Embed Size (px)
Citation preview

CORROSION SCIENCE
CORROSION—Vol. 70, No. 7 721
Submitted for publication: October 21, 2013. Revised and ac-cepted: January 15, 2014. Preprint available online: February 20, 2014, doi: http://dx.doi.org/10.5006/1170.
‡ Corresponding author. E-mail: [email protected] * Department of Chemistry, Western University, London, ON, N6A
5B7, Canada. ** Surface Science Western, 999 Collip Circle, London, ON, N6G
0J3, Canada. (1) UNS numbers are listed in Metals and Alloys in the Unified Num-
bering System, published by the Society of Automotive Engineers (SAE International) and cosponsored by ASTM International.
Effect of Alloying Elements on Crevice Corrosion Inhibition of Nickel-Chromium-Molybdenum-Tungsten Alloys Under Aggressive Conditions: An Electrochemical Study
A.K. Mishra* and D.W. Shoesmith‡,*,**
ABSTRACT
The effects of Cr, Mo, and W on the crevice corrosion of a number of commercial Ni-Cr-Mo(W) alloys in 1.0 mol/L sodium chloride (NaCl) were studied using the potentiodynamic-galvanostatic-potentiodynamic technique to measure film breakdown and repassivation potentials as well as protection temperatures. As expected, Cr is the key element determining resistance to crevice initiation, but a substantial Mo alloy con-tent is required to achieve maximum film stability, especially at temperatures >60°C. Mo, not Cr, is the major element con-trolling crevice propagation and repassivation. If the protection temperature is accepted as the key indicator of overall alloy resistance, then the resistance increases in the order: Alloy 625 (UNS N06625) < C-4 (UNS N06455) < C-276 (UNS N10276) < C-22 (UNS N06022) ~ Alloy 59 (UNS N06059) ~ C-2000 (UNS N06200) < Alloy 686 (UNS N06686). More generally, this or-der could be written: high Cr-low Mo < low Cr-high Mo < high Cr-high Mo < high Cr-high (Mo+W). The individual influences of Mo and W appear to be inseparable and, while adding W improved the resistance, adding the equivalent amount of Mo could achieve the same improvement.
KEY WORDS: crevice corrosion, Ni-Cr-Mo-W alloys, PD-GS-PD technique, protection temperature, repassivation potential
INTRODUCTION
Nickel-based metals, alloyed with Cr, Mo, W, and other elements, are widely used for equipment con-struction in the petrochemical, chemical process, and power industries because of their excellent cor-rosion resistance in both oxidizing and reducing environments. The presence of sufficient Cr enforces the growth of a passive barrier oxide layer of Cr2O3 on the surface, and Mo and W appear to retard the propagation of localized corrosion if the passive film is breached. Therefore, optimization of the concentration of Cr, Mo, and W is the key feature in developing Ni-Cr-Mo and Ni-Cr-Mo-W alloys, which are resistant to uniform and localized corrosion and stress corrosion cracking.1-2
The passive film properties of a number of Ni-Cr-Mo(W) alloys were studied at different potentials and temperatures in acidic solutions by Lloyd, et al.,3 using various electrochemical and surface characteri-zation techniques. Both potentiostatic and potentiody-namic experiments showed that C-22 (UNS N06022)(1) has a lower passive current density than C-276 (UNS N10276). This was attributed to the higher Cr con-tent in C-22, which results in the growth of a more protective Cr/Ni oxide barrier layer at the alloy oxide interface. The effects of Cr, Mo, and W on passive film properties and, to some extent, on localized corrosion were studied for the alloys C-4 (UNS N06455), C-276, 625 (UNS N06625), C-22, and C-2000 (UNS N06200).4 High Cr (>20%, wt%)-containing alloys demonstrated better passive film properties than low Cr-containing alloys. While improved passivity was generally attrib-
ISSN 0010-9312 (print), 1938-159X (online)14/0000117/$5.00+$0.50/0 © 2014, NACE International

CORROSION SCIENCE
722 CORROSION—JULY 2014
uted to the alloy Cr content, Mo and W were found to segregate to the outer regions of the film, and, at high potentials when oxidation of Cr(III) to Cr(VI) initiates, were found to play an important role in suppressing the onset of transpassivity. As a consequence, Mo and W play a dominant role in the control/inhibition of lo-calized corrosion in aggressive environments.4 Accord-ing to this study, C-22 and C-2000, which contain high Cr and high Mo or Mo+W, provide better localized corrosion resistance in the aggressive environments than the other studied alloys (C-276 and C-4).
Jakupi, et al.,5-9 used electrochemical and surface analytical techniques to determine the relationship between passive film impedance properties and com-position in aggressive environments. The film proper-ties on C-22 were investigated at different potentials in concentrated chloride (5 mol/L) solution using elec-trochemical impedance spectroscopy (EIS) and x-ray photoelectron spectroscopy (XPS). A direct relation-ship between film resistance and the Cr(III) oxide con-tent of the barrier layer oxide film was observed.5 A more extensive XPS study10 subsequently confirmed this relationship and showed that at more positive po-tentials when the Cr(III) content decreased, due to its oxidation to the more soluble Cr(VI), the Mo(VI) and W(VI) contents in the film increased substantially. Time-of-flight secondary ion mass spectrometry (ToF-SIMS) analyses on C-22 and on C-2000 showed the VI oxidation states of Mo and W accumulated at the ox-ide/solution interface, consistent with the previous observations in acidic solutions,3-4 though the extent of segregation to the outer surface was not so dramatic.
To understand the effect of Cr and Mo on the inhibition of localized corrosion behavior, crevice cor-rosion studies on Alloy 625, C-276, and Alloy G-3 (UNS N06985) were performed by Lillard, et al.,11 in expected critical crevice solutions (CCS). Potentiody-namic results showed that an increase in Mo con-tent resulted in a lower passive current density and a smaller dissolution rate associated with the active region. A crevice corrosion-resistance ranking (C-276 > Alloy 625 > Alloy G-3), based on an increase in Mo content from Alloy G-3 to C-276, was proposed. The study further suggested that Mo alloying controls the crevice propagation rate.
Kehler and Scully12 studied the crevice corrosion susceptibility of Alloy 625 and C-22 in an acidic solu-tion. The metastable corrosion event rate, recorded from current-time transients, was found to increase with an increase in applied potential and tempera-ture, and the increase was more significant for Alloy 625 compared to C-22. Also, the depth of penetration due to crevice corrosion was higher for Alloy 625 than C-22. Since both alloys have a similar Cr content, therefore, the differences in the crevice corrosion be-havior was attributed to their Mo (or Mo+W) content,
i.e., a higher Mo (or Mo+W) content in C-22 results in better crevice corrosion resistance.
Wong and Buchheit13 studied the effect of Cr and Mo on the localized corrosion behavior in Ni-Cr-Mo al-loys. It was observed that there was a reduction in the number of metastable pitting events with an increase in the Cr and Mo concentrations. An increase in Mo concentration resulted in a lower peak pitting current and a decrease in the rate of the fastest growing pits. Since metastable pits are precursors to stable pits,14 this reduction in the number and size of metastable pit events led to an improvement in the alloy’s resis-tance to localized corrosion.
The effect of Mo and W on galvanostatically driven crevice propagation was also studied on the C-22 and C-2000 alloys.6 Scanning electron microscopy (SEM) images and energy-dispersive x-ray (EDX) mapping shows an accumulation of insoluble corrosion prod-uct, enriched with Mo, O and Mo, W, O at propagating sites for C-2000 and C-22, respectively, in agree-ment with the results reported by other research-ers.15 Raman spectroscopy results6 indicated that the insoluble products formed at active locations within the crevice were polymeric Mo species (including W in the case of C-22), which control the crevice propaga-tion rate and whose accumulation inhibits the depth of corrosion penetration.7 These results are consistent with those of Hayes, et al.,16 who also claimed that, while Cr had the dominant influence on passivity, Mo was responsible for controlling pit propagation and promoting repassivation.
The corrosion behavior of C-22, C-22HS (UNS N07022), and Hybrid-BC1† alloy (UNS N10362) in 1 M hydrochloric acid (HCl) solution at 90°C was recently studied by Zadorozne, et al.17 The corrosion rate, cal-culated from the Stern-Geary equation, shows that the anodic dissolution in the active potential range was mainly controlled by the Mo content, the higher Mo content of the Hybrid-BC1† alloy resulting in bet-ter corrosion resistance in the active region compared to C-22 and C-22HS. On the contrary, the Hybrid-BC1† alloy showed a higher passive current density (obtained from potentiodynamic polarization graphs) compared to C-22 and C-22HS. This poorer passivity of the Hybrid-BC1† alloy is a result of a lower Cr con-tent. Crevice repassivation potentials (ER,CREV) were obtained by the potentiodynamic-galvanostatic-poten-tiodynamic (PD-GS-PD) technique,18 using a multiple crevice assembly (MCA) arrangement, for C-22, C-22HS, and Hybrid-BC1† in chloride solution at 90°C. A significantly higher ER,CREV was obtained for the Hy-brid-BC1† alloy compared to C-22 and C-22HS, which suggests that the higher Mo content in Hybrid-BC1† alloy aids in repassivation, too.
In this study, a systematic investigation of the susceptibility to crevice corrosion initiation and the early stages of propagation has been undertaken for a range of commercially available Ni-Cr-Mo(W) alloys. In † Trade name.
CORROSION SCIENCE
CORROSION—Vol. 70, No. 7 723
addition, attention has been paid to the synergistic ef-fect of one alloying element on another by comparing the behavior of alloys that differ in only one alloying component, with the primary emphasis on the under-standing of the effects of Cr, Mo, and W.
The alloys studied were C-4, C-276, Alloy 625, C-22, C-2000, Alloy 59 (UNS N06059), and Alloy 686 (UNS N06686). The comparison of alloys is based on breakdown potential (Eb), crevice repassivation poten-tial (ER,CREV), and protection temperature (TPROT) mea-surements made using the PD-GS-PD technique. This technique allows very reproducible measurements. A detailed description of this technique has been re-ported elsewhere18 and it has been successfully ap-plied to a range of different corrosion-resistant alloys in various solutions.17-22 Experiments were conducted using both the MCA17-23 and a single crevice arrange-ment.5-9
EXPERIMENTAL PROCEDURES
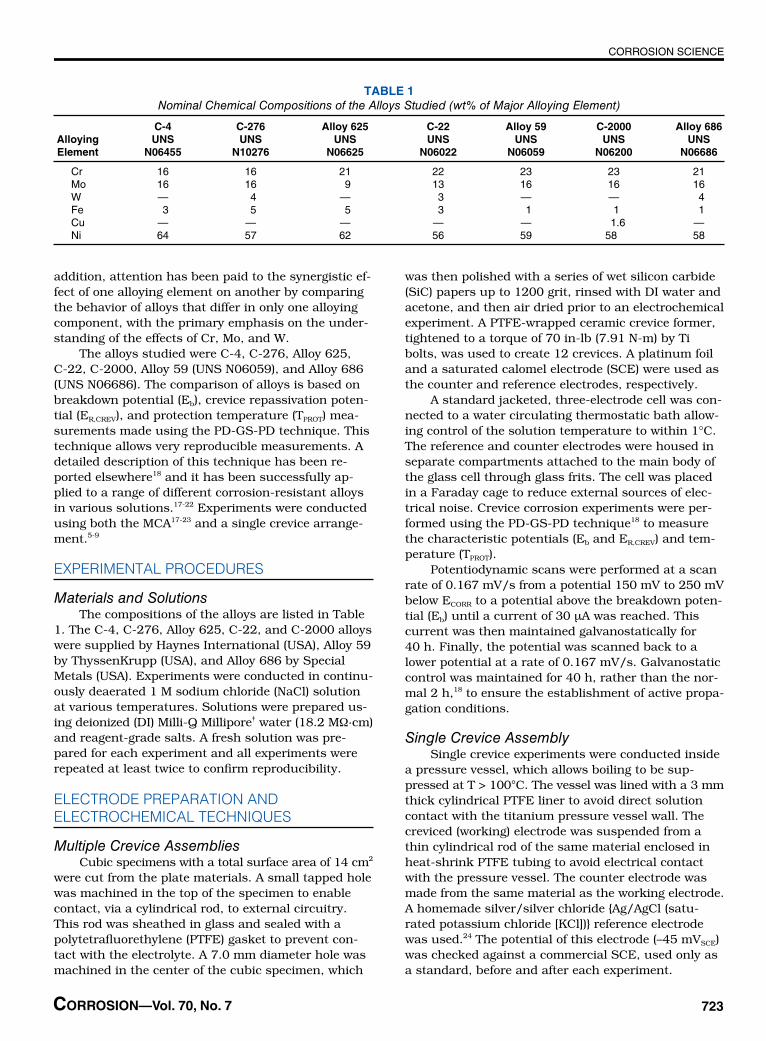
Materials and SolutionsThe compositions of the alloys are listed in Table
1. The C-4, C-276, Alloy 625, C-22, and C-2000 alloys were supplied by Haynes International (USA), Alloy 59 by ThyssenKrupp (USA), and Alloy 686 by Special Metals (USA). Experiments were conducted in continu-ously deaerated 1 M sodium chloride (NaCl) solution at various temperatures. Solutions were prepared us-ing deionized (DI) Milli-Q Millipore† water (18.2 MΩ·cm) and reagent-grade salts. A fresh solution was pre-pared for each experiment and all experiments were repeated at least twice to confirm reproducibility.
ELECTRODE PREPARATION AND ELECTROCHEMICAL TECHNIQUES
Multiple Crevice AssembliesCubic specimens with a total surface area of 14 cm2
were cut from the plate materials. A small tapped hole was machined in the top of the specimen to enable contact, via a cylindrical rod, to external circuitry. This rod was sheathed in glass and sealed with a polytetrafluorethylene (PTFE) gasket to prevent con-tact with the electrolyte. A 7.0 mm diameter hole was machined in the center of the cubic specimen, which
was then polished with a series of wet silicon carbide (SiC) papers up to 1200 grit, rinsed with DI water and acetone, and then air dried prior to an electrochemical experiment. A PTFE-wrapped ceramic crevice former, tightened to a torque of 70 in-lb (7.91 N-m) by Ti bolts, was used to create 12 crevices. A platinum foil and a saturated calomel electrode (SCE) were used as the counter and reference electrodes, respectively.
A standard jacketed, three-electrode cell was con-nected to a water circulating thermostatic bath allow-ing control of the solution temperature to within 1°C. The reference and counter electrodes were housed in separate compartments attached to the main body of the glass cell through glass frits. The cell was placed in a Faraday cage to reduce external sources of elec-trical noise. Crevice corrosion experiments were per-formed using the PD-GS-PD technique18 to measure the characteristic potentials (Eb and ER,CREV) and tem-perature (TPROT).
Potentiodynamic scans were performed at a scan rate of 0.167 mV/s from a potential 150 mV to 250 mV below ECORR to a potential above the breakdown poten-tial (Eb) until a current of 30 μA was reached. This current was then maintained galvanostatically for 40 h. Finally, the potential was scanned back to a lower potential at a rate of 0.167 mV/s. Galvanostatic control was maintained for 40 h, rather than the nor-mal 2 h,18 to ensure the establishment of active propa-gation conditions.
Single Crevice AssemblySingle crevice experiments were conducted inside
a pressure vessel, which allows boiling to be sup-pressed at T > 100°C. The vessel was lined with a 3 mm thick cylindrical PTFE liner to avoid direct solution contact with the titanium pressure vessel wall. The creviced (working) electrode was suspended from a thin cylindrical rod of the same material enclosed in heat-shrink PTFE tubing to avoid electrical contact with the pressure vessel. The counter electrode was made from the same material as the working electrode. A homemade silver/silver chloride {Ag/AgCl (satu-rated potassium chloride [KCl])} reference electrode was used.24 The potential of this electrode (–45 mVSCE) was checked against a commercial SCE, used only as a standard, before and after each experiment.
TABLE 1 Nominal Chemical Compositions of the Alloys Studied (wt% of Major Alloying Element)
C-4 C-276 Alloy 625 C-22 Alloy 59 C-2000 Alloy 686 Alloying UNS UNS UNS UNS UNS UNS UNS Element N06455 N10276 N06625 N06022 N06059 N06200 N06686
Cr 16 16 21 22 23 23 21 Mo 16 16 9 13 16 16 16 W — 4 — 3 — — 4 Fe 3 5 5 3 1 1 1 Cu — — — — — 1.6 — Ni 64 57 62 56 59 58 58
CORROSION SCIENCE
724 CORROSION—JULY 2014
A schematic of the crevice electrode arrangement inside the pressure vessel has been reported else-where.5-9 The geometry of the working electrode was designed to avoid unwanted crevices. The crevice for-mer was a PTFE slice fixed between the flat metal sur-face and a polysulfone coupon. In this study, the crevice design was modified slightly with the crevice former surface area made smaller than the flat surface area of metal to better define the crevice mouth and to confine any propagation to the flat surface of the specimen. The creviced assembly was held together with insulated threaded bolts and metal nuts to en-sure that the defined working electrode surface would be the only creviced metal area exposed to solution. The creviced face of the working electrode was pol-ished using the same procedure used with the MCA.
To prevent boiling of the electrolyte solution, the pressure vessel was pressurized with 0.4 MPa of Ar gas. On first exposure to the solution, the electrode was allowed to stabilize at open circuit for 8 h. Sub-sequently, crevice corrosion was initiated galvano-statically (5 µA or 20 µA) and the current maintained throughout the 48 h of the experiment.
RESULTS AND DISCUSSION
Effect of Cr on Crevice CorrosionTo study the effect of Cr, the Alloys C-276 and
686 were compared, since both have similar Mo and W contents and differ only significantly in their Cr content (16 wt% for C-276 compared to 21 wt% for 686). The small difference in Fe content (Table 1) is not expected to significantly affect the corrosion resis-tance, the primary purpose of its incorporation in Ni-based alloys being cost reduction.1
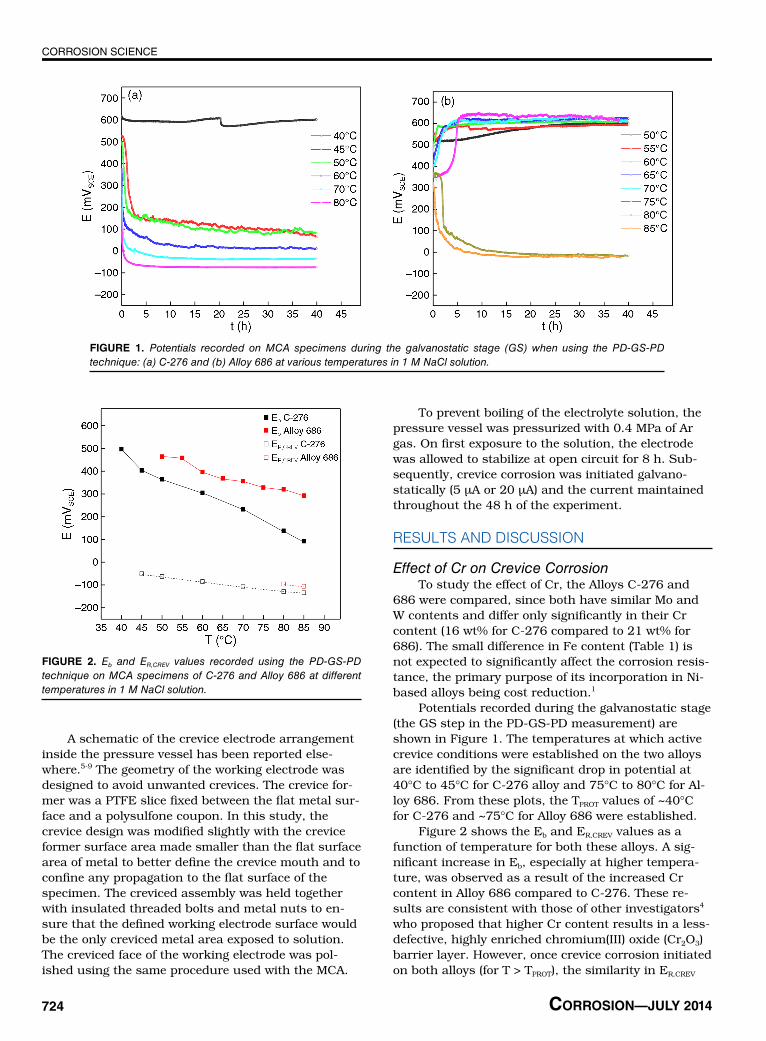
Potentials recorded during the galvanostatic stage (the GS step in the PD-GS-PD measurement) are shown in Figure 1. The temperatures at which active crevice conditions were established on the two alloys are identified by the significant drop in potential at 40°C to 45°C for C-276 alloy and 75°C to 80°C for Al-loy 686. From these plots, the TPROT values of ~40°C for C-276 and ~75°C for Alloy 686 were established.
Figure 2 shows the Eb and ER,CREV values as a function of temperature for both these alloys. A sig-nificant increase in Eb, especially at higher tempera-ture, was observed as a result of the increased Cr content in Alloy 686 compared to C-276. These re-sults are consistent with those of other investigators4 who proposed that higher Cr content results in a less-defective, highly enriched chromium(III) oxide (Cr2O3) barrier layer. However, once crevice corrosion initiated on both alloys (for T > TPROT), the similarity in ER,CREV
FIGURE 1. Potentials recorded on MCA specimens during the galvanostatic stage (GS) when using the PD-GS-PD technique: (a) C-276 and (b) Alloy 686 at various temperatures in 1 M NaCl solution.
FIGURE 2. Eb and ER,CREV values recorded using the PD-GS-PD technique on MCA specimens of C-276 and Alloy 686 at different temperatures in 1 M NaCl solution.

CORROSION SCIENCE
CORROSION—Vol. 70, No. 7 725
values indicated no significant effect of Cr on crevice repassivation.
To understand the effect of Cr in more detail, two more Ni-Cr-Mo alloys (C-4 and Alloy 59) were stud-ied. Unlike C-276 and 686, C-4 and 59 contain no W (Table 1). Both C-4 and 59 have similar Mo but differ in Cr content, with C-4 having 7% (wt%) less than Al-loy 59. Unsurprisingly, Alloy 59 had a higher Eb than C-4, and, consistent with the results for Alloy 686 and C-276, both alloys exhibited a similar ER,CREV (Figures 3 and 4). Furthermore, C-4 containing relatively low Cr and low Mo initiated crevice corrosion at a tem-perature as low as 350°C (Figure 3[a]). Based on these results on four different commercially available Ni-Cr-Mo(W) alloys, it can be concluded that increasing the Cr content resulted in improved passivity and, thus, a higher Eb. However, Cr appeared to play little to no role in the control of crevice propagation and repas-sivation.
Effect of Mo on Crevice CorrosionC-22 and Alloy 686 were selected to study the ef-
fect of Mo on crevice corrosion, since both alloys have similar Cr and W contents while C-22 has a 3% (wt%) lower Mo content than Alloy 686 (Table 1). Figures 5 and 6 show the potentials (recorded during the galva-nostatic period) and the variation of Eb and ER,CREV with temperature, respectively. The TPROT for Alloy 686 was ~20°C higher than that for C-22, indicating that the high-Mo (or Mo+W) content retarded the initiation of crevice corrosion as the temperature was increased. Comparison of the Eb values shows that the higher Cr alloy (Alloy 686) exhibited slightly higher values (~50 mV at low temperatures decreasing to ~20 mV at higher temperatures) than C-22, except at the highest temperature when the difference widened to ~160 mV. This minor difference in Eb values suggests the small difference in Mo content did not influence the passivity
significantly. These results confirm the importance of Cr in preventing film breakdown, any additional influ-ence on passivity of Mo being minor except at the highest temperature (85°C, Figure 6). Given the simi-lar Eb values for the two alloys, the initiation of crevice corrosion on C-22, but not Alloy 686, at lower tem-peratures suggested a role of Mo in preventing crevice initiation, especially with increasing temperature.
Since the influences of Cr and Mo (or Mo+W) are hard to separate, the behaviors of C-22 and Alloy 686 were compared at the higher temperature of 105°C using a single crevice arrangement (Figure 7). In these experiments the potential of each alloy was followed for 48 h at an applied current of either 5 µA or 20 µA. At the lower current (Figure 7[a]), after a single major event at ~16 h, the potential on C-22 became unstable after ~28 h. This behavior indicated continuous un-
FIGURE 3. Potentials recorded on MCA specimens during the galvanostatic stage (GS) when using the PD-GS-PD technique: (a) C-4 and (b) Alloy 59 at various temperatures in 1 M NaCl solution.
FIGURE 4. Eb and ER,CREV values recorded using the PD-GS-PD technique on MCA specimens of C-4 and Alloy 59 at different temperatures in 1 M NaCl solution.

CORROSION SCIENCE
726 CORROSION—JULY 2014
successful attempts to establish stable active crevice corrosion sites. By comparison, Alloy 686 established a stable potential at this current with only very minor, effectively negligible, negative-going transients. This is a strong indication that the increased Mo (Mo+W) con-tent was suppressing the metastable activation events, which eventually could lead to the establishment of active crevice corrosion sites. This is in consensus with the results reported by other researchers.12-13
To confirm this influence, the experiment was repeated at a higher applied current when initiation would be expected to occur more readily. As shown in Figure 7(b), this was the case, the initiation of stable crevice corrosion occurring on C-22 in 6 h to 7 h. By comparison, active corrosion conditions were not es-tablished on Alloy 686 until >27 h, even though the higher density of metastable events (compared to the density observed at 5 µA) suggested many attempted
initiations occurred. The resistance to initiation on Al-loy 686 is clearly indicated by the considerably higher potential required (at this higher current) before ini-tiation finally occurs.
To investigate the importance of Mo in inhibiting crevice initiation, the crevice corrosion behavior of Al-loy 625 and Alloy 59 were compared using the MCA arrangement (Figures 8 and 9). While both these al-loys have a high (21 wt% to 23 wt%) Cr content, the Mo content of Alloy 625 (9 wt%) is considerably lower than that of Alloy 59 (16 wt%). Figure 9 shows little difference in Eb between the two alloys, at least for temperatures below 60°C, both being very positive, as expected for high-Cr content alloys. However, once Eb was exceeded, crevice corrosion initiated on the low Mo-containing Alloy 625 at a temperature of 30°C compared to 60°C for the high Mo-containing Alloy 59 (Figure 8). At temperatures above 60°C, the influence of Mo on maintaining passivity was very marked. For Alloy 59 (16 wt% Mo), Eb decreased only marginally over the temperature range from 60°C to 85°C, while that for Alloy 625 (9 wt% Mo) fell substantially. The difference in Eb values at 85°C reached ~300 mV (Figure 9).
These results indicate a number of influences of Mo. In high Cr-high Mo (Mo+W) alloys, passivity ap-peared to be optimized, but even a relatively small increase in Mo (Mo+W) inhibited crevice initiation, even at temperatures as high as 105°C. As proposed previously by Kehler and Scully12 and Wong and Buchheit,13 this appeared to be due to the ability of Mo to suppress the transition of metastable film breakdown events to stable active crevice sites.
However, experiments that compare alloys with high Cr but significantly different Mo contents showed that initiation of active sites was not suppressed at lower Mo contents. Additionally, while a high-Cr con-tent may have led to high Eb values in low-Mo alloys
FIGURE 5. Potentials recorded on MCA specimens during the galvanostatic stage (GS) when using the PD-GS-PD technique: (a) C- 22 and (b) Alloy 686 at various temperatures in 1 M NaCl solution.
FIGURE 6. Eb and ER,CREV values recorded using the PD-GS-PD technique on MCA specimens of C-22 and Alloy 686 at different temperatures in 1 M NaCl solution.

CORROSION SCIENCE
CORROSION—Vol. 70, No. 7 727
at low temperatures (<60°C), the resistance to film breakdown at higher temperatures could not be main-tained—Eb decreasing markedly with temperature for low-Mo alloys. Although alloys with only a limited variation in Mo content were included in this study, a minimum Mo content >9 wt% was required to achieve the high-temperature resistance.
Effect of W on Crevice CorrosionThe alloy comparisons described so far could not
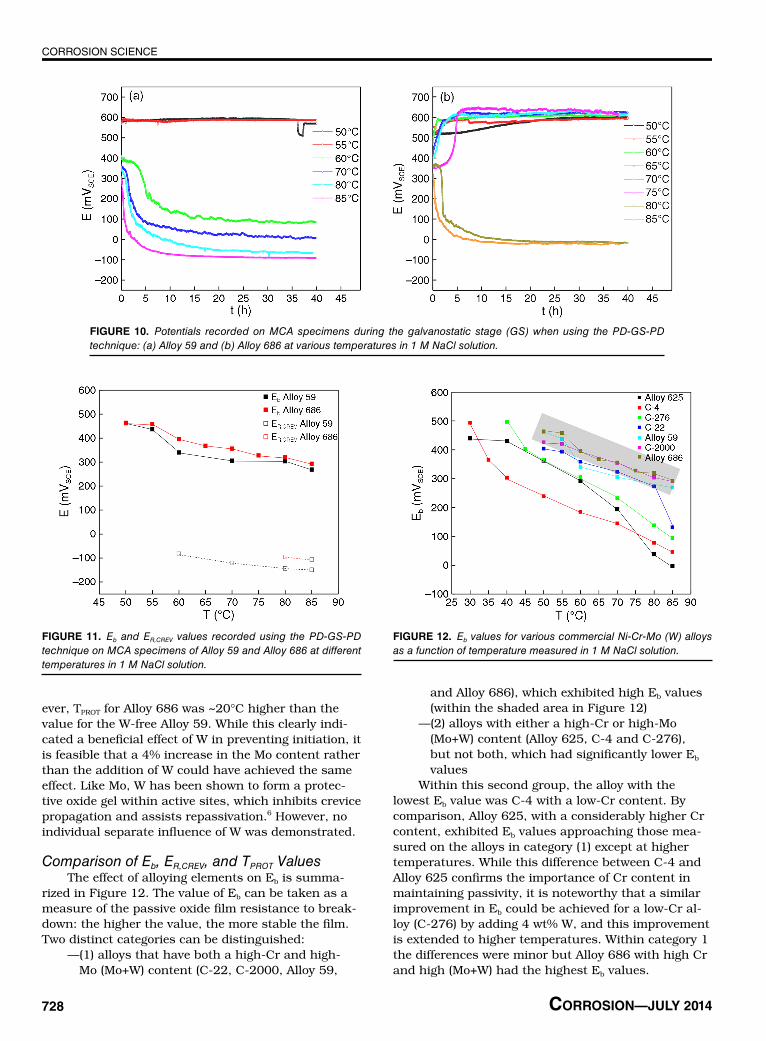
separate the influences of Mo and W. In an attempt to distinguish these influences, the behavior of Alloy 59 and Alloy 686 were compared. Both alloys have simi-lar Cr and Mo contents but only Alloy 686 contains W (4 wt%). The characteristic potentials for these two alloys are shown in Figures 10 and 11. Both alloys ex-hibited very high Eb values, which were maintained up to 85°C, as expected for high Cr-high Mo alloys. How-
FIGURE 7. Potentials recorded on single crevice electrodes during galvanostatic experiments on C-22 and Alloy 686 at 1,050°C in 1 M NaCl solution: (a) 5 µA and (b) 20 µA.
FIGURE 8. Potentials recorded on MCA specimens during the galvanostatic stage (GS) when using the PD-GS-PD technique: (a) Alloy 625 and (b) Alloy 59 at various temperatures in 1 M NaCl solution.
FIGURE 9. Eb and ER,CREV values recorded using the PD-GS-PD technique on MCA specimen of Alloy 625 and Alloy 59 at different temperatures in 1 M NaCl solution.
CORROSION SCIENCE
728 CORROSION—JULY 2014
ever, TPROT for Alloy 686 was ~20°C higher than the value for the W-free Alloy 59. While this clearly indi-cated a beneficial effect of W in preventing initiation, it is feasible that a 4% increase in the Mo content rather than the addition of W could have achieved the same effect. Like Mo, W has been shown to form a protec-tive oxide gel within active sites, which inhibits crevice propagation and assists repassivation.6 However, no individual separate influence of W was demonstrated.
Comparison of Eb, ER,CREV, and TPROT ValuesThe effect of alloying elements on Eb is summa-
rized in Figure 12. The value of Eb can be taken as a measure of the passive oxide film resistance to break-down: the higher the value, the more stable the film. Two distinct categories can be distinguished:
—(1) alloys that have both a high-Cr and high-Mo (Mo+W) content (C-22, C-2000, Alloy 59,
and Alloy 686), which exhibited high Eb values (within the shaded area in Figure 12)
—(2) alloys with either a high-Cr or high-Mo (Mo+W) content (Alloy 625, C-4 and C-276), but not both, which had significantly lower Eb values
Within this second group, the alloy with the lowest Eb value was C-4 with a low-Cr content. By comparison, Alloy 625, with a considerably higher Cr content, exhibited Eb values approaching those mea-sured on the alloys in category (1) except at higher temperatures. While this difference between C-4 and Alloy 625 confirms the importance of Cr content in maintaining passivity, it is noteworthy that a similar improvement in Eb could be achieved for a low-Cr al-loy (C-276) by adding 4 wt% W, and this improvement is extended to higher temperatures. Within category 1 the differences were minor but Alloy 686 with high Cr and high (Mo+W) had the highest Eb values.
FIGURE 10. Potentials recorded on MCA specimens during the galvanostatic stage (GS) when using the PD-GS-PD technique: (a) Alloy 59 and (b) Alloy 686 at various temperatures in 1 M NaCl solution.
FIGURE 11. Eb and ER,CREV values recorded using the PD-GS-PD technique on MCA specimens of Alloy 59 and Alloy 686 at different temperatures in 1 M NaCl solution.
FIGURE 12. Eb values for various commercial Ni-Cr-Mo (W) alloys as a function of temperature measured in 1 M NaCl solution.

CORROSION SCIENCE
CORROSION—Vol. 70, No. 7 729
Figure 13 shows the plot of ER,CREV as a function of temperature for various Ni-Cr-Mo(W) alloys. This comparison yields similar trends with Cr, Mo, and Mo+W content to that observed for Eb, but with some differences for the poorer performing alloys. When comparing Eb values (above), the poorest performing alloy (lowest Eb values), except at the highest tempera-tures, was the low Cr-high Mo C-4. By contrast, when comparing ER,CREV values, it is the high Cr-low Mo Al-loy 625, which had the lowest values over the whole temperature range, indicating that Mo, rather than Cr, is the key alloying component controlling propaga-tion and assisting repassivation.
Consideration of the whole set of ER,CREV values shows that generally over the whole temperature range (up to 85°C) the order of increasing ER,CREV val-ues, indicating a suppression of propagation and im-proved tendency to repassivate, was:
High Cr-Low Mo < Low Cr-High Mo < High Cr-High Mo < High Cr-High Mo+W
When comparing all the alloys, perhaps the most instructive parameter that yields an overall evaluation of resistance to crevice corrosion for a series of alloys is TPROT, the temperature below which crevice corro-sion does not initiate. These values, taken to be 5°C below the lowest temperature at which crevice initia-tion was observed, and hence a value of TPROT obtained (Figure 13), are plotted in Figure 14 as a function of the Mo+W content of the alloy. It should be noted that the TPROT for Alloy 625 is assumed to be around 25°C, since crevice corrosion was observed at the first tem-perature tested, which was 30°C.
The two diagonal lines in Figure 14 show that two distinct classes of alloy can be defined: low Cr and high Cr. In both cases, increasing the Mo+W content led to an increase in the temperature range (25°C to TPROT) over which the alloy was protected against crev-ice corrosion. The synergistic effect of Cr and Mo(+W) was clearly demonstrated by the significantly better performance of the high-Cr alloys.
A common way to compare the localized perfor-mance of alloys is to calculate the pitting resistance equivalent number (PREN).25 Previous investigators17
have used the relationship:
PREN = %Cr + 3.3% (Mo+0.5W) (1)
to calculate the influence of alloy composition on the resistance to localized corrosion. The applicability of this relationship can be deduced by plotting PREN as a function of TPROT, Figure 15. Note, no value for Alloy 625 is included since no reliable TPROT value was actu-ally recorded for this alloy (as noted above). While a reasonable relationship is observed for five of the al-loys, the crevice corrosion resistance of the C-22 alloy is significantly underestimated by this relationship.
FIGURE 13. ER,CREV values for various commercial Ni-Cr-Mo (W) alloys as a function of temperature measured in 1 M NaCl solution.
FIGURE 14. TPROT values as a function of the Mo+W content of a series of commercial Ni-Cr-Mo (W) alloys measured in 1 M NaCl solution.
FIGURE 15. Relationship between TPROT (from Figure 14) and PREN values calculated for various Ni-Cr-Mo (W) alloys: (1) PREN values calculated using relationship (1); (2) PREN values calculated using relationship (2).

CORROSION SCIENCE
730 CORROSION—JULY 2014
A possibility is that the influence of W on the be-havior of C-22 is underestimated. Consequently, the second line in Figure 14 shows the TPROT values plot-ted against a PREN value calculated assuming the ef-fect of W is identical to that of Mo; i.e.:
PREN = %Cr + 3.3% (Mo+W) (2)
This adjustment does not lead to a better re-lationship, the PREN value for C-276 being uncor-related to the other values. While it is feasible that an improvement of the fit to a straight line could be achieved by varying the relative importance of the in-dividual elements in the calculation, the empirical na-ture of the parameter, PREN, and the absence of any demonstrated mechanistic connection to TPROT makes this a somewhat artificial exercise. That both lines are equally limited in their ability to define the rela-tive contributions of Mo and W may reflect the similar chemical behavior of these two elements in control-ling crevice propagation.6 These relationships are best used only as qualitative indicators of the function of these two elements in determining the resistance to crevice corrosion.
CONCLUSIONS
The effects of the alloying elements Cr, Mo, and W on the crevice corrosion of commercial Ni-Cr-Mo(W) alloys in 1.0 mol/L NaCl solution have been studied using the PD-GS-PD technique to measure film break-down and alloy repassivation potentials and protec-tion temperatures; i.e., the temperature below which crevice corrosion does not initiate. While the Cr con-tent is the key alloying addition determining passive film stability, the presence of a substantial Mo content (>>9 wt%) is required to achieve maximum film stabil-ity against breakdown under creviced conditions. This is particularly the case for temperatures >60°C.v Mo is the key alloying element influencing repas-sivation after crevice propagation, the repassivation potential (ER,CREV) showing a clear increase with in-creasing Mo (or Mo+W) content indicating a greater driving force for repassivation.v If the protection temperature (TPROT) is accepted as a key indicator of an alloy’s overall resistance to crevice corrosion, then the alloys can be ranked in the follow-ing order of increasing resistance:
Alloy 625 < C-4 < C-276 < C-22 ~ Alloy 59 ~ C-2000 < Alloy 686
More generally, this order could be written as:
High Cr-Low Mo < Low Cr-High Mo < High Cr-High Mo < High Cr-High Mo+W
v Attempts to separate the influences of Mo and W were not successful. While it was shown that adding W improved the resistance, it is possible that increas-ing the Mo content by a similar amount would have produced the same improvement.v Using values of PREN, calculated by either sepa-rating or combining the influences of Mo and W produced only qualitatively linear relationships but could not separate the influences of the two elements. While PREN values offer guidance in alloy design, they should not be considered quantitative.
ACKNOWLEDGMENTS
This research was funded by the Canadian Natural Sciences and Engineering Research Council (NSERC). The authors also acknowledge Haynes Inter-national, Thyssenkrupp, and Special Metals for pro-viding the samples.
REFERENCES
1. P. Crook, D. Klarstrom, ASM Handbook, vol. 13B (Materials Park, OH: ASM International, 2005), p. 228.
2. W.Z. Friend, Corrosion of Nickel and Nickel-Based Alloys (New York, NY: John Wiley and Sons, 1980), p. 292.
3. A.C. Lloyd, D.W. Shoesmith, N.S. McIntyre, J.J. Noel, J. Electrochem. Soc. 150 (2003): p. B120.
4. A.C. Lloyd, J.J. Noel, S. McIntyre, D.W. Shoesmith, Electrochim. Acta 49 (2004): p. 3015.
5. P. Jakupi, D. Zagidulin, J.J. Noel, D.W. Shoesmith, Electrochim. Acta 56 (2011):p. 6251.
6. P. Jakupi, F. Wang, J.J. Noel, D.W. Shoesmith, Corros. Sci. 53 (2011): p.1670.
7. P. Jakupi, J.J. Noel, D.W. Shoesmith, Corros. Sci. 53 (2011): p. 3122.
8. P. Jakupi, J.J. Noel, D.W. Shoesmith, Corros. Sci. 54 (2012): p. 260.
9. P. Jakupi, J.J. Noel, D.W. Shoesmith, Electrochem. Solid-State Lett. 13 (2010): p. C1.
10. X. Zhang, D. Zagidulin, D.W. Shoesmith, Electrochim. Acta 89 (2013): p. 814.
11. R.S. Lillard, M.P. Jurinski, J.R. Scully, Corrosion 50 (1994): p. 251.
12. B.A. Kehler, J.R. Scully, Corrosion 61 (2005): p. 665.13. F. Wong, R. Buchheit, ECS Trans. 16 (2009): p. 91.14. G.S. Frankel, J. Electrochem. Soc. 145 (1998): p. 2186.15. X. Shan, J.H. Payer, J. Electrochem. Soc. 156 (2009): p. C313.16. J.R. Hayes, J.J. Gray, A.W. Szmodis, C.A. Orme, Corrosion 62
(2006): p. 491.17. N.S. Zadorozne, C.M. Giordano, M.A. Rodriguez, R.M. Carranza,
R.B. Rebak, Electrochim. Acta 76 (2012): p. 94.18. A.K. Mishra, G.S. Frankel, Corrosion 64 (2008): p. 836.19. M.R. Ortiz, M.A. Rodriguez, R.M. Carranza, R.B. Rebak, Corrosion
66 (2010): p. 1.20. M. Miyagusuku, R.M. Carranza, R.B. Rebak, “Inhibition Effect of
Phosphate Ions on Crevice Corrosion of Alloy 22,” CORROSION/ 2011, paper no. 1120 (Houston, TX: NACE 2011).
21. M.R. Ortiz, M.A. Rodriguez, R.M. Carranza, R.B. Rebak, Corros. Sci. 68 (2013): p. 72.
22. C.M. Giordano, M.R. Ortiz, M.A. Rodriguez, R.M. Carranza, R.B. Rebak, Corros. Eng., Sci., Tech. 46 (2011): p. 129.
23. K.J. Evans, A. Yilmaz, S.D. Day, L.L. Wong, J.C. Estill, R.B. Rebak, JOM 57 (2005): p. 56.
24. X. He, J.J. Noel, D.W. Shoesmith, J. Electrochem. Soc. 149 (2002): p. B440.
25. Z. Szklarska-Smialowska, Pitting and Crevice Corrosion of Metals (Houston, TX: NACE International, 2005).