Embed Size (px)
Citation preview
THE EFFECTIVENESS OF ADVERTISING AMONG MEDIA MULTITASKERS: EFFECTS OF ENDORSER ATTRACTIVENESS AND ARGUMENT STRENGTH
BY
SANN HEE RYU
THESIS
Submitted in partial fulfillment of the requirements for the degree of Master of Science in Advertising
in the Graduate College of the University of Illinois at Urbana-Champaign, 2014
Urbana, Illinois
Adviser:
Professor Patrick Vargas
ii
ABSTRACT
In recent years, the phenomenon of media multitasking—using more than one
medium at a time—has grown remarkably. However, we do not know much about how
media multitasking affects the public’s responses to advertising. The purpose of this
study is to investigate how people respond to argument strength and endorser
attractiveness variables in advertising when attending to multiple media simultaneously.
In particular, this study examines how people—varying in the extent to which they
chronically engage in media multitasking—attend to substantive issues (i.e., argument
strength) and peripheral information (i.e., endorser attractiveness) in advertisements when
exposed to a media multitasking environment. In this experiment, I first measure the level
of media multitasking and then manipulate the quality of argument strength and endorser
attractiveness, then measure cognitive, affective, and behavioral responses, along with
content comprehension level. The analyses reveal that participants’ level of media
multitasking is positively correlated with free recall for product category and the critical
brand. In addition, participants with higher media multitasking propensity have better
overall and affective attitudes toward the brand following exposure to ads with weak
arguments, while participants with lower media multitasking propensity have better
overall and affective attitudes following exposure to ads with strong arguments.

iii
To Father, Mother, and Brother
Words cannot express how much I love you all.

iv
ACKNOWLEDGMENTS
This thesis would not have been possible without the support of many people.
Foremost, I would like to express my deepest gratitude to my advisor Patrick Vargas for
his patience, caring, and continuous support of my M.S. study. I greatly appreciate your
willingness to listen and provide me with an excellent atmosphere for doing research. I
would also like to thank Brittany Duff and Chang-Dae Ham for serving on my thesis
committee, and for their encouragement and insightful comments.

v
TABLE OF CONTENTS
CHAPTER 1: INTRODUCTION ....................................................................................... 1 1.1 What is Media Multitasking? .................................................................................... 1 1.2 Growing Effects of Media Multitasking ................................................................... 2
CHAPTER 2: LITERATURE REVIEW ............................................................................ 3 2.1 Media Multitasking and Advertising ........................................................................ 3 2.2 Media Multitaskers and Information Processing ...................................................... 4 2.3 Distraction and Persuasion ........................................................................................ 7 2.4 Research Questions ................................................................................................... 9 2.5 Tables and Figures .................................................................................................. 14
CHAPTER 3: METHODOLOGY .................................................................................... 16 3.1 Design ..................................................................................................................... 16 3.2 Participants .............................................................................................................. 16 3.3 Procedure ................................................................................................................ 17 3.4 Experimental Stimuli .............................................................................................. 18 3.5 Measures ................................................................................................................. 19 3.6 Tables and Figures .................................................................................................. 24
CHAPTER 4: RESULTS .................................................................................................. 25 4.1 Manipulation Check ................................................................................................ 25 4.2 Media Multitaskers ................................................................................................. 26 4.3 Task Performance ................................................................................................... 26 4.4 Media Multitasking and Advertising Effectiveness ................................................ 27 4.5 Tables and Figures .................................................................................................. 34
CHAPTER 5: DISCUSSION ............................................................................................ 55 5.1 Implications ............................................................................................................. 55 5.2 Limitations .............................................................................................................. 58
REFERENCES ................................................................................................................. 61
Appendix A Media Multitasking Index ............................................................................ 67 Appendix B Online Magazine .......................................................................................... 79 Appendix C Experimental Stimuli for Endorser Attractiveness ....................................... 91 Appendix D Experimental Stimuli for Argument Strength .............................................. 92 Appendix E Filler Ads ...................................................................................................... 93 Appendix F Comprehension Questions ............................................................................ 94 Appendix G Questionnaire for Participants of the Survey ............................................... 96

1
CHAPTER 1
INTRODUCTION
1.1 What is Media Multitasking?
With the advancement of new technologies such as smartphones and tablets,
people are increasingly choosing to multitask while consuming media. Such multitasking
has been on the rise due to the increased availability of digital devices, which allows
people to switch frequently through media, such as instant messaging while watching
television, or checking email while downloading files (Foehr 2006). As of 1994, web
users would only tolerate 10 seconds, at the most, for computer response and would
switch their attention to other tasks in the face of longer delays (Nielsen 1994).
According to a recent report verified by The Associated Press, people had an attention
span of 8 seconds in 2013, down from 12 seconds in 2000 (National Center for
Biotechnology Information 2014). These other tasks can be non-media activities (e.g.,
eating), or attention to different types of media (e.g., text-messaging while web-surfing;
Jeong and Fishbein 2007). The latter pattern of media behavior, so-called media
multitasking, is often defined as simultaneous usage of multiple media at a single point in
time (Pilotta, Schultz, Drenik, and Rist 2004; Foehr 2006). More specifically, media
multitasking includes both cases of engaging in two or more media simultaneously (e.g.,
reading a magazine and watching TV) and converging media activities by means of the
same medium (e.g., reading an online article and watching video content on the same
computer; Koolstra, Ritterfeld, and Vorderer 2009).

2
1.2 Growing Effects of Media Multitasking
The phenomenon of media multitasking is growing fast, with close to 40% of
people using their tablets or smartphones while watching TV at least once a day, 62%
doing so multiple times a week, and more than 84% at least once a month (Nielsen’s
Cross Platform Report 2012). In addition, this type of media consumption activity is
popular across generations: more than 53% of children/adolescents, aged 8 to 18 years,
reported that they media multitask “most of the time” or “some of the time” (Foehr 2006)
while adults spend almost 24% of their media time using multiple media concurrently
(Papper, Holmes, and Popovich 2004). Using the Internet and watching television seem
to be the most popular combination of media multitasking for both young people and
adults (Papper et al. 2004; Foehr 2006; Rideout, Foehr, and Roberts 2010).
While today’s media consumption habits have changed substantially, little
academic research has explored this trend of simultaneous media use. In this paper, I
investigated the effects of media multitasking on consumer perceptions of advertising and
on consumer behavior. Because media multitasking is related to the psychological
processes of allocating attention, switching tasks, and retrieving information from
memory, it almost certainly affects advertising effectiveness. Media multitasking may
offer more communication channels to reach out to consumers, which is a great
opportunity for advertisers. On the other hand, this phenomenon may also present a
challenge to advertisers in that media multitasking may influence consumers’ cognitive
and affective responses towards commercial content. Therefore, it is important to
examine the effects of simultaneous media exposure on advertising effectiveness.
3
CHAPTER 2
LITERATURE REVIEW
2.1 Media Multitasking and Advertising
Even with the growing influence of media multitasking, the underlying
mechanisms of how media multitasking influences advertising processing have been
underexplored. Prior research on media multitasking has focused on either positive or
negative effects on information comprehension (Lin, Robertson, and Lee 2009; Jeong and
Hwang 2012), but only a few studies have investigated the field in the context of
advertising. An exploratory, qualitative study examined the self-reported impact of media
multitasking on consumer motivation, ability, and opportunity when processing
commercial content (Bardhi, Rohm, and Sultan 2010). In the study, participants reported
both positive and negative aspects of their media multitasking experiences. With respect
to advertising, the young consumers felt in control of their media consumption as they
chose which media channel they would attend to commercial content. On the other hand,
they found media multitasking inefficient, which implies a smaller amount of cognitive
resources available to process advertising. Other researchers examined the effectiveness
of simultaneous exposure to cross-media campaigns (i.e., combining online and radio
advertising; Voorveld 2011). The internet-radio combination generated more positive
outcomes for affective and behavioral aspects compared to exposure via a single medium.
The participants in the internet-radio condition had more positive brand attitudes,
changed their brand attitudes in a more positive way, and had higher purchase intentions.
Although it is not technically media multitasking, an empirical study demonstrated that

4
the simultaneous presentation of television programming and advertising (i.e., the use of
split screen) is more advantageous for relatively weak messages than for relatively strong
messages (Chowdhury, Finn, and Olsen 2007). That is, this simultaneous presentation
format presents a distraction to advertising processing and makes weak ad messages more
persuasive by inhibiting the generation of counterarguments.
2.2 Media Multitaskers and Information Processing
With respect to information processing in a media multitasking environment,
people are more likely to be distracted by different media streams. They have to divide
their attention to process multiple media contents, which inevitably causes information
loss compared to a non-multitasking environment. This is because one cannot infinitely
process infinite amounts of information, thereby resulting in selective choice of what
pieces of information to attend to (Kanfer and Ackerman 1989; Lang 2000). A great deal
of research on media multitasking has relied on this limited-capacity approach to
understand how multitasking affects information processing (Lang 2000; Chowdhury et
al. 2007; Bardhi et al. 2010; Jeong, Hwang, and Fishbein 2010; Voorveld 2011; Jeong
and Hwang 2012; Lui and Wong 2012; Srivastava 2013).
Although media multitasking is increasingly common, not everyone does it. Even
some young people spend little or no time media multitasking: 19% of adolescents
reported they never use more than one medium at a time. Then what type of person tends
to engage in media multitasking? People who frequently multitask with media tend to be
sensation seekers (i.e., like risk and adventure), girls (rather than boys), have a computer
(i.e., watch television programs on it), and live in highly TV-oriented households (Foehr

5
2006). Moreover, heavy media multitaskers (hereafter HMMs) and light media
multitaskers (hereafter LMMs) process information differently (Ophir, Nass, and Wagner
2009).
HMMs are much worse than LMMs at filtering information, managing short-term
memory, and switching tasks. That is, HMMs are less efficient at attending to the
relevant versus irrelevant information, suppressing irrelevant representations in memory
and switching from one task to another. This is because HMMs have a propensity for
bottom-up attentional control; they tend to take in all the information from their
environment without priority. LMMs, on the other hand, have a propensity for top-down
attentional control; they are better able to focus on a primary task without being affected
by distractors. In other words, HMMs are more breadth-biased, while LMMs have more
focused cognitive control. All in all, HMMs are more easily influenced by multiple media
inputs than LMMs due to their inability to filter out both external stimuli and
representations in memory.
However, HMMs’ poorer ability to suppress distractors does not necessarily mean
that they are simply inefficient and have a general deficit in every task. They may treat
different sources of information in a more egalitarian manner because seemingly
irrelevant information at a single point in time may be useful later (Lin 2009; Cain and
Mitroff 2011). In fact, some studies have found a positive correlation between media
multitasking level and multisensory integration; HMMs were better at integrating
information from different modalities (Lui and Wong 2012). Moreover, advertising utility
was found to be a predictor of media multitasking: the more people perceive advertising
as useful the greater their propensity for media multitasking behavior (Duff, Yoon,

6
Wang, and Anghelcev 2014). This suggests that HMMs may be more attentive to task-
unrelated information such as advertising that can be intentionally ignored by LMMs. In
this way, media multitaskers’ varying motivation for viewing irrelevant information may
have different influences on advertising effectiveness. HMMs, who are breadth-biased,
may be more likely to carefully attend to and process advertising while LMMs tend to
inhibit attention to, and processing of, advertising when it is deemed irrelevant to their
tasks and goals.
According to the elaboration likelihood model (ELM; Petty and Cacioppo 1986),
people are more likely to process information carefully when they are both motivated and
able to do so; however, people tend to be influenced by more peripheral information (e.g.,
how attractive an endorser is) when they are less motivated and more distracted. For
example, consumers are more likely to make an effort to process an advertising message
carefully when they have plenty of time to think about the message and when the
commercial is personally relevant to their interests. If they are either unwilling or unable
to carefully process the information in the ad, they are less likely to be swayed by
substantive features in the ad and more likely to be susceptible to peripheral cues such as
a pleasant image or happy music in the background. This is because such nonsubstantive
cues can be processed easily and can also provide shortcuts to making decisions with
minimal cognitive effort (Shavitt, Swan, Lowrey, and Wänke 1994).
Moreover, the ELM can be reconceptualized in terms of a 2 x 2 factorial design.
The degree of cognitive elaboration that people engage in, although conceptualized as a
continuum in the Model, can be manipulated as a two-level independent variable: central
vs. peripheral processing. Participants can be shown ads that would be more or less

7
persuasive under high cognitive elaboration, or central route processing, i.e., ads
featuring strong or weak arguments. They could also be shown ads that would be more or
less persuasive under low cognitive elaboration, i.e., ads featuring an attractive or
unattractive source. So the first independent variable in this 2 x 2 factorial design could
be an ad feature: arguments vs. attractiveness. The other two-level independent variable
would be the quality of the ads; strong arguments and attractive sources make for better
ads, whereas weak arguments and unattractive sources make for worse ads. Thus, the 2 x
2 factorial design of this slight reconceptualization of the ELM is ad feature (arguments
vs. attractiveness) by ad strength (better vs. worse).
The limited capacity and elaboration likelihood models have significant
implications for today’s heavy media environment where consumers are increasingly
becoming multitaskers. Both theories imply that multitasking inevitably results in
reduced attention to advertising content. Although it is still unclear to what extent
consumers allocate more or fewer resources and store information, these theories can
provide the groundwork for understanding how consumers respond to advertising stimuli
in a media multitasking environment.
2.3 Distraction and Persuasion
Previous multitasking research has examined the disruptive impact of
multitasking on information processing, especially in terms of comprehension and recall
(Armstrong and Chung 2000). On the other hand, other studies suggest that distraction
may increase persuasion by reducing counter-argument production (Baron, Baron, and
Miller 1973; Festinger and Maccoby 1964; Chowdhury et al. 2007; Jeong and Hwang

8
2012). Media multitasking may also increase media persuasion effects by allowing
message content to slip away from viewers’ scrutiny with less attention being paid
(Collins 2008). Thus, it is important to understand how distraction influences message
processing in order to provide some insight into the role of media multitasking on
persuasion.
Distraction may either enhance or reduce persuasion (i.e., agreement in terms of
attitudes) under different circumstances (Petty, Wells, and Brock 1976). Distraction
effects can cause variability in consumers’ cognitive responses elicited by a persuasive
message (i.e., supporting arguments or counterarguments). A strong message
predominantly produces favorable thoughts and distraction may inhibit supporting
cognitive elaboration resulting in a lower persuasive impact. On the other hand, for a
weak message where the dominant cognitive response is disagreement, distraction may
enhance persuasion by weakening the counterargument process. In short, distraction can
enhance persuasion for a weak message by suppressing counterarguments or decrease
persuasion for a strong message by inhibiting supportive arguments. These distraction
effects suggest that media multitasking may have a differential influence on strong and
weak arguments in advertising.
With respect to the impact of media multitasking on message persuasion, in one
study a media multitasking group self-reported and actually performed worse at
comprehending and counterarguing the persuasive message (Jeong and Hwang 2012).
The results suggest that media multitasking can decrease persuasion by inhibiting
comprehension, but also can increase persuasion by reducing counterarguing. In case of
the influence of distraction (i.e., the simultaneous presentation of advertising and

9
television programming in the split-screen) on advertising, viewers generated fewer
supporting arguments and less favorable brand evaluations in response to a relatively
strong advertising message, but not for the weak one. This indicates that distraction
elicited by the simultaneous presentation is more beneficial for relatively weak messages,
and further implies that such a distracting format is more suitable for ads that contain
peripheral cues such as an attractive endorser than for ads that require elaborative
cognitive effort (Chowdhury et al. 2007).
2.4 Research Questions
The present study has two important research questions. The first question is
whether there is a relationship between people’s media multitasking level and their
responses to advertisements. Research on media multitaskers found that HMMs are more
susceptible to irrelevant stimuli than LMMs due to the formers’ inability to filter out
information. People who report frequently engaging in media multitasking may tend to be
more attentive to advertising information (which can be considered irrelevant in a dual
tasking environment where people are, say, reading an article while watching television).
Because HMMs are more motivated to attend to advertising, I predict the following:
Hypothesis 1: Participants’ propensity for media multitasking will be positively
correlated with their memory (both recall and recognition) for advertisements in a media
multitasking environment.

10
The second question is how media multitaskers respond differently to variables in
advertising such as argument strength and endorser attractiveness. As discussed above,
HMMs have more motivation and ability to process advertising messages compared to
LMMs. According to the ELM, argument strength manipulations in ads can be more or
less persuasive when people are more motivated and able to process information, while
endorser attractiveness manipulations in ads can be more or less persuasive when people
are less motivated and able to process information. Therefore, following the ELM it is
possible to predict that participants with a higher propensity for media multitasking will
tend to have better attitudinal responses (including affective, cognitive, and behavioral
[i.e., purchase intention] components) to an ad featuring strong arguments than to an ad
featuring weak arguments. This is because HMMs tend to process the ads more centrally
due to their higher motivation and ability to process advertising/irrelevant information.
And if HMMs are processing advertising carefully, they should also show no effect of
endorser attractiveness. However, participants with a lower propensity for media
multitasking will tend to have better attitudinal responses to an attractive endorser ad than
to an unattractive endorser ad while showing no effect of argument strength
manipulations. This is because LMMs are better at attending to the primary task, and
should be more likely to process the ads peripherally (if at all). This pattern of results is
conceptually identical to Petty, Cacioppo, and Schuman (1983), and can be seen in Figure
1: ELM-based hypotheses. More formally, I suggest a series of hypotheses following
predictions that can be made based on the ELM, and MMI serving as a measure of
participants’ motivation and ability to process irrelevant advertising information:

11
Hypothesis 2a: There will be a main effect of ad quality on affective and cognitive
attitudes, as well as behavioral intentions, such that better ads (strong arguments,
attractive endorser) will elicit more positive responses than worse ads (weak arguments,
unattractive endorser).
Hypothesis 3a: There will be a three-way interaction among ad quality, ad feature,
and MMI on affective and cognitive attitudes, as well as behavioral intentions. This
three-way interaction can be decomposed into two different two-way interactions: First,
among participants who saw the argument strength manipulations, HMMs will respond
positively to strong arguments, and negatively to weak arguments, but LMMs will not
differentiate among strong and weak arguments (see top half of Figure 1). Second, among
participants who saw the endorser attractiveness manipulations, LMMs will respond
positively to the attractive endorser, and negatively to the unattractive endorser, but
HMMs will not differentiate among attractive and unattractive endorsers (see bottom half
of Figure 1).
However, these ELM-based hypotheses may not hold in a media multitasking
environment where people are under cognitive load. Participants in the present study
were exposed to a cognitively demanding environment where they were asked to perform
media multitasking, reading a 3000 word article excerpted from The New Yorker
magazine (Gladwell 2002) and watching a 12 minute video clip from a Disney situation
comedy at the same time. It is possible that neither HMMs nor LMMs will be able to
process information carefully, especially when the information (i.e., advertising) is not

12
related to their primary goals. In this case, an ELM with cognitive load-based set of
hypotheses may be proposed. If participants are under too much cognitive load, neither
HMMs nor LMMs will be able to process information carefully, despite HMMs’ higher
motivation to acquire information, so no one will show a differential attitudinal response
in the argument strength conditions. However, because HMMs are motivated to attend to
advertising they may be susceptible to peripheral cues, such as endorser attractiveness,
that can affect attitudes in the absence of cognitive elaboration. LMMs, on the other
hand, should be better at filtering out advertisements, and should therefore show no
attitudinal effect due to the endorser attractiveness manipulations. This predicted pattern
of results can be seen in Figure 2: ELM and cognitive load-based hypotheses. More
formally, I suggest a series of alternate, competing hypotheses following predictions that
can be made based on the ELM and cognitive load brought on by a multitasking
environment:
Hypothesis 2b: There will be a (marginal) main effect of ad quality on affective
and cognitive attitudes, as well as behavioral intentions, such that better ads (strong
arguments, attractive endorser) will elicit more positive responses than worse ads (weak
arguments, unattractive endorser).
Hypothesis 3b: There will be a three-way interaction among ad quality, ad feature,
and MMI on affective and cognitive attitudes, as well as behavioral intentions. This
three-way interaction can be decomposed into two different two-way interactions: First,
among participants who saw the argument strength manipulations, HMMs and LMMs

13
will show no effect of the manipulations (see top half of Figure 2). Second, among
participants who saw the endorser attractiveness manipulations, HMMs will respond
positively to the attractive endorser, and negatively to the unattractive endorser, but
LMMs will not differentiate among attractive and unattractive endorsers (see bottom half
of Figure 2).

14
2.5 TABLES AND FIGURES Figure 1. ELM-based hypotheses
0
1
2
3
4
5
6
7
Lower MMI Higher MMI
Attitude
Attractive Endorser
Unattrative Endorser
0
1
2
3
4
5
6
7
Lower MMI Higher MMI
Attitude
Strong Argument
Weak Argument

15
Figure 2. ELM and cognitive load-based hypotheses
0
1
2
3
4
5
6
7
Lower MMI Higher MMI
Attitude
Attractive Endorser
Unattrative Endorser
0
1
2
3
4
5
6
7
Lower MMI Higher MMI
Attitude
Strong Argument
Weak Argument
16
CHAPTER 3
METHODOLOGY
3.1 Design
In this experiment I first measured participants’ level of media multitasking and
then manipulated the quality of argument strength and endorser attractiveness; I then
measured cognitive, affective, and behavioral responses, along with content
comprehension level. This study is a 2 (ad feature: argument strength vs. endorser
attractiveness) x 2 (ad quality: better vs. worse) between subjects factorial design with a
measured, continuous predictor variable, participants’ level of media multitasking (see
Table 1). The participants’ media multitasking level was treated as a continuous variable
representing individual differences. The dichotomous independent variables included ad
features (i.e., argument strength: strong and weak argument ad vs. endorser
attractiveness: attractive and unattractive endorser ad) and quality of ads (i.e., better
condition: strong argument and attractive endorser ad vs. worse condition: weak
argument and unattractive endorser ad). There were three dependent variables including
memory for the ads (both recall and recognition measures), attitudes (overall attitude
along with affective and cognitive attitude), and purchase intention.
3.2 Participants
Two hundred and fifty two undergraduates in an Advertising department at a large
Midwestern university participated in exchange for extra credits. First, they filled out a
questionnaire about their media use (i.e., the Media Multitasking Index, Ophir et al.,

17
2009; see Appendix A), which was administered online. Once students had completed the
online survey, they were invited to participate in the experimental portion of the study. A
total of 213 students agreed to participate in the onsite experiment. Since media
multitasking is a cognitively high-demand activity and language is an important variable,
41 non-native participants were excluded in data analysis. I also excluded three
participants who had already seen the critical brand of toothpaste used in the study
(Marvis) prior to the experiment, as well as three outliers who took extended periods of
time to complete the MMI online. Eight participants who reported previously seeing the
video content were also excluded. No participant had read the article before. 158 usable
respondents remained in the data set. One hundred and twenty (75.9 %) were female and
38 (24.1%) were male participants. They averaged 19.7 years old, ranging from 17 to 21
(SD = 0.98).
3.3 Procedure
Participants were randomly assigned to one of the four experimental conditions.
When they arrived at the computer lab they were seated at headset-enabled individual
computers where they could view the experimental stimuli. While seated at the computer
participants read an “online” magazine article and watched a video on the same screen.
The screen size was big enough (21.5-inch display) to present both the two-page display
of the magazine and the video content. As a cover story, participants were told that the
study was to see to what extent they could perform media multitasking. They were asked
to read the online magazine and watch the video clip at the same time, and were informed
that there would be some questions related to the tasks afterwards. The video was 12

18
minutes long and the reading material was informally pretested to take about the same
amount of time to read. After this multitasking exercise, the participants filled out a
questionnaire of dependent measures, including questions about reading and video
comprehension, advertisements in the magazine, and other demographic information.
3.4 Experimental Stimuli
The media multitasking tasks included reading an online magazine article, The
Talent Myth, by Malcolm Gladwell (2002), excerpted from The New Yorker magazine
and viewing an edited TV episode from Good Luck Charlie, It’s Christmas! by Disney
(2011). The online magazine was slightly modified (cut short) and the print
advertisements were created for this experiment (see Appendix B). There were four
experimental stimuli, all of them ads for the European toothpaste brand Marvis. This
critical brand was chosen for its product package design; it is in English yet unfamiliar to
American consumers (as noted earlier, only three out of 175 participants had previously
seen the brand). Four print advertisements for the toothpaste brand Marvis were
manipulated based on ad feature (i.e., argument strength and endorser attractiveness) and
ad quality (i.e., better ads and worse ads).
Two pretests were conducted to evaluate the level of argument quality and
endorser attractiveness in the Marvis advertisements. In order to minimize confounding
effects between argument valence and argument strength, both the strong argument ad
and the weak argument ad have the same product attributes and features with varying
degrees of argument strengths (Areni and Lutz 1988; Chowdhury et al. 2007). With
respect to argument strength, the attributes of the toothpaste varied by country of origin

19
(i.e., Italy vs. England), cleaning (i.e., without any gritty residue vs. with only a little
gritty residue), freshening (i.e., fresh for all day long vs. fresh for hours), packaging (i.e.,
8 different colors in 4 oz. vs. 4 different colors in 2.8 oz.), comparison (i.e., more than
any other brand vs. just as other brand), tradition (i.e., the 50th anniversary vs. the 5th
anniversary), discount (i.e., buy one get one free vs. buy one and get one five percent
off), and safety (i.e., safe ingredients approved by FDA vs. some ingredients approved by
FDA). In the same line of reasoning, only the level of endorser attractiveness was
manipulated while keeping other features constant (i.e., the message of both attractive
endorser ad and unattractive endorser ad was the same).
Three print advertisements were included in the magazine: one of the four
experimental stimuli types (strong argument ad, weak argument ad, attractive endorser
ad, and unattractive endorser ad; see Appendix C and D) and two filler ads (i.e., a cat
food brand, Felix, and a coffee beverage, TOP; see Appendix E). The products used in
the filler ads were also foreign brands from England and Korea, respectively. Regarding
familiarity with the task materials, only six participants had seen the TV episode and
none had read the article before.
3.5 Measures
3.5.1 Media Multitasking Level
The media multitasking level was measured through a self-report questionnaire,
the Media Multitasking Index (MMI; Ophir et al. 2009). The MMI, administered online,
assesses respondents’ use of twelve different media: print media, television, computer
video, music, non-musical audio, video games, telephone, text messaging (SMS), instant

20
messaging, web surfing, e-mail, and other computer applications. Respondents were
asked to type in the number of hours per week they use each medium and how frequently
they use the primary medium along with other media at the same time (i.e., “Most of the
time,” “Some of the time,” “A little of the time,” or “Never”). The same formula
developed by Ophir et al. (2009) was used to calculate a media multitasking index by
multiplying the number of hours per week spent using each of 11 primary mediums with
the number of other media typically used while using the primary medium. Response
options were weighted as follows: “Most of the time” with a score of 1, “Some of the
time” with a score of 0.67, “A little of the time” with a score of 0.33, and “Never” with a
score of 0. The product was then divided by the sum of total hours spent per week with
all primary media.
3.5.2 Content Comprehension
After the multitasking portion of the study, participants were first asked to answer
reading and video comprehension questions. A total of 12 multiple-choice questions were
developed, six each for the magazine article and the TV episode. In order to assess better
the participants’ understanding on the materials, the comprehension questions were
generated based on Bloom’s Taxonomy: two of six questions were basic knowledge
level, two were intermediate, and two were in-depth analysis level (Bloom 1956; Lin et
al. 2009). For the reading and video material, basic knowledge level questions assessed
the basic information that can be obtained just by reading the article (e.g., “Who
consulted Enron?”) and watching the video clip (e.g., “What did Dad buy?”). The
intermediate level questions required participants to understand the meaning of concepts

21
and content: “Which of the following best describes what Enron did based on ‘the talent
mind-set’?” for the reading material and “What seems to be the most important Christmas
tradition to Mom?” for the video content. The in-depth analysis level questions measured
participants’ ability to integrate information and further to make inferences: “Given what
you read, which of the following statements is the most probable?” for the article and
“Why are Mom and Dad so on edge?” for the video clip (see Appendix F for complete
materials).
3.5.3 Cognitive Measures
For cognitive responses, free recall, aided recall, and cued-recognition were
measured (Petty, Cacioppo, and Schumann 1983; Voorveld 2011; see Appendix G). Free
recall was measured with an open-ended question asking participants to list all of the
product categories that were advertised in the magazine (e.g., coffee beverage, toothpaste,
and cat food) with a score of 1 for each correct product category (a score of 3 was
possible for correctly typing in all three product categories). With respect to aided recall,
the participants were asked to type in the toothpaste brand that was advertised in the
magazine and were scored 1 for Marvis and 0 for an incorrect answer. Category-cued
brand recognition was measured by asking the respondents to mark the toothpaste brand
advertised in the magazine among multiple choices (i.e., Botot, Marvis, Solidox) with a
score of 1 for the correct answer and 0 for the other two incorrect choices. For brand-
cued recognition, the participants were asked if there was an ad for Marvis included in
the advertisements they saw in the magazine. This was scored 1 for Yes, 0 for No, and
0.5 for I don’t know.

22
3.5.4 Attitude Measures
Attitudinal responses were measured in terms of affective and cognitive aspects of
attitude construct (Crites, Fabrigar, and Petty 1994). The participants were asked to
choose a number on each scale that best described their feelings toward the brand.
Affective attitude was measured with three items on seven-point semantic differential
scales (hate/love, sad/delighted, sorrow/joy). Cognitive attitude was also measured with
three items on seven-point semantic differential scales (useless/useful, unsafe/safe,
harmful/beneficial). In addition, to reflect the participants’ comprehensive attitudes
toward the brand, a global evaluation on the brand was measured by asking overall how
much they liked Marvis as a toothpaste product (single item seven point scale,
dislike/like; Biehal, Stephens, and Curlo 1992).
3.5.5 Behavioral Measure
The intent to buy the brand in the ad was measured through a single item, seven
point scale. Participants were asked to indicate their likelihood of buying the advertised
product if it were available and affordable, with end points labeled as “very low” and
“very high.”
3.5.6 Follow-up Questions
Participants were asked to report their perceived difficulty of the media
multitasking task they performed and how the task made them feel on two separate
seven-point semantic differential items, anchored by difficult/easy and upset/pleasant.
They reported the extent to which they devoted their attention to both the reading and
23
video tasks on a slider (i.e., percentage of attention to reading the magazine, watching the
video, and some unrelated task add up to 100% in total). In addition, participants
indicated whether they were previously exposed to the experimental stimuli including the
brand Marvis and the task materials. They also reported how much they enjoyed reading
the article and watching the TV episode. Some demographic information such as gender,
age and primary language was also asked at the end of the survey.

24
3.6 TABLES AND FIGURES Table 1. Experiment design
Better Quality Worse Quality
Argument Strength Strong Argument Ad Weak Argument Ad
Endorser Attractiveness Attractive Endorser Ad Attractive Endorser Ad

25
CHAPTER 4
RESULTS
4.1 Manipulation Check
Two pretests were conducted to evaluate the level of argument quality and
endorser attractiveness in the Marvis advertisements. The first pretest was conducted to
evaluate the quality of the messages in the ad in terms of persuasiveness
(unpersuasive/persuasive), strength (weak/strong), and positiveness (bad/good) using
seven-point scales. An independent samples t-test indicated that all constructs of
persuasiveness (Mstrong = 4.33, SDstrong = 1.48, Mweak = 3.55, SDweak = 1.4, t(77) = 2.43),
strength (Mstrong = 4.46, SDstrong = 1.27, Mweak = 3.78, SDweak = 1.39, t(77) = 2.43), and
positiveness (Mstrong = 4.79, SDstrong = 1.28, Mweak = 3.93, SDweak = 1.35, t(77) = 2.94)
were successfully manipulated, all ps < 0.05 (see Table 2). The level of endorser
attractiveness was evaluated in light of likability (dislike/like), favorability
(unfavorable/favorable) and attractiveness (unattractive/attractive) using seven-point
scales. The results in Table 3 show that the level of attractiveness between the attractive
endorser ad and the unattractive endorser ad was significantly different, Mattractive = 5.65,
SDattractive = 1.41, Munattractive = 4.94, SDunattractive = 1.63, t(98) = 2.33, p <0.05. There were
no significant differences in likability (Mattractive = 5.08, SDattractive = 1.46, Munattractive =
4.94, SDunattractive = 1.48, t(98) = 0.48, p > 0.6) and favorability (Mattractive = 5.16, SDattractive
= 1.53, Munattractive = 4.96, SDunattractive = 1.47, t(98) = 0.68, p > 0.4) between these two
endorsers. These results suggest that only the attractiveness of the endorser was

26
successfully manipulated without being confounded with other similar constructs (Perdue
and Summers 1986).
4.2 Media Multitaskers
The online survey (N = 249) shows that the total MMI scores of students (M =
4.67, SD = 1.95) ranged from 0.18 to 11.52. They were normally distributed, with
skewness of 0.7 (SE = 0.15) and kurtosis of 1.07 (SE = 0.31; see Figure 3). The
participants’ MMI scores (N = 158, M = 4.62, SD = 1.8) ranged from 0.83 to 10.79 and
were also normally distributed, with skewness of 0.76 (SE = 0.19) and kurtosis of 1.15
(SE = 0.38; see Figure 4). The researchers who developed the MMI used it to identify
HMMs and LMMs (Ophir et al. 2009). In their study, heavy media multitaskers were
identified as those respondents who were one standard deviation or more above the mean
while light media multitaskers were identified as those respondents who were one
standard deviation or more below the mean. In doing this, Ophir et al. (2009)
dichotomized media multitasking by splitting responses into HMMs and LMMs. In the
present study, I treated media multitasking as a continuous variable because
dichotomization of continuous variables is associated with a variety of problems (see, for
example, Cohen 1983; Fitzsimons 2008).
4.3 Task Performance
A paired-samples t-test was performed to explore how participants performed the
media multitasking tasks. A Pearson product-moment correlation coefficient was also
conducted to examine any relationship between MMI and task-related variables. Means,

27
standard deviations, ranges, and reliability statistics of the variables are presented in
Table 4.
A paired-samples t-test indicated that participants scored higher on the video
tasks (M = 3.15, SD = 1.44) than the reading tasks (M = 2.34, SD = 1.79). The difference,
-0.81, BCa 95% CI [-1.14, -0.43], was significant t(157) = -4.57, p < 0.001, d = 0.5.
A Pearson correlation was performed to test any relationship between
participants’ MMI and their task performance but there were no significant results, all rs
< 0.057 (ps > 0.48). With respect to attention allocation questions, the participants’
subjective report of attention to the video was significantly correlated with their scores
on the video comprehension task, r = 0.31 (p < 0.01), while negatively correlated with
their assessments of the task difficulty, r = -0.42 (p < 0.01). The results in Table 5 show
that the participants’ attention to the reading material was negatively correlated with
their scores in the video task, r = -0.29 (p < 0.01), and was positively correlated with
their assessments of the task difficulty, r = 0.43 (p < 0.01). There was no significant
relationship between participants’ self-reported feeling (i.e., whether the media
multitasking makes them feel upset or pleasant) with other task-related variables. In
short, participants who reported paying more attention to the video content scored
higher on the related test and judged the media multitasking task less difficult.
4.4 Media Multitasking and Advertising Effectiveness
4.4.1 Cognitive Measure
A Pearson product-moment correlation coefficient was conducted to assess the
relationship between the level of media multitasking and dependent variables. I did not

28
expect either ad feature or ad quality to affect participants’ cognitive responses to (i.e.,
memory for) advertising because different ad feature and ad quality do not necessarily
enhance or reduce memory. Therefore, no analyses regarding condition effects on
memory were conducted. Means, standard deviations, ranges, and reliability statistics of
the memory variables are presented in Table 6.
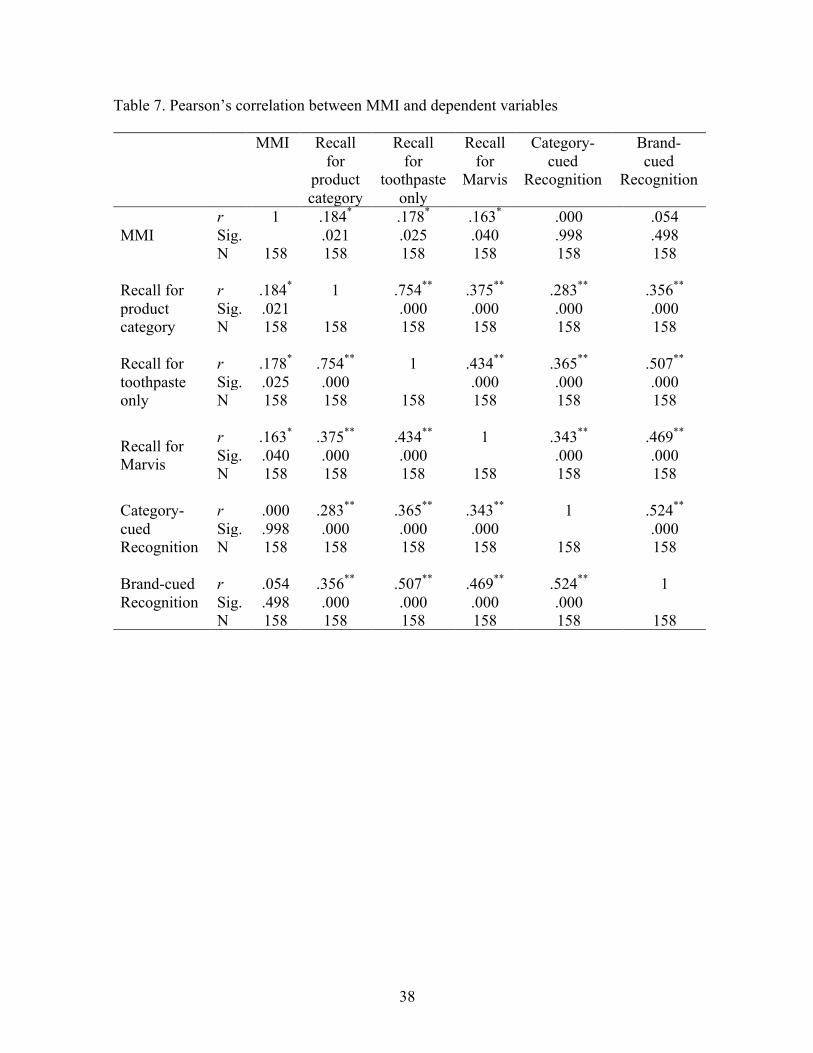
The correlation matrix (see Table 7) shows that MMI scores were positively
correlated with free recall for all three product categories, r = .18, BCa 95% CI [0.01,
0.33], free recall for the toothpaste product category, r = 0.18, BCa 95% CI [0.02, 0.33],
and free recall for the brand name Marvis, r = 0.16, BCa 95% CI [0.02, 0.33], (all ps <
0.05). Figure 5 shows the correlations between MMI and free recall for product category
and Figure 6 shows the correlations between MMI and free recall for Marvis. There was
no significant correlation between MMI and other dependent variables such as
recognition, attitudes, and purchase intention.
How were the various dependent measures correlated with each other? Free recall
for the toothpaste was positively correlated with brand recall (r = 0.43, 95% BCa CI
[0.29, 0.56], p < 0.01), category-cued recognition (r = .37, 95% BCa CI [0.22, 0.48], p <
0.01), brand-cued recognition (r = 0.51, 95% BCa CI [0.38, 0.62], p < 0.01), as well as
cognitive attitude (r = 0.18, 95% BCa CI [0.02, 0.35], p < 0.05). Free recall for product
category was also positively correlated with cognitive attitude, r = 0.22, 95% BCa CI
[0.09, 0.36], (p < 0.01). Free recall for Marvis was positively correlated with overall
attitudes, r = 0.22, 95% BCa CI [0.07, 0.36], (p < 0.05). All in all, participants with
higher MMI scores were more likely to recall the product categories (i.e., coffee
beverage, toothpaste, and cat food) and the critical brand Marvis that were advertised in

29
the magazine. Therefore, hypothesis 1 was partially supported that the MMI was
positively correlated only with free recall while there was no relationship with
recognition.
4.4.2 Attitudinal Measure
A series of multiple regression analyses was performed to see how attitudinal
responses could be explained by MMI, ad feature (argument strength vs. endorser
attractiveness) and ad quality (better vs. worse). Means, standard deviations, ranges, and
reliability statistics of the variables are presented in Table 8.
Overall Attitude
Overall attitude was regressed on the predictor and independent variables, MMI,
ad feature, and ad quality, testing for main effects and all possible interactions (see Table
9). There were no main effects (all βs < |0.25|, ts < |1.7|, ps > 0.11), and thus there was no
support for either hypothesis 2a or 2b. There was a significant two-way interaction
between MMI and ad quality on overall attitude (β = 0.33, t = 2.21, p = 0.03); the more
people engaged in media multitasking, the more they liked the worse ads (see Figure 7).
No other two-way interaction was significant (all βs < |0.4|, ts < |2.3|, ps > 0.16). The
three-way interaction among MMI, ad feature, and ad quality was marginally significant
(β = -0.52, t = -1.77, p = 0.08).
In order to examine the marginal three-way interaction and test competing
hypotheses 3a and 3b, I conducted two separate two-way analyses examining the effects
of MMI and ad quality on participants’ overall attitudes toward the brand, first among
30
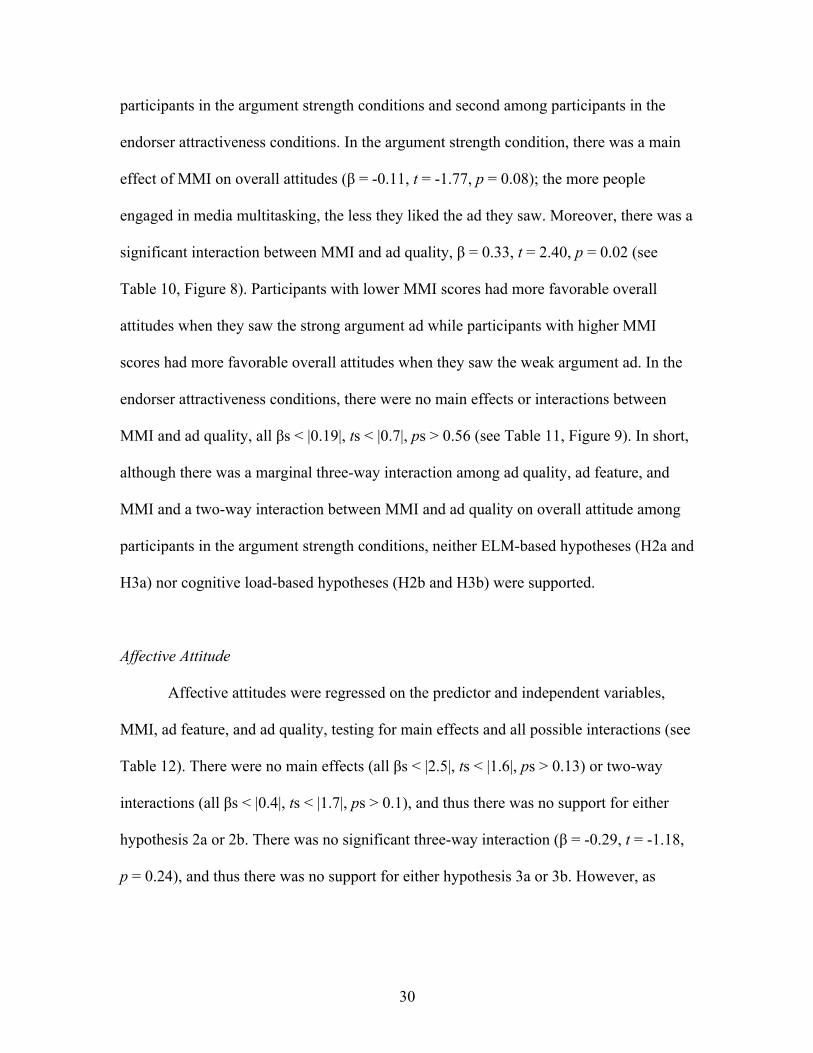
participants in the argument strength conditions and second among participants in the
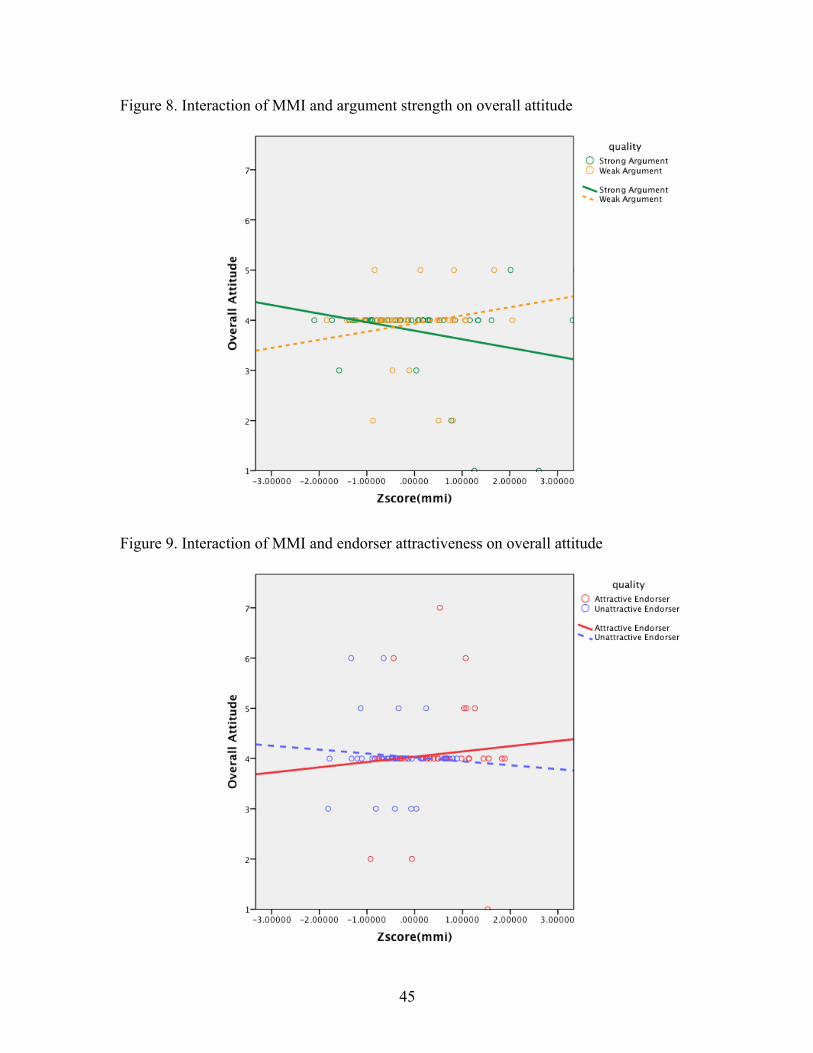
endorser attractiveness conditions. In the argument strength condition, there was a main
effect of MMI on overall attitudes (β = -0.11, t = -1.77, p = 0.08); the more people
engaged in media multitasking, the less they liked the ad they saw. Moreover, there was a
significant interaction between MMI and ad quality, β = 0.33, t = 2.40, p = 0.02 (see
Table 10, Figure 8). Participants with lower MMI scores had more favorable overall
attitudes when they saw the strong argument ad while participants with higher MMI
scores had more favorable overall attitudes when they saw the weak argument ad. In the
endorser attractiveness conditions, there were no main effects or interactions between
MMI and ad quality, all βs < |0.19|, ts < |0.7|, ps > 0.56 (see Table 11, Figure 9). In short,
although there was a marginal three-way interaction among ad quality, ad feature, and
MMI and a two-way interaction between MMI and ad quality on overall attitude among
participants in the argument strength conditions, neither ELM-based hypotheses (H2a and
H3a) nor cognitive load-based hypotheses (H2b and H3b) were supported.
Affective Attitude
Affective attitudes were regressed on the predictor and independent variables,
MMI, ad feature, and ad quality, testing for main effects and all possible interactions (see
Table 12). There were no main effects (all βs < |2.5|, ts < |1.6|, ps > 0.13) or two-way
interactions (all βs < |0.4|, ts < |1.7|, ps > 0.1), and thus there was no support for either
hypothesis 2a or 2b. There was no significant three-way interaction (β = -0.29, t = -1.18,
p = 0.24), and thus there was no support for either hypothesis 3a or 3b. However, as

31
above, I decomposed the three-way into two separate two-way analyses, this time for
exploratory purposes.
In the argument strength conditions, there were no main effects (all βs < |0.07|, ts
< |0.96|, ps > 0.34); however, there was a significant two-way interaction between MMI
and ad quality, β = 0.2, t = 2.04, p = 0.05 (see Table 13, Figure 10). Similar to the results
for overall attitudes, participants with lower MMI had more favorable affective attitudes
when they saw the strong argument ad while participants with higher MMI had more
favorable affective attitudes when they saw the weak argument ad. In the endorser
attractiveness conditions, there were no main effects (all βs < |0.31|, ts < |1.6|, ps > 0.12)
and no interaction between MMI and ad quality, β = -0.08, t = -0.34, p = 0.74 (see Table
14, Figure 11). Although there was a significant two-way interaction between MMI and
ad quality on affective attitude in the argument strength conditions, neither ELM-based
hypotheses (H2a and H3a) nor cognitive load-based hypotheses (H2b and H3b) were
supported.
Cognitive Attitude
Cognitive attitudes were regressed on the predictor and independent variables,
MMI, ad feature, and ad quality, testing for main effects and all possible interactions (see
Table 15). There were no main effects (all βs < |0.11|, ts < |0.8|, ps > 0.42), or two-way
interactions (all βs < |0.13|, ts < |0.65|, ps > 0.52), and thus there was no support for either
hypothesis 2a or 2b. There was no three-way interaction (β = -0.26, t = -0.69, p = 0.49),
and thus there was no support for either hypothesis 3a or 3b. However, as above, I
decomposed the three-way into two separate two-way analyses for exploratory purposes.

32
In the argument strength conditions, there were no main effects (all βs < |0.11|, ts
< |0.8|, ps > 0.42) or two-way interactions, β = -0.13, t = -0.65, p = 0.52 (see Table 16,
Figure 12). Although the findings were not significant, participants with lower MMI had
slightly more favorable cognitive attitudes when they saw the weak argument while
participants with higher MMI had slightly more favorable cognitive attitudes when they
saw the strong argument. In the endorser attractiveness conditions, there were no main
effects (all βs < |0.22|, ts < |0.99|, ps > 0.32) or two-way interactions, β = -0.39, t = -1.19,
p = 0.24 (see Table 17, see Figure 13). Although the findings were not significant,
participants with lower MMI had slightly more favorable cognitive attitudes when they
saw the unattractive endorser ad while participants with higher MMI had slightly more
favorable cognitive attitudes when they saw the attractive endorser ad. All in all,
regarding cognitive attitude, neither ELM-based hypotheses (H2a and H3a) nor cognitive
load-based hypotheses (H2b and H3b) were supported.
4.4.3 Behavioral Measure
Purchase Intention
Purchase intention was regressed on the predictor and independent variables,
MMI, ad feature, and ad quality, testing for main effects and all possible interactions (see
Table 18). There were no main effects (all βs < |0.47|, ts < |1.39|, ps > 0.16) or two-way
interactions (all βs < |0.51|, ts < |1.32|, ps > 0.19), and thus there was no support for either
hypothesis 2a or 2b. There was no three-way interaction (β = 0.12, t = 0.21, p = 0.84),
and thus there was no support for either hypothesis 3a or 3b. However, as above, I
decomposed the three-way into two separate two-way analyses for exploratory purposes.

33
In the argument strength conditions, there were no main effects (all βs < |0.47|, ts
< |1.44|, ps > 0.15) or two-way interactions, β = -0.02, t = -0.06, p = 0.95 (see Table 19,
Figure 14). Although the findings were not significant, both participants with higher
MMI and lower MMI had greater purchase intention when they saw the strong argument
ad than the weak argument ad. In the endorser attractiveness conditions, there were no
main effects (β = -0.22, t = -0.65, p = 0.52) or two-way interactions (β = 0.1, t = 0.2, p =
0.84). However, there was a significant main effect of ad quality on purchase intention, β
= -0.85, t = -2.06, p = 0.04 (see Table 20, Figure 15). Regardless of MMI, participants’
purchase intention was higher in the attractive endorser ad than the unattractive endorser
ad. In conclusion, regarding purchase intention, neither ELM-based hypotheses (H2a and
H3a) nor cognitive load-based hypotheses (H2b and H3b) were supported.

34
4.5 TABLES AND FIGURES
Table 2. Results of pretest 1 for argument strength
Strong Argument (N = 39)
Weak Argument (N = 40) t(77) Sig.
Persuasiveness 4.33 (1.48) 3.55 (1.4) 2.426 0.02 Strength 4.46 (1.27) 3.78 (1.39) 2.429 0.03 Positiveness 4.79 (1.28) 3.93 (1.35) 2.94 0.00 Note: Standard deviations appear in parentheses. Table 3. Results of pretest 2 for endorser attractiveness
Attractive Endorser
(N = 49) Unattractive Endorser
(N = 51) t(98) Sig.
Likability 5.08 (1.46) 4.94 (1.48) 0.479 0.63 Favorability 5.16 (1.53) 4.96 (1.47) 0.675 0.50 Attractiveness 5.65 (1.41) 4.94 (1.63) 2.334 0.02 Note: Standard deviations appear in parentheses.

35
Figure 3. A normal distribution of media multitasking index (MMI) from the online survey with N = 249
Figure 4. A normal distribution of media multitasking index (MMI) among the experiment participants with N = 158

36
Table 4. Means, standard deviations, and possible ranges for task-related variables N Mean SD Possible Range Reading score 158 2.34 1.79 0 to 12 Video score 158 3.15 1.44 0 to 12 Attention to reading 158 43.3 24.86 0 to 100 Attention to reading 158 51.8 24.53 0 to 100 Attention to reading 158 4.89 7.55 0 to 100 Difficulty 158 2.23 1.14 1 to 7 Feeling 158 3.04 1.01 1 to 7 Enjoy article 158 3.07 1.81 1 to 7 Enjoy video 158 4.68 1.59 1 to 7 Table 5. Correlations among MMI, attention allocation, task performance, self-reported difficulty and feeling
Reading score Video score Difficulty Feeling
MMI
r -.034 .056 .155 .050 Sig. .675 .487 .051 .529 N 158 158 158 158
Attention to reading r .118 -.291** .431** .163
Sig. .140 .000 .000 .041 N 158 158 158 158
Attention to reading r -.108 .312** -.422** -.138
Sig. .177 .000 .000 .084 N 158 158 158 158
Attention to reading
r -.037 -.056 -.046 -.089 Sig. .643 .482 .568 .264 N 158 158 158 158
**. Correlation is significant at the 0.01 level (2-tailed).

37
Table 6. Means, standard deviations, and possible ranges for cognitive variables
N Mean SD Possible Range Free recall for product category 158 1.26 0.97 0 to 3 Free recall for Marvis 158 0.21 0.41 0 to 1 Category-cued brand recognition 158 0.65 0.48 0 to 1 Brand-cued recognition 158 0.7 0.29 0 to 1
38
Table 7. Pearson’s correlation between MMI and dependent variables MMI Recall
for product category
Recall for
toothpaste only
Recall for
Marvis
Category-cued
Recognition
Brand- cued
Recognition
MMI r 1 .184* .178* .163* .000 .054 Sig. .021 .025 .040 .998 .498 N 158 158 158 158 158 158
Recall for product category
r
.184*
1
.754**
.375**
.283**
.356**
Sig. .021 .000 .000 .000 .000 N 158 158 158 158 158 158
Recall for toothpaste only
r
.178*
.754**
1
.434**
.365**
.507**
Sig. .025 .000 .000 .000 .000 N 158 158 158 158 158 158
Recall for Marvis
r
.163*
.375**
.434**
1
.343**
.469**
Sig. .040 .000 .000 .000 .000 N 158 158 158 158 158 158
Category-cued Recognition
r
.000
.283**
.365**
.343**
1
.524**
Sig. .998 .000 .000 .000 .000 N 158 158 158 158 158 158
Brand-cued Recognition
r
.054
.356**
.507**
.469**
.524**
1
Sig. .498 .000 .000 .000 .000 N 158 158 158 158 158 158

39
Table 7 (cont.) Overall
attitude Affective attitude
Cognitive attitude
MMI r .003 .062 .057 Sig. .970 .436 .480 N 158 158 158
Recall for product category
r
.117
.123
.221**
Sig. .143 .123 .005 N 158 158 158
Recall for toothpaste only
r
-.011
.033
.180*
Sig. .888 .679 .024 N 158 158 158
Recall for Marvis
r
.223**
.094
.051
Sig. .005 .239 .521 N 158 158 158
Category-cued Recognition
r
-.035
.081
.140
Sig. .660 .311 .079 N 158 158 158
Brand-cued Recognition
r
.018
.118
.172*
Sig. .825 .141 .031 N 158 158 158
*. Correlation is significant at the 0.05 level (2-tailed). **. Correlation is significant at the 0.01 level (2-tailed).

40
Figure 5. Correlation between MMI and free recall for product category (r = .18, p < 0.05)
Figure 6. Correlation between MMI and free recall for Marvis (r = .16, p < 0.05)

41
Table 8. Means, standard deviations, and possible ranges for attitudinal variables N Mean SD Possible Range Alpha Overall attitude 158 3.96 0.79 1 to 7 Affective attitude 158 4.13 0.65 1 to 7 0.89
Love 158 4.11 0.68 1 to 7 Delighted 158 4.16 0.72 1 to 7
Joy 158 4.13 0.76 1 to 7 Cognitive attitude 158 4.76 1.01 1 to 7 0.89
Useful 158 4.78 1.17 1 to 7 Safe 158 4.66 1.04 1 to 7
Beneficial 158 4.83 1.15 1 to 7 Purchase intention 158 3.54 1.55 1 to 7

42
Table 9. The effects of MMI, ad feature, and ad quality on overall attitude
Model Sum of Squares df Mean Square F Sig. Regression 5.465 7 .781 1.269 .270b Residual 92.307 150 .615 Total 97.772 157
Model
Unstandardized Coefficients
Standardized Coefficients
t
Sig.
B SE B Beta (Constant) 3.791 .120 31.692 .000 MMI -.171 .105 -.219 -1.628 .106 Quality .143 .175 .091 .818 .415 Feature .244 .188 .155 1.302 .195 QxF -.156 .269 -.086 -.582 .561 MMIxF .276 .196 .201 1.404 .162 MMIxQ .333 .151 .292 2.209 .029 MMIxQxF -.516 .292 -.243 -1.767 .079 a. Dependent Variable: Overall attitudes b. Predictors: (Constant), MMI, Quality, Feature, QualityxFeature, MMIxFeature, MMIxQuality, MMIxQualityxFeature

43
Figure 7. Interaction of MMI and ad quality on overall attitude

44
Table 10. Two-way interaction of MMI and ad quality on overall attitude for argument strength condition
Model Sum of Squares df Mean Square F Sig.
Regression 3.507 3 1.169 2.250 .089b Residual 39.999 77 .519 Total 43.506 80
Model
Unstandardized Coefficients
Standardized Coefficients
t
Sig.
B SE B Beta (Constant) 3.791 .110 34.493 .000 MMI -.171 .096 -.269 -1.772 .080 Quality .143 .161 .097 .890 .376 MMIxQ .333 .138 .366 2.404 .019 a. Dependent Variable: Overall attitude b. Predictors: (Constant), MMI, Quality, MMIxQuality Table 11. Two-way interaction of MMI and ad quality on overall attitude for endorser attractiveness condition
Model Sum of Squares df Mean Square F Sig.
Regression .367 3 .122 .171 .916b Residual 52.308 73 .717 Total 52.675 76
Model
Unstandardized Coefficients
Standardized Coefficients
t
Sig.
B SE B Beta (Constant) 4.036 .156 25.868 .000 MMI .105 .179 .104 .586 .560 Quality -.013 .220 -.008 -.061 .951 MMIxQ -.183 .270 -.114 -.677 .500 a. Dependent Variable: Overall attitude b. Predictors: (Constant), MMI, Quality, MMIxQuality
45
Figure 8. Interaction of MMI and argument strength on overall attitude
Figure 9. Interaction of MMI and endorser attractiveness on overall attitude

46
Table 12. The effects of MMI, ad feature, and ad quality on affective attitude
Model Sum of Squares df Mean Square F Sig. Regression 3.121 7 .446 1.045 .402b Residual 63.977 150 .427 Total 67.098 157
Model Unstandardized
Coefficients Standardized Coefficients
t
Sig.
B SE B Beta (Constant) 4.078 .100 40.943 .000 MMI -.066 .087 -.102 -.755 .451 Quality .025 .146 .019 .174 .862 Feature .236 .156 .181 1.508 .134 QxF -.333 .224 -.221 -1.491 .138 MMIxF .072 .163 .063 .440 .660 MMIxQ .202 .125 .214 1.612 .109 MMIxQxF -.286 .243 -.163 -1.176 .242 a. Dependent Variable: Affective attitude b. Predictors: (Constant), MMI, Quality, Feature, QualityxFeature, MMIxFeature, MMIxQuality, MMIxQualityxFeature

47
Table 13. Two-way interaction of MMI and ad quality on affective attitude for argument strength condition
Model Sum of Squares df Mean Square F Sig.
Regression 1.245 3 .415 1.552 .208b Residual 20.585 77 .267 Total 21.830 80
Model
Unstandardized Coefficients
Standardized Coefficients
t
Sig.
B SE B Beta (Constant) 4.078 .079 51.716 .000 MMI -.066 .069 -.147 -.954 .343 Quality .025 .115 .024 .219 .827 MMIxQ .202 .099 .314 2.036 .045 a. Dependent Variable: Affective attitude b. Predictors: (Constant), MMI, Quality, MMIxQuality Table 14. Two-way interaction of MMI and ad quality on affective attitude for endorser attractiveness condition
Model Sum of Squares df Mean Square F Sig.
Regression 1.632 3 .544 .915 .438b Residual 43.392 73 .594 Total 45.025 76
Model
Unstandardized Coefficients
Standardized Coefficients
t
Sig.
B SE B Beta (Constant) 4.313 .142 30.356 .000 MMI .006 .163 .007 .037 .970 Quality -.308 .200 -.201 -1.537 .129 MMIxQ -.083 .246 -.056 -.340 .735 a. Dependent Variable: Affective attitude b. Predictors: (Constant), MMI, Quality, MMIxQuality

48
Figure 10. Interaction of MMI and argument strength on affective attitude
Figure 11. Interaction of MMI and endorser attractiveness on affective attitude

49
Table 15. The effects of MMI, ad feature, and ad quality on cognitive attitude
Model Sum of Squares df Mean Square F Sig. Regression 2.872 7 .410 .389 .908b Residual 158.384 150 1.056 Total 161.255 157
Model Unstandardized
Coefficients Standardized Coefficients
t
Sig.
B SE B Beta (Constant) 4.798 .157 30.619 .000 MMI .109 .137 .109 .792 .429 Quality -.077 .229 -.038 -.337 .736 Feature -.054 .246 -.027 -.218 .828 QxF -.058 .352 -.025 -.165 .869 MMIxF .106 .257 .060 .413 .680 MMIxQ -.127 .197 -.087 -.644 .521 MMIxQxF -.264 .382 -.097 -.691 .491 a. Dependent Variable: Cognitive attitude b. Predictors: (Constant), MMI, Quality, Feature, QualityxFeature, MMIxFeature, MMIxQuality, MMIxQualityxFeature

50
Table 16. Two-way interaction of MMI and ad quality on cognitive attitude for argument strength condition
Model Sum of Squares df Mean Square F Sig.
Regression .807 3 .269 .257 .856b Residual 80.578 77 1.046 Total 81.385 80
Model
Unstandardized Coefficients
Standardized Coefficients
t
Sig.
B SE B Beta (Constant) 4.798 .156 30.757 .000 MMI .109 .137 .126 .796 .428 Quality -.077 .228 -.038 -.339 .736 MMIxQ -.127 .197 -.102 -.647 .520 a. Dependent Variable: Cognitive attitude b. Predictors: (Constant), MMI, Quality, MMIxQuality Table 17. Two-way interaction of MMI and ad quality on cognitive attitude for endorser attractiveness condition
Model Sum of Squares df Mean Square F Sig.
Regression 2.062 3 .687 .645 .589b Residual 77.805 73 1.066 Total 79.867 76
Model
Unstandardized Coefficients
Standardized Coefficients
t
Sig.
B SE B Beta (Constant) 4.744 .190 24.936 .000 MMI .215 .218 .173 .984 .328 Quality -.135 .268 -.067 -.505 .615 MMIxQ -.391 .329 -.198 -1.190 .238 a. Dependent Variable: Cognitive attitude b. Predictors: (Constant), MMI, Quality, MMIxQuality

51
Figure 12. Interaction of MMI and argument strength on cognitive attitude
Figure 13. Interaction of MMI and endorser attractiveness on cognitive attitude

52
Table 18. The effects of MMI, ad feature, and ad quality on purchase intention
Model Sum of Squares df Mean Square F Sig. Regression 23.593 7 3.370 1.438 .194b Residual 351.597 150 2.344 Total 375.190 157
Model Unstandardized
Coefficients Standardized Coefficients
t
Sig.
B SE B Beta (Constant) 3.790 .233 16.232 .000 MMI .282 .205 .185 1.381 .169 Quality -.469 .341 -.152 -1.375 .171 Feature .169 .366 .055 .462 .644 QxF -.380 .524 -.106 -.725 .469 MMIxF -.502 .383 -.187 -1.310 .192 MMIxQ -.017 .294 -.007 -.057 .955 MMIxQxF .119 .569 .029 .208 .835 a. Dependent Variable: Purchase intention b. Predictors: (Constant), MMI, Quality, Feature, QualityxFeature, MMIxFeature, MMIxQuality, MMIxQualityxFeature

53
Table 19. Two-way interaction of MMI and ad quality on purchase intention for argument strength condition
Model Sum of Squares df Mean Square F Sig.
Regression 12.231 3 4.077 1.874 .141b Residual 167.497 77 2.175 Total 179.728 80
Model
Unstandardized Coefficients
Standardized Coefficients
t
Sig.
B SE B Beta (Constant) 3.790 .225 16.850 .000 MMI .282 .197 .220 1.433 .156 Quality -.469 .329 -.157 -1.427 .158 MMIxQ -.017 .283 -.009 -.059 .953 a. Dependent Variable: Purchase intention b. Predictors: (Constant), MMI, Quality, MMIxQuality Table 20. Two-way interaction of MMI and ad quality on purchase intention for endorser attractiveness condition
Model Sum of Squares df Mean Square F Sig.
Regression 11.147 3 3.716 1.473 .229b Residual 184.100 73 2.522 Total 195.247 76
Model
Unstandardized Coefficients
Standardized Coefficients
t
Sig.
B SE B Beta (Constant) 3.959 .293 13.527 .000 MMI -.219 .336 -.113 -.653 .516 Quality -.849 .413 -.267 -2.057 .043 MMIxQ .102 .506 .033 .202 .841 a. Dependent Variable: Purchase intention b. Predictors: (Constant), MMI, Quality, MMIxQuality

54
Figure 14. Interaction of MMI and argument strength on purchase intention
Figure 15. Interaction of MMI and endorser attractiveness on purchase intention

55
CHAPTER 5
DISCUSSION
5.1 Implications
The purpose of this study was to understand how people—varying in the extent to
which they engage in media multitasking—attend to substantive issues (e.g., how strong
the argument is) and peripheral information (e.g., how attractive the endorser is) in
advertisements in a media multitasking environment. The results show that the MMI
score was weakly but statistically significantly correlated with free recall for product
category; participants with higher MMI scores were more likely to remember product
categories that were advertised in the magazine. On the other hand, there was no
correlation between MMI and recognition measures (both category-cued recognition and
brand-cued recognition). This may be due to the fact that recognition tests are easier than
recall tests (Cabeza, Kapur, Craik, McIntosh, Houle, and Tulving 1997). In this
experiment, the recognition tasks were to select the correct brand name Marvis from the
multiple choices; whereas in recall tasks participants had to generate the answer without
any retrieval cues. Moreover, participants were provided with more cues as they moved
on to the next cognitive tests and, in fact, they scored better after each cognitive test;
category-cued recall test (M = 0.21, SD = 0.4) contained information that there was a
“toothpaste” ad, category-cued recognition test (M = 0.65, SD = 0.48) was a multiple
choice question with having Marvis among options, and brand-cued recognition test (M =
0.69, SD = 0.29) was simply a yes or no question. This easier nature of recognition tests

56
may have made it difficult to detect any effect of dual tasking differences between
subjects in recognition tasks.
With respect to attitudinal and behavioral responses, the results failed to support
both the ELM-based hypotheses and the ELM with cognitive load-based hypotheses. One
possible explanation can be due to the task difficulty. The level of task difficulty in the
present study may have left participants unable to recognize any difference in the level of
argument strength and endorser attractiveness. Participants scored 2.34, on average, out
of 12 in the reading task and scored 3.15 out of 12 in the video task on average. The
highest scores obtained were 5 for the reading task and 4 for the video task. This suggests
that the task of media multitasking was extremely difficult and may simply have leveled
out any differences among conditions.
While the results failed to support any hypotheses, participants with higher MMI
had better overall and affective attitudes toward the brand when they saw the weak
argument ad. On the other hand, participants with lower MMI had better overall and
affective attitudes when they saw the strong argument ad. These results are somewhat
counterintuitive with what the ELM would predict in that people tend to be easily swayed
by peripheral cues in advertising under cognitive load. Moreover, the results were also
inconsistent with the ELM with cognitive load-based set of hypotheses that neither
HMMs nor LMMs would be able to process information carefully due to a cognitively
demanding media multitasking environment. One possible explanation for the
counterintuitive significant findings in the present study can be simple Type I error. With
respect to significant interaction effects of MMI and ad quality on overall and affective
attitudes in the argument strength conditions, Type I error might have occurred that, in

57
fact, there were no significant interactions. As above, the media multitasking task was
highly difficult and it is questionable whether participants were able to evaluate the
argument quality in the ads. However, if Type I error had not occurred, participants
actually responded differently to the strong and weak argument ads varying by their
media multitasking propensity. In fact, previous studies regarding the influence of
multitasking on message processing suggest that such distraction can compromise
people’s ability to evaluate argument quality, resulting in higher persuasion effects when
argument quality is weak (Chowdhury et al. 2007; Jeong and Hwang 2012). From this
perspective, HMMs—who were more likely to be distracted (Ophir et al. 2009)—may
have failed to evaluate the low quality of arguments in the ad while LMMs—who were
better at task switching (Ophir et al. 2009)—may have successfully recognized the strong
argument ad.
The larger body of advertising research has focused on traditional media
consumption, which regards the consumer as a passive user of one type of media at a
time. Several studies in the field of communication examined the negative impact of
multitasking on cognitive control. Researchers conducting these studies mainly focused
on exploring how background media can have a negative influence on primary tasks such
as doing homework (Beentjes, Koolstra, and van der Voort 1996; Pool, Koolstra, and van
der Voort 2003). However, these studies have not covered the influence of advertising in
a multimedia context. The present study has important implications in that I not only
viewed consumers as active media users but I also explored how they, based on their
media consumption habits, react differently to a competitive media environment and
attend to different cues in advertising. Moreover, previous research on media multitaskers

58
used abstract stimuli (e.g., differentiating blue and red rectangles) to test HMMs and
LMMs’ different processing styles, which is far from any real life experience and lacks
ecological validity. However, in this study, HMMs and LMMs were exposed to more
natural media multitasking situations and how they process advertising differently was
examined. It created more naturalistic media environments generating higher ecological
(and possibly higher external) validity.
This research topic is clearly of interest to advertisers and media planners who
aim to gain consumers’ attention in a media multitasking context. It should also be noted
that using multiple media platforms at once is in the same line with the Integrated
Marketing Communications (IMC), which suggests greater synergistic effects of cross-
media campaigns than the sum of each platform benefit. Discovering the underlying
mechanisms of how consumers react to second screens and perceive advertising through
various platforms may be another academic research topic in the future.
5.2 Limitations
The present study is not without flaws. First of all, it is questionable whether the
MMI, a self-reported media use measure, is accurate and reliable. Participants in this
study had to entirely rely on their memory to report their media usage patterns in
everyday life. This may have generated recall bias either in an overestimating or in an
underestimating manner. In fact, researchers have found that people were more likely to
over-report media use in survey responses, compared to diary methods (Greenberg,
Eastin, Skalski, Cooper, Levy, and Lachlan 2007). Moreover, the MMI scale is extremely
long (i.e., 168 questions in total), so participants may not have been able to pay full

59
attention to read through the questionnaire to the end. This is even more problematic
when considering HMMs tend to have shorter attention spans; HMMs may be more
likely to satisfice when completing the measure. Therefore, future research may involve
developing a new media-use measure that better estimates peoples’ multiple media use in
real life by, say, combining the survey and diary methods (Greenberg et al. 2007).
Secondly, although participants were randomly assigned to experimental
conditions, secondary analyses revealed a significant two-way interaction between ad
feature and ad quality on MMI (β = -0.87, t = -2.77, p < 0.01). Simple effects analyses
revealed no significant difference in participants’ MMI scores between the strong (M = 0,
SD = 1.16) and weak argument conditions (M = 0.08, SD = 1.19), t(79) = 0.3, p > 0.76.
However, the mean difference of MMI scores between the attractive (M = -0.38, SD =
0.68) and unattractive endorser conditions (M = 0.41, SD = 0.78) was significant, t(75) =
-4.74, p < 0.001. This accidental confounding of the endorser attractiveness manipulation
with MMI makes it difficult to interpret any main effect or interaction involving
attractiveness. HMMs were more likely to see the attractive endorser, and LMMs were
more likely to see the unattractive endorser. As such, any effect of endorser attractiveness
that obtained in the analyses could also have been due to participants’ MMI status.
Thirdly, the effectiveness of advertising can differ by the level of distraction.
Although in this study I asked participants to pay attention to both tasks in order to create
a media multitasking environment, in follow-up studies I may focus on manipulating the
level of distraction by designating primary and secondary tasks (i.e., reading a magazine
as a primary task while playing a video for a background noise). This is because
allocating varying amounts of attention to each medium may result in different responses

60
to advertising information. For instance, participants who are asked to pay more attention
to the video content may be less likely to be influenced by the ads in the magazine. In this
way, manipulating the level of distraction and setting the priority of attended media can
also be another research topic.
Lastly, although the pretesting for all four experimental materials was successful,
it was not conducted under high cognitive load. In the actual study the ads were exposed
to participants in a demanding media multitasking environment. The ads may have been
processed differently under this cognitively demanding situation. Therefore, follow-up
studies should include manipulation checks for the stimuli and see how people respond to
various ad conditions during experiments. In addition, it is also worth investigating
whether people are more responsive to specific ad features such as familiarity of endorser
(i.e., celebrity source attractiveness as peripheral cues; Kahle and Homer 1985) when
they can only make minimal cognitive effort to process the ads. Discovering which type
of ad feature is more or less effective can be another future topic.

61
REFERENCES
Areni, Charles S., and Lutz, Richard J. (1988), “The Role of Argument Quality in the
Elaboration Likelihood Model,” Advances in consumer research, 15 (1).
Armstrong, G. Blake, and Chung, Leeva (2000), “Background Television and Reading
Memory in Context Assessing TV Interference and Facilitative Context Effects on
Encoding Versus Retrieval Processes,” Communication Research, 27 (3), 327-
352.
Bardhi, Fleura, Rohm, Andrew J., and Sultan, Fareena (2010), “Tuning in and tuning out:
media multitasking among young consumers,” Journal of Consumer Behavior, 9
(4), 316-332.
Baron, Robert S., Baron, Penny H., and Miller, Norman (1973), “The relation between
distraction and persuasion,” Psychological Bulletin, 80 (4), 310-323.
Beentjes, Johannes W., Koolstra, Cees M., and van der Voort, Tom H. A. (1996),
“Combining background media with doing homework: Incidence of background
media use and perceived effects,” Communication Education, 45 (1), 59–72.
Biehal, Gabriel, Stephens, Debra, and Curlo, Eleonora (1992), “Attitude toward the Ad
and Brand Choice,” Journal of Advertising, 21 (3), 19-36.
Bloom, Benjamin S. (1956), Taxonomy of educational objectives: The classification of
education goals by a committee of college and university examiners, David
McKay.
Cabeza, Roberto, Kapur, Shitij, Craik, Fergus I.M., McIntosh, Anthony R., Houle,

62
Sylvain, and Tulving, Endel (1997), “Functional neuroanatomy of recall and
recognition: A PET study of episodic memory,” Journal of Cognitive
Neuroscience, 9 (2), 254-265.
Cain, Matthew S., and Mitroff, Stephen R. (2010), “Distractor filtering in media
Multitaskers,” Journal of Vision, 10 (7), 260-260.
Chowdhury, Rafi M., Finn, Adam, and Olsen, G. Douglas (2007), “Investigating the
simultaneous presentation of advertising and television programming,” Journal of
Advertising, 36 (3), 85-96.
Cohen, Jacob. (1983), “The cost of dichotomization,” Applied Psychological
Measurement, 7, 249–253.
Collins, Rebecca L. (2008), “Media multitasking: Issues posed in measuring the effects
of television sexual content exposure,” Communication methods and measures, 2
(1-2), 65-79.
Crites, Stephen L., Fabrigar, Leandre R., and Petty, Richard E. (1994), “Measuring the
affective and cognitive properties of attitudes: Conceptual and methodological
issues,” Personality and Social Psychology Bulletin, 20 (6), 619-634.
Duff, B. R., Yoon, G., Wang, Z., and Anghelcev, G. (2014), “Doing it all: An exploratory
study of predictors of media multitasking,” Journal of Interactive Advertising,
(just-accepted).
Festinger, Leon, and Maccoby, Nathan (1964), “On resistance to persuasive
communications,” The Journal of Abnormal and Social Psychology, 68 (4), 359.
Fitzsimons, Gavan J. (2008), “Editorial: Death to dichotomizing,” Journal of Consumer
Research, 35 (1), 5-8.

63
Foehr, Ulla G. (2006), “Media Multitasking among American Youth: Prevalence,
Predictors and Pairings,” Henry J. Kaiser Family Foundation.
Gladwell, Malcolm (2002, July), “The Talent Myth,” The New Yorker. Retrieved from
http://www.newyorker.com/archive/.
Greenberg, Bradley S., Eastin, Matthew S., Skalski, Paul, Cooper, Len, Levy, M., and
Lachlan, Ken (2005), “Comparing survey and diary measures of internet and
traditional media use,” Communication Reports, 18 (1-2), 1-8.
Jeong, Se H., and Fishbein, Martin (2007), “Predictors of multitasking with media: Media
factors and audience factors,” Media Psychology, 10 (3), 364-384.
———, Se H., and Hwang, Yoori (2012), “Does Multitasking Increase or Decrease
Persuasion? Effects of Multitasking on Comprehension and Counterarguing,”
Journal of Communication, 62 (4), 571-587.
———, Se H., Hwang, Yoori, and Fishbein, Martin (2010), “Effects of exposure to
sexual content in the media on adolescent sexual behaviors: The moderating role
of multitasking with media,” Media Psychology, 13 (3), 222-242.
Kahle, Lynn R., and Homer, Pamela M. (1985), “Physical attractiveness of the celebrity
endorser: A social adaptation perspective,” Journal of consumer research, 11 (4),
954-961.
Kanfer, Ruth, and Ackerman, Phillip L. (1989), “Motivational and cognitive abilities: An
integrative/aptitude treatment interaction approach to skill acquisition,” Journal of
Applied Psychology, 74 (4), 657-690.
Koolstra, Cees M., Ritterfeld, Ute, and Vorderer, Peter (2009), “Media choice despite
Multitasking,” In Media choice: A theoretical and empirical overview, 234-246.

64
Lang, Annie (2000), “The limited capacity model of mediated message processing,”
Journal of Communication, 50 (1), 46-70.
Lin, Lin (2009), “Breadth-biased versus focused cognitive control in media multitasking
behaviors,” Proceedings of the National Academy of Sciences, 106 (37), 15521-
15522.
Lin, Lin, Tip Robertson, and Jennifer Lee (2009), “Reading performances between
novices and experts in different media multitasking environments,” Computers in
the Schools, 26 (3), 169-186.
Lui, Kelvin F.H., and Wong, Alan C.-N. (2011), “Does media multitasking always
hurt?,” i-Perception, 2 (4), 325-325.
National Center for Biotechnology Information (2014), Attention Span Statistics: U.S.
National Library of Medicine, The Associated Press. Retrieved March 10, 2014,
from http://www.statisticbrain.com/attention-span-statistics/.
Nielsen, Jakob (1994), Usability Engineering, Elsevier.
Nielsen Cross-Platform Report (2012), “The Cross-Platform Report: A New Connected
Community,” retrieved November 2, 2013, from
http://www.nielsen.com/us/en/newswire/2012/the-cross-platform-report-a-new-
connected-community.html.
Ophir, Eyal, Nass, Clifford, and Wagner, Anthony D. (2009), “Cognitive control in
media Multitaskers,” Proceedings of the National Academy of Sciences, 106 (37),
15583-15587.
Papper, Robert A., Holmes, Michael E., and Mark N. Popovich (2004), “Middletown

65
media studies: Media multitasking and how much people really use the media,”
International Digital Media and Arts Association Journal, 1, 9-50.
Perdue, Barbar C., and Summers, John O. (1986), “Checking the success of
manipulations in marketing experiments,” Journal of Marketing Research (JMR),
23 (4).
Petty, Richard E., Wells, Gary L., and Brock, Timothy C. (1976), “Distraction can
enhance or reduce yielding to propaganda: Thought disruption versus effort
justification,” Journal of Personality and Social Psychology, 34 (5), 874-884.
———, Cacioppo, J. T. (1986). The elaboration likelihood model of persuasion. In
Communication and Persuasion. Springer New York, 1-24.
———, Richard E., Cacioppo, John T., and Schumann, David (1983), “Central and
peripheral routes to advertising effectiveness: The moderating role of
involvement,” Journal of consumer research, 10 (2), 135-146.
Pilotta, Joseph J., Schultz, Don E., Drenik, Gary, and Rist, Philip (2004), “Simultaneous
media usage: A critical consumer orientation to media planning,” Journal of
Consumer Behaviour, 3 (3), 285-292.
Pool, Marina M., Koolstra, Cees M., and van der Voort, Tom H. A. (2003), “The impact
of background radio and television on high school students’ homework
performance,” Journal of Communication, 53 (1), 74–87.
Rideout, Victoria J., Foehr, Ulla G., and Roberts, Donald F. (2010), “Generation M:
Media in the Lives of 8-to 18-Year-Olds,” Henry J. Kaiser Family Foundation.
Shavitt, Sharon, Swan, Suzanne, Lowrey, Tina M., and Wänke, Michaela (1994), “The

66
interaction of endorser attractiveness and involvement in persuasion depends on
the goal that guides message processing,” Journal of Consumer Psychology, 3 (2),
137-162.
Srivastava, Jatin (2013), “Media multitasking performance: Role of message relevance
and formatting cues in online environments,” Computers in Human Behavior, 29
(3), 888-895.
Voorveld, Hilde A.M. (2011), “Media multitasking and the effectiveness of combining
online and radio advertising,” Computers in Human Behavior, 27 (6), 2200-2206.

67
APPENDIX A: MEDIA MULTITASKING INDEX

68

69

70

71

72

73

74

75

76

77

78

79
APPENDIX B: ONLINE MAGAZINE

80
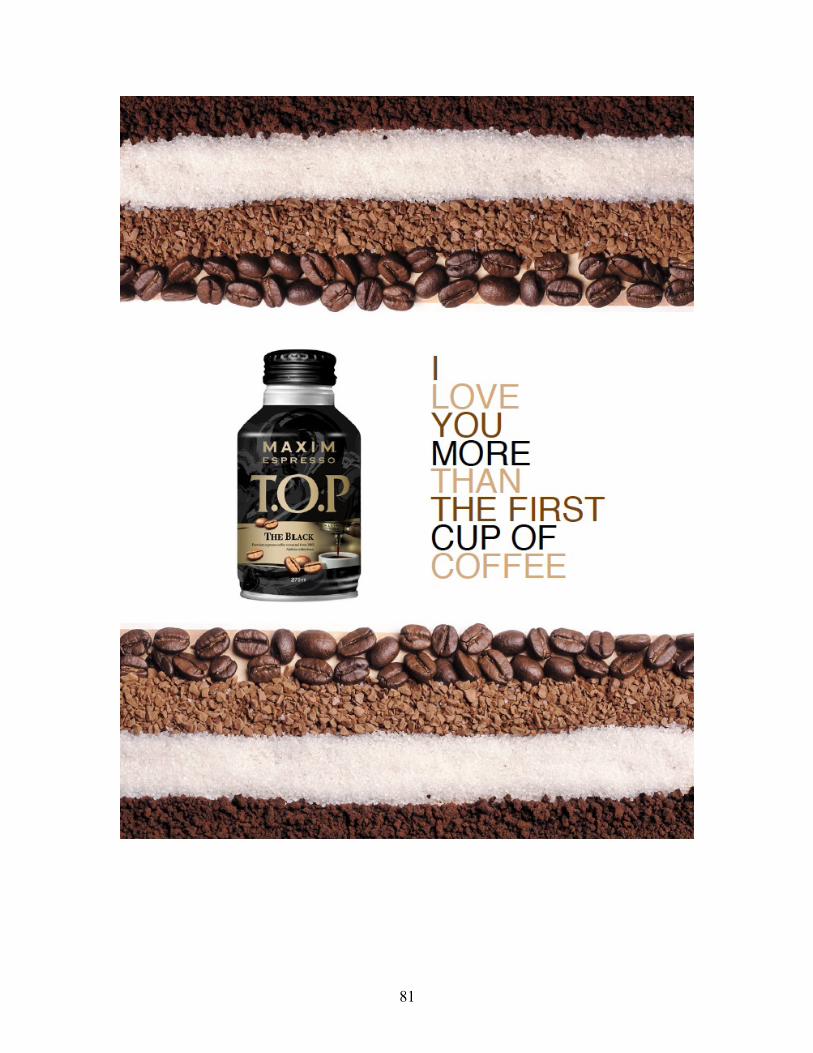
81

82

83

84
Note: One of experimental stimuli was embedded in 8th page of the magazine.
MARVIS, MARVELOUS TOOTHPASTE
Whitening formulas from England!
Marvis gently cleans and polishes with only a little gritty residue.
It has a peppermint flavor that keeps your breath fresh for hours.
This stylish tube comes in 4 different colors in 2.8 oz.
Marvis offers you just as pleasurable of a taste sensation as other brand.
We are celebrating our 5th anniversary,
buy one and get one 5 percent off!
! Note that Marvis contains some ingredients approved by the FDA.
MARVIS, MARVELOUS TOOTHPASTE
Whitening formulas from Italy!
Marvis gently cleans and polishes without any gritty residue.
It has a peppermint flavor that keeps your breath fresh all day long.
This stylish tube comes in 8 different colors in 4 oz.
Marvis offers you a more pleasurable taste sensation than any other brand.
We are celebrating our 50th anniversary,
buy one and get one free!
! Note that Marvis contains safe ingredients approved by the FDA.

85

86

87

88
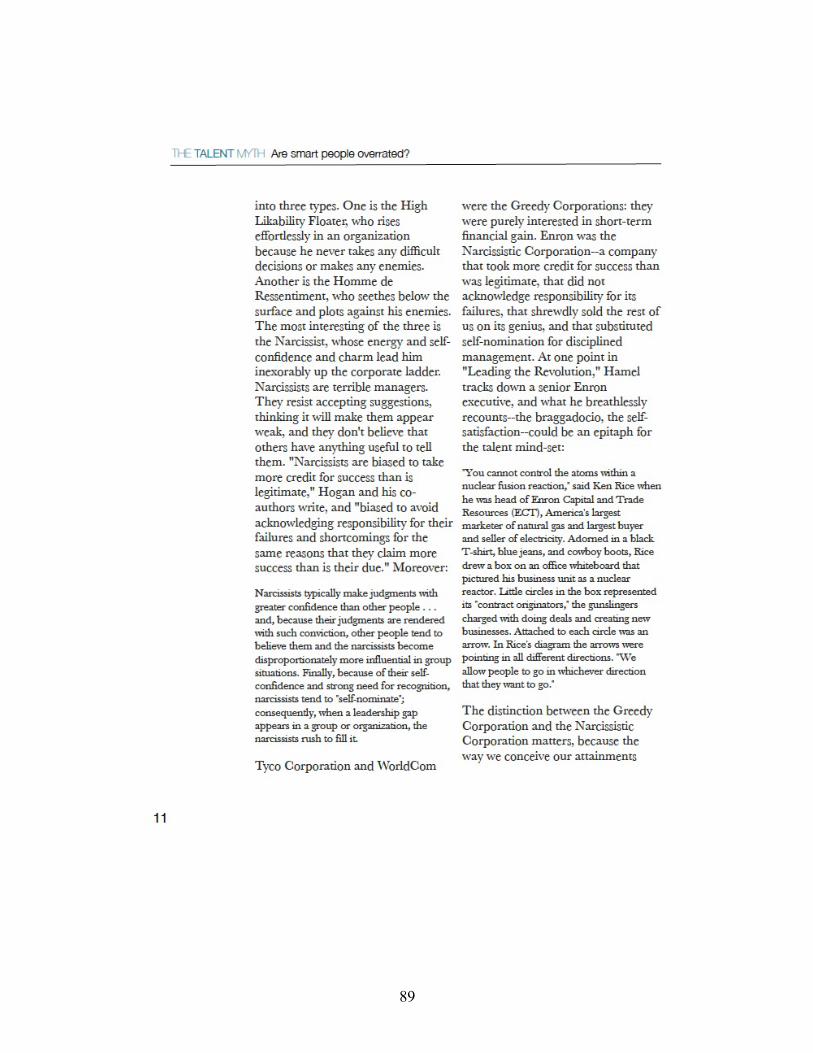
89

90

91
APPENDIX C: EXPERIMENTAL STIMULI FOR ENDORSER ATTRACTIVENESS
NOTE: Left image shows the attractive endorser ad for Marvis toothpaste. Right image shows the unattractive endorser ad for Marvis toothpaste. Pictures of endorsers have been blacked out to preserve propriety.
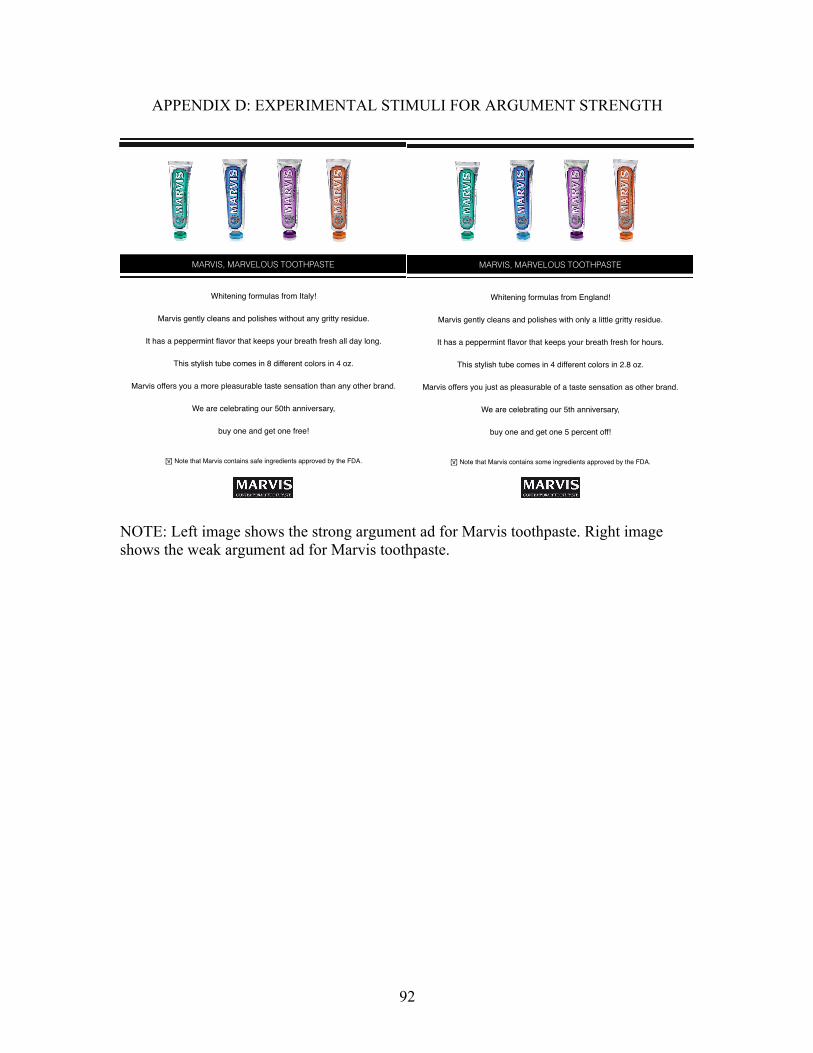
92
APPENDIX D: EXPERIMENTAL STIMULI FOR ARGUMENT STRENGTH
NOTE: Left image shows the strong argument ad for Marvis toothpaste. Right image shows the weak argument ad for Marvis toothpaste.
MARVIS, MARVELOUS TOOTHPASTE
Whitening formulas from Italy!
Marvis gently cleans and polishes without any gritty residue.
It has a peppermint flavor that keeps your breath fresh all day long.
This stylish tube comes in 8 different colors in 4 oz.
Marvis offers you a more pleasurable taste sensation than any other brand.
We are celebrating our 50th anniversary,
buy one and get one free!
! Note that Marvis contains safe ingredients approved by the FDA.
MARVIS, MARVELOUS TOOTHPASTE
Whitening formulas from England!
Marvis gently cleans and polishes with only a little gritty residue.
It has a peppermint flavor that keeps your breath fresh for hours.
This stylish tube comes in 4 different colors in 2.8 oz.
Marvis offers you just as pleasurable of a taste sensation as other brand.
We are celebrating our 5th anniversary,
buy one and get one 5 percent off!
! Note that Marvis contains some ingredients approved by the FDA.

93
APPENDIX E: FILLER ADS
NOTE: Left image shows the first filler ad for Felix, a European brand of cat food. Right image shows the third filler ad for T.O.P, a Korean brand of coffee beverage. The ads for both brands were created for the experiment.

94
APPENDIX F: COMPREHENSION QUESTIONS Reading: The Talent Myth by Malcolm Gladwell * answers are underlined Basic knowledge level 1. Who consulted Enron?
1) Boston Consulting Group 2) McKinsey & Company 3) Bain & Company
2. What are things like knowing how to manage yourself and others, and how to navigate complicated social situations?
1) Helicopter Knowledge 2) Pilot Knowledge 3) Tacit Knowledge
Intermediate level 3. Which of the following best describes what Enron did based on “the talent mind-set?”
1) It hired and rewarded the top performers. 2) It promoted talented employees based on their potential. 3) It fired the employees considered irresponsible.
4. Which of the following best describes the Narcissist type of manager?
1) They rise effortlessly in an organization by never taking any risk or making any enemies.
2) They avoid acknowledging responsibility for their failures and plot against the enemies.
3) They resist accepting suggestions and are biased to take more credit for success. In-depth analysis 5. Why did Enron fail in spite of its talent mind-set?
1) Because they failed to access the employees’ abilities to work with people. 2) Because they failed to conduct candid and probing individual interviews. 3) Because they failed to objectively evaluate the talent of employees.
6. Given what you read, which of the following statements is the most probable? 1) Students who hold a malleable view of their intelligence are more likely to
believe in their innate talent. 2) Students who hold a fixed view of their intelligence are more reluctant to take a
course to improve their skills. 3) Students who are praised for their effort are more likely to lie about how they
score on the test.

95
Video: Good Luck Charlie It’s Christmas! by Disney Basic knowledge level 1. What did PJ buy?
1) Christmas swimsuits 2) Playstation 2 3) Santa suit
2. What did dad buy?
1) Camera 2) Stroller 3) Lawn mower
Intermediate level 3. What seems to be the most important Christmas tradition to mom?
1) Tree shaped pancakes on Christmas morning 2) Star on the tree 3) Dad’s overeating
4. Which of the following is true about Gabe?
1) The Christmas present for Gabe is Galaxy of Death One. 2) Gabe will succeed in bringing the game system to grandmother’s house. 3) Gabe already figured out where mom hid the presents.
In-depth analysis 5. Why are mom and dad so on edge?
1) Because they have to take care of four children during the Christmas trip. 2) Because they have to spend time with grandmother who doesn’t like dad. 3) Because it’s the first time spending Christmas at the grandparents’ new place in
Palm Springs. 6. Why doesn’t mom permit her daughter to go to Florida with her friend during the spring break?
1) Because her daughter is too young. 2) Because they have to visit their grandmother. 3) Because her daughter overlooks the importance of having a Christmas tradition.

96
APPENDIX G: QUESTIONNAIRE FOR PARTICIPANTS OF THE SURVEY
Cognitive Measure Free Recall Please try to list all of the product categories that were advertised in the magazine. Product Category-cued Recall Please try to type in the toothpaste brand that was advertised in the magazine. Product Category-cued Recognition Please mark the toothpaste brand that was advertised in the magazine.
1) Marvis 2) Botot 3) Solidox
Brand-cued Recognition An ad for Marvis was included in the advertisements I saw in the magazine.
1) Yes 2) No 3) Don’t know
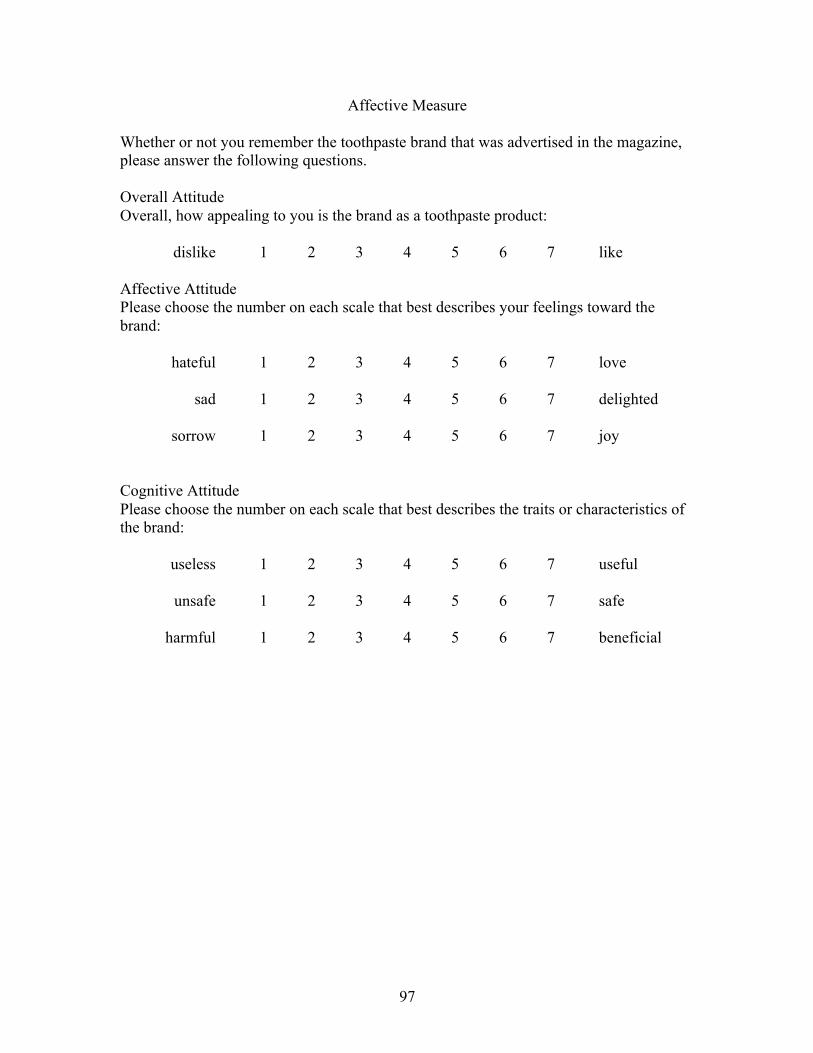
97
Affective Measure Whether or not you remember the toothpaste brand that was advertised in the magazine, please answer the following questions. Overall Attitude Overall, how appealing to you is the brand as a toothpaste product: dislike 1 2 3 4 5 6 7 like Affective Attitude Please choose the number on each scale that best describes your feelings toward the brand: hateful 1 2 3 4 5 6 7 love sad 1 2 3 4 5 6 7 delighted sorrow 1 2 3 4 5 6 7 joy
Cognitive Attitude Please choose the number on each scale that best describes the traits or characteristics of the brand: useless 1 2 3 4 5 6 7 useful unsafe 1 2 3 4 5 6 7 safe harmful 1 2 3 4 5 6 7 beneficial

98
Behavioral Measure
Purchase Intention If the advertised product were available and affordable, my likelihood of buying it is: very low 1 2 3 4 5 6 7 very high

99
Follow-up Questions Perceived Difficulty How difficult was the task (media multitasking)? very difficult -3 -2 -1 0 1 2 3 very easy
Feeling How did the task (media multitasking) make you feel? very upset -3 -2 -1 0 1 2 3 very pleasant Attention Allocation During the dual-tasking part of the study, how much of your attention did you devote to each task? The three categories should sum to 100% of your attention. Percent of your attention to devoted to reading the magazine Percent of your attention to devoted to watching the video Percent of your attention to devoted to some unrelated to task => Total sum should be 100 Familiarity Have you ever watched the TV show (Good Luck Charlie) used in this study before?
1) Yes 2) No
Have you ever watched the TV episode (It’s Christmas) shown in this study?
1) Yes 2) No
Have you ever read the article (Talent Myth) used in this study before?
1) Yes 2) No
Have you ever seen the toothpaste brand Marvis before?
1) Yes 2) No
Interest How much did you enjoy reading the article? not at all -3 -2 -1 0 1 2 3 a great deal How much did you enjoy watching the TV episode? not at all -3 -2 -1 0 1 2 3 a great deal

100
Demographic Information What is your gender?
1) Female 2) Male
What is your age? ___________years Is English your primary language?
1) Yes 2) No
If no, how long have you been living in the United States? ___________years and___________months