Embed Size (px)
Citation preview
The Effects and Effectiveness of LikelyVoter Models in Pre-Election Surveys
American Association for Public Opinion ResearchHollywood, FL - May 16th 2015
D AVID L . VANNETTE
&J ON A. K ROSNICK
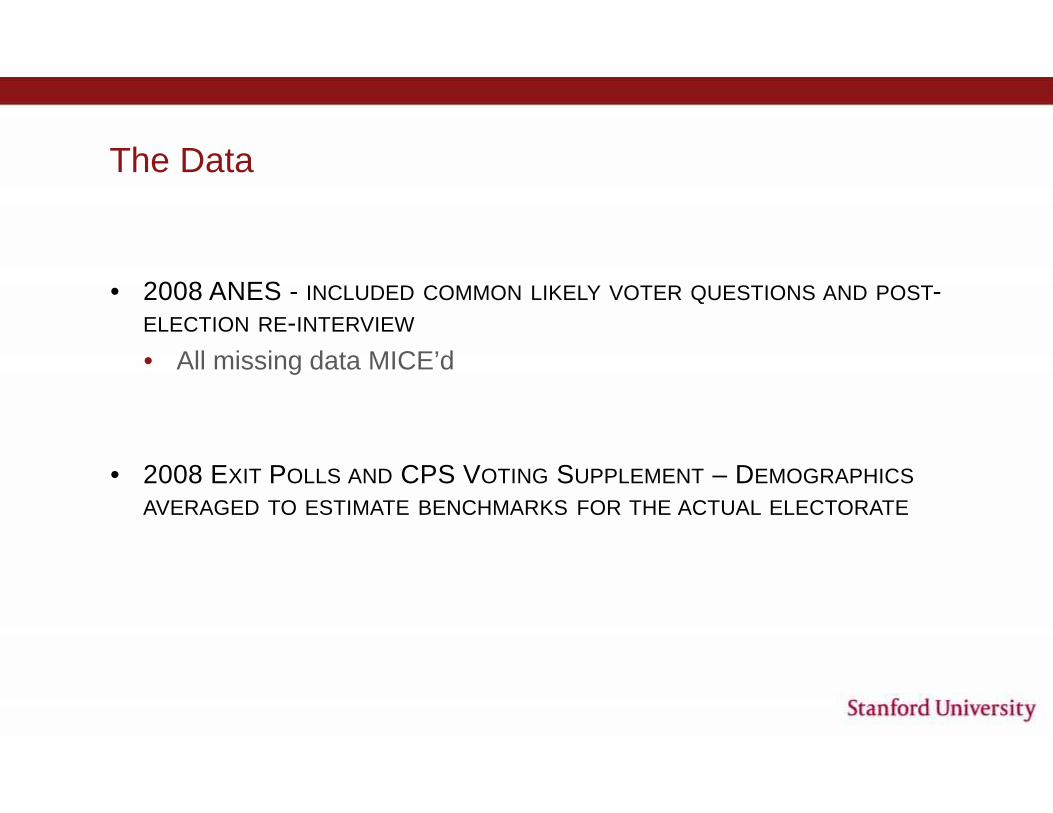
The Data
• 2008 ANES - INCLUDED COMMON LIKELY VOTER QUESTIONS AND POST-ELECTION RE-INTERVIEW
• All missing data MICE’d
• 2008 EXIT POLLS AND CPS VOTING SUPPLEMENT – DEMOGRAPHICSAVERAGED TO ESTIMATE BENCHMARKS FOR THE ACTUAL ELECTORATE
0.00%
10.00%
20.00%
30.00%
40.00%
50.00%
60.00%
70.00%
80.00%
90.00%
100.00%
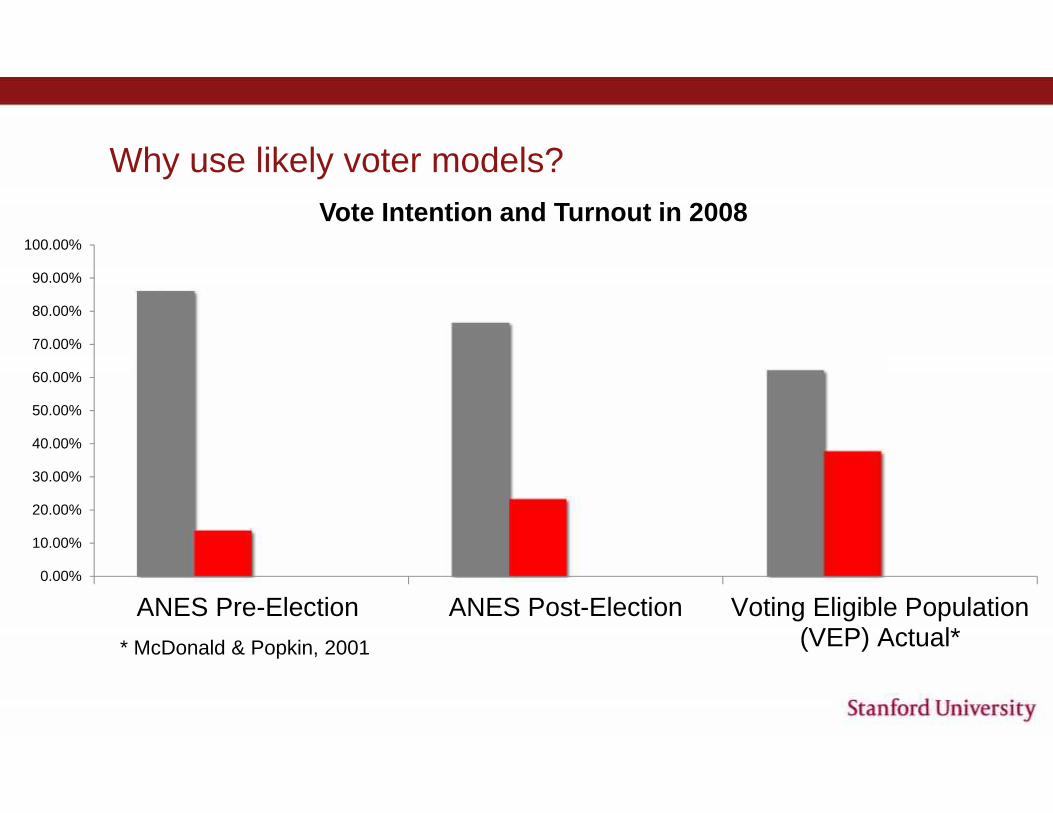
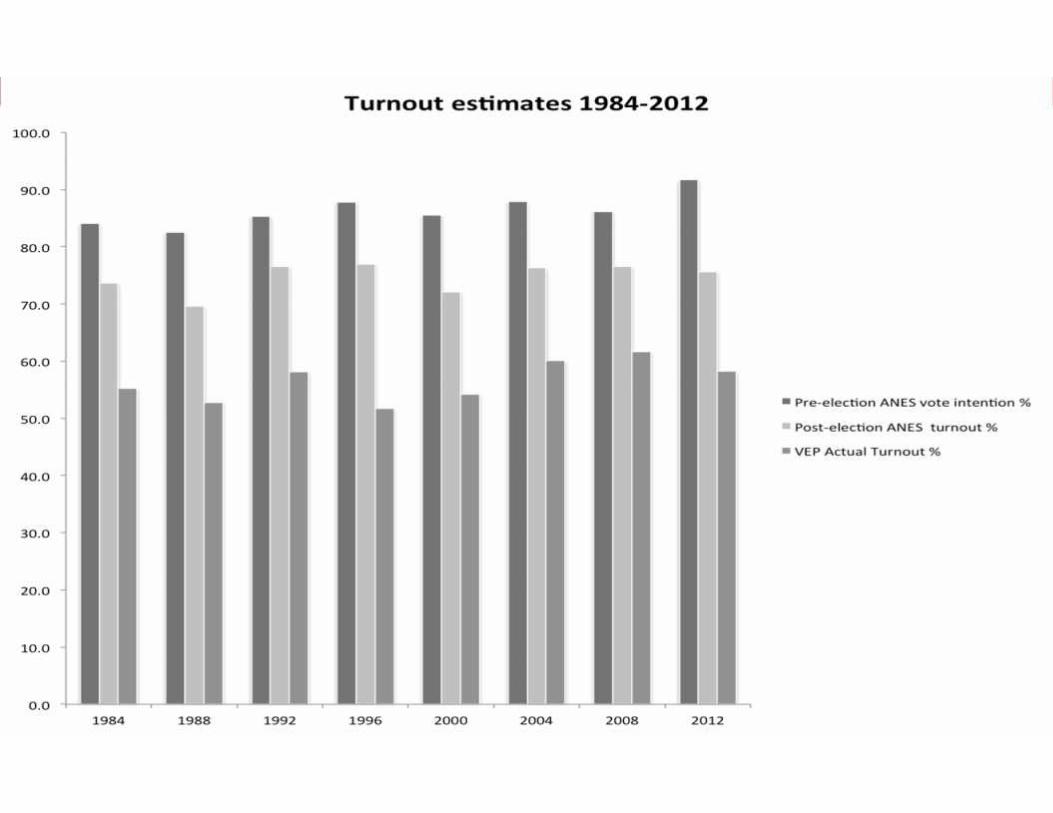
ANES Pre-Election ANES Post-Election Voting Eligible Population(VEP) Actual*
Vote Intention and Turnout in 2008
Why use likely voter models?
* McDonald & Popkin, 2001
Why use likely voter models?
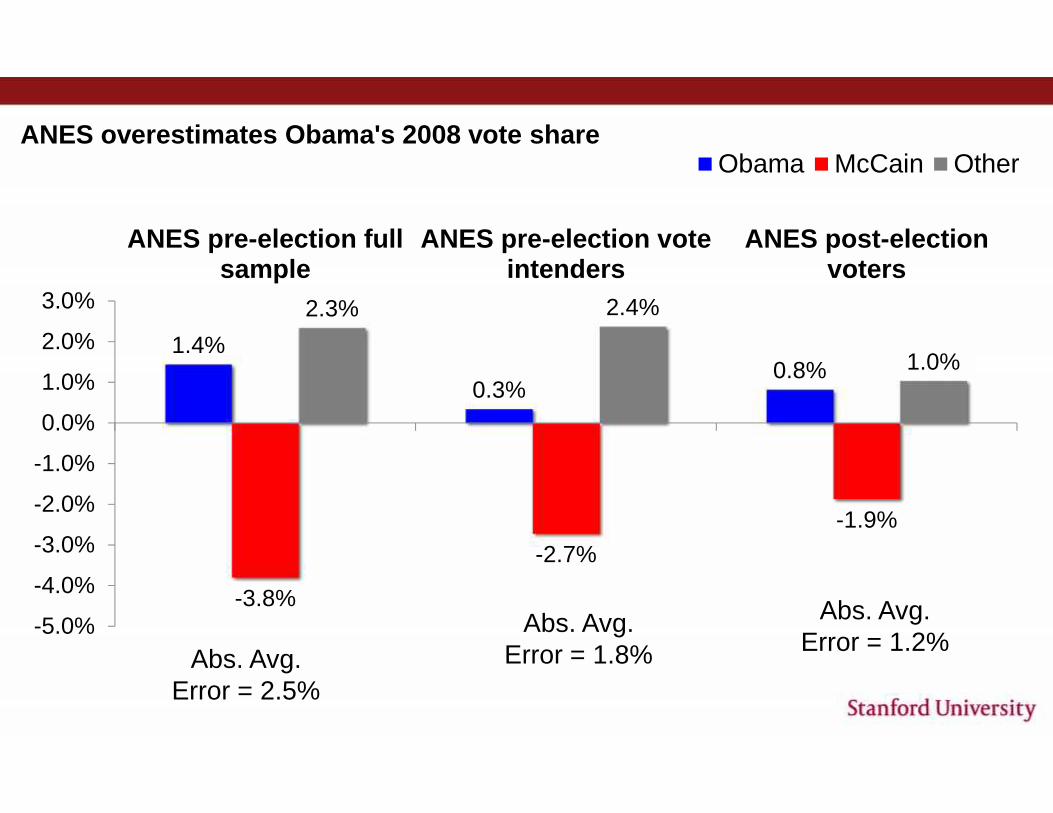
1.4%
0.3%0.8%
-3.8%
-2.7%-1.9%
2.3% 2.4%
1.0%
-5.0%
-4.0%
-3.0%
-2.0%
-1.0%
0.0%
1.0%
2.0%
3.0%
ANES pre-election fullsample
ANES pre-election voteintenders
ANES post-electionvoters
ANES overestimates Obama's 2008 vote shareObama McCain Other
Abs. Avg.Error = 1.2%Abs. Avg.
Error = 2.5%
Abs. Avg.Error = 1.8%
-5
-4
-3
-2
-1
0
1
2
3
4
5
1984 1988 1992 1996 2000 2004 2008 2012
Perc
ent d
iffer
ence
from
FEC
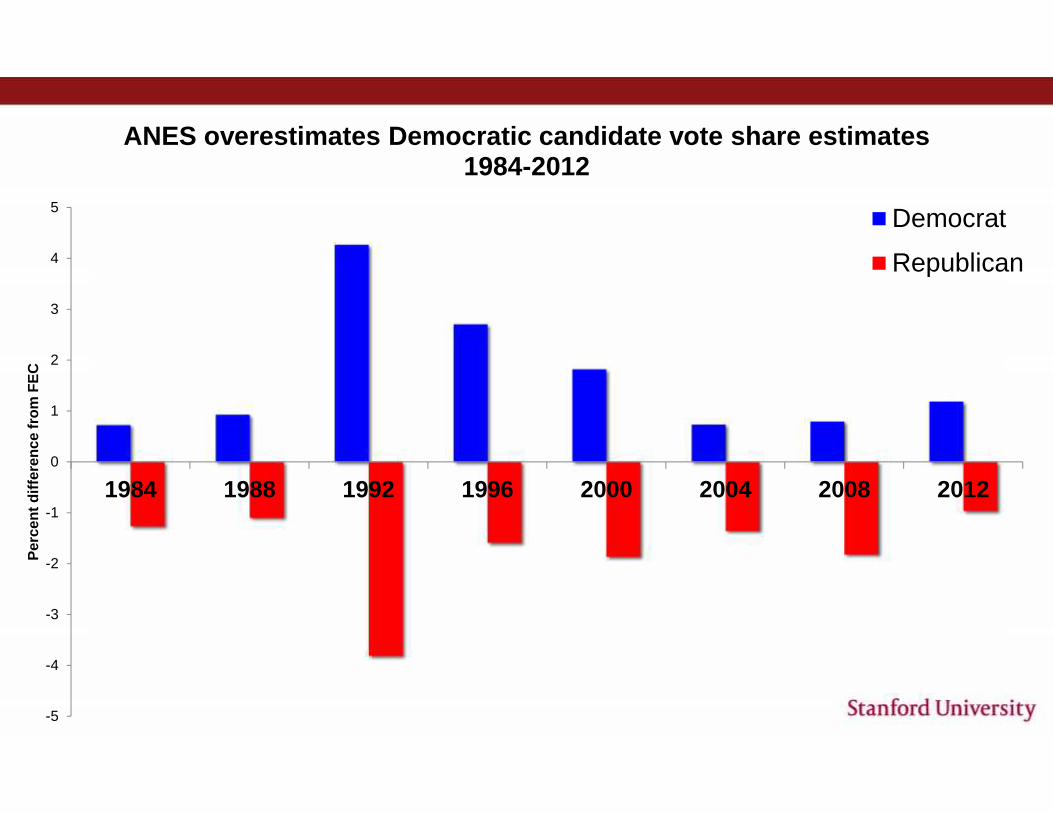
ANES overestimates Democratic candidate vote share estimates1984-2012
Democrat
Republican
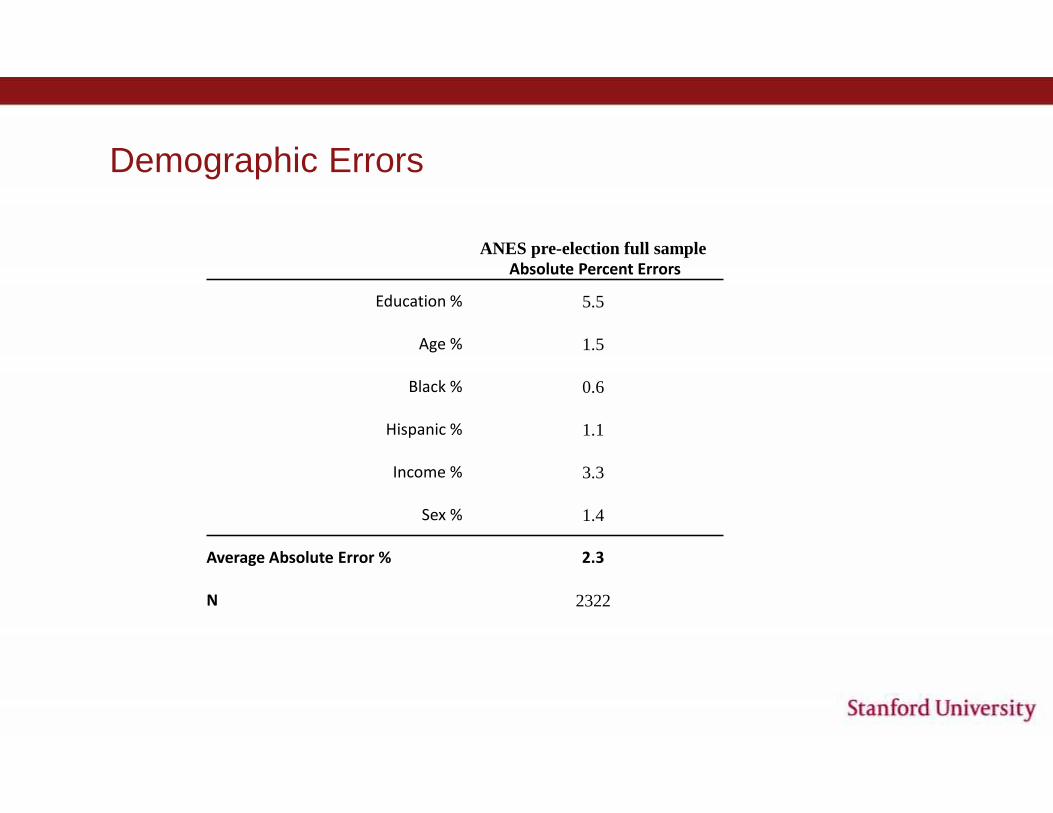
Demographic Errors
ANES pre-election full sampleAbsolute Percent Errors
Education % 5.5
Age % 1.5
Black % 0.6
Hispanic % 1.1
Income % 3.3
Sex % 1.4
Average Absolute Error % 2.3
N 2322
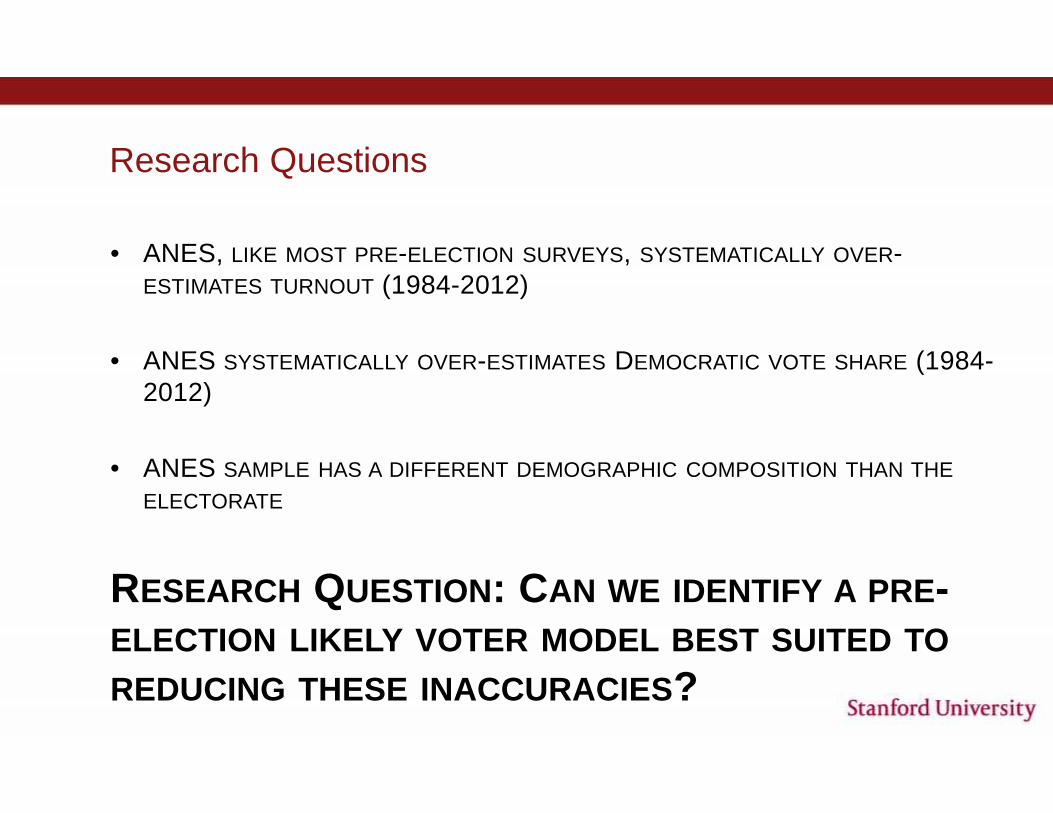
Research Questions
• ANES, LIKE MOST PRE-ELECTION SURVEYS, SYSTEMATICALLY OVER-ESTIMATES TURNOUT (1984-2012)
• ANES SYSTEMATICALLY OVER-ESTIMATES DEMOCRATIC VOTE SHARE (1984-2012)
• ANES SAMPLE HAS A DIFFERENT DEMOGRAPHIC COMPOSITION THAN THEELECTORATE
RESEARCH QUESTION: CAN WE IDENTIFY A PRE-ELECTION LIKELY VOTER MODEL BEST SUITED TOREDUCING THESE INACCURACIES?
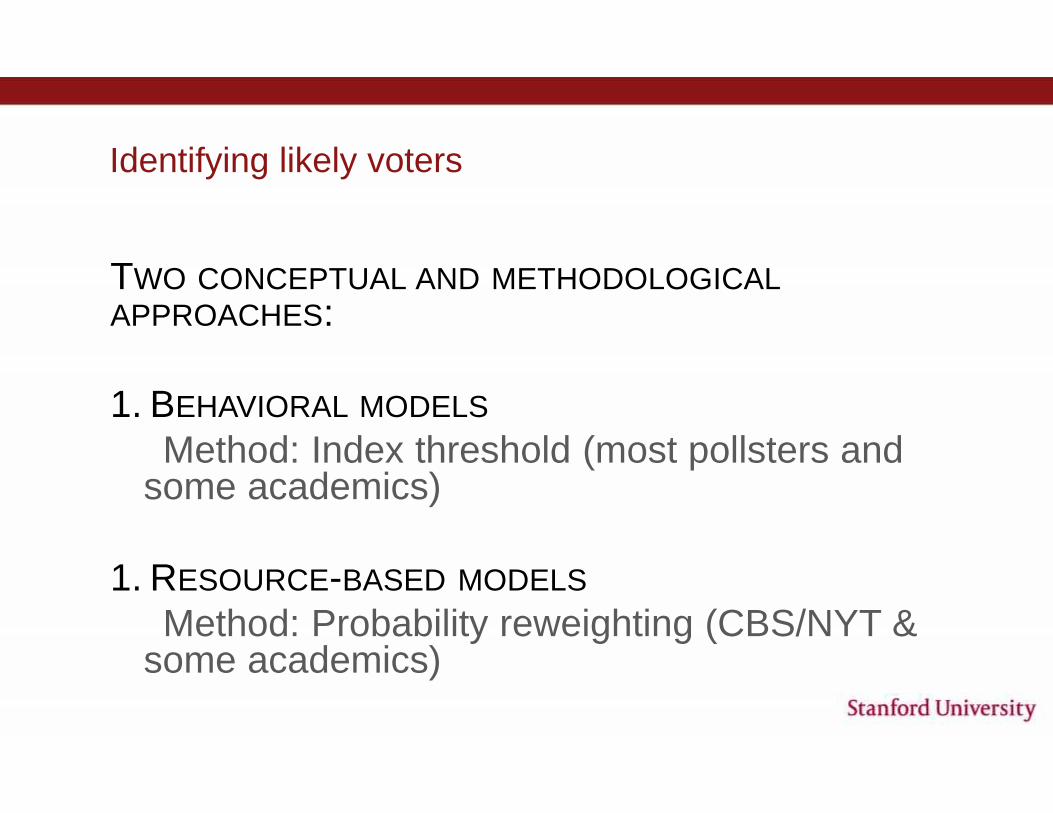
Identifying likely voters
TWO CONCEPTUAL AND METHODOLOGICALAPPROACHES:
1. BEHAVIORAL MODELSMethod: Index threshold (most pollsters and
some academics)
1. RESOURCE-BASED MODELSMethod: Probability reweighting (CBS/NYT &
some academics)
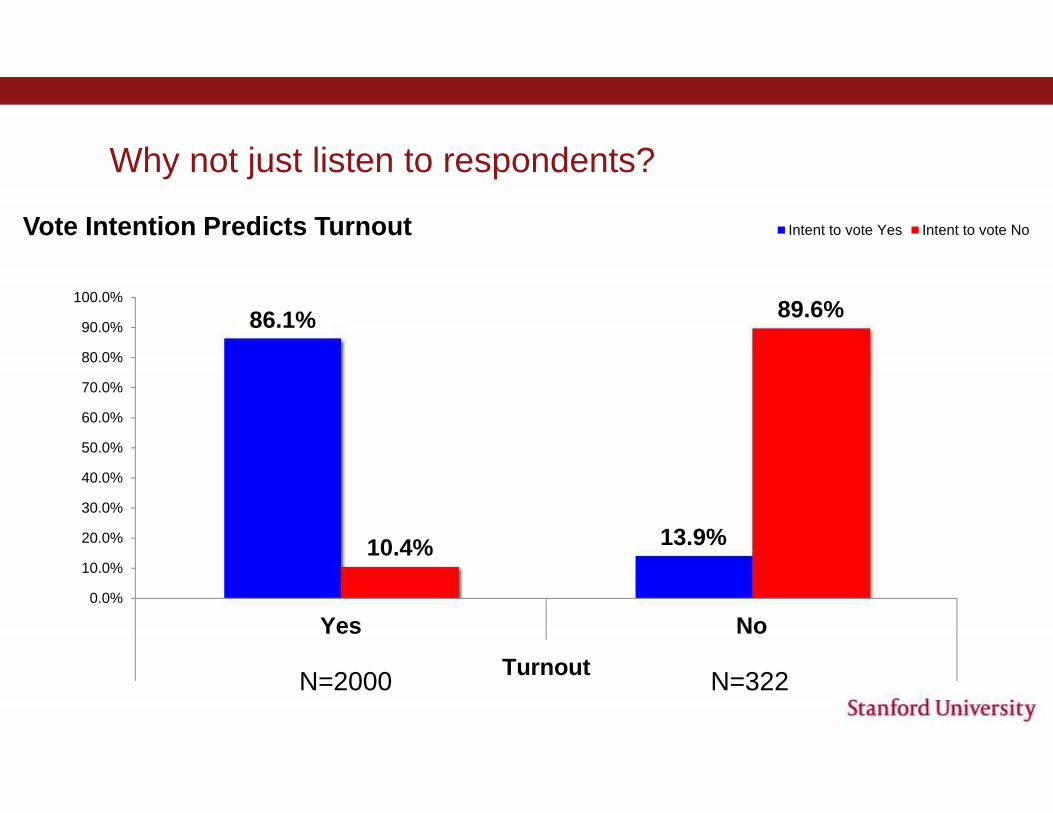
Why not just listen to respondents?
86.1%
13.9%10.4%
89.6%
0.0%
10.0%
20.0%
30.0%
40.0%
50.0%
60.0%
70.0%
80.0%
90.0%
100.0%
Yes No
Turnout
Vote Intention Predicts Turnout Intent to vote Yes Intent to vote No
N=2000 N=322
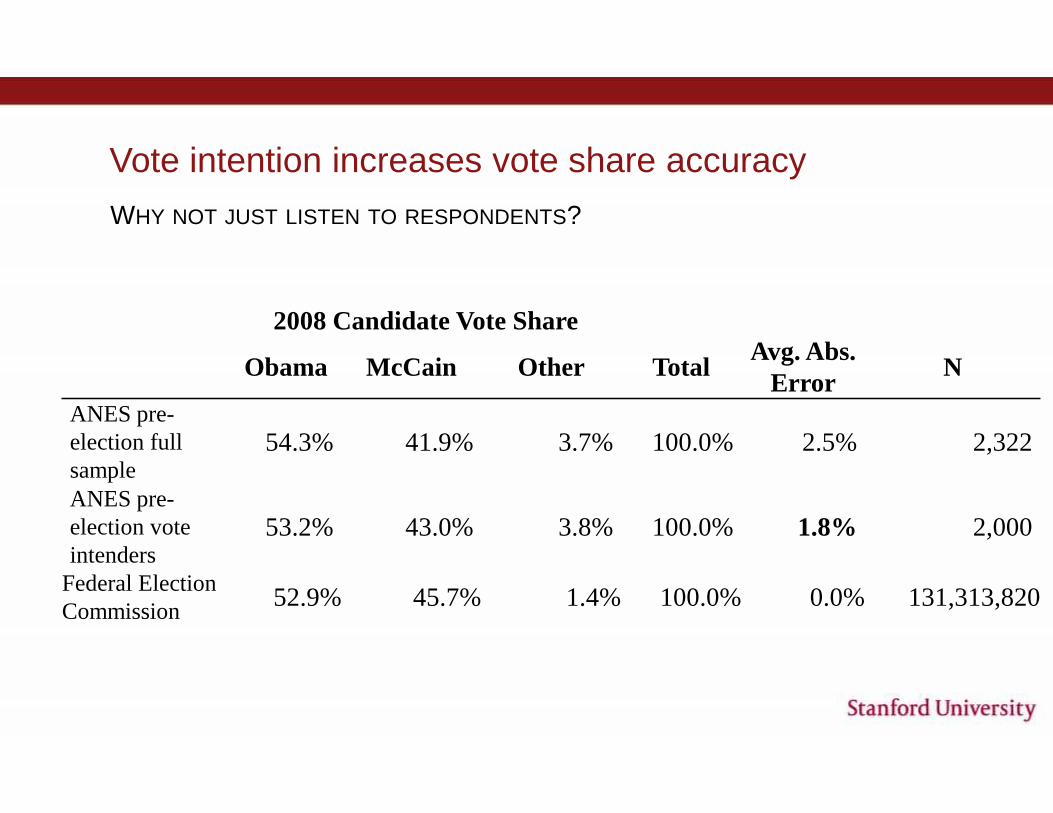
Vote intention increases vote share accuracyWHY NOT JUST LISTEN TO RESPONDENTS?
2008 Candidate Vote Share
Obama McCain Other TotalAvg. Abs.
ErrorN
ANES pre-election fullsample
54.3% 41.9% 3.7% 100.0% 2.5% 2,322
ANES pre-election voteintenders
53.2% 43.0% 3.8% 100.0% 1.8% 2,000
Federal ElectionCommission 52.9% 45.7% 1.4% 100.0% 0.0% 131,313,820
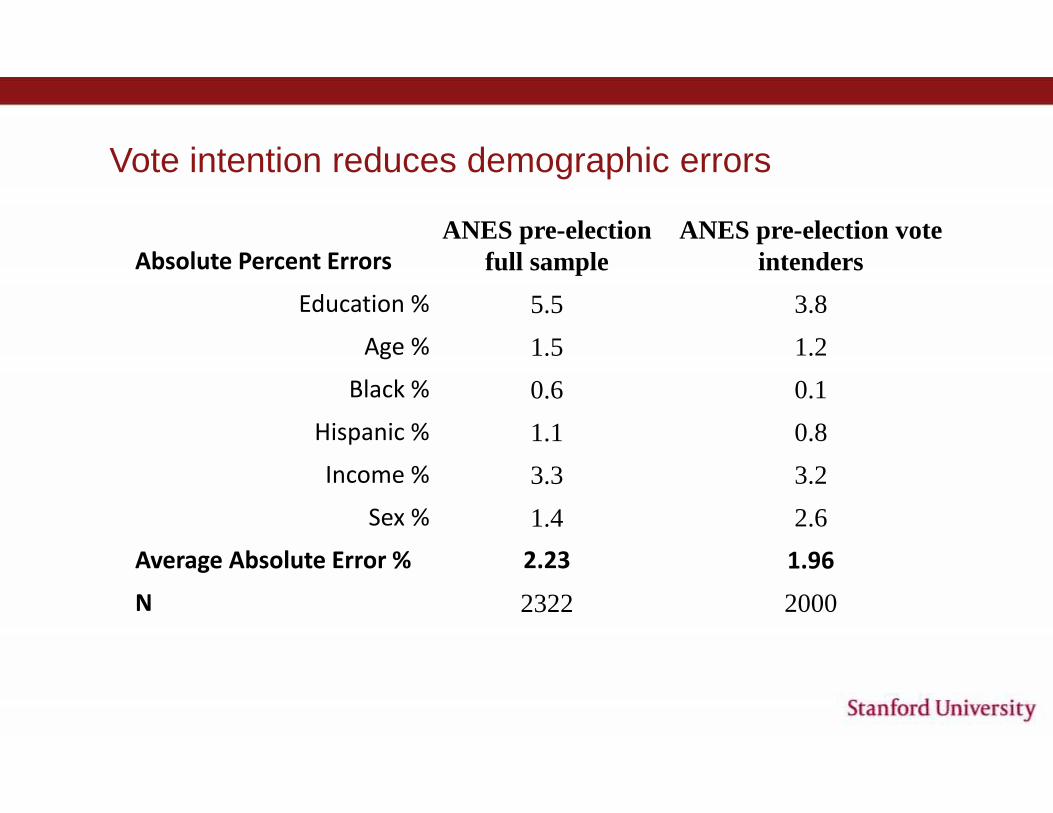
Vote intention reduces demographic errors
Absolute Percent ErrorsANES pre-election
full sampleANES pre-election vote
intenders
Education % 5.5 3.8
Age % 1.5 1.2
Black % 0.6 0.1
Hispanic % 1.1 0.8
Income % 3.3 3.2
Sex % 1.4 2.6
Average Absolute Error % 2.23 1.96
N 2322 2000
But maybe we can do better
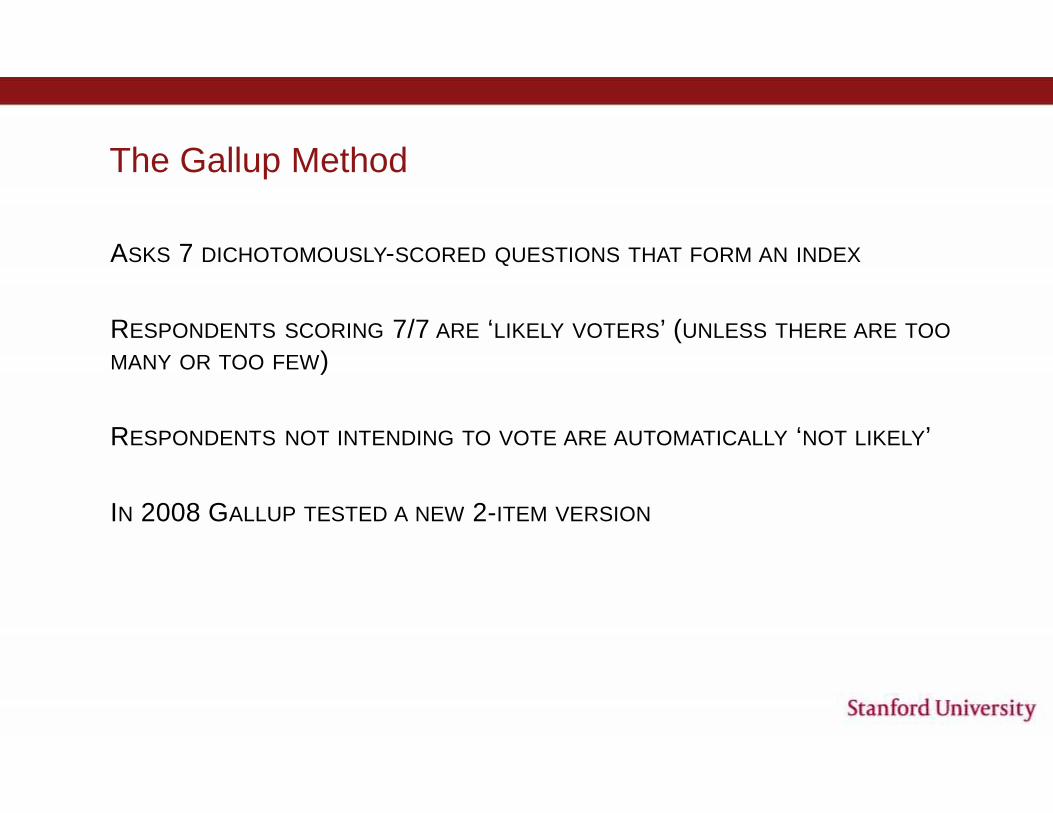
The Gallup Method
ASKS 7 DICHOTOMOUSLY-SCORED QUESTIONS THAT FORM AN INDEX
RESPONDENTS SCORING 7/7 ARE ‘LIKELY VOTERS’ (UNLESS THERE ARE TOOMANY OR TOO FEW)
RESPONDENTS NOT INTENDING TO VOTE ARE AUTOMATICALLY ‘NOT LIKELY’
IN 2008 GALLUP TESTED A NEW 2-ITEM VERSION
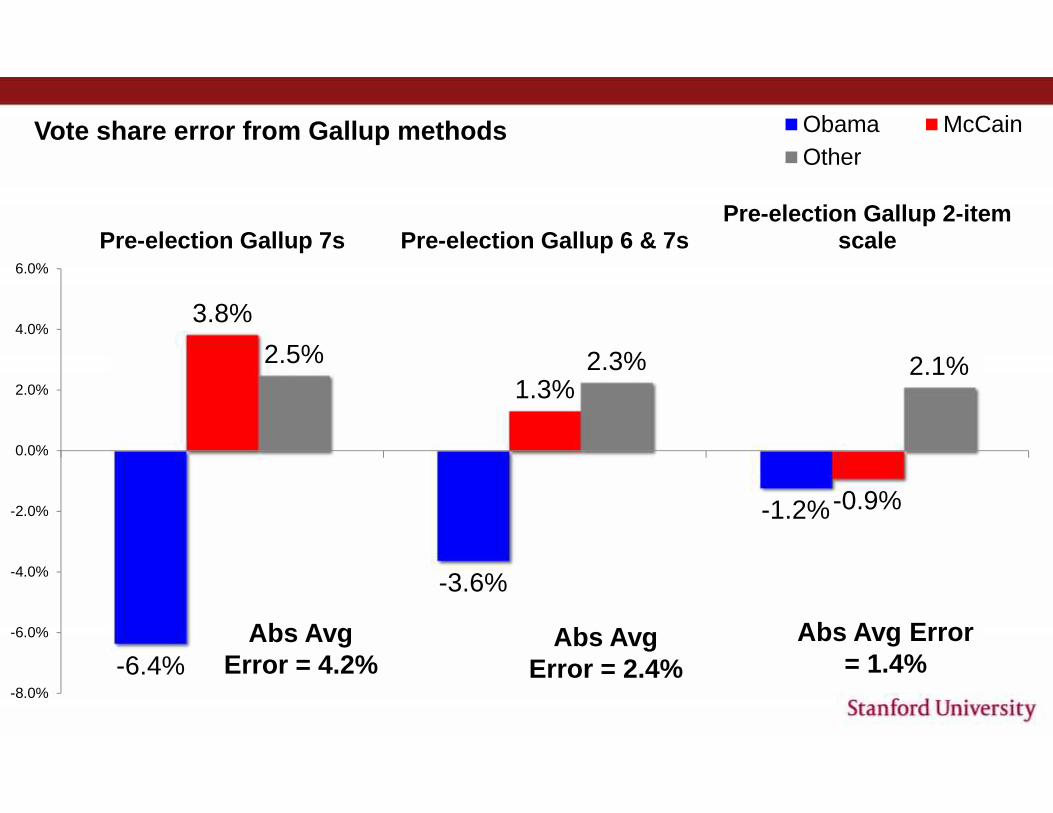
-6.4%
-3.6%
-1.2%
3.8%
1.3%
-0.9%
2.5% 2.3% 2.1%
-8.0%
-6.0%
-4.0%
-2.0%
0.0%
2.0%
4.0%
6.0%
Pre-election Gallup 7s Pre-election Gallup 6 & 7sPre-election Gallup 2-item
scale
Vote share error from Gallup methods Obama McCainOther
Abs AvgError = 4.2%
Abs AvgError = 2.4%
Abs Avg Error= 1.4%
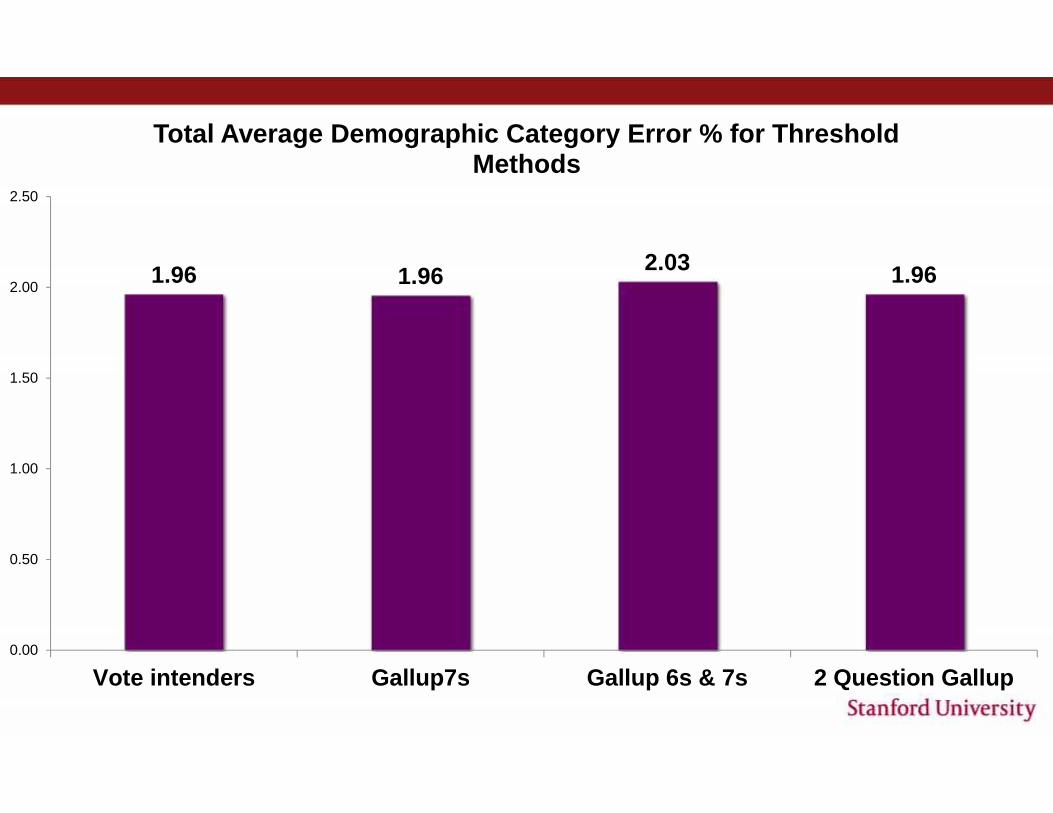
1.96 1.96 2.03 1.96
0.00
0.50
1.00
1.50
2.00
2.50
Vote intenders Gallup7s Gallup 6s & 7s 2 Question Gallup
Total Average Demographic Category Error % for ThresholdMethods
Probability-based approaches
BENEFITS:• GET TO USE THE FULL SAMPLE OF RESPONDENTS
• NO NEED TO GUESS AT WHAT TURNOUT WILL BE
• CAN USE NON-DICHOTOMOUS VARIABLES
• NO ARBITRARY ‘LIKELY/UNLIKELY’ THRESHOLD
COSTS
• CAN’T EVALUATE ACCURACY IN PREDICTING TURNOUT
Probability-based approaches
OUR PAPER TESTS 6 LOGISTIC REGRESSION MODELS
• VOTE INTENTION
• GALLUP 7-ITEM BATTERY
• GALLUP 2-ITEM BATTERY
• Thought given to election + Likelihood of voting
Probability-based approaches
OUR PAPER TESTS 6 LOGISTIC REGRESSION MODELS• A RESOURCE-BASED MODEL (HOLBROOK & KROSNICK, 2013)
• Voted in prior election + Sex + Education + Age + Income + Employmentstatus + Southern state
• NEW HYBRID MODEL• Vote intention + Thought given to election + Likelihood of voting + Voted in
prior election + Education + Primary vote
• NEW HYBRID MODEL #2• Thought given to election + Likelihood of voting + Education + Primary
vote + Party ID Strength
THEN WE PRODUCE PREDICTED PROBABILITIES OF VOTING AND REWEIGHT THE DATATO EVALUATE CANDIDATE VOTE SHARE AND DEMOGRAPHICS
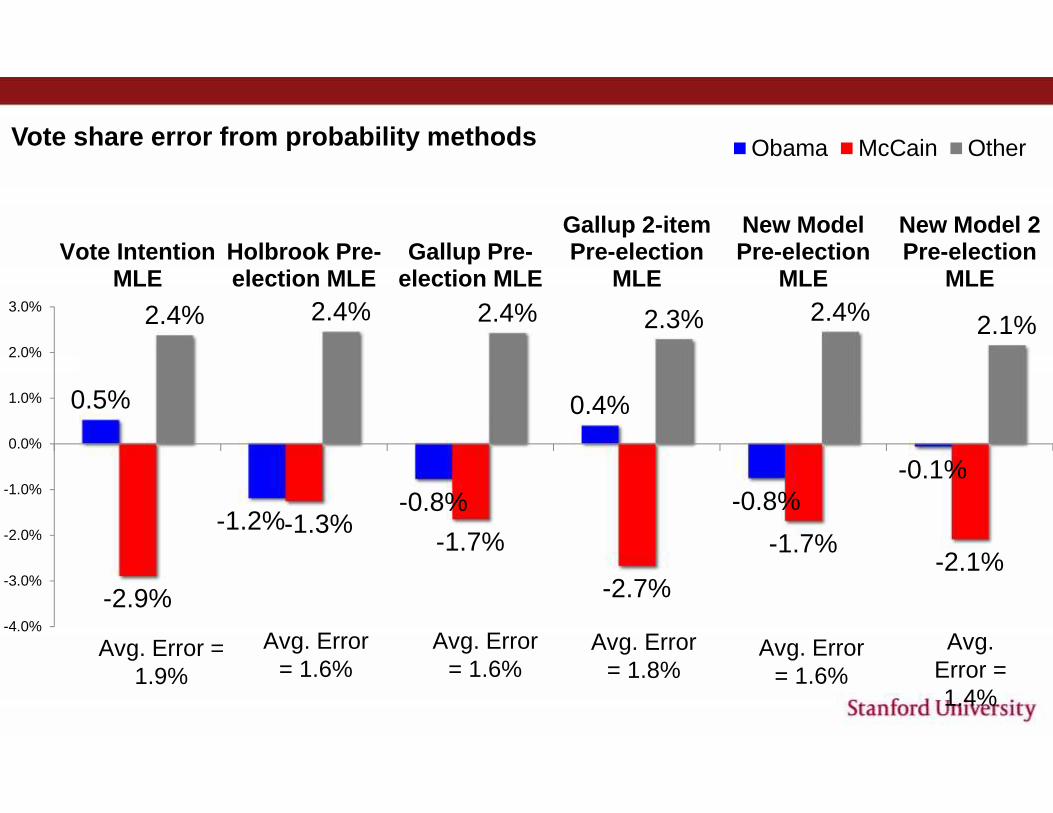
0.5%
-1.2%-0.8%
0.4%
-0.8%-0.1%
-2.9%
-1.3%-1.7%
-2.7%
-1.7%-2.1%
2.4% 2.4% 2.4% 2.3% 2.4% 2.1%
-4.0%
-3.0%
-2.0%
-1.0%
0.0%
1.0%
2.0%
3.0%
Vote IntentionMLE
Holbrook Pre-election MLE
Gallup Pre-election MLE
Gallup 2-itemPre-election
MLE
New ModelPre-election
MLE
New Model 2Pre-election
MLE
Vote share error from probability methods Obama McCain Other
Avg. Error =1.9%
Avg. Error= 1.6%
Avg. Error= 1.6%
Avg. Error= 1.8%
Avg. Error= 1.6%
Avg.Error =1.4%
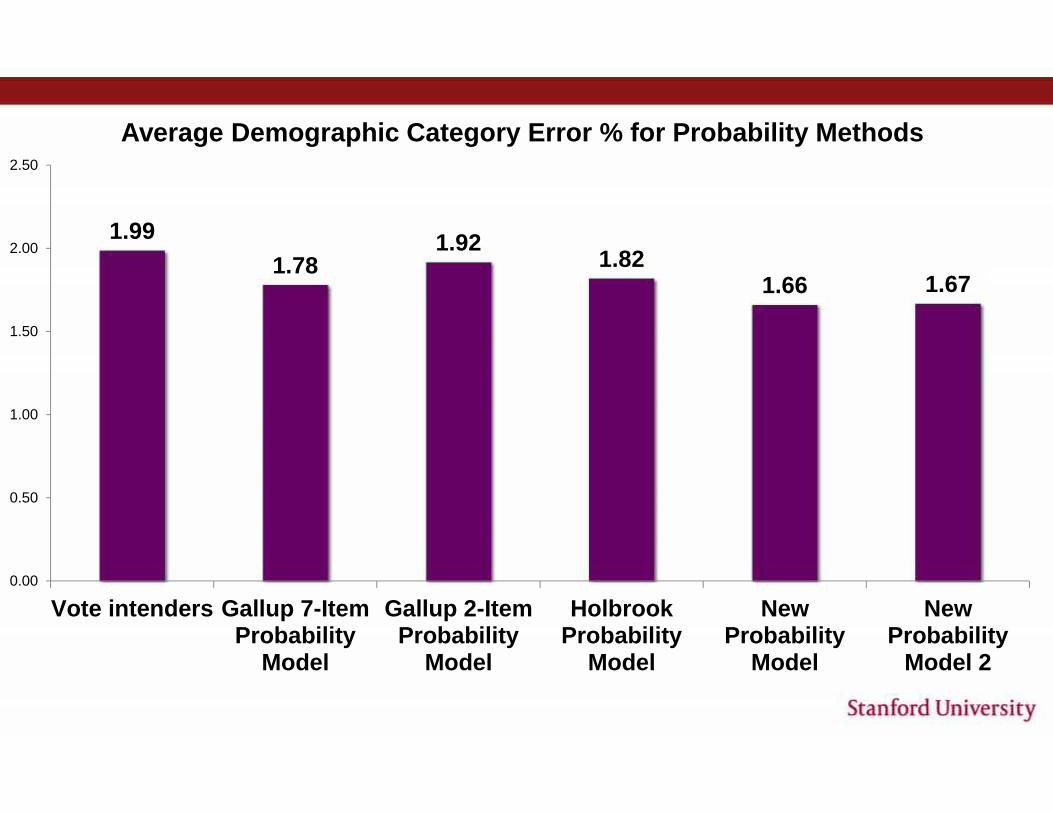
1.991.78
1.921.82
1.66 1.67
0.00
0.50
1.00
1.50
2.00
2.50
Vote intenders Gallup 7-ItemProbability
Model
Gallup 2-ItemProbability
Model
HolbrookProbability
Model
NewProbability
Model
NewProbability
Model 2
Average Demographic Category Error % for Probability Methods
So how do the different approaches compare?
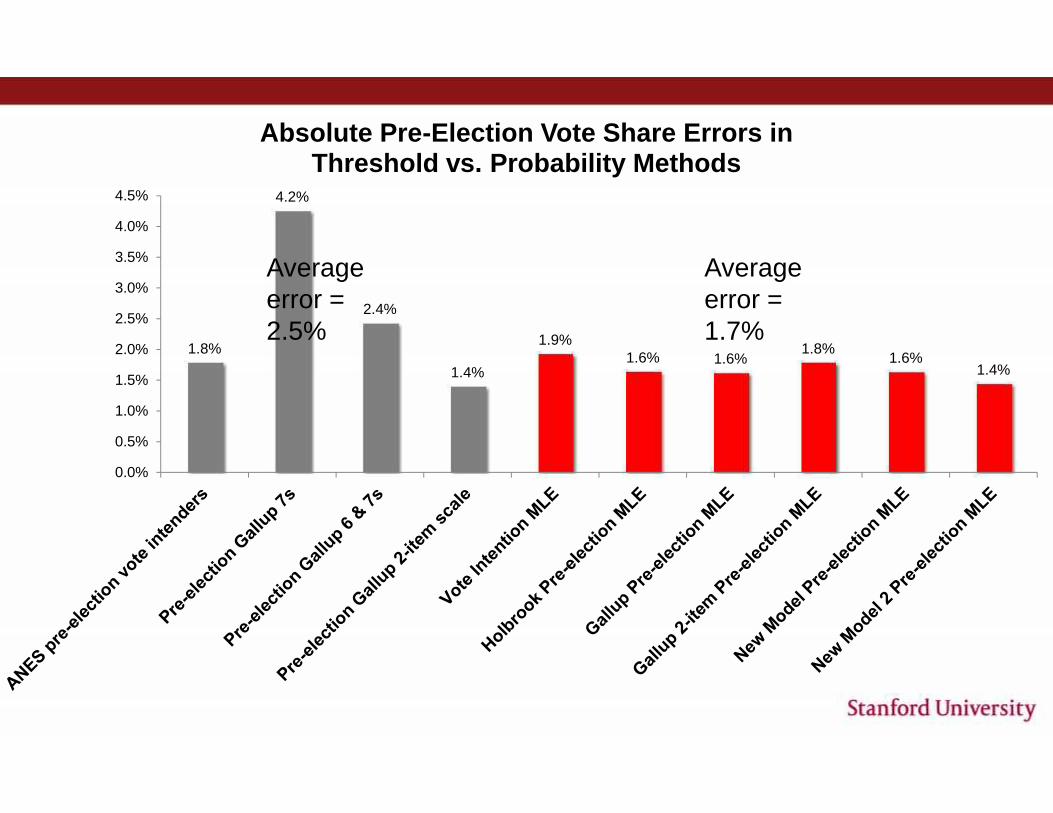
1.8%
4.2%
2.4%
1.4%
1.9%1.6% 1.6%
1.8% 1.6%1.4%
0.0%
0.5%
1.0%
1.5%
2.0%
2.5%
3.0%
3.5%
4.0%
4.5%
Absolute Pre-Election Vote Share Errors inThreshold vs. Probability Methods
Averageerror =2.5%
Averageerror =1.7%
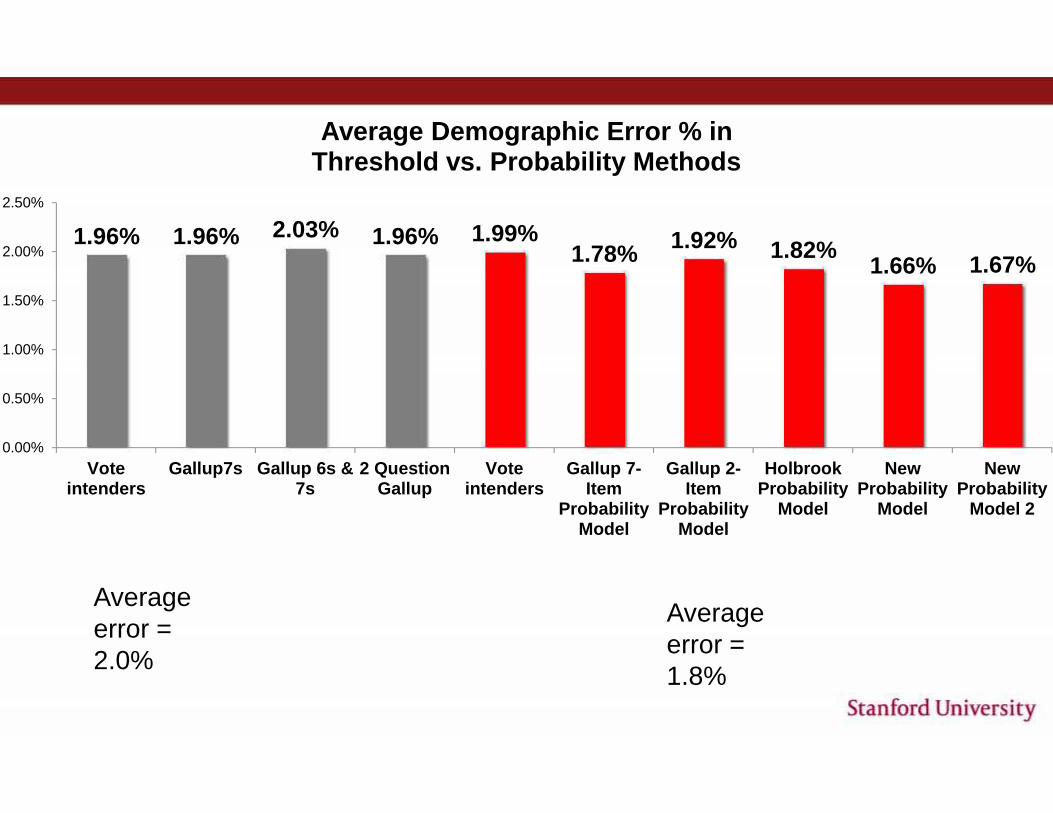
1.96% 1.96% 2.03% 1.96% 1.99%1.78% 1.92% 1.82% 1.66% 1.67%
0.00%
0.50%
1.00%
1.50%
2.00%
2.50%
Voteintenders
Gallup7s Gallup 6s &7s
2 QuestionGallup
Voteintenders
Gallup 7-Item
ProbabilityModel
Gallup 2-Item
ProbabilityModel
HolbrookProbability
Model
NewProbability
Model
NewProbability
Model 2
Average Demographic Error % inThreshold vs. Probability Methods
Averageerror =2.0%
Averageerror =1.8%
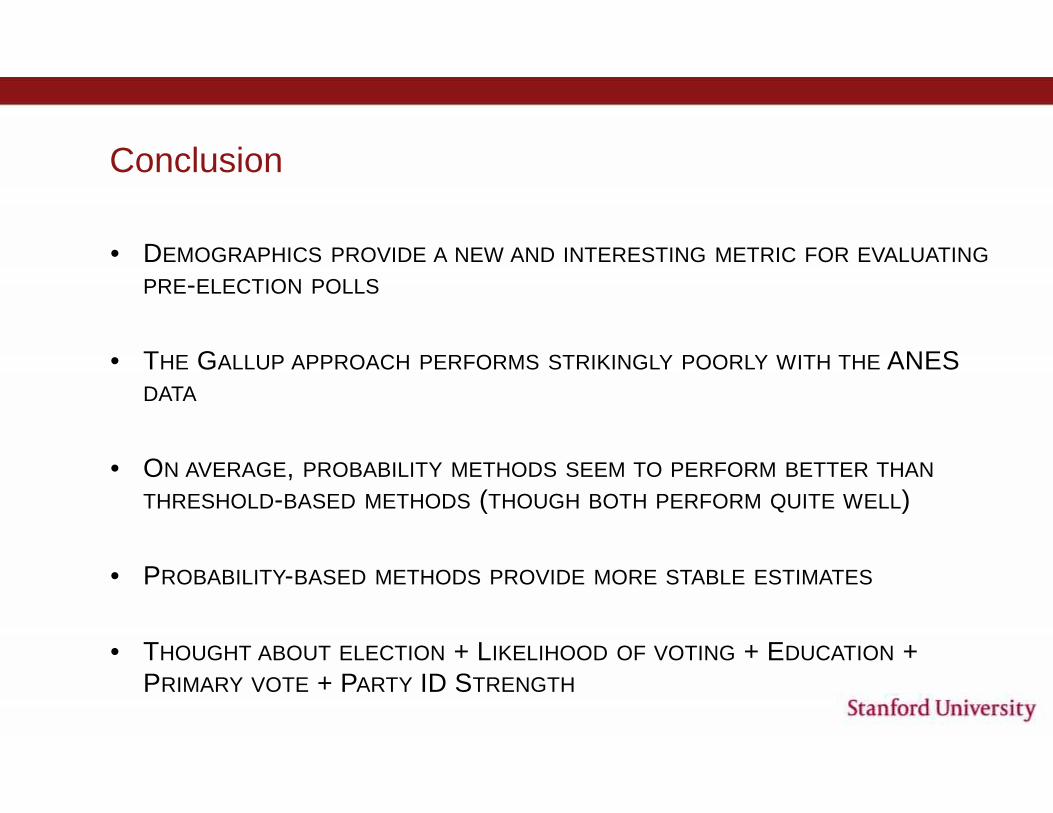
Conclusion
• DEMOGRAPHICS PROVIDE A NEW AND INTERESTING METRIC FOR EVALUATINGPRE-ELECTION POLLS
• THE GALLUP APPROACH PERFORMS STRIKINGLY POORLY WITH THE ANESDATA
• ON AVERAGE, PROBABILITY METHODS SEEM TO PERFORM BETTER THANTHRESHOLD-BASED METHODS (THOUGH BOTH PERFORM QUITE WELL)
• PROBABILITY-BASED METHODS PROVIDE MORE STABLE ESTIMATES
• THOUGHT ABOUT ELECTION + LIKELIHOOD OF VOTING + EDUCATION +PRIMARY VOTE + PARTY ID STRENGTH
Why use likely voter models?
• TRACKING VOTER PREFERENCES IS POPULAR (HORSE-RACE JOURNALISM)
Why use likely voter models?
• TRACKING VOTER PREFERENCES IS POPULAR (HORSE-RACE JOURNALISM)
• MOST PEOPLE REPORT THAT THEY ARE REGISTERED AND INTEND TO VOTE
Why use likely voter models?
• TRACKING VOTER PREFERENCES IS POPULAR (HORSE-RACE JOURNALISM)
• MOST PEOPLE REPORT THAT THEY ARE REGISTERED AND INTEND TO VOTE
• FEWER VOTE ON ELECTION DAY