Embed Size (px)
Citation preview

Report for the Associated Press
March 2016 Presidential Preference Primary Election Study in Florida
Randall K. Thomas, Frances M. Barlas, Linda McPetrie,
Annie Weber, Robert Benford, & Mansour Fahimi
GfK Custom Research
May 2016
1

Overview
Exit polls have traditionally been used by news organizations for two main purposes.
The first has been to add ‘color commentary’ around election vote choices by focusing on the
attitudes and beliefs that voters have, providing a deeper understanding of voters’ choices. The
second purpose of exit polls has been to help news organizations improve their election
projections within states. Traditionally, exit polls have selected a representative sample of
polling places within a state and then, within the polling places, randomly selected exiting voters
to participate in surveys that ask about vote choices, demographics, and attitudes across a
number of election-related issues. Exit polls have been facing a number of challenges and
undergoing changes, as early and absentee voting have increased. Developing an alternative
polling supplement, such as using telephone polls of early and absentee voters, has been one
approach to address the increasing proportion of voters who vote early or by absentee ballot.
The Associated Press (AP) and GfK are jointly undertaking a series of tests around
elections and primaries to explore the feasibility of employing online administration of surveys
as an alternative to exit polling in select states. These tests use probability-based sample from
GfK’s KnowledgePanel® (KP) – which is the largest online panel in the United States with
about 55,000 members for which panelists are selected with known probabilities from an
Address Based Sampling (ABS) frame that represents U.S. households. Due to its size, KP can
be useful for state-specific studies. However, even with the largest probability panel in the
United States, some states, especially when filtered for likely voters, may yield smaller samples
than desired. One technique GfK has been developing to address this issue is to use non-
probability sample (NPS) to supplement KP sample. By understanding and adjusting for the
biases present in the non-probability samples, we can blend the samples to enable larger sample
2

sizes. This allows for more detailed subgroup analysis, while maintaining data quality and
helping with cost effectiveness.
Our first study used an online poll to predict election outcomes for the Governor and
Senator contests in the November 2014 general elections that took place in Georgia and Illinois.
The results were reported separately.1 Our general findings were that using GfK’s probability-
based KP sample alone produced superior outcomes than using NPS alone, and that KP-only
sample outperformed exit polls (before the exit polls were weighted to final election outcomes).
However, using KP as the basis to adjust for biases in the NPS enabled us to blend the samples
together as a larger Calibrated KP+NPS sample. We found the combined calibrated solution
yielded reasonably close approximations to actual vote proportions, outperforming the accuracy
of exit polls (before they were weighted to final election outcomes). In addition, the results were
quite comparable when looking at demographics and attitudes related to vote choice when
compared with exit polls. Another purpose of this first study was to examine the influence of
likely voter models. We found that a simpler model gave similar, and sometimes closer,
approximations to the vote outcomes than the more complex, traditional model.
To follow-up on the first study, we conducted a second online poll in Kentucky and
Mississippi in November 2015, with the results reported separately.2 We screened for self-
identified registered likely voters drawn from two different sample types: 1) GfK’s probability-
based KP sample and 2) NPS sources. We compared the actual election outcomes for the
Governor, Secretary of State, and Attorney General contests in both states, as well as the
Lieutenant Governor contest in Mississippi, with results among registered likely voters from the
KP sample and from a combination of the KP and NPS sources using our calibration
1 http://www.ap.org/research/elections/election-studies-IL-GA-Nov2014.pdf 2 http://www.ap.org/research/elections/election-studies-KY-MS-Nov2015.pdf
3

methodology. Generally, we replicated results for the New Likely Voter model found in the
prior GA-IL study, finding that in these two states (KY and MS) the New Likely Voter model
was superior to the Traditional Likely Voter model (and better than using no likely voter model
at all) for both KP-only sample and Calibrated KP+NPS sample. Results for the KP-only sample
were more accurate than with the larger Calibrated KP+NPS sample. No exit polls were
conducted in the KY and MS contests to allow for a comparison.
While our first two studies were general election studies with a Democrat and a
Republican to select from (with third-party candidates in some contests), our third study
examined the 2016 presidential preference primary in Florida, with separate contests for
Republicans and Democrats. There were multiple candidates in each contest, and not all of them
were running active campaigns. Our goals for this study were to:
1. replicate the likely voter model results from Studies 1 and 2;
2. examine effects of field period length on election result accuracy;
3. compare online sample estimates with exit poll outcomes and results from
telephone polls for absentee or early voters; and
4. compare attitudinal and demographic findings to the existing exit polling.
Overall, the vote outcome estimates from this third online poll were close to the actual
election outcomes for both the Democratic and Republican presidential preference primaries,
accurately predicting the winner and order of candidates in each contest using both the KP-only
samples and the Calibrated KP+NPS samples. For example, the KP-only sample had an average
error versus the actual vote of 1.1 percentage points.
4

Regarding field period, we found that a 4-day field period was slightly more accurate
than a 7-day field period, though the combined sample was more accurate than the separate field
periods.
We compared the simpler New Likely Voter model developed in the GA-IL study against
an abbreviated version of the traditional model and found that, again, the new model was
superior to the traditional model for predicting election outcomes.
An additional major finding of this study was that, when compared to the National
Election Pool (NEP) exit poll, both online sample types – KP-only and Calibrated KP+NPS –
had similar attitudinal profiles associated with the candidate choices. Overall, we, again, found
that results from online polls can be a viable alternative to the traditional exit poll methodology.
We provide some lessons learned that will be used to help inform the next round of pilot testing.
5

Method
Field Periods
The web-based study fielded in Florida and had two field periods – a 7-day field period
from March 8 (5:30 pm Eastern) to March 15 (12:30 pm Eastern) and a 4-day field period from
March 11 (11:40 am Eastern) to March 15 (12:30 pm Eastern). KP panelists were sent 2
reminders to complete the study; for the 7-day field, reminders were sent Friday and Monday
mornings, while the 4-day field reminders were sent on Sunday and Monday mornings. The
election estimates (pooled across both the 4- and 7-day field periods) for both parties were
delivered to AP at 4:05 pm Eastern on Election Day, March 15.
Respondents
We selected all available Florida-based sample members from KP and randomly assigned
half to each field period. For the NPS sources, we used demographic factors to establish quotas
for respondents – proportions for levels of age-sex, race-ethnicity, and education were
established as limits based on targets derived from the Current Population Survey.
The total number of qualified completes is shown in Table 1 by sample source, field
period, primary party voting preference, and likely voter status. We had 1,860 total completed
interviews from the KnowledgePanel and 3,329 from non-probability sample (all 18 years of age
and older and living in Florida) – which were then screened to be either likely voters or not likely
voters with the simplified New Likely Voter model.
6

Table 1. Completed Interviews by Sample Source, Field Period, Primary Party, Likely Voter Status
KnowledgePanel Non-probability Sample
Field Period
Primary Party
Likely Voter 1
Not Likely Voter
Likely Voter
Not Likely Voter
4 DayRepublican 298 122 436 222Democrat 239 157 487 276Neither 0 80 0 218
7 DayRepublican 300 146 437 226Democrat 281 150 489 315Neither 0 87 0 223
Overall Totals 1,118 742 1,849 1,480
1 Likely voter calculated using the New Likely Voter model.
Table 2 presents the number of completes obtained by day for both field periods and
sample types.
Table 2. Completed Interviews by Day for Sample Source and Field Period
KnowledgePanel Non-probability Sample
4 Day 7 Day 4 Day 7 Day
Date of Completion
March 8, 2016 22 72
March 9, 2016 484 271
March 10, 2016 145 359
March 11, 2016 481 158 277 226
March 12, 2016 130 45 489 169
March 13, 2016 151 17 640 425
March 14, 2016 113 70 169 148
March 15, 2016 21 23 64 20
Total 896 964 1,639 1,690
7

Online Sample Weighting
Standard demographic weights were computed for all participants, regardless of voter
registration and likelihood to vote for each sample source (KP and NPS). State-level population
benchmarks based on Current Population Survey targets from March 2015 were used to create
weighting targets based on age-sex, education, income, and race-ethnicity. KP and NPS data
were then combined using an optimal blending process in proportion to their respective effective
sample sizes (Fahimi, 1994) using our calibration methodology where we calibrate using
additional attitudinal and behavioral dimensions that have been found to differentiate between
probability-based and NPS respondents (Fahimi et al., 2015). These questions included weekly
time spent on the Internet for personal use, number of online surveys completed monthly,
average daily duration of television viewing, tendency to be an early adopter of new products,
frequency of coupon use when shopping, and number of moves in the past five years.
National Election Pool Exit Poll
The NEP exit poll was conducted by Edison Research, with in-person exit interviews for
Election Day voters combined with a telephone interview component for those who voted by
way of absentee ballot or voted early. Descriptions of the exit poll methodology were provided
to GfK by the AP. In-person interviews were conducted in three waves on Election Day, March
15. Each wave randomly selected voters from a stratified probability sample of polling places
within Florida. The telephone interviews were conducted between March 8 and March 14 on
both landline phones and cellphones drawn from a random-digit dial sample. The complete exit
poll had a total of 3,104 Republican voters and 2,350 Democratic voters, which included
telephone interviews with 283 Republican and 217 Democratic voters who had voted by
absentee ballot or voted early.
8

Exit poll results. The exit poll crosstabs were released in stages, which varied in both
the number of cases completed and the weighting algorithms used. Results from two releases
were used for this report to compare with the results obtained in the web-based interviews.
Intermediate exit poll results (shown in Appendix A) included the first two waves of in-person
interviews at the precinct level and all data from the telephone calls to early/absentee voters
(with a total of 1,328 Republican and 1,232 Democratic voters). These intermediate results were
released to NEP members and subscribers at 5:00 pm on March 15, prior to polls closing. The
final exit poll results (shown in Appendix B) were released the day after the election and
included interviews from all three waves of in-person precinct interviews along with all
telephone interview cases (with a total of 1,907 Republican and 1,659 Democratic voters).
Exit poll data adjustments. There are two major forms of useful output from the NEP
exit poll – first, the crosstabs of demographics and attitudes by candidate vote choice and second,
the estimate of candidate vote proportions. Each output has associated data adjustments that are
independent yet designed to more accurately yield representative results.
Exit poll crosstab weighting. The intermediate results were weighted using targets of
estimated vote counts from a combination of pre-election polls and the first two waves of the exit
poll. The final exit poll results, reported in Appendix B, were weighted to the final vote count. In
both sets of results, the early and absentee vote estimates (telephone) were combined with
Election Day estimates (in-person) in a 40 to 60 ratio. The NEP used past voting history to
estimate the size of the absentee and early vote.
Model-based candidate estimates. The exit poll candidate estimates were derived from a
series of statistical models that use current and past results from a random sample of precincts.
For the Florida presidential primary, candidate estimates used the best sample precinct model –
9

that is, the model that had the smallest standard error in the difference between the estimates for
the top two candidates. The best sample precinct model was based on data from all three waves
of in-person data collection and all telephone interviews.
10

Results
Likely Voter Models
We first compared results using the New Likely Voter model against a modified version
of the Traditional Likely Voter model. The questions from the Traditional Likely Voter model
were modified slightly to allow respondents to answer all relevant questions from both models.
The new model identified a larger subset of likely voters (LV), including all of those identified
by the traditional model, as well as some others who would have been screened out by the
traditional model. Both models were adjusted slightly from the models used in prior studies to
reflect the difference in voting in a closed-primary state, as is the case with Florida, as opposed
to the general election likely voter models used previously.
The Traditional Likely Voter model was limited to respondents who were registered to
vote (and registered for either the Republican or Democratic parties) and based on a complex set
of definitions that includes past vote frequency, past voting behavior, whether or not they have
already voted, likelihood to vote, interest in news about the election, and knowing where to vote.
This model required eight survey questions based on four different patterns of survey answers to
define a likely voter. This model is very similar to what many others in the polling sector use.
The New Likely Voter model was also limited to respondents who reported being
registered to vote and registered with the Republican or Democratic party, and was based on
responses to two additional questions; the model includes those who 1) already voted or say they
will definitely vote or 2) say they probably will vote and also indicated that they always or nearly
always vote in primary elections.
We calculated the ‘average error’ to determine accuracy. The average error is computed
by first determining the absolute deviation of each candidate’s predicted vote proportions from
11

the actual results. The mean of the candidate deviations is then computed for each contest, and
then the average is computed across contests, treating each contest as equivalent.3 To match the
actual ballot presentation that voters would have in Florida, the web-based questionnaire
presented all candidates who were included on the Florida ballot to respondents (the Florida
ballot contained 13 Republican and 3 Democratic candidates) in alphabetical order. For
purposes of analysis, we looked at the four Republican and two Democratic candidates with
active campaigns at the time of the primary, along with an ‘Other candidate’ category for each
party. We then compared actual vote totals with our estimated proportions for the active
candidates and ‘Other.’
First, we compared the two likely voter models with the demographically weighted KP
sample (Table 3). We found that across both primary contests, the average absolute deviation
between election outcomes and survey results (average error) was larger when the Traditional
Likely Voter model was used and smaller with the New Likely Voter model. The average error
for the New Likely Voter model was 1.1 percentage points, confirming findings from the earlier
general election studies.
3 We did not average across all candidate deviations individually since the Republican contest, with more candidates, had more deviations and would therefore potentially have an unequal influence on the overall mean value. Our approach instead equates and averages the error of the two independent samples across each party’s primary.
12

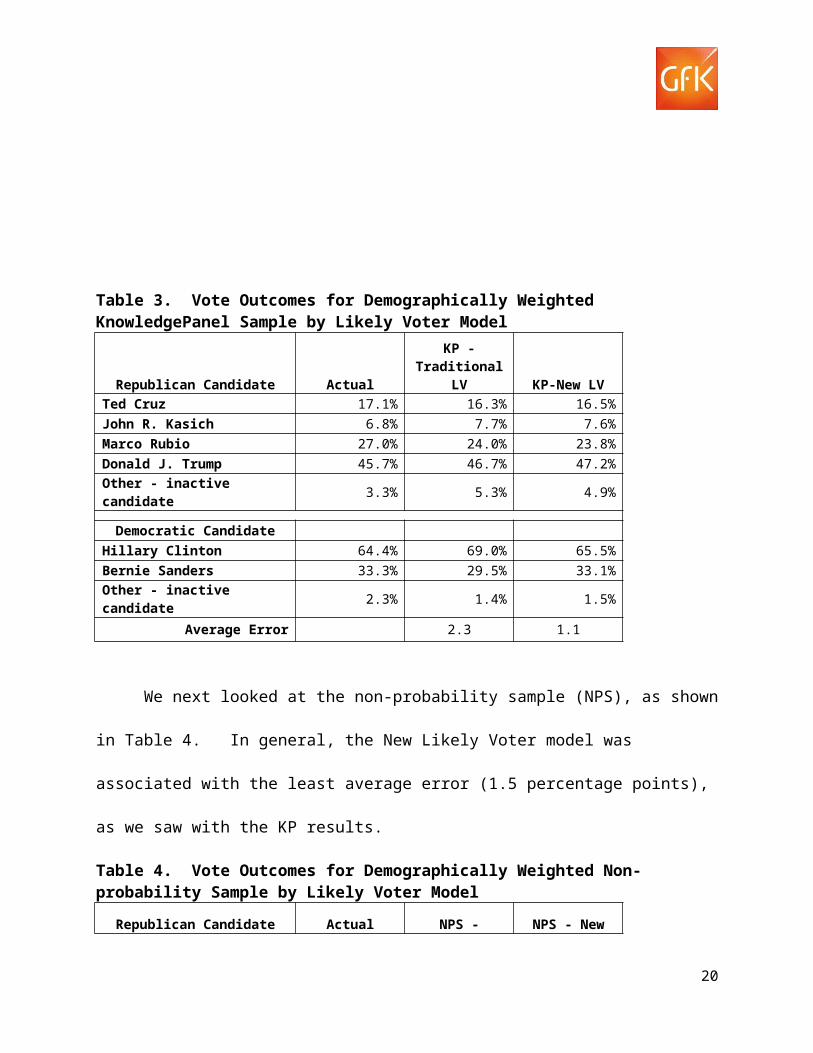
Table 3. Vote Outcomes for Demographically Weighted KnowledgePanel Sample by Likely Voter Model
Republican Candidate ActualKP - Traditional
LV KP-New LVTed Cruz 17.1% 16.3% 16.5%John R. Kasich 6.8% 7.7% 7.6%Marco Rubio 27.0% 24.0% 23.8%Donald J. Trump 45.7% 46.7% 47.2%Other - inactive candidate 3.3% 5.3% 4.9%
Democratic CandidateHillary Clinton 64.4% 69.0% 65.5%Bernie Sanders 33.3% 29.5% 33.1%Other - inactive candidate 2.3% 1.4% 1.5%
Average Error 2.3 1.1
We next looked at the non-probability sample (NPS), as shown in Table 4. In general,
the New Likely Voter model was associated with the least average error (1.5 percentage points),
as we saw with the KP results.
Table 4. Vote Outcomes for Demographically Weighted Non-probability Sample by Likely Voter Model
Republican Candidate ActualNPS -
Traditional LV NPS - New LVTed Cruz 17.1% 12.7% 13.4%John R. Kasich 6.8% 5.8% 5.7%Marco Rubio 27.0% 26.3% 25.2%Donald J. Trump 45.7% 48.8% 48.4%Other - inactive candidate 3.3% 6.4% 7.4%
Democratic CandidateHillary Clinton 64.4% 65.5% 64.8%Bernie Sanders 33.3% 31.8% 32.8%Other - inactive candidate 2.3% 2.7% 2.4%
Average Error 1.7 1.5
13

We next looked at the Calibrated KP+NPS samples under the similar conditions as used
for the individual KP and NPS samples (see Table 5). The New Likely Voter model again had
the lowest average error (1.1 percentage points) with the combined, calibrated sample.
Table 5. Vote Outcomes for Calibrated KP+NPS Sample by Likely Voter Model
Republican Candidate Actual
Calibrated KP + NPS -
Traditional LVCalibrated KP + NPS -New LV
Ted Cruz 17.1% 16.4% 16.4%John R. Kasich 6.8% 6.6% 6.6%Marco Rubio 27.0% 25.0% 24.3%Donald J. Trump 45.7% 46.9% 47.3%Other - inactive candidate 3.3% 5.2% 5.4%
Democratic CandidateHillary Clinton 64.4% 67.4% 65.4%Bernie Sanders 33.3% 30.1% 32.3%Other - inactive candidate 2.3% 2.5% 2.3%
Average Error 1.7 1.1
Effects of Field Period
We next compared results for the demographically weighted KP and the Calibrated
KP+NPS samples (see Table 6) and looked for any differences in results by field period (the
overall combined sample versus 4-day versus 7-day groups). The average error was somewhat
lower for the 4-day field period than the 7-day field period for both the KP and Calibrated
KP+NPS samples. However, the separate field periods were both significantly higher in average
error than the results with the two field periods combined, most likely reflecting the impact of
larger samples and their associated higher rates of precision.
14

Table 6. Vote Outcomes for Field Period by Sample TypeKnowledgePanel - Demo Weighted Calibrated KP+NPS
Republican Candidate Actual Overall 4 Day 7 Day Overall 4 Day 7 Day
Ted Cruz 17.1% 16.5% 11.1% 22.1% 16.4% 13.6% 19.2%
John R. Kasich 6.8% 7.6% 7.6% 7.5% 6.6% 6.4% 6.6%
Marco Rubio 27.0% 23.8% 27.9% 20.3% 24.3% 26.7% 22.2%
Donald J. Trump 45.7% 47.2% 47.6% 46.6% 47.3% 48.0% 46.4%
Other - inactive candidate 3.3% 4.9% 5.8% 3.6% 5.4% 5.2% 5.5%
Democratic Candidate
Hillary Clinton 64.4% 65.5% 65.2% 66.7% 65.4% 64.9% 66.0%
Bernie Sanders 33.3% 33.1% 33.9% 31.6% 32.3% 32.3% 32.1%
Other - inactive candidate 2.3% 1.5% 1.0% 1.7% 2.3% 2.8% 1.9%
Average Error 1.1 1.7 2.1 1.1 1.2 1.5
Comparison with Exit Poll Vote Proportions
The NEP exit poll projected results for 5 candidates for the Republicans and 2 candidates
for the Democrats, though Florida listed 13 candidates on the Republican ballot and 3 candidates
on the Democratic ballot. Since the exit poll reported results for only the subset of candidates
with projections summing to 100%, we rescaled the actual outcomes to represent only those 5
candidates in the Republican contest and the 2 candidates in the Democratic contest (so each
would also sum to 100% and be comparable to the exit poll results). In addition, we also
rescaled the KP-only and Calibrated KP+NPS samples for those same candidates to compare our
study with the exit poll results. Table 7 displays these comparisons. Both the rescaled KP-only
15

and Calibrated KP+NPS samples had a lower average error (both 1.0 percentage points) than the
exit poll results (2.2 percentage points).
Table 7. Vote Outcomes – Comparisons of Exit Poll with Sample Sources
Republican Candidate ActualActual
RescaledNEP Exit
Poll 1
KP-only Demo
WeightedCalibrated KP+NPS
Ben Carson 0.9% 0.9% 1.0% 0.5% 0.9%Ted Cruz 17.1% 17.6% 17.7% 17.3% 17.2%John R. Kasich 6.8% 6.9% 6.2% 7.9% 6.9%Marco Rubio 27.0% 27.7% 28.7% 24.9% 25.4%Donald J. Trump 45.7% 46.9% 46.4% 49.4% 49.5%
Democratic CandidateHillary Clinton 64.4% 65.9% 62.0% 66.5% 66.9%Bernie Sanders 33.3% 34.1% 38.0% 33.5% 33.1%
Average Error 2.2 1.0 1.0 1 Best sample precinct model using only exit poll results combined with absentee and early voter telephone poll results
Early/Absentee Vote Effects
We next compared the results for those who indicated they would vote early or by
absentee ballot with those who indicated they would vote on Election Day. Table 8 summarizes
the weighted proportion of absentee and early voters by sample source and party primary.
Slightly more than half of all voters voted early or by absentee ballot in Florida.4
The NPS-only sample was the closest to the actual proportion of those who voted early or
absentee in Florida. Note that the proportions of early or absentee voting for the online samples
are the estimates based on self-reported data and not based on any a priori assumptions or
weighting of early and absentee vote proportions to derive vote estimates. Data were weighted
using an overall demographic weight for all respondents regardless of vote likelihood or Election
Day or early and absentee voting proportions.
4 Of the total number of interviews the NEP exit poll, 9.2% of the Democratic interviews and 9.1% of the Republican interviews were conducted by telephone, representing those who voted early or by absentee ballot.
16

Table 8. Proportions of Early/Absentee Voters by Sample Source and Party Primary
Actual KP-only NPS-onlyCalibrated KP+NPS
Florida Republican Primary 51.0% 58.3% 48.5% 54.9%
Florida Democratic Primary 52.0% 64.5% 49.2% 55.6%
Average Deviation from Actual 9.9 2.7 3.7
Table 9 summarizes the vote choice proportions for each party’s primary by
early/absentee and Election Day voters for the NEP exit poll, the KP-only sample, and the
Calibrated KP+NPS sample. To assess comparability between GfK’s online poll samples and
the exit poll by vote method, we computed the absolute difference between the exit poll for the
two methods and averaged by contest. Although there were differences in projected proportions
by voting method and sample, all samples showed the same order of candidate outcomes,
regardless of whether they were early and absentee voters or Election Day voters. Once
available, we will compare the distributions in Table 9 to the actual vote proportions among
early/absentee and Election Day voters.
Table 9. Results for Early/Absentee and Election Day Voters by Sample Source
17

Republican Candidate
NEP Absentee/
Early Voters 1
KP-only Absentee/
Early Voters
Calibrated KP+NPS Absentee/
Early VotersNEP Election
Day 1KP-only
Election Day
Calibrated KP+NPS
Election Day
Ben Carson 1.0% 0.8% 1.1% 1.0% 0.2% 0.8%
Ted Cruz 18.2% 17.8% 16.7% 17.0% 16.5% 17.8%
John R. Kasich 5.7% 7.0% 6.1% 7.0% 9.2% 8.0%
Marco Rubio 28.5% 25.9% 28.0% 29.0% 23.5% 22.1%
Donald J. Trump 46.7% 48.6% 48.1% 46.0% 50.6% 51.4%
c
Democratic Candidate
Hillary Clinton 61.0% 70.0% 68.3% 62.7% 58.6% 65.1%
Bernie Sanders 39.0% 30.0% 31.7% 37.3% 41.4% 34.9%
Average Divergence from Exit Poll 5.14 4.04 3.41 2.63
1 Best sample precinct model Election Day exit poll results and absentee or early voter telephone poll results
18

Electorate Demographics and Attitudes
Comparing methodologies and samples. We next examined the demographics and
attitudes of respondents based on vote choice for each party’s primary, comparing our online
samples against the NEP results. Appendix A reflects normal demographic weighting for KP-
only sample and for the blended Calibrated KP+NPS sample for both parties’ primaries. The
intermediate results for the NEP exit poll are also presented in Appendix A. Appendix B shows
results for KP-only sample and Calibrated KP+NPS sample after each had been post-stratified to
the election outcomes. Appendix B also presents the final results for the NEP exit poll, which
were also weighted to election outcomes. To assess comparability between results from GfK’s
online poll and the results from the NEP exit poll, we computed the absolute difference between
the online study and the exit poll for each proportion of each level of the demographic and
attitudinal variables for each candidate (when the exit poll did not suppress presentation of the
results due to low sample sizes). We averaged the deviations by item and then averaged the
deviations across all items. We did this for each contest within each state and for each sample
and weighting combination. Table 10 summarizes the average percentage-point deviations from
exit poll values for these sample and weighting combinations.
Table 10. Comparing Exit Poll Results with Online Voter Demographics and Attitudes
Pre-election Weighted Results Results Weighted to Election Outcomes
KP-only Sample Average Deviation
Calibrated (KP+NPS) Sample Average Deviation
KP-only Sample Average Deviation
Calibrated (KP+NPS) Sample Average Deviation
Republican Primary 3.7 2.6 3.3 2.3
Democratic Primary 5.8 5.4 5.2 4.4
19
Average 4.7 4.0 4.2 3.4
Similar to findings from the GA-IL study, we found that, in general, KP-only sample had
a higher average deviation from exit poll results than did Calibrated KP+NPS sample. Post-
stratifying by election outcomes (for both the exit polls and online poll results) further reduced
the differences between the online samples and the exit poll. This convergence between the
online results and the exit poll results is expected due to the increased similarity of weighting.
20

Conclusions
Lessons Learned and Next Steps
Once again, the findings support the superiority of the New Likely Voter model and
support the choice of the simpler model in future work.
As was found in the 2014 GA-IL study, online polling with the KP-only and the
Calibrated KP+NPS samples conducted in the days leading up to the election had
substantially lower average error than the NEP exit poll. The KY-MS study also
demonstrated the ability to accurately predict the election outcome with an online poll
using KP and Calibrated KP+NPS. However, no exit poll was conducted in the election to
allow for a comparison.
While the four-day field period showed a smaller average error than the seven-day field
period, the lowest error was found when looking at both samples combined. This warrants
some caution in using only the four-day field period immediately preceding Election Day,
especially given the increasing portion of ballots being completed in early voting or by
absentee ballot. We plan to compare results for early versus late Florida survey responders
in an effort to further investigate the differences between the two field period lengths. In
addition, we will examine the differences in early versus late survey responders in the two
prior studies (GA-IL and KY-MS).
In a preliminary analysis, we found an even simpler likely voter model that was limited to
two questions – voter registration and likelihood of voting – somewhat improved
projected election results. We will go back through the data we collected in GA-IL and
KY-MS to see if this even simpler likely voter model worked at least as well in those state
elections.
21

References
Fahimi, M. (1994). Post-stratification of pooled survey data. Proceedings of the American
Statistical Association, Survey Research Methods Section, Toronto, Canada.
Fahimi, M., Barlas, F. M., Thomas, R. K., & Buttermore, N. (2015). Scientific surveys based on
incomplete sampling frames and high rates of nonresponse. Survey Practice, 8 (5).
ISSN: 2168-0094
22