Embed Size (px)
Citation preview


NAMOJS ~?0L
o002


NAVAL POSTGRADUATE SCHOOLMonterey, California
THE EFFECT OF WELDING PROCESSON THE MICROSTRUCTURE OFHY-130 STEEL WELDMENTS
by
Teresa M. McNutt
December 1988
Thesis Co-Advisors: J. Mauro LoszSaeed Saboury
Approved for public release; distribution is unlimited.
T242150
Unclassified
Security Classification of this page
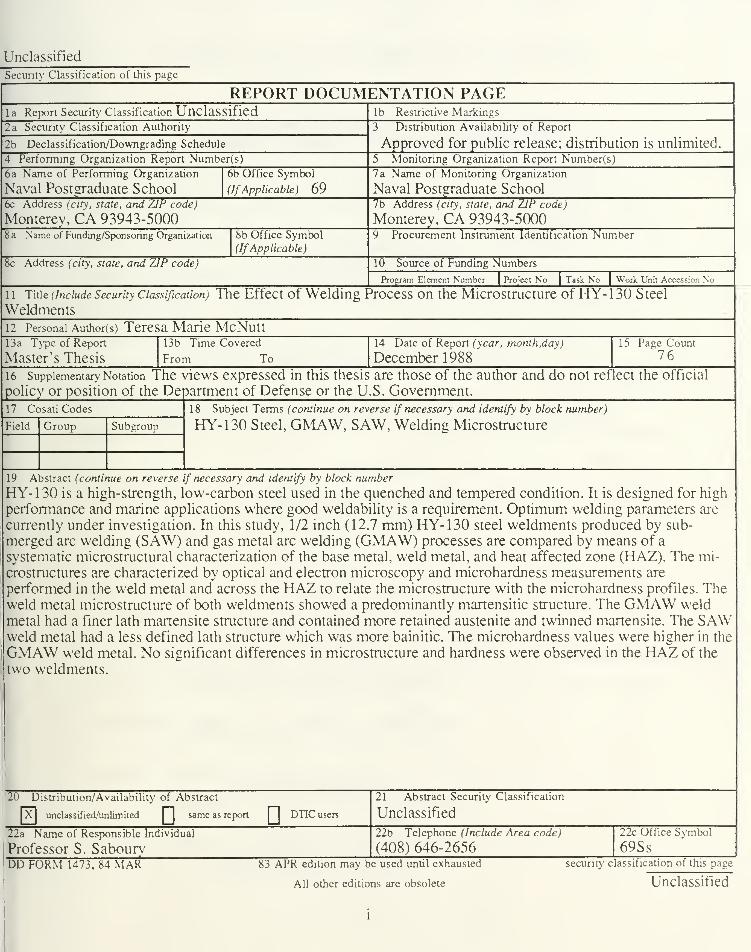
REPORT DOCUMENTATION PAGEla Report Security Classification Unclassified lb Restrictive Markings
Security Classification Authority
2b Declassification/Downgrading Schedule
3 Distribution Availability of Report
Approved for public release; distribution is unlimited.
4 Performing Organization Report Number(s) Monitoring Organization Report Numbers)
6a Name of Performing Organization
Naval Postgraduate School
6b Office Symbol
(IfApplicable) 697a Name of Monitoring Organization
Naval Postgraduate School6c Address (city, state, and ZIP code)
Monterev, CA 93943-50007b Address (city, state, and ZIP code)
Monterey, CA 93943-50008 a Name of Funding/Sponsoring Organization 8b Office Symbol
(IfApplicable)
9 Procurement Instrument Identification Number
8c Address (city, state, and ZIP code) 10 Source of Funding Numbers
Program Element Number Project No Task No Work Unit Accession No
1 1 Title (include Security Classification) The Effect of Welding Process on the Microstructure of HY- 1 30 Steel
Weldments
12 Personal Author(s) Teresa Marie McNutt13a Type of Report
Master's Thesis
13b Time Covered
From To
14 Date of Report (year, month,day)
December 1988
15 Page Count
76
16 Supplementary Notation The views expressed in this thesis are those of the author and do not reflect the official
policy or position of the Department of Defense or the U.S. Government.
17 Cosati Codes
Field Group Subgroup
18 Subject Terms (continue on reverse if necessary and identify by block number)
HY-130 Steel, GMAW, SAW, Welding Microstructure
19 Abstract (continue on reverse if necessary and identify by block number
HY-130 is a high-strength, low-carbon steel used in the quenched and tempered condition. It is designed for high
performance and marine applications where good weldability is a requirement. Optimum welding parameters are
currently under investigation. In this study, 1/2 inch (12.7 mm) HY-130 steel weldments produced by sub-
merged arc welding (SAW) and gas metal arc welding (GMAW) processes are compared by means of a
systematic microstructural characterization of the base metal, weld metal, and heat affected zone (HAZ). The mi-
crostructures are characterized by optical and electron microscopy and microhardness measurements are
performed in the weld metal and across the HAZ to relate the microstructure with the microhardness profiles. Theweld metal microstructure of both weldments showed a predominantly martensitic structure. The GMAW weldmetal had a finer lath martensite structure and contained more retained austenite and twinned martensite. The SAWweld metal had a less defined lath structure which was more bainitic. The microhardness values were higher in the
GMAW weld metal. No significant differences in microstructure and hardness were observed in the HAZ of the
two weldments.
20 Distribution/Availability of Abstract
I X unclassified/unlimited same as report DTIC users
21 Abstract Security Classification
Unclassified
22a Name of Responsible Individual
Professor S. Sabourv
22b Telephone (Include Area code)
(408) 646-265622c Office Svmbol
69SsDD FORM 1473, 84 MAR 83 APR edition may be used until exhausted
All other editions are obsolete
1
security classification of this page
Unclassified

Approved for public release; distribution is unlimited.
The Effect of Welding Process on theMicrostructure of HY-130 Steel Weldments
by
Teresa M. McNuttCaptain, Canadian Forces
B.Sc. (Chem. Eng.), Queen's University at Kingston, Canada, 1983
Submitted in partial fulfillment of therequirements for the degree of
MASTER OF SCIENCE IN MECHANICAL ENGINEERING
from the
NAVAL POSTGRADUATE SCHOOLDecember 1988
ABSTRACT
HY-130 is a high-strength, low-carbon steel used in the quenched
and tempered condition. It is designed for high performance and
marine applications where good weldability is a requirement. Opti-
mum welding parameters are currently under investigation. In this
study, 1/2 inch (12.7 mm) HY-130 steel weldments produced by
submerged arc welding (SAW) and gas metal arc welding (GMAW) pro-
cesses are compared by means of a systematic microstructural charac-
terization of the base metal, weld metal, and heat affected zone (HAZ).
The microstructures are characterized by optical and electron micro-
scopy and microhardness measurements are performed in the weld
metal and across the HAZ to relate the microstructure with the
microhardness profiles. The weld metal microstructure of both weld-
ments showed a predominantly martensitic structure. The GMAW
weld metal had a finer lath martensite structure and contained more
retained austenite and twinned martensite. The SAW weld metal had a
less defined lath structure which was more bainitic. The microhard-
ness values were higher in the GMAW weld metal. No significant dif-
ferences in microstructure and hardness were observed in the HAZ of
the two weldments.
in
TABLE OF CONTENTS
I. INTRODUCTION 1
II. BACKGROUND 3
A HY-130 STEEL 3
R MICROSTRUCTURE 4
C WELDING PROCESSES 6
D. COOLING RATE 8
E. INCLUSIONS 13
III. EXPERIMENTAL PROCEDURE 16
A MATERIAL AND MATERIAL PREPARATION 16
R MICROHARDNESS TRAVERSES 18
C MICROSTRUCTURAL CHARACTERIZATION 19
IV. RESULTS 22
A MACROSTRUCTURE 22
R MICROHARDNESS MEASUREMENTS 26
C MICROSTRUCTURAL CHARACTERIZATION 32
1. Optical Microscopy 33
2. Scanning Electron Microscopy (SEM) 33
IV

3. Transmission Electron Microscopy (TEM) 38
a Base Metal 3g
b. Weld Metal of the Last Pass 54
c. Weld Metal Close to Coarse HAZ 55
d. Coarse HAZ 55
e. Fine HAZ 55
V. DISCUSSION. 58
VI. SUMMARY 64
LIST OF REFERENCES 65
INITIAL DISTRIBUTION LIST 68

ACKNOWLEDGMENTS
I wish to express my appreciation to my thesis advisors, Dr. J.
Mauro Losz and Dr. Saeed Saboury. I thank Mauro for his transmission
electron microscopy and photographic instruction and Saeed for his
guidance, concern, and unending dedication.
I extend a very special thank you to Claudine Guerin and Robert
Perron for their love and attention which they generously shared with
my two daughters while I was completing my studies. Also, I thank my
parents, Garth and Veronica Cornwall and Joyce and Reg McNutt, for
their support and assistance when each of our daughters was born.
I express my appreciation to the Canadian Forces and particularly
to my branch for offering such a superb educational opportunity to my
husband and me.
Finally, to my husband, Steven, and daughters, Kaitlyn and Megan,
I apologize for not spending as much time with you as I would have
liked. I dedicate this work to the three of you.
VI

I. INTRODUCTION
HY-130 steel is a low-carbon, 130 ksi yield-strength, high-tough-
ness alloy steel designed for high-performance applications. The
advantages of the HY steels are their good combination of strength and
toughness over a large temperature range and their good weldability
with little or no post-weld heat treatment [Ref. 1]. HY-130 steel
achieves its strength and toughness through a quench and temper
heat treatment.
The United States Navy has sponsored the development of the
HY-130 system as a replacement for the lower-strength HY-80 system
in the construction of submarine hulls. The HY-130 steel system under
development includes specifications for rolled plate; forged, extruded,
and cast product forms; and required filler metal and welding proce-
dures for the fabrication of high-strength and high-toughness struc-
tures [Ref. 2]. HY-130 steel can provide a deeper operating depth
capability for submersibles and an increased strength-to-weight ratio.
HY-130 steel is currently used by the U.S. Navy for submersibles and is
a candidate for use in the SSN-21 submarine design for nonpressure
hull structures [Ref. 3]. The use of HY-130 steel is estimated to pro-
vide a weight savings of 40 to 50 tons over HY-100 steel in the SSN-21
submarine [Ref. 3]. The high cost of labor-intensive welding and the
great potential for weight reduction have motivated research to iden-
tify the optimum welding parameters for HY-130 steel.
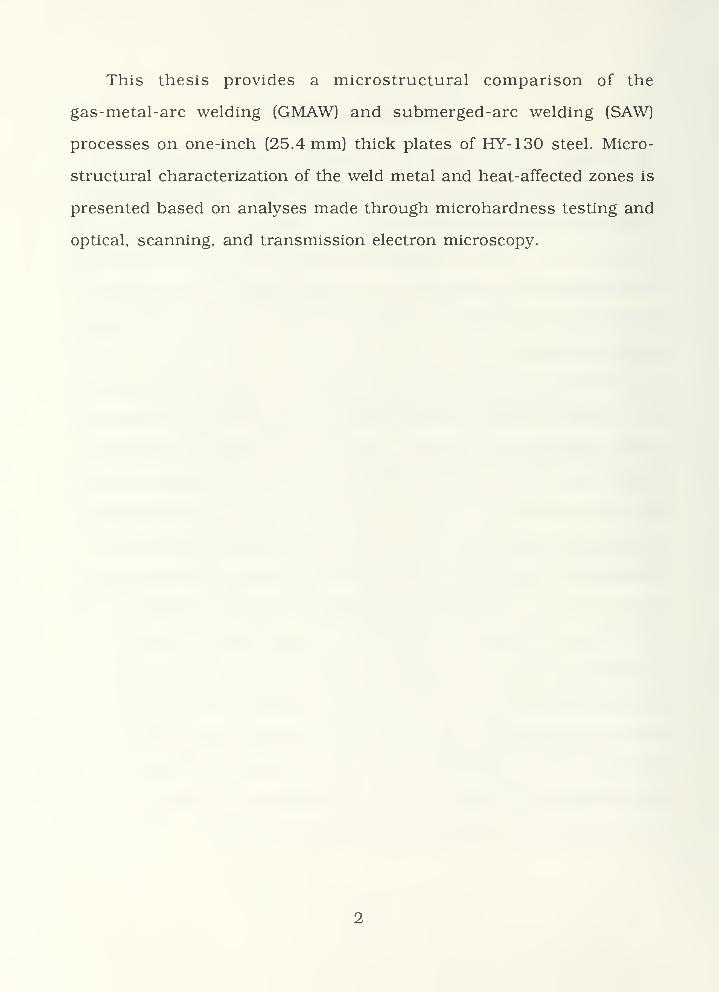
This thesis provides a microstructural comparison of the
gas-metal-arc welding (GMAW) and submerged-arc welding (SAW)
processes on one-inch (25.4 mm) thick plates of HY-130 steel. Micro-
structural characterization of the weld metal and heat-affected zones is
presented based on analyses made through microhardness testing and
optical, scanning, and transmission electron microscopy.

II. BACKGROUND
A. HY-130 STEEL
HY-130 steel is a hardenable high-strength steel developed for
high-performance and marine applications. It is used in the quenched
and tempered condition and has good weldability. The carbon content
is maintained at less than 12 weight percent and it is a medium alloy-
type steel.
The roles of the key elements of HY-130 steel are described in
Reference 2. In summary:
C is kept low (between 0.08 and 0.12 weight percent)to ensure good notch toughness and weldability;
Ni lowers the transformation temperature and contrib-utes to solid solution strengthening;
Cr, Mo, and V are strong carbide formers, improve hardenability,but are kept low to reduce embrittlement;
Mn increases hardenability but is kept below 0.09 per-cent to avoid poor toughness;
Si controls the occurrence of oxidation and maintains alow transition temperature and satisfactory notchtoughness;
P is kept low to reduce embrittlement;
Al improves toughness without the formation of alu-
minum nitride precipitates; and
H is kept as low as possible to prevent hydrogenembrittlement.
HY-130 steel is produced with a high degree of cleanliness, so sulfur
and oxygen are kept to the lowest possible levels.

HY-130 is used in the quenched and tempered condition and
requires a minimum of 60 to 75 percent martensite [Ref. 2] with a
maximum of 40 percent lower bainite at the center of a four-inch plate
[Ref. 1]. The austenitizing temperature is recommended as 1,500° F.
(815.6° C) with a tempering range of 1,000° to 1,150° F (537.8° to
621.1° C) followed by a water quench. These temperatures are lower
than for the HY-80 steels, in which the austenitizing temperature is
recommended as 1,650° F (898.9° C) with a tempering range of 1,150°
to 1,250° F (621.1° to 676.7° C). [Ref. 1]
B. MICROSTRUCTURE
The microstructure development of low-carbon weldments has
been studied by several authors. The transformation sequence is sum-
marized in References 4, 5, and 6 and is outlined here.
Below the austenitizing temperature, ferrite initially nucleates at
austenite grain corners and along the boundaries as these sites usually
provide the lowest energy barrier. The ferrite growth is planar and
leads to the formation of grain boundary alliotriomorphs or blocky fer-
rite. Subsequently, sideplates develop from the grain boundary ferrite
and grow very rapidly. Often this results in parallel arrays of ferrite
laths adjacent to the prior austenite grain boundaries. Occasionally,
large polygonal ferrite grains are observed in this region. Acicular fer-
rite may start to nucleate intragranularly at inclusions. This heteroge-
neous nucleation may also occur at twin boundaries or stacking faults
in the austenite or at pre-existing Widmanstatten ferrite. Acicular fer-
rite is a fine-grained Widmanstatten type of ferrite, nucleated in the
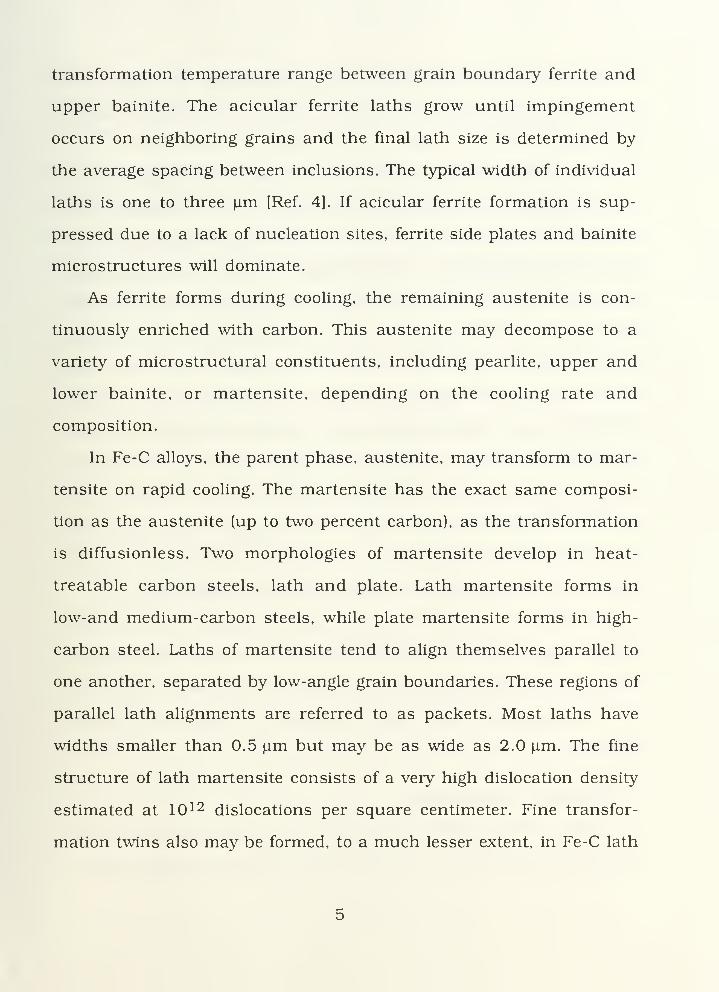
transformation temperature range between grain boundary ferrite and
upper bainite. The acicular ferrite laths grow until impingement
occurs on neighboring grains and the final lath size is determined by
the average spacing between inclusions. The typical width of individual
laths is one to three Jim [Ref. 4]. If acicular ferrite formation is sup-
pressed due to a lack of nucleation sites, ferrite side plates and bainite
microstructures will dominate.
As ferrite forms during cooling, the remaining austenite is con-
tinuously enriched with carbon. This austenite may decompose to a
variety of microstructural constituents, including pearlite, upper and
lower bainite, or martensite, depending on the cooling rate and
composition.
In Fe-C alloys, the parent phase, austenite, may transform to mar-
tensite on rapid cooling. The martensite has the exact same composi-
tion as the austenite (up to two percent carbon), as the transformation
is diffusionless. Two morphologies of martensite develop in heat-
treatable carbon steels, lath and plate. Lath martensite forms in
low-and medium-carbon steels, while plate martensite forms in high-
carbon steel. Laths of martensite tend to align themselves parallel to
one another, separated by low-angle grain boundaries. These regions of
parallel lath alignments are referred to as packets. Most laths have
widths smaller than 0.5 |im but may be as wide as 2.0 fim. The fine
structure of lath martensite consists of a very high dislocation density
estimated at 10 12 dislocations per square centimeter. Fine transfor-
mation twins also may be formed, to a much lesser extent, in Fe-C lath

martensite. The amount of fine twinning increases with decreasing
martensite transformation temperature (Ms) as the carbon content
increases. [Ref. 6]
Bainite forms under continuous cooling rates intermediate to
those of pearlite and martensite formation. Bainite consists of fine
aggregates of ferrite and cementite. The ferrite in bainite may be lath
or plate-like containing a dislocation substructure. Two morphologies
of bainite exist, upper and lower bainite. Upper bainite forms in the
temperature range just below that of pearlite, while lower bainite
forms at temperatures closer to the Ms. The carbide particles of upper
bainite tend to be elongated and form between ferrite laths. In some
steels, especially those with high silicon content, the carbon-enriched
austenite between the bainite laths is quite stable and is retained
between the ferrite laths at room temperature. Lower bainite is com-
posed of relatively large plates and is often characterized as acicular.
Fine carbides form within the plates, which is in contrast with upper
bainite, where coarser carbides form between the plates. [Ref. 6]
Thompson, et al. [Ref. 7] have identified a granular bainite, in low-
carbon, copper-bearing steels such as A710, which is described as
laths of ferrite which have a very similar crystallographic orientation
within each packet and interlath particles of martensite and/or
austenite.
C. WELDING PROCESSES
Fusion welding is the most important technique used in welding
construction today [Ref. 8]. The two fusion-welding processes used in

this study were submerged-arc welding (SAW) and gas-metal-arc
welding (GMAW).
SAW involves an automatically fed, continuous electrode wire and
a separate granular flux. The flux is usually delivered slightly ahead of
the welding electrode. The arc is initiated between the electrode and
the workpiece and is insulated by the flux, preventing atmospheric
contamination and rapid dissipation of heat. This results in relatively
high welding speeds and deep penetration. The melted flux reacts
with the weld pool and adds certain alloying elements to the weld
metal. For HY-130 weldments, the filler metal selection is made such
that the as-deposited weld metal will possess similar properties as the
fully heat-treated base metal. Large heat-affected zones (HAZs) are
characteristic of SAW as approximately two volumes of base metal are
melted for each volume of filler metal [Ref. 9]. SAW is a high produc-
tion process known for its high deposition rates. It is, however, lim-
ited to flat and horizontal positions to avoid flux run-off. [Ref. 10]
The GMAW process uses an electric arc between a consumable
wire electrode and the workpiece. A gas shields the arc and weld pool
from the atmosphere, preventing oxidation and contamination. GMAW
is often performed with DC reverse polarity (DCRP), which results in a
more stable transfer and deeper penetration than DC straight polarity
(DCSP). The GMAW process has high productivity, reliability, and all-
position capability. [Ref. 10]

Figure 1 shows the different sub-zones of a weld. Multi-pass welds
result in refinements in microstructure, improvements in toughness,
and reductions in residual stresses as compared to single-run welds
[Ref. 8]. Each subsequent weld thermal cycle refines the grains of the
underlying portion of the previous weld metal. Figure 2 is a schematic
showing the resulting microstructures of single- and multi-run welds.
Challenger, et al. [Ref. 11] used TEM to show that overlapping the
weld beads is necessary in GMAW of HY-130 to produce a microstruc-
ture with the required yield strength. If overlapping is not employed,
there is little tempering of the martensite, resulting in less fracture
resistance.
D. COOLING RATE
The weld metal microstructure is a function of the cooling rate
(or heat input rate) and composition. Higher cooling rates are associ-
ated with lower heat input rates. Cooling is continuous, therefore
continuous cooling transformation (CCT) diagrams may be used to
predict the microstructure of the particular weld metal composition. A
schematic CCT diagram for low-carbon steel [Ref. 12] is included at
Figure 3. This summarizes the weld metal microstructure expected as
a function of cooling rate. The cooling rate determines the extent of
supercooling prior to the transformation of austenite, which affects
the driving force for the reaction. From the CCT diagram it is seen
that increasing the cooling rate would increase the formation of acic-
ular ferrite or upper bainite, hence it is a mechanism of microstruc-
tural refinement.
8

(_>
wt % c
heat affected zone
Figure 1. Schematic Diagram of the Various Sub-Zonesof the Heat-Affected Zone Approximately
Corresponding to a 0.15 Weight Percent C AlloyIndicated on the Fe-Fe3 C Equilibrium Diagram [Ref. 8]
9

(a)
yVT Coarse grained
^'x'-.C. f"ine grained
//^ Intercritical
/\vCoarse columnar
Recrysfallised coarse
Recrysrall ised fine
Figure 2. Schematic Comparison of the Microstructures of(a) Single-Run and (b) Multi-Run Welds [Ref. 8]
10
1/
aa*a.G
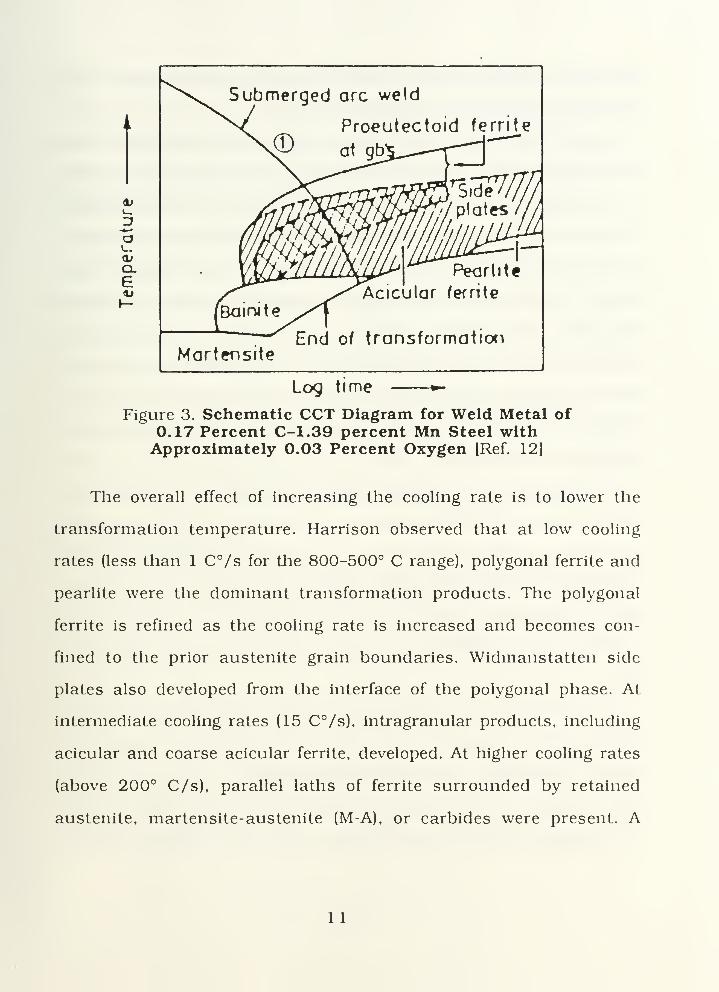
Submerged arc weld
Proeutectoid ferrite
Pearlite
Acicular fernte
MartensiteEnd of transformation
Log time
Figure 3. Schematic CCT Diagram for Weld Metal of0.17 Percent C-1.39 percent Mn Steel withApproximately 0.03 Percent Oxygen [Ref. 12]
The overall effect of increasing the cooling rate is to lower the
transformation temperature. Harrison observed that at low cooling
rates (less than 1 C°/s for the 800-500° C range), polygonal ferrite and
pearlite were the dominant transformation products. The polygonal
ferrite is refined as the cooling rate is increased and becomes con-
fined to the prior austenite grain boundaries. Widmanstatten side
plates also developed from the interface of the polygonal phase. At
intermediate cooling rates (15 C°/s), intragranular products, including
acicular and coarse acicular ferrite, developed. At higher cooling rates
(above 200° C/s), parallel laths of ferrite surrounded by retained
austenite, martensite-austenite (M-A), or carbides were present. A
1 1

martensitic transformation replaced the lath structure when high
basic hardenability was also present. [Ref. 13]
Using the SAW process, Glover, et al. found that as the heat input
increased from 0.74 kJ/mm to 10 kJ/mm, the weld metal of a C-Mn
steel (C above 0.13 percent, about 1.1 percent Mn, 0.25 percent Si,
0.2 percent Mo, and 0.035 Nb) changed from martensite to upper bai-
nite to acicular ferrite. An M-A microconstituent located between the
ferrite laths was replaced by carbides as the heat input increased. In
low-carbon, high-strength, low-alloy (HSLA) steels (C below 0.07 per-
cent), the weld metal changed from coarse polygonal ferrite to
acicular ferrite to upper bainite. A blocky or elongated M-A microcon-
stituent was formed in the cooling range 15s to 190s while no distinct
carbide formed. [Ref. 14]
Wong reported that longitudinal flat two-inch (51 mm) gage ten-
sile specimens of HY-130 exhibited an increased yield strength with
increases in cooling rate. Hardness measurements taken at the center
of the weld decreased only slightly with increased heat input. For heat
inputs ranging from 20 kj/in to 41 kJ/in (0.79 to 1.6 kJ/mm), the
Rockwell C hardness measurements were 36 to 34, respectively.
[Ref. 3]
The cooling rate strongly influences the transformation kinetics
as well as the mechanical properties of the weld metal. A minimum
cooling rate for 25 to 50 mm HY-130 steel plates has been specified as
30 F°/second at 1,000° F or 16.7 C°/s at 537.8° C [Ref. 1], which limits
the maximum allowable preheat temperature. Lower cooling rates will
12
result in weld metal yield strengths below 130 ksi. Wong reported that
a minimum cooling rate of 35 F°/s at 1,000° F (19.4 C°/s at 537.8° C)
for 1/2 inch (12.7 mm) plates was required to produce adequate
mechanical properties in longitudinal weld metal of HY-130 steel. For
GMAW processes, he found that a heat input of 30 to 35 kJ/in (1.18 to
1.38 kJ/mm) should be used with 1/2 inch (12.7 mm) plates. Extrap-
olation showed that a 40 kJ/in (1.57 kJ/mm) heat input should be
limited to 3/4 inch (19 mm) plates or greater. Flax, et al. [Ref. 1] state
the recommended input energy as 45 kJ/in (1.77 kJ/mm) for GMAW
with a limit of 50 kJ/in (1.97 kJ/mm) for a one-inch (25.4 mm) plate.
Flax also reports the minimum preheat and interpass temperature for
one-inch (25.4 mm) plate HY-130 steel as 200° F (93.3° C). The maxi-
mum preheat temperature is listed as 300° F (148.9° C) or as high as
400° F (204.4° C) to avoid transverse cracking in the weld metal.
E. INCLUSIONS
Many authors state that inclusions play an important role in phase
transformations by providing suitable nucleation sites for acicular fer-
rite. Bhatti, et al. [Ref. 15] found that the controlling factors in deter-
mining the effectiveness of inclusions as nucleants in SAW of API
5LX65 steel (0.052 percent C, 1.37 percent Mn, 0.224 percent Si,
0.34 Cu) are volume fraction and size distribution. It is debated
whether it is the inclusion crystallography or the indirect effect of
inclusion chemistry on hardenability that is of importance in the
nucleation of acicular ferrite. It seems that a threshold value of 1.1
13

percent Mn must be exceeded in the weld metal for acicular ferrite to
develop [Ref. 15].
Bhatti, et al. also found that inclusions are generally globular in
shape in the weld metal. They were, however, accompanied by dis-
tinctly geometrical inclusions in the beads when high basicity flux was
used. These inclusions were triangular, rectangular, pentagonal, and
hexagonal in shape and very rich in Al. The Al-rich inclusions were
accompanied by a larger amount of acicular ferrite than the Mn-rich
inclusions which had a lesser amount of acicular ferrite.
Lui and Olson [Ref. 16] studied the effect of inclusions in the weld
metal of SAW HSLA steel. They found that the inclusion volume frac-
tion can be directly related to the concentration of inclusion formers
(oxygen and sulfur) and affects the austenite to ferrite transformation.
They related the microstructure to weld metal oxygen content and
found that the mean particle size of weld metal inclusions decreased
with increasing concentration of oxygen. The inclusion size distribu-
tion dictated whether the oxide and oxy-sulfide inclusions were
located largely at austenite grain boundaries or intragranularly, which
controlled the final weld metal microstructure. Particles with diame-
ters smaller than a critical size were often found at the boundaries and
were effective at pinning the austenite grain boundary. Since grain
boundary nucleation of ferrite is quite favorable, site saturation occurs
quickly, followed by allotriomorphic growth. Weld metals with high
oxygen content and a large amount of grain boundary ferrite were
associated with a large number of small-size inclusions of diameters of
14

less than one {im and with fine austenite grains. Intragranular inclu-
sions provided the initial nucleation sites for acicular ferrite formation.
A higher acicular ferrite content was associated with a large number of
inclusions of diameter greater than two |im and with coarser austenite
grains, resulting in a refined microstructure. The larger austenite
grains result in a smaller grain boundary surface area, reducing the
availability of grain boundary nucleation sites, hence the amount of
grain boundary ferrite is reduced.
Ricks, et al. [Ref. 17] studied the influence of second-phase parti-
cles and concluded that inert, nondeformable inclusions are always
less-effective sites for nucleation than grain boundaries. Only after site
saturation of the boundaries had taken place could nucleation on
inclusions occur. It has also been noted by several authors that inclu-
sions can accelerate nucleation through the thermal expansion differ-
ence between the inclusion and the matrix [Ref. 16]. The austenite
matrix is strained at inclusion locations, during cooling, which accel-
erates its transformation into ferrite.
15

III. EXPERIMENTAL PROCEDURE
A. MATERIAL AND MATERIAL PREPARATION
Two HY-130 steel plates about 25 mm thick with the chemical
composition given in Table I were welded by multi-pass gas-metal-arc
(GMAW) and submerged-arc (SAW) welding processes. The weld
preparation for each plate was a single beveled, 60° V-joint with a
backing plate tack-welded at the base of each plate at the joint. Both
welds were made using identical electrode material of the chemical
composition listed in Table I. The welding parameters of each process
are summarized in Table II. Each plate measured one inch (25.4 mm)
long in the welding direction. The weldments were fabricated by David
Taylor Naval Ship Research and Development Center (DTNSRDC),
Annapolis, Maryland, and were sent to the Naval Postgraduate School
for examination.
The plates were sectioned perpendicular to the weld into
approximately one-half inch (12.7 mm) thick specimens. Each speci-
men face was sanded to produce a smooth, flat surface suitable for
macroetching. The samples were then etched in a two-percent Nital
solution for about ten minutes until details of each weld pass became
clear.
Rockwell C hardness measurements were taken in the base metal.
16

TABLE I
CHEMICAL COMPOSITION OF HY 130 BASE PLATE,
WELD METAL, AND FILLER METAL
Element Base PlateWeld MetalGMAW
Weld MetalSAW Filler Metal*
Carbon 0.106 0.074 0.055 0.091
Manganese 0.87 1.46 1.44 1.67
Silicon 0.22 0.30 0.37 0.39
Phosphorus 0.007 0.006 0.014 0.005
Sulfur 0.002 0.005 0.001 0.010
Nickel 4.40 2.39 2.40 2.23
Molvbdenum 0.42 0.62 0.62 0.63
Chromium 0.51 1.05 0.99 1.05
Vanadium 0.058 0.014 0.020 0.011
Aluminum 0.019 0.003 0.014 0.004
Titanium 0.002 0.003 0.004 0.010
Zirconium 0.001 0.001 0.001 0.003
Copper 0.057 0.046 0.046 0.045
Oxygen 0.0060 0.019 0.028 0.0030
Nitrogen 0.008 0.0046 0.005 0.0030
Boron 0.004 0.005 0.003 0.004
Arsenic - - - 0.011
Hydrogen 1.4 ppm 1.4 ppm 0.4 ppm 0.0002
*The filler metal also
bium, calcium, ceriumcontains small
,and yttrium.
amounts of lead, bismuth, tin, antimony, nio-
17

TABLE II
WELDING PARAMETERS FOR SAW AND GMAW WELDMENTS
Welding Process SAW GMAWWeld ID Number F258 F262
Thickness 1 inch
25.4 mm1 inch
25.4 mmNumber of Passes 40 21
Current (amp) 300 340
Voltage (kV) 34 27
Polarity DCRP DCRP
Travel Speed 17.5 in/min
7.41 mm/s1 1 in/min
4.66 mm/sHeat Input 35.0 kJ/in
1.38 kJ/mm50.1 kJ/in
1.97 kJ/mmPreheat/Interpass
Temperature
200° F
93.3° C
250° F
121.1° C
Cooling Rate at
1,000° F or 537.8° C
34 F°
18.9 C°
38 F°
21.1 C°
B. MICROHARDNESS TRAVERSES
Samples were cut from the macrosamples, metallographically
mounted, polished, and etched in two-percent Nital to locate regions
for analyses. To facilitate microhardness measurements, a line was
scribed across each selected region with a diamond scribe. The sam-
ples were then lightly polished in order to remove the etch and sub-
jected to microhardness measurement along each scribed line. A
Buehler Micromet Micro Hardness Tester with a diamond indenter
and a 300 gram load was used to take the measurements. Penetrations
18

were made at 0.2 mm intervals along the linear traverses, but the
intervals were reduced to 0.1 mm in the vicinity of the fusion line.
C. MICROSTRUCTURAL CHARACTERIZATION
After completion of the microhardness measurements, the sam-
ples were re-polished, re-etched with Nital for 45 seconds, and
examined with a Zeiss ICM 405 microscope. A series of photographs
was taken along the HAZ microhardness traverses to represent the
weld metal, coarse HAZ, fine HAZ, and base metal regions. Montages
comprised of several optical micrographs were prepared of the single-
pass HAZ regions to illustrate these locations. Photographs were also
taken throughout the last weld pass region of the weld metal and a
region of base metal which was unaffected by the welding process.
These micrographs were taken at 500x and enlarged to 750x. The
grain size in the coarse HAZ region of the last pass was measured for
the GMAW and SAW samples using the intercept method.
Scanning electron micrographs were taken at the minimum,
average, and maximum hardness locations within the last pass of the
weld metal at approximately 2,000x. A Cambridge Stereo S4-10 scan-
ning electron microscope operated at 40 kV was used.
In preparation for transmission electron microscopy, each HAZ
sample was wafered along a plane parallel to the plane of the weld
fusion line using a low-speed diamond wafering wheel. The weld metal
samples were wafered perpendicular to the plane of the fusion line.
Figure 4 shows the orientation of these samples and the cutting loca-
tions. Wafer thicknesses ranged from 0.35 mm to 0.50 mm. Slices
19
were numbered commencing with zero, nearest to the weld metal,
and increased outward toward the base metal. Each wafer was glued to
a flat metal block, sanded and polished to 0.15 mm thickness using
standard metallographic techniques. The wafers were etched for 45
seconds in a two-percent Nital solution and optical examination
repeated to map the variations of microstructure within each speci-
men. The wafers were then punched at desired locations to make
3 mm diameter discs. The discs were hand-sanded to a thickness of
0.07 mm using 600 grit paper. These discs were electropolished using
a ten-percent perchloric acid-90-percent glacial acetic acid elec-
trolyte solution. Polishing was performed at 40 to 50 volts, 180 to 200
milliamps, and 13° C using a Tenupol twin jet thinning apparatus. The
foils were examined with a Jeol 120-CX transmission electron micro-
scope operated at 120 kV.
20
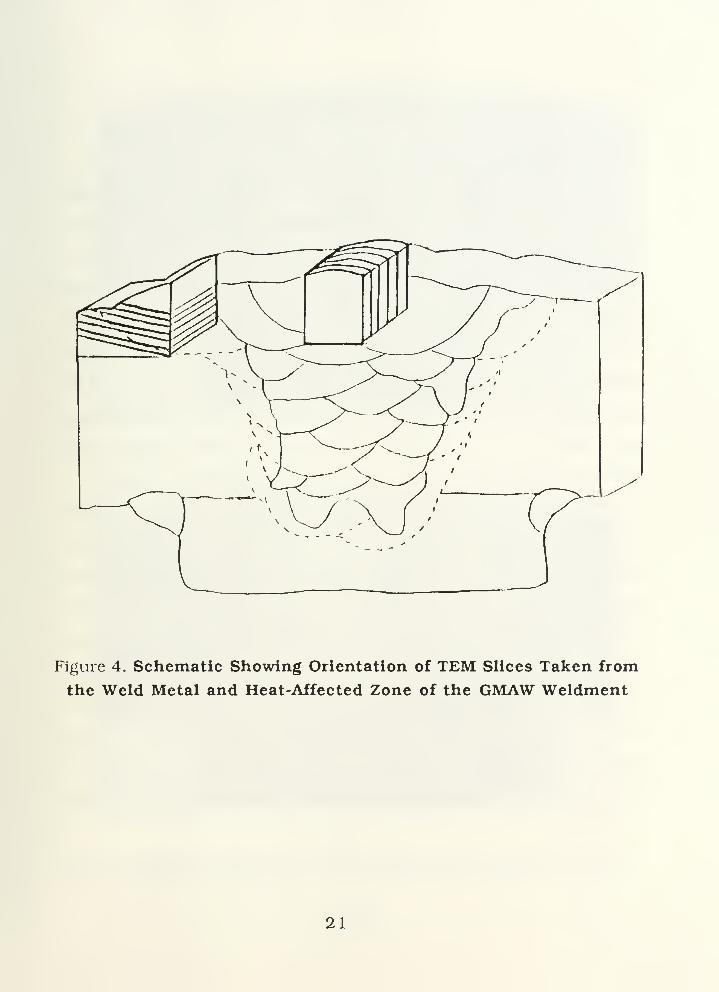
Figure 4. Schematic Showing Orientation of TEM Slices Taken from
the Weld Metal and Heat-Affected Zone of the GMAW Weldment
21
IV. RESULTS
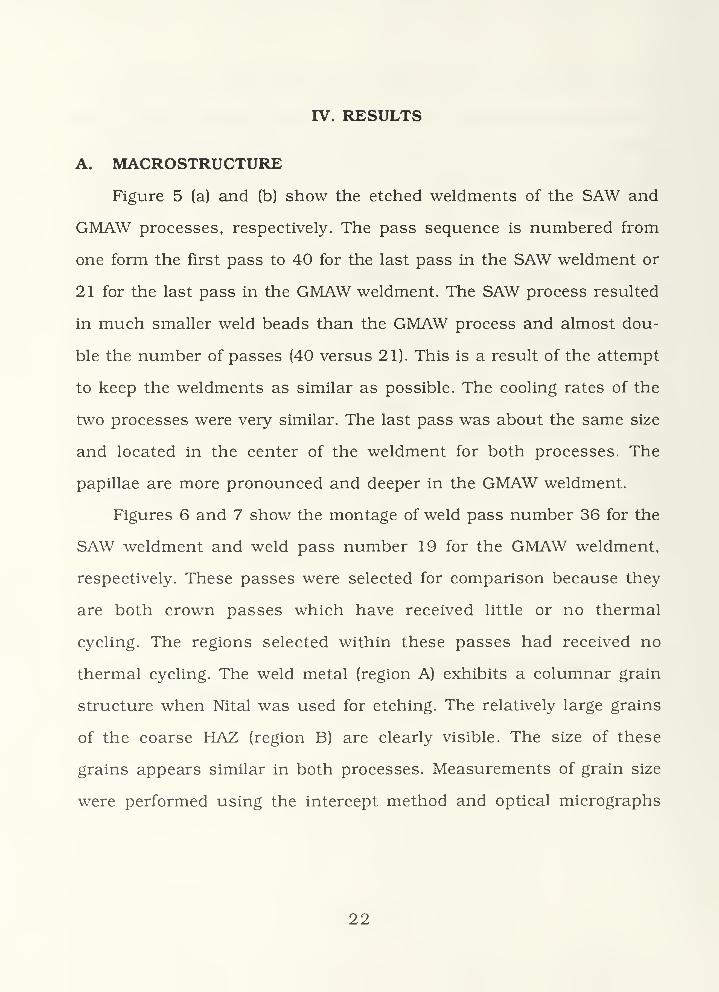
A. MACROSTRUCTURE
Figure 5 (a) and (b) show the etched weldments of the SAW and
GMAW processes, respectively. The pass sequence is numbered from
one form the first pass to 40 for the last pass in the SAW weldment or
21 for the last pass in the GMAW weldment. The SAW process resulted
in much smaller weld beads than the GMAW process and almost dou-
ble the number of passes (40 versus 21). This is a result of the attempt
to keep the weldments as similar as possible. The cooling rates of the
two processes were very similar. The last pass was about the same size
and located in the center of the weldment for both processes. The
papillae are more pronounced and deeper in the GMAW weldment.
Figures 6 and 7 show the montage of weld pass number 36 for the
SAW weldment and weld pass number 19 for the GMAW weldment,
respectively. These passes were selected for comparison because they
are both crown passes which have received little or no thermal
cycling. The regions selected within these passes had received no
thermal cycling. The weld metal (region A) exhibits a columnar grain
structure when Nital was used for etching. The relatively large grains
of the coarse HAZ (region B) are clearly visible. The size of these
grains appears similar in both processes. Measurements of grain size
were performed using the intercept method and optical micrographs
22

1 C^'M & J:7C
(a)
S^5^p¥$&S5^^&"^$SS
III
(b)
Figure 5. Etched Weldments of (a) SAW and (b) GMAW Processes
23
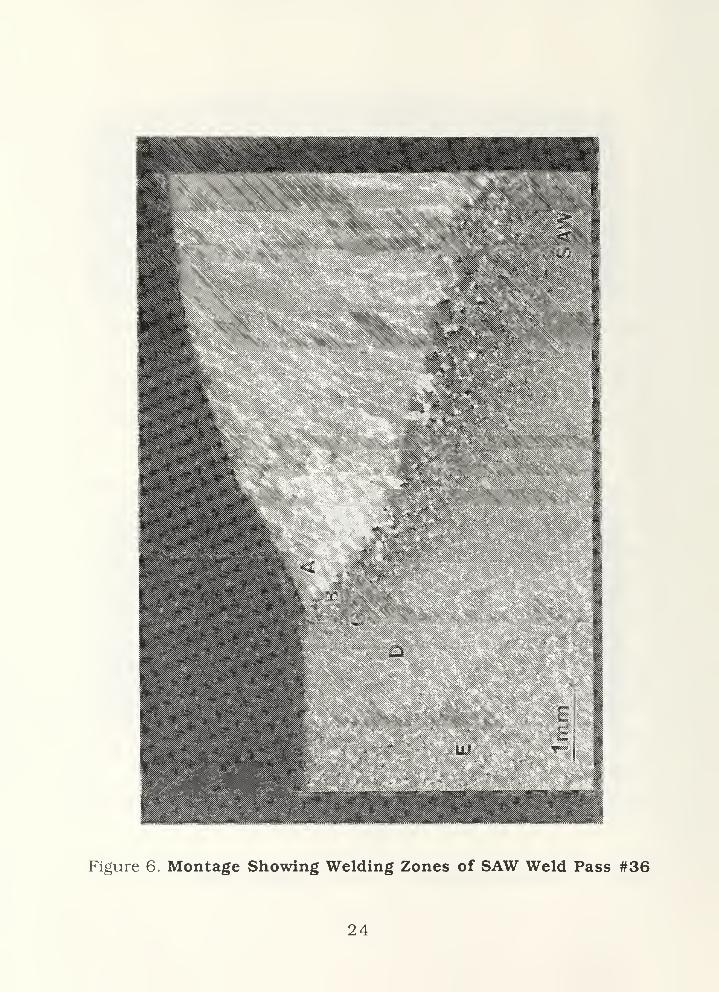
Figure 6. Montage Showing Welding Zones of SAW Weld Pass #36
24

m
Figure 7. Montage Showing Welding Zones of GMAW Weld Pass #19
25

at 500x of the coarse HAZ close to the fusion line. The average grain
size was 26 (im in the SAW sample and 30 \xm in the GMAW sample,
which confirmed that the two processes had a similar grain size. It is
seen that the grains become much finer, moving from the fusion line
toward the base metal. The fine HAZ is marked as region D, while the
base metal is marked as region E. The HAZ is narrower at the crown of
the weldment and widens toward the root. It appears that the HAZ
thickness is greater in the GMAW process.
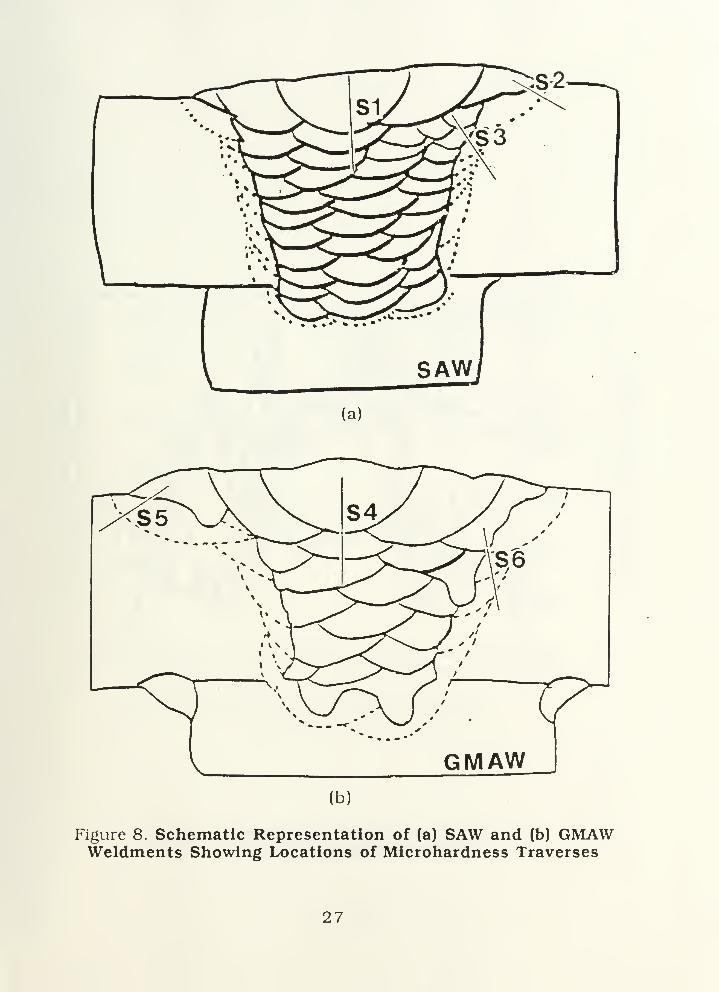
B. MICROHARDNESS MEASUREMENTS
Figure 8 is a schematic representation of the weldments pro-
duced by the SAW and GMAW processes to indicate the location of the
microhardness traverses. Scribes SI and S4 are through the center
region of the two welds; scribes S2 and S5 are across single-weld
passes of no or little thermal cycling (pass number 36 for SAW and
pass number 19 for GMAW), and scribes S3 and S6 are across HAZ
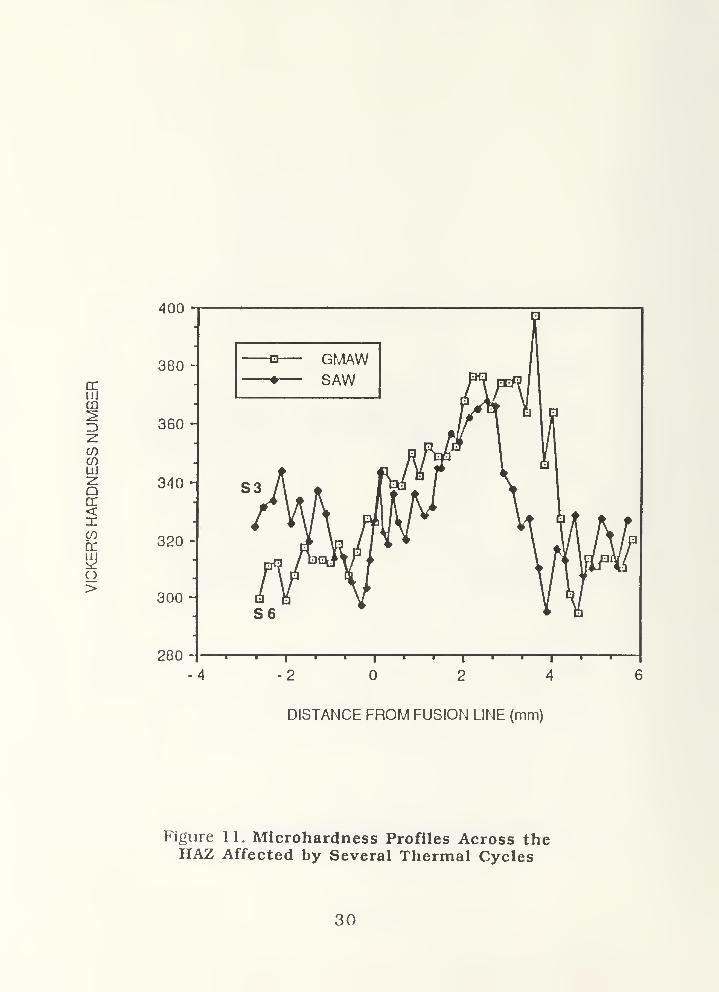
regions which have experienced considerable thermal cycling. Figures
9, 10, and 11 show the resulting Vicker's microhardness profiles for
the scribes through the weld center, across the HAZ of the single
pass, and across the thermally cycled HAZ region, respectively.
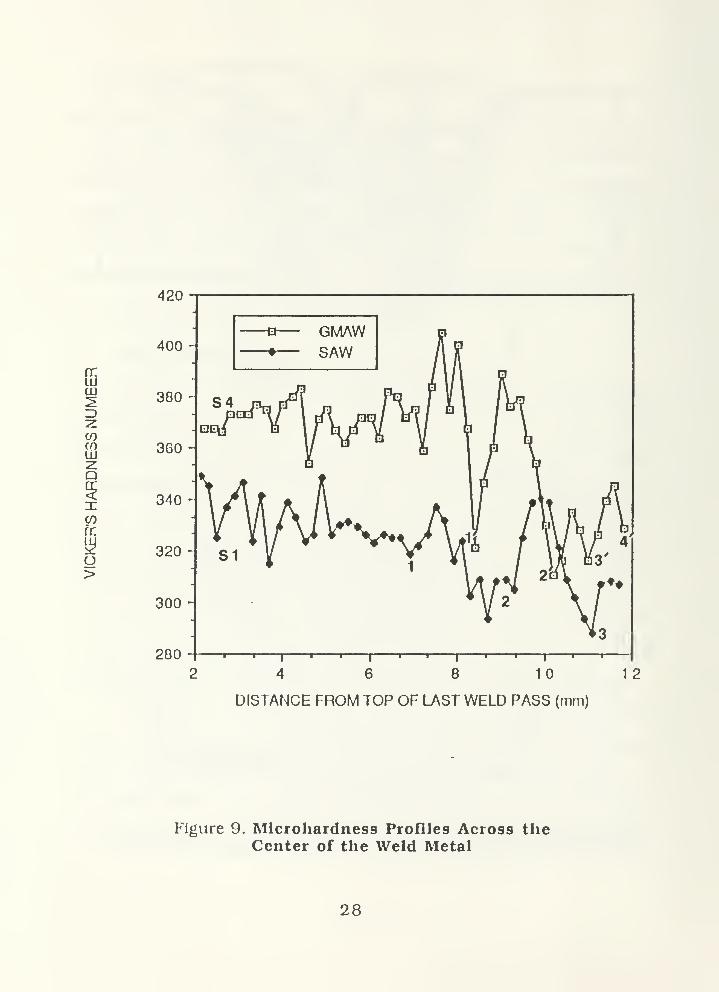
The profiles through the weld metal (Figure 9) show a major dif-
ference between the two processes in that the GMAW weld metal is
substantially harder. The last pass of each sample extends about seven
millimeters from the crown of the weld to the root of the last pass
(indicated by "1" on the profiles). The average hardness of the last
26
(a)
(b)
Figure 8. Schematic Representation of (a) SAW and (b) GMAWWeldments Showing Locations of Microhardness Traverses
27
llj
CD
V)inill
n:
COn:
o>
420
400 -
380 -
360 -
340
320
300 -
280
2 4 6 8 10 12
DISTANCE FROM TOP OF LAST WELD PASS (mm)
Figure 9. Microhardness Profiles Across theCenter of the Weld Metal
28

LUm
c/)
inLU
Q
Ienfie
o>
420
400 -
380 -
360 -
340 -
320 -
300
280
GMAWSAW
—i 1 1 1 1 p
2 2
t 11 r
DISTANCE FROM FUSION LINE (mm)
Figure 10. Microhardness Profiles Across theHAZ of a Single-Weld Pass
29
HiCD
z(I)
inLU
5</)
DC
O>
400
380 -
360 -
340 -
320 -
300 -
280
DISTANCE FROM FUSION LINE (mm)
Figure 11. Microhardness Profiles Across theHAZ Affected by Several Thermal Cycles
30

pass is 371 VHN for the GMAW sample and 333 VHN for the SAW
sample. The hardness profiles decrease to minimum points at loca-
tions numbered 1, 2, 3, and 4, which correlate with the intersection
of two heat zones. The average hardness is reduced for each previous
weld pass, as seen in Figure 9.
The microhardness profiles across the HAZ in Figure 10 indicate
that both processes follow the same hardness trend in the similar
single-pass region. The hardness drops at the fusion line, then sharply
increases through the HAZ, displaying two distinct levels. The first
plateau identifies the coarse HAZ while the higher second plateau
identifies the fine HAZ. The hardness reaches a maximum in the fine
HAZ, sharply decreases at the end of the visible HAZ, and then reaches
a steady value of approximately 317 VHN in the base metal. The GMAW
sample exhibits a much larger decrease in hardness at the fusion line
than the SAW sample. The GMAW sample is slightly harder throughout
the HAZ, reaching a maximum hardness of 406 VHN compared to a
maximum of 385 VHN for the SAW process. It is coincidental that the
width of the HAZ is approximately 3.4 mm for both processes at the
location of S2 and S4. In general, however, the width of the HAZ varies
significantly with the location in the HAZ and the angle of the scribe.
The slope of the hardness profile, when passing from the fine HAZ
into the base metal, is about the same. A pronounced difference was,
however, observed in the hardness of the weld metal.
With repeated thermal cycling, the profiles across the HAZ
(Figure 11) exhibited a similar microhardness trend as the profiles
31

with no thermal cycling (Figure 10). The hardness in both processes
decreases at the fusion line, increases at about the same slope
throughout the HAZ, and decreases with the same slope to a steady
value of about 316 VHN in the base metal. The maximum hardness in
the fine HAZ was 397 VHN for the GMAW process and 367 VHN for
the SAW process.
Rockwell C hardness measurements taken in the base metal indi-
cated an average hardness of 42 Re.
Five distinct regions characterized by the microhardness trends
of Figures 9 and 10 were selected for microstructural investigation.
These regions are:
a base metal (region E),
b. weld metal of last pass (pass numbers 40 and 21),
c. weld metal close to coarse HAZ (region A)
d. coarse HAZ (region B), and
e. fine HAZ (region D).
The region labeled C on Figures 6 and 7 was an intermediate
region of the HAZ. There was not a distinct transition between the
coarse HAZ and fine HAZ, so it was difficult to correlate this location
between the SAW and GMAW weldments. For this reason, no micro-
structural analysis was done at this location.
C. MICROSTRUCTURAL CHARACTERIZATION
The selected regions were examined using optical, scanning, and
transmission electron microscopy. The microstructure of the base
32

metal, weld metal, and HAZ of the SAW and GMAW processes were
characterized and compared.
1. Optical Microscopy
Optical micrographs of the SAW and GMAW weldments across
the HAZ of the passes illustrated in Figure 6 and 7 are compared in
Figures 12 through 15. The weld metal of both processes (Figure 12)
appeared to have a fine martensitic-bainitic structure. Some polygonal
ferrite can be seen and is indicated in the GMAW micrograph. The
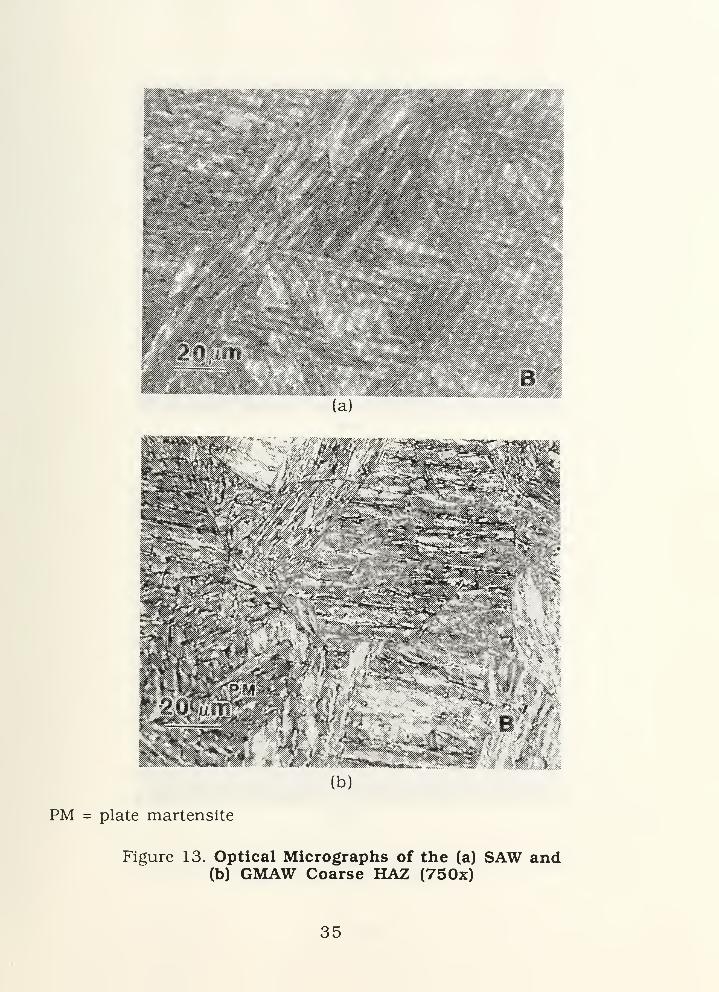
coarse HAZ of both weldments (Figure 13) consisted predominantly of
a lath martensite structure, although in some areas a bainitic structure
was also present. Packets of martensite containing parallel laths can be
readily resolved within the coarse prior austenite grain boundaries.
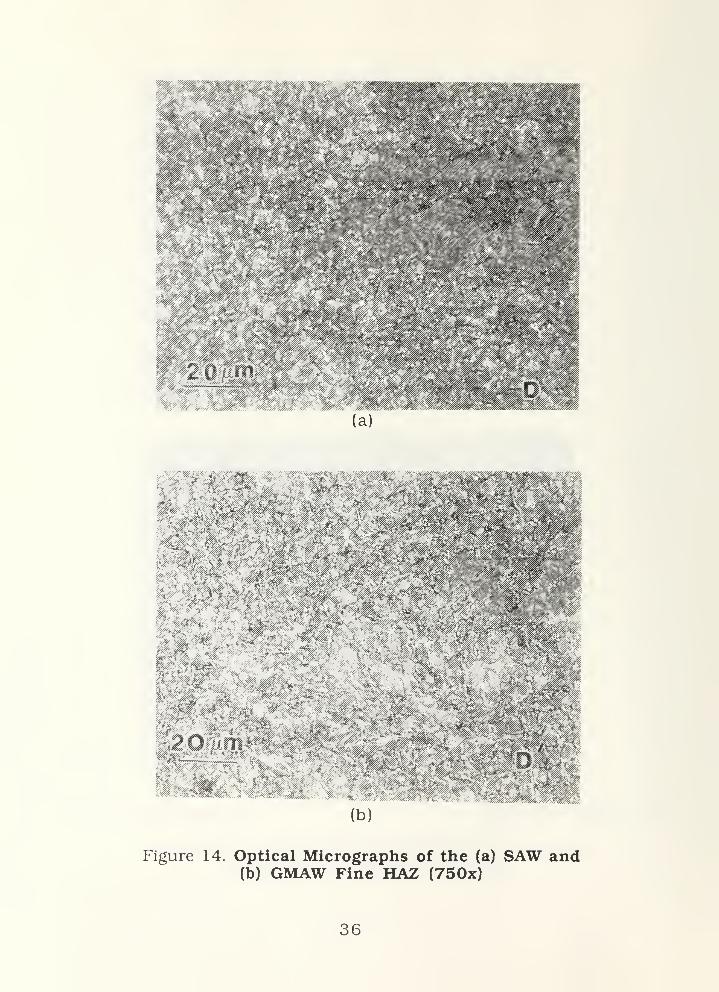
Some plate martensite was occasionally found. The fine HAZ in both
processes (Figure 14) consisted of a much finer martensitic-bainitic
structure, but the prior austenite grain boundaries were not delineated
in this zone by the two-percent Nital etching technique used. The
microstructure of the base metal (Figure 15) consisted of a tempered
martensite-bainite duplex structure.
2. Scanning Electron Microscopy (SEM)
SEM was employed because it was difficult to distinguish
between the microstructural differences between the two welding
processes under optical examination. SEM was performed in the weld
metal to observe any microstructural difference corresponding to the
variations in hardness. SEM micrographs taken along traverses SI and
33
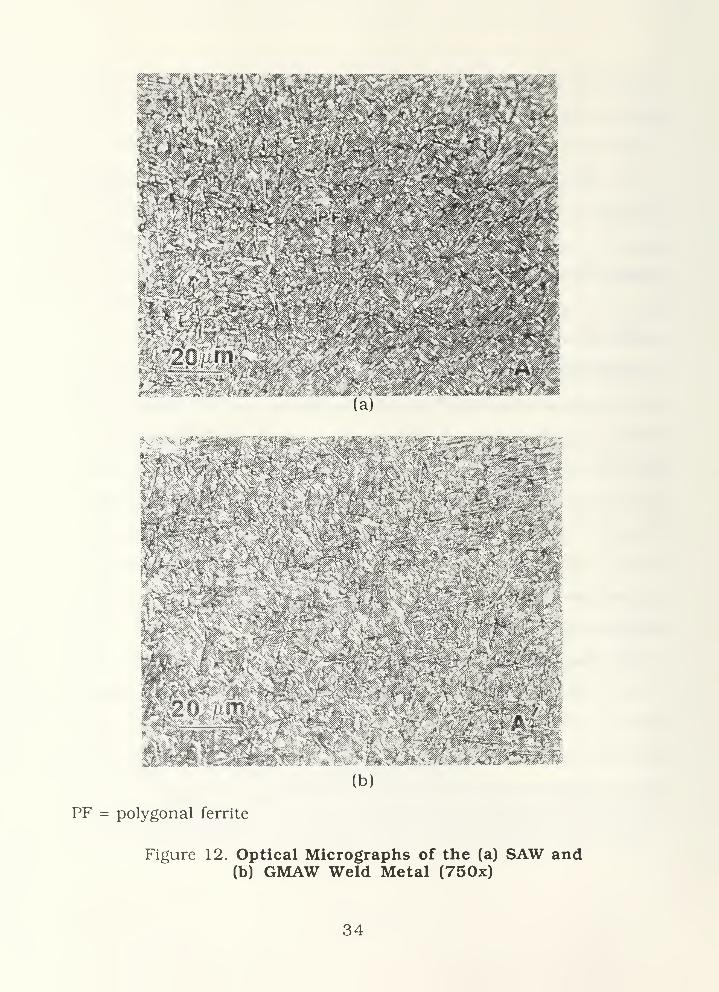
PF = polygonal ferrite
Figure 12. Optical Micrographs of the (a) SAW and(b) GMAW Weld Metal (750x)
34
WWM^iMM WMMB,
wM(a)
PM = plate martensite
Figure 13. Optical Micrographs of the (a) SAW and(b) GMAW Coarse HAZ (750x)
35
I
(a)
Wi irar
.,.,; WHS
:;'<s* *Wlizm»
'"i?s
4§¥-<
W 5-. &'%&;&,< - ''
"•'-^V*:
'<*f .: -'"^it^
(b)
M*mm<£.
Figure 14. Optical Micrographs of the (a) SAW and(b) GMAW Fine HAZ (750x)
36

(a)
Figure 15. Optical Micrographs of the (a) SAW and(b) GMAW Base Metal (750x)
37

S4 at the maximum, average, and minimum hardness points are shown
in Figures 16, 17, and 18, respectively. The hardness values at these
locations were 352, 333, and 288 VHN for the SAW process and 405,
373, and 301 for the GMAW process (Figure 9). Both samples showed
a similar lath structure, but the GMAW weld metal appeared to have a
more defined lath morphology. Even at the SEM resolution level,
comparison between the weld metal structures of the two welding
processes was found to be difficult. For this reason, SEM was not com-
pleted on regions B, C, D, and E.
3. Transmission Electron Microscopy (TEM)
TEM was performed on the same five regions described in
the microhardness section and representative microstructures are
shown in Figures 19 through 23. In general, both weldments showed
the similar microconstituents, but the relative amounts of the micro-
constituents varied from one weldment to another. Typical micro-
structures included tempered and autotempered martensite, lath
martensite, bainite, retained austenite between the laths, and polygo-
nal ferrite. The microstructure of the GMAW weld metal consisted of
more lath martensite and was finer than the SAW weld metal. The
microstructure throughout the HAZ of the two welding processes was
very similar.
a. Base Metal
Figure 19(a) is a typical micrograph of the base metal
region showing the tempered lath martensite structure. Signs of
38

Figure 16. SEM Micrographs Taken at the MaximumMicrohardness Location of the Weld Metal of the Last Pass
for (a) SAW and (b) GMAW (approx. 2,000x)
39
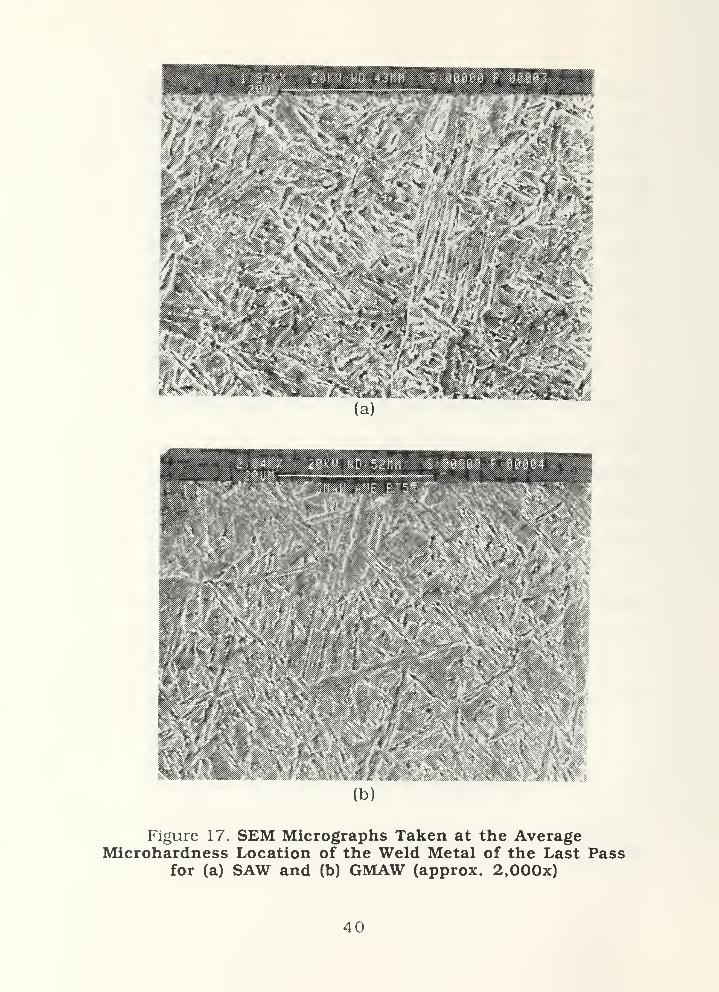
1111 11111
Figure 17. SEM Micrographs Taken at the AverageMicrohardness Location of the Weld Metal of the Last Pass
for (a) SAW and (b) GMAW (approx. 2,000x)
40

(b)
Figure 18. SEM Micrographs Taken at the MinimumMicrohardness Location of the Weld Metal of the Last Pass
for (a) SAW and (b) GMAW (approx. 750x)
41

R = recoveryP = precipitates
D = high dislocation density
AM = autotempered martensiteC = cementite
Figure 19. TEM Micrographs in the Base Metal
42

(c)
Figure 19. TEM Micrographs in the Base Metal (continued)
43
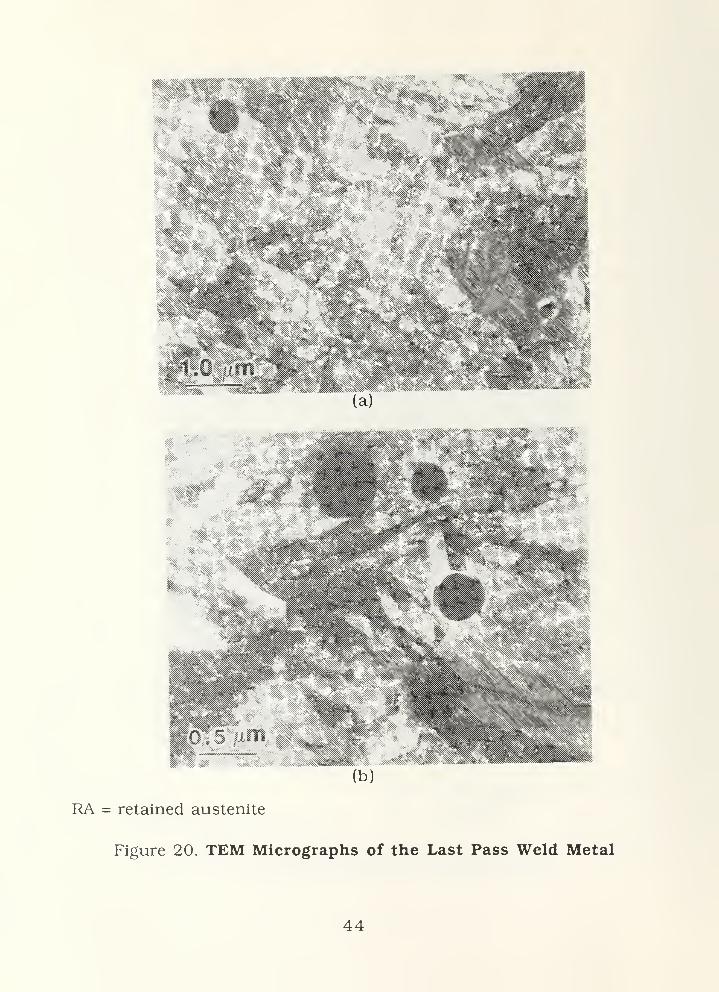
(a)
RA = retained austenite
Figure 20. TEM Micrographs of the Last Pass Weld Metal
44

1
II
'mP
5 5!llPlt
Figure 20. TEM Micrographs of the Last Pass Weld Metal(continued)
45

m ., SSf '¥ nS?''::sSS8&s;
dip
T = twinned martensite
Figure 2 1 . TEM Micrographs of Weld Metal Close to Fusion Lineof SAW Pass #36 and GMAW Pass #19
46

'.N%-
m
9w<:*
1HI
i ill
, ;#
--.;
"llr'
(C)
llPf
%
Figure 2 1 . TEM Micrographs of Weld Metal Close to Fusion Lineof SAW Pass #36 and GMAW Pass #19 (continued)
47
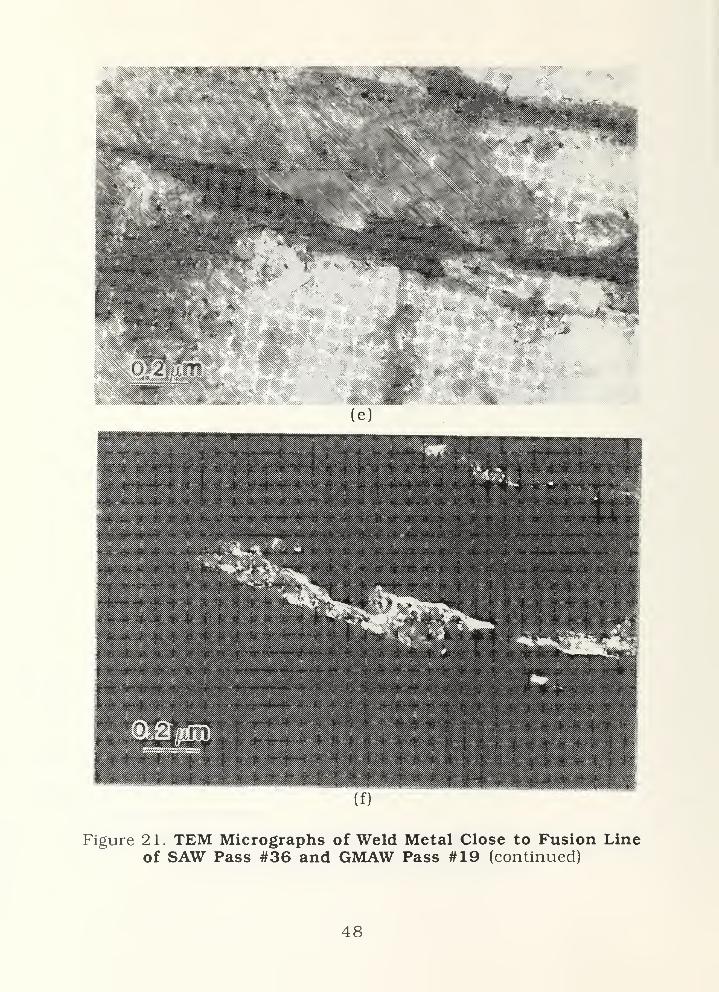
...
(e)
Figure 2 1 . TEM Micrographs of Weld Metal Close to Fusion Lineof SAW Pass #36 and GMAW Pass #19 (continued)
48

Si: jv>^:.
Figure 22. TEM Micrographs of the Coarse HAZ
49

(d)
Figure 22. TEM Micrographs of the Coarse HAZ (continued)
50
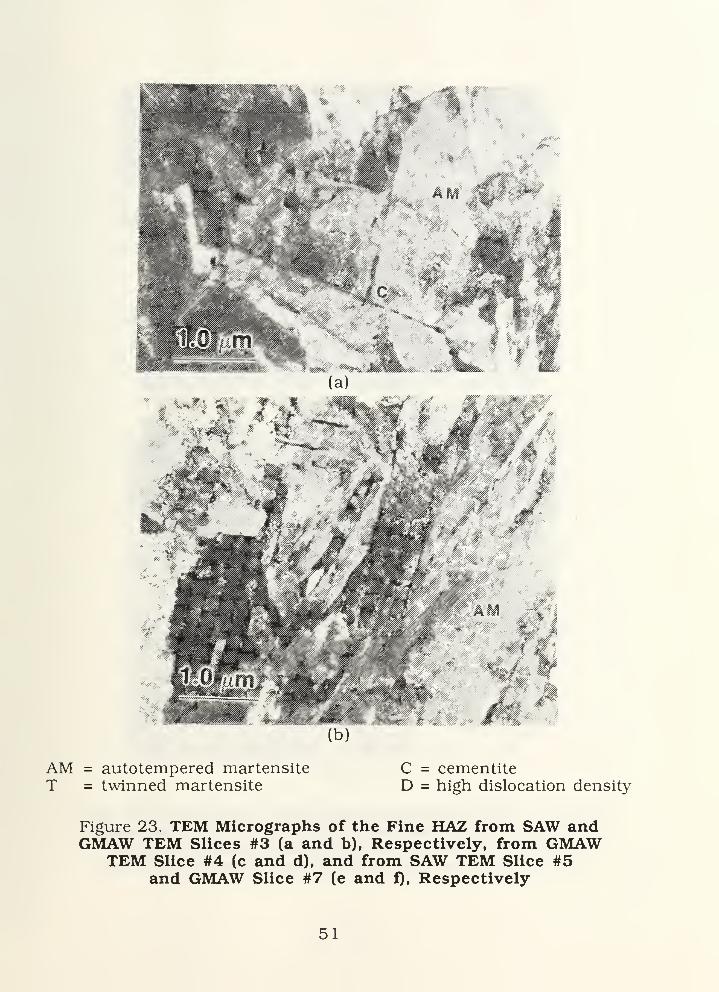
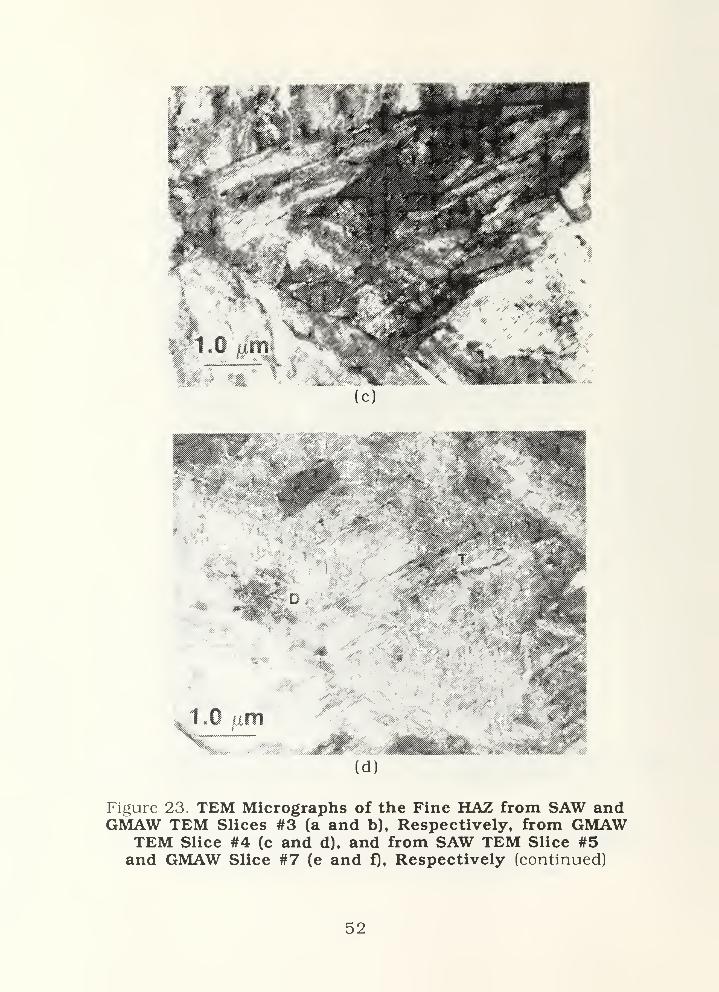
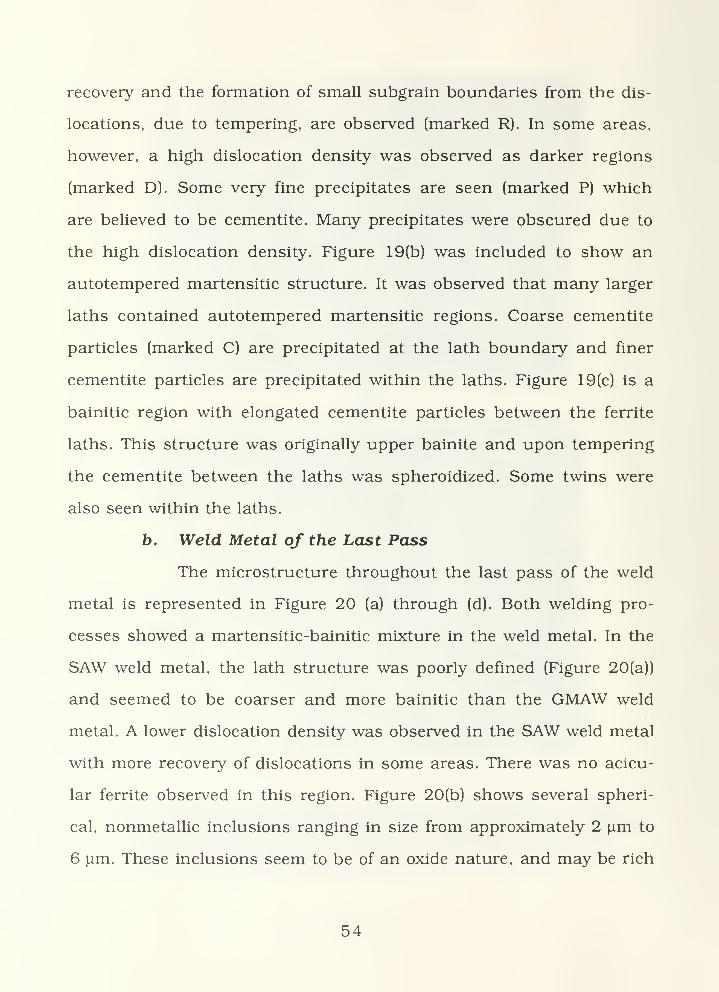
AM = autotempered martensiteT = twinned martensite
C = cementiteD = high dislocation density
Figure 23. TEM Micrographs of the Fine HAZ from SAW andGMAW TEM Slices #3 (a and b), Respectively, from GMAW
TEM Slice #4 (c and d), and from SAW TEM Slice #5and GMAW Slice #7 (e and f), Respectively
51
vim ,/M?
(d)
Figure 23. TEM Micrographs of the Fine HAZ from SAW andGMAW TEM Slices #3 (a and b), Respectively, from GMAW
TEM Slice #4 (c and d), and from SAW TEM Slice #5and GMAW Slice #7 (e and f), Respectively (continued)
52

Figure 23. TEM Micrographs of the Fine HAZ from SAW andGMAW TEM Slices #3 (a and b), Respectively, from GMAW
TEM Slice #4 (c and d), and from SAW TEM Slice #5and GMAW Slice #7 (e and f), Respectively (continued)
53
recovery and the formation of small subgrain boundaries from the dis-
locations, due to tempering, are observed (marked R). In some areas,
however, a high dislocation density was observed as darker regions
(marked D). Some very fine precipitates are seen (marked P) which
are believed to be cementite. Many precipitates were obscured due to
the high dislocation density. Figure 19(b) was included to show an
autotempered martensitic structure. It was observed that many larger
laths contained autotempered martensitic regions. Coarse cementite
particles (marked C) are precipitated at the lath boundary and finer
cementite particles are precipitated within the laths. Figure 19(c) is a
bainitic region with elongated cementite particles between the ferrite
laths. This structure was originally upper bainite and upon tempering
the cementite between the laths was spheroidized. Some twins were
also seen within the laths.
b. Weld Metal of the Last Pass
The microstructure throughout the last pass of the weld
metal is represented in Figure 20 (a) through (d). Both welding pro-
cesses showed a martensitic -bainitic mixture in the weld metal. In the
SAW weld metal, the lath structure was poorly defined (Figure 20(a))
and seemed to be coarser and more bainitic than the GMAW weld
metal. A lower dislocation density was observed in the SAW weld metal
with more recovery of dislocations in some areas. There was no acicu-
lar ferrite observed in this region. Figure 20(b) shows several spheri-
cal, nonmetallic inclusions ranging in size from approximately 2 |j.m to
6 |im. These inclusions seem to be of an oxide nature, and may be rich
54

in Si or Mn [Ref. 16]. Inclusions, although present in similar numbers
and sizes in both processes, were not observed in high densities. The
GMAW weld metal showed a finer lath martensite structure, as seen in
Figure 20(c). The second phase regions present between the marten-
site laths, in Figure 20(d), are probably retained austenite. The low-
angle grain boundaries between the laths and areas of higher
dislocation density are seen in the GMAW weld metal.
c. Weld Metal Close to Coarse HAZ
The microstructure of the weld metal close to the coarse
HAZ was similar to that observed in the last pass weld metal. Figure
2 1 (a) shows a coarse bainitic structure representative of the SAW weld
metal. Signs of dislocation recovery are again seen in some localized
regions. In the SAW sample, more polygonal ferrite was seen. The
morphology of the GMAW weld metal consisted predominantly of lath
martensite (Figure 21(b)). Twins were present in the weld metal of
both samples, but the GMAW weld metal seemed to contain larger
amounts. Representative bright and dark field TEM micrographs of
twinned martensite observed in the GMAW weld are shown in Figure
21 (c) and (d). Retained austenite was present between the martensite
or ferrite laths of both samples but appeared more frequently in the
GMAW weld metal. Figure 21 (e) and (f) are bright field and dark field
micrographs showing retained austenite between the laths. The dark
field micrograph shows the austenite phase illuminated using a (002)y
diffraction spot. These two micrographs were taken in the SAW sam-
ple but are representative of both processes.
55
d. Coarse HAZ
The microstructures seen throughout the HAZ of the two
samples were very similar, consisting of a martensitic-bainitic struc-
ture with a large amount of autotempered martensite. The SAW sample
seems to be coarser, containing more bainite than the GMAW micro-
structure (Figure 22(a)). Figure 22(b) suggests that the GMAW sample
is a finer structure containing more martensite than the SAW sample.
Figure 22(c) shows the bainitic structure of the SAW heat-affected
zone containing the intralath cementite particles. Figure 22(d) shows
a large region of lower bainite in the GMAW heat-affected zone. Both
samples revealed some retained austenite between parallel laths as
well as twinned martensite within the laths.
e. Fine HAZ
The microstructures throughout the fine HAZ were sim-
ilar for the two welding processes. Figure 23 (a) and (b) show the sim-
ilar morphologies in the micrographs from the third TEM slices of the
SAW and GMAW samples, located at approximately 1.6 mm and
1.2 mm from the fusion line, respectively. Figure 23(a) shows tem-
pered martensite and some autotempered martensite with cementite
particles precipitated between the laths at the prior austenite grain
boundary. Figure 23 (c) and (d) are from the fourth TEM slice of the
GMAW sample, located approximately 1.6 mm from the fusion line.
Figure 23(c) shows a packet of fine parallel lath martensite which is
heavily dislocated. Figure 23(d) shows a large autotempered marten-
site lath, containing some twins. Figure 23 (e) and (f) shows the
56
microstructure from the fifth SAW slice and the seventh GMAW slice
(located approximately 2.7 mm and 2.8 mm, respectively, from the
fusion line), which correspond to location D on the microhardness
profile of Figure 10. The same autotempered martensite structure is
seen in these last slices as the third slices.
57

V. DISCUSSION
Differences in the microstructure of the two weldments could not
be readily resolved using optical and scanning electron microscopy
(SEM). Transmission electron microscopy (TEM), however, allowed
the differences to be observed and compared.
The microhardness profiles across the weld center and HAZ were
used to identify where differences in microstructure might be
expected. The subsequent microstructural characterizations tended to
correlate with the microhardness profiles.
The microhardness profiles through the weld metal (Figures 9
and 10) indicated that the GMAW weld metal was generally harder
than the SAW weld metal. The weld metal hardness across the region
of repeated thermal cycling (Figure 11) does not, however, seem to
follow the same trend of weld metal hardness. Figure 1 1 indicates that
the weld metal of the SAW process is harder than the GMAW weld
metal, but a meaningful comparison of the weld metal hardness in this
region can only be performed if the effect of the subsequent thermal
cycling experienced is carefully examined. This was not attempted,
hence no comparison was made. The weld metal of the GMAW sample
was harder and generally exhibited a finer, martensitic lath structure,
while the weld metal of the SAW weldment was not as hard and con-
sisted of a coarser, more bainitic lath structure (Figures 20 and 21).
Similar microstructures were also observed by Challenger, et al. [Ref.
58

18] in a comparative study of SAW and GMAW processes on HY-100
steel weldments. Generally, upper bainite is considered to be less
tough than tempered martensites of similar composition and
strengths [Ref. 19]. Nahlor and Krahe [Ref. 19] found that in a 0.1 per-
cent C, 1/2 Mo-B steel, decreasing the austenite grain size resulted in
a decreased bainite packet size and increased toughness. This indi-
cates that the toughness of the SAW weldment may be greater than the
GMAW weldment due to the more bainitic structure of the SAW
sample.
Both profiles across the weld metal center revealed the average
hardness to be highest in the last pass, which was not affected by sub-
sequent thermal cycles. The average hardness of previous passes
decreased due to the tempering by subsequent passes. The minimum
hardness values on the profile occurred at intersections of two heat
zones which were regions which experienced a greater amount of
tempering.
The microhardness across the heat-affected zones (Figure 10) of
the two processes was very similar and is in agreement with the
observations of similar microstructures throughout the HAZ (Figure
23). The microstructure of the HAZ in both processes was of a
bainitic-martensitic duplex structure with large amounts of autotem-
pered martensite. The GMAW weldment showed a much larger
decrease in hardness at the fusion line than the SAW weldment
(Figure 10). The reason for this is not quite understood, but it may be
attributed to the higher heat input of the GMAW process. The
59
maximum hardness values of the fine HAZ were higher for the profiles
across the single-pass HAZ (Figure 10) than for the profiles across the
thermally cycled HAZ (Figure 11). The difference in maximum hard-
ness can be attributed to the increased amount of tempering of the
thermally cycled region which results in softening. The base metal
hardness of the four profiles across the HAZ was the same.
The SEM micrographs of the weld metal of the last pass showed a
refinement in microstructure as the hardness increased with the
finest structure occurring at the maximum hardness location (Figures
16 and 18). The location of maximum hardness was closest to the
weld crown and the location of minimum hardness was near the root
of the last pass. This can be attributed to the higher cooling rate at the
crown of the weld, where it is largely air cooled, whereas the bottom
of the pass has a lower cooling rate.
TEM provided further analysis of the microstructures present.
The GMAW weld metal seemed to contain a larger amount of retained
austenite between the laths and a larger amount of twinned marten-
site. As ferrite forms, the carbon content of the remaining austenite is
increased, which leads to the formation of twinned martensite and/or
the retention of some high-carbon austenite. Twinned martensite is
unlikely to form unless the carbon content of austenite exceeds about
0.2 percent [Ref. 20]. The observation of twins may indicate that inho-
mogeneities in carbon content existed within the austenite grains
prior to transformation. Such inhomogeneities may be due to an insuf-
ficiently high temperature being reached for homogeneous dissolution
60
of carbides or to insufficient time spent at the high temperature. The
GMAW weld metal in the as-deposited condition has a slightly higher
carbon content (0.074 percent for the GMAW weld metal and 0.055
percent for the SAW weld metal), which would contribute to an
increase in hardness. The SAW weld metal was observed to have more
polygonal ferrite, which is coarse and has a lower carbon content than
martensite, which would also contribute to the lower hardness.
In a study of HY-130 weldments, Chen, et al. [Refs. 21 and 22]
observed that the fine-grained bainitic and ferritic structures were
more resistant to stress corrosion cracking (SCC) than the untem-
pered martensite and twinned martensite structures. It was also
observed [Ref. 22] that the absorption of hydrogen in twinned marten-
site could promote SCC susceptibility and assist in brittle fracture.
Since resistance to SCC is lowered by the presence of untempered and
twinned martensite, the GMAW weld metal would be expected to be
more susceptible to SCC due to its larger amount of twinned marten-
site than the SAW weldment.
The overall effect of retained austenite on properties depends
mainly on the morphology. Webster [Ref. 23] states that the presence
of retained austenite between martensite laths improves the fracture
toughness. According to the same author, the refinement of the
austenite grain size results in increases in strength and SCC resistance
and decreases the fatigue crack growth rate. Thomas [Ref. 24] studied
the effect of retained austenite in medium carbon alloy steels and
found that thermally stable retained austenite films between
61

martensite laths can be beneficial for fracture toughness properties.
Ritchie, et al. [Ref. 25] found that the stress corrosion crack velocity
through martensite is reduced upon intersection of the retained
austenite. Kim, et al. [Ref. 26] found that, in 5.5 Ni steel, austenite
precipitated on the martensite laths decreases the toughness in the
presence of hydrogen by increasing the severity of hydrogen embrit-
tlement. Relating the results of previous work to this study, the
retained austenite present in both weldments might be expected to
increase the toughness of the weldments. The GMAW weldment might
have a larger increase in toughness due to the greater amounts of
interlath retained austenite present.
Several authors [Refs. 13, 15, and 16] have discussed the signifi-
cant effect of fine nonmetallic inclusions on the nucleation of acicular
ferrite. The low density of inclusions observed in this study might have
had some effect on the absence of acicular ferrite in the GMAW and
SAW weldments. The as-deposited weld metal composition has a
higher amount of Mn (about 1.45 percent) and Si (about 0.38 percent)
than Al (0.003 percent in the SAW or 0.014 percent in the GMAW
sample). Bhatti, et al. [Ref. 15] observed that higher amounts of acicu-
lar ferrite were associated with Al-rich inclusions and lower amounts
of acicular ferrite were associated with Mn-rich inclusions. This leads
to the speculation that the inclusions of the two weldments under
study, although not chemically analyzed, should be richer in Mn and Si
rather than of an Al-rich nature. The as-deposited weld metal compo-
sition of the weldments indicates less than 0.005 percent S and an
62
oxygen content of 0.019 percent in the GMAW and 0.028 percent in
the SAW samples. Weld metal compositions containing a higher oxygen
and sulfur content generally contain a larger number of inclusions
[Ref. 18]. The low density of inclusions in the SAW and GMAW weld
metals can be a result of the low sulfur and oxygen contents.
It is seen that the differences in microstructure of the SAW and
GMAW weldments tended to correlate with the microhardness pro-
files of the center weld metal and across the HAZ. The observations
made and conclusions drawn were largely in agreement with studies
by previous authors.
63

VI. SUMMARY
The effect of welding processes, gas-metal-arc (GMAW) and sub-
merged-arc (SAW), on the microstructure of HY-130 steel multi-pass
weldments was studied and compared. Microhardness measurements,
optical, scanning, and transmission electron microscopy were used to
characterize the microstructures. The microhardness profiles of the
GMAW and SAW weldments showed the same general trend with the
microstructure throughout the HAZ of a single-pass region showing no
significant differences. The major microstructural and microhardness
differences between the two processes occurred in the weld metal.
The GMAW weld metal consisted of a more predominant martensitic
structure with a finer lath morphology than the SAW weld metal. The
GMAW weld metal also contained more twinned martensite and more
retained austenite. The SAW weld metal has a less-defined lath and
more-bainitic structure. The last-pass weld metal of the GMAW sample
was approximately 40 VHN harder than the SAW sample, so the GMAW
weldment may be expected to have a higher strength. A general
recommendation of one welding process over the other cannot,
however, be made based on the present study because the selection of
welding process depends on a large number of other factors.
64

LIST OF REFERENCES
1. Flax, R. W., Keith, R. E., and Randall, M. D., Welding the HY Steels,
ASTM Special Technical Publication 494, pp. 1-25, 1971.
2. Palko, W. A., Bryne, J. P.. and Zanis, C. A., "Processing of HY-130Steel Castings," American Foundrymeris Society Transactions, v. 84,
pp. 193-202, 1976.
3. David Taylor Naval Ship Research and Development Center ReportSME-85/109, Welding of Thin Section HY-130 Steel ProgressReport, by R. J. Wong, pp. 1-38, January 1986.
4. Grong, O., and Matlock, D. K., "Microstructural Development in
Mild and Low-Alloy Steel Weld Metals," International MetalsReview, v. 31, number 1, pp. 27-45, 1986.
5. British Steel Corporation Research Organization, Weld MetalMicrostructure—A State of the Art Review, by R. C. Cochrane, pp. 1-
8, October 1982.
6. Krauss, G., Principles of Heat Treatment of Steel, pp. 43-83,American Society for Metals, 1980.
7. Thompson, S. W., Colvin, D. J., and Krauss, G., "On the Bainitic
Structure Formed in a Modified A710 Steel," Metallurgical, v. 22,
pp. 1069-1074, 12 March 1988.
8. Easterling, K., Introduction to the Physical Metallurgy of Welding,Butterworths, pp. 150-153, 1983.
9. Therrien, A. E., Characterization of Submerged-Arc and Gas-Metal-Arc Weldments in HY-100 Steel, Master's Thesis, Naval Postgradu-ate School, Monterey, California, December 1983.
10. Metals Handbook, 9th ed., v. 6, pp. 114-181, American Society for
Metals, 1983.
11. Challenger, K. D., Brucker, R. B., Elger, W. M., and Sorek, M. J.,
"Microstructure-Thermal History Correlations for HY-130 ThickSection Weldments," Welding Journal, v. 63 (8), pp. 254s-262s,1984.
65
12. Abson, D. J., and Dolby, R. E., "Microstructural Transformations in
Steel Weld Metals— A Reappraisal," Welding Institute ResearchBulletin 19, pp. 20-206, July 1978.
13. Farrar, R. A., and Harrison, P. L., "Review Acicular Ferrite in Car-bon-Manganese Weld Metals: An Overview," Journal of MaterialsScience, v. 22, pp. 3812-3820, April 1987.
14. Glover, A. G., McGrath, J. T., Tinkler, M. J., and Weatherly, G. C.,
"The Influence of Cooling Rate and Composition on Weld MetalMicrostructures in a C/Mn and a HSLA Steel," Welding ResearchSupplement, v. 55, pp. 267s-273s, 1976.
15. Bhatti, A. R., Saggese, M. E., Hawkins, D. N., Whiteman, J. A., andGolding, M. S., "Analysis of Inclusions in Submerged Arc Welds in
Microalloyed Steels," Welding Journal, v. 63 (7), pp. 224s-230s,July 1984.
16. Lui, S., and Olson, D. L., "The Role of Inclusions in ControllingHSLA Steel Weld Microstructures," Welding Research Supplement,v. 65, pp. 139s-149s, June 1986.
17. Ricks, R. A., Barritte, G. S., and Howell, P. R., 'The Influence of
Second Phase Particles on Diffusional Phase Transformations in
Steels," Proceedings of International Conference on Solid StatePhase Transformations, pp. 463-468, 1981.
18. Deb, P., Challenger, K. D., and Therrien, A. E., "Structure-Prop-erty Correlation of Submerged-Arc and Gas-Metal-Arc Weldmentsin HY-100 Steel," Metallurgical Transactions, v. 18A, pp. 987-997,June 1987.
19. Naylor, J. P., and Krahe, P. R., "The Effect of the Bainite PacketSize on Toughness," Metallurgical Transactions, v. 5, pp. 1699-1701, July 1974.
20. Speich, G. R., and Leslie, W. C, "Tempering of Steel," Metallurgi-cal Transactions, v. 3, pp. 1043-1054, May 1972.
21. Chen, C, Thompson, A. W., and Bernstein, I. M., 'The Correlationof Microstructure and Stress Corrosion Fracture of HY-130 Steel
Weldments," Metallurgical Transactions, v. 1 1A, pp. 1723-1730,October 1980.
66
22. Chen, C, Thompson, A. W., and Bernstein, I. M., "Microstructureand Stress Corrosion Cracking of HY-130 Steel Weldments,"paper presented at the Bolton Landing Conference, 5th, Schenec-tady, New York, 1979.
23. Webster, D., "Development of a High Strength Stainless Steel withImproved Toughness and Ductility," Metallurgical Transactions,v. 2, pp. 2097-2114, August 1971.
24. Thomas, G., "Retained Austenite and Tempered MartensiteEmbrittlement," Metallurgical Transactions, v. 9A, pp. 439-450March 1978.
25. Ritchie, R. O., Castro Cedeno, M. H., Zackay, V. F., and Parker, E.
R., "Effects of Silicon Additions and Retained Austenite on StressCorrosion Cracking in Ultrahigh Strength Steels," MetallurgicalTransactions, v. 9A, pp. 35-52, January 1978.
26. Kim, Y. H., Kim, H. J., and Morris. J. W., Jr., "The Influence of
Precipitated Austenite on Hydrogen Embrittlement in 5.5 Ni
Steel," Metallurgical Transactions, v. 17A, pp. 1157-1164, July1986.
67
INITIAL DISTRIBUTION LIST
No. Copies
1. Defense Technical Information Center 2Cameron StationAlexandria, VA 22304-6145
2. Library, Code 0142 2Naval Postgraduate SchoolMonterey, CA 93943-5002
3. Department Chairman, Code 69Hy 1
Department of Mechanical EngineeringNaval Postgraduate SchoolMonterey, CA 93943-5000
4. Dr. Saeed Saboury 2P. O. Box 51922Pacific Grove, CA 93950
5. Dr. J. M. B. Losz, Code 69Lo 2Department of Mechanical EngineeringNaval Postgraduate SchoolMonterey, CA 93943-5000
6. Professor T. R. McNelley, code 69Mc 1
Department of Mechanical EngineeringNaval Postgraduate SchoolMonterey, CA 93943-5000
7. Mr. Paul W. Holsberg, Code 2815 1
David Taylor Naval Ship Researchand Development Center
Annapolis, MD 21402-5067
8. Mr. G. L. Franke, Code 2815 1
David Taylor Naval Ship Researchand Development Center
Annapolis. MD 21402-5067
68

9. Mr. R. J. Wong, Code 2815David Taylor Naval Ship Research
and Development CenterAnnapolis, MD 21402-5067
10. Capt. T. M. McNutt, CF13 Paula CrescentNepean, Ontario, Canada K2H 8Y8
11. Anti-Armour Light Armoured Vehicle Project
National Defence HeadquartersMajor-General George R. Pearks BuildingOttawa, Ontario, Canada K1A 0K2
12. Director Personnel Education and DevelopmentNational Defence HeadquartersMajor-General George R. Pearks BuildingOttawa, Ontario, Canada K1A 0K2
13. Director General Land Engineering and MaintenanceNational Defence HeadquartersMajor-General George R. Pearks BuildingOttawa, Ontario, Canada K1A 0K2
69


DTJi
OOL|̂
Thesi sM268535
1McNutt
The effecf- fProcess on «._
ve^ing—"re^Vf,cro-
3 6 > t-
c
ThesisM268535 McNutt
The effect of weldingprocess on the micro-structure of HY-130steel weldments.
..«,„£