Embed Size (px)
Citation preview

THE EFFECT OF USING A SIX BRICK DUPLO BLOCK GUIDED
PLAY APPROACH ON PRE-SCHOOL LEARNERS’ VISUAL
PERCEPTUAL ABILITIES
SARAH JEMUTAI
AUGUST 2017
THE EFFECT OF USING A SIX BRICK DUPLO BLOCK GUIDED
PLAY APPROACH ON PRE-SCHOOL LEARNERS’ VISUAL
PERCEPTUAL ABILITIES
Sarah Jemutai
Submitted in fulfilment of the requirements for the degree of
Master of Education (Research)
in the Faculty of Education
at the
Nelson Mandela University
Port Elizabeth
South Africa
Supervisor: Professor Paul Webb
Co-Supervisor: Professor David Serem
August 2017


ii
ACKNOWLEDGEMENTS
Thanks to God Almighty for His love that endured, peace of mind, mercy, guidance and good
health all through my beautiful journey that He enabled me complete this study.
To my supervisors, Professor Paul Webb and Professor David Serem, thank you for having
faith in me accepting me as I am. With the many mistakes I made you were always patient.
You encouraged and guided me throughout my studies. The “what do you think” question
always made me reason beyond the obvious. I am indebted to Dr Amina Brey for all her help
and to Professor Kasten Speck for subjecting samples of my statistical analyses for
comparison using the Statistical Package for the Social Sciences (SPSS).
To DAAD for offering me my scholarship under CERMESA which supported me throughout
my two-year study programme, thank you. I will not forget this for a second.
To the founders of CERMESA and the project leaders‟ and coordinators from all the five
universities, thank you for your support. To the principals, teachers, research assistants (the
Psychology students) and learners who participated in this study, a special word of thanks. A
big thank you as well to Kholisa Papu and Mrs Carol Poisat for their encouraging words,
continued support and help at all times. To Professor Violet Opata who has been my mentor
thanks for your guidance and unique concern may God bless you mightily.
I thank my loving husband Wycliffe Kemboi for all the support that he gave me throughout
my studies and for his encouragements, moral support and for being there for me at all times
and for taking care of our children Alvan Kiprotich and Ellany Jepkoech who were always
patient and would always ask; “mummy when will you be coming back?” when I travelled to
South Africa for my studies. Thank you my siblings; Olga, Viola Jeniffer, Judy, Kibet;
Brothers/sisters-in-law for your prayers, sacrifice, support and encouragement.
To my friends Lily, Janet, Ann, Zainabu, Ezekiel and Cornelius for your assistance and
friendship; asante sana.
iii
DEDICATION
I dedicate this study to the late Elizabeth Jeptoo Marus
May your soul rest in peace!
Though out of sight, you will never be out of mind!

iv
ABSTRACT
This study investigated the possible effects that the use of guided play using the 6
Brick Duplo Block approach might have in terms of the development of aspects of visual
perception in pre-literate 5-7year old children. An explanatory sequential mixed-method
design was employed. Seventy-seven Grade R learners in two schools, one in the Republic of
South Africa and the other in the Republic of Kenya, comprised the purposive convenience
sample. Quantitative pre- and post-intervention data were generated using the Visual
Perception Aspects Test (VPAT) and analysed using Excel functions to generate descriptive
and inferential statistics. The pre-test mean score in the Kenyan school was statistically and
practically significantly lower than the South African pre-test mean score. This difference
was attributed to the amount and type of play that took place in the natural settings of these
schools prior to the intervention and the nature and amount of play material available in each.
The largest improvements from the pre- to post-tests occurred in the South African and
Kenyan experimental groups and the difference between them dropped from the 99% level of
confidence in the pre-test to the 95% level of confidence in the post-test. These findings
suggest that using the 6 Brick Duplo Block approach may accelerate the development of
aspects of visual discrimination in pre-literate 5-7-year-old children and that the approach
may be most effective when used with children who have had little previous exposure to
guided play at school. Qualitative data were obtained through open-ended classroom
observations and semi-structured teacher interviews with the experimental group class
teachers. Classroom observation revealed that the learners were enthusiastic about the guided
play and the semi-structured interviews revealed that they realise the importance of using
guided play for developing the visual skills necessary for reading, writing and numeracy. The

v
overall findings of this study suggest that the development of aspects of visual perception
were accelerated in the study sample of pre-literate Grade R learners when their teachers
facilitated guided play using the 6 Brick Duplo Block approach. Recommendations are made
that curriculum developers, early childhood advisors and teachers should be made aware of
the potential of using guided play and reconsider the Piaget‟s stages of cognitive
development to design appropriate instructional materials that promote learners‟ visual
perceptual growth and development.

vi
TABLE OF CONTENTS
CHAPTER 1: INTRODUCTION AND OVERVIEW
1. INTRODUCTION ....................................................................................................... 1
2. BACKGROUND .......................................................................................................... 2
2.1 Play ................................................................................................................................ 3
2.2 Visual Perception ........................................................................................................... 3
2.3. 6 Brick Duplo Block guided play approach ................................................................... 4
3. STATEMENT OF THE PROBLEM ......................................................................... 5
4. RESEARCH AIM AND OBJECTIVES .................................................................... 5
5. RESEARCH QUESTIONS ......................................................................................... 6
6. RESEARCH DESIGN AND METHODS .................................................................. 6
6.1 Research Design............................................................................................................. 7
6.2 Methods.......................................................................................................................... 8
Sample and Setting ......................................................................................................... 8
Research Intervention .................................................................................................... 8
Data Generating Instruments ........................................................................................ 9
Data Generation ............................................................................................................ 9
Data Analysis ............................................................................................................... 10
Validity and Reliability ................................................................................................ 10
7. THEORETICAL AND CONCEPTUAL FRAMEWORKS .................................. 11

vii
8. ETHICAL CONSIDERATIONS .............................................................................. 12
9. OUTLINE OF THE STUDY .................................................................................... 12
CHAPTER 2: LITERATURE REVIEW
1. INTRODUCTION ..................................................................................................... 14
2. EARLY CHILDHOOD DEVELOPMENT ............................................................. 14
3. THE NOTION OF PLAY ......................................................................................... 16
3.1 Importance of play ....................................................................................................... 17
3.2 Forms of play ............................................................................................................... 18
3.3 Play as a primary medium for development ................................................................ 20
3.4 Play and cognitive development .................................................................................. 20
3.5 The role of play in developing reading ........................................................................ 21
3.6 The role of play in developing early mathematical idea .............................................. 23
3.7 Relationship between play and later achievement ....................................................... 25
4. VISUAL PERCEPTION ........................................................................................... 27
5. ASPECTS OF VISUAL PERCEPTION.................................................................. 29
5.1 Visual Discrimination .................................................................................................. 29
Role of visual discrimination in reading and writing .................................................. 30
Role of visual discrimination in mathematics .............................................................. 31
5.2 Visual Memory ............................................................................................................ 31
5.3 Visual Sequential Memory .......................................................................................... 33
6. ROLE OF VISUAL PERCEPTION IN WRITTEN TASKS ................................ 33
7. DEVELOPING VISUAL PERCEPTION ............................................................... 35

viii
8. MEASURING VISUAL PERCEPTION ................................................................. 35
9. SIX BRICK DUPLO BLOCK APPROACH ........................................................... 38
10. CONSTRUCTIONISM ............................................................................................. 40
11. FRAMING THE STUDY .......................................................................................... 43
12. THEORETICAL FRAMEWORK ........................................................................... 44
13. CHAPTER SUMMARY ............................................................................................ 45
CHAPTER 3: RESEARCH DESIGN AND METHODOLOGY
1. INTRODUCTION ..................................................................................................... 47
2. RESEARCH PARADIGMS...................................................................................... 47
2.1 Positivist paradigm....................................................................................................... 49
2.2 Post-positivist paradigm............................................................................................... 50
2.3 Interpretivist paradigm ................................................................................................. 51
2.4 Pragmatic paradigm ..................................................................................................... 52
3. RESEARCH DESIGN AND METHODOLOGY ................................................... 53
3.1 Matching paradigms and methods ............................................................................... 54
3.2 Quantitative methods ................................................................................................... 55
3.3 Qualitative methods ..................................................................................................... 56
Interviews ..................................................................................................................... 56
Classroom observations ............................................................................................... 57
3.4. Mixed-methods ............................................................................................................ 58
3.5 Mixed-Method Designs ............................................................................................... 60
3.6 Explanatory Mixed-Methods Design ........................................................................... 61

ix
3.7 Triangulation ................................................................................................................ 62
4. DESIGN AND METHODS USED IN THIS STUDY ............................................. 63
4.1 Research Aim and Objectives ...................................................................................... 63
4.2 Research Questions ...................................................................................................... 64
4.3 Design .......................................................................................................................... 65
4.4 Setting and sample ....................................................................................................... 66
4.5 Intervention .................................................................................................................. 68
4.6 Data generating instruments ........................................................................................ 69
Visual Perception Aspects Test (VPAT) ....................................................................... 69
Semi-structured interviews........................................................................................... 69
Classroom observation ................................................................................................ 70
4.7 Data generation ............................................................................................................ 70
4.8 Data Analysis ............................................................................................................... 73
5. VALIDITY AND RELIABILITY ............................................................................ 74
Validity and reliability in quantitative research .......................................................... 74
Reliability and validity in qualitative research ............................................................ 75
6. ETHICAL ISSUES .................................................................................................... 76
7. CHAPTER SUMMARY ............................................................................................ 77
CHAPTER 4:RESULTS
1. INTRODUCTION ..................................................................................................... 78
2. QUANTITATIVE DATA .......................................................................................... 78
2.1 Distribution of the test scores ...................................................................................... 79

x
2.2 Overall comparison of pre-test scores from South Africa and Kenya ......................... 81
2.3 Sub-sections of the VPAT test ..................................................................................... 85
Visual Discrimination .................................................................................................. 86
Visual Memory ............................................................................................................. 87
Visual Sequential Memory ........................................................................................... 87
2.4 Gender .......................................................................................................................... 88
2.5 Summary of the quantitative results ............................................................................ 89
3. CLASSROOM OBSERVATIONS ........................................................................... 90
3.1 Availability of play resources ...................................................................................... 90
3.2 Use of play materials ................................................................................................... 91
3.3 Children‟s reactions to the use of play materials ......................................................... 91
3.4 Summary of classroom observations ........................................................................... 92
4. INTERVIEWS ........................................................................................................... 93
4.1. Biographical Information ............................................................................................. 93
4.2 Using the 6 Brick Duplo Block activities .................................................................... 93
4.3 Teachers perceptions of the approach .......................................................................... 97
4.4 Children‟s‟ reaction towards Duplo Block activities ................................................. 100
4.5 Lessons children learnt from the intervention ........................................................... 101
4.6 Summary of the findings of the semi-structured interviews ...................................... 104
5. CHAPTER SUMMARY .......................................................................................... 105

xi
CHAPTER 5: DISCUSSION AND RECOMMENDATIONS
1. INTRODUCTION ................................................................................................... 107
2. HANDLING THE QUANTITATIVE DATA ....................................................... 108
3. PRE-TEST FINDINGS ........................................................................................... 109
4. CHANGES FROM PRE- TO POST-TESTS ........................................................ 110
Changes in the comparison groups............................................................................ 110
Changes in the experimental groups .......................................................................... 111
5. CONSIDERING THE FINDINGS ......................................................................... 112
Access to play resources ............................................................................................ 113
Guided play ................................................................................................................ 113
Learner enthusiasm .................................................................................................... 115
Teacher attitudes and perceptions ............................................................................. 116
Aspects of visual perception....................................................................................... 120
Time and materials .................................................................................................... 122
Gender issues …………………………………………………………..…………………..123
6. LIMITATIONS OF THE STUDY ......................................................................... 124
7. RECOMMENDATIONS......................................................................................... 125
Recommendations for further research ..................................................................... 125
Recommendations for curriculum developers, advisors and teachers ...................... 126
8. CONCLUSION ........................................................................................................ 127
9. REFERENCES ……………………………………………………………………129

xii
LIST OF APPENDICES
APPENDIX A: INTERVIEW PROTOCOL
APPENDIX B: RECORD SHEET
APPENDIX C: VISUAL PERCEPTUAL ASPECT TEST (VPAT)
APPENDIX D: SCORE SHEET
APPENDIX E: CODE BOOK
APPENDIX F: CODED SOUTH AFRICAN RESULTS
APPENDIX G: CODED KENYAN RESULTS
APPENDIX H: TEACHER CONSENT FORMS
APPENDIX I: PARENT CONSENT FORM (SOUTH AFRICA)
APPENDIX J: PARENT CONSENT FORM (KENYA)

xiii
LIST OF TABLES
Table Page
Table 3.1: Paradigms, methods and data collection tools (Mertens 2005, p.5) 55
Table 4.1: Number of participants in the South African and Kenyan schools
experimental and comparison groups (RSA n=38; Kenya n=39)
79
Table 4.2: South African and Kenyan pre-test numbers of participants, mean scores
and standard deviations
81
Table 4.3: Comparison of the pre-test mean scores of the students in the Kenyan and
South African schools (σ = standard deviation)
82
Table 4.4: Comparison of the Kenyan and South African groups mean scores in the
Visual Perception Aspect (VPAT) pre and post-tests with t-test
probability value (p)
84
Table 4.5: Comparison of mean score changes between the experimental and control
groups in Kenya and South Africa.
85

xiv
LIST OF FIGURES
Figure Page
Figure 3.1: Explanatory mixed methods design (Creswell &Plano Clark 2007) 61
Figure 3.2: Triangulation of mixed-method design (Creswell & Plano Clark, 2007). 63
Figure 3.3: Visual representation of the research design used in this study 66
Figure 4.1: Distribution of the VPAT scores of the 77 children who wrote the
VPAT pre-test (note: bin 1 represents a score ranging from 0 to 5; bin
2 scores from 6 to 10; bin 3 from 11 to 15, etc., namely bins of a
range of five points each.)
80
Figure 4.2: Comparison of pre-test scores in the schools that participated in
Kenya (n=39) and South Africa (n=38)
81
Figure 4.3: Experimental and control group pre- and post-test mean scores in the
RSA and Kenyan schools
Figure 4.4: Change in mean scores in the comparison and experimental groups in
the South African and Kenyan groups.
83
84
Figure 4.5: Mean scores of the aspect visual discrimination in the Kenyan and
South African pre and post-tests out of a total of 16.
86

xv
Figure 4.6: Mean scores of the aspect visual memory in the Kenyan and South
African pre and post-tests out of a total of 16.
87
Figure 4.7: Mean scores of the aspect visual sequential memory in the Kenyan
and South African pre and post-tests out of a total of 16.
88
Figure 4.8: Comparison of the boys and girls in pre- and post-test scores in
Kenyan and South African schools
89

xvi
LIST OF ABBREVIATIONS
VPAT: Visual Perceptual Aspect Test
VD: Visual Discrimination
VM: Visual Memory
VSM: Visual Sequential Memory
SAT: South African Teacher
KET: Kenyan Teacher
RSA: Republic of South Africa

Chapter 1: Introduction and overview
1
CHAPTER ONE
INTRODUCTION AND OVERVIEW
1. INTRODUCTION
One aspect of child development is the development of a variety of perceptual skills
during the crucial early learning years, especially visual perception, which plays a
fundamental role in determining a young learner‟s ability to successfully complete written
and numeric tasks (Clutten, 2009). Visual perception is the brain‟s ability to organize and
interpret what is seen (Deiner, 2005). According to Jooste and Jooste (2005), an integration
of adequate visual, auditory and tactile information, as well as eye, ear and hand functions, is
necessary for reading, writing and copying. These basic academic skills therefore require
perceptual and cognitive tasks such as the discrimination of shapes or objects (letters, words,
and numbers) and learning about the patterns and relationships of these shapes and objects
(Deiner, 2005). Pickering (2001) notes that young children appear to encode pictures of
objects in visual form focusing on visual features such as shape, orientation and detailed
appearance.
Learners require opportunities and activities to help them develop visual perception.
One of the ways that learners can acquire visual perception is through play. Children, whether
playing or functioning within an academic environment, have a tendency to learn through the
regular use of their eyes (Atherton & Gates, 2007; Gentile, 2005) and, on average, the
primary learning channel is vision (Sattler & Evans, 2002). Previous research indicates that
while approximately 20-30% of learners tend to learn more effectively through the auditory

Chapter 1: Introduction and overview
2
channel (to recall what is heard), at least 40% tend to learn more effectively when presented
with visual information (Schneck, 2005). Visual perception refers to bringing meaning to that
which the eyes see and plays a fundamental role in a learner‟s ability to learn, read and spell,
in addition to the learner‟s accomplishment of written and numeric tasks vital for academic
competence (Schiman & Rouse, 2006; Scheiman & Gallaway, 2006).
Although a great deal of research has been done on play internationally (Whitebread
& O‟Sullivan, 2012), not a great deal has been done in African settings (Hewes, 2006).
Similarly, the research on play and visual perception that has been done in Africa has been
done on literate children rather than on children in the crucial early learning years before
formal schooling (Brey, 2017). Recently a 6 Brick Duplo Blocks guided play approach has
been developed in South Africa (Hutcheson, Frank & Smith, 2014). Similarly, a Visual
Perception Aspects Test (VPAT) for testing young children‟s levels of visual perceptions has
recently been developed and validated in an African context (Clutten, 2009). As such, it
appeared that investigating the effects of using the 6 Brick Duplo Blocks guided play
approach on visual discrimination, visual memory and visual sequential memory in pre-
school learners in African schools using the Visual Perception Aspects Test was an area of
study that should make a contribution to better understanding the relationships between
guided play and the development of visual perception in pre-literate African children.
2. BACKGROUND
The importance of early childhood education, especially in the domains of reading
and mathematics, coupled with its relationship to later achievement, has and continues to gain
international recognition (Van Oers & Duijkers, 2013). Theorists and researchers conclude
that play is the primary medium for development and learning for young children (Brooker,
Blaise, & Edwards, 2014; Bergen & Fromberg, 2009) and the United Nations High

Chapter 1: Introduction and overview
3
Commission for Human Rights recognises play as the right of every child and as being
essential for optimal child development (Muro, Pretty, DakoGyeke, 2006).
2.1 Play
Play is a universal phenomenon and something that every child does (Hewes, 2006).
It has been of great interest and value to scholars of child development, learning
psychologists, educators and researchers over a long period of time (Whitebread, 2012;). Jean
Piaget (1962) and Lev Vygotsky (1978) were the first to link play with cognitive
development. Play is also closely linked to intellectual achievement (Whitebread, 2012;
Piaget, 1953). It has been found that children who engage in play in pre-school are better
prepared for school (Bowman, Donovan & Burns, 2000; Philips & Shonkoff, 2000). In
addition, play promotes the foundation of social, physical and emotional skills necessary for
success in school and in life, which “paves the way for learning” (Kalliala, 2005 p. 22). One
such opportunity for play is block building which lays a foundation for logical mathematical
thinking, scientific reasoning and cognitive problem solving, as well as creativity and flexible
thinking (Hansel, 2016; Hutcheson et al., 2014; Bruner, Sylvia & Genova, 1976). It is for
these reasons that this study focuses on play amongst young children using the 6 Brick Duplo
Block approach.
2.2 Visual Perception
Visual perception is the brain‟s ability to organise and interpret what is seen (Deiner,
2005). It is a learnt phenomenon that takes place over a period of time and which places
demand on an individual‟s sense of sight and mind (Gordon, 2004). It is a process whereby
one sees and then changes what is seen into useful information, thereby giving meaning to
that which the eye sees (Ted Brown, Rodger & Davis, 2003). Visual perception enables
learners to acquire reading and spelling skills, as well as being able to complete written and

Chapter 1: Introduction and overview
4
numeric tasks. Learners not only learn but also gain competency and performance (Schiman
& Rouse, 2006; Scheiman & Gallaway, 2006). The process of developing visual perception
starts when one is born (Scheneck, 2005) and is progressive (Brockets, 2006; Bergh &
Theron, 2003) over a period of time (Gordon, 2004; Cheatum & Hammond, 2000). While the
visual perception skills of children are not at the same level as is the case for adults, they do
have a sufficient level of perception for basic functioning (Arterberry, 2008). Factors that
hamper children‟s ability to explore their environment may impede the visual perception
learning process (Tsai, Wilson & Wu, 2008), and affect their learning adversely (Loikith,
2005; Dankert, Davies & Gavin, 2003). Conversely, Tsai et al. (2008) have reported that
learning visual perceptual skills can be improved by practical experience, which is important
as it has been shown that performance in reading, writing, and mathematics depends on levels
of visual perception.
2.3. 6 Brick Duplo Block guided play approach
Though many believe that spatial skills are not „teachable‟ (Verdine, Golinkoff,
Hirsh-Pasek, & Newcombe, 2014), certain studies suggest that spatial skills are malleable
(Uttal, Meadow, Tipton, Hand, Alden, Warren, & Newcombe, 2013) and that structured early
play experiences can alter spatial thinking (Casey, Andrews, Schindler, Kersh, Samper, &
Copley, 2008). The 6 Brick Duplo Block approach, which has been developed in South
Africa, is new and there has been little to no research on the effects of its use on children‟s
physical or cognitive abilities. A first study on the possible effects of the 6 Bricks Duplo
Block on children‟s visual perception was done focusing on grade two (approximately 7-9
years old) children and their teachers (Brey, 2017). As research has not yet been undertaken
on the use of the 6 Brick Duplo Block concept with younger children in South Africa or other
areas in Africa, and the important roles that play and visual development have in this age
group of young children‟s development (Mayer, Sodian, Koerber, & Schwippert, 2014), this

Chapter 1: Introduction and overview
5
study focuses on the effect of using the 6 Brick Duplo Block approach through guided play
activities on pre-school children‟s visual perceptual abilities in both Kenya and South Africa.
3. STATEMENT OF THE PROBLEM
Visual perception is an important developmental aspect in young children,
particularly in terms of enabling reading, writing and numeracy (Tsai et al., 2008). In turn
play is closely linked to cognitive and intellectual achievement (Whitebread, 2012; Piaget,
1953). While mechanisms to develop children‟s visual perceptual abilities have not yet been
clearly defined (Nath & Szücs, 2014), play with coloured Duplo Blocks appear to have the
potential to develop visual perception in young children. As there has been no research
recorded to date on the effect of the newly developed 6 Brick Duplo Block approach play
activities on the development of pre-literate learners‟ visual perception, and there is little to
no research in this field in the African context using an instrument developed and validated in
Africa to measure visual perception, this study investigates 6 Brick Duplo Block activities
that appear to lend themselves to the promotion of visual perception abilities required for
developing reading, writing and numeracy. These specific abilities are visual discrimination,
visual memory and visual sequential memory. These aspects of visual perception were
measured using the VPAT test which was developed and validated in Africa for African
conditions by Clutten (2009).
4. RESEARCH AIM AND OBJECTIVES
The aim of the research was to investigate whether the use of 6 Brick Duplo Block
guided play approach can help young learners develop visual perceptual abilities as indicated
by pre-post-test scores using the Visual Perception Aspects Test (Clutten, 2009). The
objectives supporting this aim were to investigate three major aspects of visual perception
that are essential to developing reading writing and numeracy skills, namely: visual

Chapter 1: Introduction and overview
6
discrimination, visual memory and visual sequential memory. The study focuses at Grade R
learners in foundation phase in South Africa and middle class nursery Early Childhood level
in Kenya as children of this age bracket have usually just entered formal schooling and are
about to learn how to read and write and become numerate.
5. RESEARCH QUESTIONS
The study attempted to investigate the following primary research question:
Does guided play using the 6 Brick Duplo Block approach have an effect on pre-
school learner‘s visual perception abilities?
The following secondary interrelated questions needed to be answered in order to
answer the primary research question:
What are the effects of using the 6 Brick Duplo Block guided play approach on
pre-literate learners‟ visual discrimination abilities?
What are the effects of using the 6 Brick Duplo Block guided play approach on
young learners‟ visual memory abilities?
What are the effects of using the 6 Brick Duplo Block guided play approach on
young learner‟ visual sequential memory abilities?
What are teachers‟ perceptions of the use of the 6 Brick Duplo Block approach
on pre-literate learner‟s visual perceptual development?
6. RESEARCH DESIGN AND METHODS
According to Creswell (2009), research designs are plans and procedures for research
that span the decisions from broad assumptions to detailed methods of data collection and
analysis. As such, the research design is described below after which more attention is given
to the research methods employed. The study utilised a quasi-experimental design with pre-
Chapter 1: Introduction and overview
7
post-testing and experimental and comparison groups. However, the experimental and
comparison groupings were not randomly chosen (existing classes were used) and the
numbers were relatively small, which means that the design was not a true experimental
design.
6.1 Research Design
This study was conducted within a pragmatic paradigm using an explanatory mixed-
method approach (Creswell, 2005). The pragmatic paradigm postulates by and large that the
approach to research is that of integration of data collection methods and data analysis
procedures in the course of the research (Creswell, 2003). In this study quantitative data was
generated via pre-post-tests of the participating children in the three aspects of visual
perception described above, namely visual discrimination, visual memory, and visual
sequential memory.
Two classes of pre-school (Grade R in South Africa and equivalent in Kenya)
children in one South African and one Kenyan school were chosen (purposive convenience
sampling) to participate in the study. One class in each school constituted the experimental
group and receive „the treatment‟ (an intervention based on play using the 6 Brick Duplo
Block approach), while the other provided a comparison group that had not received „the
treatment‟. The intervention included providing teachers with training and sufficient sets of 6
Brick Duplo Blocks to allow all of the children in their classes to participate in the pre-
designed Duplo Blocks activities. 6 Brick Duplo Block activities that were identified by the
researcher as having the potential to promote visual discrimination, visual memory and visual
sequential memory were used. The intervention took place over three to four months, a period
of time that previous research in this area has shown an effect when using a similar
intervention (A. Brey, personal communication 21 April, 2016). The post-test was applied

Chapter 1: Introduction and overview
8
immediately after the intervention. Classroom observations were made during the
intervention and the teachers were interviewed immediately after the post-testing to establish
their perceptions of the effects of the intervention on their learners‟ visual perceptual
development.
6.2 Methods
In this section the sample and setting, research instruments, data generation and data
analysis are described, as are aspects of validity and reliability of the data generated.
Sample and Setting
As noted above, two classes of same level of pre-school children in two schools (one
class in South Africa having a comparison and experimental group and the other in Kenya
also with a comparison and experimental group) participated in the study. The sample size
was approximately 80 learners, i.e. 40 learners from each school with approximately 20
learners in each class. This empirical investigation‟s sampling frame focused on government
schools of almost similar size and representing an urban population where second-language
learners are taught in English (a reasonably common situation in both countries). Learners‟
ranged between the ages of 5-7 years of age. This age group was chosen because research
suggests that, taking into account verbal and non-verbal intelligence, spatial ability may be a
unique underlying mechanism which can be used to account for differences in higher order
academic performance at this age (Mayer et al., 2014).
Research Intervention
The intervention, which employed the provision and usage of the 6 brick Duplo
Blocks approach, took place in two purposively selected schools in South Africa and Kenya.
Teachers from one class in each school did not receive training or the 6 Brick Duplo Blocks.

Chapter 1: Introduction and overview
9
Their classes served as the comparison/control group. Teachers from the other class received
training on guided-play using the Six-brick approach and the children in their class formed
the experimental group. The volunteer teachers in each group within a school worked
independently from each other. Open-ended observation took place during the intervention
period and field notes were made by the researcher.
Data Generating Instruments
The visual discrimination, visual memory, and visual sequential memory tests
developed and validated in an African setting by Clutten (2009) were used for pre-post-
testing to generate quantitative data. Open ended classroom observation and a semi-structured
interview protocol was used to generate qualitative data on the experimental teachers‟
perceptions of the intervention. The experimental teachers were provided with record sheets
to record all the 6 Brick Duplo Block activities they completed with their learners.
Data Generation
The pre- and post-testing was carried out using three aspects of the Visual Perception
Aspects Test (VPAT) developed by Clutten (2009), namely visual discrimination, visual
memory, and visual sequential memory tests. Standard one-on-one testing was used. The
purpose of the pre-tests was to determine learners‟ baseline visual perceptual abilities before
the intervention (guided play using the 6 Brick Duplo Block approach), whilst the purpose of
the post-tests was to determine learners‟ possible developments in terms of visual perceptual
abilities after the intervention. Testing was facilitated by the researcher with the assistance of
fourth year psychology students from universities in the two countries; namely South Africa
and Kenya, to generate quantitative data. The three Visual Perceptual Aspect sub-tests were
administered together as the time that they took to do them was within the attention span of
learners of their age (S. Clutten, Personal communication, 21 April, 2016). Qualitative data

Chapter 1: Introduction and overview
10
were generated via open-ended classroom observation in form of field and a semi-structured
interview with each of the experimental teachers. These interviews were video and audio-
recorded (reasons for video and audio recording explained in chapter three). The qualitative
data generated through semi-structured teacher interviews were used to afford insight into the
teachers‟ thoughts, understandings and views regarding guided play using 6 Brick Duplo
Blocks as a mechanism to develop pre-school learners‟ visual perceptual abilities.
Data Analysis
The tests (quantitative data) were scored, coded, entered into an excel spread sheet by
the researcher and analysed using descriptive and inferential statistical methods. Reasons for
choosing excel is explained in chapter three. The same results were entered into statistical
package for social sciences (SPSS) by an Educational statistician in Oldenburg University
Germany. The open-ended classroom observations and semi-structured individual teacher
interviews were categorised into issues that are relevant to this research study so as to help
explain the quantitative data findings.
Validity and Reliability
The validity and reliability of the Visual Perception Aspects Test (VPAT) developed
by Clutten (2009) have already been verified and the test has been shown to be both valid and
reliable in the African context. In terms of the qualitative data, it is more appropriate to speak
of „trustworthiness‟. Koonin (2014) states that in any research endeavor, “… we also want to
be able to trust the findings of researchers”. This implies that when someone else does the
same research their findings should not be too different from those in research already done.
The degree to which the components in this study are believable depends on how precisely
and believably the researcher interprets and characterizes the information divulged by the
participants. It is the reader‟s perception of how authentically the data has been represented,

Chapter 1: Introduction and overview
11
i.e. how credible the account is presented (Bloomberg & Volpe, 2008). In order to achieve
trustworthy and believable data, I have tried to make apparent a well described trail of the
methods used and evidence gleaned (Koonin, 2004). A clear and transparent account of the
processes and responses in terms of generating and analyzing the interview data forms the
basis of trustworthiness in this study.
7. THEORETICAL AND CONCEPTUAL FRAMEWORKS
This study is located in Piaget‟s theory of child development which involves changes
in cognitive process and abilities (Piaget, 1953). Piaget believes these changes are not
attained passively but through actively playing a role in learning about the world around
them. In Piaget's view, early cognitive development involves active processes which later
progresses to changes in mental operations. During Piaget‟s preoperational stage children
aged two to seven years old begin to think symbolically and learn to use words and pictures
to represent objects. During this stage increased playing and pretending reveal that children
begin to be able to use symbols. The use of symbols is dependent on visual perception. The
children who took part in this study were in Piaget‟s preoperational stage of development
(ages 2-7), a stage where the development of visual perception is vital to their ability to read,
write and engage in numeracy (Tsai et al., 2008) and play is closely linked to cognitive and
intellectual achievement (Whitebread, 2012; Piaget, 1962).
The conceptual framework of this study is generally based in understandings of
development through play and specifically within theoretical notions of the development of
visual perception. As noted above, understandings of the effect of play can be traced back to
Piaget and the idea that the external construction of physical artifacts is a powerful means to
achieve internal construction of understanding. While visual perception is a process that
begins at birth (Schneck 2005) it develops in a relatively sequential manner (Brockett, 2006;

Chapter 1: Introduction and overview
12
Bergh & Theron, 2003) over time (Gordon, 2004; Cheatum & Hammond, 2000). As
children‟s rates of development are affected by the settings in which they spend their
formative years (Perry, 2001), this study explored whether a particular setting, namely the
provision of an intervention using the 6 Brick Duplo Block guided play approach, provided
an opportunity for accelerating the rate of development of visual perception.
8. ETHICAL CONSIDERATIONS
Ethical considerations are precautions that should be taken into consideration in
order to safeguard the rights of individuals when doing research (Bloomberg & Volpe,
2008). In addition, ethical practice “consisted of an agreement between the participant and
the researcher, to protect the participants from harm at all times and to safeguard
confidentiality” (p.76). Such agreements include seeking permission from the heads of the
school, participating teachers, parents and children, as well as providing adequate
information on the research. In the case of this study, which falls under the umbrella of a
larger study on the development of visual perception, ethics approval to conduct research
was obtained from Nelson Mandela Metropolitan University Ethics Committee [H14-EDU-
ERE-014/Approval] and permission to conduct the study was obtained from all relevant
stakeholders.
9. OUTLINE OF THE STUDY
This study is described in five chapters. Chapter one provides an introduction and the
background of the study and introduces the issues on play, visual perception and the concept
of the 6 Brick Duplo Block guided play approach. The research problem is formulated, aim
of the research, the research questions, design and methodology, data generating tools used,
data generation process and analysis together with ethical issues are presented, and finally an
outline of the study is described.

Chapter 1: Introduction and overview
13
Chapter two provides a literature review for this study focusing on issues of play and
visual perception and how play can be used to develop visual perception in pre-school
learners. Chapter three explains the philosophical underpinnings of the study in terms of
world views, methods which were adopted when collecting and analysing the data, the
sample, data gathering instruments, as well as issues pertaining to validity and reliability of
the research process and procedures are also described.
Chapter four focuses on the results obtained from the study. These results are
discussed in chapter five in light of the literature review in chapter two. The main conclusions
drawn from this study, their implications, and recommendations for further research are also
argued in this chapter.
.

Chapter 2: Literature review
14
CHAPTER TWO
LITERATURE REVIEW
1. INTRODUCTION
This chapter provides an outline of early childhood development, the notion of play,
visual perception, 6 Bricks Duplo Block approach and constructionism. Relevant literature
relating to play, visual perception and 6 Brick approach are reviewed and deliberated in
detail. Topics relating to play such as forms of play, play and cognitive development, the role
of play in developing reading and the relationship between play and later achievement are
considered. Aspects of visual perception and the role of visual perception in reading and
writing, role of visual perception in written tasks, developing visual perception and
measuring visual perception is also explained. The concept of the 6 Brick Duplo Block
approach and constructionism is discussed, as is the way in which the study is framed.
2. EARLY CHILDHOOD DEVELOPMENT
The period from birth to approximately eight years of age, which is generally referred
to as „early childhood development‟, is critical to laying the foundation for learning and
cognitive development (Piaget, 1964). Close to half of an individual‟s potential in terms of
intelligence is developed by the time that he or she reaches four years of age, and therefore
the major aim of any early childhood development (ECD) activities should be to protect a
child‟s rights to opportunities for full emotional, physical, social and cognitive development
(Ailwood, 2003; Philips & Shonkoff, 2000).
Chapter 2: Literature review
15
One of the skills that are developed during ECD is visual perception (Scheneck,
2005). Visual perception is the ability to distinguish between objects and make sense of what
the eyes see (McLeod, 2008) and plays a vital role in learning to walk, read, write and draw
(Clutten, 2009). Underdeveloped visual perception has the potential to ruin a child‟s progress
academically and socially, and can lead to poor self-esteem, poor motivation and poor
personal development (Schneck, 2005).
The necessary, but not sufficient, precursor to visual perception is appropriate
stimulation, provision of information about objects, events and spatial layout in which an
individual is required to think and act (Kellerman & Arterbeberry, 2006). Children afforded
enough psycho-social stimulation, achieve much better functioning of the brain by the time
they are twelve (Kellerman & Arterbeberry, 2006). Furthermore, lack of psycho-social
stimulation during the critical ECD years may retard neurological development with
associated difficulties in rewiring the brain at the later stages of development.
While effective and comprehensive early childhood development depends on
interactions with parents, siblings, and the community with which the child interacts, the bulk
of the burden of providing stimulating environments conducive for maximal brain
development often falls on teacher who provides play opportunities for teaching and learning
(Philips & Shonkoff, 2000). In addition, investment in early childhood, including play,
improves numeracy and literacy levels (Mielonen & Paterson, 2009) It is believed that one
way of promoting the necessary visual perception development required for cognitive growth
is through construction play using concrete manipulatives (Hutcheson et al., 2014; Verdine,
Gilinkoff, Hirspasek, & Newcombe, 2014). It is for this reason that a particular approach to
using Lego, namely the „6 Brick‟ Duplo-block approach, was used with pre-school children
as an intervention strategy in this study. The visual perception abilities of the children who

Chapter 2: Literature review
16
participated in this study were measured pre- and post-intervention and compared with a
comparison group of children of the same age. As such, issues of play and visual perception
are elaborated on in this chapter.
3. THE NOTION OF PLAY
Play is a child‟s „work‟ that helps thinking, doing and feelings to flourish (Hewes,
2006). It is an activity where everything becomes possible and freedom of imagination takes
precedence (Elkonin, 2005). It is an instinctive, flexible, malleable, natural and creative
process without set goals which instinctively leads to a well-developed imagination (Tsao,
2008; Wardle, 2006). Through play children get the opportunity to assimilate reality into their
experience and hence make it part of their own lives (Elkonin, 2005). Play develops in
children in a predictable pattern which is linked to their intellectual, emotional, social and
physical aspects of development (Whitebread & O‟Sullivan, 2012; Kalliala, 2006; Bennett,
1997).
During play a child is freed from the overwhelming task of trying to figure out the
complexity of reality. The fantasies they create while playing helps them come to terms with
these feelings and enhances the chances of them controlling them (Kalliala, 2006). When
anger or other strong emotions are kindled in play, the ability of children to control their
feelings helps develop a readiness to cope with real life events (Hewes, 2006). Piaget (1964)
notes that understanding childrens stages of development is important if one is to facilitate
play that helps them to fully realize the potential of their physical and mental capabilities.
Teachers and adults, who often help define the boundaries of their children‟s play, need to
know the developmental stage that the children are at if they are to them to keep them safe
and to transform random play into activities that are vital for their development (Edwards,
2000; Piaget, 1962). Engaging children in play is important for many reasons, not least that it
Chapter 2: Literature review
17
provides an opportunity to bring together the inner mental sphere of the child and the realities
of the real world (Elkonin, 2005; Piaget, 1967).
3.1 Importance of play
Not only is play linked to intellectual, emotional, social and physical aspects of
development, it is cardinal for the general well-being of a child. It is through what appears to
be mundane moments of play that resilience and flexibility, which are the building blocks of
emotional and physical health, are horned and sharpened (Verdine, et al, 2014). These
building blocks are recognised by the United Nations, which has enshrined the right to play
and to freely join recreational activities for every child in its Convention on the Rights of the
Child (Murray, 2012). Article 31 elaborates that:
“Play and recreation are essential to the health and well-being of children and
promote the development of creativity, imagination, self-confidence, self-
efficacy, as well as physical, social, cognitive and emotional strength and
skills. They contribute to all aspects of learning; they are a form of
participation in everyday life and are of intrinsic value to the child, purely in
terms of the enjoyment and pleasure they afford ... Play and recreation
facilitate children‟s capacities to negotiate, regain emotional balance, resolve
conflicts and make decisions. Through their involvement in play and
recreation, children learn by doing; they explore and experience the world
around them; experiment with new ideas, roles and experiences and in so
doing, learn to understand and construct their social position within the
world.”

Chapter 2: Literature review
18
Play has also been seen as being important by many researchers who consider play as
a „medium‟ for learning (Bergen, 1998) and as a „condition‟ (among others) for learning
(Fromberg, 2012), with the goal oriented and integrative experiences gained through attaining
„flow‟, which is intrinsically motivating, empowering and satisfying (Abuhamdeh &
Csikszentmihalyi, 2012).
3.2 Forms of play
Play has been seen as a spontaneous and active process that promotes aspects of
thinking, doing and feeling (Wood & Attifield, 2005). Play may be symbolic, that is,
representing reality; meaningful in that it connects or relates to experiences; active, through
doing things using manipulatives [including imagining]; pleasurable, because when children
are occupied and engaged in an activity they find play being a pleasant activity; voluntary
and intrinsically motivating, in that the motives come as a result of mastery or curiosity; rule-
governed, whether implicitly or explicitly expressed; or episodic, in that its forms are
characterized by shifting and emerging goals which develop spontaneously (Fromberg,
2002).
Play is a simple yet complex process, and comes in different forms; each aimed at
developing knowledge, skills and understanding, mainly in the cognitive and social domains
(Broadhead, 2004; Vygotsky 1978; Piaget & cook, 1952). The types of play, which often
occur in homes and in schools and can be broadly classified as mental or physical play, are
designed to attract a child‟s attention and to provoke interest. Vygotsky (1967) refers to
mental play as something that is geared towards discovery and exploration through the use of
numbers, puzzles, and words. Children are expected to remember words, colours, shapes and
numbers as they learn and socialize together. While playing, they often learn unconsciously
and the pressure to remember or to commit something to memory is alleviated because
Chapter 2: Literature review
19
learning comes naturally through play. Mental play encourages mental activity and creativity
and, in the process, develops problem solving skills and mastery of words. Active or physical
play such as playing with shapes and tangible letters to form words, children develop their
fine motor skills. There are three major forms of physical play, namely exploratory play,
manipulative play and constructive play.
Exploratory play begins with curiosity as soon as a child notices things in his or her
environment. Any colourful, tangible or anything that will attract the attention of children
causes them to reach out and examine them. Exploration flourishes in an emotional
environment that encourages initiative, curiosity, and problem-solving (Wood & Attifield,
2005). A widely held view is that “exploration deals with how objects or interpersonal
situations function” (Hutt, 1976, p. 211). Exploratory play, deals with „what can it/they do?‟
and „what the player can do or what can I do?‟ with the subsequent discovery becoming “a
form of representation” (Fromberg, 2012, p. 73). As such exploratory play not only provides
an opportunity to learn about perceptual properties, but is an occasion for learning about the
functional properties of objects, giving children power to “control situations as they
manipulate objects in a proactive manner” (Collard & Sutton-Smith 1979, p. 52).
In accordance to the theory of Piaget (1962), cognitive development has to do with
the child‟s perception of objects, pattern recognition, and memory. Manipulative play enables
children to exercise their hand-eye coordination and motor skills by moving their fingers and
arms as they manipulate the materials available. They are able to exercise control with their
fingers as they handle the construction sets of objects (Nespeca, 2012).
Constructive play can be one of the most complex but the most rewarding form of
active play. It involves a lot of imagination and creativity which requires a great deal of
physical and mental energy, and hence serves best to challenge and boost the potential of the

Chapter 2: Literature review
20
children (Nath, & Szücs, 2014). Schools often have different constructive tools such as
building blocks with which children can construct towers, patterns, buildings and imaginative
objects together through negotiation, socialization and sharing (Nespeca, 2012). Constructive
play using the „6-Brick‟ Duplo Block approach is the kind of play that is the focus of this
study.
3.3 Play as a primary medium for development
According to Piaget (1962) play is a primary medium for development. Frost (1992,
p.48) agreed to the same idea, asserting that "play is the chief vehicle for the development of
imagination and intelligence, language, social skills, and perceptual-motor abilities in infants
and young children". Fromberg (1999, p.223) states that play is the “ultimate integrator of
human experience.” as children can do what they have seen others do, be able to observe
what is being done, and draw inspiration from them while they play in order to build games
to construct scenarios and enjoy the activities they are doing (Fox, 2007).
As mentioned earlier, play is a primary medium of development which helps children
develop their gross and fine motor skills. As they play, social interactions expose them to the
social aspects of their being and they are able to respond to each other emotionally in case of
a misunderstanding and have opportunities to develop their emotional intelligence which
contributes to their overall development (Fromberg, 1999).
3.4 Play and cognitive development
Among the theorists who agree on the relationship between play and cognitive
development are Piaget, Montessori and Vygotsky (Mielonen & Paterson, 2009). They all
come to a common consensus that children are able to better recall first-hand experiences
when they interact with the world than when someone else tells them about it. As observed

Chapter 2: Literature review
21
by Maria Montessori, whose theories have influenced the way many ECD programmes are
structured (Mooney, 2002 p.23) children develop their literacy skills without their knowledge
of doing it. In Montessori‟s eyes, children are self-constructivist learners.
Piaget (1962) asserts that young children develop meaning through interacting with
their environment, particularly in his “concrete operational” cognitive development stage
(Mielonen & Paterson, 2009). At these stage children retrace their thinking through a
phenomenon he termed as “reversibility” (Mooney, 2000 p.78). Piaget asserts that through
reversibility children develop the ability to solve higher scale problems by being able to drive
their thoughts. Reversibility also enables children to begin thinking abstractly (Mooney, 2000
p.78). Russian sociologist Lev Vygotsky agrees that play has an important role in facilitating
cognitive development in that children not only put in practice what they know, but in the
process of play they get to learn new things from each other and from their surrounding
(Mielonen & Paterson, 2009). “The world children inhabit is shaped by their families,
communities, socioeconomic status, education, and culture” (Mooney, 2000 p.83). These
notions place play as a strategic niche in children‟s cognitive development and which helps
them grow and learn how to interpret the world around them as they explore their world
through play.
3.5 The role of play in developing reading
Literacy can be defined as the ability to read and write (Tsao, 2008). Reading and
writing helps children communicate with others. This guides them develop linguistic
competence that leads to communicative abilities throughout their lives. Linguistic
competence enhances children‟s knowledge and facilitates learning and growth (Klenk,
2001). When children play and communicate through play, they are learning how language
works and gaining an understanding of how to interact with other people (Newman &

Chapter 2: Literature review
22
Holzman, 1993 Vygotsky, 1978). Eventually, children connect the meaning of spoken
language to written language, which is the key to success in school. According to Vygotsky
(1978); Newman and Holzman (1993), language skills are developed by children by grasping
new ideas and concepts in the process of listening and speaking to each other (Webb, 2008).
Play environments rich in literacy activities help children develop skills.
Mooney (2000 p.83) proposes that play is the “voluntary engagement in enjoyable
activities” and adds that research within the past twenty-five years has brought forth a
positive connection between play and the development of literacy. To quote his explanation
of how children learn as they play he says:
“Language and development build on each other. Language is constantly used when
they play. They determine the make-believe conditions. They discuss objects and
roles and directions. They correct each other and they learn about ideas and untried
situations”.
Mooney (2000, p.83)
After observing how children were learning in his own classroom Cambourne came
up with his theory of “The Conditions of Learning” (Mielonen & Paterson, 2009) as it applies
to literacy learning. He came to find that children had to build their own knowledge so as to
profoundly learn it. His conclusions that in play, all of the conditions that foster learning are
achieved which gives children the opportunity to engage and practice the oral language and
hence enhance effective transference to literacy learning. When children are in the process of
playing, they indulge the use of language to communicate and to also negotiate meaning
(Mielonen & Paterson, 2009).

Chapter 2: Literature review
23
Moreover, referring to the theory of social construction, it appears that the skills of
literacy in the young children have a high probability of evolving in a natural way as they
play (Vygotsky, 1978). Back in the 1900‟s, play was being considered as something that
should be exercised outside the confines of classrooms or learning places (Hall, 1991) and in
1987, Hall made an observation that teachers were disseminating learning in a manner that
was very controlled and this thus brought about a negative impact on children. He pointed out
that “Children had to ignore everything they knew about learning and submit to the
ownership of their learning” (Hall, 1991, p.4)
In addition to Hall‟s remarks, twenty-five years of research has unveiled a connection
that exists between literacy learning and play. Researchers come to the conclusion that an
environment that has a wealth of literacy attributes has the capability of developing literacy
skill quite early in young children (Webb, 2010; Klenk, 2001). They add that, social
interactions experienced by a child during play “… do not hinge on formal instruction, they
are authentic and purposeful” (Klenk, 2001, p.150)
Through such previous studies which converge to the idea that play enhances literacy,
it has shown that play is a critical component that not only sharpens the writing skills of a
child but also whets the reading aspects thereof. Play encourages early reading skills that can
be employed both in the classrooms and homes so that children learn without knowing
(Montessori 1936). She believed that children could develop their literacy skills and other
learning opportunities like mathematics without their knowledge of doing so through play.
3.6 The role of play in developing early mathematical idea
Perry and Dockett (2002) propose that children have come up with multifarious,
powerful and significant understandings of mathematics way before they start their formal
education. They add that watching children play hide and seek is one of those reminiscent

Chapter 2: Literature review
24
moments that an adult can be glad to have and entertain. On a closer look from the lens of an
early childhood researcher, as a child in charge counts while the rest disappear to hide, it then
becomes apparent that numbers are being reinforced into the mind of the child and the
cognitive development takes shape. They continue to state that such understandings are
developed and refined through play. The social context that is afforded to children as they
play provides more knowledgeable and even experienced others who will encourage and
foster the process of making meanings including mathematical ones to the rest within that
context (Webb & Mayaba 2010; Arcavi, 2003; Perry & Dockett, 2002; Perry, 2001;
Vygotsky, 1978).
Social interaction provides support and the context within which they play offers a
place where they employ innovation, creative problem solving and risk taking which is the
gateway that encourages children to learn about who they are among others and the whole
sphere wherein they live (Bennett, 1997). As far as Vygotsky (1978) is concerned, play
creates a zone of proximal development (ZPD) whereby the children are motivated to learn
by the assistance of others who are more experienced than themselves. Mathematical ideas
sprout in such rich environments because the ones who are more experienced can “pass”
them to the other play partners indirectly as they play. Aubrey, Godfrey & Dahl, (2006) adds
important insights to play by noting that play is not only a window of opportunity through
which a child develops, but it is a contributor to the consolidation and reinforcement of
conceptual acquisitions and current „learnings‟ by furnishing them with opportunities for
novel masteries and new insights. There are many mathematical experiences that a child
encounters through play. By observing preschoolers aged between four and five playing,
Ginsburg (2000) identified that 42% of the play had mathematical experiences. Considering
such results, mathematical ideas have a cradle that lies in playing. Play such as block play,
construction and number puzzles motivates such ideas in the minds of the young ones and

Chapter 2: Literature review
25
education promoting play is essential especially in the current dispensation.
Using blocks to engage in Construction play proffers preschoolers a chance to
classify, order, utilize fractions, measure, count and become cognizant of symmetry, length,
depth, width, shape, and space (Hirsch-Pasek, 2009). As a child constructs a toy, the
mathematical aspects of measurement of lengths, width and heights as mentioned are not only
subconsciously learned but the fine reasoning skills are forged and made alive in the young
mind. With such skills developed, transferring the same ideas to the real world of
construction and design where complex mathematical abilities are needed for personal
achievement becomes much more easy and manageable.
3.7 Relationship between play and later achievement
It was in the year 1982 that a certain research was undertaken on an intact group of
thirty-seven (37) preschoolers who were aged four (4). They were attending a play-oriented
preschool and were tested in accordance to the Lunzer Five Point Play Scale (1955) as a
means of obtaining a block performance measure. Sixteen (16) years later, the records of the
same group of students were obtained and it was found out that at the start of middle school,
seventh (7th) grade, and in the high school grades, there was a positive relationship between
block performance in their preschool and mathematical achievement. The positive correlation
was evident later in the group of students but not in their early grades which raised many
questions. One of the explanations hinged on Piaget‟s formal operational thinking which
begins at about eleven (11) years of age. At this stage, the child begins to think in abstract
terms and they begin their independence of relying so much on concrete objects. Piaget‟s
framework asserts that knowledge is acquired cumulatively and much is drawn from the
motor activities experienced in the pre-operational years and stages. It became clear that the
block-play children engaged in during their pre-school school period enabled them to perform

Chapter 2: Literature review
26
well as the abstract part of their minds became alive after obtaining formal operational
thinking.
There are various aspects of the development of a child that needs special attention as
he or she grows to the kind of a person that the community and the family intends them to be
academically and socially. Beginning from the fine motor skills, the visual perception to the
level of cognitive development that are required of it, play comes in as a critical condiment
and ingredient to employ in making it a success in effective and reliable ways. Alluding to the
literature of Montessori and Piaget, the pioneers of early childhood development theorists,
their observations provide a wealth of information that can be used to attest to the connection
that exist between play and later achievement be it in mathematical, linguistic capabilities or
in any other area of achievement that is in connection to the mind. Piaget (1962) puts forth
that through “reversibility” children develop the ability solve higher scale problems by being
able to drive their thoughts (Mooney, 2002, p.23). “Reversibility” which is enhanced through
play also enables children to begin thinking abstractly. There is resonance between
connectivity and the role that play plays in cognitive and fine motor skill development
(Vygotsky, 1978). He says that children not only put in practice what they know but in the
process of play, they get to learn new things from each other and from the surrounding. Such
knowledge they obtain at an early age is pivotally influential in later achievement and hence
shows how powerful play is in the whole developmental process of a human being. Frost
(1992, p.48) agrees and states that "play is the chief vehicle for the development of
imagination and intelligence, language, social skills, and perceptual-motor abilities in infants
and young children". All of these skills are the building blocks of later experiences in life and
therefore creates an objectively informed assumption that the correlation between play and
later achievement is positive.

Chapter 2: Literature review
27
This study focuses on block play using Lego „6 Bricks‟ activities that are believed to
develop sensory and perceptual skills which include; tactile discrimination, gross and fine
motor skills, and memory skills, auditory and visual perception (Hutcheson et al., 2014). In
this study the visual perception abilities of pre-literacy (Grade R) learners that have been
measured pre- and post-intervention block play using Lego bricks are visual discrimination,
visual memory, and visual sequential memory, all of which are required for the development
of early literacy and mathematical skills (Clutten, 2009).
4. VISUAL PERCEPTION
Visual Perception is referred to as that which the eye can see and the subsequent
ability of the brain to process it accurately (Kellerman & Arterberry, 2006 Deiner, 2005). It is
accompanied by the routine visual functions, the skills that stem from visual perception
enable learners to carry out their daily life activities. The daily life of a child is surrounded by
a multitude of visual stimuli of which most often than not presented dynamically (Kellerman
& Arterberry, 2006). As children explore the environment they depend on the senses to offer
what is necessary about the surrounding (Landsberg, Krüger, & Nel, 2005). Loikith (1997
p.1997) adds that ―visual perception is the point at which an individual‘s knowledge meets
environmental opportunities‖. In psychological literature, goal-theorists describe visual
perception as a “goal-driven” activity. The goal-theorists believe on visual perception as the
perceiver‟s intentions and cognitive skills which initiate and control perception.
Referring to Piaget‟s description of visual perception as an activity which “mentally
acts on a visual scene” (Loikith, 1997 p.198). Piaget‟s emphasis was on “action” as opposed
to sensory associations (Kellerman & Arterberry, 2006 p.109). It is not only constrained
within the aspects of color and shape but includes visual discrimination, shape perception,
spatial orientation, visual memory and recognizing the location of objects as well (Glass,

Chapter 2: Literature review
28
2002). Research driven towards the understanding of visual development in the early life of a
child has revealed a great deal of information and one of the salient ones include the
functions of the visual domain which include many aspects that start and mature at different
periods (Scott, 2003).
The visual system has many cortical and other sub-cortical areas each with a different
onus connected to processing the received visual data (Farroni & Menon 2008). Between the
age of six and nine (6-9) months, it is found out that the acuity of children experiences rapid
improvement and they become more attentive to the surrounding hence indulges in more
exploration visually by examining the objects around them, the ones they are holding, they
become more interested in the activities taking place in their surroundings (Farroni & Menon
2008). This is a very crucial time of visual development and more exposure to objects and
activities should be encouraged at this stage. By the time the children are two years of age,
they have the ability to mimic movements and order objects that have similar characteristics
such as color or shape (Piaget, 1962). It is at this point that they are able to point particular
objects drawn in a book because of visual development. Due to these development stages,
periods of play, times of visual stimulation and excitation are needed for improved co-
ordination, improved levels of visual discrimination and hand-eye co-ordination (McLeod,
2008). For proper object location, shape perception and other day to day visual skills, it is
important to invest in the development of visual perception to enable such skills take root and
assist children throughout their life (Kellerman & Arterberry, 2006)
If such skills are not well developed, Amitary, Kron and Ramous found out that
problems such as dyslexia could ensue (Farroni & Menon, 2008). Other studies also indicate
that there is a potent relationship that exists between difficulties of visual perception and
problems experienced in reading (Gibson, 2014; Badian, 2005). Furthermore, many
Chapter 2: Literature review
29
researchers have approved the hypothesis that a disability in visual perception finally leads to
impediments experienced in learning by the casualty because of association or a connection
between learning difficulties and poor visual development (Deiner, 2005).
Farroni and Menon (2008) conclude that the development of the brain is highly
influenced by the sensory experience that the child will be exposed to. If the experience is
poor, then the brain development is impaired and comes with the ripple effect of affecting
other skills directly linked to the brain (Farroni & Menon, 2008). They state that visual
experience is very important for the vision of a child to develop normally. The relationship
between the aspects of visual perception and other areas of personal development makes this
skill attract significant importance and more research to enhance the effectiveness of its
development becomes of paramount importance (Farroni & Menon, 2008).
5. ASPECTS OF VISUAL PERCEPTION
While visual perception encompasses a number of categories, according to Clutten
(2009) there are three which are especially important for development in young children,
namely visual discrimination, visual memory and visual sequential memory. A description of
each of these three categories is given below.
5.1 Visual Discrimination
In order for a child to be able to identify differences that visual images portray, he or
she needs to have sound visual perception aspect of discrimination (Woodrome & Johnsons,
2009). Visual discrimination refers to the ability ―to differentiate one object from another‖
(Lerner, 2000 p. 271) and adds that it is the ability ―to discriminate position or brightness,
colour, pattern, shape or size‖ it requires learners to observe keenly and be aware of two
aspects of form or objects; i.e. similarities and differences of objects or forms that are critical
Chapter 2: Literature review
30
in learning to read. The ability to distinguish these differences can be between various letters,
figures, numbers or words, numbers like 6/9, 3/8, and 1/7 (Dednam, 2005; Kurtz, 2003)
This visual perceptual aspect is necessary for reading, writing and mathematics
(Retief & Heimburge, 2006). Lerner (2000) found that learners with visual discrimination
challenges struggled to see the difference between similar looking letters and words. For
example, the letters and words; b/d, b/p, wont/want and car/cat. These differences also exist
among visual images where a learner is required to distinguish between different colours and
sizes. For example, a learner is shown various colours and sizes of images and the learner is
able to point out that the red car is much bigger than the blue car and the blue car is much
bigger than the yellow car. In turn, Retief and Heimburge (2006) maintain that any learner
who cannot differentiate between shapes will experience difficulty with literacy and
numeracy. Visual discrimination is therefore vital to reading, writing, spelling and
mathematics.
They add that a learner who is incapable to differentiate between forms, will
experience challenges with literacy and numeracy as form perception is the basis of spelling,
reading, writing and mathematics. Visual discrimination will enable children to interpret
visual imagery that are often used to educate them and hence will also aid in sharpening their
reading and writing skills. If visual discrimination is well developed aspects such as size,
shape, colour and other variables shall be clear and concise to the developing child
(Woodrome & Johnsons, 2009; Lerner, 2000). There are roles that visual discrimination plays
in Early Childhood Development such as in the development of reading and writing,
arithmetic and also in the social development of the child.
Role of visual discrimination in reading and writing
For a child to be able to read and to also write, then the ability to clearly distinguish

Chapter 2: Literature review
31
between letters needs to be enhanced (Baluoti et al, 2012; Woodrome & Johnsons, 2009).
Children have always had the problem of mirroring or confusing letters such as „p‟ and „b‟.
Such problems may be brought about by poor visual discrimination and may induce other
problems in the child as well such as self-doubt and frustration when confronted with words
that look almost similar like not and hot (Baluoti et al, 2012; Woodrome & Johnsons, 2009).
When the visual is impaired or biased then the same will be directly replicated to reading
(Retief & Heimburge, 2006; Dednam, 2005). They maintain that what the eye sees is what
the hand will write and hence has the power to influence writing skills. Visual discrimination
is therefore such an important aspect that cannot be ignored since it affects very important
educational tools of a child.
Role of visual discrimination in mathematics
Mathematics is one of those subjects that are governed by symbols that can be quite
confusing to children. Children are exposed to the demand of having to get well acquainted
with the symbols before being able to understand and hence to solve the problems presented
to them (Perry & Dockett, 2002). Poor visual discrimination may be identified when a child
understands a problem when said verbally or written than when expressed in mathematical
form. For instance, the child may be comfortable with “two plus one” than with 2+1 (Baluoti
et al, 2012; Woodrome & Johnsons, 2009). The sharpening of visual discrimination thus
becomes such a special focus for the purpose of understanding and solving arithmetic
problems and for the sake of reading and writing.
5.2 Visual Memory
Tulving (2000) defines memory as the cognitive capacity to encode, store and retrieve
information and also suggested that there are separate memory systems. These are: short term
memory systems, which refer to the ability of a learner to remember something for a brief

Chapter 2: Literature review
32
moment of time and long term memory systems as the process of storing and retrieving
information (Sousa, 2001). This aspect of visual memory assists one to recall what they have
read or seen by sufficiently processing information through the short term-memory then the
same information is filtered out into the long-term memory. Borsting (2006) defines visual
memory as the ability to retain visual information and to remember what the eyes have seen.
As a child develops, memory develops (Gunning, 2006). Learners need to be attentive to be
able to recall and recognize information later (Dednam, 2005). Visual memory plays a key
role in the child‟s overall development and the skills they need to be successful in school.
Gathercole, Brown and Pickering (2003) suggest that individual difference to store and
retrieve information can directly affect children‟s ability to develop knowledge and skills in
key domains over school years as, in academic situations, learners usually work with shapes,
numbers, letters or words
While learners who have challenges in visual perceptual memory may have problems
to store and retrieve some visual information involving such areas as literacy, mathematics
and other subjects and activities of daily learning, the development of visual working
memory leads to success in reading, spelling and mathematics (Alloway & Archibald, 2008;
Alloway & Alloway, 2010). A learner‟s ability to recall what he or she has seen or read is
vital as, without it a learner will struggle to recall words, patterns of words or numbers and
eventually place them in the wrong order and even omit some letters and numbers.
Deficiencies in recall also contribute to difficulty in following the steps to solve mathematical
problems (Retief & Heimburge, 2006). Visual memory is the most important perceptual
aspects that aid spelling, reading, writing and numerating (Kavale, 1982). When the eye has
the ability to see but the mind finds it difficult to remember or retrieve the information that
has just been taken in by the eye, then visual perception is greatly impaired (Dednam, 2005).
Remembering that which has been seen is an invaluable aspect of visual perception since

Chapter 2: Literature review
33
association and learning would never be possible without this condiment. A well-developed
visual memory enhances comprehension since information in short term memory will be
processed and stored in the long term memory (Hall, 1991).
5.3 Visual Sequential Memory
This is the ability of a child to recall and reproduce letters, numbers, objects or
anything presented to him or her visually in a sequence (one after the other) (Groffman,
2006). It is a skill that is not only quite important in the growth and development process of a
child but it highly determines whether he or she will be able to master tasks such as spelling,
handwriting and even reading. In the class room situation, it refers “to the learners‟ ability to
recognize, recall and reproduce visually presented material in the correct order” (Retief &
Heimburge, 2006, p. 38). Visual sequential memory determines whether a child will be able
to remember letters and words to form sentences in the correct order. It is through exercises
that stimulate the remembrance of things seen that visual sequential memory is enhanced
(Groffman, 2006). As part of the building blocks of visual perception, visual sequential
memory stands as a strong pillar whose skills can be transferred to other areas of life, for
example sound sequencing, handwriting and storytelling. As it plays sacred role in visual
perception as a whole.
6. ROLE OF VISUAL PERCEPTION IN WRITTEN TASKS
As a fundamental skill that is used to communicate from one person to the other,
writing is quite essential and an indispensable part of life. Fine motor skills promote proper
handwriting but there are other skills that must be developed in order for them to remain in
sync (Kurtz, 2003). One of the skill is reading as it is core in learning to spell, write and
accomplish various tasks in mathematics. When the eye, ear and hand functions are integrated
with adequate visual, tactile and auditory information; reading, copying and writing becomes

Chapter 2: Literature review
34
necessary (Jooste & Jooste, 2005).These academic skills require simple perceptual and
cognitive tasks like discrimination of words, letters and numbers (objects or shapes) and
learning about words letters and numbers (Deiner, 2005).The ability to write requires one to
develop aspects like control of posture (Gross motor) perform isolated movements (Fine
motor control) of the hand muscles, perceptual control, motor planning, cognitive processing,
visual discrimination and language processing (Kurtz, 2003).According to Jooste and Jooste
(2005 p.392) writing is influenced by defective visual and/or tactile perception. Handwriting
that is dysfunctional which is a characteristic that relates to visual perception, is apparent in
the way a learner forms letters and numbers (ability to discriminate and remember) and
reversals of numbers together with/or impaired spacing when it comes to written tasks of
words, letters or numbers (Dednam, 2005).
The above mentioned aspects of visual perception work together and they all play a
role in learning. Such learning includes formation of letters, spacing, orienting, copying and
sizing them correctly (Kurtz, 2003). Based on the information received by the eye, a child is
able to imitate letters and forms from books or after an adult has drawn them. Starting from
the pre-drawn model, the child is empowered to reproduce the same letters or forms from
memory. As it can be easily deduced, all of the aspects of visual perception come together
collaboratively to make a task such as writing possible (Kurtz, 2003). The memory and the
motor skills work hand in hand to make everything possible.
According to a psychologist named Gregory (1970), perception tends to be a
constructive process that uses the top-down approach to process information. He argued that
what the eye perceives from the environment is ambiguous and hence cognitive information
of the higher order for instance that from past experiences is required for interpretation
(McLeod, 2008). Helmholtz termed it as “likelihood principle” because a reference is done

Chapter 2: Literature review
35
from the past knowledge. Since the reality is then constructed based on what lies in the
environment and the past information already stored, writing will therefore require apt
aspects of visual perception such as visual memory, fine motor skills and a conducive
environment for the health of its development (McLeod, 2008).
7. DEVELOPING VISUAL PERCEPTION
The manner in which visual perception unfolds is significantly and rapidly developed
from approximately ages three-six (Kellerman & Arterberry, 2006) and this continues up to
age eleven and learnt continuously through the interaction with the environment (Brockets,
2006).
When a child is an infant up to school going age through school years the patterns of
visual perception develops in a manner that is recognizable and this sequential pattern is
agreed by several authors (Brockett, 2006; Bergh & Theron, 2003; Schneck, 2005; William,
1983; Gesell, Frances & Bullis, 1949).
According to Williams (1983) the development of visual perception closely relates to
the age of the learner. Since children mature at different rate, Groth-Marnat (1990) argues
that this includes the rate of visual perception together with eye-motor aspects. According to
Cratty (1979) individuals can discriminate between triangles, squares and circles at an early
age and be able to draw a circle at three years, square at four, triangle at five (visual
discriminatory aspects) and copy a diamond at six (eye-motor integration). Although Carr
(2015) argues that learners may develop eye-motor skills they may not be integrated at the
same time.
8. MEASURING VISUAL PERCEPTION
Much can be said about visual perception, its properties and the aspects that make it

Chapter 2: Literature review
36
up. It is a subject worth a discourse but one of the puzzling things is the question of how the
self-same visual perception can be measured. How can a teacher, parent or an instructor know
whether the visual perception of a child is within the normal limits? How can they then tell
when there is a problem with one of the aspects of visual perception is amiss or
underdeveloped?
From the discussions, visual perception is made up of several aspects which culminate
to a well-developed visual perception (Dednam, 2005). When measuring visual perception
therefore, it follows that an assessment of its building blocks as a mature and better way to
come to a final conclusion about the nature of the overall measurement. Clutten (2009) came
up with visual perceptual aspect tests developed in an African setting used to master school
work and measure the following aspects;
Visual Discrimination; which refers to the visual observation and awareness of
objects in terms of their similarities and differences. Visual discrimination is vital for reading,
writing and mathematics (Reitief & Heimburge, 2006).
Visual Memory; the ability to retain what the eyes have seen and to remember the
various characteristics in an object (Borsting, 2006).
Visual Sequential Memory; the ability to recall forms in the correct order which is a
crucial aspect in reading, writing, spelling and mathematics (Groffman, 2006).
Visual Form Constancy; the ability to recognize the dominant features in an object in
terms of sizes, textures, colours positions or shading (Dednam, 2005).
Visual Closure; the ability of a learner to identify objects with or without the presence
of the object this enables learners read and comprehend easily (Lerner, 2007).

Chapter 2: Literature review
37
Visual Synthesis and Analysis; as the learners‟ ability to change and analyze words
into sounds and synthesize the sounds into understandable words (Dednam, 2005).
Spatial Orientation; the ability to be aware of space around in terms of form,
direction, distance and position (Reitief & Heimburge, 2006). These visual spatial aspects are
crucial for learner‟s letter formation, reading, direction from left to right and locating a new
reading line (Dednam, 2005). The ability to identify and recognize the position of objects is a
developmental process that every learner needs in order to function well within their learning
environment (Scheneck, 2005; Williams, 1983). Visual Spatial Relationships governs the
recognition of numbers and the alphabetical letters which may be varying in size, alignment
and spacing (Reitief & Heimburge, 2006)
Visual Figure Ground Perception; that refers to location of an object or form in an
environment without getting mixed up with what surrounds the busy environment or by the
surrounding images from the background (Lerner, 2000). If one is exposed to a picture or
anything related to it that has got distracting information and he or she is able to extract the
pertinent details from it, then the person is said to have a well-developed Visual Figure-
Ground (Lerner, 2000). This skill is quite important for instance in identifying the key words
on questions, noticing the relevant information from pictures and figures and also having the
ability to ignore what is irrelevant in given scenarios.
Aspects of visual perception facilitate learners to start reading on a place in a
particular page and not losing the specific place (Dednam, 2005). They are the skills that
facilitate the discriminatory aspect, analyses of information and processing of visual
information (Scheiman & Gallaway, 2006), it is through the measurement of these aspects
that we can confirm the nature of visual perception of the child or person in question. Clutten
(2009) developed a test called the Visual Perceptual Aspects Test (VPAT) that measures the

Chapter 2: Literature review
38
above mentioned aspects but for the purposes of this study, the researcher used the first three
aspects of visual discrimination, visual memory and visual sequential memory because the
entire study deals with Grade R learners; those who are about to learn how to read and write.
The test developed by (Clutten, 2009) measures the same aspects.
9. SIX BRICK DUPLO BLOCK APPROACH
The 6 Brick Duplo Blocks are manipulatives that can be used by young children
specifically for play, they are easy to handle and less likely to be swallowed. They come in
different colours that attract children. 6 Bricks assist children with numerous developmental
skills. They are simple and not frustrating to play with because of the clutch power in them.
They are specifically six in number because the average range of vision in a child is at a
range of 6 Bricks required for problem solving and lateral thinking skills. The approach used
with the 6 Bricks activities take short time with simple exercises designed to wake up the
brain and get the child moving, thinking and remembering. They are not intended to be a
curriculum, but they do support all areas of development in the curriculum. (Hutcheson et al.,
2014)
The 6 Bricks concept is designed to excite and motivate young children in the
classroom to attain the skills, knowledge and attitudes necessary for success in later life. In
order to grasp concepts, children must be given time to manipulate concrete tools. They need
opportunities to use their whole body to explore and aid their development of ideas, curiosity
and imagination. Every child has a set of six 2x4 stud bricks, one of each colour, on the desk
or readily available throughout each school day. The teacher can then easily facilitate any
activity at any time. Repetition brings about better organization of the brain and the secret of
the success of these activities lies in their regular repetition which will enable children to
consolidate new knowledge. In play, children develop their most important basic brain

Chapter 2: Literature review
39
function - the ability to control their own behavior in order to reach a goal. The 6 Bricks
activities give plenty of opportunity for the child to practice and improve self-control, which
is fundamental to all other learning in life. 6 Bricks activities develop sensory, speech &
language, cognitive, motor, social and emotional skills in the young child because of the
activities that are fun and inspire laughter and love for learning (Hutcheson et al., 2014)
By using the 6 Brick Duplo Block Guided Play Approach on the preschoolers, overall
Visual Perception performance of preschoolers will be seen directly reflected on their
academic outcomes. The Duplo Blocks are used to construct a series of structures and by
making different shapes using different colours, so as to give preschoolers the ability to
reconstruct what has been previously demonstrated by the instructor. By doing so, sharpen
their visual perception which is critical in their academic performance (Hutcheson et al.,
2014)
6 Brick Duplo Blocks lend preschoolers underlying benefits that past researchers and
literature have illustrated about block play. Being most practiced and popular among groups
of children between three and eight years of age (Nespeca, 2012), constructive play is any
type of activity where the children make or rather build things out of the building blocks.
They therefore construct big things from the small pieces they have. Blocks have been used
by children for a long time for example John Locke introduced alphabet blocks as early as
1693 (Hewitt, 2001). Other well-known educators such as Friedrich Froebel, who is
accredited as the father of kindergarten addresses that “children must master the language of
things before they can master the language of words” and Maria Montessori, have made an
emphasis concerning the importance of block building. In the early 1900‟s Caroline Pratt
(Nespeca, 2012) brought about the unit blocks which became rudimentary in the United
States of America till date. In contrast to Froebel and Montessori, Caroline was an advocator
of free expression and strongly encouraged an open-ended approach to playing with the

Chapter 2: Literature review
40
blocks (Pollman & Phifer, 2010).
The use of blocks has many benefits to the preschoolers and one of them given special
attention. Playing with blocks such as the 6 Brick Duplo Blocks enhances the use and hence
develops fine and large motor skills, gives the children a chance to express their creativity
without limits, offers a platform where teamwork and collaboration is practiced and fostering
of their self-confidence (Hutcheson et al., 2014). Moreover, block play develops the aspects
of negotiation and conflict resolution, improves the co-ordination between the hand and eye,
affords the preschoolers many chances of problem solving, self-confidence build-up and
develops creativity and imagination. In addition, 6 Brick Duplo Block play not only has the
capability of fostering literacy skills and enhancing mathematical capabilities but produces
positive visual or spatial understandings (Hutcheson et al., 2014).
10. CONSTRUCTIONISM
The use of 6 Brick Duplo Block Guided Play Approach that is directed towards the
development of visual perception becomes a gateway through which other areas of learning
are released and made possible to the young learner especially the preschoolers (Ackermann,
1996). Alluding to the works of Farroni and Menon (2008), they came to the conclusion that
the development of the brain is highly influenced by the sensory experience that the child will
be exposed to. If the experience is poor, then the brain development is impaired and comes
with the ripple effect of affecting other skills directly associated with the brain. They state
that visual experience is very important for the vision of a child to develop normally. The
relationship between the aspects of visual perception and other areas of personal development
makes this skill attract significant importance and more research to enhance the effectiveness
of its development.
According to Ackermann (1996) the convictions that teachers and parents deeply have

Chapter 2: Literature review
41
about how their children become knowledgeable, experienced and intelligent become the
main means through which their practices and attitudes towards achieving them are driven.
Whether they believe that intelligence is naturally innate and talent is given, or whether the
surrounding shapes them or whether the children actively construct their knowledge through
interacting with the world around them, the methods and equipment that the three schools of
thought will employ to achieve the final objective will be different (Ackermann, 1996). After
Piaget came up with the theory of Constructivism (Piaget, 1967), where he reveals what
children are interested in and what they are capable of doing at different stages of their
development, some aspects such as the role of context, media and uses together with the
importance of styles or individual preferences as a human learns and develops have been
overlooked and Papert‟s “constructionism” comes as a rescue.
According to Papert (1991) who developed constructionism theory basing on Piaget‟s
constructivism theory (Ackermann, 1996), states that:
―Constructionism—the N word as opposed to the V word— shares constructivism‘s
view of learning as ―building knowledge structures‖ through progressive
internalization of actions… It then adds the idea that this happens especially
felicitously in a context where the learner is consciously engaged in constructing a
public entity, whether it‘s a sand castle on the beach or a theory of the universe
(Papert, 1991, p.1)
Papert‟s approach places more focus on learning via making instead of the collective
cognitive potential of the learner (Ackermann, 1996, p.4). This approach aids in
comprehending the manner in which ideas are formed and transformed if their expression is
done via dissimilar media, when confirmed in certain contexts, when individual minds work
them out. This therefore changes learning from universals to the way learners converse with

Chapter 2: Literature review
42
their favorite artifacts, tools, objects-to-think with and representations. The key to learning
according to Papert is borne in the ability to express and project our inner ideas and feelings
(Ackermann, 1996 p.4) It is through expression that the tangibility and share ability of the
ideas become real and thus sharpens and shapes the same ideas aiding learners to effectively
communicate to the rest using expressions. Knowledge and the potential to expand the human
mind at any level of development in Papert‟s view are grounded in contexts, molded by uses,
and the utilization of external aids. Basing on the philosophy of constructionism from
Papert‟s work, it therefore legitimizes the use of tools and equipment to improve particular
aspects of a learner like the use 6 Brick Duplo Block to enhance the Visual perception
capabilities of pre-school learners.
Though one of the effect in education has been the belief in direct instruction where
teachers see learners as “empty vessels that need to be filled up with knowledge” (Donald,
Lazarus & Lolwana, 2010, p.79). Freire (2000) calls it the „banking approach‟ to education,
which is still seen in schools as „talk-and-chalk‟ teaching. An essential part of constructivism
is that knowledge is not passively received. It is passively constructed (Donald et.al, 2010).
Piaget (1953) and Bruner (1966) have shown that knowledge is not simply „taken in‟ in the
form of human development. It is actively and continuously constructed and reconstructed as
learners‟ progress to higher levels of understanding. Through the use of play with the 6 Brick
Duplo Blocks the learners will be actively involved in the lesson and participate as
contributors of knowledge. Their participation makes learning real, enjoyable and
meaningful. Their brains need to be active all the time. The brain is…. always “learning how
to learn” (Doidge, 2007). It is not an inanimate vessel that we need to fill; rather it is more
like a living creature with an appetite, one that can grow with proper nourishment and
exercise (Doidge, 2007, p. 47) reporting on Merzenich`s (2001) research). Development in
children is based on their active engagement with and exploration of their physical and social

Chapter 2: Literature review
43
world. The implication is that teaching and learning also need to be active, exploratory
process if educators are to optimise cognitive development. This means giving learners
opportunities to try out things, to experiment and discover things, to question and discuss and
to reflect and solve problems for themselves. And what Piaget describes particularly well is
precisely this internal structure and organisation of knowledge at different levels of
development. The idea that learners construct meaning, of course, is the constructivism of
Jean Piaget. Constructivism talks about the invisible construction of ideas and relations
among others, within the mind of the learner add to the idea that /external/ construction of
real artefacts is a powerful means to achieve Piaget`s internal construction of understanding
11. FRAMING THE STUDY
Within the confines of Early Childhood Development, definition of play has been
looked into in details by investigating the various types of play and their impact on the
various developmental aspects of a growing child. Visual perception and its aspects have also
been discussed in detail. It has been unveiled that periods of play, times of visual stimulation
and excitation are needed for improved co-ordination, improved levels of aspects of visual
perception and hand-eye co-ordination. For proper object location, shape perception and
other day to day visual skills, it is essential to invest in the development of visual perception
to enable such skills to take root and assist children throughout their life. Play has also been
found to be linked to intellectual, emotional, social and physical aspects of development, it is
clear that play is cardinal for the general well-being of a child.
From constructionism, the key to learning according to Papert is borne in the ability to
express and project our inner ideas and feelings. It is through expression that the tangibility
and share ability of the ideas become real and thus sharpens and shapes the same ideas aiding
us to effectively communicate to the rest using our expressions. In conjunction with

Chapter 2: Literature review
44
expressing inner ideas and creativity, it has been identified that playing with blocks such as
the 6 Brick Duplo Blocks which promotes expression enhances the use and hence develops
fine and large motor skills, gives the children a chance to express their creativity without
limits, offers a platform where teamwork and collaboration is practiced and fostering of their
self-confidence as well. Block play develops the aspects of negotiation and conflict
resolution, improves the co-ordination between the hand and eye, affords the preschoolers
many opportunities of improving their problem solving skills, boosts their self-confidence,
creativity and imagination. In addition, it is predicted that the 6 Brick Duplo Block play will
not only have the capability of fostering literacy skills and enhancing mathematical
capabilities but will produce positive visual or spatial understandings. By linking the ideas of
visual perception (how it is developed and measured), the notion of play, the six brick Duplo
block guided play and Papert‟s constructionism, the research focuses on answering this
question:
“What will be the effect of using Six-Brick Duplo Block Guided Play Approach on
the Visual Perception of preschoolers?”
12. THEORETICAL FRAMEWORK
As can be seen from the literature referred to above, this study is framed within Jean
Piaget‟s theoretical framework of child development. Piaget carefully observed play activities
in children at different stages and thus formulated the developmental stages of play that
resonate with his positions on cognitive development. Piaget believed that once schemas
became mentally represented they were able to assimilate one another spontaneously.
Cognitive abilities, including visual perception, develop rapidly during the pre-operational
stage (ages 2-7 years), the age group of the children that participated in this study. Children
develop imaginative skills and begin to think in a symbolic manner Piaget emphasizes the

Chapter 2: Literature review
45
role of play during this stage of child development. Play is seen as a vehicle through which
they experience the journey of physical, cognitive and social development and get to
understand the world that surround.
Lev Vygotsky (1967, p.16) has said:
“In play a child is always above his average age, above his daily behavior; in play it is
as though he were a head taller than himself. As in the focus of a magnifying glass,
play contains all developmental tendencies in a condensed form; in play it is as
though the child were trying to jump above the level of his normal behavior”
It is during early childhood that play has the most significant effect on child
development and has great potential in influencing how perception, attention and thinking is
chiseled and modeled. Bodrova and Leong (1996, p. 57) add that:
“Early childhood for Vygotsky was the period during which the restructuring of lower
mental functions goes through its initial stages as children, for the first time in their
lives, use tools to transform their cognitive processes such as perception, attention,
memory, and thinking.”
As can be seen from the contents of this chapter, the theoretical framework for this
study is provided by Jean Piaget‟s theory of child development while the conceptual
framework provided by understandings of play and the development of visual perception.
Bringing these concepts together provides the research with both a point of focus and a lens
through which to interpret the results of the study.
13. CHAPTER SUMMARY
The purpose of this chapter is to review literature on three main issues in the study
namely, the notion of play, visual perception and the 6 Brick Duplo Block approach. Issues

Chapter 2: Literature review
46
pertaining to early childhood development and specifically on play such as; the importance of
play, forms of play, play as a primary medium for development, play and cognitive
development, the role of play in developing reading, the role of play in developing early
mathematical ideas as well as relationship between play and later achievement are elaborated.
Aspects of visual perception, namely visual discrimination, visual memory and visual
sequential memory are clarified. The role of visual discrimination in reading, writing and
mathematics is explored as is the role of visual perception in written tasks. The development
of visual perception and how visual perception can be measured is explained.
Why the 6 Brick Duplo Block approach was chosen as the manipulatives selected for
guided play in this study is explained. Constructionism is explored as a means through which
knowledge is continuously constructed and reconstructed as learners‟ progress to higher
levels of understanding. Finally, a section on framing the study in terms of theoretical and
conceptual frameworks is presented.
.

Chapter 3: Research design and methodology
47
CHAPTER THREE
RESEARCH DESIGN AND METHODOLOGY
1. INTRODUCTION
Chapter three explains and rationalizes the logical underpinnings of this study, the
theoretical viewpoints that underpin the methodology, methods of data collection and
analysis. Research paradigms are discussed to position the philosophical frameworks of the
study and a motivation is put forward for operating within a pragmatic paradigm.
Quantitative and qualitative methods of data collection and analysis are discussed and the
rationale for adopting a mixed-method approach is presented. The research design for this
study is described; the sample and setting described, and the intervention, data generation
instruments, data gathering and data analysis processes are explained. Issues of reliability and
validity are considered and ethical issues are discussed.
2. RESEARCH PARADIGMS
Research has been defined as “a process of systematic inquiry that is designed to
collect, analyse, interpret and use data to understand, describe, predict, or control a
phenomenon or empower individuals in such contexts” (Mertens, 2005, p.2). However, it has
been pointed out that what seemed relatively easy and simple to define has become complex
because of the dramatic increase in the number of research methods used, “especially in the
social or applied sciences” (O‟Leary, 2004, p.8). Mertens (2005, p.2) agrees and writes that
“the exact nature of the definition of research is influenced by the researcher's theoretical

Chapter 3: Research design and methodology
48
framework" Such theory is then used to establish relationships between or among constructs
that go beyond the local event and try to connect it with similar events (Mertens, 2005).
A theoretical framework, as distinct from a theory, is sometimes referred to as a
paradigm, something which determines the motivation and expectations for the research, the
selection of methodology, methods, literature review and research design, and the way that
knowledge is studied and interpreted (Mertens, 2005; Bogdan & Biklen, 1998). Paradigms
are not discussed in all research texts and are given varied emphasis and sometimes
conflicting definitions. For example, the term „paradigm‟ may be defined as “a loose
collection of logically related assumptions, concepts, or propositions that orient thinking and
research” (Bogdan & Biklen, 1998, p. 22) or the “philosophical intent or motivation for
undertaking a study” (Cohen, Manion & Morrison, 2013, p. 22). Willis (2007, p. 8) note that
research paradigms may be seen as “a comprehensive belief system, world view or a
framework that guides research and practice in the field”. Senge (1990, p.8) defines a
paradigm as a “deeply ingrained assumptions and generalisations that influence how people
see the world and behave.” MacNaughton; Rolfe and Siraj-Blatchford (2001, p. 32) highlight
three elements of paradigm namely a belief about the nature of knowledge, the methodology
to be used, and the criteria for validity. Therefore, research paradigms inform the nature of
inquiry and act as means of producing knowledge (Taylor & Medina, 2013).
Research paradigms have become ways of looking at the world which are composed
of certain philosophical assumptions, these assumptions guide and direct thinking and action
not only in choice of method but also in nature of reality (ontology), the theory of knowledge
(epistemology) and specific ways that knowledge can be generated (methodology), in
fundamental ways (Taylor & Medina, 2013; Morgan, 2007). In their perspective, Creswell
and Plano Clark (2011, p.41) argue strongly that the focus of research should be “on the

Chapter 3: Research design and methodology
49
question asked, rather than the method”. In this way it is possible to use multiple methods of
data collection to inform the problem under study and the research can be “pluralistic and
oriented towards „what works‟ and practice” of and not constrained by one perception reality
(Creswell & Plano Clark, 2011, p.41). Their framework for guiding research has been
recognised as a „pragmatic paradigm‟, which enables researchers to use both quantitative and
qualitative methods which may be described as falling within more than one of the paradigms
that have been described, for example the positivist, post-positivist, interpretive and
constructivist paradigmatic stances (Creswell, 2009). As this study uses both quantitative and
qualitative data generating methods when investigating the effects of guided play using the 6
Bricks approach, it may be seen to fall within the ambit of positivism and interpretivism, and
therefore the paradigmatic positioning of this study may be termed „pragmatic‟. In order to
more fully explain this positioning we will briefly consider positivistic, post-positivistic,
interpretative and pragmatic paradigms and then link them with the research methods used in
this study.
2.1 Positivist paradigm
Positivism is "based on the rationalistic, empiricist philosophy that originated with
Aristotle, Francis Bacon, John Locke, August Comte, and Emmanuel Kant" (Mertens, 2005,
p.8) and "reflects a deterministic philosophy in which causes probably determine effects or
outcomes" (Creswell, 2003, p.7). It is sometimes known as 'scientific method' or 'science
research', coupled to the belief that science provides us with the clearest possible ideal of
knowledge (Cohen, Manion & Morrison, 2007). Science is seen as a way a researcher can get
the truth, understand the world and be able to predict and control (Krauss, 2005). The term
scientific knowledge refers to a procedure that consist of systematic observation, testing,
modifying hypotheses, measurement, speculation, constructing theories and explanation in
addition to creating ideas and conceptual tools (Lederman, Abd-El-Khalick, Bell & Schwarts,

Chapter 3: Research design and methodology
50
2002). In this connection, reasoning is grounded on empirical objectivity and mathematical
certainty in order to reveal law-like properties of the material universe (Taylor, 2014). Thus,
the researcher controls the research process in order to maintain objectivity. The aim of a
positivist is to describe an experience or test a theory "through observation and measurement
in order to predict and control forces that surround us" (O'Leary, 2004, p.5). The use of
treatment and control groups, pre-and post-tests, large sample sizes and randomised sampling
are key characteristics of positivist research (Taylor, 2014).
The assumption that "the social world can be studied in the same way as the natural
world, that there is a method for studying the social world that is value free, and that
explanations of a causal nature can be provided" has been contested and criticised by
researchers in social science who believe that material and humans cannot be studied in the
same manner (Mertens, 2010, p.8). Human beings think and have feelings about important
aspects of human experience that cannot be objectively observed (Mertens, 2010). As such,
what can be studied is not limited to that which can be observed, an observation which post-
positivists use to point out the limitations of positivism. There are, however, aspects of
positivism which can provide measures of human abilities that can then be more deeply
explored and interpreted via qualitative methods, as has been done in this study.
2.2 Post-positivist paradigm
Post-positivism aligns in some sense with the constructivist paradigm maintaining that
post-positivists understand the world as ambiguous, variable and multiple in its realities -
"what might be the truth for one person or cultural group may not be the „truth‟ for another"
(O'Leary, 2004, p.6-7). He further proposes that post-positivism is intuitive and holistic,
inductive and exploratory with findings that are qualitative in nature. The use of quantitative
findings can be supplemented by qualitative findings so that the participants‟ thoughts,

Chapter 3: Research design and methodology
51
perceptions, actions and feelings concerning a certain phenomenon are discovered (Taylor,
2014; de Vos, Strydom Fouche &Delport, 2011; Mertens, 2010; Willis, 2007). While the
basis of positivist research is „true experiments‟ which use of large sample sizes and random
sampling, the basis of post-positivism is „quasi-experiments‟ that may use of smaller samples
and non-random assignments (Taylor & Medina, 2013). The latter is exemplified by more
interaction between the researcher and the participants; presence of qualitative data
generation tools like observations and interviews; sampling techniques that includes non-
random sampling and not limiting to random assignments, purposive and convenience
sampling; presence of smaller sample sizes which is not the case with positivist research. The
participants‟ affective responses are regarded as knowledge; knowledge is not based on
objectively measurable empirical evidence only (de Vos, et al., 2011). Post-positivism is
considered by Taylor and Medina (2013 p.3) as a “modified scientific method for social
sciences” where one can use pre and post-tests, interventions, control/comparison and
experimental groups. In this study quantitative and qualitative data have been generated and
triangulated in an attempt to understand the research problem.
2.3 Interpretivist paradigm
The interpretive paradigm is related to the study of hermeneutics, which refers to the
study of interpretive understanding (Mertens, 2005) in that knowledge is socially constructed
by people who are actively engaged in the research process and who can provide numerous
experiences and ideas of reality (Mertens, 2010). The interpretivist/constructivist paradigm
grew out of the philosophy of Edmund Husserl's phenomenology and Wilhelm Dilthey's and
other German philosophers' study of interpretive understanding called hermeneutics
(Mertens, 2005, p.12 citing Eichelberger, 1989). Interpretivist/constructivist methods of
research have the purpose of understanding "the world of human experience" (Cohen &
Manion, 2013, p.36), proposing that "reality is socially constructed" (Mertens, 2005, p.12).

Chapter 3: Research design and methodology
52
The interpretivist/constructivist researcher rely on the "participants' views of the situation
being studied" (Creswell, 2003, p.8) and distinguishes the influence on the research according
to own background and experiences. Constructivists do not begin with a theory (as post-
positivists) but they "generate or inductively develop a theory or pattern of meanings"
(Creswell, 2003, p.9) all through the research process. The constructivist may combine both
qualitative and quantitative methods (mixed methods) or rely on qualitative data generation
methods and analysis. Qualitative data may be employed in a manner, which supports or
expounds upon quantitative data and efficiently expands the description.
This understanding of making meaning of peoples lived experiences relies on a
prolonged process of interaction between the researcher and the participants in an inter-
subjective manner (Taylor, 2014; Taylor & Medina, 2013). Because the data is fully
generated from the participants and not the researcher through an interactive process, the
validity of the interpretivist process relies on the confirmability of a concept relating to
whether the data can be traced back to the starting point or not (Taylor & Medina, 2013;
Mertens, 2010). The methods of data collection can be qualitative or quantitative or a
combination, as was the case in this study.
2.4 Pragmatic paradigm
Pragmatism is not committed to any one system of philosophy or reality. Pragmatist
researchers focus on the 'what' and 'how' of the research problem (Creswell, 2003, p.11). The
initial stance of pragmatists is that they "rejected the scientific notion that social inquiry was
able to access the 'truth' about the real world solely by virtue of a single scientific method"
(Mertens, 2005, p.26). As the pragmatic paradigm recognises that scientific or positivistic
notions are not the only source of truth “the focus is on the consequences of research on the
primary importance of the question asked rather than the method, and on the use of multiple

Chapter 3: Research design and methodology
53
method of data collection to inform the problem under study” (Creswell & Plano Clark, 2011,
p.41). Thus it is pluralistic and oriented towards „what works‟ and practice.” Therefore, no
one system of reality has precedence (Mertens, 2005). The pragmatic paradigm enables
researchers to use both quantitative and qualitative methods, which encompass
positivist/post-positivist approaches when generating quantitative data and
interpretive/constructivist approaches when generating qualitative data (Creswell, 2009).
Pragmatism is seen as the paradigm that provides the underlying philosophical
framework for mixed-methods research (Somekh & Lewin, 2005; Tashakkori & Teddlie,
2003) and it places "the research problem as central and applies all approaches to
understanding the problem” (Creswell, 2003, p.11). With the research question 'central', data
collection and analysis methods are chosen as those most likely to provide insights into the
question with no philosophical loyalty to any alternative paradigm. The pragmatic paradigm
defines the approach was used in this study where both quantitative and qualitative methods
were used.
3. RESEARCH DESIGN AND METHODOLOGY
According to Denzin & Lincoln (2011) and Mouton (2002), research design is a plan
that guides the researcher to carry on with the study. Methodology is a way a researcher
approaches research. This implies the presence of research design underpinned by certain
philosophical principles and research design process. According to King and Horrocks (2010,
p. 6) “design of research and choice of particular methods and their justifications in relation
to research project are made evident”. There is a difference between research design and
research design process (Gibson & Brown, 2009). Design refer to specific approach but the
design process is “the practice of working through a given focus for research and generation
of a research plan and design for that topic” (Gibson & Brown, 2009, p.48).

Chapter 3: Research design and methodology
54
There is need to be clear difference between “methods and methodology” (King &
Horrocks, 2010 p. 6). „Methods‟ can be explained easily as being procedures or techniques
used to collect and analyse data. However, „methodology‟ conveys the process that underpins
a study. King and Horrocks (2010) add that methodology requires a researcher to have
specific reason for the selection of a particular technique of data generation or analysis.
According to the Macquarie Dictionary (1997) the term methodology is the science of
methods, especially: that branch of logic dealing with the logical principles underlying the
organisation of the various special sciences, and the conduct of scientific inquiry. Somekh
and Lewin (2005, p.346) define methodology as both "the collection of methods or rules by
which a particular piece of research is undertaken" and the "principles, theories and values
that underpin a particular approach to research" Walter (2006, p.35) argues that methodology
is the frame of reference for the research which is influenced by the "paradigm in which our
theoretical perspective is placed or developed". Commonly, methodology refers to the overall
approach to research linked to the paradigm or theoretical framework while, on the other
hand, methods are the systematic modes, procedures or tools used for collection and analysis
of data. This definition is consistent despite its frame being a general definition as opposed to
one which is discipline or research specific (Schram, 2006; Leedy & Ormrod, 2005).
3.1 Matching paradigms and methods
Research which applies the positivist or post-positivist paradigm, incline to the use of
quantitative approaches (methods) to data collection and analysis, though not necessarily
exclusively, while the interpretivist/constructivist paradigm commonly operates using mostly
qualitative methods (Cohen & Manion 2013; Silverman, 2000; Bogdan & Biklen 1998;
Burns, 1997; Peshkin & Glesne, 1992). The pragmatic paradigm provides an opportunity for
"multiple methods, different worldviews, and different assumptions, as well as different
forms of data collection and analysis in the mixed methods study" (Creswell, 2003, p.12).

Chapter 3: Research design and methodology
55
Table 3.1 shows how research methods cross paradigm boundaries. In my study it was the
research question that determined which research data collection and analysis methods
(qualitative/quantitative or mixed methods) would be most suitable for the study.
Table 3.1:
Paradigms, methods and data collection tools (Mertens, 2005, p.5)
Paradigm Methods (primarily) Data collection tools
(examples)
Positivist/Postpositivist Quantitative. "Although qualitative methods can be used within these paradigms, quantitative methods tend to be predominant . . ." (Mertens, 2005, p. 12)
Experiments
Quasi-experiments
Tests
Interpretivist/Constructivist Qualitative methods predominate although quantitative methods may also be utilised.
Interviews
Observations
Pragmatic Qualitative and/or quantitative methods may be employed. Methods are matched to the specific questions and purpose of the research.
May include tools from both positivist and interpretivist paradigms e.g. Interviews, observations, testing and experiments.
3.2 Quantitative methods
Quantitative methods refer to objective and systematic processes whereby numeric
data from a selected group are used so to generalise findings (Maree & Pietersen, 2007).
From literature it implies that quantitative research either formulates assumptions reliable
with the positivist or post-positivist research paradigm (Taylor, 2014; Taylor & Medina,
2013; Creswell & Plano Clark, 2011). Quantitative classicists who are positivists judge that

Chapter 3: Research design and methodology
56
social observation should be treated the same way as the physical phenomenon (Johnson &
Onwuegbuzie, 2004). In contrast, post-positivist quantitative research approach is tentative
and cautious in terms of generalising findings (Taylor & Medina, 2013; Creswell, 2009). The
quantitative data that were generated in this study must be viewed via a post-positivist lens.
The data in this study were generated via visual-perception testing in a quasi-experimental
framework of non-random selection and small sample sizes. As such the findings must be
viewed cautiously and tentatively and no assertions of generalizability have been made.
3.3 Qualitative methods
Qualitative research aims at generating descriptive data so as to develop
understanding of what is being observed (Nieuwenhuis, 2007). The focus of qualitative
research falls within the interpretive/constructivist paradigm in order to understand peoples
lived experiences which provide multiple realities. As opposed to positivist philosophy,
which interprets the world in an objective manner, qualitative researchers argue that “the
knower and known cannot be separated because the subjective knower is the only source of
reality” and therefore multiple realities exist (Guba, 1990 cited in Johnson & Onwuegbuzie,
2004, p.14). Johnson and Onwuegbuzie (2004) argue that time and content-free
generalisations are not possible because research is value bound and therefore it is almost
impossible to differentiate causes and effects flowing logically from the specific to the
general. The findings in this study that were generated from interviews and classroom
observation are therefore not meant in any way to be taken as generalizable results.
Interviews
Interviews are the most predominant methods of data generation used in qualitative
research (DePoy & Gilson, 2008). Researchers obtain information through direct exchange
with the participants whom they expect to be having knowledge searched (DePoy & Gilson,

Chapter 3: Research design and methodology
57
2008). Kvale as cited in Sewell (2001, p.1) gives a definition of qualitative interviews as
“attempts to understand the world from participant‟s point of views, to unfold the meaning of
peoples experiences, [and] to uncover their lived world prior to scientific explanations”. Gay
and Airasian (2000) explains that interviews provide a researcher with data which cannot be
gathered through observations and allows a researcher ask probing questions in order to
explore participants‟ responses that regards their concerns, experience, interest, feelings and
attitudes. Interviews are social relationship made for the purposes of exchanging information
between the researcher and the participant. The quality and quantity of the exchanged
information depends on the interviewer‟s creativeness and astuteness toward management
and the understanding of relationships (Monette, Sullivan & DeJong, 2005).
Semi-structured interviews refer to those interviews done around a particular interest
in an organised manner with considerable amount of flexibility in-depth data gathering and
scope (DiCicco-Bloom & Crabtree, 2006; Jarbandhan, 2006). In this study semi-structured
interviews were held with the two teachers who participated in the intervention. The
interview schedule was similar for the two teachers (Appendix A). The interviews help the
researcher to gain a better understanding of their perceptions on the use of the 6 Brick
approach on pre-school learners‟ visual perceptual development.
Classroom observations
Data gathered through observation boils down to the actual classroom observation
and taking of field notes. Druckman (2005 p.247-249) refers to this step of data gathering as
„appropriately taking note while taking notes.‟ Participant observation is also necessary as
these may maximise observational efficacy, lessen investigator bias and permit for
verification of data (Denzin & Lincoln, 2005). Judd, Smith and Kidder (1991 p.304) illustrate
that „field notes should consist of everything the researcher sees and hears‟. This may seem

Chapter 3: Research design and methodology
58
uninteresting, boring detail, which the researcher is unlikely to recognize at the beginning of
a study but might become important later on. A report on observation is done and maintained
in form of field notes. Silverman (2000) propose two practical rules for making field notes
that is recording what we see along with what we hear, and develop field notes beyond
immediate observation. It is difficult to write down all observed material in qualitative
research. The researcher‟s task is to make systematic and accurate notes as soon as the
observation session has ended. The loose notes and jottings made should be converted into
field notes as soon as possible, at least at the end of every observation session (Druckman,
2005). Data becomes less accurate if more time passes between the session and the making of
field notes. In the case of my research study, I visited the South African school while I was
there and visited the Kenyan school while I was there. This happened at different times. I was
observing what was going on in the classroom before or during or after the play session. I did
not have any prepared tool that guided me during the observation sessions but did open ended
observation in order to have an idea of what was going on in the two classrooms
(experimental classes South Africa and Kenya) and how learners were learning. After every
observation I sat and made my field notes from what I had observed and heard.
3.4. Mixed-methods
A mixed-methods approach involves gathering both numeric information (e.g., via
instruments such as tests) as well as text information (e.g., via interviews) so that the final
database represents both quantitative and qualitative information (Creswell, 2003, p.20)
which can be combined. Mixed-methods research has been identified as a "key element in the
improvement of social science, including education research" with research strengthened by
the use of a variety of methods and one which "requires a greater level of skill, can lead to
less waste of potentially useful information and creates researchers with an increased ability
to make appropriate criticisms of all types of research" (Gorard & Taylor, 2004, p.7). Mixed-

Chapter 3: Research design and methodology
59
method research often has greater impact because figures can be very persuasive to policy-
makers whereas stories are more easily remembered and repeated by them for illustrative
purposes (Johnson & Onwuegbuzie, 2004; Creswell, 2003).
To date, research styles are becoming more complex in design and more flexible in
their application of methods with mixed-methods being more acceptable and common
(Denscombe, 2008). Some questions may lead a researcher to favour qualitative or
quantitative approaches and no one paradigm essentially recommends or prohibits the use of
any of the methodological approach (Creswell & Plano Clark, 2011). If the research is to be
fully effective, qualitative and quantitative methods might be required. Research may become
disadvantaged if it does not permit the use of both methods. The pragmatic paradigm, which
openly recommends mixed-method approaches, permit the question to define the data
collection and analysis methods applied, collecting both quantitative and qualitative data and
integrating the data at different stages of inquiry (Creswell, 2003), as was done in this study
which utilised tests, intervention, observations and interviews.
Mixed-methods also increase the validity and trustworthiness and lead to a better
understanding of the data that has been generated (Creswell, 2003). Creswell and Plano Clark
(2007) add that it is not enough to simply collect and analyse quantitative and qualitative
data; that need to be “mixed” in order to form a more complete response to the research
problem, unlike when standing alone. Johnsons and Turner (2003), as cited by Teddlie and
Tashakkori (2009, p.238) explain the fundamental principles of mixed methods that “methods
should be mixed in a way that has complementary strengths and non-overlapping
weaknesses.

Chapter 3: Research design and methodology
60
As stated by Onwuegbuzie and Leech (2006), mixed method research has logical and
intuitive appeal that provides a bridge between qualitative and quantitative paradigms. It has
the ability to match the purpose of the method together with what is needed in the study. An
example is getting key issues and methods clarified before the development of the study
(Tashakkori & Teddlie, 2010). In addition, the complementary case between qualitative and
quantitative data can be clarified throughout the study and give direction on complex or
contradictory responses as well as unexpected themes and information that might have not
come to light (Driscoll, Appiah-Yeboah, Salib and Rupert, 2007). The combination of data
types can provide a better understanding of both the qualitative or quantitative findings
(Creswell, 2009). In turn, Driscoll et al., (2007) believe that a mixed-method approach may
compromise sample size, and increase the time and resources needed to make the study
possible. There are also challenges of timing of the sampling and difficulties in compiling,
managing and analysing the data.
3.5 Mixed-Method Designs
Mixed method research has attracted considerable attention in terms of types of mixed
method designs (Teddlie & Tashakkori 2009). Such attention has taken place diverse
disciplines such as educational research, evaluation, and human science disciplines since late
1980‟s. These typologies are different in terms of their complexities (Onwuegbuzie & Collins
2007). Nevertheless, the majority of mixed methods utilize time factors as their base,
meaning whether both qualitative and quantitative data takes place at the same time or
approximately almost at the same time (concurrent), or if they occur one after the other with
the one that comes last being dependent on the one that came earlier (sequential). Other
important aspects to consider in mixed-method research is whether the study is exploratory,
explanatory or convergent mixed-method designs, and the priority given to either the
quantitative or qualitative data.

Chapter 3: Research design and methodology
61
3.6 Explanatory Mixed-Methods Design
Explanatory mixed method design is also referred to as a two phase mixed methods
design. Explanatory research uses qualitative data to help make sense of quantitative data
(Figure 3.1).
Figure 3.1: Explanatory mixed methods design (Creswell &Plano Clark 2007, p.73)
In this study I trained the teachers on how to guide children through play with the
blocks after which the first data that I generated were quantitative via pre-post-tests.
Thereafter which I generated qualitative data via teacher interviews. The observations I made
in the classroom were only analysed after the post-test and used in to make sense of the
quantitative findings. The main purpose of this design was therefore to use the qualitative
data to make sense of the earlier data generated through quantitative testing (Creswell &
Plano Clark 2007). In my case priority was given to quantitative data generated.
As depicted in Figure 3.1, the sequence that I followed was a sequential explanatory
mixed-method design. The pre-tests were given to the learners in the first phase, followed by
intervention period of four months after which post-tests were administered. The qualitative
results on teacher interviews and observations were used to help understand the data
Quantitative Data Collection and
Analysis
Qualitative Data Collection and
Analysis
Interpretation

Chapter 3: Research design and methodology
62
generated via quantitative testing (Creswell, 2005; Creswell, 2009; Creswell & Plano Clark,
2011). These data were then triangulated.
3.7 Triangulation
Creswell and Clark (2011), Mertens (2010), and Johnson and Christensen (2008)
explain that triangulation takes place by cross-checking information through the use of
multiple data collection procedures. Corroboration or proof is seen if the findings are in
agreement through the consistency from the different sources of data generation. Mixed-
methods allow triangulation of different kinds of data in order to understand the phenomenon
of interest (Creswell and Clark 2011). It may involve concurrent or sequential, but separate,
collection and analysis of qualitative and quantitative data, so as to compare and contrast the
findings and check on the extent to which they agree or do not agree (Figure 3.2). This study
triangulated the classroom observation, teacher interviews, and visual perceptual aspect test
data.
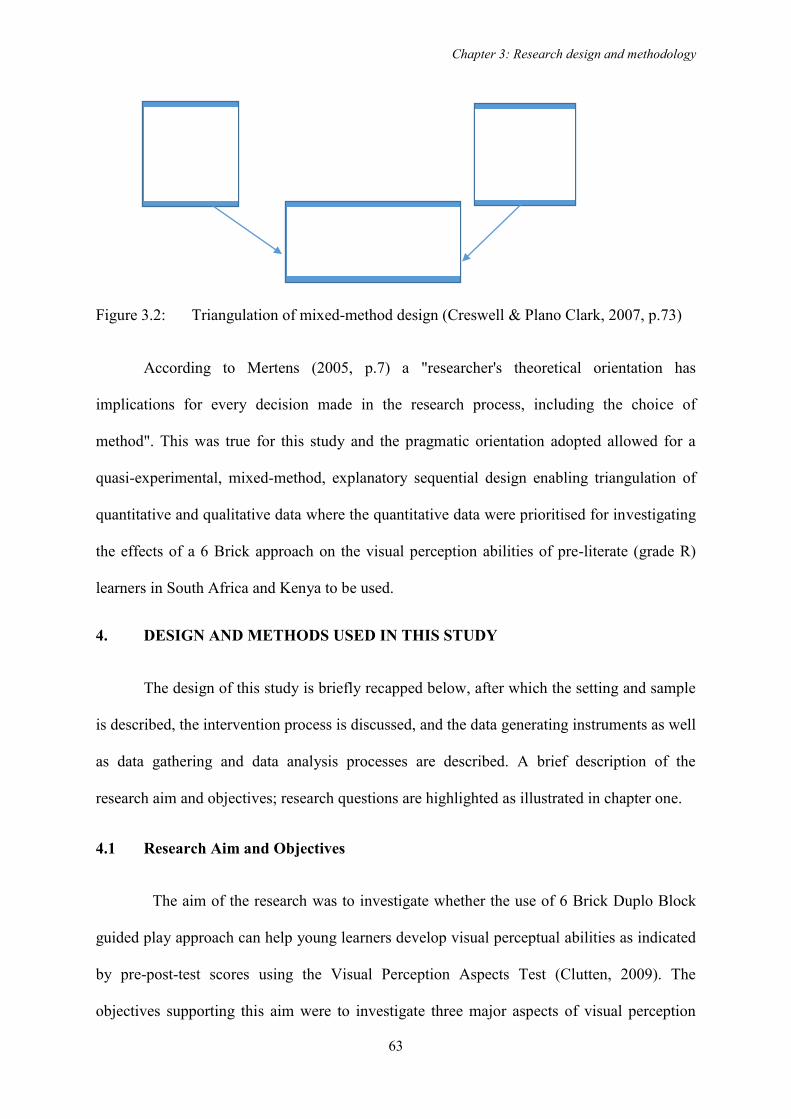
Chapter 3: Research design and methodology
63
Figure 3.2: Triangulation of mixed-method design (Creswell & Plano Clark, 2007, p.73)
According to Mertens (2005, p.7) a "researcher's theoretical orientation has
implications for every decision made in the research process, including the choice of
method". This was true for this study and the pragmatic orientation adopted allowed for a
quasi-experimental, mixed-method, explanatory sequential design enabling triangulation of
quantitative and qualitative data where the quantitative data were prioritised for investigating
the effects of a 6 Brick approach on the visual perception abilities of pre-literate (grade R)
learners in South Africa and Kenya to be used.
4. DESIGN AND METHODS USED IN THIS STUDY
The design of this study is briefly recapped below, after which the setting and sample
is described, the intervention process is discussed, and the data generating instruments as well
as data gathering and data analysis processes are described. A brief description of the
research aim and objectives; research questions are highlighted as illustrated in chapter one.
4.1 Research Aim and Objectives
The aim of the research was to investigate whether the use of 6 Brick Duplo Block
guided play approach can help young learners develop visual perceptual abilities as indicated
by pre-post-test scores using the Visual Perception Aspects Test (Clutten, 2009). The
objectives supporting this aim were to investigate three major aspects of visual perception
Quan data generation
and analysis
Qual data generation
and analysis
Quan + Qual results are compared and
interpreted

Chapter 3: Research design and methodology
64
that are essential to developing reading writing and numeracy skills, namely: visual
discrimination, visual memory and visual sequential memory. The study focuses at Grade R
learners in foundation phase in South Africa and middle class nursery Early Childhood level
in Kenya as children of this age bracket have usually just entered formal schooling and are
about to learn how to read and write and become numerate.
4.2 Research Questions
The study attempted to investigate the following primary research question:
Does guided play using the 6 Brick Duplo Block approach have an effect on pre-
school learner‘s visual perception abilities?
The following secondary interrelated questions needed to be answered in order to
answer the primary research question:
What are the effects of using the 6 Brick Duplo Block guided play approach on
pre-literate learners‟ visual discrimination abilities?
What are the effects of using the 6 Brick Duplo Block guided play approach on
young learners‟ visual memory abilities?
What are the effects of using the 6 Brick Duplo Block guided play approach on
young learner‟ visual sequential memory abilities?
What are teachers‟ perceptions of the use of the 6 Brick Duplo Block approach
on pre-literate learner‟s visual perceptual development?

Chapter 3: Research design and methodology
65
4.3 Design
As noted earlier, in this study a quasi-experimental, pre-post-test, mixed-method,
explanatory sequential design which enabled triangulation of quantitative and qualitative data
were developed for this study. A pre-post-test design was used to investigate the effects of the
strategy on the learners‟ visual perception abilities and the participants were selected via
purposive convenience sampling, i.e. from schools in South Africa and Kenya that were
prepared to be part of the research and were accessible to the researcher by using local
transport, and which drew children from similar socio-economic groups in similar urban
settings. A quasi-experimental design resembles a true experiment the only difference is a
quasi-experiment may use a variety of sampling techniques e.g. convenience sampling
instead of random assignments and may use smaller sample sizes other than larger sample
sizes (Taylor, 2014; Taylor & Medina, 2013; Mertens, 2010). As there was no random
assignment to the experimental and comparison groups and the fact that the sample sizes
were relatively small (classes of approximately 20 children each), the design used in this
study can be considered to be quasi-experimental (Cohen et al., 2007).
Teachers in two Grade R classes, one in a school in South Africa and one in a school
in Kenya, were trained in the use of the 6 Brick Duplo-block approach and provided with
Duplo-blocks and selected Duplo-block activities. The first reason for working with pre-
schoolers is that, while there has been some research in terms of developing visualisation
using 6 Bricks in older children, there was little to no evidence in my literature search that
such research has been conducted with children who have not yet been taught to read and
write. The second reason is that visual perception is a key aspect of learning to read and
write (Clutten, 2009) and is therefore an aspect of child development that is worthy of study.

Chapter 3: Research design and methodology
66
Both of these schools chosen for this study have two Grade R classes which meant
that in each case a second Grade R class was available as a comparison group. The
comparison group teachers were not trained in the Duplo-block approach nor did the children
receive Duplo-blocks. Once the intervention and testing was complete, the teachers who had
been trained to use the Duplo-blocks shared their experience with the comparison group
teachers and Duplo-blocks were also supplied for the comparison group classes.
The pre-post-tests used were the first three sections of the Visual Perception Aspects
Tests (VPAT). These sections dealt with the visual perception aspects of visual
discrimination, visual memory and visual sequential memory. The data generated by these
tests was subjected to descriptive and inferential statistical analysis. As part of the
explanatory sequential mixed-methods design the experimental group teachers were
interviewed after the intervention and the classroom observation field notes were interrogated
in order to help explain the quantitative data findings. Figure 3.3 provides an overall visual
representation of the research design used in this study.
Figure 3.3: Visual representation of the research design used in this study
4.4 Setting and sample
As noted above, the schools selected in South Africa and Kenya comprised a
purposive sample of pre-literate children from similar socio-economic groups in similar
Observation

Chapter 3: Research design and methodology
67
urban settings and who are taught in English. The two schools chosen for this study had two
pre-school classes each (one of each which with their respective teachers could be used as the
experimental class and the other the comparison group class). Each one of the four classes
(two in South Africa and two in Kenya) were similar in size, namely 20- 25 children in each.
These children were considered to be pre-literate as they were in pre-school school
preparatory classes with reading and writing only being taught in the following year. Such
classes are called Grade R in South Africa and as middle class pre-units in Kenya. As noted
above, each of the schools chosen had two such classes which provided a convenient way
into which to select experimental and comparison groups. The classes of the teachers in each
school who were keenest to be involved formed the experimental group in each country.
In my study thirty-eight (38) learners took part in the South African school, 20 in the
comparison group and 18 in the experimental group (class). In the Kenyan school, 39 learners
took part in the study, 19 in the experimental and 20 in the control group, i.e. a total of 39
participants. Only the experimental group teachers who allowed their children to play with
the 6 Brick Duplo blocks in the experimental classes were interviewed. When using mixed
methods, samples of above 30 participants are usually recommended if one is seeking
statistical probabilities at confidence levels of 95% or more. As such, it is recognised that the
fact that the class sizes were only approximately 20 might present challenges, but it was also
decided that as it was possible that they could still provide sufficient data to provide
sufficient confidence in the findings, and as no attempt was being made to generalise
findings, the use of mixed methods remained an appropriate design for this study (Creswell
&Plano Clark, 2011). Similarly, using only two teachers as interviewees to generate
qualitative data was also accepted as being appropriate in that they could probably provide
adequate in-depth understanding from involved participants (Creswell & Plano Clark, 2011).

Chapter 3: Research design and methodology
68
4.5 Intervention
The intervention can be presented in two phases. The first phase involved the
training of the teachers in the use of the 6 Brick Duplo block activities with their learners.
These activities were selected by the researcher by reading through all the activities in the 6
Brick Duplo block activity booklet and then selecting activities that appeared to bet fit the
development of visual discrimination, visual memory and visual sequential memory (VD,
VM, VSM, respectively) over a period of four months using ten-minute activities four times a
week. After choosing the activities from the booklet they were photocopied in colour and put
in the same order in five different files four for the teachers and one for the researcher. The
files contained: activities on the different aspects in the order VD, VM and VSM, record of
completed activities, completed record sheets containing date, activity name, number of
blocks used, learners completed the activity, learners‟ enjoyment of activity and a section was
left blank for comments (appendix B). The comparison group teachers only received their
files and blocks once the intervention period and data generation were completed.
Training of the teachers in the South African school where the study was conducted
was done by the researcher accompanied by the psychology students in the month of June,
2016. The training was done in a manner that the researcher guided the teachers and the
psychology students in terms of how the teachers should facilitate play with the 6 Bricks by
their children during the four-month intervention period. The activities were set out in the
teacher‟s files to be done one per day in the order VD, VM and VSM for 10 minute per
activity for three days per week. The fourth day of the week was reserved for the teacher to
repeat an activity that she believed was not well understood. This process was repeated in the
month of July, 2016 in the participating Kenyan school. During the intervention period I
visited the schools to observe how the teachers were progressing. My observations were
recorded as field notes.
Chapter 3: Research design and methodology
69
4.6 Data generating instruments
The instruments used to generate the data were the Visual Perceptual Aspect Test
(appendix C) which shows samples of the test on the three aspects of VD, VM and VSM (the
test was too bulky and as a result, only a few samples are indicated in this appendix), which
was administered to the children as pre- and post-intervention tests; semi-structured
interviews after post-tests were conducted; and the field notes on my open ended
observations made during class visits.
Visual Perception Aspects Test (VPAT)
The VPAT test used as the pre- and post-test contained the following:
A biographical information section where the researcher, with assistance from the
teacher had to fill the following information, school, Grade (to distinguish
between the experimental and comparison groups), gender, date of assessment,
date of birth, chronological age, home language, relevant background information
(such as wears prescription of lenses or diagnosed with attention deficit disorder).
The three Visual Perceptual Aspect Tests of Visual Discrimination, Visual
Memory and Visual Sequential Memory. Each of these aspects had sixteen
questions, i.e. a total of 48 questions were asked.
Instructions for each sub-test on how the test should be administered (for the
tester)
A score sheet for each sub-test.
Semi-structured interviews
I used a semi-structured interview in order to gain a detailed picture of teacher‟s
perception on the use of 6 Brick approach on pre-school learners visual perceptual

Chapter 3: Research design and methodology
70
development. I had a set of predetermined questions on the interview schedule which acted as
a guide for the whole interview process that was video Kenyan school and audio RSA school
recorded [The recording apparatus that was available to me in Kenya was a video recorder
and, as such, provided both audio and video data. In South Africa I used an audio-recorder as
I considered audio data sufficient to meet the purpose of generating the conversational data
that I required.]. The teachers I interviewed shared with me freely, I also made clarifications
on questions that were not clear or well understood and this gave the teachers maximum
opportunity to tell their story.
Classroom observation
As noted earlier, while in the school in South Africa I made five open-ended
classroom observations as to whether the play sessions were carried out as expected, what
other play activities took place while I was in the classroom, what play resources were made
available to the children, and how enthusiastic the children were when taking part in the play
activities. As noted earlier I had no particular instrument to use, but simply recorded my
observations in a field note book. During the first session of play with the blocks I guided the
children in terms of the activities, playing with them for three different introductory activities
from the file I had prepared for the teacher for the entire intervention period. I observed how
well the children were able to follow instructions and if they were able to complete each
activity. I repeated this process in the Kenyan school where I made eight school visits.
4.7 Data generation
The Visual Perceptual Aspect Test (VPAT) was administered as a pre-test to all of the
children in the four classes in the two schools with the help of five fourth-year psychology
students from Nelson Mandela University in the school in South Africa. This was also done
with five third-year psychology students from Moi University in the school in Kenya. The

Chapter 3: Research design and methodology
71
VPAT is a psychological test and therefore was administered with the assistance of five
fourth-year psychology students from the department of psychology at the Nelson Mandela
University under the guidance of a professor of psychology (Professor Chris Hoelson) and
the assistance of my supervisor, Professor Paul Webb. Fourth-year students were selected
because they had to undergo their internship the following year. They were keen to assist as
the exercise on testing could help them gain experience in the field.
The visual perceptual aspect test used was a printed test which used toy shapes which
had to be identified in 2D on paper. It was administered as a pencil-and-paper test under the
individual guidance of the psychology students and the researcher. This process took
approximately 20-30 minutes per child tested. As at least five children could be tested at a
time by the five testers and the researcher, the entire group per school (experimental and
control) could be tested during the course of one school day. Testing took place in a room
provided for the purpose by the schools and the children were drawn from their classrooms in
batches of five or six.
Pencils were provided to mark the selected shape and patterns on the test paper. The
children put a mark on the selected answer on the test booklet and the researcher and the
psychology students recorded their answers selected on a separate answer sheet each time
during the testing session (pre and post-test) (appendix D). I then went through the answer
sheet and the marked test booklet to check for errors and omissions. I then recoded the
answers according to the three aspects visual discrimination, visual memory and visual
sequential memory electronically into an excel spread sheet. Then I made a code book
(appendix E) to explain the recorded results per code in the excel spread sheet because the
excel function recognises numbers only. The excel spread sheet contained coded results of
pre-post-tests (experimental and comparison) of the South African school (appendix F) and
Kenyan coded results of pre-post-tests (experimental and comparison) results (appendix G).

Chapter 3: Research design and methodology
72
This exercise (pre-test administration) began in South Africa in the month of June,
2016 (I was in South Africa from the 1st of April, 2016 until the 5th of July, 2016). I then
travelled to Kenya in the same month of July and secured a similar school in Kenya in which
to conduct the research (similar in terms of the criteria of being similar in terms of socio
economic status, teaching being in English and being in an urban area of almost similar
setting). Similar procedures were followed in terms of seeking consent to do my study in the
Kenyan school, training the teachers, getting six third year psychology students from Moi
University through the assistance of my second supervisor, Professor David Serem to assist in
the testing in the Kenyan school. Third year students were chosen in Kenya because at Moi
University it is in their third year that students prepare for their internship so, as in South
Africa, the testing exercise helped them gain experience in the field.
The two schools then also followed a four-month intervention period during which the
experimental class teacher guided the children to play with the 6 Bricks. I did open-ended
observations when I visited the schools. This was followed by administering post-tests in the
month of October, 2016 with the assistance of the same psychology students. I did the post-
tests first with the Kenyan school because I was in Kenya at this time. Finally, while in the
Kenyan school, after preparing an interview schedule, I conducted semi-structured interviews
with the experimental class teacher. I then travelled to South Africa in the month of
November, 2016 and conducted post-tests in the South African school with the assistance of
the same fourth-year psychology students and interviewed the experimental class teacher.
This process meant that there was a slightly longer time lapse between the pre- and post-
testing in South Africa compared to Kenya, but I believe that this had little effect as the
teacher in South Africa simply spread out the activities over the three extra weeks available
to her.

Chapter 3: Research design and methodology
73
My open ended classroom observations were done in the course of the intervention
period but only inspected after the post-testing was complete. Individual teacher interviews to
find out the teachers‟ perceptions on the use of 6 Brick Duplo Block approach on the
development of visual perception in children, and which were audio and video recorded, were
also conducted after the post-tests were administered.
4.8 Data Analysis
The quantitative data from the VPAT testing was subjected to statistical analysis.
There are a numbers of statistical packages that can be used to generate descriptive and
inferential data such as SPSS, Statistica, BMDP, etc. However, these programmes can only
be used under licence at a cost, and most African universities either do not have these
packages or only pay for them for selected projects where funds are available. As Excel,
which is part of the Microsoft Office package can perform the same or similar types of
statistical analysis required of this study (Carlberg, 2011), and is available to anyone who has
the Office package at no cost, it was therefore the program of choice for this study. A sample
of the data generated were also subjected to statistical analysis for comparison using the
Statistical Package for the Social Sciences (SPSS), which verified all samples of descriptive
and inferential generated when using the excel function.
The results of the pre- and post-tests, which had been entered into an excel spread
sheet and coded for statistical analysis, were treated statistically using Excel to generate
descriptive statistics such as sums (totals), counts, averages (means) and standard deviations.
From these statistics visual presentations could be made using the graph functions of the
package. The Excel package also offers access to a variety of inferential statistics. As the data
generated were matched pairs, and since t-Tests are least subject to the effects of small data
sets not being distributed normally (Carlberg, 2011), this test was chosen to investigate

Chapter 3: Research design and methodology
74
whether there were any statistically significant differences between group scores and between
changes in mean scores in the groups of children tested. As the samples were relatively small
a 90% level of confidence (p≤0.1) was selected as the indicator of significant difference
between groups. This level of confidence is considered to be very low in statistical terms
(Carlberg, 2011), but has been used by some social scientists in the past depending on the
nature of their study and was considered to be appropriate for this small scale, master‟s
degree level, study. Where higher levels of confidence were attained, these were considered
to be „bonus‟ findings.
Both the open-ended qualitative classroom observation and individual interview data
were simply inspected after the post-testing was complete. Issues that arose that were
pertinent to this study were extracted and considered in light of the quantitative data
generated and the issues covered in the literature review in chapter two.
5. VALIDITY AND RELIABILITY
In any research endeavour validity and reliability are important to the research
process and, since the study adopted a mixed-method approach, validity will be discussed
differently in terms of the quantitative and qualitative aspects of the research.
Validity and reliability in quantitative research
According to Creswell (2005), refer quantitative reliability as obtaining results that
are accurate and consistent from the research instrument and if similar participants are given
the same instrument repeatedly similar or almost similar results will be achieved. According
to Mertens (2005) the reliability of research instruments are calculated using statistical
analysis. According to Creswell (2005); Struwig, and Stead (2001) validity refers to the
accuracy of the research instrument in order to draw conclusions. This confirms the outcome
of results in relation to the research objectives (Basit, 2010). In this research the visual

Chapter 3: Research design and methodology
75
perceptual aspects test (VPAT)was the core of Clutten‟s research has been shown to be both
reliable and valid and therefore no further discussion will be made in terms of its validity or
statistical analyses such as Cronbach α calculated for the small samples used (Clutten, 2009).
However, distribution of the normality of the data generated was checked before the data
were subjected to statistical analysis as this would provide a guide as to the type of tests that
could be used and how the levels of confidence at which the findings might be interpreted.
Reliability and validity in qualitative research
Reliability is a concept mostly used for testing quantitative research though the idea is
often used in all research as it relates to the quality of explaining and generating
understanding (Stenbacka, 2001 p.551). According to Patton (2002) validity and reliability
are factors needed while designing a study, judging quality and analysing results. To ensure
reliability in qualitative research, trustworthiness is crucial. According to (Seale 1999 p.266)
“trustworthiness of a research report lies in the heart of issues conventionally discussed as
validity and reliability” Lincoln and Guba 1985 states that there can be no validity without
reliability as validity establishes reliability (Patton, 2001). The adoption of concepts of
validity in qualitative research has been considered to be what is more appropriate in terms of
rigor, quality and trustworthiness (Stenbacka, 2001). Establishing the truth through reliability
and validity is replaced by trustworthiness used in establishing confidence in findings
(Mishler, 2000). The term trustworthiness is a preferred option for notions of validity and
reliability in qualitative research the purpose of qualitative research is to gain insight into
specific phenomenon and not generalise findings (Koonin, 2014). Dependability serves as the
reason for assessing trustworthiness (Butler-Kisber, 2010; Bloomberg & Volpe, 2008).
Credibility and dependability serve as the criteria for the assessment of trustworthiness.
According to Bloomberg and Volpe (2008) credibility refers to how accurate and true
researchers interpret and describe information revealed from the participants. Koonin (2014)

Chapter 3: Research design and methodology
76
is in agreement with the definition of credibility by Bloomberg and Volpe. They add that
researcher‟s findings need to be dependable representation of the participant‟s views.
The qualitative aspect of the study aimed at finding out the teacher‟s views and
perceptions regarding the use of 6 Brick Duplo block approach on learners‟ visual perceptual
abilities and gleaning notions of classroom contexts and interactions to help explain
quantitative findings. In order to minimise misunderstandings during the semi-structured
interview, the researcher gave a clear explanation of the questions asked, especially areas
where the participants felt that clarification was necessary. Similarly, multiple classroom
visits were made to enhance the believability of the issues that were identified.
6. ETHICAL ISSUES
Research is an ethical practice that encompasses morals or rules of behaviour
(Struwig et al., 2001). It is researchers‟ role to abide by the code of research conduct. They
have to ensure privacy as they conduct research with participants (Struwig et al., 2001).
Creswell (2009) professional ethics encompasses the following; respect, fairness, honesty,
integrity, confidentiality, anonymity, privacy and informed consent. Prior to data collection,
the researcher visited the schools in South Africa and Kenya to discuss the aims, research
design and methodology of the study with the school principals. The teachers volunteered to
take part in the study and their responses were only used for the purposes of this research.
The teachers who participated in the semi-structured interviews signed consent forms which
was similar for the two teachers (appendix H) and consent forms were signed by the parents
of Grade R learners from the two schools (appendix I South African parents and Appendix J
for the Kenyan parents). The participants‟ anonymity was kept throughout the study. Ethics
approval of this particular study was provided by the Faculty of Education Research,
Technology and Innovation Ethics Committee and the Human Ethics Committee at the
Chapter 3: Research design and methodology
77
Nelson Mandela Metropolitan University as an addendum to an umbrella study conducted
under ethics number H14-EDU-ERE-014.
7. CHAPTER SUMMARY
In this chapter I have discussed the philosophical underpinnings of the study, located
the study in the pragmatic paradigm and considered the appropriateness of a mixed-methods
approach to answer the research questions The quasi-experimental, pre-post-test, mixed-
method, explanatory sequential design which enabled triangulation of quantitative and
qualitative data is described and explained. The generally equivalent setting and samples in
South Africa and Kenya are described and reasons for the choice of schools and grades are
given. The intervention and data generating process is explained in detail, with particular
emphasis on what was done by whom and why it was done in the way that it was done. The
data analysis process is described and the reasons why Excel was used for statistical analysis
is explained. The types of analyses undertaken, namely the statistical treatments used and the
Tesch Method of Thematic Analysis of qualitative data, are described and issues of validity,
reliability and ethics are considered.

Chapter 4: Results
78
CHAPTER FOUR
RESULTS
1. INTRODUCTION
In this chapter analyses from quantitative and qualitative data are presented in an
effort to ultimately answer the research question: Does guided play using the 6 Brick Duplo
block approach have an effect on pre-school learners‘ visual perceptual abilities? Results
from quantitative data generated from pre-intervention post-tests are recorded and analysed
statistically so as to provide descriptive and inferential statistics. These results are presented
in graphical and tabular form as appropriate. Qualitative data from semi-structured interviews
were transcribed. Excerpts from the transcriptions are presented where appropriate to the
narrative in the text of this chapter. The results of class room observations are described and
the findings from interviews with relevant quotations are also presented in this chapter.
2. QUANTITATIVE DATA
Quantitative data were obtained from the Visual Perception Aptitude test (VPAT)
results of 77 pre-school children from two Grade-R classes in a school in the Republic of
South Africa (n= 38) and two classes of pre-school learners (n=39) from a school considered
to be acceptably equivalent in Kenya. One class in each school served as an experimental
group and the other as a comparison group. As mentioned in chapter three, the results of the
pre- and post-tests were entered into an Excel spread sheet and coded for statistical analysis.
Statistical analysis was undertaken using Excel to generate descriptive and inferential
statistics. The reasons for choosing Excel for this purpose are given in chapter three.
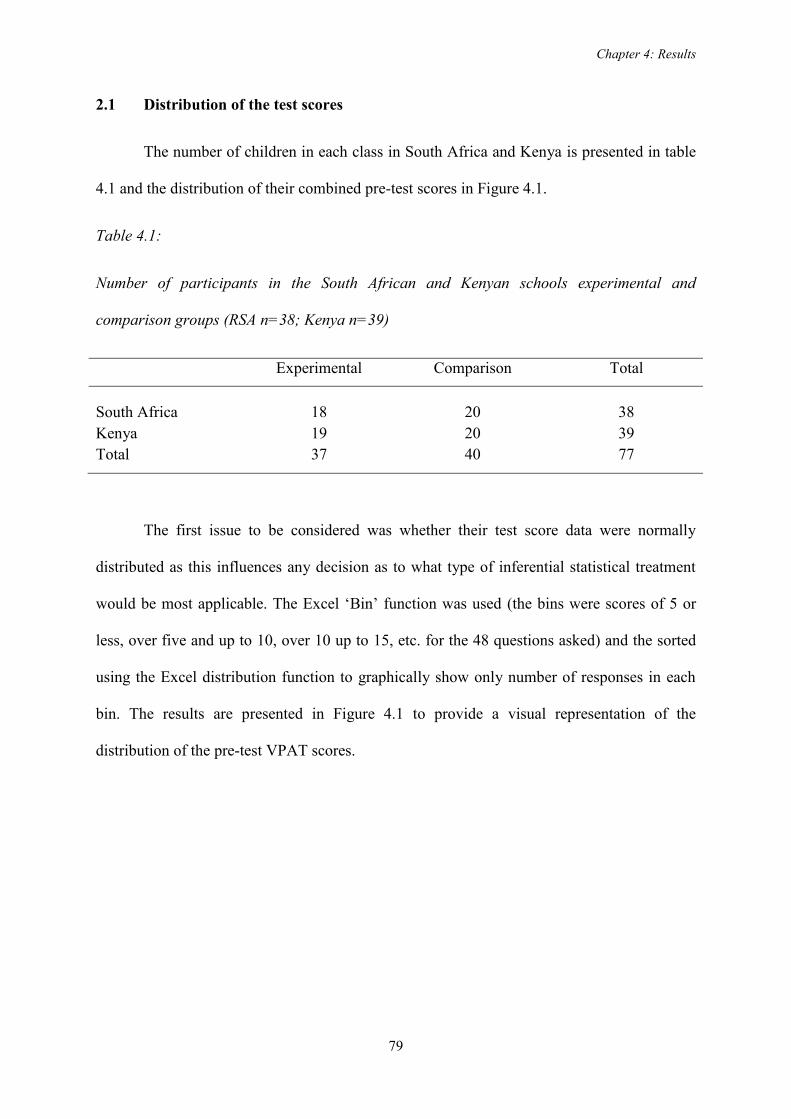
Chapter 4: Results
79
2.1 Distribution of the test scores
The number of children in each class in South Africa and Kenya is presented in table
4.1 and the distribution of their combined pre-test scores in Figure 4.1.
Table 4.1:
Number of participants in the South African and Kenyan schools experimental and
comparison groups (RSA n=38; Kenya n=39)
Experimental Comparison Total
South Africa 18 20 38Kenya 19 20 39Total 37 40 77
The first issue to be considered was whether their test score data were normally
distributed as this influences any decision as to what type of inferential statistical treatment
would be most applicable. The Excel „Bin‟ function was used (the bins were scores of 5 or
less, over five and up to 10, over 10 up to 15, etc. for the 48 questions asked) and the sorted
using the Excel distribution function to graphically show only number of responses in each
bin. The results are presented in Figure 4.1 to provide a visual representation of the
distribution of the pre-test VPAT scores.

Chapter 4: Results
80
Figure 4.1: Distribution of the VPAT scores of the 77 children who wrote the VPAT pre-
test (note: bin 1 represents a score ranging from 0 to 5; bin 2 scores from 6 to
10; bin 3 from 11 to 15, etc., namely bins of a range of five points each.)
The distribution of the scores suggest that the scores (n=77) are normally distributed
and that therefore parametric statistical analyses are applicable. As the data were generated as
matched pairs and, since t-Tests are least subject to the effects of small data sets even if the
data are not distributed normally (Carlberg, 2011), this test was chosen to investigate whether
the apparent differences suggested by the descriptive statistics were statistically significant.
This choice was supported further by the fact that the standard deviations (σ) of each group
were not dissimilar (Table 4.2).
0
5
10
13
24
12
9
4
00
5
10
15
20
25
30
1 2 3 4 5 6 7 8 9
Scores
Bin distribution of all pre-test scores n=77
FREQUENCY OF PRE-TEST SCORES RSA AND KENYA

Chapter 4: Results
81
Table 4.2:
South African and Kenyan pre-test numbers of participants, mean scores and standard
deviations
Pre-test RSA comparison
RSA experimental
Kenya comparison
Kenya experimental
N 20 18 19 20Mean score 25.35 28.06 18.05 19.42σ 5.16 7.62 6.86 6.01
2.2 Overall comparison of pre-test scores from South Africa and Kenya
The pre-test scores of the experimental and comparison groups in each school (one in
the RSA and one in Kenya), were calculated and then represented visually as bar graphs
(Figure 4.2).
Figure 4.2: Comparison of pre-test scores in the schools that participated in Kenya (n=39)
and South Africa (n=38)
18.8
26.3
0
5
10
15
20
25
30
Kenya RSA
mean
score
Schools mean scores in each country
Comparison of pre-test scores in the participating schools in RSA and Kenya

Chapter 4: Results
82
The descriptive statistics show that the mean score for the pre-test in the Kenyan
schools was 7.5 points (or 15%) lower than the pre-test mean score in the South African
school. While this difference appears to be significant, its statistical significance needs to be
calculated before one can say with confidence that the children in the South African school
started from a higher base score, and that difference needs to be taken into account when
comparing the effects of the intervention on post-test scores. Application of a t-test to the data
revealed that the mean scores of the children in the Kenyan schools were lower at a
statistically significantly difference at the 99% level of confidence (Table 4.3).
Table 4.3
Comparison of the pre-test mean scores of the students in the Kenyan and South African
schools (σ = standard deviation)
Kenyan school South African school p value
Mean score σ Mean score σ
18.82 6.36 26.63 6.50 ≤0.01
Using the Effect Size Calculator for T-Tests revealed that the effect size (practical
significance) for the difference between these mean scores was large (Cohen‟s d = 1.17) (see
http://www.socscistatistics.com/effectsize/Default3.aspx).
All of the groups (experimental and comparison groups in both schools) mean scores
improved from pre-to post-testing (Figure 4.3) with both the South African groups attaining
higher scores on their VPAT pre-test scores than the Kenyan groups post-test scores.
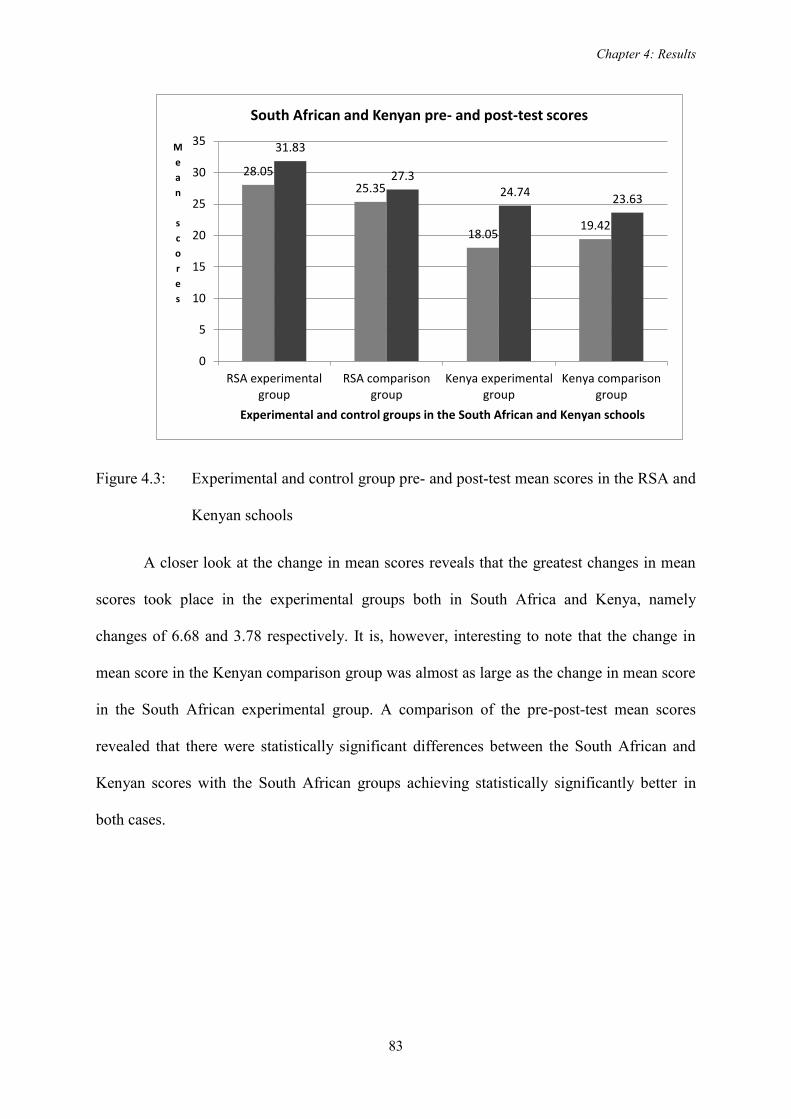
Chapter 4: Results
83
Figure 4.3: Experimental and control group pre- and post-test mean scores in the RSA and
Kenyan schools
A closer look at the change in mean scores reveals that the greatest changes in mean
scores took place in the experimental groups both in South Africa and Kenya, namely
changes of 6.68 and 3.78 respectively. It is, however, interesting to note that the change in
mean score in the Kenyan comparison group was almost as large as the change in mean score
in the South African experimental group. A comparison of the pre-post-test mean scores
revealed that there were statistically significant differences between the South African and
Kenyan scores with the South African groups achieving statistically significantly better in
both cases.
28.0525.35
18.0519.42
31.83
27.324.74 23.63
0
5
10
15
20
25
30
35
RSA experimentalgroup
RSA comparisongroup
Kenya experimentalgroup
Kenya comparisongroup
Mean
scores
Experimental and control groups in the South African and Kenyan schools
South African and Kenyan pre- and post-test scores
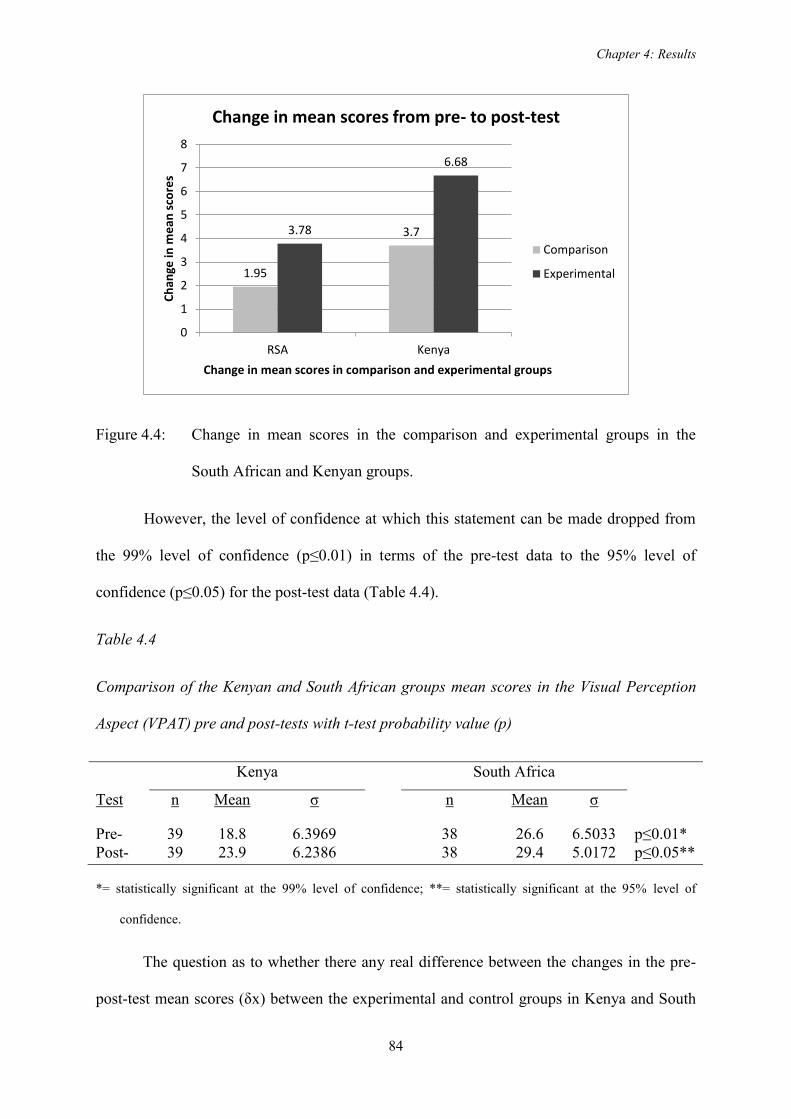
Chapter 4: Results
84
Figure 4.4: Change in mean scores in the comparison and experimental groups in the
South African and Kenyan groups.
However, the level of confidence at which this statement can be made dropped from
the 99% level of confidence (p≤0.01) in terms of the pre-test data to the 95% level of
confidence (p≤0.05) for the post-test data (Table 4.4).
Table 4.4
Comparison of the Kenyan and South African groups mean scores in the Visual Perception
Aspect (VPAT) pre and post-tests with t-test probability value (p)
Kenya South Africa
Test n Mean σ n Mean σ
Pre- 39 18.8 6.3969 38 26.6 6.5033 p≤0.01*Post- 39 23.9 6.2386 38 29.4 5.0172 p≤0.05**
*= statistically significant at the 99% level of confidence; **= statistically significant at the 95% level of
confidence.
The question as to whether there any real difference between the changes in the pre-
post-test mean scores (δx) between the experimental and control groups in Kenya and South
1.95
3.73.78
6.68
0
1
2
3
4
5
6
7
8
RSA Kenya
Chan
ge in
mea
n sc
ores
Change in mean scores in comparison and experimental groups
Change in mean scores from pre- to post-test
Comparison
Experimental

Chapter 4: Results
85
Africa can be answered using inferential statistics that include t-tests for statistical
significance and Cohen‟s d as an indicator of practical significance (Table 4.5).
Table 4.5:
Comparison of mean score changes between the experimental and control groups in Kenya
and South Africa.
Control Experimental p value Cohen‟s dn δx σ n δx σ
Kenya 20 3.7 6.913 19 6.68 6.790 p=0.0911*** 0.2
RSA 20 1.95 5.558 18 3.77 6.025 p=0.1685 N/A
***= statistically significant at the 90% level of confidence
As noted in chapter three, the samples were relatively small and therefore a 90%
level of confidence (p≤0.1) was selected as the indicator of significant difference between
groups. This level of confidence is generally considered to be low in statistical terms
(Carlberg, 2011), but has been used by social scientists depending on the nature of their
research, and was considered to be appropriate for this small scale, master‟s degree level,
study. Using this indicator of confidence, the inferential statistics in Table 4.3 reveal there is
a difference between the change in mean scores of the Kenyan experimental and control
groups while, in the South African school, although the change appeared large (see Figure
4.4) there is no statistically significant difference between the changes in mean score in the
experimental and control groups.
2.3 Sub-sections of the VPAT test
The first three sections of the VPAT test were used in this study, namely visual
discrimination (VD), visual memory (VM) and visual sequential memory (VSM). The scores

Chapter 4: Results
86
from each of these sub-tests are presented in the order in which the sub-tests are
administered, namely visual discrimination, then visual memory and finally visual sequential
memory.
Visual Discrimination
Visual Discrimination scores from the four classes (RSA experimental and
comparison; Kenya experimental and comparison) reveal that the RSA comparison class
started on a higher level than the experimental class. In Kenya the experimental group also
started on a lower mean score than the experimental group (Figure 4.5)
Figure 4.5: Mean scores of the aspect visual discrimination in the Kenyan and South African
pre and post-tests out of a total of 16.
The changes in scores shown in Figure 4.5 follow the trend for the combined data. As
the data sets were small in each case, no inferential statistics techniques were applied to these
data.
8.50
9.28 8.65
9.45
5.84
8.00
5.70
7.30
0123456789
10
SA EXP PRE
SA EXP POST
SA COMP PRE
SA COMP POST
KENYA EX PRE
KENYA EX POST
KENYA COMP
PRE
KENYA COMP POST
Scores
Pre-post-test scores in the South African and Kenyan schools
Visual discrimination pre-post-test mean scores

Chapter 4: Results
87
Visual Memory
The Visual Memory scores from the four classes (RSA experimental and
comparison; Kenya experimental and comparison) reveal that the RSA comparison class
started on a higher level than the experimental class, as was the case for Visual
Discrimination. In Kenya the experimental group also started on a lower mean score than the
experimental group (Figure 4.5)
Figure 4.6: Mean scores of the aspect visual memory in the Kenyan and South African pre
and post-tests out of a total of 16.
Again, the changes in scores shown in Figure 4.6 follow the trend for the combined
data. As the data sets were small in each case, no inferential statistics techniques were applied
to these data.
Visual Sequential Memory
Visual Sequential Memory scores from the four classes (RSA experimental and
comparison; Kenya experimental and comparison) reveal that the RSA comparison class
were distributed differently to the two Visual Perception Aspects sub-tests described above.
11.33
13.61 11.15
12.15
7.32
10.37 8.35
10.40
0
2
4
6
8
10
12
14
16
SA EXP PRE
SA EXP POST
SA COMP PRE
SA COMP POST
KENYA EX PRE
KENYA EX POST
KENYA COMP
PRE
KENYA COMP POST
Scores
Pre-post-test scores in the South African and Kenyan schools
Visual Memory pre-post-test mean scores
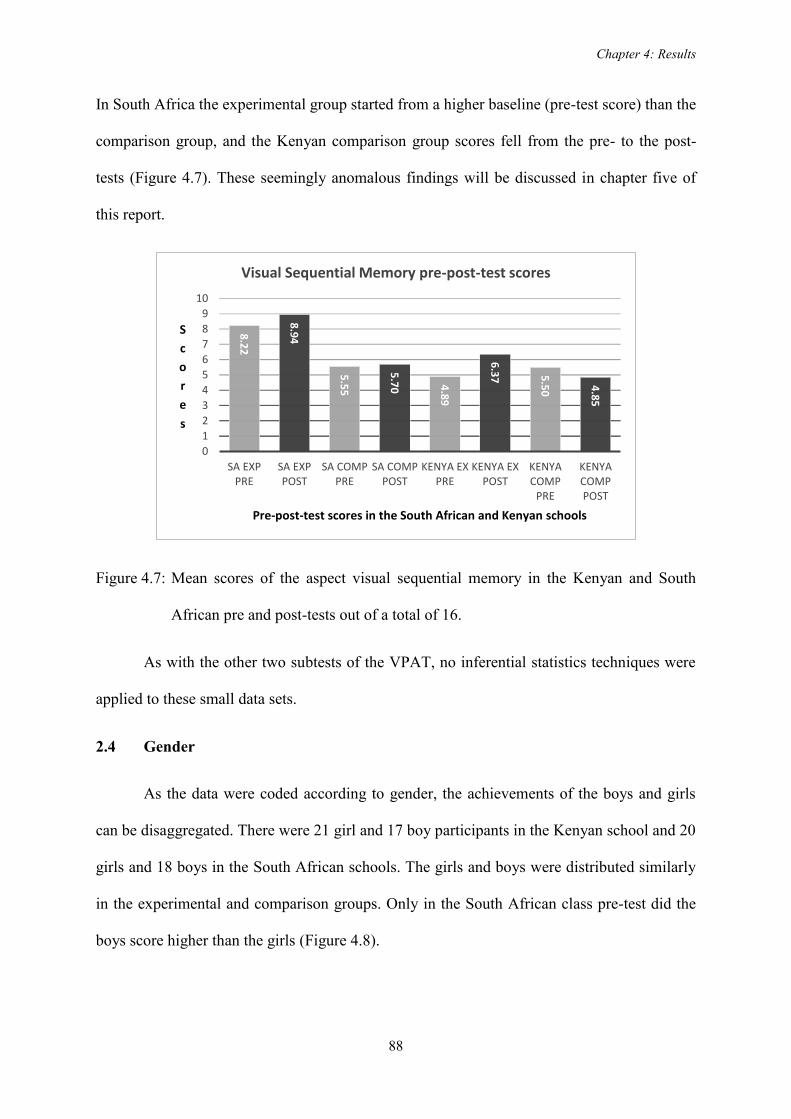
Chapter 4: Results
88
In South Africa the experimental group started from a higher baseline (pre-test score) than the
comparison group, and the Kenyan comparison group scores fell from the pre- to the post-
tests (Figure 4.7). These seemingly anomalous findings will be discussed in chapter five of
this report.
Figure 4.7: Mean scores of the aspect visual sequential memory in the Kenyan and South
African pre and post-tests out of a total of 16.
As with the other two subtests of the VPAT, no inferential statistics techniques were
applied to these small data sets.
2.4 Gender
As the data were coded according to gender, the achievements of the boys and girls
can be disaggregated. There were 21 girl and 17 boy participants in the Kenyan school and 20
girls and 18 boys in the South African schools. The girls and boys were distributed similarly
in the experimental and comparison groups. Only in the South African class pre-test did the
boys score higher than the girls (Figure 4.8).
8.22
8.94
5.55
5.70 4.89
6.37 5.50 4.85
0123456789
10
SA EXP PRE
SA EXP POST
SA COMP PRE
SA COMP POST
KENYA EX PRE
KENYA EX POST
KENYA COMP
PRE
KENYA COMP POST
Scores
Pre-post-test scores in the South African and Kenyan schools
Visual Sequential Memory pre-post-test scores

Chapter 4: Results
89
Figure 4.8: Comparison of the boys and girls in pre- and post-test scores in Kenyan and
South African schools
While it may appear from the descriptive statistics illustrated in Figure 4.8 that the
girls may have collectively done better than the boys on the VPAT test, a two tailed t-test of
the combined data revealed no statistically significant difference between the two groups (p=
0.20). No statistically significant differences were found when the boys and girls were
aggregated into experimental and comparison groups either.
2.5 Summary of the quantitative results
The pre-test data generated by the combined set of participating students was
distributed normally
The standard deviations (σ) of the VPAT pre-test data generated by each group
(experimental and comparison groups in South Africa and Kenya) were similar.
18
23.5
28.4
28.8
20
24.5
26.35
29.95
0
5
10
15
20
25
30
35
Kenya pre test Kenya post RSA pre RSA post
Mean
scores
Male and female scores in the VPAT pre-post-tests
Gender comparison in pre-post-tests in the two schools
Male
Female
Chapter 4: Results
90
The number of participants in each group was similar, as was the gender
distribution.
The pre- and post-test scores of the South African participants were statistically
significantly better than their Kenyan counterparts at the 99% level of
confidence.
The largest improvements from the pre- to post-tests occurred in the South
African and Kenyan experimental groups, but only the changes in the Kenyan
experimental group was statistically significant.
The disaggregated Visual Discrimination and Visual memory scores followed the
trends seen in the combined data, but the Visual Sequential memory scores fell
from the pre- to post-test in the Kenyan comparison group.
There was no statistically significant difference between the pre- and post-test
scores of the boys and the girls.
3. CLASSROOM OBSERVATIONS
Three main issues were revealed during the open-ended classroom observations I
made in the participating schools. These were the availability of play resources, the use of
play materials and the children‟s reactions to the use of play materials in the schools.
3.1 Availability of play resources
My first observation was that there was an abundance of play materials of different
types available to the children in the South African school, including Duplo Blocks. On the
contrary, I only saw one type of play material in the Kenyan school (wood cut into different
shapes for the children to stack).

Chapter 4: Results
91
3.2 Use of play materials
Learners in the South African school sat in groups of 7-10 and every child had his/her
own play materials. As the play materials were sufficient and of different types a number of
different activities took place at the same time. The children could share ideas as they played
with what was placed on their tables. Not only was the South African school fully resourced
with materials, but specific times for play were part of the timetable for the day. The play that
took place was general play and not teacher guided. When I asked the teachers if she had
used Duplo Blocks before the intervention to develop specific concepts she replied that the
resources were used for “general purposes not for learning.” However, she noted that she got
the children to play memory games which she felt would help with learning how to write.
On the contrary, as noted earlier, there was only one type of play material in the
Kenyan schools which the children used the wood that was cut into different shapes to build
castles. As this was the only play material available to the children the children rarely played.
Most of the time when teaching the teacher drew pictures on the blackboard or on paper
charts.
3.3 Children’s reactions to the use of play materials
Every time I entered into the Kenyan school classroom there was a lot of excitement
from the learners as they knew that it was time to play (this observation was corroborated by
the teachers during her interview). It appeared that the children really enjoyed using the
materials and would invite me to play with them. When I asked the teacher if the children
reminded her about playing with the 6 Brick Duplo Blocks she said that they did and noted
that they “even wanted to use their sleeping time, instead of sleeping, use that time to play.”
The teacher requested more assistance in accessing play resources saying “If there are more
things out there, please bring us. They really enjoyed. If there are more play materials bring

Chapter 4: Results
92
more for us”. This teacher also recognised the learning opportunities that such play afforded
saying “we need more play materials because it helps children learn and to develop skills.”
The teacher in the South African school stated that the children “loved” using the
resources that had been provided for this project and “got excited every time I told them its 6
Brick time”. I observed that this was the case, but also noted that the responses by the
children was not as passionate as that of the children in the Kenyan school and, when asked,
the teacher said that the children did not remind her to use the 6 Brick activities as they saw
them “just another activity” like those that they did with the abundance of other play
resources that were available to them.
3.4 Summary of classroom observations
There was an abundance of play materials of different types available to the
children in the South African school but only type of play material in the Kenyan
school
A great deal of unguided play took place in in the South African schools, but
little to no play took place in the Kenyan schools prior to the intervention.
Specific times for play were part of the timetable in the South African school but
not in the Kenyan school.
The children in both the Kenyan and South African schools were enthusiastic
when it came to using the 6 Brick Duplo Block approach, but the children in the
Kenyan school were more enthusiastic and even wanted to use their „sleeping
time‟ to play with the blocks.

Chapter 4: Results
93
4. INTERVIEWS
One-on-one semi-structured interviews were held with the experimental class teacher
from the South African school and Kenyan school. The aim of these interviews was to gain
richer and more in-depth data regarding their perception of the use of the 6 Brick approach in
their classes. The teachers were asked about the activities they had done with their learners
during the four-month intervention period and how the learners had responded towards the
guided play sessions. The interviews were transcribed (see Folder 1). In order to maintain
confidentiality, the names of the schools are not mentioned, only the countries which the
teachers came from, for example „Semi-structured interview South African teacher‟ as (SAT)
and „Semi-structured interview Kenyan teacher‟ as (KET). Their names are not mentioned.
The questions were categorised into the following issues with findings presented below as the
teachers‟ biographical information, how the teacher‟s used the 6 Brick Duplo Block
approach, their perceptions of the approach and their children‟s‟ reactions‟, and what they
thought the children had learned from the intervention‟.
4.1. Biographical Information
All of the teachers participating in the study were female. The South African
experimental teacher had four years‟ experience of teaching Grade R/ECDE, while the
Kenyan teacher had been teaching at this level for 14 years. Neither teacher had any
experience of using the 6 Brick Duplo Block approach, but the South African teachers had
Duplo Blocks in her classroom which she used for „free play‟ with learners.
4.2 Using the 6 Brick Duplo Block activities
When asked whether they had ever used or played with 6 Bricks before and, if so, was
it used for general play or was it used for specific activities aimed at developing specific

Chapter 4: Results
94
concepts the South African Teacher said ―No. I haven‘t, I only used the Duplo during free
play but not for any educational purpose - we haven‘t told them physically what to do with
them. They just played with it. 6 Bricks were used for general purposes not for learning.‖
The Kenyan teacher responded ―I have never used them before but I have been using other
materials but not the same as this one. It is first time to use the blocks‖. These statements
confirm what I had noted during my classroom observations, namely that the use of the 6
Brick Duplo Block approach was something new for both teachers and their learners in both
South Africa and Kenya.
When asked if they were able to do three activities in the order Visual Discrimination,
Visual Memory and then Visual Sequential Memory each week the South African teacher
replied ―I tried to do one every day but our curriculum didn‘t allow it. I didn‘t manage three
times a week. I tried to do as many as I could in a week there are some weeks I couldn‘t
because of our curriculum.‖ In contrast, the Kenyan teachers said ―We were able to do it in
fact they wanted it twice a day‖. This is what I also observed in the children because I saw
how they were enjoying the play sessions and more so being the only materials being put in
use in the classroom.
When asked of the duration each activity took on average and if the time allocated
was enough or too much for the learners the South African teacher replied ―20-30 minutes it
was quite a lot of time. 10 minutes did not help me at all.‖ This was in agreement with what
the Kenyan teacher said ―On average 20 minutes.10minutes was not enough. They wanted
more. Did before they went home when they had done the days‘ activity so it didn‘t interfere
with the school programme.‖ The 10 minutes that was initially planned for in the activity file
for the two schools did not work for the two teachers and it appears that the learners in the

Chapter 4: Results
95
Kenyan school enjoyed the sessions to an extend that they wanted more time of the play
sessions.
When asked whether there were any scenarios that things went unexpectedly, i.e. right
or wrong, and if so what did they do and if they were caught by any surprises the South
African teacher said ―Mmmmm not really because I know the children and I know what they
are capable of there wasn‘t any big surprises. Some of them with built blocks would put them
away e.g. build a tower. Some of them surprised me they normally didn‘t pay attention to
details and there they were able to copy exactly as I did and others where I expected them to
do that could copy what I have done.‖ The Kenyan teacher had the following to say ―There is
a time they wanted to do their own things, and told me can you look at mine? I gave them the
opportunity to be creative. They were so attentive that there was no destruction. The colours
attracted them so much. Did everything at a stipulated time and the children were able to
make things beyond the teachers‘ reach.‖ The two teachers were actually surprised by what
the 6 Bricks did to their learners like paying attention to detail from the South African school.
In the Kenyan school learners became attentive, were creative by making „things‟ that were
beyond teacher‟s expectations.
When asked if there were any changes in terms of way of doing things that they
noticed with the learners as they guided them play the South African teacher replied ―Some
words I had to change because some of the wordings were too difficult for them to
understand so I had to change some wordings.‖ The Kenyan teacher said ―I learnt that the
slow learners were able to play with the blocks better/ faster than the fast learners.‖
When asked if the play sessions using the 6 Bricks changed the way they thought
about things, or the way they taught the children within their class environment the South
African teacher replied ―Mmmm I wouldn‘t say its changed my ways but having bricks will
Chapter 4: Results
96
help me in future, I will introduce the children earlier and will be able to understand how to
use the bricks as it is a new concept because at this age you can‘t expect to introduce
something to children and expect them to do something straight away. They learnt slowly by
slowly. The introduction of bricks was used for free time play.‖ The Kenyan teacher said
―Yes, made them to do their work very fast, e.g. homework, so that they can have time to play
with the learners. Blocks have made them do their work very fast.‖ This was part of what I
observed on how the children were taking in instructions especially when the play sessions
were about to begin they were very fast to clear the table and ready to receive the blocks.
When asked if the play materials helped the learners play amicably as they focused on
the days‟ activity or sometimes they quarrelled the South African teacher replied ―Mmmm
They argue when they didn‘t get it right they would say they didn‘t get it right. The one who
didn‘t get it right would feel upset. There was a lot of individualism. They didn‘t want to work
as a group, so I taught them how to share. At this age they are all about themselves as a
bigger picture.‖ The Kenyan teacher said ―They were able to share. They had to know that
they had to have 6 Bricks. Could assist those whose bricks fell and told each other the total
number has to add to 6. Were able to tell what colours were missing.
When asked how else they use 6 Bricks apart from playing, for example in math or
socialization the South African teacher replied ―To be honest everything in grade R is put
together no separate time for English, math, skills. The whole day all those are learnt it
didn‘t help with the studs, it didn‘t help with math covering two how many left didn‘t help.‖
The Kenyan teacher said ―Able to learn words same, at least, that is mathematics after the
activity they could talk a lot about the bricks and they requested the teacher if they could go
with them home to show their parents.‖

Chapter 4: Results
97
When asked if they always did the Duplo activities with the learners or if sometimes
the learners played with them alone the South African teacher replied ―most of them I did
with them as those who are younger could not know what to do with them. Could only display
and look at me.‖ The Kenyan teacher said ―I did most of the activities with the learners then
give them an extra time because they wanted to play more.‖
When asked whether they will take part in future with these activities or they are
satisfied with what they have done the South African teacher replied ―Mmmm I think I will if
it doesn‘t take too much time and if I had much time to do it. I will definitely use the activities
for my own children one day I think it is really good.‖ The Kenyan teacher replied ―Yes, I
will encourage other teachers to use the same materials for this children it makes them social
using the same bricks.‖
4.3 Teachers perceptions of the approach
When asked if they liked the activities by Duplo and if so will they play with other
classes in future the South African teacher replied ―Yes, I did like them, I think I will, I will
make the activities a bit simpler. They were a bit more complex for their age.‖ The Kenyan
teacher said ―Yes, I liked the activities because it was like playing but learning. Will play in
future. It has encouraged the children to be active in class.‖
When asked if there were any challenges and if so how did they overcome them the
South African teacher replied ―Yes, there were but a few. Time was a challenge had to get
through the curriculum. As teachers had to do our own assessment according to the
curriculum and to have a table doing an activity which a teacher needs to be assessed and
having 6 Bricks didn‘t work at all. Sometimes I had to miss 6 Bricks coz I had to get the
assessment done. I didn‘t like it coz the kids and I enjoyed it time didn‘t allow there is one

Chapter 4: Results
98
activity I didn‘t do coz the teacher had to take the bricks out early morning then the children
had to copy the pattern and leave it the whole day and the teacher had to go and rearrange
the blocks and see if the children rearranged. In grade R the children do not have that
knowledge, there was enough space in class for it. The understanding of some concepts like
left right, behind, next to, the middle, they didn‘t understand what was asked of it. So this was
a bit frustrating for me. The activities didn‘t work at the beginning of the year and learning
certain terminologies first time like learning English.‖ The Kenyan teacher said ―There were
challenges. Some pupils did not want to make what you have made wanted to make their own.
First they made the teachers then they made their own. I had to give them a chance to do.
Challenge of time too short 10 minutes so gave them a chance to play more so that they
become contended.‖ From the two responses it can be noted that time was a major challenge
for the two teachers they were not able to complete the activities within the 10-minute
stipulated time.
When asked which skill really improved as a result of playing with the bricks either
with them or with the learners they taught the South African teacher replied ―Memory.
learners were more sequential or order helped a lot.‖ The Kenyan teacher said ―They were
able to know the colours especially the ones who couldn‘t differentiate. but with the blocks it
helped. Able to develop skills in the mind stay more with the bricks could pack. For those
who couldn‘t pack.‖ According to the teachers the aspect of visual memory developed the
most in the learners and this was also seen in the changes in the quantitative pre-post VM
scores attained by the learners.
When asked if there was anything they learnt about using 6 Bricks that enhanced their
teaching in class and improved their mode of teaching the South African teacher replied ―Am

Chapter 4: Results
99
not sure.‖ The Kenyan teacher said ―It made the children to be familiar with things in class
they were able to do their work very well with the bricks. Bricks enhanced teaching in class.
When asked of the development of cognitive, social, emotional and physical abilities
which has been shown through play whether they saw any sign of these abilities being
developed when the children played with the 6 Bricks the South African teacher replied ―All
of these developed sometimes could see frustrations when they couldn‘t build something, so
the emotional part taken care of.‖ The Kenyan teacher said ―Building something you have
never seen. socialization; they were able to ask their friends is this right or wrong Emotional;
some became gloomy especially on the activity which they were told close your eyes and feel
what your friend has made then the one who was feeling not making it right.‖
When asked of the concentration period and attention span of the learners as a result
of playing with 6 Bricks the South African teacher replied ―20 minutes for the majority some
longer most were done at 20 minutes. 10minutes was difficult.‖ The Kenyan teacher said ―10
minutes was perfect for them but more than 10 minutes they wanted to make something else.‖
When asked if there were any difficulties they faced or encountered with the bricks
the South African teacher replied ―one activity mentioned, I did most activities the children
completed the activities a few didn‘t complete the activities but I carried on.‖ The Kenyan
teacher said ―I didn‘t see any difficulties I enjoyed playing with the bricks.‖ When asked if
they had anything else they would like to add the South African teacher replied ―No. I think
everything that I have said have covered everything all the things about me about it. Overall
its awesome educational thing for the children to actually build on memory auditory visually
everything.‖ The Kenyan teacher said ―If there are more things out there, please bring us.
They really enjoyed. If there are more play materials bring more for us. They need more play
materials because it helps children learn and to develop skills.‖

Chapter 4: Results
100
4.4 Children’s’ reaction towards Duplo Block activities
When asked if the learners were enjoying the sessions with Duplo or if they became
bored/distracted the South African teacher replied ―Mainly the children enjoyed it, they were
distracted when they couldn‘t understand what asked of it.‖ The Kenyan teacher responded
―The learners were ready for that duplo every day and could remind the teacher we have not
done. The 10 minutes were not enough. They really enjoyed the sessions. Did not know it was
part of learning.‖
When asked if the activities were done at a particular time, of day and whether the
children reminded the teacher to do the activities the South African teacher replied ―No
because we don‘t always do 6 Bricks. We have other educational playing games like other
memory games where they learn how to write, thread in, every day with different activities.
They didn‘t see it as a 6 Brick game. It was just as any other activity.‖ On the contrary the
Kenyan teacher said ―The children could remind and even wanted to use their sleeping time
instead of sleeping - use that time to play.‖ These statements from the teachers clearly depicts
what I had observed in their schools, namely that the South African children had so many
playing games that helped them learn and that in the Kenyan school there was a lack of
resources and the only play materials that were in use were the 6 Bricks. As such the children
reminded the teacher that they were ready to play even to sacrifice their sleeping time to play
with the blocks.
When asked if the children enjoyed the activities the South African teacher replied
―They loved it. they got excited every time I told them its 6 Brick time.‖ The Kenyan teacher
said ―Yes, they really enjoyed. And they discovered a lot. Enabled the children to be
independent.‖ The above statements also confirm what I had also observed in their
classrooms, namely how much the children enjoyed doing the 6 Brick activities.

Chapter 4: Results
101
When asked what their children enjoyed the most about the blocks, for example was it
the colourful nature of bricks or the cooperation that came as a result of playing together the
South African teacher replied ―I think it‘s the way they realised oh! I can do different things
with bricks, I can build different things e.g. as I let them play with smaller Lego pieces they
actually building better things, e.g. walls, straight tower‖ The Kenyan teacher said ―They
enjoyed building the towers- make the tallest towers. They were able to differentiate warm
and cold colours.‖ These statements supported my observations that the children became
excited with what they able to do with the blocks and how children from both the South
African and Kenyan schools enjoyed building towers.
4.5 Lessons children learnt from the intervention
When asked if there was anything else the learners learnt apart from the aspects of
Visual Discrimination, Visual Memory and Visual Sequential Memory the South African
teacher replied ―They learnt how to be patient because they knew they didn‘t have to touch
the bricks at a certain time and things like that. They had to watch.‖ The Kenyan teacher had
the following views to put across ―They developed many ways of carrying tasks that is why I
saw some children‘s IQ was high to build what I have never seen. Intellectual capacity
became high. Able to teach something else to be able to differentiate e.g. many, at least, long,
short, and see the variations.‖
When asked if the 6 bricks helped them teach other concepts and if so, how did they
know, the South African teacher replied ―Mmmmm not to teach other concepts, it‘s a bit
difficult for them to understand what the bricks are meant … because … I … especially for
young age, I do my teaching in different ways especially for such a young age.‖ For the
Kenyan case this question was answered together with the question that came before this
above. The two teachers had different views. The South African teacher felt the learners were

Chapter 4: Results
102
young and 6 Bricks for that age could not help teach other concepts. On the other hand, the
Kenyan teacher saw her learners developing many ways of carrying out tasks, children
developing the capacity to build what she had never seen, which, according to her, developed
her learner‟s IQ and that the 6 Bricks helped her teach to differentiate between many, at least,
long, short, and see to be able to see the variations.
When asked if they were able to assess any skills by observing the children's
involvement in the activity the South African teacher replied ―Left right that was the only
thing. In the future will do more things used for assessment, but not this time round.‖ While
the Kenyan teacher said ―Able to assess some skills like one telling the other to wait: give me
something then I arrange something for you. Was wondering how they were arranging the
blocks and even able to assist each other to arrange and guided each other. Out of the
teacher‟s observations not only were the aspects of VD, VM and VSM developed by the
learners, but also other skills like left and right, giving each other chances to wait, assisting
and guiding each other arrange the Bricks. I too observed the spirit of cooperation that was
developed among the children.
When asked if they could state some lessons learnt when using 6 Bricks, for example
patience, thinking of new ideas or remembering instructions the South African teacher replied
―They learnt patience … take information remember it then build something from memory.‖
The Kenyan teacher said ―Able to develop memory skills, could remind the teacher what they
did the previous day. Could remember what they were taught yesterday. Learnt patience if
told can you put your arms on your laps they did. They were able to remember instructions.
Majority wanted to follow instructions, few built their own things. Age matters the young
ones were doing their own and didn‘t want to be disturbed.‖

Chapter 4: Results
103
The teachers were reminded that the intervention phase consisted of three Visual
Perceptual Aspects which included:
visual discrimination – what is similar or different in form (e.g. the formation
of letters and numbers, shapes),
visual memory – (to remember what was visually seen e.g. spelling, copying
from the board),
visual sequential memory (ability to remember visual details in the correct
order e.g. counting in 2‟s or 3‟s in similar repeated pattern),
They were then asked which visual perceptual aspect they thought improved the most
through 6 Bricks, that is was it Visual Discrimination, Visual Memory or Visual Sequential
Memory. The South African teacher replied ―Visual Memory.‖ The Kenyan teacher said
―Memory was the most then discrimination‖
When asked which visual perceptual aspect they thought improved the least through
the use of 6 Bricks, that is was it VD, VM or VSM the South African teacher replied
―Auditory memory: Discrimination‖ The Kenyan teacher said ―least is sequential but were
able to say what followed what.‖ From the responses of the two teachers the South African
teacher actually responded ―Auditory memory, discrimination‖ even after clarifying that the
question was about VD, VM or VSM. The response of the Kenyan teacher was also depicted
in the quantitative results that the leaners attained in the pre and post-tests. Visual sequential
memory improvements were lower than the gains in the two other aspects: visual
discrimination and visual memory.
When asked if they thought the visual perceptual aspects of VD, VM and VSM
transferred across into the classroom the South African teacher replied ―Yes, majority of them

Chapter 4: Results
104
could understand but with some activities there was language barrier so they couldn‘t
understand it. Positive things that happened is that blocks helped children very much in the
educational field, placing things in certain ways, counting studs, addition and subtraction.
Shapes: when we started couldn‘t identify many but afterwards they could, for example,
identify a semi-circle and two semicircles. Could ask can we build it. I think it is going to go
a long way, made them inquire about things as well.‖ The Kenyan teacher said ―It
transferred across the class. Thank you for choosing our school they (Angels) appreciated.‖
The responses above confirm what I also observed; 6 Bricks became an educational activity
for the children; made the learners enjoy what they were doing and; a variety of skills were
developed in the children, including patience.
4.6 Summary of the findings of the semi-structured interviews
Both of the teachers had never used the 6 Bricks approach in their classrooms,
but Duplo was available in the South African school “for general purposes not
for learning”.
The activities required approximately 20 minutes not the planned 10 minutes per
activity. As such, providing sufficient time became a challenge.
The learners paid “attention to detail” and “did everything at a stipulated time”
in both schools.
Some of the wording in the activity file was changed to meet the level of the
learners in both countries and, in the Kenyan school, learners who were
considered to be „slow‟ academically, were able to succeed in the 6 Brick
activities faster than the children in their class who were previously considered
to be „fast‟ academically.

Chapter 4: Results
105
In the South African school, a lot of individualism was seen in the learners but
the teacher taught them “how to share”. In the Kenyan school they were able to
share and cooperate from the beginning, an example being that they continually
reminded each other that Bricks were needed each time.
The Kenyan teacher emphasized a number of times that the mathematical terms
“same, at least, etc.” were learnt by the children in the Kenyan school via the 6
Brick activities.
The teacher in both South Africa and Kenya were able to successfully complete
most of the activities and stated that they will continue to use the 6 Brick
activities in future. They will “also encourage other teachers to use the same
materials” because they (teachers and learners) liked and enjoyed the activities.
Visual memory was the aspect that they believed to have improved the most in
the two schools and the 6 Brick approach was described by the Kenyan teacher
as an “awesome educational thing”
It was noted by both of the teachers interviewed that the learners learnt patience
and the Kenyan teacher added that they developed many ways of carrying out
tasks like differentiating “many, at least”; “long, short” and seeing the variations.
5. CHAPTER SUMMARY
In this chapter the quantitative and qualitative data generated in this study were
presented. Quantitative analyses of the results of the learners‟ pre/post-tests were made. The
pre-test data generated by the combined set of participating students was distributed normally
and the standard deviations of the VPAT pre-test data generated by each group (experimental
and comparison groups in South Africa and Kenya) were similar. The number of participants
in each group was similar, as was the gender distribution. The pre- and post-test scores of the

Chapter 4: Results
106
South African participants were statistically significantly better than their Kenyan
counterparts at the 99% level of confidence. The largest improvements from the pre- to post-
tests occurred in the South African and Kenyan experimental groups, but only the change in
the Kenyan experimental group was statistically significant. The disaggregated Visual
Discrimination and Visual memory scores followed the trends seen in the combined data, but
the Visual Sequential memory scores fell from the pre- to post-test in the Kenyan comparison
group. Learners‟ achievement scores relating to visual discrimination (VD), visual memory
(VM), and visual sequential memory (VSM) are illustrated graphically in this chapter. The
learners were provided with 48 questions: 16 per aspect in the two participating schools: RSA
and Kenya. There was no statistically significant difference between the pre- and post-test
scores of the boys and the girls.
Qualitative data were obtained from two instruments; namely open-ended classroom
observations and semi-structured teacher interviews. Data generated from teacher interviews
provided a better understanding of the use of the 6 Brick approach on pre-school learners‟
visual perceptual development. The teacher comments suggested that the learners really
enjoyed the play sessions with the 6 Bricks, both teachers agreed that the visual perception
aspect that developed the most during the intervention was that of visual memory. Of the
three aspects of visual perception they felt that visual sequential memory skills were
developed the least. This was clearly seen by graphical depictions of the learners change in
scores from the pre- to post-tests for these thee aspects of visual perception. A summary of
the findings was also done at the end of every data generating tool, to highlight the issues that
came up from the findings received. The teachers acknowledged the importance of guided
play and promised to use the apparatus and engage their children in 6 Brick play activities
with other classes in the future.

Chapter 5: Discussion and recommendations
107
CHAPTER FIVE
DISCUSSION AND RECOMMENDATIONS
1. INTRODUCTION
This chapter considers the results obtained in terms of answering the primary research
question which is whether guided play using the 6 Brick Duplo Blocks approach in Grade R
accelerates the development of pre-school learners‟ visual perception abilities. The handling
of the data is discussed, as are the pre-test findings and the changes from pre- to post-test
mean scores. The findings of the study are then considered in terms of the learners‟ access to
play resources, guided play and learner enthusiasm. The participating teachers‟ attitudes and
perceptions in terms of the 6 Bricks Duplo Blocks intervention, its effects on visual
perception development in general and the specific aspects of visual discrimination, visual
memory and visual sequential memory, and the time and materials required are also explored.
Gender issues are mentioned and the limitations of the study are considered.
Recommendations for further research are made and considerations for curriculum
and materials developers are proposed. Finally, conclusions are drawn as to the positive
connections between play and the development of visual perception and its relationship to the
development of literacy and numeracy. The effects of using the 6 Bricks Duplo Blocks
approach as a tool to motivate young children to attain these basic skills and how this study
might make a contribution to the debate on developing visual perception and related literacy
and numeracy skills in the African context in which it was undertaken are deliberated.

Chapter 5: Discussion and recommendations
108
2. HANDLING THE QUANTITATIVE DATA
As noted in chapter three, there was concern as to how the data might be distributed
because of the small sample size used. This concern is important as the distribution of the
data, namely whether it is normally distributed or not, provides an indication as to the type of
statistical analyses that can be effectively applied, namely parametric or non-parametric tests.
In order to determine the distribution of the data the results obtained from the Visual
Perception Abilities Test (VPAT) from 77 learners who answered 48 questions each (16 per
visual aspect) were entered in the Excel Bin function using scores in a range of 5, for
example a score of 5 or less; a score between 6 and 10, etc. up to 48, as explained in chapter
four.
The pre-test scores generated by the participating children in the South African and
Kenyan school were combined, binned and a bar-graph of the data distribution produced. As
parametric tests are generally considered to be more robust than non-parametric tests
(Carlberg, 2011), it was gratifying that the bar graph indicated an acceptable normal
distribution of the results (see Figure 4.1 in Chapter 4). When the results were disaggregated
into South African and Kenyan pre-test data it could be seen that the results of the South
African children were skewed to the left while the Kenyan children were skewed to the right.
Being skewed to the left means that more children achieved higher marks than would be
expected from a normal distribution of marks while being skewed to the right means that
more children scored marks lower than the mean that would be expected in normally
distributed data. These distributions provided an early indication that the South African
subjects started from a higher base in terms of visual perception scores than that of their
Kenyan counterparts.
Chapter 5: Discussion and recommendations
109
As the initial (pre-test) data appeared to be normally distributed, the standard
deviations of the two schools on their pre-test scores was not dissimilar, and the group sizes
were very similar, t-tests were chosen as a data analysis tool. As t-tests are parametric tests
least affected by skewness and variances in standard deviation, and because matched pairs of
pre-post-test data were available, the use of a matched-pair t-test appeared sufficiently robust
for the purpose of this master‟s degree study. Standard indicators of statistical significance
were used, namely p≤0.05 and p≤0.01 (the 95% and 99% levels of confidence respectively)
were used, but as the samples were small a decision was taken to also consider p≤0.1 (90%
level of confidence) as also being statistically significant for the purposes of this study if
necessary. In order to enhance the validity of the study in terms of using the free Excel
software which might be open to criticism, a sample of the data generated were also subjected
to statistical analysis for comparison using the Statistical Package for the Social Sciences
(SPSS) by an Educational Statistician (Professor K. Speck) at Oldenburg University (a
partner university in the CERMESA project which provided the scholarship for this study).
The SPSS analyses verified all of the samples of descriptive and inferential statistics
generated when using the Excel functions.
3. PRE-TEST FINDINGS
The first finding of note is that the mean score of the pre-test data in the Kenyan
school was 15% lower compared to the pre-test score of the South African school. The pre-
test scores of the South African participants were statistically significantly better than their
Kenyan counterparts at the 99% level of confidence (see Table 4.3). This finding can be
explained by the fact that the classroom observations revealed that in the South African
classrooms there was an abundance of play materials of different types available while in the
Kenyan classroom there was only type of play material (wood cut into different shapes). The
classroom observations and interviews also revealed that a great deal of unguided play took

Chapter 5: Discussion and recommendations
110
place in specified „play times‟ in the South African schools, but little to no play took place in
the Kenyan schools prior to the intervention. Additionally, the teacher in the South African
experimental school noted in her interview that using the 6 Brick Duplo Block approach was
no different in essence to what she did with the other resources she had on hand. Therefore, it
is not surprising that the South African pre-test scores were statistically significantly better
than the Kenyan pre-test scores.
4. CHANGES FROM PRE- TO POST-TESTS
In this section I consider changes in pre- to post-tests both within groups
(experimental and control groups in South Africa and Kenya) and across groups (between
experimental and control groups in South Africa and Kenya). All of the groups (experimental
and comparison groups in both countries) mean scores improved statistically significantly
from pre to post-testing. This reflects the position of Kellerman & Arterberry (2006) that
visual perception develops rapidly in young children of about age‟s three to six.
Changes in the comparison groups
The children in the comparison group from South Africa did not play with 6 Bricks
but their scores improved statistically significantly, as was the case with the Kenyan
comparison group. This seemingly anomalous finding can be explained by the fact that visual
perception develops rapidly in young children (Brockett, 2006; Schneck, 2005; Bergh &
Theron, 2003; William, 1983; Gesell, Frances & Bullis, 1949). As noted in Chapter 2, the
time from birth to approximately eight years of age, which is generally referred to as „early
childhood development‟, is critical to laying the foundation for learning and cognitive
development (Piaget, 1962) and close to half of an individual‟s potential in terms of
intelligence is developed by the time that a child reaches four years of age (Philips &
Shonkoff, 2000). As noted above, one of the skills that are developed during this ECD period
Chapter 5: Discussion and recommendations
111
of rapid cognitive development is visual perception (Scheneck, 2005), and it is therefore not
surprising that there were detectable and statistically significant changes in the comparison
groups‟ visual perception abilities over the study period of four months.
Changes in the experimental groups
Children in the experimental groups played with 6 Bricks during the four-month
intervention in both South Africa and Kenya. The scores of the experimental groups
improved from pre to post-test (see table 4.4 Chapter 4). When a comparison of the pre-post-
test mean scores was done, results revealed that there were statistically significant differences
between the South African and Kenyan scores with the South African groups achieving
statistically significantly better in both cases. The Kenyan experimental class had started on a
lower mean-score and a greater improvement was seen from pre- to post-tests (see table 4.4
Chapter four). This greater improvement is reflected in the drop in the level of confidence in
the differences between the South African and Kenyan pre- and post-test scores from the 99%
level of confidence in terms of the pre-test data to the 95% level of confidence for the post-
test data. As such, it appears that the improvement in terms of learner overall achievement
per class in both schools suggest that the learner‟s intellectual performance was optimised
through the manner in which information was presented; that is visual perception in the form
of guided play using 6 Bricks (Tsao, 2008; Scheiman & Rouse, 2006). Guided play using
approaches such as the 6 Brick Duplo Block approach has been documented as a powerful
way of facilitating deep conceptual understanding (Hutcheson, et al., 2014).
Chapter 5: Discussion and recommendations
112
5. CONSIDERING THE FINDINGS
As noted, the Kenyan school data indicated a greater improvement compared to the
South African school with a higher mean increase. Comparing the two schools during the
open ended classroom observation, it was clear that the availability of play resources was
inadequate in the Kenyan school. As such, it can be inferred that the provision of sets of 6
Bricks in their classes was a factor in terms of an improvement in visual perception after the
intervention. In other words, the improved results suggest that the availability and use of 6
Bricks has an accelerating effect in the development of visual perception (Hutcheson et al.,
2014). This statement resonates with Kellerman and Arterbbery‟s (2006) statement that play
is accompanied by the development of routine visual functions, which enables learners to
carry out their daily life activities, hence the proposition that the daily routine of a child need
to be one which is surrounded by a multitude of visual stimuli, preferably those that presented
dynamically and result in active engagement, as is the case with the 6 Brick approach.
The findings in this study are congruent with literature that when children are exposed
to play at an early age, play helps them develop in their cognitive abilities (Mielonen &
Paterson, 2009; Vygotsky, 1978; Piaget, 1962), including their visual perceptual abilities. The
development of visual perception in children takes place through mental enactment of a
visual scene (Loikith, 1997). In this way play stimulates visual perception as opposed to mere
sensory association (Kellerman & Arterberry, 2006). The literature cited above, namely that
guided play sessions can improve the development of visual perception can be used to
explain the changes in VPAT scores in this study.

Chapter 5: Discussion and recommendations
113
Access to play resources
As mentioned there were changes in the schools in both countries in the experimental
and comparison groups that were statistically significant. Both the South African
experimental and comparison groups started on higher mean-scores compared to the Kenyan
groups in the pre-test scores. The qualitative data provide some insights as to why this may
be the case. Firstly, it has already been noted that the South African children had access to a
variety of play resources while the Kenyan children did not before they were supplied with
sets of 6 Bricks Duplo Blocks. Although the Lego Duplo Blocks were available in the South
African school, they were only used for free play. Prior to using the 6 Brick Duplo Block
approach the South African children sat around the table in groups of 7-10 where they
engaged in different play activities. During the process of play children freely discussed and
shared ideas together. The teacher didn‟t physically guide the children during play, but the
initiative came from the children. Her role was to ensure that each child has play materials
and see into it that there is order in the classroom. Children played and after completing the
activity for the day stood up and went to show the teacher whether they had done it correctly.
Every time I made classroom visits for observation children had time to play because play
was part of the day‟s routine in the South African school‟s timetable. In contrast the 6 Bricks
Duplo Block approach that was used during the intervention used directed activities guided
by the teacher and the learners had to perform tasks aimed at developing different aspects of
visual perception (visual discrimination, visual memory and visual sequential memory).
Guided play
With the provision of 6 Bricks in the two schools‟ the experimental teachers managed
to guide the children play with the 6 Bricks Duplo Blocks using a colour printed guideline
placed in their files that had been prepared by the researcher. The guidelines were based on

Chapter 5: Discussion and recommendations
114
literature which suggests that when children engage in play at an early age they tend to
develop cognitively and intellectually (Vygotsky, 1978; Piaget, 1962) – something which is
supported by the results attained in the experimental classes in both South Africa and Kenya.
As noted earlier, the Kenyan children started on a lower pre-test score compared to
the South African children who my observations and the teacher interviews revealed had
been exposed to a variety of play activities before the intervention; something which appears
to have enhanced their development of visual perception during their early years of pre-
schooling (Williams, 1983). Regardless of the increase in their mean-score in both
experimental and comparison classes from pre to post-tests, the results show that learner
visual perception performance abilities improved more in the experimental groups where
guided play took place. This finding is most likely to have been a result of the provision of
the 6 Bricks Duplo Blocks guided play activities, as suggested by Hutcheson et al. (2014).
When contemplating the statement above, it should be noted that research shows that
not only is play linked to intellectual, emotional, social and physical aspects of development,
it is cardinal for the general well-being of a child. Play contributes to all aspects of learning
like the development of creativity, imagination, self-confidence, self-efficacy, as well as
physical, social, cognitive and emotional strength and skills. Children explore and experience
the world around them, experiment with new ideas, roles and experiences and in so doing,
learn to understand and construct their social position within the world. Whether guided play
using 6 Bricks used in this study accelerated such understanding, or it was only their skills
that improved (both of which can perhaps be deduced from improved achievement), cannot
be conclusively claimed, but is a reflection worthy of further research.
However, what is interesting is that the Kenyan school experimental group‟s change
in mean score from pre-to post-text almost doubled that of the results attained in the South

Chapter 5: Discussion and recommendations
115
African experimental group (mean-scores of 6.68 and 3.78 respectively; see Figure 4.4),
which suggests that the 6 Brick play resources worked most effectively where the children
had not been afforded the opportunity to play in a guided way and, as such, the intervention
was needed the most, namely, in the Kenyan experimental group that started from a lower
pre-test mean score than that attained by the South African participants.
Learner enthusiasm
The differences in pre-test scores by the South African and Kenyan scores were not
reflected in their enthusiasm for the guided play activities. Classroom observation and teacher
interview data revealed that the experimental group children from both schools were very
enthusiastic when it came to 6 Bricks. Even the South African children who already had
Duplo Blocks in their classrooms before the intervention was introduced noticeably liked the
6 Brick guided play sessions. The South African experimental group teacher confirmed this
by saying:
―They loved it. They got excited every time I told them its 6 brick time.‖
Nevertheless, it could be gauged from the classroom observations that the Kenyan
children were even more enthusiastic than their South African counterparts when it came to
the 6 Brick Dupo Block approach. Every time I entered their classroom for open-ended
observation there was a great deal of excitement amongst the children because they knew it
was time to play. If the teacher delayed the 6 Brick activities for any reason the children
could remind her that it was time for 6 Brick activities. Their added enthusiasm and
clamouring to play can probably be attributed to the fact that the 6 Bricks activities was
almost their only opportunity for play as the 6 Bricks were the only construction toys (apart
from the wooden shapes) that were available for play in their classroom. Another factor is
that play was not part of the Kenyan school‟s timetable as was the case for the South African

Chapter 5: Discussion and recommendations
116
school. The number of times I visited the Kenyan school there was no physical play taking
place in the classroom whether guided by the teacher or by the children themselves. Most of
the time the teacher would teach and draw on the chalkboard; a „chalk and talk‟ approach
which Freire (2000) calls the „banking concept‟.
Teacher attitudes and perceptions
The teachers were surprised by the use of 6 Brick activities in their classroom and
agreed that the learners paid “attention to detail” and “did everything at a stipulated time” in
both schools. The learners were allowed to be creative in their play and built things with 6
bricks well beyond their teachers‟ anticipation. The teachers believed that the 6 Bricks Duplo
Block approach enabled the children to be attentive to the instructions which they got from
them, and were very pleased by the way their children responded. The importance of positive
teacher attitudes is pointed out by Ackermann (1996) who maintains that the convictions that
teachers and parents hold deeply affect how their children become knowledgeable,
experienced and intelligent. As far as teachers are concerned, their attitude is one of the main
means through which their practices are driven, namely whether they believe that intelligence
is naturally innate and talent is given, or whether children actively construct their knowledge
through interacting with the world around them. The positive reaction by the two teachers to
the intervention suggests that they are open to the idea that their learners are able to
constructively engage with their environment and develop cognitive attributes, including
visual perception.
In fact, the Kenyan teacher said that the learners who she considered to be
academically „slow‟ were able to succeed in the 6 Brick activities faster than the children in
their class who were previously considered to be „fast‟ academically. Through the success of
those believed to be „slow‟, she was able to change her perceptions and see that play

Chapter 5: Discussion and recommendations
117
activities are characterized by shifting and emerging goals which develop spontaneously
(Fromberg, 2002). The teachers also stated that the 6 Bricks Duplo Blocks approach provided
their children an opportunity to be curious in what they were doing and become intrinsically
motivated (Abuhamdeh & Csikszentmihalyi, 2012). In the case of this study it appeared that
the guided play enabled a zone of proximal development to be developed by the teacher
which allowed the learners to learn without stress (Vygotsky, 1978).
The teachers believed that as a result of sharing the learners developed cooperative
learning skills. This statement echoes the views of Papert who maintains that the key to
learning is borne in the ability to express and project our inner ideas and feelings
(Ackermann, 1996). Knowledge and the potential to expand the human mind at any level of
development in Papert‟s view are grounded in contexts, molded by use, and the utilization of
external aids. In doing so one improves particular aspects of a learner. Through expression
and sharing the tangibility of ideas become real and the ability of learners to effectively
communicate using expressions is sharpened and promoted. Hutcheson et al., (2014) believes
that playing with 6 Brick Duplo Blocks also enhances the use and development of fine and
large motor skills, gives the children a chance to express their creativity without limits, and
offers a platform where teamwork and collaboration is practiced and fostering of their self-
confidence. This belief is borne out by the interesting similarity in the two schools, noted
during the semi-structured teacher interviews, that despite their different geographical regions
all of the children really loved building the towers and competed fiercely to see who could
build the tallest.
The experimental group teachers both felt that the 6 Bricks Duplo Block activities
enabled the children learn mathematical terms such as “same,‟ and „at least”. The teacher in
the Kenyan school made this opportunity explicit to her learners during the 6 brick guided
Chapter 5: Discussion and recommendations
118
play time. Aubrey et al., (2006) points out that mathematical ideas sprout when those who are
more experienced pass them to the other play partners indirectly as they play. Play thus
contributes to the consolidation that reinforces conceptual acquisitions and many
mathematical ideas. When watching the children play in the class where the teacher made it
explicit that mathematical terms could be learned during the 6 Brick guided play time, it was
clear that that the children were passing on of mathematical ideas as they played together.
When children play they are able to engage in social interactions that provided support within
their contexts that allowed innovative and creative problem solving which encourages
children to learn within their environment (Bennett, 1997). As children engage in play
activities they create a zone of proximal development through schema construction that
enables them to learn while interacting with others who are more experienced. The teachers
observed this during the intervention period with one stating:
―I learnt that the slow learners were able to play with the blocks better/ faster than
the fast learners.‖
This unexpected finding could be the result of creating a zone of proximal
development between the children (those who are more and less knowledgeable) and between
the children and the teacher (Vygotsky, 1978). The Kenyan teacher perceived that the 6 Brick
Duplo Block sessions:
“…, made them to do their work very fast...‖
The teacher‟s comments about the guided play sessions resonate with the opinions
expressed by researchers such as Bergen & Fromberg (2009) regarding the positive effects of
play on learner performance and conceptualisation. For example:
―Their cognitive, social, emotional and physical abilities, developed.‖

Chapter 5: Discussion and recommendations
119
―Mainly the children enjoyed it, did not know it was part of learning.‖
―They did everything at a stipulated time and make things beyond the teacher‘s
reach.‖
―They were able to know the colours especially the ones who couldn‘t differentiate -
with the blocks it helped.‖
The teachers‟ comments shed some light on possible reasons for the changes in mean-
scores in the experimental classes and also some positive effect of guided play on the
learners.
―Some of them surprised me - they normally didn‘t pay attention to details and there
they were able to copy exactly as I did‖
―They were able to develop skills in the mind.‖
It was agreed by both of the teachers interviewed that the learners learnt patience and
the Kenyan teacher added that they developed many ways of carrying out tasks like
differentiating “many, at least”; “long, short” and seeing the variations. The teacher‟s
observation echoes Hutcheson et al., (2014) on how 6 Bricks give plenty of opportunity for
the child to practice and improve self-control, which is fundamental to all other learning in
life.
Piaget (1967) notes that children are interested in and what they are capable of doing
at different stages of their development. Children need opportunities to use their whole body
to explore and aid their development of ideas, curiosity and imagination. After playing with
the 6 Bricks Duplo Blocks the children began to develop in a certain way that made them pay
attention to detail and do everything at a stipulated time. They could not touch the 6 Bricks

Chapter 5: Discussion and recommendations
120
unless instructed by the teacher, patience begun to develop. It is important that teachers and
adults know the developmental stage that the children are working with if they are to
transform random play into activities that are vital for their development (Edwards, 2000;
Piaget, 1962).
Aspects of visual perception
The descriptive quantitative data generated in this study suggests that the visual
discrimination and visual perception aspects of visual perception developed more than the
visual sequential memory aspect. The samples were too small to provide any inferential
statistics to support this assertion, so nothing can be said about these aspects at any level of
confidence from a statistical viewpoint. However, both the South African and Kenyan
experimental group teachers felt that the aspect that improved the most in the two countries
as a result of playing with 6 Bricks was visual memory (see Figure 4.6 chapter four). Both
teachers strongly believed that visual memory was the aspect that improved the most and
visual sequential memory improved the least. This belief is reflected in the quantitative data
gathered from the children from the two schools. The children did well in the aspect of visual
memory but their results in the aspect of visual sequential memory dropped in the Kenyan
comparison group from pre to post-tests. As noted above, the seemingly anomalous finding
of falling visual sequential memory scores cannot be claimed statistically, but may be worth
investigating during further research.
The Visual Memory scores from the four classes (South African experimental and
comparison groups; Kenyan experimental and comparison groups) reveal that the South
African comparison class started on a higher level than the experimental class, as was the
case for Visual Discrimination. In Kenya the experimental group also started on lower mean
scores than the comparison group. All the four classes improved from pre to post-tests

Chapter 5: Discussion and recommendations
121
(Experimental and comparison). These results are congruent with what the teachers had
stated as their perception during the semi-structured interviews conducted immediately after
post-tests on their feelings about the aspect that they felt had improved the most The teachers
were adamant that the children had shown a greater improvement in the aspect of visual
memory when compared with the other two (visual discrimination and visual sequential
memory). Relating to these statements are the ideas of Borsting (2006) which refer to visual
memory as the ability to retain visual information and to remember what the eyes have seen.
After looking at the questions asked on visual memory on the visual perceptual aspect test
results suggested that learners were able to recall what they had seen by sufficiently
processing through the short term memory and then filtering the same information into the
long-term memory. Research has shown that as a child develops, memory develops
(Gunning, 2006). After the four-month intervention period the results suggested that
children‟s cognitive capacity to encode, store and retrieve information greatly improved
(Tulving, 2000).
Visual memory plays a key role in a child‟s overall development and the skills they
need to be successful in school. Alloway & Archibald, (2008); Alloway & Alloway (2010)
point out how the development of visual working memory leads to success in reading,
spelling and mathematics. It becomes vital for a learner to recall that which he or she has seen
so as not to struggle to recall words, patterns of words or numbers and eventually place them
in the wrong order and even omit some letters and numbers. As suggested Kavale (1982).
Visual memory is the most important perceptual aspects that aids spelling, reading, writing
and numerating. The 6 Brick Duplo Block approach was described by the South African
teacher as an “awesome educational thing”. The Kenyan teacher concurred. She had seen
how the children enjoyed the 6 Brick play sessions and asked for more play materials.

Chapter 5: Discussion and recommendations
122
Hutcheson et al. (2014) state that the 6 Brick Duplo Block concept is designed to
excite and motivate young children in the classroom to attain the skills, knowledge and
attitudes necessary for success in later life. They also believe that by using the 6 Brick Duplo
Block approach children are able to develop sensory, speech & language, cognitive, motor,
social and emotional skills because of the activities that are fun and inspire laughter and love
for learning that is seen directly reflected on their academic outcomes. The teachers in this
study liked the 6 Brick Duplo Block approach and enjoyed the play sessions with their
learners. They noted how the children were actively involved in the activities at all times.
These statements support Mooney‟s (2000 p.83) notion that play is “voluntary engagement in
enjoyable activities” and reveal that the approach enabled the children to interact freely as
they played with the Duplo Blocks.
Time and materials
Although the experimental group teachers from the two different schools had never
used the 6 Bricks Duplo Block guided play approach before they both managed to do most of
the activities with their children and, once the intervention was completed, they readily
encouraged the other teachers in their schools to use the same materials, emphasising that
they would “also encourage other teachers to use the same materials” The Kenyan teacher
managed to do the activities in the order of visual discrimination, visual memory and visual
sequential memory. The South African teachers did not always follow this sequencing
because she had a number of other play activities in the school curriculum to complete so she
could not complete all of the three activities each week However, by the end of the
intervention period all the activities had been completed in the South African school. In
contrast there was no problem in completing the 6 Brick Duplo Block activities each week,
with the children often asking to do the activities twice in a day (they even went as far as
asking to use their sleeping time for play). Both teachers agreed that the activities required

Chapter 5: Discussion and recommendations
123
approximately 20 minutes not the planned 10 minutes per activity. As such, providing
sufficient time was a challenge in the two schools. The South African teachers said:
―20-30 minutes it was quite a lot of time. 10 minutes did not help me at all.‖
The Kenyan teacher agreed saying that;
―On average 20 minutes. Ten minutes was not enough. They wanted more.‖
The play sessions had to take time because teachers had to give instructions to the
children before they could embark on the activities and because of the nature of play was so
enjoyable that the children wanted more and longer play sessions. These teachers‟
perceptions support the literature on the nature of play which is seen to be a simple yet a
complex process which requires time to provide opportunities to bring together the inner
mental sphere and the realities of the real world (Elkonin, 2005), and which comes in
different forms that aim at developing knowledge, skills and understanding in the cognitive
and social domains (Broadhead, 2004; Vygotsky, 1978; Piaget, 1962).
Gender issues
Although issues of gender and the development of visual perception were not part of
the aims of this study it seemed opportune to analyse the data on hand in terms of this factor
as the data were available and easily coded into the Excel spread sheet. The biographical data
revealed that there was roughly an equal distribution of boys and girls in the samples in the
two countries. There were 21 girl and 17 boy matched pair participants (those who wrote both
the pre- and post-test) in the Kenyan school and 20 girls and 18 boy matched pairs
participants in the South African school. This distribution was similar in both the
experimental and comparison groups. Only in the South African class pre-test did the boys
attain a higher mean score than the girls (see Figure 4.8), but a two tailed t-test of the

Chapter 5: Discussion and recommendations
124
combined data revealed no statistically significant difference between the two groups
(p=0.20). No statistically significant differences were found when the boys and girls were
aggregated into experimental and comparison groups either. These findings are reflected in
the findings of a longitudinal study of children in their last year of nursery school who were
monitored over seven years. During this time no gender differences in terms of visual
perception development were found using the Piaget test for spatial orientation and the Visual
Perceptual Skills test of visual perception (De Landtsheer, Frett, Devenyns & Simons, 2016).
6. LIMITATIONS OF THE STUDY
The findings of this study should be viewed in light of the following limitations. The
sample size was limited to two schools, one in South Africa and the other in Kenya where the
medium of instruction is English. The selection of both the teachers and the learners was
made on the basis of purposive convenience sampling using two schools that were available,
had two classes of English second-language learners between 5-7 years of age, and where
consent was obtained from the parents, school heads/ principals and educational authorities to
participate in the study. In order to use matched pairs to strengthen the statistical analysis, the
sample size was even smaller than the number of children whose parents had consented for
the study (43 learners in South Africa and 56 learners in Kenya) due to absenteeism during
either the pre- or post-test, i.e. only the data generated by the children who had done both pre
and post-test were considered for this study. The tests used were restricted to only three
aspects of visual perception, namely visual discrimination, visual memory and visual
sequential memory. As such, in no way are the results of this study meant to be generalizable
or to be representative of learners, teachers or schools in South Africa and Kenya.
Nevertheless, the findings in this study appear adequately robust and sufficiently
statistically and qualitatively motivated to make an initial tentative contribution to issues of

Chapter 5: Discussion and recommendations
125
guided play in general and when using the 6 Bricks Duplo Blocks in particular in terms of
effects on visual perception development in pre-literate learners. As such, the findings appear
to be sufficiently supported to be able to make recommendation for further research on the
topic and for curriculum developers to note.
7. RECOMMENDATIONS
It becomes clear from the literature review and the findings of this study that guided
play plays an important and effective role in developing visual perception in children.
Nonetheless, in the context of the type of schools in South Africa and Kenya that participated
in the study, there are two main areas of importance that deserve further consideration. These
two areas can be classified as (i) recommendations for further research and (ii)
recommendations for curriculum and materials developers, Early Childhood Development
advisors and teachers.
Recommendations for further research
As the sample was limited to two schools in two countries with a limited number of
learners and teachers, it would seem advantageous to engage in similar research on a larger
scale, e.g., with more schools and larger number of learners, as well as different types of
schools. Only schools where English as the medium of instruction were chosen for this study
but there is also a need to target schools with other mediums of instruction, particularly where
second-language learners are concerned, for example in Kenya „Kiswahili‟ is spoken as a
national language could provide further insights in terms of giving instructions in a language
that is possibly better understood when answering questions on visual perceptual aspect test
(VPAT). Similarly, many isiXhosa home language learners are found in South African
schools, particularly in the Eastern Cape, as are Kalenjin (Nandi) home language speakers in
Chapter 5: Discussion and recommendations
126
schools in western Kenya. These local linguistic issues provide opportunities for further
research.
As the tests were limited to only three out of nine aspects of visual perception (visual
discrimination VD, visual memory VM, visual sequential memory VSM), investigation of a
broader range of visual perceptual aspects may be fruitful in terms of understanding visual
perception development through play in pre-literate learners. Finally, it is not conclusively
clear whether using the 6 Bricks Duplo Blocks approach in this study facilitated the overall
development of visual perception or merely certain visual perceptual skills and, as such,
deeper contemplation of such issues warrant further research.
Recommendations for curriculum developers, advisors and teachers
Results from this study suggest a need for curriculum developers to reconsider the
Piaget‟s stages of cognitive development under the Piagetian theory in order to design
appropriate instructional materials that promote learners‟ visual perceptual growth and
development. The 6 Bricks Duplo Block approach, which the results of this study suggest is
an effective way of accelerating visual perception via guided play, is critical in areas of the
curriculum where early reading, writing and problem-solving performance are valued. Deiner
(2005) and Gordon (2004) posit that the brain needs to organize and interpret that which is
seen via a process that takes place over a period of time by using a more effective
instructional design (Mukwa & Too, 2002). The changes in visual perception which are
attributed to the 6 Brick Duplo Block guided play approach took place over a period of four
months and curriculum developers and teachers should also be aware that guided play should
be a regular and ongoing process. Similarly, the ability of guided play with manipulatives
such as Duplo Blocks to accelerate visual perception underscores the need for curriculum
developers and early childhood advisors to make teachers aware of the potential of using

Chapter 5: Discussion and recommendations
127
guided play and help them design, use and integrate guided play sessions into their teaching
from before children start their formal schooling (Hewes, 2006).
8. CONCLUSION
The theoretical framework for this study was based on Piagetian theory of child
development using two conceptual notions: (i) Guided play to develop different aspects of
learning in general (Hutcheson et al., 2014) and (ii) the development of visual perception in
particular as an essential element required by children to enable them to process that which
their eyes have seen to activities that help them to carry out important daily life activities
(Kellerman & Arterberry, 2006). In the case of this study the particular elements were the
development visual discrimination, visual memory and visual sequential memory – all of
which are essential for the development of literacy and numeracy skills and abilities – via
using the 6 Brick Duplo Block guided play approach.
Research done within the past twenty-five years has highlighted positive connections
between play and the development of literacy (Mooney, 2008). Play, which is seen as a
universal phenomenon (Hewes, 2006), helps children thrive in a predictable pattern which is
linked to their intellectual, emotional, social and physical aspects of development
(Whitebread, 2012; Kalliala, 2006; Bennett, 1997). The data generated via the Visual
Perceptual Aspect Test in this study revealed that guided play using the 6 Brick Duplo Block
approach had a statistically significant positive effect in terms of accelerating the
development of pre-school learner‟s visual perception abilities. Individual interviews with
teachers and open ended classroom observations by the researcher, juxtaposed with the
literature on Early Childhood Development, suggest that the development of cognitive,
social, emotional and physical abilities was enhanced through the guided play sessions. These
finding suggest that instructional methods such as the 6 Brick Duplo Block approach enable

Chapter 5: Discussion and recommendations
128
engaging and pleasure driven activities towards the attainment of goals related to visual
perception skills such as preparing pre-literate young learners for the development of reading,
writing and numeracy skills.
The positive findings of this study support the contention that guided play serves an
important function when attempting to develop aspects of visual perception in pre-literate
children which have been shown to assist in the acquisition of skills, concepts and knowledge
required for literacy and numeracy in a manner that is engaging, more attractive and
interesting (Clutten, 2009). The findings on the effects of using the 6 Bricks Duplo Blocks
approach is a tool that can be used to motivate young children to attain these basic skills,
knowledge and attitudes necessary for success in later life (Hutcheson et al., 2014). Notably,
the use of the Visual Perceptions Aspect Test, which was developed in Africa and validated
for African conditions, to evaluate the effects of guided play on visual perception, should
stimulate conversations around developing visual perception in pre-school learners, an area
that is crucial to the pre literate children who are about to read and write and become
numerate (Clutten, 2009). As such, I believe that this study, though limited in scope and
range, should make a contribution to the debate on developing visual perception and related
literacy and numeracy skills in the African context in which it was undertaken.

References
129
REFERENCES
Abuhamdeh, S., & Csikszentmihalyi, M. (2012). The importance of challenge for the
enjoyment of intrinsically motivated, goal-directed activities. Personality and Social
Psychology Bulletin, 38(3), 317-330.
Ackermann, E. (1996). Perspective-taking and object construction: Two keys to learning.
Constructionism in Practice: Designing, Thinking, and Learning in a Digital World,
Lawrence Erlbaum, Mahwah, NJ, 25-35.
Ailwood, J. (2003). Governing early childhood education through play. Contemporary Issues
in Early Childhood, 4(3), 286-299.
Alloway, T. P., & Alloway, R. G. (2010). Investigating the predictive roles of working
memory and IQ in academic attainment. Journal of Experimental Child Psychology,
106(1), 20-29.
Alloway, T. P., & Archibald, L. (2008). Working memory and learning in children with
developmental coordination disorder and specific language impairment. Journal of
Learning Disabilities, 41(3), 251-262.
Arcavi, A. (2003). The role of visual representations in the learning of mathematics.
Educational Studies in Mathematics, 52(3), 215-241.
Arterberry, M. (2008). Perceptual development. Encyclopaedia of Infant and Early
Childhood Development, 522-531.
Atherton, H., & Gates, B. (2007). A history of learning disabilities: Churchill Livingstone
Edinburgh.

References
130
Aubrey, C., Godfrey, R., & Dahl, S. (2006). Early mathematics development and later
achievement: Further evidence. Mathematics Education Research Journal, 18(1), 27-
46.
Badian, N. A. (2005). Does a visual-orthographic deficit contribute to reading disability?
Annals of Dyslexia, 55(1), 28-52.
Baluoti, A. R., Bayat, M. R., & Alimoradi, M. (2012). Relationship between visual
perception and reading disability in primary students (first, second, third, grade) of
Ahwaz city. International Research Journal of Applied and Basic Sciences, 2012,
(Vol 3.): Science Explorer Publications.
Basit, T. N. (2010). Conducting research in educational contexts: Bloomsbury Publishing.
Bennett, N. (1997). Teaching through play: Teachers' thinking and classroom practice:
McGraw-Hill Education (UK).
Bergen, D. (1998). Readings from... Play as a Medium for Learning and Development: Eric.
Bergen, D. (2002). The role of pretend play in children's cognitive development. Early
Childhood Research & Practice, 4(1).
Bergen, D., & Fromberg, D. P. (2009). Play and social interaction in middle childhood. Phi
Delta Kappan, 90, 426-430. http://dx.doi.org/10.1177/003172170909000610.
Bergh, Z. (2003). The foundations of personality. In Z. C. Bergh & A. L. Theron (Eds.),
Psychology in the Work Context, (2nd ed.) (pp. 279-299), Cape Town: Oxford
University Press Southern Africa.
Bloomberg, L., & Volpe, M. (2008). Completing qualitative research: A roadmap from
beginning to end. Thousand Oaks: Sage Publications.
Bodrova, E., & Leong, D. J. (1996). Tools of the mind: The Vygotskian approach to early
childhood and primary classrooms. Pearson Upper Saddle River, NJ.

References
131
Bogdan, R. C., & Biklen, S. K. (1998). Foundations of qualitative research in education.
Qualitative Research in Education: An Introduction to Theory and Methods, 1-48.
Borsting, E. (2006). Overview of vision efficiency and visual processing development. In M.
M Scheinman & M. W Rouse (2nd ed.), Optometric management of learning related
vision problems (pp.35-68). Missouri: Mosby Elsevier.
Bowman, B. T., Donovan, S., & Burns, M. S. (2000). Eager to learn: Educating our
preschoolers: Executive summary: National Academy Press.
Brey, A. (2017). The effect of ‗6 Bricks‘ guided play on grade two learners‘ visual
perception and reasoning abilities (Unpublished Doctoral Dissertation). Nelson
Mandela Metropolitan University, Port Elizabeth
Broadhead, P. (2004). Early years play and learning: Developing social skills and
cooperation: Psychology Press.
Brockett, S., & Director, I. Integration of Auditory and Visual Systems. Accessed on 28 May
2016 at: [http://www.autism.org/visual.html]:1-2.
Brooker, E., Blaise, M., & Edwards, S. (2014). SAGE handbook of play and learning in early
childhood. Sage.
Bruner, J. S. (1966). Toward a theory of instruction (Vol. 59): Harvard University Press.
Bruner, J., Sylva, K., & Genova, P. (1976). The role of play in the problem solving of
children 3–5 years old. Play-Its role in development and evolution. New York: Basic
Books.
Burns, R. B. (1997). Introduction to research methods: Addison Wesley Longman.
Butler-Kisber, L. (2010). Qualitative inquiry: Sage Publications.
Carlberg, C. (2011). Statistical analysis: Microsoft 2010. New York, USA: Pearson
Education.
References
132
Carr, A. (2015). The handbook of child and adolescent clinical psychology: A contextual
approach: Routledge.
Casey, B. M., Andrews, N., Schindler, H., Kersh, J. E., Samper, A., & Copley, J. (2008). The
development of spatial skills through interventions involving block building activities.
Cognition and Instruction, 26(3), 269-309.
Cheatum, B. A., & Hammond, A. A. (2000). Physical activities for improving children's
learning and behavior: A guide to sensory motor development: Human Kinetics.
Cliffs, New Jersey: Prentice-Hall.
Clutten, S. C. (2009). The development of a visual perception test for learners in the
foundation phase. University of South Africa.
Cohen, L., Manion, L., & Morrison, K. (2007). Research methods in education (6th ed.).
London: Routledge.
Cohen, L., Manion, L., & Morrison, K. (2013). Research methods in education: Routledge.
Collard, R. R., & Sutton-Smith, B. (1979). Exploration and play: Gardner Press.
Cratty, B. J. (1979). Perceptual and motor development in infants and children. Englewood
Creswell, J. W. (2003). Research design: Qualitative, quantitative, and mixed methods
design. London: Sage.
Creswell, J. W. (2005). Educational research: Planning, conducting, and evaluating
quantitative and qualitative research (2nd ed.). New Jersey: Pearson Education.
Creswell, J. W. (2009). Research design: Qualitative and mixed methods approaches.
London and Thousand Oaks: Sage Publications.
Creswell, J. W., & Plano Clark, V. L. (2011). Designing and conducting mixed methods
research (2nd ed.). Los Angeles: Sage Publications, Inc.
Creswell, J.W. & Plano Clark, V. L. (2007). Designing and conducting mixed methods
research. Thousand Oaks, CA: Sage.

References
133
Dankert, H. L., Davies, P. L., & Gavin, W. J. (2003). Occupational therapy effects on visual-
motor skills in preschool children. American Journal of Occupational Therapy, 57(5),
542-549.
De Landtsheer, M., Frett, E., Devenyns, H. & Simons, J. (2016). Study of auditory and visual
perception in relation to spatial orientation in young children. European
Psychomotricity Journal, 8(1), 66-83.
De Vos, A. S., Strydom, H., Fouche, C. B., & Delport, C.S. (2011). Research at grass roots
(4th ed). Pretoria: Van Schaik Publishers
Dednam, A. (2005). Learning impairment. Addressing barriers to learning: A South African
perspective. Pretoria: Van Schaik
Deiner, P. L. (2004). Resources for educating children with diverse abilities: Birth through
eight: Wadsworth Publishing Company.
Denscombe, M. (2008). Communities of practice a research paradigm for the mixed methods
approach. Journal of Mixed Methods Research, 2(3), 270-283.
Denzin, N. K., & Lincoln, Y. S. (2005). The handbook of qualitative research (3rd ed.).
Thousand Oaks, CA: Sage.
Denzin, N. K., & Lincoln, Y. S. (2011). The SAGE handbook of qualitative research:
London: Sage.
DePoy, E., & Gilson, S. F. (2008). Evaluation practice: How to do good evaluation research
in work settings: Psychology Press.
DiCicco Bloom, B., & Crabtree, B. F. (2006). The qualitative research interview. Medical
Education, 40(4), 314-321.
Dictionary, M. (1997). Published by the Macquarie Library Macquarie Library Macquarie
University Australia.

References
134
Doidge, N. (2007). The brain that changes itself: Stories of personal triumph from the
frontiers of brain science: Penguin.
Donald, D., Lazarus, S., & Lolwana, P. (2010). Educational Psychology in social context:
Ecosystemic applications in Southern Africa (4th Edition). Southern Africa: Oxford
University Press.
Driscoll, D. L., Appiah-Yeboah, A., Salib, P., & Rupert, D. J. (2007). Merging qualitative
and quantitative data in mixed methods research: How to and why not. Ecological and
Environmental Anthropology (University of Georgia), 18.
Druckman, D. (2005). Doing research: Methods of inquiry for conflict analysis: Sage.
Edwards, C. P. (2000). Children's play in cross-cultural perspective: A new look at the six
cultures study. Cross-Cultural Research, 34(4), 318-338.
Elkonin, D. B. (2005). Chapter 3: Theories of play. Journal of Russian & East European
Psychology, 43(2), 3-89.
Farroni, T., & Menon, E. (2008). Visual perception and early brain
development. Encyclopedia on early childhood development, Montréal, QC, Centre of
excellence for early childhood development, retrieved January, 2017, from
http://www.child-encyclopedia.com/sites/default/files/textes-experts/en/580/visual-
perception-and-early-brain-development.pdf
Fox, J. E. (2007). Back-to-basics: Play in early childhood. Early Childhood News:
Excelligence Learning Corporation. Retrieved from http://www. early childhoodnews.
com/earlychildhood/article_view. aspx.
Freire, P. (2000). Pedagogy of the Oppressed. London: Bloomsbury
Fromberg, D. P. (1999). A review of research on play. The Early Childhood Curriculum:
Current Findings in Theory and Practice, 27-53.
Fromberg, D. P. (2002). Play and meaning in early childhood education: Allyn & Bacon.

References
135
Fromberg, D. P. (2012). The all-day kindergarten and pre-k curriculum: A dynamic-themes
approach: Routledge.
Frost, J. L. (1992). Play and playscapes: Delmar.
Gathercole, S. E., Brown, L., & Pickering, S. J. (2003). Working memory assessments at
school entry as longitudinal predictors of National Curriculum attainment levels.
Educational and Child Psychology, 20(3), 109-122.
Gay, L. R., & Airasian, P. (2000). Educational research: Competencies for analysis and
application (6th ed.). Prentice Hall: New Jersey.
Gentile, M. (2005). Functional visual behaviour: A therapist‘s guide to evaluation and
treatment options (2nd ed). Bathesda, MD: AOTA Publication.
Gesell, A., Ilg, F. L., & Bullis, G. E. (1949). Vision: Its development in infant and child. New
York: Paul B. Hoeber, Inc.
Gibson, J. J. (2014). The ecological approach to visual perception: Classic edition:
Psychology Press.
Gibson, W., & Brown, A. (2009). Working with qualitative data. London: Sage.
Ginsburg, H. (2000). Children's Minds and Developmentally Appropriate Goals of Preschool
Mathematics Education. Paper presented at the Annual Meeting of the American
Educational Research Association, New Orleans, April.
Glass, P. (2002). Development of the visual system and implications for early intervention.
Infants & Young Children, 15(1), 1-10.
Gorard, S., & Taylor, C. (2004). Combining methods in educational and social research:
McGraw-Hill Education (UK).
Gordon, I. E. (2004). Theories of visual perception: Psychology Press.
Gregory, R. L. (1970). The intelligent eye. London: Weidenfeld and Nicolson.

References
136
Groffman, S. (2006). The relationship between visual perceptual problems and learning. In
M. M. Scheiman & M. W. Rouse (2nd ed.), Optometric Management of Learning
Related Vision Problems (pp.241-282). Missouri: Mosby Elsevier.
Groth-Marnat, G. (1990). The handbook of psychological assessment. New York: John
Wiley & Sons.
Guba, E. G. (1990). The alternative paradigm dialog. In E. G. Guba (Ed.), The paradigm
dialog (pp.17-27). Newbury Park, CA: sage
Gunning, T. G. (2006). Closing the literacy gap: Allyn & Bacon.
Hall, N. (1991). Play and the emergence of literacy. In J. Christie (Ed.), Play and early
literacy development (pp.3-25). Albany, New York: State University of New York
Press.
Hansel, R. (2016). Creative block play: A Comprehensive guide to learning through building:
Redleaf Press.
Hewes, J. (2006). Let the children play: Nature's answer to early learning: Early Childhood
Learning Knowledge Centre.
Hewitt, K. (2001). Blocks as a tool for learning: A historical and contemporary perspective.
Young Children, 56(1), 6-14.
Hirsh-Pasek, K. (2009). A mandate for playful learning in preschool: Applying the scientific
evidence: Oxford University Press.
Hutcheson, B. Frank, N & Smith, L. (2014). Back to basics with 6 bricks. Johannesburg: Care
for Education.
Hutt, C. (1976). Exploration and play in children. In S. B. Jerome, J. Alison, K. Sylva (Eds.).
Play: It‘s Role in Development and Evolution (pp. 202-215). New York: Basic Books
Jarbandhan, D. (2006). Using the survey procedure and interview data collection technique.
Journal of Public Administration, 41(3), 669-681.
References
137
Johnson, B., & Christensen, L. (2008). Educational research: Quantitative, qualitative, and
mixed approaches: Sage.
Johnson, B., & Turner, L. A. (2003). Data collection strategies in mixed methods research.
Handbook of Mixed Methods in Social and Behavioral Research, 297-319.
Johnson, R. B., & Onwuegbuzie, A. J. (2004). Mixed methods research: A research paradigm
whose time has come. Educational Researcher, 33(7), 14-26.
Jooste, C., & Jooste, M. (2005). Intellectual impairment. In E. Landsberg, D. Kruger & N.
Nel (Eds.), Addressing Barriers to Learning. A South African Perspective (pp.380-
404). Pretoria: Van Shaik Publishers.
Judd, C., Smith, E., & Kidder, L. (1991). Research methods in social science. Fort Worth:
Holt, Rinehart, and Wanston.
Kalliala, M. (2005). Play culture in a changing world. UK: McGraw-Hill Education.
Kavale, K. (1982). Meta-analysis of the relationship between visual perceptual skills and
reading achievement. Journal of Learning Disabilities, 15(1), 42-51.
Kellman, P. J., & Arterberry, M. E. (2006). Infant visual perception. In D. Kuhn & R. S.
Siegler (Eds.), Handbook of child psychology (Vol. 2). Cognition perception and
language (6th ed.), (pp.109-160). New Jersey: John Wiley & Sons
Kellman, P., & Arterberry, M. (2006). Perceptual development. The Handbook of Child
Psychology: Cognition, Perception, and Language, 6, 109-160.
King, N., & Horrocks, C. (2010). Interviews in qualitative research: Sage.
Klenk, L. (2001). Playing with literacy in preschool classrooms. Childhood Education, 77(3),
150-157.
Koerber, S., Mayer, D., Osterhaus, C., Schwippert, K., & Sodian, B. (2015). The
development of scientific thinking in elementary school: A comprehensive inventory.
Child Development, 86(1), 327-336.

References
138
Koonin, M. (2014). Validity and reliability. In F., du Plooy-Cilliers, C., Davis, & R.,
Bezuidenhout (Eds.), Research matters (pp. 252-260). Cape Town: Juta
Krauss, S. E. (2005). Research paradigms and meaning making: A primer. The Qualitative
Report, 10(4), 758-770.
Kurtz, L. A. (2003). How to help a clumsy child: Strategies for young children with
developmental motor concerns: Jessica Kingsley Publishers.
Kvale, S. (2008). Doing interviews. In M. Sewell (Ed.), The use of qualitative interviews in
evaluation: An introduction to qualitative research interviewing. Thousand Oaks, CA:
Sage
Landsberg, E., Krüger, D., & Nel, N. (2005). Addressing barriers to learning: A South
African perspective: Van Schaik Publishers.
Lederman, N. G., Abd El Khalick, F., Bell, R. L., & Schwartz, R. S. (2002). Views of
nature of science questionnaire: Toward valid and meaningful assessment of learners'
conceptions of nature of science. Journal of Research in Science Teaching, 39(6),
497-521.
Leedy, P., & Ormrod, J. (2005). A handbook for teacher research from design to
implementation: New Jersey: Pearson Education.
Lerner, J. (2000). Learning disabilities: Theories, diagnosis, and correction. Boston:
Houghton Mifflin.
Lincoln, Y. S., & Guba, E. G. (1985). Naturalistic inquiry (Vol. 75): Sage.
Loikith, C. (1997). Visual perception: Development, assessment and intervention. In M.
Gentile (Ed.), Functional visual behaviour: A Therapist‘s guide to evaluation and
treatment options. Bathesda, MD: AOTA Publications.

References
139
Loikith, C. (2005). Development of visual attention. In M. Gentile (Ed.), Functional visual
behaviour: A therapist guide to evaluation and treatment options (pp. 145-170).
Bathesda, M.D: AOTA Publications.
MacNaughton, G., & Rolfe, S. A. (2001). The research process: Doing early childhood
research. International Perspectives on Theory and Practice, 12-30.
Maree, K., & Pietersen, J. (2007). The quantitative research process: First steps in research.
Pretoria: Van Schaik.
Mayer, D., Sodian, B., Koerber, S., & Schwippert, K. (2014). Scientific reasoning in
elementary school children: Assessment and relations with cognitive abilities.
Learning and Instruction, 29, 43-55.
McLeod, S. A. (2007). Visual Perception Theory. Retrieved from
www.simplypsychology.org/perception-theories.html
Mertens, D. M. (2005). Research methods in education and psychology: Integrating diversity
with quantitative & qualitative approaches (2nd ed). Thousand Oaks, California:
Sage Publications
Mertens, D. M. (2010). Research and evaluation in education and psychology: Integrating
diversity with quantitative, qualitative, and mixed methods. Los Angeles: Sage
Publications, Inc.
Mielonen, A., & Paterson, W. (2009). Developing literacy through play. Journal of Inquiry
and Action in Education, 3(1), 2.
Mishler, E. G. (2000). Validation in inquiry-guided research: The role of exemplars in
narrative studies. Acts of Inquiry in Qualitative Research, 119-146.
Monette, D., Sullivan, T., & Dejong, C. (2005). Applied social research: A tool for the
human services. Belmont, CA: Brooks/Cole-Thomson Learning: Inc.
Montessori, M., & Carter, B. B. (1936). The secret of childhood: Orient Longmans Calcutta.

References
140
Mooney, C. G. (2000). Theories of childhood: An introduction to Dewey, Montessori,
Erikson, Piaget. Minnesota: Red Leaf Press.
Morgan, D. L. (2007). Paradigms lost and pragmatism regained methodological implications
of combining qualitative and quantitative methods. Journal of Mixed Methods
Research, 1(1), 48-76.
Mouton, J. (2002). How to succeed in your Master‘s and Doctoral Studies. Pretoria: van
Schaik
Mukwa, C., & Too, J. (2002). General instructional methods. Eldoret: Moi University Press.
Muro, J., Petty, K., & DakoGyeke, M. (2006). Facilitating the transition between play in the
classroom and play therapy. Journal of School Counselling, 4(17), 17.
Murray, C. (2012). Sport in care: using freedom of information requests to elicit data about
looked after children's involvement in physical activity. British Journal of Social
Work, 43(7), 1347-1363.
Nath, S., & Szücs, D. (2014). Construction play and cognitive skills associated with the
development of mathematical abilities in 7-year-old children. Learning and
Instruction, 32, 73-80.
Nespeca, S. M. (2012). The importance of play, particularly constructive play, in public
library programming. The Association for Library Service to Children, September, 10.
Newman, F., & Holzman, L. (1993). Vygotsky: Revolutionary scientist. New York:
Routledge.
Nieuwenhuis, J. (2007). Introducing qualitative research: In K. Maree (Ed.), First Steps in
Research (pp.47-66). Pretoria: Van Schaik Publishers.
O'Leary, Z. (2004). The essential guide to doing research. London: Sage.
Onwuegbuzie, A. J., & Collins, K. M. (2007). A typology of mixed methods sampling
designs in social science research. The Qualitative Report, 12(2), 281-316.
References
141
Onwuegbuzie, A. J., & Leech, N. L. (2006). Linking research questions to mixed methods
data analysis procedures 1. The Qualitative Report, 11(3), 474-498.
Papert, S., & Harel, I. (1991). Situating constructionism. Constructionism, 36(2), 1-11.
Patton, M. Q. (2002). Designing qualitative studies. Qualitative Research and Evaluation
Methods, 3, 230-246.
Perry, B., & Dockett, S. (2002). Young children‟s access to powerful mathematical ideas.
Handbook of International Research in Mathematics Education, 2, 81-112.
Perry, J. (2001). Outdoor play: Teaching strategies with young children (Vol. 80): Teachers
College Press.
Peshkin, A., & Glesne, C. (1992). Becoming qualitative researchers: An introduction. NY:
Longman Publising Group.
Phillips, D. A., & Shonkoff, J. P. (2000). From neurons to neighbourhoods: The science of
early childhood development: National Academies Press.
Piaget, J. (1953). The origin of intelligence in the child: Routledge and Kegan Paul.
Piaget, J. (1962). Play, dreams and imitation in children. New York: WW Norton & Co.
Piaget, J. (1964). Part I: Cognitive development in children: Piaget development and
learning. Journal of Research in Science Teaching, 2(3), 176-186.
Piaget, J. (1967). The mental development of the child. Six Psychological Studies, 3-73.
Piaget, J., & Cook, M. (1952). The origins of intelligence in children (Vol. 8): International
Universities Press New York.
Pickering, S. J. (2001). The development of visuo-spatial working memory. Memory, 9(4-6),
423-432.
Pollman, M. J., & Phifer, S. (2010). Blocks and beyond. Baltimore: Brookes.
References
142
Reif, F., & Heimburge, A. (2006). How to reach and teach all children in the inclusive
classroom: Practical strategies, lesson and activities. San Francisco, CA: Jossey-
Base.
Sattler, J., & Evans, C. (2002). Visual impairments. In J. M. Sattler (Ed.), Assessment of
children. Behavioural and clinical applications (4th ed.), (pp. 367-376). San Diego:
Jerome.
Scheiman, M., & Gallaway, M. (2006). Optometric assessment: Visual information
processing problems. Optometric Management of Learning Related Vision Problems
(2nd ed.), St Louis: Mosby, 369-406.
Scheiman, M., & Rouse, M. W. (2006). Optometric management of learning-related vision
problems: Elsevier Health Sciences.
Schneck, C. M. (2005). Visual perception (5th ed.). In J. Case-Smith (Ed.), Occupational
Therapy in Children (pp. 412-446). Missouri: Elseriver Mosby.
Schram, T. H. (2006). Conceptualizing and proposing qualitative research: Pearson Merrill
Prentice Hall.
Scott, M. (2003). School readiness: A head start for preschool years: Pearson South Africa.
Seale, C. (1999). Quality in qualitative research. Qualitative Inquiry, 5(4), 465-478.
Senge, P. (1990). The fifth discipline: The art and science of the learning organization. New
York: Currency Doubleday.
Sewell, M. (2001). The use of qualitative interviews in evaluation. Retrieved from httpp. ag.
arizona. edu/fcr/fs/cyfar/Intervu5. htm. January, 2017
Silverman, D. (2000). Doing qualitative research: A practical guide. London: Sage.
Smilansky, S., & Shefatya, L. (1990). Facilitating play: A medium for promoting cognitive,
socio-emotional and academic development in young children: Psychosocial &
Educational.

References
143
Somekh, B., & Lewin, C. (2005). Research methods in the social sciences: Sage.
Sousa, D. A. (2001). How the brain learns. Thousand Oaks, CA: Corwin Press.
Stenbacka, C. (2001). Qualitative research requires quality concepts of its own. Management
Decision, 39(7), 551-556.
Struwig, F. W., & Stead, G. B. (2001). Planning, designing & reporting research: Cape
Town: Hanli Venter.
Tashakkori, A., & Teddlie, C. (2003). The past and the future of mixed methods research:
From data triangulation to mixed model designs. In A. Tashakkori & C. Teddlie
(Eds.), Handbook of Mixed Methods in Social & Behavioural Research (pp.671-701).
Thousand Oaks, CA: Sage Publications.
Tashakkori, A., & Teddlie, C. (2010). Sage handbook of mixed methods in social &
behavioral research: Sage.
Taylor, P. (2014). Contemporary qualitative research: Toward an integral research
perspective. In S. K. Abell & N. G. Lederman (Eds.), Handbook on Research on
Science Education (pp.113-169). New York: Routledge
Taylor, P. C., & Medina, M. N. D. (2013). Educational research paradigms: From positivism
to multiparadigmatic. The Journal of Meaning-Centered Education, 1(2), 1-13.
Ted Brown, G., Rodger, S., & Davis, A. (2003). Test of Visual Perceptual Skills--Revised:
An Overview and Critique. Scandinavian Journal of Occupational Therapy, 10(1), 3-
15.
Teddlie, C., & Tashakkori, A. (2009). Foundations of mixed methods research: Integrating
quantitative and qualitative approaches in the social and behavioral sciences: Sage.
Tsai, C.-L., Wilson, P. H., & Wu, S. K. (2008). Role of visual–perceptual skills (non-motor)
in children with developmental coordination disorder. Human Movement Science,
27(4), 649-664.

References
144
Tsao, Y.-L. (2008). Using guided play to enhance children's conversation, creativity and
competence in literacy. Education, 128(3), 515.
Tulving, E., & Craik, F. I. (2000). The Oxford handbook of memory: Oxford: Oxford
University Press.
Uttal, D. H., Meadow, N. G., Tipton, E., Hand, L. L., Alden, A. R., Warren, C., &
Newcombe, N. S. (2013). The malleability of spatial skills: A meta-analysis of
training studies. Psychological Bulletin, 139(2), 352.
Van Oers, B., & Duijkers, D. (2013). Teaching in a play-based curriculum: Theory, practice
and evidence of developmental education for young children. Journal of Curriculum
Studies, 45(4), 511-534.
Verdine, B. N., Golinkoff, R. M., Hirsh Pasek, K., Newcombe, N. S., Filipowicz, A. T., &
Chang, A. (2014). Deconstructing building blocks: Preschoolers' spatial assembly
performance relates to early mathematical skills. Child Development, 85(3), 1062-
1076.
Vygotsky, L. S. (1967). Play and its role in the mental development of the child. Soviet
Psychology, 5(3), 6-18.
Vygotsky, L. S. (1978). Mind in Society. Cambridge, MA: Harvard University Press.
Walter, M. (2006). Social science methods: An Australian perspective. New York: Oxford
University Press.
Wardle, F. (2006). Play as curriculum. Early Childhood News: The Professional Resource for
Teachers and Parents.
Webb, P (2008). Discussion and exploratory talk. In P. Webb (Ed.), Scientific literary: A new
Synthesis (pp.-29-50). Port Elizabeth: Bay Books.
Webb, P. (2010). Science education and literacy: Imperatives for the developed and
developing world. Science, 328, 448-450.

References
145
Webb, P., & Mayaba, N. (2010). The effect of an integrated strategies approach to promoting
scientific literacy on grade 6 and 7 learner‟s general literacy skills. African Journal of
Research in Mathematics, Science and Technology Education. 36(4), 381-401.
Whitebread, D., & O'Sullivan, L. (2012). Preschool children's social pretend play: Supporting
the development of meta-communication, metacognition and self-regulation.
International Journal of Play, 1(2), 197-213.
Williams, H. G. (1983). Perceptual and motor development: Prentice Hall.
Wolfgang, C. H., Stannard, L. L., & Jones, I. (2001). Block play performance among
preschoolers as a predictor of later school achievement in mathematics. Journal of
Research in Childhood Education, 15(2), 173-180.
Wood, E., & Attfield, J. (2005). Play, learning and the early childhood curriculum: Sage.
Woodrome, S. E., & Johnson, K. E. (2009). The role of visual discrimination in the learning-
to-read process. Reading and Writing, 22(2), 117-131.
Young, C. J., Cartmill, E. A., Levine, S. C., & Goldin-Meadow, S. (2013). Gesture and
Speech Input are Interlocking Pieces: The Development of Children‟s Jigsaw Puzzle
Assembly Ability.

Appendices
146
APPENDIX A: INTERVIEW PROTOCOL
Biographical Information
How many years have you been teaching foundation phase? /ECDE Section?
How many years have you been teaching grade R / ECDE Section?
Have you used Duplo in your teaching before?
Interview Questions
Have you ever used or played with Six-Bricks before? If so, was it used for general
play or was it used for specific activities aimed at developing specific concepts?
Were the learners enjoying the sessions with the Duplo or did they become bored /
distracted?
Every activity was done per day in the order VD, VM then VSM. Did you manage to
do an activity three times each week?
How long did each activity take on average? Was that time enough or too much for
them?
If you did these activities at a particular time then maybe you delay, did the children
remind you to do these activities?
What else did the learners learn apart from the aspects of VD, VM and VSM? Did the
Six Bricks help you teach other concepts? If so, how did you know?
Are there any scenarios that things went unexpectedly i.e. right or wrong? If so what
did you do? Were you caught by surprise?

Appendices
147
Are there any changes in terms of way of doing things that you noticed with the
learners as you guided them play?
Were you able to assess any skills by observing the children's involvement in the
activity?
Have the play sessions using the Six Bricks changed the way you think about things,
or the way you teach the children within your class environment?
Did the play materials help the learners play amicably as they focused on the days‟
activity or sometimes they quarrelled?
Did you like the activities by Duplo? If so will you play with other classes in future?
Did the children enjoy the activities?
Were there any challenges? If so how did you overcome them?
Which skill really improved as a result of playing with the Bricks? Either with you or
with the learners you taught.
How else did you use Six Bricks apart from playing? E.g. in math or socialization.
What did you learn about using Six Bricks that enhanced your teaching in class that
improved your mode of teaching?
What do your children enjoy most as a result of playing with the blocks? Is it the
colourful bricks or the cooperation that came as a result of playing together?
Could you state some lessons learnt when using Six Bricks? For example, patience,
thinking of new ideas or remembering instructions?
Development of cognitive, social, emotional and physical abilities has been shown
through play. Did you see any sign of any of these abilities being developed when the
children played with the Six Bricks?
During play with Six-Bricks for how long did the learners concentrate? For how long
did their attention span last

Appendices
148
Did you always do these activities with the learners or sometimes they did it alone
Were there any difficulties you faced or encountered with the bricks/
In future will you take part in these activities or you are satisfied with what you have
done
What else would you like to add
Visual Perceptual Aspects:
The intervention phase consisted of three Visual Perceptual Aspects which included:
visual discrimination – what is similar or different in form (e.g. the formation
of letters and numbers, shapes),
visual memory – (to remember what was visually seen e.g. spelling, copying
from the board),
visual sequential memory (ability to remember visual details in the correct
order e.g. counting in 2‟s or 3‟s in similar repeated pattern),
Which visual perceptual aspect do you think improved the most through Six Bricks?
Was it VM, VD or VSM.
Which visual perceptual aspect do you think improved the least through Six
Bricks? Was it VD, VM or VSM
Do you think the visual perceptual aspects of VD, VM and VSM transferred across
into the classroom?

Appendices
149
APPENDIX B: RECORD SHEETS
Date
Activity Name
Number of blocks used 1 2 3 4 5 6
Learners completedthe activity
Fully Partially Not at all
Learners‟ understanding of activity
Fully Partially No Understanding
Learners‟enjoyment of activity
Comment(optional)

Appendices
150
APPENDIX C: VISUAL PERCEPTUAL ASPECT TEST (VPAT)
VISUAL PERCEPTUAL ASPECT TEST (VPAT)
NAME _____________________________________
DATE _____________________________________

Appendices
151

Appendices
152

Appendices
153
SUBTEST: VISUAL DISCRIMINATION (VD)
VISUAL DISCRIMINATORY ASPECTS
(Similar Test: Gardiner‘s TVPS: Subtest - Visual Discrimination)
Task: To locate the exact two or three dimensional (2- 3D) view of a form
(the target item) in the midst of other represented form views (the
response items).
Purpose: To evaluate the learner‟s ability to observe swiftly, as well as
accurately, concrete differences and/or similarities in presented 2- or 3D
printed form views represented on blue paper.
Over and above: requires visual attention, visual scanning, reasoning and motor planning
(to point to an elected response item) aspects
Ceiling: Three consecutive unsuccessful responses
Time Allocation: 2 to 9 seconds (taking into account the learner‟s age and the item‟s level of difficulty)
Material:
3D plastic shapes: one oval and two circles
Test Booklet containing 16 Visual Discrimination (VD) Plates
Concrete Example: plastic 3-dimensional shapes (an oval and two circles
of the same color)
Instructions: The tester places an oval and two circles, which are the same in colour vertically
in front of the learner. Say to the learner r, “See this shape…” (whilst pointing to a circle)
“…look and find it amongst these” (whilst pointing to the remaining shapes [one circle and an
oval] on the table). If learner selects the circle say, “Yes, it is exactly the same… same shape,
size and colour.” If learner is unsuccessful take time to explain what makes the two circles
similar (i.e. the colour, shape and size) as well as what makes the oval differ to the circle.

Appendices
154
– 2- or 3D represented views of black stimuli on blue paper
arranged from easy to more complicated form views
Instructions: Present the VD Test booklet by placing it in front of the learner. Open the VD
Plate 1 in front of the learner. Say to the learner, “See this form…” (whilst placing the circle on
the plate‟s target item) “…see that it is the same as the one drawn on this paper?” Remove the
circle. Say to the learner, “See this form in this block…” (whilst pointing to the target block
containing a the single 2D form view). Then say, “Look and find it among these forms below.”
(pointing now to the blocks below containing the various choices). If the learner identifies and
nominates the correct response continue with the next plate of the VD subtest until the ceiling is
reached. If the learner is unable to allocate the correct response, once more demonstrate the
Concrete and Plate 1 Examples. Record this unsuccessful attempt on the score sheet (see score
sheet example). The learner may require prompting to make a choice if more time than is
considered reasonable is taken (see time allocation). Record all responses on the score sheet by
either circling or crossing through the learner‟s elected response.
This can assist with a possible diagnostic evaluation, as well as to delineate the visual
perceptual aspect which may require remediation.
Example below of an item from the Visual Discrimination (VD) subtest of the Visual Perceptual
Aspects Test (Clutten, 2009).

Appendices
155

Appendices
156
Example below of an item from the Visual Memory (VM) subtest of the Visual Perceptual
Aspects Test (Clutten, 2009).

Appendices
157
SUBTEST: VISUAL SEQUENTIAL MEMORY (VSM) :
(Similar Tests: Gardiner‘s TVPS – Subtest: Visual Sequential Memory, ITPA‟s Visual Sequential Memory Subtest)
Task: To identify and hold a 2- or 3 D represented sequential pattern of forms in the working memory to be able to accurately recall it
Purpose: To evaluate the learner‟s ability to remember a non-meaningful sequential pattern of a visual stimuli previously seen
Over and above: Requires visual attention, visual scanning, reasoning, comprehending and planning
Ceiling: Three consecutive unsuccessful responses
Time Allocation: 5 seconds for 2 to 3 sequential forms (items 1 - 5;
12 seconds for 6 to 7 sequential forms (items 10 – 13)
9 seconds for 4 to 5 sequential forms (items 6 - 9)
14 seconds for 8 to 9 sequential forms (items 14 - 16)
Time Period: 6 to 10 seconds (taking into account the learner‟s age and the item‟s difficulty)
Material:
3D plastic shapes: the same coloured circle and cross shapes
Test Booklet containing 32 Visual Memory Plates
Procedure:
3D plastic shapes: the same coloured circle and cross shapes Test Booklet containing 32 Visual Memory Plates
Concrete Example: plastic 3-dimensional shapes (circle, and two cross shapes)
Instructions: The tester builds a form pattern (i.e. x o x) on the table in front of the learner. Say to the learner, “See this pattern of shapes… look carefully as you must remember it so that you can copy it…” (whilst pointing to the pattern of shapes). Allow the learner time to view the shape before removing it. Then say, “…build the pattern you saw” (whilst placing the removed shapes back on the table in front of the learner).
Test Booklet: 32 VSM Plates –
2D black stimuli on blue paper
Instructions: Place the VSM Test booklet it in front of the learner. Open VSM Plate 1 in front of the learner. Say to the learner, “See this pattern… look carefully as you must remember it, so that you can find it on the next page…” (whilst pointing to the single target form on the plate).

Appendices
158
After you have returned the page say, “… look and find the same pattern” (whilst pointing to the choice of response items on the plate). Allocated time for the learner to view the design (see time allocation above). If the learner identifies and nominates the correct response continue with the next plate of the VSM subtest until the ceiling is reached. If the learner is unable to allocate the correct response, once more demonstrate the Concrete and Plate 1 Examples. Record this unsuccessful attempt on the score sheet (see score sheet example). The learner may require prompting to make a choice if more time than is considered reasonable is taken (see time allocation). Remember a majority of learners will require less allocated time, then proceed at the pace set by the individual learner. Record all responses on the score sheet by either circling or crossing through the learner‟s elected response to later assist with a possible diagnostic evaluation.
Example of an item from the Visual Sequential Memory (VSM) subtest of the Visual Perceptual Aspects Test (Clutten, 2009).
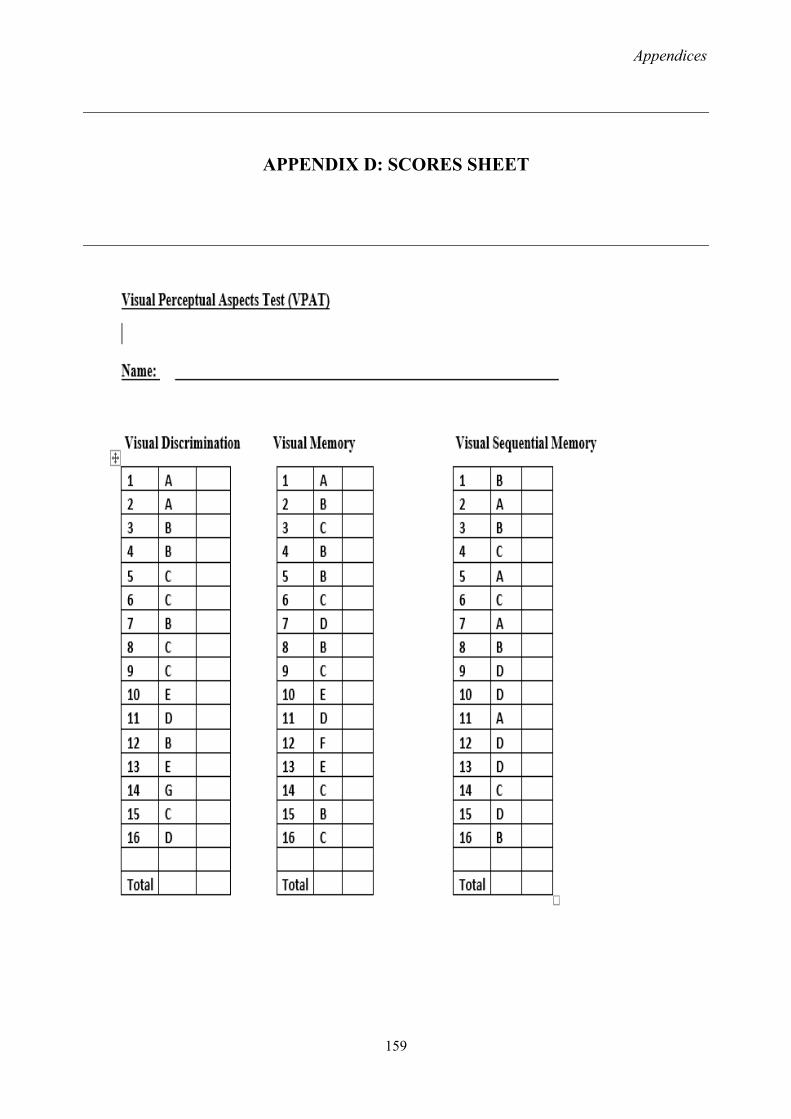
Appendices
159
APPENDIX D: SCORES SHEET

Appendices
160
APPENDIX E: CODE BOOK
GENDER: 0=BOY 1=GIRL
COUNTRY: 0=KENYA 1=SOUTH AFRICA (SA)
ENTRIES: 0=WRONG 1=CORRECT
ASPECTS: 0=VD 1=VM 2=VSM
GRADE R: 0=KENYA 1= SOUTH AFRICA
RW: EXPERIMENTAL (SOUTH AFRICA)
RL: CONTROL CLASS (SOUTH AFRICA)

Appendices
161
APPENDIX F: CODED SOUTH AFRICA RESULTS PRE-POST-TESTS
Experimental: Pre-test rw
VD VM VSM VDM VM VSMNAME AGE GRADE SEX COUNTRY S/A 1 2 3 4 5 6 7 8 9 10 11 12 13 14 15 16 1 2 3 4 5 6 7 8 9 10 11 12 13 14 15 16 1 2 3 4 5 6 7 8 9 10 11 12 13 14 15 16
1 6 1 1 1 5 10 8 1 1 1 1 0 1 0 0 0 1 1 1 1 1 1 1 1 1 0 1 0 0 0 1 1 0 1 0 1 0 1 0 1 0 1 0 1 0 02 6 1 1 1 7 10 10 1 1 1 1 0 1 0 1 1 0 0 0 1 1 1 1 1 1 1 1 1 0 1 0 0 0 1 1 0 1 1 1 0 1 1 1 0 1 0 1 0 03 6 1 1 1 9 16 11 1 1 1 1 1 1 1 0 1 1 0 0 0 1 1 1 1 1 1 1 1 1 1 1 1 1 1 1 1 1 1 1 1 0 0 1 1 0 1 0 1 1 1 1 04 6 1 0 1 7 12 9 1 1 1 1 0 1 1 1 0 0 0 0 1 1 1 1 1 1 1 1 1 0 1 0 1 1 0 0 1 1 1 0 1 0 1 1 0 1 0 0 05 6 1 1 1 13 14 13 1 1 1 1 1 1 1 1 1 1 1 0 1 0 0 1 1 1 1 1 1 1 1 1 1 0 1 0 1 1 1 1 1 1 1 1 1 1 1 0 1 1 1 1 0 1 1 06 6 1 0 1 6 5 6 1 1 1 1 0 1 1 0 0 0 1 1 1 1 1 0 0 0 1 1 0 1 1 1 0 1 0 0 07 6 1 0 1 14 15 6 1 1 1 1 1 1 1 1 1 1 1 1 1 0 0 1 1 1 1 1 1 1 1 1 1 1 1 1 0 1 1 1 1 1 1 1 1 1 0 0 08 6 1 0 1 8 15 10 1 1 1 1 1 1 1 1 0 0 0 1 1 1 1 1 1 1 1 1 0 1 1 1 1 1 1 1 1 1 1 1 1 1 1 0 1 1 0 0 09 5 1 1 1 9 9 5 1 1 1 1 1 0 0 1 0 1 0 1 0 1 0 0 1 0 1 1 1 1 1 1 1 0 1 0 0 0 1 1 0 0 1 1 1 0 0 0
10 6 1 0 1 10 15 14 1 1 1 1 1 1 1 1 0 1 0 0 1 0 0 0 1 1 1 1 1 0 1 1 1 1 1 1 1 1 1 1 1 1 1 1 1 1 1 1 1 1 0 1 0 1 1 111 6 1 0 1 7 4 2 1 1 1 1 1 1 0 1 0 0 0 0 1 1 1 0 1 0 0 0 1 1 0 0 012 6 1 1 1 10 11 12 1 1 1 1 1 1 1 1 1 1 0 0 0 1 1 1 1 1 1 1 1 1 0 1 0 0 1 0 0 1 1 1 1 1 1 1 1 0 0 1 1 0 0 1 113 6 1 0 1 9 11 11 1 1 1 1 1 1 1 1 1 0 0 0 1 1 1 1 1 1 0 1 1 1 1 0 1 0 0 0 1 1 1 1 1 1 1 1 1 0 1 1 0 0 1 014 5 1 1 1 7 12 9 1 1 0 0 1 1 0 1 1 1 0 0 0 1 1 1 1 1 1 1 1 1 0 1 0 1 0 0 1 0 1 1 1 1 1 1 1 0 1 1 0 0 015 6 1 0 1 6 14 9 1 1 1 1 1 1 0 0 0 1 1 1 1 1 1 1 1 1 0 1 0 1 1 1 1 1 1 1 1 1 1 1 1 1 0 0 016 5 1 0 1 10 12 9 1 1 1 1 1 1 0 1 1 1 0 1 0 0 0 1 1 1 1 1 1 1 1 1 0 1 0 1 1 0 0 0 1 1 1 1 1 1 1 0 1 1 0 0 017 6 1 1 1 7 9 3 1 1 0 1 1 1 0 1 0 1 0 0 0 1 0 1 1 1 0 1 1 1 0 1 0 0 1 0 0 1 1 0 1 0 0 0 018 6 1 1 1 9 10 1 1 1 1 1 1 1 1 1 1 0 0 0 1 1 1 1 1 1 1 1 1 0 1 0 0 1 0 0 0
153 204 148
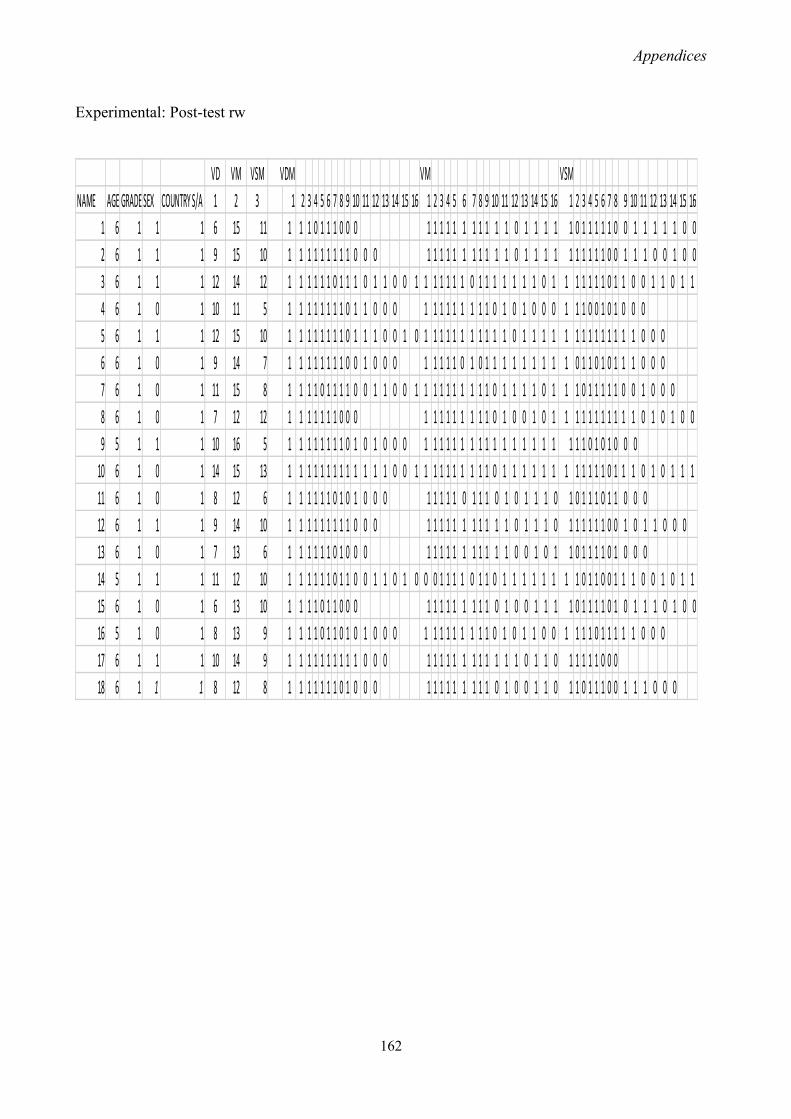
Appendices
162
Experimental: Post-test rw
VD VM VSM VDM VM VSMNAME AGE GRADE SEX COUNTRY S/A 1 2 3 1 2 3 4 5 6 7 8 9 10 11 12 13 14 15 16 1 2 3 4 5 6 7 8 9 10 11 12 13 14 15 16 1 2 3 4 5 6 7 8 9 10 11 12 13 14 15 16
1 6 1 1 1 6 15 11 1 1 1 0 1 1 1 0 0 0 1 1 1 1 1 1 1 1 1 1 1 0 1 1 1 1 1 0 1 1 1 1 1 0 0 1 1 1 1 1 0 02 6 1 1 1 9 15 10 1 1 1 1 1 1 1 1 1 0 0 0 1 1 1 1 1 1 1 1 1 1 1 0 1 1 1 1 1 1 1 1 1 1 0 0 1 1 1 0 0 1 0 03 6 1 1 1 12 14 12 1 1 1 1 1 1 0 1 1 1 0 1 1 0 0 1 1 1 1 1 1 1 0 1 1 1 1 1 1 1 0 1 1 1 1 1 1 1 0 1 1 0 0 1 1 0 1 14 6 1 0 1 10 11 5 1 1 1 1 1 1 1 1 0 1 1 0 0 0 1 1 1 1 1 1 1 1 1 0 1 0 1 0 0 0 1 1 1 0 0 1 0 1 0 0 05 6 1 1 1 12 15 10 1 1 1 1 1 1 1 1 0 1 1 1 0 0 1 0 1 1 1 1 1 1 1 1 1 1 1 0 1 1 1 1 1 1 1 1 1 1 1 1 1 1 0 0 06 6 1 0 1 9 14 7 1 1 1 1 1 1 1 1 0 0 1 0 0 0 1 1 1 1 1 0 1 0 1 1 1 1 1 1 1 1 1 0 1 1 0 1 0 1 1 1 0 0 07 6 1 0 1 11 15 8 1 1 1 1 0 1 1 1 1 0 0 1 1 0 0 1 1 1 1 1 1 1 1 1 1 0 1 1 1 1 0 1 1 1 0 1 1 1 1 1 0 0 1 0 0 08 6 1 0 1 7 12 12 1 1 1 1 1 1 1 0 0 0 1 1 1 1 1 1 1 1 1 0 1 0 0 1 0 1 1 1 1 1 1 1 1 1 1 1 0 1 0 1 0 09 5 1 1 1 10 16 5 1 1 1 1 1 1 1 1 0 1 0 1 0 0 0 1 1 1 1 1 1 1 1 1 1 1 1 1 1 1 1 1 1 1 0 1 0 1 0 0 0
10 6 1 0 1 14 15 13 1 1 1 1 1 1 1 1 1 1 1 1 1 0 0 1 1 1 1 1 1 1 1 1 1 0 1 1 1 1 1 1 1 1 1 1 1 1 0 1 1 1 0 1 0 1 1 111 6 1 0 1 8 12 6 1 1 1 1 1 1 0 1 0 1 0 0 0 1 1 1 1 1 0 1 1 1 0 1 0 1 1 1 0 1 0 1 1 1 0 1 1 0 0 012 6 1 1 1 9 14 10 1 1 1 1 1 1 1 1 1 0 0 0 1 1 1 1 1 1 1 1 1 1 1 0 1 1 1 0 1 1 1 1 1 1 0 0 1 0 1 1 0 0 013 6 1 0 1 7 13 6 1 1 1 1 1 1 0 1 0 0 0 1 1 1 1 1 1 1 1 1 1 1 0 0 1 0 1 1 0 1 1 1 1 0 1 0 0 014 5 1 1 1 11 12 10 1 1 1 1 1 1 0 1 1 0 0 1 1 0 1 0 0 0 1 1 1 1 0 1 1 0 1 1 1 1 1 1 1 1 0 1 1 0 0 1 1 1 0 0 1 0 1 115 6 1 0 1 6 13 10 1 1 1 1 0 1 1 0 0 0 1 1 1 1 1 1 1 1 1 0 1 0 0 1 1 1 1 0 1 1 1 1 0 1 0 1 1 1 0 1 0 016 5 1 0 1 8 13 9 1 1 1 1 0 1 1 0 1 0 1 0 0 0 1 1 1 1 1 1 1 1 1 0 1 0 1 1 0 0 1 1 1 1 0 1 1 1 1 1 0 0 017 6 1 1 1 10 14 9 1 1 1 1 1 1 1 1 1 1 0 0 0 1 1 1 1 1 1 1 1 1 1 1 1 0 1 1 0 1 1 1 1 1 0 0 018 6 1 1 1 8 12 8 1 1 1 1 1 1 1 0 1 0 0 0 1 1 1 1 1 1 1 1 1 0 1 0 0 1 1 0 1 1 0 1 1 1 0 0 1 1 1 0 0 0

Appendices
163
Control: Pre-test rl
VD VM VSM VD VM VSMNAME AGE GRADESEX COUNTRY S/A 1 2 3 4 5 6 7 8 9 10 11 12 13 14 15 16 1 2 3 4 5 6 7 8 9 10 11 12 13 14 15 16 1 2 3 4 5 6 7 8 9 10 11 12 13 14 15 16
1 6 1 1 1 8 6 1 1 1 1 1 0 1 0 1 1 1 0 0 0 1 1 1 1 1 0 1 0 0 0 0 1 0 0 02 6 1 1 1 10 11 10 1 1 1 1 1 1 1 1 0 1 0 0 0 1 1 1 1 1 1 1 1 0 1 0 1 1 0 1 0 0 1 1 1 1 1 1 1 1 1 0 1 0 0 03 6 1 0 1 13 9 5 1 1 1 1 1 1 1 1 1 1 0 0 1 1 0 1 1 1 1 1 1 0 1 1 1 0 1 0 1 1 0 0 1 1 1 0 0 04 6 1 0 1 7 12 9 1 1 1 1 1 1 1 0 0 0 1 1 1 1 1 1 1 1 1 0 1 0 0 1 1 0 1 0 1 1 1 0 0 1 1 1 0 1 0 1 0 05 6 1 1 1 9 12 4 1 1 1 1 1 1 0 1 1 0 1 0 0 0 1 1 1 1 1 1 1 0 1 1 1 1 1 0 0 0 1 0 1 1 1 0 0 06 6 1 1 1 10 7 7 1 1 1 1 1 1 0 1 1 1 0 1 0 0 0 1 0 1 1 1 1 0 1 1 0 0 0 1 1 1 1 0 1 0 1 1 0 0 07 6 1 0 1 12 15 6 1 1 1 1 1 1 1 1 1 1 0 1 1 0 0 0 1 1 1 1 1 1 1 1 1 1 1 0 1 1 1 1 1 1 1 1 1 1 0 0 0 08 6 1 0 1 14 15 10 1 1 1 1 1 1 1 1 1 1 1 1 0 1 1 1 1 1 1 1 1 1 1 1 1 0 1 1 1 1 1 1 1 1 1 1 0 1 0 1 0 1 0 0 1 1 1 09 6 1 1 1 8 12 8 1 1 1 1 1 1 0 1 0 1 0 0 0 1 1 1 1 1 1 1 1 1 0 1 1 1 0 0 0 1 1 1 1 1 1 0 1 0 1 0 0 0
10 6 1 0 1 6 10 7 1 1 1 1 0 1 0 1 0 0 0 1 1 1 1 1 1 1 0 1 0 1 0 1 0 0 0 1 1 1 1 1 1 1 0 0 011 6 1 1 1 5 12 10 1 1 1 1 0 1 0 0 0 1 1 1 1 1 0 1 1 1 1 1 1 1 0 0 0 1 1 1 1 0 1 1 0 1 1 1 1 0 0 012 6 1 1 1 10 10 2 1 1 1 1 1 1 0 1 0 0 1 0 1 0 1 0 1 0 1 1 1 0 1 1 1 0 1 0 1 1 0 0 1 1 0 0 013 6 1 0 1 7 16 5 1 1 1 1 1 1 0 1 0 0 0 1 1 1 1 1 1 1 1 1 1 1 1 1 1 1 1 1 1 1 0 1 0 1 0 0 014 6 1 0 1 9 9 4 1 1 1 1 1 1 0 0 1 0 1 0 1 0 0 0 1 1 1 1 1 0 1 1 1 0 1 0 0 1 1 0 0 1 0 1 0 0 015 6 1 1 1 7 11 3 1 1 1 1 1 1 0 1 0 0 0 1 0 1 1 1 0 1 1 1 0 1 1 0 1 0 1 1 1 0 0 0 1 0 0 016 6 1 1 1 7 11 2 1 1 1 1 1 1 0 1 0 0 0 1 1 1 1 1 0 1 1 1 1 0 0 1 1 0 0 0 1 1 0 0 017 6 1 0 1 8 13 2 1 1 1 1 1 1 0 1 0 1 0 0 0 1 1 1 1 1 1 1 0 1 1 1 1 1 1 0 0 1 0 0 1 0 0 018 7 1 0 1 7 13 4 1 1 1 1 1 1 0 1 0 0 0 1 1 1 1 1 1 1 1 1 0 1 0 1 1 0 1 0 1 1 0 1 0 1 0 0 019 6 1 1 1 8 9 8 1 0 1 1 0 1 0 1 0 0 1 0 1 1 0 0 1 1 1 1 1 1 1 0 1 0 1 0 0 0 1 0 0 1 0 1 0 1 1 0 0 1 1 0 1 020 7 1 1 1 8 10 4 1 1 1 1 1 1 0 1 1 0 0 0 1 1 1 1 1 0 0 1 1 0 1 0 0 1 1 0 1 1 0 0 1 0 1 0 0 0
173 223 111
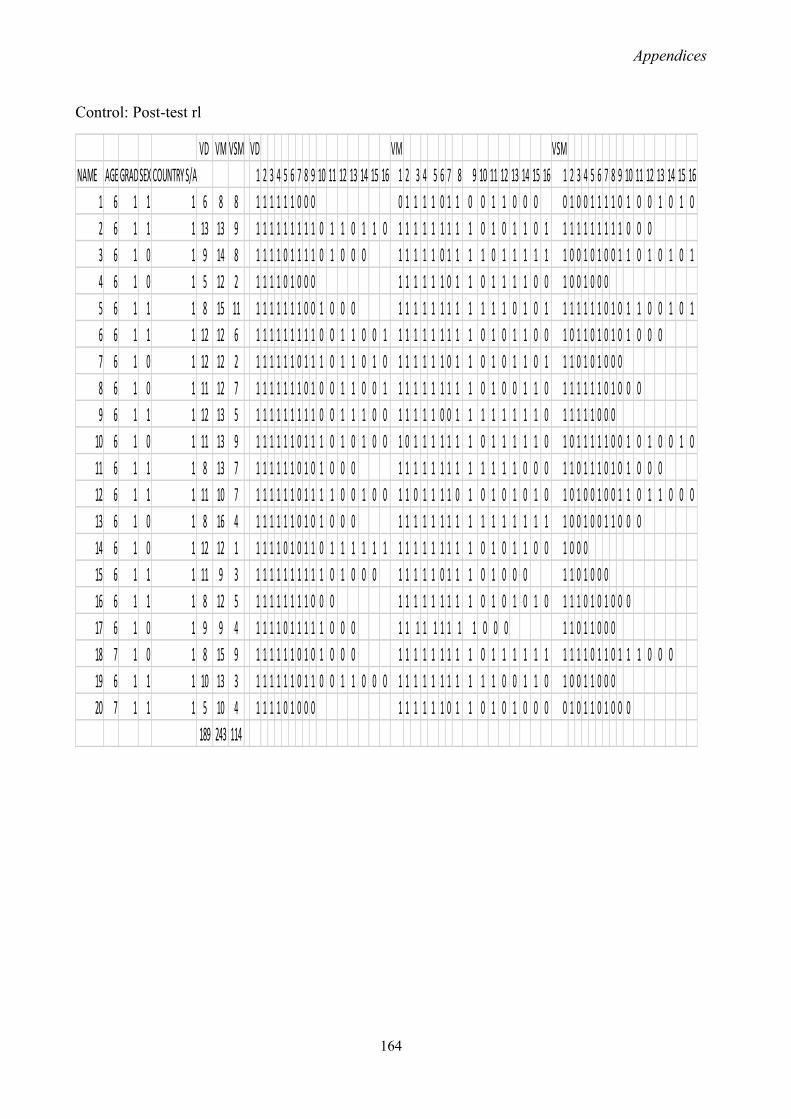
Appendices
164
Control: Post-test rl
VD VM VSM VD VM VSMNAME AGE GRADESEX COUNTRY S/A 1 2 3 4 5 6 7 8 9 10 11 12 13 14 15 16 1 2 3 4 5 6 7 8 9 10 11 12 13 14 15 16 1 2 3 4 5 6 7 8 9 10 11 12 13 14 15 16
1 6 1 1 1 6 8 8 1 1 1 1 1 1 0 0 0 0 1 1 1 1 0 1 1 0 0 1 1 0 0 0 0 1 0 0 1 1 1 1 0 1 0 0 1 0 1 02 6 1 1 1 13 13 9 1 1 1 1 1 1 1 1 1 0 1 1 0 1 1 0 1 1 1 1 1 1 1 1 1 0 1 0 1 1 0 1 1 1 1 1 1 1 1 1 1 0 0 03 6 1 0 1 9 14 8 1 1 1 1 0 1 1 1 1 0 1 0 0 0 1 1 1 1 1 0 1 1 1 1 0 1 1 1 1 1 1 0 0 1 0 1 0 0 1 1 0 1 0 1 0 14 6 1 0 1 5 12 2 1 1 1 1 0 1 0 0 0 1 1 1 1 1 1 0 1 1 0 1 1 1 1 0 0 1 0 0 1 0 0 05 6 1 1 1 8 15 11 1 1 1 1 1 1 1 0 0 1 0 0 0 1 1 1 1 1 1 1 1 1 1 1 1 0 1 0 1 1 1 1 1 1 1 0 1 0 1 1 0 0 1 0 16 6 1 1 1 12 12 6 1 1 1 1 1 1 1 1 1 0 0 1 1 0 0 1 1 1 1 1 1 1 1 1 1 0 1 0 1 1 0 0 1 0 1 1 0 1 0 1 0 1 0 0 07 6 1 0 1 12 12 2 1 1 1 1 1 1 0 1 1 1 0 1 1 0 1 0 1 1 1 1 1 1 0 1 1 0 1 0 1 1 0 1 1 1 0 1 0 1 0 0 08 6 1 0 1 11 12 7 1 1 1 1 1 1 1 0 1 0 0 1 1 0 0 1 1 1 1 1 1 1 1 1 1 0 1 0 0 1 1 0 1 1 1 1 1 1 0 1 0 0 09 6 1 1 1 12 13 5 1 1 1 1 1 1 1 1 1 0 0 1 1 1 0 0 1 1 1 1 1 0 0 1 1 1 1 1 1 1 1 0 1 1 1 1 1 0 0 0
10 6 1 0 1 11 13 9 1 1 1 1 1 1 0 1 1 1 0 1 0 1 0 0 1 0 1 1 1 1 1 1 1 0 1 1 1 1 1 0 1 0 1 1 1 1 1 0 0 1 0 1 0 0 1 011 6 1 1 1 8 13 7 1 1 1 1 1 1 0 1 0 1 0 0 0 1 1 1 1 1 1 1 1 1 1 1 1 1 0 0 0 1 1 0 1 1 1 0 1 0 1 0 0 012 6 1 1 1 11 10 7 1 1 1 1 1 1 0 1 1 1 1 0 0 1 0 0 1 1 0 1 1 1 1 0 1 0 1 0 1 0 1 0 1 0 1 0 0 1 0 0 1 1 0 1 1 0 0 013 6 1 0 1 8 16 4 1 1 1 1 1 1 0 1 0 1 0 0 0 1 1 1 1 1 1 1 1 1 1 1 1 1 1 1 1 1 0 0 1 0 0 1 1 0 0 014 6 1 0 1 12 12 1 1 1 1 1 0 1 0 1 1 0 1 1 1 1 1 1 1 1 1 1 1 1 1 1 1 0 1 0 1 1 0 0 1 0 0 015 6 1 1 1 11 9 3 1 1 1 1 1 1 1 1 1 1 0 1 0 0 0 1 1 1 1 1 0 1 1 1 0 1 0 0 0 1 1 0 1 0 0 016 6 1 1 1 8 12 5 1 1 1 1 1 1 1 1 0 0 0 1 1 1 1 1 1 1 1 1 0 1 0 1 0 1 0 1 1 1 0 1 0 1 0 0 017 6 1 0 1 9 9 4 1 1 1 1 0 1 1 1 1 1 0 0 0 1 1 1 1 1 1 1 1 1 0 0 0 1 1 0 1 1 0 0 018 7 1 0 1 8 15 9 1 1 1 1 1 1 0 1 0 1 0 0 0 1 1 1 1 1 1 1 1 1 0 1 1 1 1 1 1 1 1 1 1 0 1 1 0 1 1 1 0 0 019 6 1 1 1 10 13 3 1 1 1 1 1 1 0 1 1 0 0 1 1 0 0 0 1 1 1 1 1 1 1 1 1 1 1 0 0 1 1 0 1 0 0 1 1 0 0 020 7 1 1 1 5 10 4 1 1 1 1 0 1 0 0 0 1 1 1 1 1 1 0 1 1 0 1 0 1 0 0 0 0 1 0 1 1 0 1 0 0 0
189 243 114

Appendices
165
APPENDIX G: CODED KENYAN RESULTS PRE-POST-TESTS
Control: Pre-test Kenya
NAMES VD VM VSM VD VM VSMAGE GRADESEX COUNTRY KE 1 2 3 4 5 6 7 8 9 10 11 12 13 14 15 16 1 2 3 4 5 6 7 8 9 10 11 12 13 14 15 16 1 2 3 4 5 6 7 8 9 10 11 12 13 14 15 16
1 5 0 0 0 2 5 8 1 1 0 0 0 1 0 0 1 1 0 1 1 0 0 0 1 1 1 1 1 1 0 1 0 0 1 0 0 02 5 0 0 0 4 3 3 1 1 1 1 0 0 0 1 1 1 0 0 0 1 1 0 1 0 0 03 5 0 0 0 3 11 1 1 1 1 0 0 0 1 1 1 1 1 0 1 0 1 0 1 0 0 1 1 1 1 0 0 04 6 0 1 0 6 10 7 1 1 1 1 1 0 0 1 0 0 0 1 1 1 1 1 0 1 1 1 0 1 0 0 1 0 0 1 0 0 1 0 1 0 0 1 1 0 0 1 0 15 5 0 0 0 10 7 8 1 1 1 1 0 1 0 1 1 1 1 1 0 0 0 1 1 1 1 1 0 1 0 1 0 0 0 1 1 0 1 1 1 0 0 1 1 0 1 0 0 06 5 0 1 0 10 8 13 1 1 1 1 1 0 1 1 1 0 1 1 0 0 0 1 1 1 1 1 1 0 1 1 0 0 0 1 1 1 1 1 1 1 0 1 1 0 1 1 1 1 07 5 0 0 0 8 7 10 1 1 1 1 1 0 1 1 0 1 0 0 0 1 1 1 1 1 0 1 1 0 0 0 1 1 1 1 1 0 1 1 0 0 1 0 1 0 0 18 5 0 0 0 7 7 7 1 1 1 1 1 1 0 1 0 0 0 1 1 1 1 1 0 1 0 1 0 0 0 1 1 0 0 1 1 1 1 1 0 0 1 0 0 09 5 0 0 0 3 7 6 1 1 1 0 0 0 1 0 1 1 1 1 0 1 1 0 0 0 1 1 1 0 1 0 1 1 0 0 0
10 5 0 1 0 1 9 3 1 0 0 0 1 1 1 1 1 1 0 0 1 0 1 0 0 1 0 0 1 1 0 1 0 0 0 011 5 0 0 0 4 8 6 1 1 1 0 1 0 0 0 1 1 1 1 0 0 1 1 1 0 1 0 0 0 1 1 0 0 1 0 1 1 0 0 1 0 0 012 5 0 0 0 4 8 9 1 1 1 1 0 0 0 1 1 1 1 1 0 0 1 1 0 1 0 0 0 1 1 0 1 0 1 0 1 1 1 0 1 1 0 013 5 0 1 0 8 12 3 1 0 1 1 1 1 1 0 1 1 0 0 0 1 1 1 1 1 1 1 0 1 0 1 0 1 1 0 1 0 1 1 0 0 1 0 0 014 5 0 0 0 7 10 1 1 1 1 1 0 1 1 0 0 0 1 0 1 1 1 0 1 1 1 0 1 0 0 1 0 1 1 0 0 015 5 0 0 0 2 3 2 1 1 0 0 0 0 1 0 1 1 0 0 0 1 0 1 0 0 016 5 0 1 0 8 11 5 1 1 1 1 1 1 0 1 0 1 0 0 0 1 1 1 1 1 1 1 1 1 0 1 0 0 1 0 0 1 0 1 0 1 1 0 1 0 0 017 6 0 0 0 12 8 8 1 1 1 1 1 1 0 0 1 0 1 1 1 1 1 1 1 1 1 1 1 0 1 0 1 0 1 0 0 0 1 0 0 1 1 1 0 1 0 0 1 0 0 1 018 5 0 1 0 6 11 2 1 1 1 1 1 1 0 0 0 1 1 1 1 1 1 1 1 1 1 1 0 0 0 1 1 0 0 019 5 0 1 0 3 10 4 0 0 1 1 0 1 0 0 0 1 1 1 1 1 1 1 1 1 0 1 0 0 0 1 1 1 0 0 1 0 0 020 5 0 1 0 6 12 4 1 1 1 1 0 1 0 0 1 0 0 0 1 1 1 1 1 0 1 1 1 0 1 0 1 0 1 1 1 0 1 1 1 0 0 0
114 167 110

Appendices
166
Control: Post-test Kenya
NAMES AGE GRADESEX COUNTRY KE VD VM VSM VD VM VSM1 2 3 4 5 6 7 8 9 10 11 12 13 14 15 16 1 2 3 4 5 6 7 8 9 10 1 12 13 14 15 16 1 2 3 4 5 6 7 8 9 10 11 12 13 14 15 16
1 5 0 0 0 4 8 2 1 1 1 1 0 0 0 0 1 0 1 1 1 0 0 1 1 1 0 0 1 0 0 02 5 0 0 0 5 8 5 1 1 1 1 0 1 0 0 0 1 1 1 1 1 0 1 1 1 0 0 0 1 1 0 0 1 1 1 0 0 03 5 0 0 0 7 11 3 1 1 0 1 1 1 1 0 1 0 0 0 1 1 1 1 1 1 1 1 1 0 1 0 0 1 0 0 1 0 1 1 0 0 04 5 0 1 0 9 10 2 1 1 1 1 0 1 0 0 0 1 1 1 1 1 0 1 1 1 1 0 1 0 0 0 0 1 0 0 1 0 0 05 6 0 0 0 10 8 11 1 1 1 1 0 1 1 1 0 1 0 1 1 0 0 0 1 1 1 1 1 1 0 1 1 0 0 0 1 1 1 1 1 1 1 0 1 1 1 0 0 1 0 06 5 0 1 0 12 12 9 1 1 1 1 1 1 0 1 1 0 1 1 1 0 0 1 1 1 1 1 1 0 1 1 1 0 1 1 1 1 0 0 1 1 1 1 0 1 1 1 1 1 0 0 07 5 0 0 0 12 13 8 1 1 1 1 1 1 1 0 1 0 0 1 1 1 1 0 1 1 1 1 1 1 1 1 1 0 1 0 1 1 0 1 1 1 1 1 0 1 1 1 1 0 0 08 5 0 0 0 6 14 6 1 1 1 1 0 1 1 0 0 0 1 1 1 1 1 1 0 1 1 1 1 0 1 1 1 1 1 1 0 1 1 1 1 0 0 09 5 0 0 0 9 15 8 1 1 1 1 1 1 0 1 1 0 0 1 0 0 0 1 1 1 1 1 1 1 1 1 1 1 0 1 1 1 1 1 1 0 0 1 1 1 0 0 1 1 1 0 0 0
10 5 0 1 0 5 11 10 1 1 1 1 0 1 0 0 0 1 1 1 1 1 1 1 1 1 0 1 0 1 0 0 0 1 1 1 1 1 0 0 1 0 1 0 0 1 1 1 011 5 0 0 0 9 10 0 1 1 1 1 0 1 1 1 1 0 0 1 1 0 0 0 1 1 1 1 1 1 1 1 1 0 1 0 0 0 0 0 012 5 0 0 0 4 11 2 1 1 1 1 0 0 0 1 1 1 1 1 1 1 0 1 0 1 0 1 1 0 0 0 0 1 1 0 0 013 5 0 1 0 9 8 4 1 1 1 1 0 1 1 1 1 0 0 1 0 0 1 1 1 1 1 0 1 1 1 0 0 0 1 1 0 0 1 1 0 0 014 5 0 0 0 7 9 10 1 1 1 1 1 1 1 0 0 0 1 1 1 1 1 1 1 1 1 0 0 0 1 1 1 1 1 0 1 1 1 0 0 1 1 0 0 015 5 0 0 0 4 10 2 1 1 1 1 0 0 0 1 1 1 1 1 1 0 0 1 0 1 0 0 1 0 1 1 1 0 0 016 5 0 1 0 9 12 3 1 0 1 1 1 1 0 1 0 1 0 0 1 1 0 0 1 1 1 1 1 1 0 0 1 0 1 1 1 1 0 1 1 0 0 1 1 0 0 017 5 0 0 0 8 9 1 1 1 1 1 0 1 1 0 1 0 0 1 0 0 0 1 1 0 1 1 1 0 0 1 0 1 0 1 1 1 0 0 1 0 0 018 6 0 1 0 11 16 7 1 1 1 1 1 1 1 0 1 0 0 1 0 1 0 1 1 1 1 1 1 1 1 1 1 1 1 1 1 1 1 1 1 0 1 1 1 1 1 1 0 0 019 5 0 1 0 6 10 5 1 1 1 1 0 1 0 1 0 0 0 1 1 1 1 1 1 1 1 1 1 0 0 0 1 1 1 1 1 0 0 020 5 0 1 0 4 11 1 1 1 1 1 0 0 0 1 1 1 1 1 1 1 0 1 0 1 0 1 1 0 0 1 0 0 0
146 208 97

Appendices
167
Experimental: Pre-test Kenya
NAMES AGE GRADESEX COUNTRY KE VD VM VSM VD VM VSM1 2 3 4 5 6 7 8 9 10 11 12 13 14 15 16 1 2 3 4 5 6 7 8 9 10 11 12 13 14 15 16 1 2 3 4 5 6 7 8 9 10 11 12 13 14 15 16
1 5 0 0 0 3 7 4 1 0 1 1 0 0 0 1 1 1 1 1 0 1 1 0 0 0 1 1 1 0 1 0 0 02 5 0 0 0 4 8 2 1 1 1 0 1 0 0 0 1 0 1 1 1 1 1 0 1 0 1 0 0 0 1 0 1 0 0 03 5 0 0 0 7 6 2 1 1 1 1 1 1 1 0 0 0 1 1 1 1 1 1 0 0 0 1 1 0 0 04 6 0 0 0 7 10 6 1 1 1 1 1 0 0 1 0 1 0 0 0 1 1 1 1 1 0 1 1 1 1 1 0 0 0 0 1 0 1 0 1 0 1 1 0 0 1 0 0 05 5 0 0 0 5 10 7 1 1 1 1 1 0 0 0 1 1 1 1 1 0 1 0 1 1 1 0 1 0 0 0 1 0 1 1 0 1 0 1 0 1 0 1 0 0 06 5 0 0 0 2 9 3 1 1 0 0 0 1 0 1 1 1 1 0 1 1 1 1 0 0 0 1 1 1 0 0 07 5 0 0 0 12 8 8 1 1 1 1 1 1 0 0 1 0 1 1 1 1 1 1 1 1 1 1 1 0 1 0 1 0 1 0 0 0 1 0 0 1 1 1 0 1 0 0 1 0 0 1 08 5 0 0 0 2 9 0 0 1 0 1 0 0 0 1 0 1 1 1 0 1 0 1 1 0 1 1 0 0 0 0 0 0 0 0 09 5 0 1 0 5 8 9 1 1 1 1 1 0 0 0 1 1 1 1 1 1 1 0 1 0 0 0 1 0 1 1 0 0 1 1 1 0 1 0 1 1 0
10 5 0 1 0 8 10 14 1 1 1 1 0 1 0 1 1 1 0 0 0 1 1 1 1 1 1 0 1 1 0 1 0 0 1 0 0 1 0 0 1 0 1 0 1 0 0 011 5 0 0 0 6 11 7 1 1 1 1 0 1 1 0 0 0 1 0 1 1 1 0 1 1 1 0 1 0 0 1 1 0 0 1 0 1 0 1 1 1 0 1 1 0 0 012 5 0 1 0 4 1 3 1 1 1 0 1 0 0 0 1 0 0 0 1 1 1 0 0 013 5 0 1 0 2 5 2 1 1 0 0 0 1 0 1 1 1 1 0 0 0 1 0 0 1 0 0 014 5 0 1 0 10 4 6 1 1 1 1 1 1 0 1 0 1 1 0 0 1 0 0 1 0 1 1 1 0 0 0 1 1 0 1 1 0 1 1 0 0 015 6 0 1 0 4 2 3 1 1 1 1 0 0 0 0 1 0 1 0 0 0 0 1 1 1 0 0 016 5 0 1 0 9 6 3 1 1 1 1 1 0 0 1 1 0 1 0 0 0 0 0 1 1 0 1 0 1 0 0 1 0 1 0 0 0 1 1 1 0 0 017 5 0 1 0 7 7 3 1 0 1 1 1 1 0 1 0 1 0 0 0 1 1 1 1 1 1 0 0 1 0 0 0 1 1 1 0 0 018 5 0 1 0 10 10 7 1 1 1 1 1 0 1 0 1 0 0 1 1 1 0 0 1 1 1 1 1 1 0 1 1 0 1 0 0 1 0 0 1 1 0 1 0 1 0 1 0 1 0 1 0 0 019 5 0 1 0 4 8 4 1 1 0 1 1 0 0 0 1 1 0 0 1 0 0 1 1 0 1 0 0 1 0 1 1 1 1 0 0 1 0 0 0
111 139 93
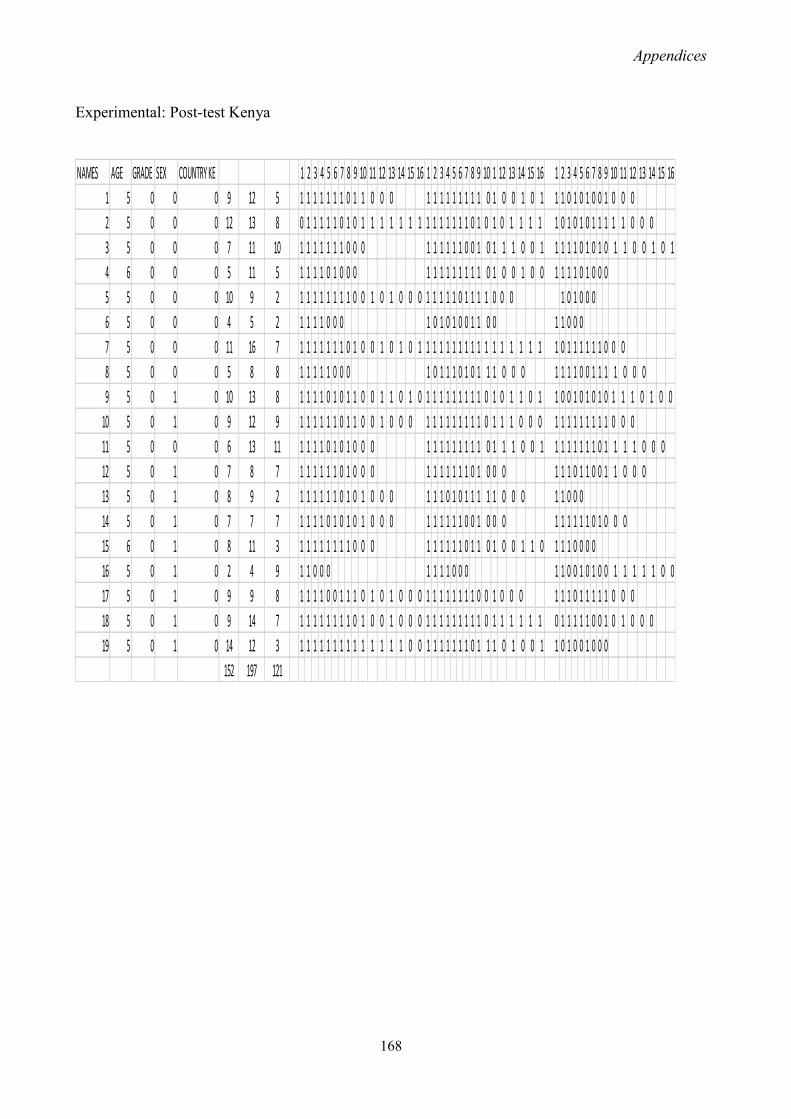
Appendices
168
Experimental: Post-test Kenya
NAMES AGE GRADE SEX COUNTRY KE 1 2 3 4 5 6 7 8 9 10 11 12 13 14 15 16 1 2 3 4 5 6 7 8 9 10 1 12 13 14 15 16 1 2 3 4 5 6 7 8 9 10 11 12 13 14 15 161 5 0 0 0 9 12 5 1 1 1 1 1 1 1 0 1 1 0 0 0 1 1 1 1 1 1 1 1 1 0 1 0 0 1 0 1 1 1 0 1 0 1 0 0 1 0 0 02 5 0 0 0 12 13 8 0 1 1 1 1 1 0 1 0 1 1 1 1 1 1 1 1 1 1 1 1 1 1 0 1 0 1 0 1 1 1 1 1 0 1 0 1 0 1 1 1 1 1 0 0 03 5 0 0 0 7 11 10 1 1 1 1 1 1 1 0 0 0 1 1 1 1 1 1 0 0 1 0 1 1 1 0 0 1 1 1 1 1 0 1 0 1 0 1 1 0 0 1 0 14 6 0 0 0 5 11 5 1 1 1 1 0 1 0 0 0 1 1 1 1 1 1 1 1 1 0 1 0 0 1 0 0 1 1 1 1 0 1 0 0 05 5 0 0 0 10 9 2 1 1 1 1 1 1 1 1 0 0 1 0 1 0 0 0 1 1 1 1 1 0 1 1 1 1 0 0 0 1 0 1 0 0 06 5 0 0 0 4 5 2 1 1 1 1 0 0 0 1 0 1 0 1 0 0 1 1 0 0 1 1 0 0 07 5 0 0 0 11 16 7 1 1 1 1 1 1 1 0 1 0 0 1 0 1 0 1 1 1 1 1 1 1 1 1 1 1 1 1 1 1 1 1 1 0 1 1 1 1 1 1 0 0 08 5 0 0 0 5 8 8 1 1 1 1 1 0 0 0 1 0 1 1 1 0 1 0 1 1 1 0 0 0 1 1 1 1 0 0 1 1 1 1 0 0 09 5 0 1 0 10 13 8 1 1 1 1 0 1 0 1 1 0 0 1 1 0 1 0 1 1 1 1 1 1 1 1 1 0 1 0 1 1 0 1 1 0 0 1 0 1 0 1 0 1 1 1 0 1 0 0
10 5 0 1 0 9 12 9 1 1 1 1 1 1 0 1 1 0 0 1 0 0 0 1 1 1 1 1 1 1 1 1 0 1 1 1 0 0 0 1 1 1 1 1 1 1 1 1 0 0 011 5 0 0 0 6 13 11 1 1 1 1 0 1 0 1 0 0 0 1 1 1 1 1 1 1 1 1 0 1 1 1 0 0 1 1 1 1 1 1 1 1 0 1 1 1 1 0 0 012 5 0 1 0 7 8 7 1 1 1 1 1 1 0 1 0 0 0 1 1 1 1 1 1 1 0 1 0 0 0 1 1 1 0 1 1 0 0 1 1 0 0 013 5 0 1 0 8 9 2 1 1 1 1 1 1 0 1 0 1 0 0 0 1 1 1 0 1 0 1 1 1 1 1 0 0 0 1 1 0 0 014 5 0 1 0 7 7 7 1 1 1 1 0 1 0 1 0 1 0 0 0 1 1 1 1 1 1 0 0 1 0 0 0 1 1 1 1 1 1 0 1 0 0 015 6 0 1 0 8 11 3 1 1 1 1 1 1 1 1 0 0 0 1 1 1 1 1 1 0 1 1 0 1 0 0 1 1 0 1 1 1 0 0 0 016 5 0 1 0 2 4 9 1 1 0 0 0 1 1 1 1 0 0 0 1 1 0 0 1 0 1 0 0 1 1 1 1 1 0 017 5 0 1 0 9 9 8 1 1 1 1 0 0 1 1 1 0 1 0 1 0 0 0 1 1 1 1 1 1 1 1 0 0 1 0 0 0 1 1 1 0 1 1 1 1 1 0 0 018 5 0 1 0 9 14 7 1 1 1 1 1 1 1 1 0 1 0 0 1 0 0 0 1 1 1 1 1 1 1 1 1 0 1 1 1 1 1 1 0 1 1 1 1 1 0 0 1 0 1 0 0 019 5 0 1 0 14 12 3 1 1 1 1 1 1 1 1 1 1 1 1 1 1 0 0 1 1 1 1 1 1 1 0 1 1 1 0 1 0 0 1 1 0 1 0 0 1 0 0 0
152 197 121

Appendices
169
APPENDIX H: CONSENT FORM FOR THE TEACHERS
CONSENT TO PARTICIPATE IN THE RESEARCH STUDY
Title of the Project; The Effects of using Six-Brick Duplo Block Guided Play Approach on Pre-
School Learners‟ Visual Perceptual Abilities.
Investigator; Sarah Jemutai.
Supervisors; Prof. Paul Webb Nelson Mandela Metropolitan University NMMU
Prof. David Serem Moi University.
Invitation to Participate in the Research Study
I invite you to participate in my research study about the Effect of using a Six-Brick Duplo Block
Guided Play Approach on Pre-School Learners‟ Visual Perceptual Abilities. This study emerged
from the East and South African –German Centre of Excellence for Educational Research
Methodologies and Management (CERM-ESA)
Description of Your Involvement
During the interview I will ask you to tell me about your involvement and experiences during the
four- month intervention period of play using the six-bricks with the young learners.
Benefits of Participation
As you participate in this interview it will give me a better understanding of how young learners
can develop visual perception which will enable me gain rich data generated from the interview

Appendices
170
and compare with the pre-post-tests done by the learners as part of the intervention. We hope that
you as the interviewee will also benefit through your own reflection of the whole process and how
the learners participated and responded to the play sessions if they were of benefit or not.
Confidentiality
The results obtained are of the benefit of this study only. We will not include any information that
will identify you. Your privacy will be upheld and your research records will be confidential.
Storage and Future use of Data
The data shall be stored for future research studies. Your name and any other identifying
information will be secured and stored separately from your research data at the faculty of
education at NMMU. Only Sarah Jemutai will have access to your research files and data.
Research data may be shared with other investigators but will not contain any information
identifying you.
Voluntary Nature of the Study
It is through your willingness that I will get feedback from you. If a question is difficult and you
are not able to answer, then you are free to say you are not able to answer it then we can move to
the next question.
Contact Information for The Study
If you have a question concerning this research you may contact Sarah Jemutai at
[email protected]) or Prof Paul Webb at [email protected]) or Prof. David
Serem at [email protected].
Consent
By signing this document, you are agreeing to be in the study.

Appendices
171
I agree to participate in the research and that the audio/video interview will be recorded.
TRUE……………
FALSE………......
Name
Signature.

Appendices
172
APPENDIX I: PARENT CONSENT FORM SOUTH AFRICA
PO Box 77000 • Nelson Mandela Metropolitan University
• Port Elizabeth • 6031 • South Africa • www.nmmu.ac.za
Faculty of Education
NMMU
Tel: +27 (0)41 504-4310 Fax: +27 (0)41-504-1610
2 June 2016
Dear Parent/Guardian
I am currently a Master student at the Nelson Mandela Metropolitan University (NMMU) under
the supervision of Professor Paul Webb. The focus of my research is to gain a better
understanding of the effect of using Six-Brick Duplo Block guided play activities on pre-school
learners visual perception abilities. Guided play and visual perception play a crucial role in the
development of early written and numeric tasks in learners.
During this research project, your child‟s teacher will use 6 Duplo Blocks to conduct 5 -10
minutes of guided play intervention activities. These activities will be conducted three to four
times a week over a period of four months. This is therefore a friendly request to you, as the parent
or guardian, to allow your child to participate in this research project. Consent to conduct my
research has been granted by your child‟s principal and teacher as well as the Provincial
Department of Education.

Appendices
173
By granting your child permission, your child will be asked to do an observation test on three
aspects of visual perception i.e. visual discrimination, visual memory and visual sequential
memory prior to and after the intervention. The assessment will take place during school hours in
the presence of the pre-school teacher, and should not exceed an hour.
The teacher will not know any individual child‟s assessment score nor will I know which score
applies to any particular child as each child will be assigned a number. The aim of the assessment
is solely to determine possible changes in the average scores of the class. Assurance is given that
throughout this study the data collected will remain anonymous and confidential and will be used
solely for my research project with the aim of facilitating the development of young learners‟
visual perception abilities through play in the future.
If you consent to your child participating in this research project, please complete the attached
reply slip and return it to your child‟s teacher. Should you have any queries, please do not hesitate
to contact me at the number below.
Yours Faithfully
Sarah Jemutai, (Researcher)
Faculty of Education (NMMU) 0780115529

Appendices
174
CONSENT OF PARENT/GUARDIAN
I, ________________________________________________________________________,
parent/guardian
of_______________________________________________________________________
(child‟s name) in
grade R_______, hereby give consent for my child to participate in the above-mentioned research
project.
Please tick the dominant language spoken at home:
Home language English Afrikaans isiXhosa Other (Please specify):
Parent/Guardian Signature: ________________________________ Date:

Appendices
175
APPENDIX J: PARENT CONSENT FORMS KENYA
PO Box 77000 • Nelson Mandela Metropolitan University
• Port Elizabeth • 6031 • South Africa • www.nmmu.ac.za
Faculty of Education
NMMU
Tel: +27 (0)41 504-4310 Fax: +27 (0)41-504-1610
2 June 2016
Dear Parent/Guardian
I am currently a Master student at the Nelson Mandela Metropolitan University (NMMU) under
the supervision of Professor Paul Webb of NMMU and Professor David Serem of Moi University.
The focus of my research is to gain a better understanding of the effect of using Six-Brick Duplo
Block guided play activities on pre-school learners visual perception abilities. Guided play and
visual perception play a crucial role in the development of early written and numeric tasks in
learners.
During this research project, your child‟s teacher will use 6 Duplo Blocks to conduct 5 -10
minutes of guided play intervention activities. These activities will be conducted three to four
times a week over a period of four months. This is therefore a friendly request to you, as the parent
or guardian, to allow your child to participate in this research project. Consent to conduct my

Appendices
176
research has been granted by your child‟s principal and teacher as well as the Provincial
Department of Education.
By granting your child permission, your child will be asked to do an observation test on three
aspects of visual perception i.e. visual discrimination, visual memory and visual sequential
memory prior to and after the intervention. The assessment will take place during school hours in
the presence of the pre-school teacher, and should not exceed an hour.
The teacher will not know any individual child‟s assessment score nor will I know which score
applies to any particular child as each child will be assigned a number. The aim of the assessment
is solely to determine possible changes in the average scores of the class. Assurance is given that
throughout this study the data collected will remain anonymous and confidential and will be used
solely for my research project with the aim of facilitating the development of young learners‟
visual perception abilities through play in the future.
If you consent to your child participating in this research project, please complete the attached
reply slip and return it to your child‟s teacher. Should you have any queries, please do not hesitate
to contact me at the number below.
Yours Faithfully
Sarah Jemutai, (Researcher)
Faculty of Education (NMMU)
0780115529/0724740512

Appendices
177
CONSENT OF PARENT/GUARDIAN
I, ________________________________________________________________________,
parent/guardian
of______________________________________________________________________
(child‟s name) in
grade R_______ hereby give consent for my child to participate in the above-mentioned research
project.
Please tick the dominant language spoken at home:
Home language Kiswahili Bantu Nilote Other (Please specify):
Parent/Guardian Signature: ________________________________ Date: