Embed Size (px)
Citation preview

Jurnal Ekonomi dan Perbankan Syariah
Vol. 8. No 1, April 2020; 63- 84 ISSN (printed): 2355-1755 | ISSN (online): 2579-6437
DOI: https://doi.org/10.46899/jeps.v8i1.176
THE EFFECT OF THE PERCEPTION OF ELECTRONIC
MONEY ON CONSUMPTIVE BEHAVIOR OF STEI SEBI
STUDENTS
Nailah Fauziah1, Nining Nurhasanah2
1SEBI: Email: [email protected] 2SEBI Lecturer Email; [email protected]
ABSTRACT. In the era of industrial revolution 4.0, technological developments made
changes in the lifestyle of the modern generation. The purpose of this study was to
analyze the perception of the use of electronic money, whether it supports the
consumptive research of STEI SEBI students. The electronic money acceptance model
in this study uses the Technology Acceptance Model (TAM), and the indicators used to
measure the consumptive level of STEI SEBI students are indicators of consumptive
behavior. The research used is descriptive-quantitative. The data used are primary data
sent from questionnaires distributed to STEI SEBI students. The method of analysis in
this study uses a simple regression analysis. The results of this study indicate that
electronic money has a positive and significant influence on the consumptive students
of STEI SEBI, users using high electronic money than making consumptive STEI SEBI
students will also increase.
Keywords: Technology Acceptance Model; Electronic Money; Consumptive Behavior
1. INTRODUCTION
Innovations in electronic payment instruments using cards have
developed into more practical forms. At present, electronic money in Indonesia
is becoming more and more popular (Indonesia, n.d.). The development of
information technology has changed people’s daily lives. In the past, people
had to carry cash, now they only need to have a chip or server with them. It
makes human activities more efficient and practical. The presence of electronic
money unwittingly creates an entirely new market at a much lower price and
more practical use.
Table 1.1 the circulation of Electronic Money
Period Total amount
2013 36,225,373
2014 35,738,233

64 |Nailah Fauziah, Nining Nurhasanah : The Effect of The Perception of Electronic Money on
Consumptive Behavior of STEI SEBI Students
2015 34,314,795
2016 51,204,580
2017 90,003,848
2018 167,205,578
2019 292,299,320
2020
(January)
313,785,298
Source: Bank Indonesia, 2020
The amount of electronic money is the amount of electronic money
in circulation in the community in a certain period. Based on Bank Indonesia
(BI) data, as of January 2020, the amount of electronic money in circulation
was 313,785,298, or it increased to 7.35% compared to 2019.
Diagram 1.1 Volume and Value of Electronic Money Transactions
Source: Bank Indonesia, 2019
In addition to the increased amount of electronic money in circulation,
the amount of electronic money in transactions has also climbed up quite
dramatically. According to the data of Bank Indonesia (BI), the transactions at
the end of 2018 jumped 209.8% to 2.9 billion transactions compared to 2017

Jurnal Ekonomi dan Perbankan Syariah
Vol. 8. No.1, April 2020: 63-84 ISSN (printed): 2355-1755 | ISSN (online): 2579-6437 | 65
which was 943.3 million transactions. Until July 2019, the electronic money
transactions has reached 2.7 billion transactions. The value of electronic
money transactions also increased dramatically to 281.39%. In 2018, it reached
Rp 47.2 trillion. This figure increased by Rp. 34.8 trillion or almost tripled
compared to 2017 which was Rp. 12.4 trillion (Jayani, 2019).
The development of electronic money in Indonesia is supported by
the increasing number of internet and smartphone users in Indonesia. Based on
the results of an Indonesian Poll study in collaboration with the Indonesian
Internet Service Providers Association (APJII), the number of internet users in
Indonesia grew by 10.12% taken from field data during the period March to
April 2019. Of the 264 million inhabitants of Indonesia, there are 171.17
million people or around 64.8% who have been connected to the internet. The
biggest contribution come from Java Island with penetration rates reaching
55% of the total. In addition, from the majority of internet users in Indonesia,
the users are people with an age range of 15 to 19 years (Pratomo, 2019).
Diagram 1.1 Internat Usage Levels of Millenial Generation and X Generation
Source: Alvara Research Center, 2015
The result of the Alvara Research Center survey on internet use in
Indonesia in 2015 shows that millennial generation internet consumption is
much higher than the Gen-Xer, especially in younger millennials (15-24 years)
(Purwandi, 2016, p. 15). The age of STEI SEBI students who are in that age
range is something to pay attention to. Besides the fact that they are in the
range of age, they are also students of STEI SEBI, a school that focuses on
Islamic economics. They should at least understand about good financial
management and the concept of fulfillment needs that are in accordance with
Islamic teachings.
Despite the increase in electronic money and the largest contribution
of internet users coming from Java with penetration rates reaching 55% of the

66 |Nailah Fauziah, Nining Nurhasanah : The Effect of The Perception of Electronic Money on
Consumptive Behavior of STEI SEBI Students
total, the largest population of poor people live in Java (12.72 million people)
(Statistics, 2019, p. 3).
2. LITERATURE REVIEW
Technology Acceptance Model
The technology acceptance model (TAM) was developed by Davis et
al. (1989). The Technology Acceptance Model is an adaptation of Theory
Reasoned Action (TRA) developed by Fishbein and Ajzen (1975). TAM has
the aim to provide a parsimonious explanation of the determinants of adoption
of information technology user behavior towards the acceptance of the use of
information technology itself (Davis et al., 1989). Parsimony is a term used to
express thrifty in preparing assumptions or hypotheses that also means proof
(Priambodo & Prabawani, 2016, p. 3).
Perception of Benefit
Davis et al. (1989: 320) defines the perception of usefulness as a
belief in expediency, which is the degree to which users believe that the use of
technology / system will improve their performance at work. Perceived benefit
is defined as the extent to which a person believes that the use of certain
information systems will improve performance. Davis (1989) in Jogiyanto
(2007: 152) indicators in forming perceptions of benefits are:
1) The ability to work faster
2) Effectiveness
3) the ability to make work easier
4) Usefullness
(Aliyah, 2016, p. 3)
Perception of Ease of Use
Ease of use is defined as the extent to which a person believes that
using a technology will be free from effort (Jogiyanto. 2007: 114). Davis et al.
(1989: 320) defines perceived ease of use as a belief in ease of use, namely the
degree to which users believe that the technology / system can be used easily
and free from problems. Intensity of use and interaction between users and the
system can also show ease of use (Priambodo & Prabawani, 2016, p. 4).
Indicators in establishing ease of use are:
1) Clear and understandable
2) Not require a lot of mental effort in its use
3) Easy to use
Jurnal Ekonomi dan Perbankan Syariah
Vol. 8. No.1, April 2020: 63-84 ISSN (printed): 2355-1755 | ISSN (online): 2579-6437 | 67
4) understand what the user wants (Aliyah, 2016, p. 4)
Electronic Money
Definition of Electronic Money
Electronic money is a payment instrument in electronic form where
the value of the money is stored in certain electronic media. The user must first
deposit the money to the publisher and save it in electronic media before using
it for the purpose of the transaction. When used, the value of electronic money
stored in electronic media will be reduced by the value of the transaction and
afterwards it can be topped up (Indonesian, n.d.).
Based on Bank Indonesia Regulation No. 11 \ 12 \ PBI \ 2009 dated
April 13, 2009 concerning Electronic Money, what is meant by Electronic
Money is a means of payment that meets the following elements:
1) Issued on the basis of the value of money paid in advance by the holder to
the issuer;
2) Value of money stored electronically in a medium such as a server or chip;
3) Used as a means of payment to traders who are not the issuers of the
electronic money; and
4) The value of electronic money deposited by holders and managed by the
issuer is not a deposit as referred to in the law governing banking (Indonesia,
n.d.)
Development of Electronic Money
The development of electronic money has not only changed people's
lifestyles socially but also influenced their economic behavior. This is
reinforced by the results of a survey of the Indonesian Internet Service
Providers Association (APJII) in 2017 reaching 143.26 million people
(54.68%) of Indonesia's total population of 262 million. This means that more
than half the people in Indonesia use the internet, where the majority of internet
users as much as 83.2 million people (58.08%) are in Java, then Sumatra as
much as 19.09%, Kalimantan 7.97%, Sulawesi 7.73 %, Bali-Nusa 5.63%, and
Maluku-Papua as much as 2.49% (Silalahi & Pramedia Puspa, 2018, p. 13). In
addition, the composition of internet users in Indonesia is dominated by
productive age, namely 29.2% (ages 35-44), 24.4% (ages 25-34) and 18.4%
(ages 10-24) while the remaining elderly age ( Wulandari, 2017, p. 377).
Electronic money itself is divided into two types, the first is chip-
based electronic money and the second is server-based electronic money. Since
its development and took effect some time ago, as of March 26, 2020 there
have been 45 electronic money providers of these two types circulating in
Indonesia and have been registered at Bank Indonesia, namely:

68 |Nailah Fauziah, Nining Nurhasanah : The Effect of The Perception of Electronic Money on
Consumptive Behavior of STEI SEBI Students
1) PT Artajasa Pembayaran Elektronis (MYNT E-Money)
2) PT Bank Central Asia Tbk (Sakuku dan Flazz)
3) PT Bank CIMB Niaga (Rekening Ponsel)
4) PT Bank DKI (Jakarta One/JakOne dan JakCard)
5) PT Bank Mandiri (Persero) Tbk (Mandiri e-Cash dan Mandiri e-
Money)
6) PT Bank Mega Tbk (Mega Virtual dan Mega Cash)
7) PT Bank Negara Indonesia (Persero) Tbk (Unikqu dan TapCash)
8) PT Bank NationalInobu (Nobu e-Money)
9) PT Bank Permata (BBM Money)
10) PT Bank Rakyat Indonesia (T Bank dan Brizzi)
11) PT Finnet Indonesia (FinnChannel)
12) PT Indosat, Tbk (PayPro/Dompetku)
13) PT Nusa Satu Inti Artha (DokuPay)
14) PT Skye Sab Indonesia (Skye Mobile Money dan SkyeCard)
15) PT Telekomunikasi Indonesia, Tbk (Flexy Cash dan iVas Card)
16) PT Telekomunikasi Seluler (T-Cash dan Tap Izy)
17) PT XL Axiata, Tbk (XL Tunai)
18) PT Smartfren Telecom, Tbk (Uangku)
19) PT Dompet Anak Bangsa (Go-Pay)
20) PT Witami Tunai Mandiri (TrueMoney)
21) PT Espay Debit Indonesia Koe (Dana)
22) PT Bank QNB Indonesia, Tbk (Dooet)
23) PT BPD Sumsel Babel (BSB Cash)
24) PT Buana Media Teknologi (Gudang Voucher)
25) PT Bimasakti Multi Sinergi (Speed Cash)
26) PT Visionet Internasional (OVO Cash)
27) PT Inti Dunia Sukses (iSaku)
28) PT Veritra Sentosa Internasional (Paytren)
29) PT Solusi Pasti Indonesia (KasPro)
30) PT Bluepay Digital Internasional (Bluepay)
31) PT Ezeelink Indonesia (Ezeelink)
32) PT E2Pay Global Utama (M-Bayar)
33) PT Cakra Ultima Sejahtera (DUWIT)
34) PT Airpay Internasional Indonesia (SOPEEPAY)
35) PT Bank Sinarmas (Simas e-Money)
36) PT Transaksi Artha Gemilang (OttoCash)
37) PT Fintek Karya Nusantara (LinkAja)
38) PT Max Interactives Technologies
39) PT Sarana Pactindo
40) PT Datacel Infomedia
41) PT Kereta Commuter Indonesia
42) PT Mass Rapid Transit Jakarta
43) PT Netzme Kreasi Indonesia
44) PT Bank BNI Syariah

Jurnal Ekonomi dan Perbankan Syariah
Vol. 8. No.1, April 2020: 63-84 ISSN (printed): 2355-1755 | ISSN (online): 2579-6437 | 69
45) PT MNC Teknologi Nusantara
(Bank Indonesia, 2020).
The growth of electronic money was also driven by the launching of
the Grand Design effort to increase the use of non-cash payments, or what is
often referred to as Toward a Less Cash Society by Bank Indonesia as the
holder of the Indonesian payment system regulatory authority. Changes in the
payment system to the Less Cash Society are inevitable. Less Cash Society is
defined as a culture or trend that develops in the community in conducting
payment transactions through non-cash payment media.
Legal Basis for Providing Electronic Money
The administration of Electronic Money is regulated in:
1) Bank Indonesia Regulation Number 11/12 / PBI / 2009 dated April 13, 2009
concerning Electronic Money.
The regulatory material contained in this Bank Indonesia Regulation
includes but is not limited to:
• Procedures for licensing and licensing transfers;
• Procedures for implementation;
• Oversight;
• Enhanced technological security; and Penalty. (Bank Indonesia, 2009).
2) Bank Indonesia Circular No.11 / 11 / DASP dated April 13, 2009 concerning
Electronic Money.
This circular is an implementing regulation of Bank Indonesia
Regulation Number 11/12 / PBI / 2009 April 13, 2009 concerning Electronic
Money. (Bank Indonesia, 2009).
Electronic Money Law in Islamic Perspective
Digital money is a neutral feature that depends on the substance and
goods being traded. If the user can fulfill their primary halal interests easily
with this instriment, then the importance of this application is the same as
buying goods without having to provide cash in his/her wallet and without
having to come to the merchant and other hassles. This is based on the principle
of jurisprudence "Facilities that have the same law with the goal". The use of
digital money has been regulated in DSN MUI Fatwa No. 116 / DSN-MUI /
IX / 2017 concerning Islamic Electronic Money and AAOIFI Standards No.
38 of at-Ta'amulat al-Elektroniah (Sahroni, 2019).

70 |Nailah Fauziah, Nining Nurhasanah : The Effect of The Perception of Electronic Money on
Consumptive Behavior of STEI SEBI Students
Sharia law itself is permitted if the funds placed by the user in a digital
wallet are: (1) used by the issuer with discounts given at the initiative of the
issuer (without conditions). (2) not used by digital money issuers. Meanwhile,
if used by the publisher, with the required discount, then it becomes usury. The
purpose of the first point is that users do top-ups based on other factors (such
as ease of transaction and the issuer does not always give a discount for every
use of digital money) not because there is a discount and the issuer certainly
gives a discount for each use of digital money as promised. (Sahroni, 2019).
Consumptive Behavior
Definition of Consumptive Behavior
Consumptive behavior is the act of buying goods with emotional
consideration and buying behavior that is more dominated by desires outside
of needs and only to fulfill desires only (Gumulya & Widiastuti, 2013, p. 52).
Consumptive behavior is also a directional consumption behavior, sometimes
it just follows the prestige and only follows the trend (Philip, 2019, p. 2).
Indicators of Consumptive Behavior
Indicators of consumptive behavior according to Sumartono (2002)
are as follows:
a. Buy the product because of the lure of gifts
Individuals buy an item because of the prize offered if they buy the
item, without thinking about the size of the item's functioning.
b. Buy a product because the packaging is attractive
Consumers are very easily persuaded to buy products that are neatly
wrapped and decorated with attractive colors. This means that the motivation
to buy the product is only because the product is neatly wrapped and attractive.
c. Buy products to maintain self-appearance and prestige
Consumers have a high desire to buy, because in general a person has
characteristics in dressing, dressing up, hairstyle, and so on with the aim that
the person always looks that can attract the attention of others. The person
spends more money to support his appearance.
d. Buy products based on price (not based on benefits or uses)
Consumers tend to behave as indicated by the existence of luxurious
life so they tend to use everything that is considered the most luxurious.
e. Buying a product is just keeping the status symbol
Usually people have a high purchasing ability both in dressing,
dressing, hair style, and so on so that it can support the exclusive nature of
Jurnal Ekonomi dan Perbankan Syariah
Vol. 8. No.1, April 2020: 63-84 ISSN (printed): 2355-1755 | ISSN (online): 2579-6437 | 71
expensive items and give the impression of coming from a higher social class.
Buying a product can give a status symbol to look cooler in the eyes of others.
f. Use the product n. Use the product because of the conformity of the
advertising model
Someone tends to imitate the behavior of the idol in the form of using
everything that can be used by his idol. The person also tends to use and try
the products offered if he idolizes the public figure of the product.
g. The emergence of an consideration that buying products at high prices will
lead to high confidence
Sometimes there are people who are very encouraged to try a product
because they believe what is said by the advertisement that can foster
confidence. Cross and Cross (in Hurlock, 1999) also add that by buying
products that they think can enhance their physical appearance, they will
become more confident.
h. Try more than two similar products (different brands)
Some people will tend to use the same type of product with other
brands than the previous product he uses, even though the product has not been
used.
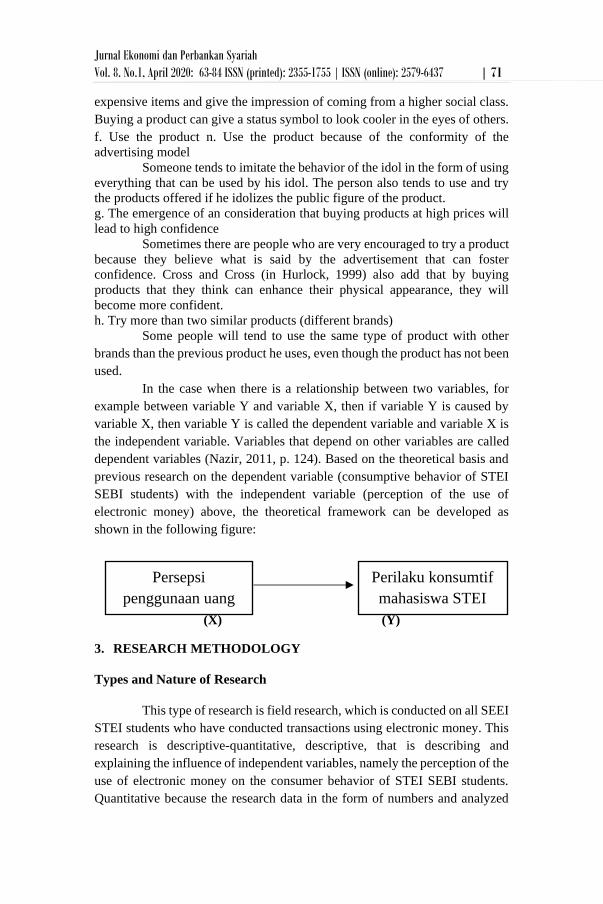
In the case when there is a relationship between two variables, for
example between variable Y and variable X, then if variable Y is caused by
variable X, then variable Y is called the dependent variable and variable X is
the independent variable. Variables that depend on other variables are called
dependent variables (Nazir, 2011, p. 124). Based on the theoretical basis and
previous research on the dependent variable (consumptive behavior of STEI
SEBI students) with the independent variable (perception of the use of
electronic money) above, the theoretical framework can be developed as
shown in the following figure:
(X) (Y)
3. RESEARCH METHODOLOGY
Types and Nature of Research
This type of research is field research, which is conducted on all SEEI
STEI students who have conducted transactions using electronic money. This
research is descriptive-quantitative, descriptive, that is describing and
explaining the influence of independent variables, namely the perception of the
use of electronic money on the consumer behavior of STEI SEBI students.
Quantitative because the research data in the form of numbers and analyzed
Persepsi
penggunaan uang
elektronik
Perilaku konsumtif
mahasiswa STEI
SEBI

72 |Nailah Fauziah, Nining Nurhasanah : The Effect of The Perception of Electronic Money on
Consumptive Behavior of STEI SEBI Students
using statistics. The analysis in this study uses statistics with the help of SPSS
statistical computer applications.
Data Type
This research uses primary and secondary data types. Primary data is
data collected for research from the actual location of the event (Sekaran,
2011). Data was collected with a questionnaire given to respondents and
deepened through interviews. Data from the questionnaire were scored in the
form of numbers and then tested and analyzed.
In addition to using primary data, this study also uses secondary data.
Secondary data (Sugiyono, 2012: 141) defines that secondary sources are
sources of data obtained by reading, studying and understanding through other
media sourced from literature, books and company documents.
Data collection technique
Data collection techniques are ways and tools used by researchers to
collect data. Secondary data collection techniques in this study were obtained
from books, journals, websites, related news and several Bank Indonesia
documents. And primary data collection techniques in this study were obtained
from respondents' answers collected through questionnaires and deepened
through interviews.
According to Arikunto (2013: 194), a questionnaire is a number of
written questions that are used to obtain information from respondents in the
sense of reports about his personality, or things he knows. The questionnaire
in this study was aimed at STEI SEBI students and distributed online through
social media groups aimed at knowing the perceptions of STEI SEBI students
in using electronic money.
According to Stewart and Cash (2012), interviewing is a process of
communication between two parties that at least one of them has a serious goal
that has been set and involves a question and answer process about something.
Interviews were conducted with several respondents (students of STEI STEI)
to find out more deeply the reasons of respondents when answering
questionnaires.
Population
Population is a collection of elements that show certain characteristics
that can be used to make conclusions (Sanusi, 2011: 87). So, the collection of

Jurnal Ekonomi dan Perbankan Syariah
Vol. 8. No.1, April 2020: 63-84 ISSN (printed): 2355-1755 | ISSN (online): 2579-6437 | 73
elements shows the amount, while certain characteristics indicate the
characteristics of the collection. The population in this study were all SEEI
STEI students.
Table 3.3 Active Students of STEI SEBI 2019/2020
Source: Academic Data of STEI SEBI
Sample
The sample is part of the population, the sample consists of a number
of members selected from the population. The sample criteria of this study are
for STEI SEBI students who have made transactions using electronic money.
The number of samples in this study was determined using the Slovin formula,
which is as follows:
𝑛 =𝑁
1 + 𝑁 ∈2
𝑛 =𝑁
1 + 𝑁 ∈2
𝑛 =1046
1 + 1046 (10%)2
𝑛 =1046
1 + 1046 (0,01)
𝑛 =1046
11,46
𝑛 = 91
Information :
n = number of samples
N = population size
e = error limit (10%)
With the STEI SEBI student population totaling 1046 people and the
error limit set at 10% (significance level or error tolerance), the number of
No. Jurusan Angkatan Jumlah
2016 2017 2018 2019
1. Manajemen Perbankan
Syariah
71 99 122 71 363
2. Akuntansi Syariah 87 62 100 68 317
3. Manajemen Bisnis Syariah 57 64 101 106 328
4. Hukum Ekonomi Syariah 38 38
Total 215 225 323 283 1.046

74 |Nailah Fauziah, Nining Nurhasanah : The Effect of The Perception of Electronic Money on
Consumptive Behavior of STEI SEBI Students
samples to be taken is 91 STEI SEBI student respondents by dividing each
study as follows:
Table 4.2 Distribution of Samples
No. Jurusan Jumlah Sampel
1. Manajemen Perbankan
Syariah
363 32
2. Akuntansi Syariah 317 28
3. Manajemen Bisnis Syariah 328 28
4. Hukum Ekonomi Syariah 38 3
Total 1.046 91
Source: Data processed
Sampling technique
The sampling technique used in this study is non-probability
sampling, namely by purposive sampling. Purposive sampling is a technique
with certain considerations (Sugiyono, Statistics for Research, 2012). What is
meant by certain considerations in purposive sampling is a sampling technique
using sample selection criteria. The sample selection criteria in this study are
those who have conducted transactions using electronic money.
Research Instruments
The instrument used in this study consisted of three instruments,
namely the Likert Scale, the Technology Acceptance Model and the
Consumptive Behavior Indicator.
Likert scale itself can be defined as a psychometric scale which is
commonly used in questionnaires / questionnaires and is the scale most widely
used in research in the form of surveys. The name of the scale is taken from
the name of Rensis Likert, who published a report explaining its use. When
responding to a question on a Likert scale, respondents determine their level
of agreement with a statement by choosing one of the available choices.
Usually in a Likert scale five options are provided in this format: 1) Strongly
Disagree; 2) Disagree; 3) Neutral; 4) Agree; and 5) Strongly Agree.
Electronic money measurement instruments (X) use the Technology
Acceptance Model (TAM)

Jurnal Ekonomi dan Perbankan Syariah
Vol. 8. No.1, April 2020: 63-84 ISSN (printed): 2355-1755 | ISSN (online): 2579-6437 | 75
Table 3.1 Technology Acceptance Model (TAM)
Konsep Indikator Referensi
Persepsi
Kemanfaatan
3.1.1.1.1.1.1 Bekerja lebih
cepat
3.1.1.1.1.1.2 Efektivitas
3.1.1.1.1.1.3 Membuat
pekerjaan lebih mudah
3.1.1.1.1.1.4 Berguna
Diadopsi dari
Davis et al.
(1989)
Persepsi
Kemudahan
Penggunaan
1. Jelas dan dapat dimengerti
2. Tidak membutuhkan usaha
mental yang banyak dalam
penggunaannya
3. Mudah digunakan
4. Sistem mudah memahami apa
yang diinginkan pengguna
Diadopsi dari
Davis et al.
(1989)
Then to measure the consumptive behavior (Y), this study uses
indicators of consumptive behavior according to Sumartono (2002)
Table 3.2 Indicators for Consumer Behavior Sumartono (2002)
Konsep Indikator Referensi
Perilaku
Konsumtif
1. Membeli produk karena
iming-iming hadiah.
2. Membeli produk karena
kemasannya menarik.
3. Membeli produk demi
menjaga penampilan dan
gengsi.
4. Membeli produk hanya
sekedar menjaga simbol
status.
Diadopsi dari
Sumartono (2002)
76 |Nailah Fauziah, Nining Nurhasanah : The Effect of The Perception of Electronic Money on
Consumptive Behavior of STEI SEBI Students
Data analysis technique
The analysis technique used to test hypotheses is a simple linear
regression analysis technique. Data analysis begins by testing the validity and
reliability. Then a simple regression was conducted which looked at the
perception of the use of electronic money on the consumer behavior of STEI
SEBI students.
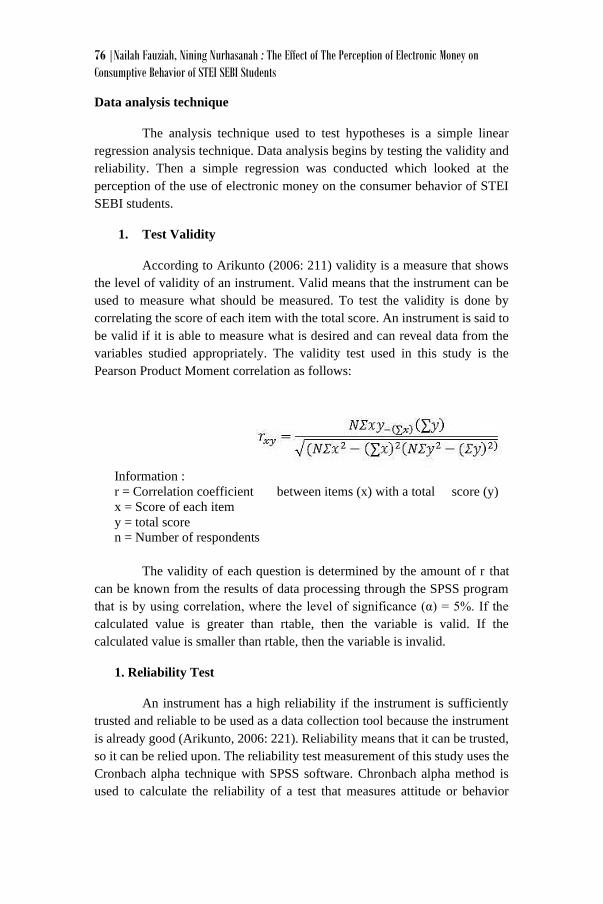
1. Test Validity
According to Arikunto (2006: 211) validity is a measure that shows
the level of validity of an instrument. Valid means that the instrument can be
used to measure what should be measured. To test the validity is done by
correlating the score of each item with the total score. An instrument is said to
be valid if it is able to measure what is desired and can reveal data from the
variables studied appropriately. The validity test used in this study is the
Pearson Product Moment correlation as follows:
Information :
r = Correlation coefficient between items (x) with a total score (y)
x = Score of each item
y = total score
n = Number of respondents
The validity of each question is determined by the amount of r that
can be known from the results of data processing through the SPSS program
that is by using correlation, where the level of significance (α) = 5%. If the
calculated value is greater than rtable, then the variable is valid. If the
calculated value is smaller than rtable, then the variable is invalid.
1. Reliability Test
An instrument has a high reliability if the instrument is sufficiently
trusted and reliable to be used as a data collection tool because the instrument
is already good (Arikunto, 2006: 221). Reliability means that it can be trusted,
so it can be relied upon. The reliability test measurement of this study uses the
Cronbach alpha technique with SPSS software. Chronbach alpha method is
used to calculate the reliability of a test that measures attitude or behavior

Jurnal Ekonomi dan Perbankan Syariah
Vol. 8. No.1, April 2020: 63-84 ISSN (printed): 2355-1755 | ISSN (online): 2579-6437 | 77
(Siregar, 2015: 89). The research instrument is said to be reliable if the
reliability coefficient> 0.60.
2. Descriptive Analysis
Descriptive analysis includes the transformation of raw data into a
form that will provide information to explain a set of factors in a situation
(Sekaran, 2006: 285). Descriptive statistical analysis includes the mean
(mean), standard deviation, maximum value and minimum value. The division
of categories in this study uses the ideal value to see the tendency of electronic
money variable data and consumptive behavior.
3. Classical Assumption Test
a. Normality test
Normality testing is a test of normality performed for parametric
statistical analysis. Normality test is used to determine whether the data is
normally distributed or not. This test uses the Kolmogorof Smirnov method.
The criteria for normality are as follows:
1) If the value of sig (significance)> alpha, then normal / pass
2) If the sig (significance) value <alpha, then it is not normal
b. Heteroscedasticity Test
Heteroscedasticity test can be done with Glejser Test, by regressing
the absolute residual value. Decisions are taken if there is no significant
relationship between all independent variables on absolute residual values, so
it can be concluded that the assumption of non-heteroscedasticity is fulfilled.
4. Simple Regression Test
Simple regression analysis is an analysis used to measure one
independent variable (the use of electronic money) against one dependent
variable (consumptive behavior). A simple linear regression equation can be
written:
Y = a + bX
Information:
Y = Dependent variable (financial behavior)
X = free variable (using fintech)
a = constant
b = coefficient

78 |Nailah Fauziah, Nining Nurhasanah : The Effect of The Perception of Electronic Money on
Consumptive Behavior of STEI SEBI Students
a. Partial Regression Test (t Test)
This test is used to determine whether the independent variable (X)
significantly influences the dependent variable (Y). Significant means the
influence that occurs can apply to the population (can be generalized).
T arithmetic formula in regression analysis is as follows:
𝑡ℎ𝑖𝑡𝑢𝑛𝑔 =𝑏
𝑠𝑏 atau 𝑡ℎ𝑖𝑡𝑢𝑛𝑔 =
𝑟√𝑛−2
√1−𝑟2
Information:
b = Regression Coefficient
Sb = Standard Error
r = Simple Correlation Coefficient
n = Number of data or cases
b. R Square Analysis
R Square can be seen from the results of the regression analysis of the
Summary Model table. R Square is adjusted R2 (Priyatno, 2009: 134). The
value obtained shows the contribution of the influence of independent
variables on the dependent variable. R Square is more recommended in
evaluating the regression analysis because with the coefficient of
determination (R2) can lead to habits of the number of independent variables
entered into the model. Every addition of one independent variable, then R2
must increase regardless of whether the variable significantly influences the
dependent variable or not (Ghozali, 2005: 83).
4. ANALYSIS AND DISCUSSION
Characteristics of Respondents
Characteristics of respondents in this study include age, gender, study
program, year of force, having other jobs besides students, type of work and
income / allowance per month. Detailed characteristics of the respondents have
been summarized in the diagram below:

Jurnal Ekonomi dan Perbankan Syariah
Vol. 8. No.1, April 2020: 63-84 ISSN (printed): 2355-1755 | ISSN (online): 2579-6437 | 79
Diagram 4.1 Based on Age
Source: Data processed
The diagram above shows that the age of the majority of respondents
ranged from 18-21 years with 56 people with a percentage of 61.1%, aged 22-
24 years with 34 people with a percentage of 37.8%, aged over 28 years with
1 person with a percentage of 1 , 1%, and the age of the respondents who were
at least ranged from 25-27 namely as many as 0 people with a percentage of
0%.
Diagram 4.2 Based on Gender
Source: Data processed
The majority of respondents were female as many as 64 people with
a percentage of 70% and male respondents numbered 27 people with a

80 |Nailah Fauziah, Nining Nurhasanah : The Effect of The Perception of Electronic Money on
Consumptive Behavior of STEI SEBI Students
percentage of 30%. This is because women use public transportation more
often than men who on average have a private vehicle and are able to drive it.
Diagram 4.3 Based on Study Program
Source: Data processed
For the study program, the majority of respondents came from the
Sharia Business Management study program as many as 34 people with a
percentage of 36.7%, then Sharia Banking Management as many as 31 people
with a percentage of 34.4%, then Sharia Accounting as many as 21 people with
a percentage of 23.3% and the least came from Islamic Economics Law study
programs, namely as many as 5 people with a percentage of 5.6%. The reason
why Sharia Business Management owns and uses electronic money more is
because on average they need electronic money for their business activities.
Source: Data processed

Jurnal Ekonomi dan Perbankan Syariah
Vol. 8. No.1, April 2020: 63-84 ISSN (printed): 2355-1755 | ISSN (online): 2579-6437 | 81
For the year of generation, the majority of respondents were in the
class of 2016 with 51 people with 55.6% percentage, then in 2017 there were
22 people with a percentage of 24.4%, then in 2018 there were 9 people with
a percentage of 10%, then in 2019 there were 7 people with a percentage 7.8%
and the least is the class of 2015 which is 2 people with a percentage of 2.2%.
Diagram 4.5 Based on Employment Status
Source: Data processed
Then for jobs other than students, 49 people with a percentage of
53.3% have other jobs besides students, while 42 others with a percentage of
46.7% do not have jobs other than students.
Diagram 4.6 Based on Job Type
Source: Data processed
6.66%, 7%
21.11%, 21%
18.88%, 19%6.63%, 6%
47%, 47%
KerjaSampinganMengajar
Berdagang

82 |Nailah Fauziah, Nining Nurhasanah : The Effect of The Perception of Electronic Money on
Consumptive Behavior of STEI SEBI Students
For employment positions, the majority of respondents do not work,
as many as 42 people with a percentage of 46.7% or rounded to 47%, then as
a teacher / teacher as many as 20 people with a percentage of 21%, then trade
as many as 17 people with a percentage of 19%, and positions the least
occupations are part time / part time jobs and other types of work (other than
those listed as options) of 6 people.
Diagram 4.7 Based on Income / Allowance Per Month
Source: Data processed
And the last income / allowance per month, the majority of
respondents get income / allowance per month ranging from Rp. 500,000 - Rp.
999,999 as many as 39 people with a percentage of 42.2% and the least are
respondents who get income / pocket money per month _> Rp. 2,000,000 as
many as 5 people with a percentage of 5.6%.
Interview result
After conducting an interview to find out the reason of the
respondent's answer, it can be concluded that the reason for responding to using
electronic money in addition to its many benefits and is easy to use is because
of the many attractive promos and cashback offered quite tempting. But behind
the convenience and benefits offered, there are respondents' concerns in terms
of security. Because in principle electronic money is the same as cash, which
is when electronic money is lost then it can be used by other parties and cannot
be claimed to the issuer. Then when the system dies, automatic electronic
money cannot be used. In addition to concerns about the security system, some
parties such as the elderly lack understanding of the use of electronic money.
So that more intensive socialization is needed so that each group is able to
transact using electronic money.

Jurnal Ekonomi dan Perbankan Syariah
Vol. 8. No.1, April 2020: 63-84 ISSN (printed): 2355-1755 | ISSN (online): 2579-6437 | 83
Based on interviews with several respondents obtained information
that in addition to increasing consumer behavior electronic money is also very
useful, for people who travel frequently it is very easy to pay for using some
transportation, and for people whose average activity is at home, electronic
money also makes it easy for them to shop so you don't have to bother leaving
the house. Besides being useful the electronic money system is also easy to
use, one of which is because it can be connected with a device so that it is
easily monitored and also used.
Partial Regression Test Results (t test)
Based on the results of the partial regression test (t test) showed that
the variable perception of the use of electronic money in this study had a
positive and significant influence on the consumer behavior of STEI SEBI
students. These results support the hypothesis which shows that the perception
of the use of electronic money has a positive and significant effect on the
consumer behavior of STEI SEBI students. That is, with the high use of
electronic money, the consumption behavior of STEI SEBI students will also
increase. Then it can be concluded Ha ACCEPTED.
5. CONCLUSION
This study examines the effect of the perception of the use of
electronic money on the consumer behavior of STEI SEBI students. Where the
perception of the use of electronic money becomes the dependent variable and
consumptive behavior as the independent variable. Based on the results of
research and discussion, the following conclusions can be drawn: 1) Electronic
money has a positive and significant impact on the level of millennial
generation consumption. 2) When the use of electronic money is high, the
consumption behavior of STEI SEBI students will also increase. 3) The link
between electronic money and consumptive behavior can be categorized quite
well.

84 |Nailah Fauziah, Nining Nurhasanah : The Effect of The Perception of Electronic Money on
Consumptive Behavior of STEI SEBI Students
BIBLIOGRAPHY
Bank Indonesia. (2009, April 13). Bank Indonesia. Dipetik Maret 12, 2020,
dari Bank Indonesia: http://www.bi.go.id/peraturan/sistem-
pembayaran/pbi_1111209
Bank Indonesia. (2009, 12 11). Bank Indonesia. Retrieved Maret 12, 2020,
from Bank Indonesia: https://www.bi.go.id/id/peraturan/sistem-
pembayaran/se_111109
Bank Indonesia. (2020, Maret 26). Bank Indonesia. Retrieved Maret 27, 2020,
from Bank Indonesia: http://www.bi.go.id
Kahf, M. (1997). as-Siyasah al-Iqtishadiyah fi ithari al-Islami. Islamic
Research and Training Institute, 207.
Kasali, R. (2017). Disruption. Jakarta: PT Gramedia Pustaka Utama.
Mudawam, S. (2000). Ekonomi Islam dalam Prospek Pembangunan Umat
Islam . Jurnal Ekonomi Sosial Politik, 109-123.
Sahroni, O. (2019, Oktober 23). Diskon dan Cashback Uang Digital. Depok,
Jawa Barat, Indonesia.
Sahroni, O. (2019, Oktober 4). Fikih Uang Digital. Depok, Jawa Barat,
Indonesia.
Suprayitno, E. (2005). Ekonomi Islam Pendekatan Ekonomi Makro Islam dan
Konvesional. Yogyakarta: Graha Ilmu.


![The Legal Nature of Electronic Money - Banco … · basis or, most often, a combination of both]", Gérard Cornu, Vocabulaire juridique , ... THE LEGAL NATURE OF ELECTRONIC MONEY](https://img.pdfslide.us/doc/110x75/5b99612109d3f210688bd0c4/the-legal-nature-of-electronic-money-banco-basis-or-most-often-a-combination.jpg)