Embed Size (px)
Citation preview

- 1 -
The effect of page layout and expectations on visual
search. Do people adapt search strategy to make best
use of page layout design?
Katherine Anne Tarling
Project report submitted in part fulfilment of the requirements for the degree of Master of Science (Human-Computer Interaction with Ergonomics) in the Faculty of Life Sciences, University College London, 2009.
NOTE BY THE UNIVERSITY
This project report is submitted as an examination paper. No responsibility can be held by London University for the accuracy or completeness of the material therein.

- 2 -
ACKNOWLEDGMENTS
A number of people have contributed in various ways to the completion of this dissertation. I would particularly like to thank Duncan Brumby. I couldn’t have asked for a more supportive or understanding supervisor, whose expertise, practical input, guidance, availability and interest contributed enormously to the development of this project. I would also like to thank everyone who gave up their time to participate in search experiments.

- 3 -
ABSTRACT
When looking at web pages, people scan content searching for items from among various options. The graphic layout of content is known to influence the speed and ease with which people find what they are looking for. How do people choose to interact visually with a given design layout and what features influence this? An eye-tracking study was conducted to determine how search strategies were adapted to a range of layouts. Layouts differed in search item density and the number of items in groups. The results show that participants were sensitive to the design layout. Gaze was adapted in favour of sparse text, but targets were located faster in dense text conditions; explained by fewer but longer visits. There was less sensitivity toward the number of items in a group and strategy did not appear to be influenced by any learning effect of group size. The findings could be explained by a rational, context-sensitive theory of search. This study furthers academic research by resolving conflicts in earlier work on display item density. It provides further evidence that people adapt search strategy according to design layout, challenging theories on the importance of layout consistency in web page design. It also implies the need for further empirical work to tease apart possible effects of learning on how people search.

- 4 -
CONTENTS
Chapter 1. Introduction .................................................................................... 7
Chapter 2. Literature review........................................................................... 12
2.1. Visual search strategies ....................................................................... 12
2.2. Search item density.............................................................................. 15
2.3. Semantic grouping............................................................................... 17
2.5. Summary.............................................................................................. 18
Chapter 3. Search strategies and layout ......................................................... 19
3.1. Method................................................................................................. 21
3.1.1. Participants ....................................................................................... 21
3.1.2. Design............................................................................................... 21
3.1.3. Procedure and Materials ................................................................... 22
3.2. Results ................................................................................................. 27
3.2.1. Search Time ...................................................................................... 27
3.1.2. Order of visits in mixed density trials............................................... 30
3.1.3. Distance between visits..................................................................... 32
3.1.4. Number of items visited per group ................................................... 36
3.1.5. Duration of visits .............................................................................. 38
Chapter 4. General Discussion ....................................................................... 40
4.1. Discussion............................................................................................ 40
4.2. Limitations........................................................................................... 46
4.3. Further work ........................................................................................ 48
4.4. Implications ......................................................................................... 51
Chapter 5. Conclusion .................................................................................... 52

- 5 -
TABLE CAPTIONS
Table 1. Search time per trial, number of fixations, duration of fixations and
distance between visits for the three density conditions (dense, mixed and sparse)…………………………………………………………………28
Table 2. Search time per trial, number of items visited, visit duration, distance
between visits, number of items visited per group, per target group and as a proportion of total items in group for ‘normal trials’ (small and large semantic groups), distance between visits for ‘test trials’ (medium semantic groups)………………………………………………………29

- 6 -
FIGURE CAPTIONS
Figure 1. A mixed-density layout where the items are also arranged in to small semantic groups of three related items. In this example, sparse text is presented in the left-hand column, dense text in the right. …………20
Figure 2. Search time per trial (s) shown for dense, mixed and sparse conditions
and group size (large groups of 9 items and small groups of 3 items). Dense groups were searched fastest………………………………...28
Figure 3. The proportion of visits to the right-hand column for mixed-density trials
for the first to the eighth visit. Shows a preference for sparse text after the fourth and fifth visit……………………………………………..32
Figure 4. A typical gaze sequence illustrating search items visited in order. Search
starts in the top left-hand corner. The first few items are checked followed by the participant skipping a number of items to further down the menu. This pattern was typical of a number of searches. (b) An example of a mixed-density trial where the left column was sparse, demonstrating a difference in distance between visits across the two columns………………………………………………………………33
Figure 5. Distance between visits per trial for the three density conditions (dense,
mixed and sparse) and the two semantic group conditions (small and large). Shows that distances between visits were great for dense text and for small groups……………………………………………………...34
Figure 6. Average number of items visited per trial for the three density conditions
(dense, mixed and sparse) and the two group size conditions (large and small)………………………………………………………………….35
Figure 7. Average number of items visited per group (all), target group only and as
a proportion of the total items in group, for large (9 item) and small(3 item) groups, for normal trials…………………………………………37
Figure 8. Average duration of visits (milliseconds) to search items for the three
density conditions (dense, mixed-density and sparse), for all trials. Visits were longest to items in dense columns. ……………………………...39

- 7 -
CHAPTER 1. INTRODUCTION
Visual search processes are widely accepted to influence the effectiveness and
efficiency with which people search computer displays (Brumby & Howes, 2008;
Halverson & Hornof, 2004). How do people interact visually with a given design
layout and what features influence this? The aim of this work is to develop
understanding about the motivating factors and processes behind eye movements to
allow us to make predictions about the performance of given layouts and to design
better interfaces from the outset.
Visual search is a fundamental process of most interactions between humans and
computers (Kieras, 2009). It is an established research field and yet many questions
pertaining to the web and design of web interfaces remain only partially answered.
While web design guidelines and recommendations abound, few are based directly
on quantifiable empirical evidence (McCarthy, Sasse & Riegelsberger, 2004;
Halverson & Hornof, 2004). This may be because visual search is complex, in that it
is guided by perceptual (e.g. visual acuity and eye position), cognitive (e.g.
decision-making and problem-solving) as well as physical (motor) processes.
The observation that people scan visual displays such as web pages according to
patterns learned through experience is widely reported (Nielsen, 2006; Bernhard,
2001; Bushcher & Cuttrell, 2009; Shrestha & Owens, 2009), with the follow-up
argument that design should uphold these conventions. These observations do not
seem to account for other empirical findings however; for example, that people
adjust the duration of their gaze according to the density of items on the visual

- 8 -
display (Bertera & Rayner, 2000; Halverson & Hornof, 2004; Ojanpaa, Nasanan &
Koho, 2002; Tseng & Howes, 2008). In contrast to the view that visual search is
influenced by learned patterns, rational, adaptive search theory argues that search is
guided by continual assessments of perceived cost (i.e. time and effort expended)
and benefit of search (i.e. information gain or likelihood of locating target) based on
the layout and content encountered (Cox & Young, 2004; Brumby & Howes, 2008;
Tseng & Howes, 2008).
Taking these two alternative theories of visual search into consideration, this
dissertation will investigate whether people adapt their search strategy to make best
use of the information available in the design layout. Rather than a single theory or
pattern of search existing, it is suggested that people have a choice of approaches for
scanning visual displays. Which approach is used will be influenced by its perceived
value in relation to the current design context.
These ideas will be explored using a classic visual search paradigm where
participants search for a known target word from among a list of distracter items
(Kieras, 2009). While the visual design layout factors that contribute to search
behaviour have attracted considerable attention (e.g. Wolfe & Horowitz, 2004;
Brumby & Howes, 2008) it is less well established which search strategy will be
applied in a given design context. In this study it will be explored to what extent
visual scanning is flexibly adapted to the display layout on page, by considering
whether or not people employ a particular scan pattern based on prior experience.
Specifically, by manipulating the information in design layouts while strategically
- 9 -
adapting the layout over the course of an experiment it will be seen which strategies
are utilised by participants.
An existing body of research already suggests that people adapt their search strategy
according to the density of search items on a visual display (Mackworth, 1976;
Bertera & Rayner, 2000; Halverson & Hornof, 2004; Ojanpaa, Nasanan & Koho,
2002; Tseng & Howes, 2008). The effect of density is considered worth re-
examining however as findings tend to disagree on whether dense or sparse search
items lead to faster search times and which densities are prioritised during search.
Previous studies (Bertera & Rayner, 2000, Ojanpää, Näsänen & Kojo, 2002)
demonstrated that dense items of basic shapes and individual characters were found
to result in faster search times. In contrast, Halverson & Hornof (2004) found that
sparse groups of words were searched fastest by participants and were also searched
first. A number of confounds would need to be removed to establish the case for any
preference. Firstly, sparse groups in Halverson & Hornof (2004) contained fewer
search items than dense groups and therefore presented better odds that the target
would be located first time. Secondly, font size was significantly larger for sparse
groups and may have initially captured attention (Pomerantz, 2006). It would be
necessary to repeat an experiment controlling for both item number and font size to
assess whether there really is a preference for sparse text and which condition
results in faster search times.
Few studies have so far addressed the effects on visual search strategy of grouping
search items by theme (for example; apple, orange, banana are all types of fruit).
While Halverson (2008) found that such semantic groups gave rise to faster search

- 10 -
performance than randomised items, it is less clear whether benefits increase in
proportion to the size of the group. Given that large semantic groups would enable
participants to skip entire areas of a display, it seems logical that greater benefits
will be construed by increasing the proportion of items grouped semantically. This
study seeks to compare search strategies between large and small semantic groups.
To determine whether people optimise search according to layout, the density of
search items and the size of groups of related words will be manipulated both within
and between display layouts. By manipulating design elements within a current page
layout as well as over the course of the experiment, it will be explored how design
factors combine to influence search strategy choice. Specifically, different design
layouts will be compared in terms of search time, order of search, number of items
visited, distance between visits and duration of visits. These variables are considered
to represent the key metrics reflecting a particular search strategy.
The format of the subsequent chapters is as follows. Chapter 2 reviews the literature,
describing two contrasting theories of visual search in more detail. It then reviews
design factors thought to influence visual search strategies, focusing on display item
density and semantic grouping. Chapter 3 introduces an experiment designed to
evaluate the influence of changes to visual display on search performance and then
presents the main study findings. Chapter 4 discusses the contribution of these
findings and makes suggestions on how design limitations present avenues for
further work. The work is then summarised in Chapter 5 in relation to the original
study goals.

- 11 -
This research will add to what is currently known about how people adapt their
visual search behaviour according to the layout context and whether it is possible to
flexibly choose between search strategies when faced with a choice. It has practical
application to the design of web pages, application menus, e-commerce product lists
and general search engine result presentation. The development of a number of
models and cognitive architectures (e.g. ACT-R; Fleetwood & Bryne, 2006) that
help predict performance of visual displays is a further outcome of a growing body
of empirical visual search knowledge (e.g. Cox & Young, 2004; Fu & Pirolli, 2007;
Salvucci, 2001).

- 12 -
CHAPTER 2. LITERATURE REVIEW
This review of the literature provides context to the investigation of whether search
is adapted optimally to visual design layout by reviewing three main areas. It first
describes two contrasting theories of visual search in more detail. It then reviews
design factors thought to influence visual search strategies, focusing firstly on
display item density and secondly on the effect of grouping items by relevance to
the search goal. It is then explained how these three areas will be combined to
inform the design of a study that explores how layout influences search.
2.1. Visual search strategies
Studies have found that visual attention is drawn to ‘more informative’ stimuli
(Berlyne, 1958; Mackworth & Morandi, 1967). It is less easy to quantify what
constitutes ‘more informative’ however. Halverson & Hornof (2004) propose that
the density of search items (i.e. the size of the gap between each item) could be one
such factor. Wolfe & Horowitz (2004) identify the main layout factors thought to
influence eye movements by reviewing a range of literature. These are listed as item
colour, orientation, size and movement. The work of Brumby & Howes (2004) as
well as Halverson & Hornof (2008) indicates that grouping items by similarity has
an influence on eye movements as well as search item density (Halverson & Hornof,
2004).
Rational analysis has been used to explain adaptations in search behaviour, where a
trade-off based on expected reward (moving towards the information goal) versus
- 13 -
effort (such as time) is made, based on the search context (Cox & Young, 2004;
Young 1998). In particular, Tseng & Howes (2008) propose that visual search is
based on a balance between the expected value of the information (exemplified by
longer durations) and the time and effort of maintaining and processing information
from a fixation. They propose that details in interface design (such as semantic
content or density) may influence the particular search strategy used. Cox & Young
(2004) similarly identify apparent shifts in strategy during interactive search
experiments which appeared to be based on details of the interface itself, such as
length of the word list or the relevance of previously seen distracter items.
It is widely established in interactive search that when people search for targets they
are unlikely to do so in an exhaustive way, preferring instead to select a target item
before visiting all possible items on a display (Brumby & Howes, 2008; Lorigo et
al, 2006). It is less clear on what basis this choice is made. According to a rational
search strategy, item skipping is explained by perceptions of information gain
versus effort and cost, which might be influenced by both top-down (for example, a
predisposition to search from left to right) and bottom-up (such as being visually
drawn to an animated word) stimuli.
In contrast to a rational account where search is sensitive to the current design
context, other researchers have observed that for web pages, eye movements are
guided by expectations of where to find pockets of information. For example,
Bernhard (2001) found that users generally predicted navigation elements to be on
the left-hand side of a page. In studies of users viewing web sites, Nielsen (2006)
identified an F-Shape scanning pattern (also Shrestha & Owens, 2009). In studies of

- 14 -
web page viewing, participants were observed to first scan the top area or lines of
text, then to scan vertically down the left hand edge and subsequently to glance
across horizontally, so forming an ‘F’ across the page. Buscher, Cuttrell & Morris
(2009) similarly identified zones on web pages described as particularly salient,
common across participants. Pearson van Schaik (2003) presents evidence that
experienced users employ learned, automatic eye movements in response to
common web page designs. Similarly, Goldberg et al (2002) predict that scan paths
are more efficient with page layout familiarity. Other research suggests that the
order in which web pages are viewed influences eye movements (Pan &
Hembrooke, 2004) and Chun (2000) coins the phrase ‘context cueing’ to describe a
visual priming effect on eye movements of earlier page views on subsequent page
viewing. To avoid repetition in visual search it is required that previously visited
items are stored and used to influence subsequent eye movements in visual search
(Logie, 1995 Kieras, 2009). Guidelines have often implied that because these
learned patterns exist, that design convention on where components are typically
located should be upheld and kept consistent (e.g. Nielsen, 2006).
Two conflicting explanations of search behaviour have thus far been described. One
view suggests that where people look is based on continuous assessment of the costs
and benefits of searching, influenced by the design layout and content. The other
view proposes that where people look is based on expectations of where important
information will be. In this document, these two strategies are not held to be
mutually exclusive, but it is suggested that people choose which strategy to employ
according to what makes most sense for a given situation.

- 15 -
As evidence for search strategy being a flexible choice, McCarthy, Sasse &
Riegelsberger (2004) presented participants with unexpected screen layouts and
found little impact on task performance. They concluded that progressing from an
initial expectation, users were subsequently able to rapidly adapt eye movements
according to the situation. In this study however there was no other choice than to
adapt, in order to complete the task. When faced with a choice of possible search
strategies to complete a task, is where people look on a display always guided by a
rational choice based on the current layout? Could gaze be influenced by predictions
about a general layout, based on earlier experiences (and thus open to error)?
2.2. Search item density
It is widely acknowledged that density affects visual search (Bertera & Rayner,
2000; Halverson & Hornof, 2004; Mackworth, 1976; Ojanpaa, Nasanan & Koho,
2002; Tseng & Howes, 2008). In a study of individual characters, Bertera & Rayner
(2000) reported that search time decreased as density increased. Similarly, Ojanpaa,
Nasanan & Koho (2002) in a study of basic shapes found that sparse groups were
searched more slowly. Both studies also found evidence that fixations were of a
longer duration for densely laid out search items, suggesting that participants may
have adopted an efficient strategy of processing multiple items in single fixations.
These findings were supported by Tseng & Howes (2008) who in a study of
thumbnail images across two density conditions (dense and sparse) identified that
participants adjusted gaze visiting fewer items for longer, for dense conditions.

- 16 -
Halverson & Hornof (2004) designed a visual search experiment to determine
whether there was an order of search preference based on item density. They used
three conditions: sparse groups, dense groups and mixed-density containing both
sparse and dense groups. The results showed that sparse groups were searched first
during mixed-density trials and were searched faster than dense groups. Halverson
& Hornof (2004) concluded that web pages should display important information in
sparse groups as a result, to ensure it is noticed first.
It is possible that factors other than density could explain the Halverson & Hornof
(2004) results however. To ensure the two densities were visually distinct, sparse
groups contained four search items per group in font size 14, whereas dense groups
contained eight search items in a group and used font size nine. Given the number
of search items varied significantly, sparse groups may have presented better odds
of finding the target on the first visit (one in four versus a one in eight chance); the
preference for sparse groups may have been a rational decision based on probability,
regardless of density. It is also possible that font size confounded the order of search
preference. Ziefle, Oehme & Luczak (2005) indicate that size of font as well as the
amount of information available for processing could both affect search
performance. Gestalt principles suggest that targets characterised by size can ‘pop-
out’ and are considered to influence early vision (Pomerantz, 2006). Similarly,
Wolfe & Horowitz (2004) identify size as a guiding attribute of visual search. Taken
these factors together, it would be necessary to repeat an experiment controlling for
font size and density, to substantiate the claim that sparse groups are searched first.

- 17 -
2.3. Semantic grouping
We next review the literature relevant to how search may be sensitive to grouping
search items by similarity. There is empirical evidence that semantic quality of non-
target items influence the way search is conducted (Brumby & Howes, 2008;
Halverson & Hornof, 2008) and that grouping items by similiarity can influence
search (Halverson & Hornof, 2008; Pierce, Parkinson & Sisson, 1992,). In a visual
search study where participants were searching for a given target word, Halverson &
Hornof (2008) found that semantically arranged conditions were searched faster
than randomised conditions. Participants appeared to judge the content of semantic
groups in single fixations, whereas several visits were made to random groups. The
presence of labels did not construe any additional benefit since participants appeared
to use any content word as an ‘anchor’ for the semantic group. McDonald et al
(1983) also found that search of menus was faster when items were functionally
grouped. Is search strategy similarly adapted toward the number of similar items
within a group? Since a greater number of distracter items could be easily
discounted, it is expected that fewer fixations would be required for large
semantically arranged groups.
The semantic group research so far reviewed has included visual spacing to
delineate group boundaries. This means there are two cues as to semantic grouping;
the content itself and the space between that marks the group. The intention in this
study is to increase reliance on comprehension of group size based on experience of
scanning content, rather than by making groups visually obvious at a glance. This
difference is important to avoid the potential confound of visual cueing when trying

- 18 -
to detect the influence of historic semantic group size on subsequent scanning
patterns.
2.5. Summary
A number of theories exist to explain and predict search behaviour. One such model
takes in to account the context of the design layout and presents a rational account
of search based on a trade-off of cost (effort) versus perceived benefit (information
gain) (Cox & Young, 2004; Young, 1998). In contrast, other research suggests that
people learn to expect where design components are and that this expectation
manifests in automated patterns of scanning behaviour when viewing web sites
(Buscher, Cuttrell & Morris, 2009; Nielsen, 2006). When faced with a choice of
search strategies, which factors influence the strategy people use?
A number of studies have sought to identify individual design factors that influence
visual search strategy, such as size, colour, movement and orientation (Wolfe &
Horowitz, 2004). Empirical evidence also suggests that people adjust gaze
according to search item density (Bertera & Rayner, 2000; Halverson & Hornof,
2004; Ojanpaa, Nasanan & Koho, 2002). The semantic cohesion of items is thought
to guide decision-making during search tasks (Brumby & Howes, 2008; Halverson
& Hornof, 2008). How does strategy choice manifest between displays of different
item density and group size? An empirical experiment designed to answer these
research questions is described in the following chapter.

- 19 -
CHAPTER 3. SEARCH STRATEGIES AND LAYOUT
This chapter describes a visual search experiment designed to explore if people
select the best visual search strategy for the design context and to ascertain which
design factors influence that chioce. The first aim was to determine how text density
influences search, resolving earlier conflicting findings. In particular, it is examined
whether sparse text items are searched fastest and first (as per Halverson & Hornof,
2004). The second aim of the experiment was to investigate whether people adapt
search strategy to take advantage of increases in the number of items within
thematically arranged groups. Finally, the experiment was designed to assess
whether eye movements of subsequent trials are influenced by group size in
previous trials.
The study used a standard visual search paradigm where participants were given a
target search item which they then had to search for from among a structured menu
of items, as rapidly and accurately as possible. An example of a mixed density
layout is shown in Figure 1. In this instance the search items were words (rather
than say, geometric shapes), comparable to real world web sites, such as search
listings (e.g. www.gumtree.co.uk) or e-commerce product lists (e.g.
www.ebay.co.uk or www.amazon.co.uk). When the target item had been located,
participants had to select it with a mouse to indicate their selection. They were then
presented with the next search task.

- 20 -
Figure 1. A mixed-density layout where the items are also arranged in to small semantic groups of three related items. In this example, sparse text is presented in the left-hand column, dense text in the right.
Text density was manipulated using a within-participants experimental design to
determine the influence of density on search time and order of search. The menu
items were arranged into semantic groups. The number of items within each
semantic group was manipulated using a between-participants experimental
structure.

- 21 -
3.1. Method
3.1.1. Participants
Twenty-one participants from the University College London and the local area
were recruited for the experiment (nine were female, mean age of 29 years; SD 5.9
years; range of 22 - 44 years). Participants were required to be native English
speakers, experienced using a computer, with normal or corrected-to-normal vision,
no learning disabilities and normal use of both hands. Visual acuity was established
through a screening questionnaire; only those who did not report previously
experienced problems reading text on a computer display were selected.
3.1.2. Design
The experiment used a 2 (semantic group size: large and small) x 3 (layout density:
dense, mixed and sparse) mixed design. The between-subjects factor was semantic
group size and the within-subjects factor was layout density. For the manipulation of
layout density, there were three conditions: sparse items, dense items and mixed
items. The design was counter-balanced, such that the presentation order of density
was randomised for dense or sparse (so either condition may have been presented
first); the mixed group was always the last condition shown.
For the manipulation of semantic group size there were two conditions: small
groups consisting of three items and large groups consisting of nine items. Menus
were thus structured in to groups and group size was randomised between
participants. In addition to ‘normal trials’ of small or large groups, each

- 22 -
experimental block included a fixed number of ‘test trials’ consisting of medium
groups (of six items).
To prime participants to know which semantic group to look for, the search question
was framed as “find a type of fruit: apple”. There were no distinctive gaps between
groups and no group label with the aim of preventing visual priming from factors
other than semantic group size.
The dependent variables measured were as follows. Search time was recorded as a
benchmark against which to compare the performance of the different layouts. The
sequence of visits to dense or sparse groups in mixed trials was analysed to
determine any preference by participants. The number of items visited was
considered as an index of the amount of effort required to search a layout, as well as
an indication of whether items were skipped. It also provides possible explanations
of variations in search time between conditions. The number of items visited per
group was used as an indicator of whether semantic content was informing search
strategy. The distance between items visited was recorded to test for priming effects
of semantic group size as well as the influence of layout density. The duration of
fixations was also sed as a comparative index of the amount of effort required to
search layouts and as a possible indicator of whether parafoveal processing was
taking place (the parsing of multiple items within a single fixation).
3.1.3. Procedure and Materials
Participants signed an informed consent form and completed a screener
questionnaire requesting demographic information. They received instructions for
- 23 -
the experiment verbally; highlights were also repeated on-screen. Each participant
was told that they would be shown a target word and the category it belonged to,
that they should study it, click on the ‘search’ button to make the word disappear
and the list appear, find the target word from this list and then click on it, doing so
as quickly as possible while trying to be accurate. They were briefed that they could
leave as soon as the tasks were complete with the aim of motivating speed of
completion. If the participant clicked on an incorrect target or outside the word list
area they had to repeat the task.
Participants were told there would be a number of these search tasks to complete
over three sections. They were also informed that the words were grouped in to
similar categories and that this structure was generally consistent across the
experiment.
Participants practiced the procedure during six initial trials that were not included
for analysis. The practice trials were identical to the remaining trials with the
exception of density which was set at a distance between the dense and sparse
groups. At the start of each section the eye tracker was calibrated to the participant,
to enable it to track their gaze. This required the participant to fixate on a number of
points to ensure a sufficient degree of accuracy. This calibration was repeated after
each experimental block.
At the start of each trial, a target word was presented alongside a search button.
Clicking the search button made the target word disappear and the menu appear.
Participants visually located the target word, moved the mouse pointer to it and
clicked on it to complete the trial.

- 24 -
There were 40 search trials for each of the 3 layout density conditions (or ‘blocks’).
The first 20 search trials within each block consisted of ‘normal trials’ – that is to
say, either large or small semantic groups. The remaining 20 search trials consisted
of 8 ‘test trials’ (medium semantic groups) and 12 normal trials. The test trials
appeared at random between trials 21 and 40. A break of three minutes was taken
between each experimental block, allowing time for participants to rest their eyes.
Finally, the experimenter gathered qualitative comments from participants about
whether they were aware of any semantic structure, whether this changed, if they
had a preference for dense or sparse groups and how they went about conducting
their search. Examples of the questionnaire used are shown in Appendix 1.
3.1.3.1 Word lists
Search items were words taken from a study by Yoon et al (2004) on word
categories which had been adapted in the Halverson and Hornof study (2004). These
adaptations concerned word length and number of items within categories and are
described in full in Halverson (2008, p. 82). The full word list used is available in
Halverson (2008, pp 158 – 164).
3.1.3.2. Software
The experiment was conducted with custom software created using Microsoft
Visual Basic. The target word was presented on an initial screen, with the target
statement appearing in the top left corner. The menus were structured as two
columns, centralised on the display screen, with semantic groups arranged

- 25 -
vertically, as shown in Figure 1. Each column contained 18 items; a total of 36 items
to search in each layout.
For the small semantic group condition, there were 12 semantic groups per
experiment (36/3 items per group). For the large semantic group condition there
were four semantic groups per experiment (36 items/9 items per group). An example
of the small semantic group condition is shown in a mixed-density layout in
Figure 1.
The target word was randomised but always appeared as part of its semantic group.
In mixed trials, the column order was randomised, meaning the dense column could
appear on the right or left.
The font used in this experiment was Arial, size 12, presented as black on a white
background. For the layout density condition, sparse groups had a gap size of 500
pixels between items; dense groups had a gap size of 300 pixels between items.
Practice trials had a gap size of 400 pixels between items. The distance of search
items from the top of the page was set at 1400 pixels. Columns were centred on the
page with the minimum distance between columns set to 1400 pixels.
3.1.3.3. Computer & Display
The software used in this experiment ran on a Dell Optiplex (Intel®. Pentium ® 4
CPU 3.00GHz. 2.989 GHz. 1.00GB of RAM) running Microsoft Windows XP
Version 2002. The visual display was set to 1078 by 758 pixels (the recommended
display settings from Tobii Corporation). The mouse was optical and set to medium
speed via the control panel.
- 26 -
Eye movements were recorded using a Tobii 1750 eye tracker. Participants were
seated approximately 60cm away from the screen. The Tobii eye tracker has a gaze
point accuracy of under 0.5 degrees of visual angle. The sampling rate of the eye
tracker is 50 Hz. The eye tracker uses infrared diodes and measures the location of
the eye and corneal reflection of the participant and using mathematical algorithms,
calculates the gaze point of the eye, to determine fixation locations (i.e. where the
eye is looking at on screen). The software used in conjunction with the Tobii eye
tracker was ClearView.
- 27 -
3.2. Results
For each correct trial, search time and eye movements were recorded from the point
when participants clicked on the ‘search’ button to the point where a correct target
was selected with the mouse. Trials were marked as incorrect if an incorrect target
was selected. Only correct trials were used in this analysis.
Unless otherwise stated, mean search time and eye movement data were analysed
using 2 (large semantic groups and small semantic groups) x 3 (sparse, dense and
mixed layouts) ANOVAs. An alpha level of 0.05 was used for the statistical tests.
The analysis was carried out for all trials, as well as just ‘normal’ and ‘test’ trials.
Normal trials consisted of either three or nine search items in a between-subjects
manipulation of semantic group size. Test trials contained six search items and were
the same across the between-subjects manipulation of semantic group size.
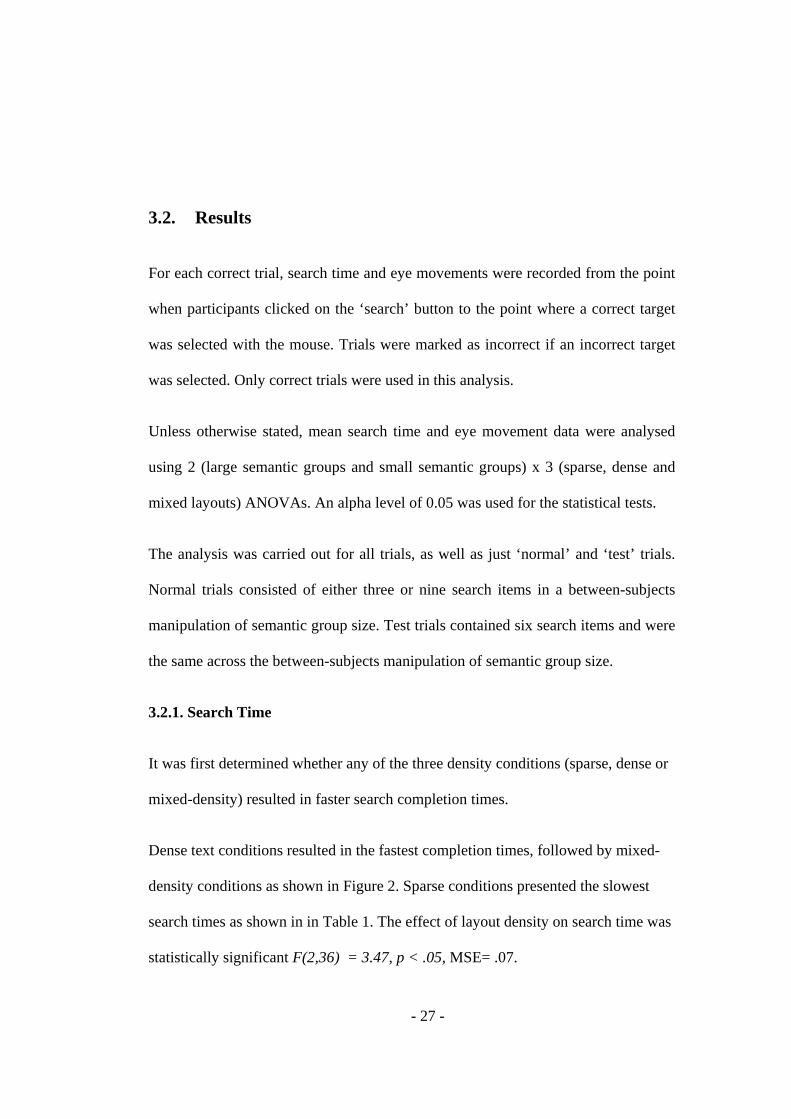
3.2.1. Search Time
It was first determined whether any of the three density conditions (sparse, dense or
mixed-density) resulted in faster search completion times.
Dense text conditions resulted in the fastest completion times, followed by mixed-
density conditions as shown in Figure 2. Sparse conditions presented the slowest
search times as shown in in Table 1. The effect of layout density on search time was
statistically significant F(2,36) = 3.47, p < .05, MSE= .07.

- 28 -
Figure 2. Search time per trial (s) shown for dense, mixed and sparse conditions and group size (large groups of 9 items and small groups of 3 items). Dense groups were searched fastest. Table 1. Search time per trial, number of fixations, duration of fixations and distance between visits for the three density conditions (dense, mixed and sparse). Dependent variable Condition M SE
Search Time (s) Dense 3.04 0.12
Mixed 3.17 0.15
Sparse 3.26 0.14
Number of items visited Dense 9.98 0.61
Mixed 10.23 0.51
Sparse 10.76 0.59
Visit duration (ms) Dense 265.38 21.66
Mixed 250.08 16.87
Sparse 255.85 16.76
Distance between visits (pixels) Dense 3.06 0.12
Mixed 3.14 0.1
Sparse 2.84 0.1

- 29 -
Search time and semantic groups were next compared. Given that entire areas of the
large semantic group conditions could be skipped if found to contain distracter (non-
target) items, it was expected that search times would be faster for large semantic
groups, assuming participants made use of the semantic content. Figure 1 shows
mean search times for both density condition and semantic group, which suggest
that larger group sizes contributed to faster search times, however there was no
significant effect F(1,18) = 1.19, p = .29, MSE= 0.94. Nor was there an interaction
effect of group size and density on search time. Means for search time by semantic
group are shown in Table 2.
Table 2. Search time per trial, number of items visited, visit duration, distance between visits, number of items visited a proportion of total items in group (‘normal trials’) and distance between visits for ‘test trials’ (medium semantic groups). Dependent variable Condition M SE
Search Time (s) Small 3.35 0.11
Large 3.03 0.21
Number of items visited Small 11.23 0.65
Large 9.69 0.76
Visit duration (ms) Small 256.45 26.09
Large 259.36 23.41
Distance between visits (pixels) Small 3.17 0.12
Large 2.9 0.14
Number of items visited per group/total number of items in group
Small 0.54 -
Large 0.3 -
Distance between visits for test trials (medium semantic group size) (pixels)
Small 3.05 0.11
Large 2.96 0.15
- 30 -
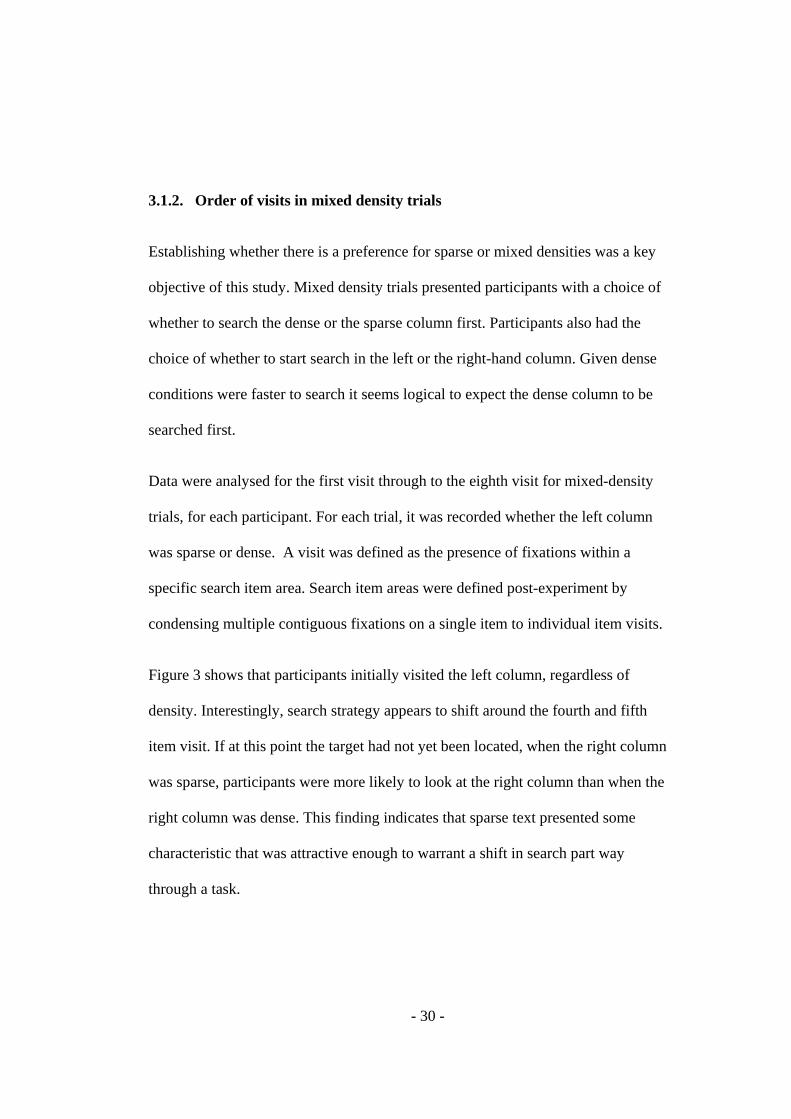
3.1.2. Order of visits in mixed density trials
Establishing whether there is a preference for sparse or mixed densities was a key
objective of this study. Mixed density trials presented participants with a choice of
whether to search the dense or the sparse column first. Participants also had the
choice of whether to start search in the left or the right-hand column. Given dense
conditions were faster to search it seems logical to expect the dense column to be
searched first.
Data were analysed for the first visit through to the eighth visit for mixed-density
trials, for each participant. For each trial, it was recorded whether the left column
was sparse or dense. A visit was defined as the presence of fixations within a
specific search item area. Search item areas were defined post-experiment by
condensing multiple contiguous fixations on a single item to individual item visits.
Figure 3 shows that participants initially visited the left column, regardless of
density. Interestingly, search strategy appears to shift around the fourth and fifth
item visit. If at this point the target had not yet been located, when the right column
was sparse, participants were more likely to look at the right column than when the
right column was dense. This finding indicates that sparse text presented some
characteristic that was attractive enough to warrant a shift in search part way
through a task.

- 31 -
Figure 3. The proportion of visits to the right-hand column for mixed-density trials for the first to the eighth visit. Shows a preference for sparse text after the fourth and fifth visit.
For statistical analysis of the order of search during mixed density trials, a 2
(position of sparse column; left or right) x 2 (density of column; sparse or dense)
ANOVA was carried out. The statistical test shows that there was a significant
effect of column density on order of search, F(1,420)=5.86, p < .05, MSE=.04.
There was a highly significant effect of column position (left or right) on order of
search, F(9,420)=10.19, p < .001, MSE=.04. There was no interaction effect of
column position and density.
Typical gaze patterns demonstrating the propensity to start search in the left-hand
corner are shown in Figures 4(a) and 4(b). The diagrams display the 36 search items
with corresponding visits, shown in order for individual trials. These figures also

- 32 -
show other effects discussed in the following sections; 4(b) in particular
demonstrates different eye movements between sparse (left) and dense (right) text.
Figure 4. Gaze sequence plots: Y axis indicates position of item in menu, X axis indicates the sequence of visits. Target position is shown by the red line. (a) A typical gaze sequence illustrating search items visited in order; search starts in the top left-hand corner, the first few items are checked followed by the participant skipping a number of items to further down the menu. This pattern was typical of a number of searches. (b) An example of a mixed-density trial where the left column was sparse, demonstrating a difference in distance between visits across the two columns.
3.1.3. Distance between visits
We next consider the distance between visits to search items. Distance was defined
as the number of display pixels (i.e. space) between two contiguous item visits
across search items. The distance between visits was first considered to evaluate if
and how items were skipped across the different layout conditions. As large
semantic groups can be quickly discounted if found to contain distracter (non-target)
Sequence of visits Sequence of visits

- 33 -
items, it is expected that the mean distance between visits would be greater than for
small semantic groups.
Furthermore, if scanning patterns were sensitive to semantic grouping, it might be
efficient to assume a fixed number of items in a group to dictate scan strategy on
subsequent trials. If such a strategy was used, it would be expected that participants
viewing large semantic groups would subsequently skip greater distances between
visits on ‘test’ trials (of medium semantic groups) when compared to small semantic
group participants.
As can be seen in Figure 5, the distance between visits was greater for dense trials.
Converse to expectations, the mean distance for small groups was marginally
greater than for large groups. The effect of density on distance between visits was
significant F(2,36) = 5.65, p < .01, MSE= 0.08. This result is surprising, given that
sparse groups presented larger gaps between items compared to dense groups. There
was no significant difference found for the distance between visits for large or small
semantic groups F(1,18) = 3.7, p =.17, MSE=.53. This indicates that semantic
group size did not impact the decision to skip items.

- 34 -
Figure 5. Distance between visits per trial for the three density conditions (dense, mixed and sparse) and the two semantic group conditions (small and large). Shows that distances between visits were great for dense text and for small groups.
We next consider the effect of historical (normal) trials on subsequent (test) trials to
determine whether strategy was influenced by any learning effect. Converse to
expectations, analysis of the means shown in Table 2 suggest that participants
viewing small semantic groups displayed longer distances between visits on test
trials than those viewing large semantic groups. Statistical analysis showed that
there was no significant effect of historic trials on the average distance between
visits for test trials F(1,18) = 0.24, p = .63, MSE=.56.
Given the null effect of semantic group on search time and visual priming, we next
consider other variables to indicate whether people were actually sensitive semantic

- 35 -
content; some plausible alternatives being that target search was based on other
characteristics or was essentially random.
We first consider the number of items visited, to indicate whether all items were
reviewed during search systematically until the target was found, or whether some
items were skipped. It is expected that larger groups would result in fewer items
visited.
Less than one third of items were visited on average in each search trial: 31.2%
items were visited in small group trials, 26.9% items were visited in large group
trials. As Figure 6 shows, more items were visited for small semantic group
conditions; fewer items visited in large semantic group conditions.
Figure 6. Average number of items visited per trial for the three density conditions (dense, mixed and sparse) and the two group size conditions (large and small).

- 36 -
We also see that fewer items were visited in dense layouts compared to sparse. The
effect of semantic group size on number of items visited (normal trials) was not
statistically significant, F(1,18)=2.24, p = .15, MSE=15.72. There was a significant
effect of density for ‘normal trials’ F(2,36) = 3.74, p < 0.05, MSE= 2.06 indicating
that fewer items were visited in dense conditions, however the same test for all trials
was not quite statistically significant, F(2,36) = 2.19, p = .13, MSE= 1.44. There
was no interaction effect between semantic group and density on number of items
visited.
3.1.4. Number of items visited per group
As described earlier, small semantic groups contained three items, large semantic
groups contained nine items. If the number of items visited in total is broadly the
same between conditions, it follows that more groups would be visited in the small
group condition than the large, purely as a product of this categorization.
Accordingly, a main effect was found for group size and number of groups visited
F(1,18)=676.99, p < .001, MSE=.165 as well as for number of items visited per
group F(1,18) = 78.63, p < 001, MSE=.24.
Of greater interest, the number of items visited per group are analysed in proportion
to the number of items in the group. As Figure 6 shows, we see that there were
fewer visits per item in large groups than in small groups. The results indicate that a
participant viewing a small group would search more items within that small group,
compared to a participant viewing a large group.

- 37 -
As an indicator of the extent to which semantic content was used to hone search
once the target semantic group had been located (recall that participants were given
the category the target word belonged to), the number of items visited within the
target group was analysed. As Figure 7 shows, more items were visited within the
large semantic target group than the small semantic target group. As a proportion of
the total items in the target group, more of the small semantic target group was
searched.
00.5
11.5
22.5
33.5
44.5
Number of itemsvisited per group
Number of itemsvisited within target
group
Number of itemsvisited per group as
proportion of total ingroup
3 items per group9 items per group
Figure 7. Average number of items visited per group (all), target group only and as a proportion of the total items in group, for large (9 item) and small(3 item) groups, for normal trials.
Statistical analysis of the number of items visited per semantic group showed that
there was a highly significant effect of semantic group size, F(1,18)=112.17, p <
.001, MSE=.26, as well as on the number of items visited within the group where the
target word was located, F(1,18)=61.79, p < .001, MSE=.50. The effect of density

- 38 -
on number of items visited per group was not significant F(2,36) =1.24, p = .3,
MSE=.03. There was no interaction effect between semantic group and density on
number of items visited per group.
3.1.5. Duration of visits
How long each visit lasts can provide an indicator of the amount of effort required
to process each search item. Possible reasoning about the item might include: Is this
a distracter or target item? If a distracter, is this part of the semantic target group or
not? This processing may be followed by a decision on which location to visit next.
The average duration of visits can provide insight on the potential differences in
search strategies arising between layouts.
Analysis of the mean visit duration of the three density conditions displayed in
Figure 8 indicate that visits were longest for dense trials and shortest for mixed
trials. There was little difference in the mean visit length between large and small
groups (see Table 2). Statistical analysis showed that there was no significant effect
of density on the average visit duration, F(2,36) = .76, p = .48, MSE= 1576. There
was no significant effect of semantic group size on the average visit duration,
F(1,18)=7e-04, p = .97, MSE=18665. Nor was there any interaction effect between
density and semantic group size on duration of visits.

- 39 -
Figure 8. Average duration of visits (milliseconds) to search items for the three density conditions (dense, mixed-density and sparse), for all trials. Visits were longest to items in dense columns.

- 40 -
CHAPTER 4. GENERAL DISCUSSION
4.1. Discussion
The goal of this research was to investigate how people adapt the way in which they
search and what factors influence this adaptation. It aimed to resolve earlier
conflicting findings on the effect of search item density on speed and order of
search. It examined whether people adapt search strategy according to benefits
offered by semantic grouping. It also considered whether a predisposition for a
particular search strategy is selected over adapting eye movements to current layout.
A key finding in this study was that participants displayed an order of search
preference based on density. After several fixations to the left-hand column (which
might be explained by a cultural familiarity with left to right reading or from visual
priming from the search goal of the previous screen) a clear preference for sparse
groups was displayed, regardless of left or right-hand column location. This finding
is remarkable as it rules out the effect of probability or font size confounds from
earlier studies (Halverson & Hornof, 2004). In particular, although Halverson &
Hornof (2004) found that participants tended to search sparse groups before dense
groups. This study was flawed as sparse groups presented better odds of locating the
target first time and were presented in a larger font size, despite size being known to
guide visual search (Wolfe & Horowitz, 2004; Pomerantz, 2006). The current
findings indicate that people really do have a preference for searching sparse groups.

- 41 -
Clearly some characteristic of sparse item density is attractive enough to cause a
shift in search strategy.
That participants had a preference for searching sparse displays first, might indicate
that sparse text is perceived as less effortful compared to dense text. In support of
this view, the results of the study suggest that visit duration for sparse groups tended
to be shorter. There is broader evidence that people adjust gaze duration according
to layout density. Tseng & Howes (2008) and Ojanpaa, Nasanan & Koho (2002)
both report that visit duration was longer for dense search items, arguing that this
may be due to people adapting their gaze in order to process multiple items in close
proximity, simultaneously. Fitts et al (1950) correlated increases in duration of gaze
with more complex information processing. If density did cause people to adjust
length of gaze, it may be that on a per item basis, items were less effortful to process
in sparse groups, possibly because visual acuity was greater or participants only
processed single items during a visit. In combination with longer visit durations,
fewer items were visited overall in dense groups. This lends further weight to the
argument that multiple items were processed simultaneously, resulting in a reduced
number of individual visits required to dense groups for the same information gain.
In the context of a preference for sparse text, it is of particular interest that in this
experiment, dense text groups actually proved to be the fastest to search. The
finding that dense text required fewer fixations may account for the faster search
time. An earlier study similarly correlated a reduced number of fixations with faster
task completion times (Goldberg & Kotval, 1998). Although the preference for
sparse text might appear to be a non-rational decision given that it seems intuitive to

- 42 -
expect the fastest density type to be searched first, it could be explained by a greater
likelihood of immediately identifying the target word within sparse text with a
shorter fixation, despite overall to search the whole sparse group would require
greater effort (i.e. fixations and time). To summarise, the two densities may have
presented different search benefits: on a per item basis sparse text may have been
more immediately informative; on a group basis, the reduced spatial area of dense
text may have enabled more efficient search strategies (such as fewer fixations).
These findings appear to support a context-sensitive theory of search, where strategy
is guided by current layout.
That dense text was found to be searched fastest in this study is consistent with
previous studies (Bertera & Rayner, 2000; Ojanpaa, Nasanan & Koho, 2002). These
studies used basic shapes and individual characters. That the current study found
similar effects with words suggests that earlier findings based on shapes and
individual characters can be expanded to more complex word items. The indication
that dense text is fastest to search conflicts with other visual research based on text
items (Halverson & Hornof, 2004). A limitation with Halverson & Hornof’s (2004)
study was the number of variables manipulated. In their study, sparse groups
contained half as many items as dense groups, were displayed in a larger font size
and had a larger gap between items. In this study, font size and item number were
consistent between dense and sparse groups, but gap size between items was
manipulated. While Halverson & Hornof (2004) found that layouts with more sparse
groups resulted in a reduced search time per word, it is proposed in this study that
this finding arises from differences in font size (and thus increased visual acuity)

- 43 -
possibly in combination with gap size. When controlling for font size, this study
found that sparse groups resulted in an increased search time per word.
It should be noted that in the current study the spatial area taken up by sparse groups
was greater than for dense groups. Additionally, search items were arranged in
thematic groups but with no visual separation. In Halverson & Hornof (2004),
spatial area was kept consistent by adjusting the size of the search items and while
items were arranged in to groups by density, the content of these groups were
random words with no semantic relationship. One possibility is that local layout
factors (such as font size, gap size, number of items and their semantic relationship)
all interact with perceptions of information value and effort required, to explain the
different results between studies. That differences in search time are reported
between studies may be a product of how density is manipulated mean that care
must be taken to isolate the exact variable under consideration in visual search
experiments. It also highlights the possible complexity of distinguishing between
contributing factors to usability issues in broader design contexts.
While manipulating item density appeared to instantiate a number of search
behaviour adaptations, differences in semantic group size did not significantly
influence search time, visit duration or distance between visits. This null effect of
semantic group size is unexpected; Halverson & Hornof (2008) found that semantic
groups were faster to search than randomised groups. Extrapolating this, it was
expected that large semantic groups would be faster to search than small semantic
groups. The null effect of group size on search time in this study suggests that

- 44 -
increasing the number of items within a similar category did not convey an
additional benefit in terms of time spent searching.
The current study did find that proportionally more of the items were visited for
groups that contained fewer items. This is similar to previous research where
Halverson & Hornof (2008) found that random groups required more item visits
before being discounted than semantic groups. The current study findings suggest
that larger semantic groups may in fact have helped to locate a target, by enabling
participants to skip a greater number of distracter items. Small semantic groups may
have been less immediately useful in determining likely target location.
Further findings of the current study contrast with the view that more items could
safely be skipped in larger groups than small groups. The distance between visits
were in fact marginally longer for small groups than large groups, suggesting that
factors other than semantic group size might have influenced item skipping.
The study was designed so that if people were sensitive to the number of items per
group, they could adapt their search to find the target more quickly. The alternative
strategy would be that a pattern of scanning would develop after a number of trials
based on an expectation that group size was consistent. This same pattern would
then be applied automatically to subsequent trials in a way that was less sensitive to
changes in group size. Evidence of a scanning pattern would be seen in different
adaptations to search across medium groups, between participants previously
viewing large groups and those previously viewing small groups. However, results
of the study show little evidence that adaptations to test trials were based on earlier
experience.
- 45 -
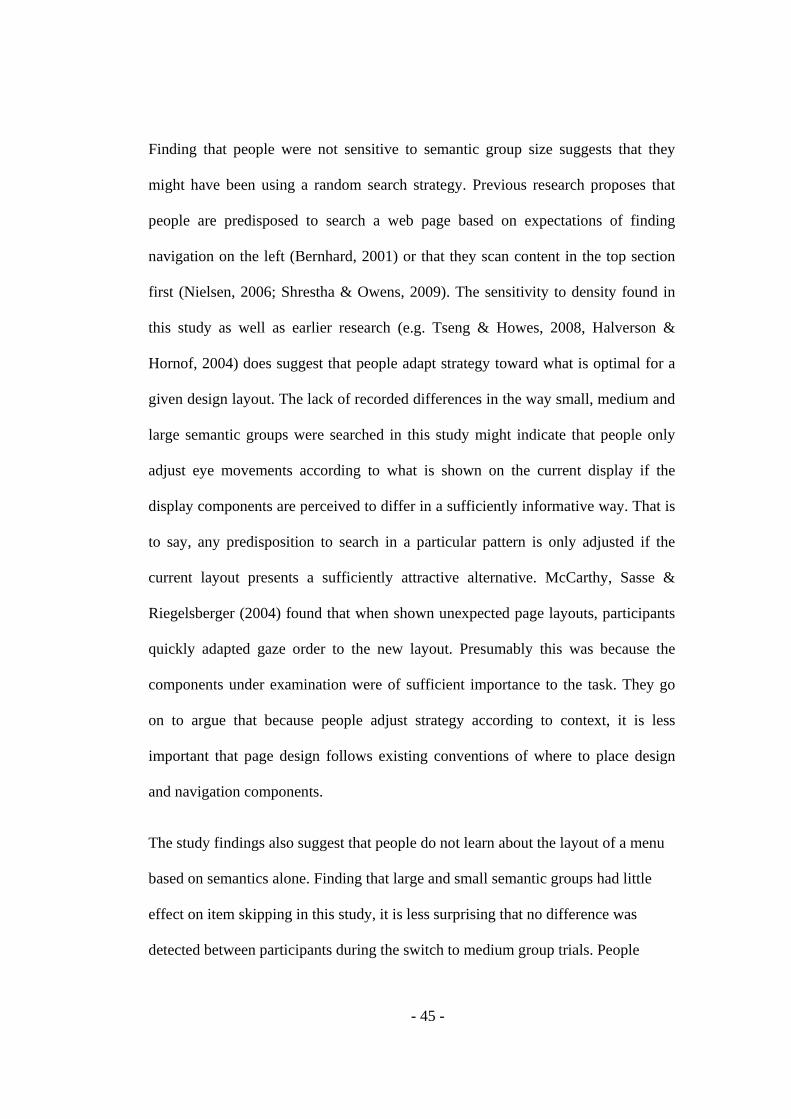
Finding that people were not sensitive to semantic group size suggests that they
might have been using a random search strategy. Previous research proposes that
people are predisposed to search a web page based on expectations of finding
navigation on the left (Bernhard, 2001) or that they scan content in the top section
first (Nielsen, 2006; Shrestha & Owens, 2009). The sensitivity to density found in
this study as well as earlier research (e.g. Tseng & Howes, 2008, Halverson &
Hornof, 2004) does suggest that people adapt strategy toward what is optimal for a
given design layout. The lack of recorded differences in the way small, medium and
large semantic groups were searched in this study might indicate that people only
adjust eye movements according to what is shown on the current display if the
display components are perceived to differ in a sufficiently informative way. That is
to say, any predisposition to search in a particular pattern is only adjusted if the
current layout presents a sufficiently attractive alternative. McCarthy, Sasse &
Riegelsberger (2004) found that when shown unexpected page layouts, participants
quickly adapted gaze order to the new layout. Presumably this was because the
components under examination were of sufficient importance to the task. They go
on to argue that because people adjust strategy according to context, it is less
important that page design follows existing conventions of where to place design
and navigation components.
The study findings also suggest that people do not learn about the layout of a menu
based on semantics alone. Finding that large and small semantic groups had little
effect on item skipping in this study, it is less surprising that no difference was
detected between participants during the switch to medium group trials. People

- 46 -
clearly do learn, but these results suggest they need more than semantics alone. One
plausible explanation is that participants were unable to detect any meaningful
differences between the groups. It also seems reasonable that alternative
characteristics of the search text reduced the immediate usefulness of the semantic
content to participants, with the result that the effect of semantic content would be
too weak to identify statistically. It is next discussed how this might have affected
results and with more time available, how subsequent experiments could address
this.
4.2. Limitations
One limitation in study design is that small semantic groups may have been more
difficult to identify, giving rise to a higher number of item visits. This is because
once an item within a small group had been fixated, it would still be necessary for
participants to visit the most proximal item (i.e. up or down) to determine the
boundary of the small group. There is some evidence that small groups were less
beneficial, given by the greater number of item visits within a small group compared
to a large group, as a proportion of total group items. This lack of benefit would
then reduce the likelihood of any predisposition to patterns of eye gaze developing
over contiguous trials.
In identifying learning effects from previous trials, the difference in group size may
have been too great or insufficient to warrant an effect. The test trials may have
appeared too early before a pattern had been established or the number of test trials
as a proportion of total trials may have been too great for learning to develop. Under

- 47 -
experimental conditions, participants may have been far more alert than might
normally be found when browsing under less artificial conditions.
A general confound may have arisen from differences in the consistency of the
semantic relationship between items. While the source of materials was the same as
earlier studies on semantic grouping (Yoon et al, 2004; Halverson, 2008), the same
confounds would have been repeated. This risk would have been greater for small
semantic groups where the randomised selection of words from a semantic sub-
group may have weakened cohesion. The strength of the semantic relationship
between words is known to influence scanning behaviour (Brumby & Howes,
2008).
While the majority of participants said they were aware of a semantic structure of
some kind, a number commented that they did not think this structure changed in
any way during the experiment, except for groups ‘moving about’. Participants may
have been unable to detect a difference between ‘normal trials’ and ‘test trials’. This
may mean that a difference would have been found had groups differed in a more
visually obvious way.
Given that similar item skipping distances were found across all semantic group size
conditions, the decision to skip items may have been based on factors other than
semantic content. Interestingly, during post-experimental follow up, participants
described using alternate strategies such as searching systematically top-to-bottom,
by word shape (for particularly long or short targets) or the first letter of the target
word or simply scanning randomly. Employing these strategies would have

- 48 -
weakened any effect of semantic structure making a comparison between large and
small semantic groups more akin to a comparison between randomised groups.
Participants were motivated to complete the tasks quickly which was important in
identifying whichever rational approach gave fastest results. In cases where target
word length was particularly long or short, searching by word shape may have
presented considerable time-benefits over searching by semantic qualities. Using
character length as a distinguishing item only makes sense for distinctively long or
short words. In post-hoc analysis, the distribution of character length of target word
was compared against character length of all words to ensure that target word
selection was representative i.e. not especially long or short in comparison to
distracter items.
The position of the target word in relation to eye gaze would also impact search
time. Some trials were completed very quickly due to a participant coincidentally
finding the target word immediately. As test trials were fewer, this interaction of
search time and eye gaze with target word position would be especially sensitive,
thus reducing the ability to detect an influence of historic trials. The effects of
density itself may have confounded the semantic content. Given the established
order of preference based on sparse text, this may have reduced the perceived
usefulness of semantic content.
4.3. Further work
There are a number of possible follow-up studies that could be done to provide
further insight around the choices participants made while carrying out the visual

- 49 -
search tasks. One such follow up study should be conducted to address the possible
confounds in the design of the current study. Specifically, the confounds include:
the fact that small groups may have been too small or not distinctive enough for
semantic content to have had any use; that the semantic relationship of items within
groups may have differed in terms of cohesion between groups or conditions; that
participants might have been using alternative strategies to search such as the shape
of the search item and finally, that a preference for sparse text may have reduced the
usefulness of semantic groupings. To address these a new experimental design could
use three within-participant conditions to systematically manipulate the visual
distinctiveness of semantic groups (i.e. semantic groups with no gaps between them
versus visual gaps), semantic cohesion versus randomized search items as well as
group size (large and small), maintaining the same visual search paradigm. A pre-
experiment validation process (such as a survey asking participants to rate similarity
of words) could help to ensure that all semantic groups were consistently
representative of a specific theme of category and that there was not a weaker
semantic consistency for small groups. If participants were using the character
length of the target item to search, rather than semantic grouping, then there should
be no difference found in performance if search items were randomized. The
resulting data would help determine whether semantic content influenced search
strategy when made more visually apparent, how this then compared with a
randomised menu structure, and whether there was any interaction of large and
small semantic groups across any of the above conditions. The expectation would be
that making small semantic groups more visually apparent would reduce the cost of
using semantic content and thus provide a stronger comparison against large groups.

- 50 -
It would also indicate whether semantic content had any impact in the first
experiment, by providing comparison performance when items were randomized.
Given earlier evidence that semantic content was used to an extent it is expected that
the randomized condition would present different results to the semantically
cohesive condition. Findings show that less than a third of items were visited on
average in each search trial. As a further interesting avenue, this subsequent study
could answer whether this was an effect of semantic grouping.
To remove the possible effect of visual priming based on word shape altogether, the
experiment could be repeated by removing the target word and replacing it with
short descriptive clues to the target, as in interactive search paradigms. An example
search task might be ‘find a grey animal with a long trunk’, where the target word is
elephant. Although it would be difficult to ensure a consistent level of helpfulness of
the clues and of the distracter items, grading the clues, answers and distracters
through surveys prior to the experiment (as in Brumby & Howes, 2008) may
increase consistency. It would be expected that search time would increase across all
trials by introducing the need for a processing stage to evaluate the suitability of
search items to the goal. Without visual priming of the target, participants may be
more sensitive to the semantically arranged groupings to hone search. Larger groups
would be expected to be of more immediate benefit, manifesting in faster search
times.
- 51 -
4.4. Implications
The findings presented here are relevant to a range of usability and design contexts.
That some empirical data exists to suggest a preference for order of search by
density has direct application to the design of information on websites where it is
necessary to scan content (such as search engine results and product lists). The study
provides evidence that the way in which item density is manipulated directly
impacts search time which has implications for the careful design of experiments as
well as general page design. Similar to McCarthy, Sasse & Riegelsberger (2004) it
also demonstrates the value and suitability of eye tracking in providing a sufficient
granularity of data to distinguish between interfaces. Empirical findings could also
feed in to work on cognitive architectures, such as ACT-R that can be used to
simulate search performance. Considering that dense text was searched faster might
have particular relevance for contexts where space and time available is constrained,
such as displaying web sites via mobile devices. This study also lends possible
support for search theory where strategy is rationally guided by the current page
layout in conjunction with perceptions of time and effort.

- 52 -
CHAPTER 5. CONCLUSION
In summary, a study was conducted that found that participants adapted search
strategy according to design layout. The novel results of this study are that
participants displayed a preference in order of search for more sparsely presented
search items, despite dense items being faster to search overall. There was less
sensitivity towards the number of items arranged in related groups. The findings
show little evidence of people adapting search behaviour based on learning effects
from previous trial layouts.
In the introduction to this dissertation, the question was posed that when faced with
a choice of search strategies, what factors influence how people search a visual
design layout and is search strategy optimised for the current layout? It was
hypothesized that people have a choice of approaches for scanning visual displays
and that which approach is used will be influenced by its perceived value in relation
to the design context.
The results of this study suggest that people are sensitive to certain characteristics of
page design and that they adapt their search accordingly. As an example in this
study, gaze duration was adapted to density, possibly in order to process multiple
items simultaneously when text was densely presented. Sparse texts appeared to be
less effortful on a per item basis and thus worthwhile to check a few search items
quickly. There was also evidence of other strategies being utilised, such as search by
word shape. It therefore seems likely that people do adapt visual search according to
design layout, making use of a range of strategies; the utility of which depends on

- 53 -
the page encountered. While people may learn to expect navigational elements to be
located in specific areas of a web page, this is likely to be just one of a number of
search strategies that can be utilised.
The results also suggest that local density factors are complex and that font size, gap
size between items and spatial area can all influence search strategy, which would
explain differences between earlier results (Halverson & Hornof, 2004, Bertera &
Rayner, 2000, Ojanpaa, Nasanan & Koho, 2002).
- 54 -
REFERENCES
Bernhard, M. L. (2001). Developing Schemas for the Location of Common Web Objects, in Proceedings of the Human Factors and Ergonomics Society 45th Annual Meeting, Human Factors and Ergonomics Society, pp.1161–5.
Bertera, J. H., & Rayner, K. (2000). Eye movements and the span of effective stimulus in visual search. Perception & Psychophysics, 62(3), 576-585.
Brumby, D. P., & Howes, A. (2004). Good enough but I'll just check: Web-Page search as attentional refocusing. Proceedings of the International Conference on Cognitive Modeling, Pittsburgh, PA, 46-51.
Brumby, D. P. & Howes, A. (2008). Strategies for Guiding Interactive Search: An Empirical Investigation Into the Consequences of Label Relevance for Assessment and Selection. Human-Computer Interaction, 23, 1 – 46.
Buscher, G., Cutrell, E., & Morris, M, R. (2009). What Do You See When You’re Surfing? Using Eye Tracking to Predict Salient Regions of Web Pages. CHI 2009, April 4–9, 2009, Boston, Massachusetts, USA. ACM.
Cox, A.L., & Young, R.M. (2004). A rational model of the effect of information scent on the exploration of menus. Poster session at the meeting of the 6th Internal Conference on Cognitive Modelling, Pittsburgh, PA.
Cox, A.L. & Silva. (2009). Item skipping in menu search (working title). Work in preparation.
Chun, M. M. (2000). Contextual Cueing of Visual Attention. Trends in Cognitive Science 4, 5, 170-178.
Fitts, P. M., Jones, R. E. & Milton, J. L. (1950). Eye Movements of Aircraft Pilots during Instrument-landing Approaches, Aeronautical Engineering Review 9(2), 24–29.
Fleetwood, M. D., & Byrne, M. D. (2006). Modeling the visual search of displays: A revised ACT-R/PM model of icon search based on eye tracking data. Human-Computer Interaction, 21(2), 153-197.
Fu, W., & Pirolli, P. (2007). SNIF-ACT: A cognitive model of user navigation on the world wide web. Human-Computer Interaction, 22(4), 355 - 412.
Goldberg, J. H. & Kotval, X. P. (1998), Eye Movement-based Evaluation of the Computer Interface, in S. K. Kumar (ed.), Advances in Occupational Ergonomics and Safety, IOS Press, pp.529–32.
- 55 -
Goldberg, J. H., Stimson, M. J., Lewenstein, M., Scott, N., Wichansky, A.M., (2002). Eye Tracking inWeb Search Tasks: Design Implications. ETRA'02 New Orleans, Louisiana, USA. ACM 2002.
Halverson, T. & Hornof, A. J. (2004a). Explaining eye movements in the visual search of varying density layouts. Proceedings of the Sixth International Conference on Cognitive Modeling, Pittsburgh, Pennsylvania, July 30 - August 1, 124-129.
Halverson, T., & Hornof, A. J. (2004b). Strategy shifts in mixed-density search. Proceedings of the 26th Annual Meeting of the Cognitive Science Society, Chicago, Illinois, August 4-8, 529-534.
Halverson, T., & Hornof, A. J. (2004c). Local density guides visual search: Sparse groups are first and faster. Proceedings of the 48th Annual Meeting of the Human Factors and Ergonomics Society. New Orleans, Louisiana, September 20-24, 1860-1864.
Halverson, T. E. (2008). An "active vision" computational model of visual search for human-computer interaction. Doctoral Dissertation in Computer and Information Science. The University of Oregon, Eugene, OR.
Halverson, T. & Hornof, A. J. (2008). The Effects of Semantic Grouping on Visual Search. Extended Abstracts of ACM CHI 2008: Conference on Human Factors in Computing Systems, Florence, Italy, April 5-10, 2008.
Kieras, D. (2009). The persistent visual store as the locus of fixation memory in visual search tasks. In A. Howes, D. Peebles, R. Cooper (Eds.), 9th International Conference on Cognitive Modeling – ICCM2009, Manchester, UK.
Mackworth, N. H. (1976). Stimulus density limits the useful field of view. In R. A. Monty, & J. W. Senders (Eds.), Eye Movements and Psychological Processes. (pp. 307-21). Hillsdale, NJ: Lawrence Erlbaum.
McCarthy, J. D., Sasse, M. A., & Riegelsberger, J. (2003). Could I have the menu please? An eye tracking study of design conventions. In E. O’Neill, P. Palanque, & P. Johnston (Eds.), People and Computers XVII – Designing for Society (pp. 401-414). London, UK: Springer-Verlag.
McDonald, J .E., Stone, J.D., and Liebelt, L.S. (1983).Searching for items in menus: The effects of organization and type of target. Proceeding of the Human Factors Society: 27th Annual Meeting 1983 (Norfolk, Virginia, Oct. 10-14). Human Factors Society, Santa Monica, California, 1983, pp. 834-837
Nielsen, J. (2006). F-Shaped Pattern for Reading Web Content. Accessed from http://www.useit.com/alertbox/reading_pattern.html on 15/07/2009.
Ojanpää, H., Näsänen, R., & Kojo, I. (2002). Eye movements in the visual search of word lists. Vision Research, 42(12), 1499-1512

- 56 -
Pearson, R. & van Schaik, P. (2003). The effect of spatial layout of and link colouring on web pages on performance in a visual search task and an interactive search task. International Journal of Human-Computer Studies, 59, 327–353.
Pierce, B.J., Parkinson, S.R., & Sisson, N. (1992). Effects of semantic similarity, omission probability and number of alternatives in computer menu search. International journal of man-machine studies. 1992, vol. 37, no5, pp. 653-677 (1 p.)
Pomerantz, J. R. (2006). Colour as a Gestalt: Pop out with basic features and with conjunctions. Visual Cognition, 14, 619-628. Psychology Press, Taylor & Francis Group.
Salvucci, D, D. (2001). An integrated model of eye movements and visual encoding. Journal of Cognitive Systems Research, 1, 201–220
Sears, A. & Jacko, J.A. (2007). The human-computer interaction handbook: fundamentals, evolving technologies and emerging applications. 2nd edition. Human Factors and Ergonomics.
Shrestha, S. & Owens, J. W. (2009). Eye Movement Analysis of Text-Based Web Page Layouts. Usability News, 11, 1. Software Usability Research Laboratory.
Tseng, Y. C. & Howes, A. (2008). The Adaptation of Visual Search Strategy to Expected Information Gain. CHI 2008, Apri 5-10, 2008, Florence, Italy.
Wolfe, J.M. & Horowitz, T.S. (2004). What attributes guide the deployment of visual attention and how do they do it? Nature Reviews Neuroscience, 5, 495-501.
Young, R.M. (1998). Rational analysis of exploratory choice. In M. Oaksford, & N. Chater (Eds.). Rational Models of Cognition. Oxford, UK: Oxford University Press.
Yoon, C., Feinberg, F., Hu, P., Gutchess, A. H., Hedden, T., Chen, H. M., et al. (2004). Category norms as a function of culture and age: Comparisons of item responses to 105 categories by american and chinese adults. Psychology and Aging, 19(3), 379-393.
Ziefle, Oehme & Luczak, 2005. Ziefle, M, Oehme, O and Luczak, H. 2005. Information presentation and visual performance in head-mounted displays with augmented reality. Zeitschrift fur Arbeitswissenschaft, 59. 3-4. 331-344.

- 57 -
APPENDIX 1
Sample of the questionnaire used post-experiment.
Please answer the following questions about the experiment you have just completed.
In this experiment, there were dense and sparse groups of words:
1. a) Did you have a preference for searching either dense or sparse groups? Circle your choice (please choose just one):
No preference Dense Sparse
b) What is the reason for your choice?
2. Did you notice any structure or similarity between the words in the display? (e.g. describe how words were grouped, if at all)?
3. Did this change or did it stay the same?
4. How did you go about searching for target words?
5. Any other comments?
apple
hawk
engine
apple
hawk
chocolate