Embed Size (px)
Citation preview
The Effect of Older Siblings on The Effect of Older Siblings on Adolescent Behavior: Is It Siblings Adolescent Behavior: Is It Siblings
or is it Parents?or is it Parents?
Laura ArgysLaura ArgysDepartment of EconomicsDepartment of Economics
University of Colorado at Denver University of Colorado at Denver
Susan AverettSusan AverettDepartment of Economics and BusinessDepartment of Economics and Business
Lafayette CollegeLafayette College
Daniel ReesDaniel ReesDepartment of Economics Department of Economics
University of Colorado at DenverUniversity of Colorado at Denver
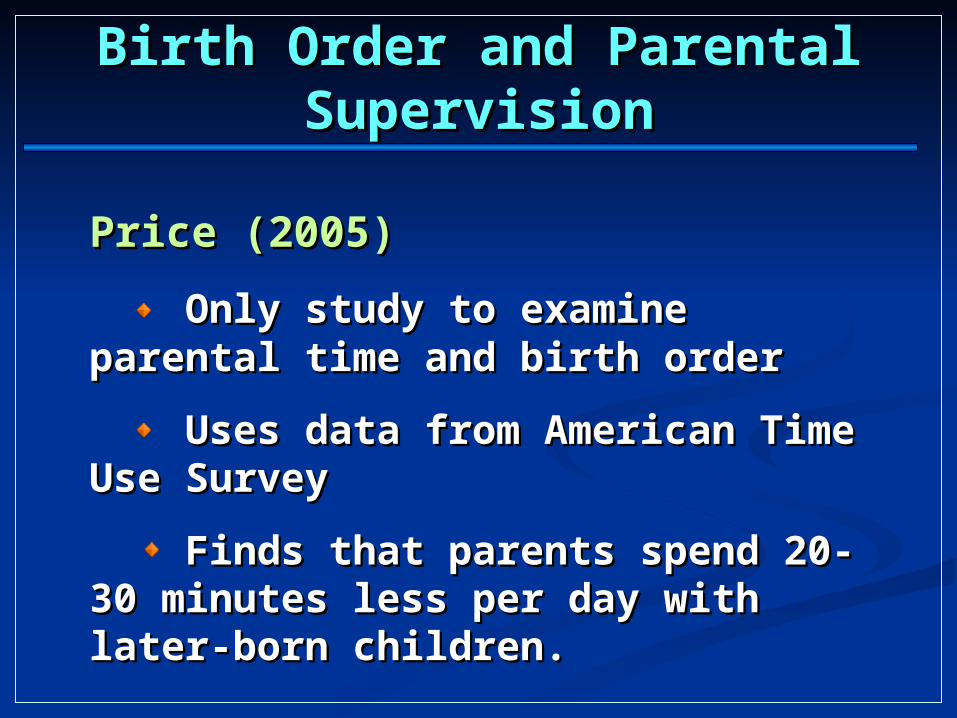
Birth Order and Parental SupervisionBirth Order and Parental Supervision
Price (2005)Price (2005)
Only study to examine parental time and Only study to examine parental time and birth orderbirth order
Uses data from American Time Use Uses data from American Time Use SurveySurvey
Finds that parents spend 20-30 minutes Finds that parents spend 20-30 minutes less per day with later-born children.less per day with later-born children.

Parental Supervision and Child Parental Supervision and Child BehaviorsBehaviors
Parental (Maternal) work and cognitive Parental (Maternal) work and cognitive outcomes in young childrenoutcomes in young children
Leibowitz (1977), Blau and Grossberg (1992), Leibowitz (1977), Blau and Grossberg (1992), Brooks-Gunn, Han and Waldfogel (2002)Brooks-Gunn, Han and Waldfogel (2002)
Parental supervision and risky behaviorsParental supervision and risky behaviors
substance use – Richardson et al. (1993)substance use – Richardson et al. (1993)
behavior problems – Vandall and Ramanan (1991)behavior problems – Vandall and Ramanan (1991)
substance use, theft, truancy – Aizer (2004)substance use, theft, truancy – Aizer (2004)
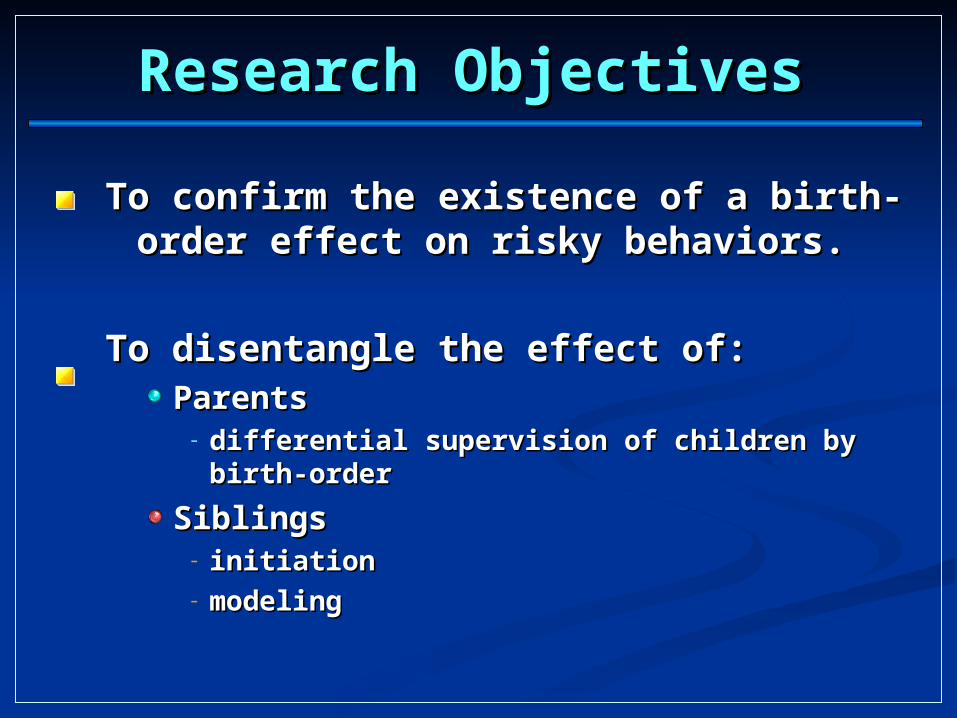
Research ObjectivesResearch Objectives
To confirm the existence of a birth-order To confirm the existence of a birth-order effect on risky behaviors.effect on risky behaviors.
To disentangle the effect of:To disentangle the effect of:ParentsParents- differential supervision of children by birth-orderdifferential supervision of children by birth-order
SiblingsSiblings- initiationinitiation- modelingmodeling

Previous Empirical Findings on Previous Empirical Findings on Economic OutcomesEconomic Outcomes
Birth order and EducationBirth order and EducationOlneck and Bill, 1979Olneck and Bill, 1979 NoNo
Blake, 1981Blake, 1981 NoNo
Hauser and Sewell, 1983Hauser and Sewell, 1983 NoNo
Behrman and Taubman, 1986Behrman and Taubman, 1986YesYes
Birth order and EarningsBirth order and EarningsOlneck and Bill, 1979Olneck and Bill, 1979 NoNo
Behrman and Taubman, 1986Behrman and Taubman, 1986 NoNo
Kessler, 1991Kessler, 1991 NoNo
Sex CompositionSex CompositionButcher and Case, 1994Butcher and Case, 1994
YesYes
Kaestner, 1997Kaestner, 1997 NoNo
Hauser and Kuo, 1998Hauser and Kuo, 1998 NoNo
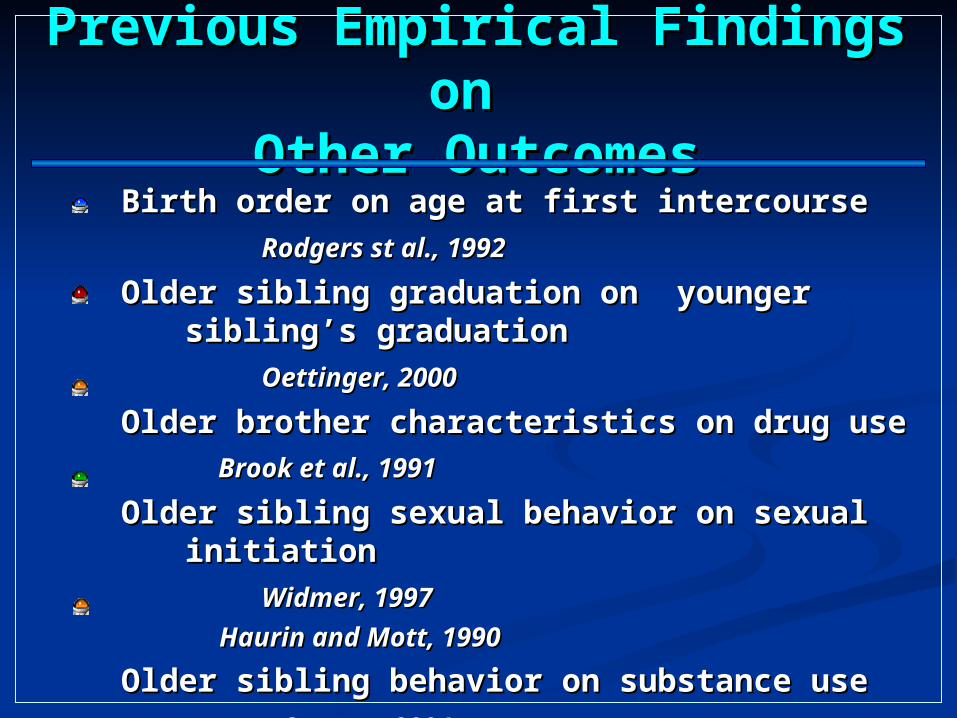
Previous Empirical Findings on Previous Empirical Findings on Other OutcomesOther Outcomes
Birth order on age at first intercourseBirth order on age at first intercourse
Rodgers st al., 1992Rodgers st al., 1992
Older sibling graduation on younger sibling’s Older sibling graduation on younger sibling’s graduationgraduation
Oettinger, 2000Oettinger, 2000
Older brother characteristics on drug useOlder brother characteristics on drug use
Brook et al., 1991Brook et al., 1991
Older sibling sexual behavior on sexual initiationOlder sibling sexual behavior on sexual initiation
Widmer, 1997Widmer, 1997
Haurin and Mott, 1990Haurin and Mott, 1990
Older sibling behavior on substance useOlder sibling behavior on substance use
Ouyang, 2004Ouyang, 2004
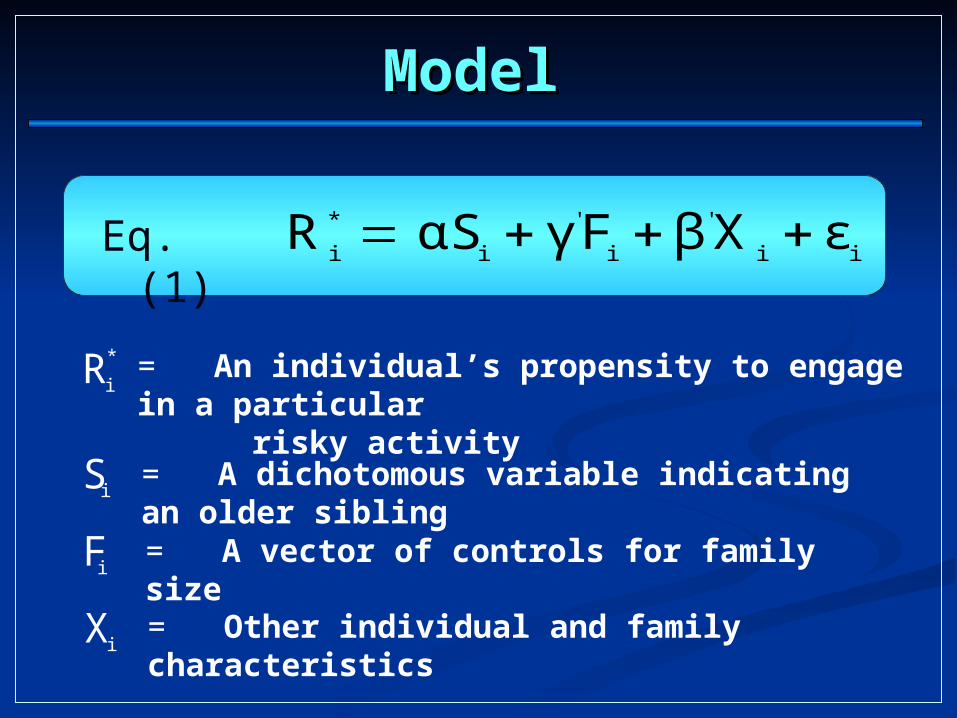
ModelModel
= An individual’s propensity to engage in a particular risky activity
= A dichotomous variable indicating an older sibling
= A vector of controls for family size
= Other individual and family characteristics
ii
'
i
'
i
*
iεXβFγαSR Eq.(1)
*
iR
iS
iF
iX

Figure 1: Older siblings and substanceFigure 1: Older siblings and substance use and sexual behavior use and sexual behavior
0
0.1
0.2
0.3
0.4
0.5
0.6
Smoking Alcohol Marijuana Sexually Active
Pro
bab
iliti
es
No older sibling (Boys) Has older sibling (Boys)
No older sibling (Girls) Has older sibling (Girls)
.380
.484**
.377.435 .426
.214.188
.333.301
.500**
.267**
.400**
.455**.491**
.226**
.346**

Figure 2: Older siblings and criminalFigure 2: Older siblings and criminal and delinquent activities and delinquent activities
0.0
0.1
0.2
0.3
0.4
0.5
Assault Gang Hand gun Vandalism Stealing
Pro
bab
ilit
ies
No older sibling (Boys) Has older sibling (Boys)
No older sibling (Girls) Has older sibling (Girls)

DataData
National Longitudinal Survey of Adolescent National Longitudinal Survey of Adolescent HealthHealth
Over 20,000 adolescentsOver 20,000 adolescents
In grades 7-12 in 1995In grades 7-12 in 1995
Household roster and family structureHousehold roster and family structure
Risk-taking activitiesRisk-taking activities
Family backgroundFamily background
Parental SupervisionParental Supervision
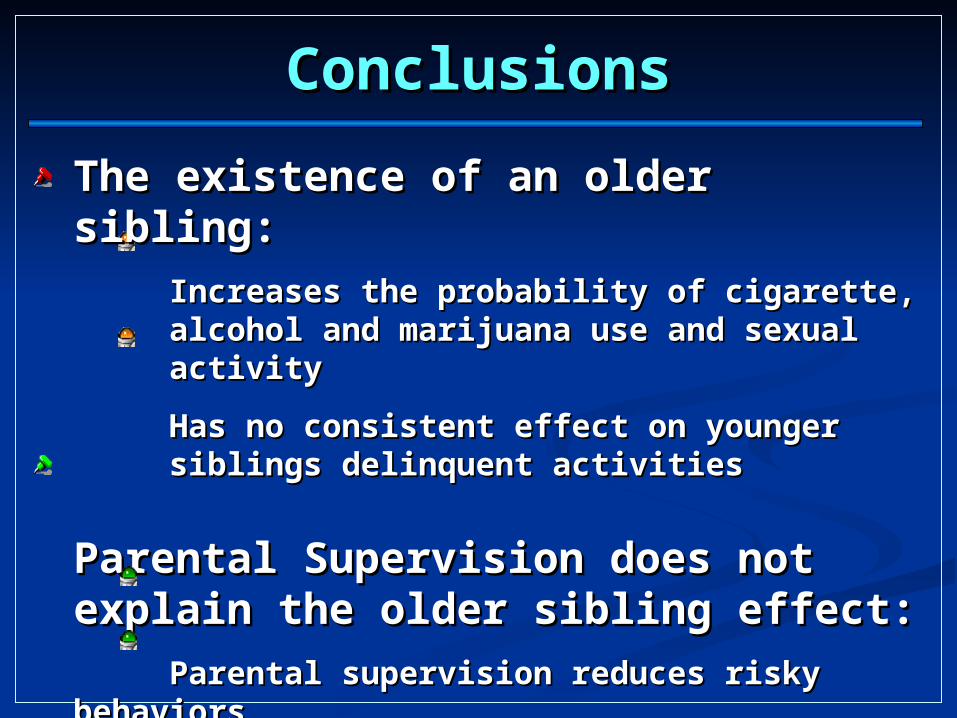
ConclusionsConclusions
The existence of an older sibling:The existence of an older sibling:
Increases the probability of cigarette, alcohol and Increases the probability of cigarette, alcohol and marijuana use and sexual activitymarijuana use and sexual activity
Has no consistent effect on younger siblings delinquent Has no consistent effect on younger siblings delinquent activitiesactivities
Parental Supervision does not explain the Parental Supervision does not explain the older sibling effect:older sibling effect:
Parental supervision reduces risky behaviorsParental supervision reduces risky behaviors
……. But the effect of older siblings remains.. But the effect of older siblings remains.
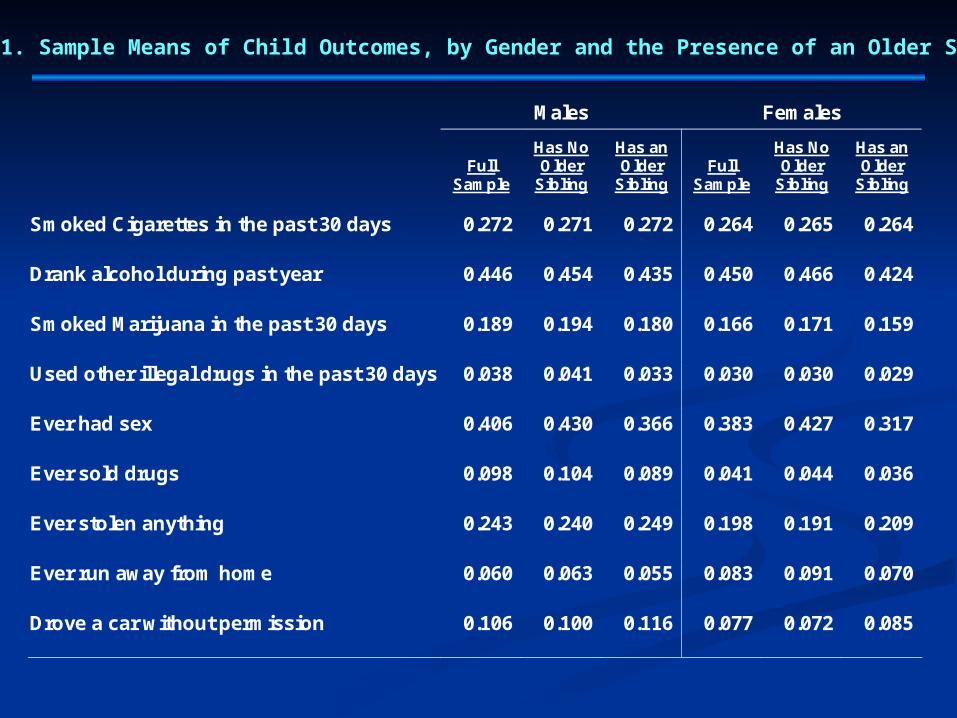
Table 1. Sample Means of Child Outcomes, by Gender and the Presence of an Older Sibling
Males Females
Full Sample
Has No Older
Sibling
Has an Older
Sibling
Full Sample
Has No Older
Sibling
Has an Older
Sibling
Smoked Cigarettes in the past 30 days
0.272 0.271 0.272 0.264 0.265 0.264
Drank alcohol during past year 0.446 0.454 0.435 0.450 0.466 0.424
Smoked Marijuana in the past 30 days 0.189 0.194 0.180 0.166 0.171 0.159
Used other illegal drugs in the past 30 days 0.038 0.041 0.033 0.030 0.030 0.029
Ever had sex
0.406 0.430 0.366 0.383 0.427 0.317
Ever sold drugs
0.098 0.104 0.089 0.041 0.044 0.036
Ever stolen anything
0.243 0.240 0.249 0.198 0.191 0.209
Ever run away from home 0.060 0.063 0.055 0.083 0.091 0.070
Drove a car without permission 0.106 0.100 0.116 0.077 0.072 0.085
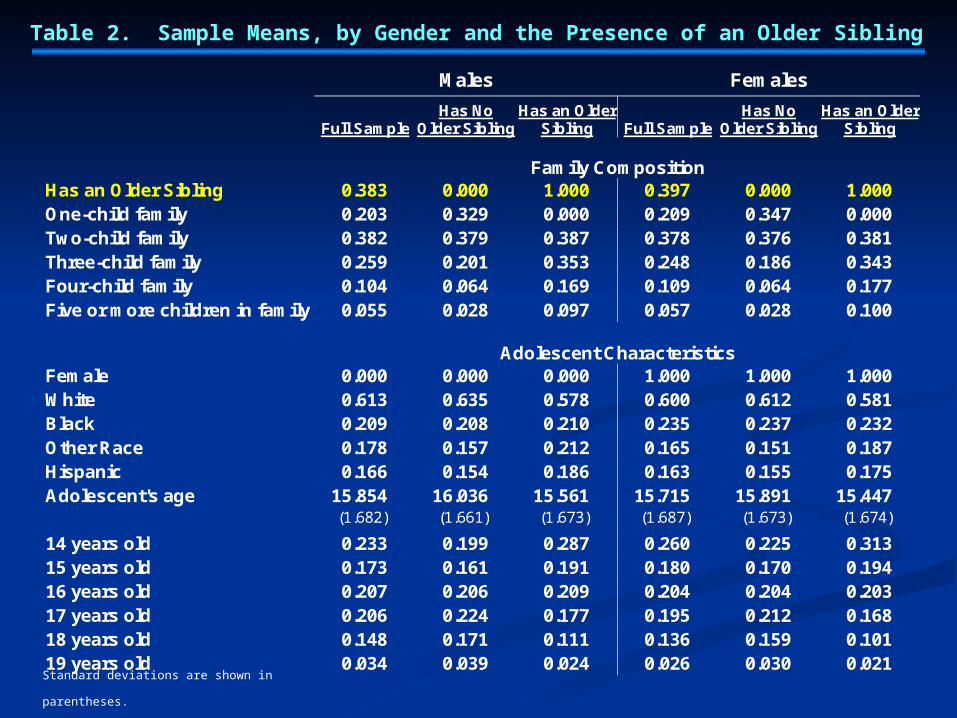
Table 2. Sample Means, by Gender and the Presence of an Older Sibling
Standard deviations are shown in parentheses.
Males Females
Full Sample Has No
Older Sibling Has an Older
Sibling Full Sample Has No
Older Sibling Has an Older
Sibling
Family Composition Has an Older Sibling 0.383 0.000 1.000 0.397 0.000 1.000 One-child family 0.203 0.329 0.000 0.209 0.347 0.000 Two-child family 0.382 0.379 0.387 0.378 0.376 0.381 Three-child family 0.259 0.201 0.353 0.248 0.186 0.343 Four-child family 0.104 0.064 0.169 0.109 0.064 0.177 Five or more children in family 0.055 0.028 0.097 0.057 0.028 0.100
Adolescent Characteristics Female 0.000 0.000 0.000 1.000 1.000 1.000 White 0.613 0.635 0.578 0.600 0.612 0.581 Black 0.209 0.208 0.210 0.235 0.237 0.232 Other Race 0.178 0.157 0.212 0.165 0.151 0.187 Hispanic 0.166 0.154 0.186 0.163 0.155 0.175 Adolescent's age 15.854 16.036 15.561 15.715 15.891 15.447 (1.682) (1.661) (1.673) (1.687) (1.673) (1.674)
14 years old 0.233 0.199 0.287 0.260 0.225 0.313 15 years old 0.173 0.161 0.191 0.180 0.170 0.194 16 years old 0.207 0.206 0.209 0.204 0.204 0.203 17 years old 0.206 0.224 0.177 0.195 0.212 0.168 18 years old 0.148 0.171 0.111 0.136 0.159 0.101 19 years old 0.034 0.039 0.024 0.026 0.030 0.021
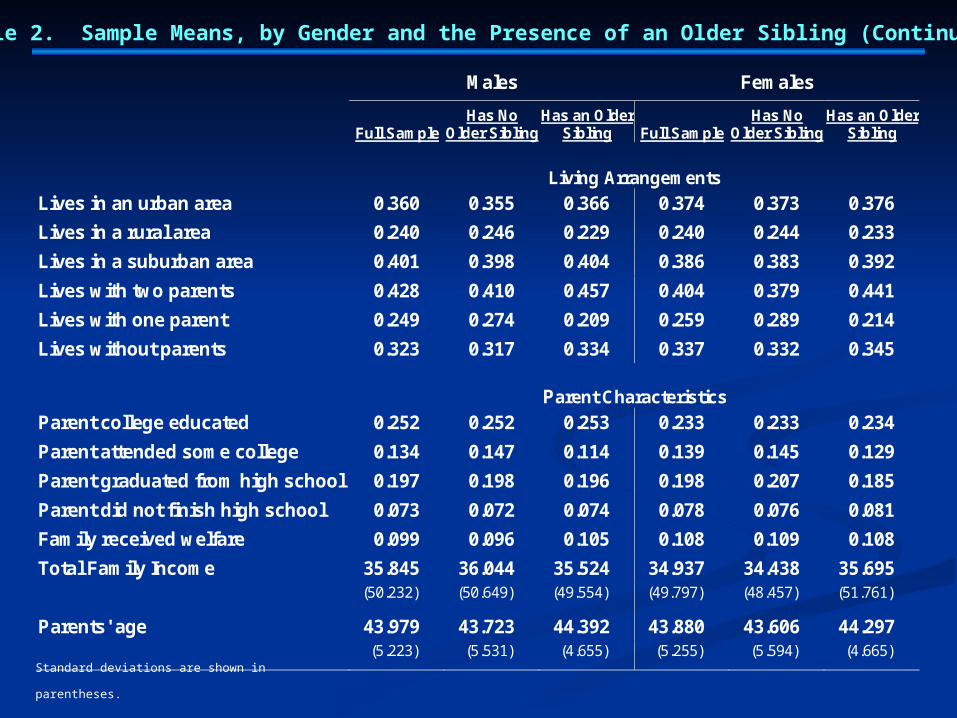
Table 2. Sample Means, by Gender and the Presence of an Older Sibling (Continued)
Standard deviations are shown in parentheses.
Males Females
Full Sample
Has No Older Sibling
Has an Older Sibling Full Sample
Has No Older Sibling
Has an Older Sibling
Living Arrangements
Lives in an urban area 0.360 0.355 0.366 0.374 0.373 0.376
Lives in a rural area 0.240 0.246 0.229 0.240 0.244 0.233
Lives in a suburban area 0.401 0.398 0.404 0.386 0.383 0.392
Lives with two parents 0.428 0.410 0.457 0.404 0.379 0.441
Lives with one parent 0.249 0.274 0.209 0.259 0.289 0.214
Lives without parents 0.323 0.317 0.334 0.337 0.332 0.345
Parent Characteristics Parent college educated 0.252 0.252 0.253 0.233 0.233 0.234
Parent attended some college 0.134 0.147 0.114 0.139 0.145 0.129
Parent graduated from high school 0.197 0.198 0.196 0.198 0.207 0.185
Parent did not finish high school 0.073 0.072 0.074 0.078 0.076 0.081
Family received welfare 0.099 0.096 0.105 0.108 0.109 0.108
Total Family Income 35.845 36.044 35.524 34.937 34.438 35.695 (50.232) (50.649) (49.554) (49.797) (48.457) (51.761)
Parents' age 43.979 43.723 44.392 43.880 43.606 44.297 (5.223) (5.531) (4.655) (5.255) (5.594) (4.665)

Table 3a. Determinants of Substance Use and Sexual Activity – Females
Smoked Cigarettes in the
past 30 days
Drank alcohol during past
year
Smoked Marijuana in the
past 30 days
Used other illegal drugs in
the past 30 days
Ever had sex
Has an Older Sibling 0.055*** 0.032** 0.026*** 0.006*** 0.000 (0.010) (0.013) (0.008) (0.002) (0.013)
One-child family 0.113*** 0.134*** 0.082*** 0.020*** 0.175*** (0.020) (0.021) (0.016) (0.006) (0.020)
Two-child family 0.042*** 0.065*** 0.026** 0.008** 0.082*** (0.014) (0.016) (0.011) (0.004) (0.017)
Three-child family 0.042*** 0.034** 0.028** 0.008** 0.054*** (0.014) (0.015) (0.011) (0.004) (0.016)
Black -0.221*** -0.168*** -0.066*** -0.034*** 0.111*** (0.015) (0.017) (0.017) (0.003) (0.018)
Other Race -0.085*** -0.077*** -0.028* -0.006** -0.072*** (0.018) (0.027) (0.017) (0.003) (0.019)
Hispanic -0.083*** 0.003 0.002 0.005 -0.013 (0.022) (0.029) (0.024) (0.008) (0.021)
Age 0.024*** 0.062*** 0.020*** 0.002*** 0.121*** (0.004) (0.005) (0.003) (0.001) (0.004)
Lives in an urban area -0.010 -0.043*** -0.019* -0.009*** 0.004 (0.013) (0.012) (0.010) (0.002) (0.013)
Lives in a rural area -0.005 -0.053*** -0.046*** -0.004 0.003 (0.012) (0.014) (0.011) (0.003) (0.015)
Lives with one parent 0.065*** 0.070*** 0.069*** 0.013*** 0.086*** (0.009) (0.011) (0.010) (0.003) (0.012)
Lives without parents 0.017 0.066** 0.039** 0.009 0.031 (0.023) (0.028) (0.018) (0.007) (0.025)

Table 3a. Determinants of Substance Use and Sexual Activity – Females (Continued)
Standard errors are shown in parentheses. Statistically significant at the ***99%, **90%, and *90% confidence level.
Controls also include dichotomous variables identifying missing values for categorical variables.
Smoked Cigarettes in the past 30
days
Drank alcohol
during past year
Smoked Marijuana in the past 30
days
Used other illegal drugs in the past 30
days
Ever had sex
Parent attended some college 0.029** 0.061*** 0.021 0.003 0.067***
(0.014) (0.016) (0.013) (0.003) (0.014)
Parent graduated from high 0.057*** 0.022 -0.000 0.000 0.095*** School
(0.012) (0.017) (0.011) (0.003) (0.015)
Parent did not finish high 0.030* -0.017 -0.018 -0.006** 0.079*** School
(0.018) (0.022) (0.014) (0.003) (0.020)
Family received welfare 0.059*** -0.019 0.037*** 0.003 0.046**
(0.014) (0.016) (0.012) (0.004) (0.019)
Total Family Income 0.000 0.000** 0.000* -0.000 -0.000**
(0.000) (0.000) (0.000) (0.000) (0.000)
Parents' age -0.001* -0.002*** -0.001 -0.001*** -0.003***
(0.001) (0.001) (0.001) (0.000) (0.001)
Wave One -0.009 0.054*** -0.081*** 0.016*** 0.019
(0.016) (0.020) (0.017) (0.005) (0.020)
Number of observations 16461 16461 16461 16461 16461
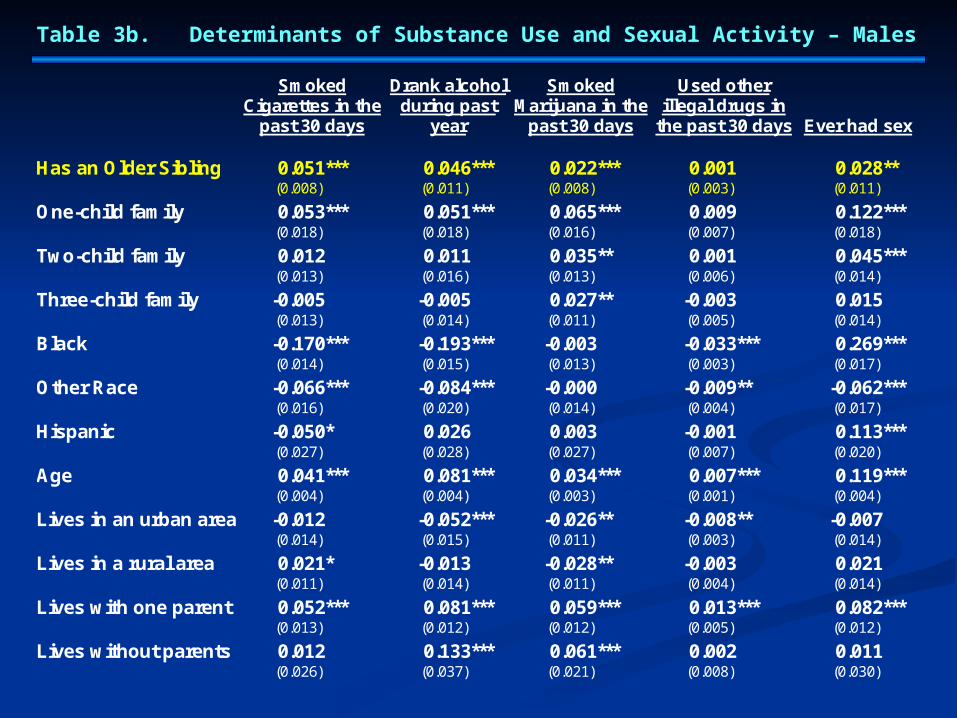
Table 3b. Determinants of Substance Use and Sexual Activity – Males
Smoked Cigarettes in the
past 30 days
Drank alcohol during past
year
Smoked Marijuana in the
past 30 days
Used other illegal drugs in
the past 30 days
Ever had sex
Has an Older Sibling 0.051*** 0.046*** 0.022*** 0.001 0.028** (0.008) (0.011) (0.008) (0.003) (0.011)
One-child family 0.053*** 0.051*** 0.065*** 0.009 0.122*** (0.018) (0.018) (0.016) (0.007) (0.018)
Two-child family 0.012 0.011 0.035** 0.001 0.045*** (0.013) (0.016) (0.013) (0.006) (0.014)
Three-child family -0.005 -0.005 0.027** -0.003 0.015 (0.013) (0.014) (0.011) (0.005) (0.014)
Black -0.170*** -0.193*** -0.003 -0.033*** 0.269*** (0.014) (0.015) (0.013) (0.003) (0.017)
Other Race -0.066*** -0.084*** -0.000 -0.009** -0.062*** (0.016) (0.020) (0.014) (0.004) (0.017)
Hispanic -0.050* 0.026 0.003 -0.001 0.113*** (0.027) (0.028) (0.027) (0.007) (0.020)
Age 0.041*** 0.081*** 0.034*** 0.007*** 0.119*** (0.004) (0.004) (0.003) (0.001) (0.004)
Lives in an urban area -0.012 -0.052*** -0.026** -0.008** -0.007 (0.014) (0.015) (0.011) (0.003) (0.014)
Lives in a rural area 0.021* -0.013 -0.028** -0.003 0.021 (0.011) (0.014) (0.011) (0.004) (0.014)
Lives with one parent 0.052*** 0.081*** 0.059*** 0.013*** 0.082*** (0.013) (0.012) (0.012) (0.005) (0.012)
Lives without parents 0.012 0.133*** 0.061*** 0.002 0.011 (0.026) (0.037) (0.021) (0.008) (0.030)
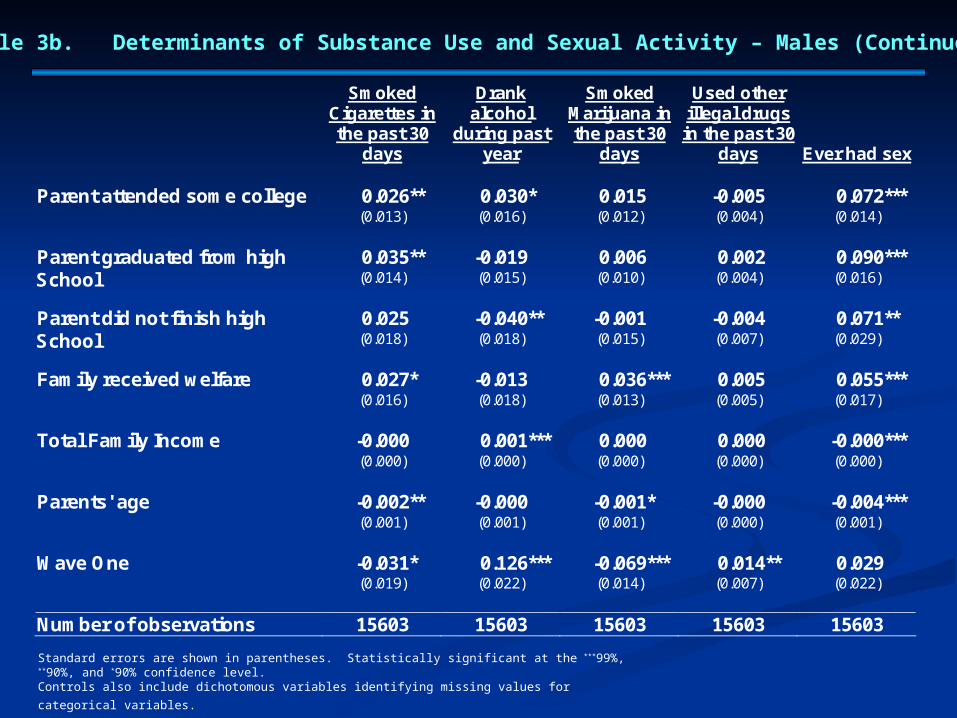
Table 3b. Determinants of Substance Use and Sexual Activity – Males (Continued)
Smoked Cigarettes in the past 30
days
Drank alcohol
during past year
Smoked Marijuana in the past 30
days
Used other illegal drugs in the past 30
days
Ever had sex
Parent attended some college 0.026** 0.030* 0.015 -0.005 0.072***
(0.013) (0.016) (0.012) (0.004) (0.014)
Parent graduated from high 0.035** -0.019 0.006 0.002 0.090*** School
(0.014) (0.015) (0.010) (0.004) (0.016)
Parent did not finish high 0.025 -0.040** -0.001 -0.004 0.071** School
(0.018) (0.018) (0.015) (0.007) (0.029)
Family received welfare 0.027* -0.013 0.036*** 0.005 0.055***
(0.016) (0.018) (0.013) (0.005) (0.017)
Total Family Income -0.000 0.001*** 0.000 0.000 -0.000***
(0.000) (0.000) (0.000) (0.000) (0.000)
Parents' age -0.002** -0.000 -0.001* -0.000 -0.004***
(0.001) (0.001) (0.001) (0.000) (0.001)
Wave One -0.031* 0.126*** -0.069*** 0.014** 0.029
(0.019) (0.022) (0.014) (0.007) (0.022)
Number of observations 15603 15603 15603 15603 15603 Standard errors are shown in parentheses. Statistically significant at the ***99%, **90%, and *90% confidence level.
Controls also include dichotomous variables identifying missing values for categorical variables.
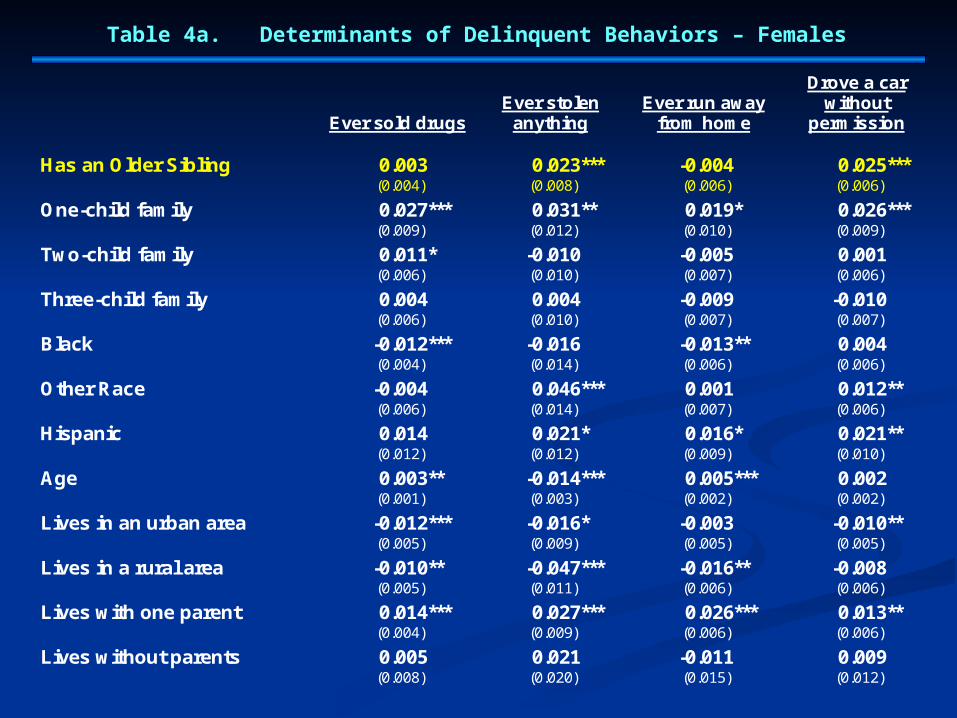
Table 4a. Determinants of Delinquent Behaviors – Females
Ever sold drugs
Ever stolen anything
Ever run away from home
Drove a car without
permission
Has an Older Sibling 0.003 0.023*** -0.004 0.025*** (0.004) (0.008) (0.006) (0.006)
One-child family 0.027*** 0.031** 0.019* 0.026*** (0.009) (0.012) (0.010) (0.009)
Two-child family 0.011* -0.010 -0.005 0.001 (0.006) (0.010) (0.007) (0.006)
Three-child family 0.004 0.004 -0.009 -0.010 (0.006) (0.010) (0.007) (0.007)
Black -0.012*** -0.016 -0.013** 0.004 (0.004) (0.014) (0.006) (0.006)
Other Race -0.004 0.046*** 0.001 0.012** (0.006) (0.014) (0.007) (0.006)
Hispanic 0.014 0.021* 0.016* 0.021** (0.012) (0.012) (0.009) (0.010)
Age 0.003** -0.014*** 0.005*** 0.002 (0.001) (0.003) (0.002) (0.002)
Lives in an urban area -0.012*** -0.016* -0.003 -0.010** (0.005) (0.009) (0.005) (0.005)
Lives in a rural area -0.010** -0.047*** -0.016** -0.008 (0.005) (0.011) (0.006) (0.006)
Lives with one parent 0.014*** 0.027*** 0.026*** 0.013** (0.004) (0.009) (0.006) (0.006)
Lives without parents 0.005 0.021 -0.011 0.009 (0.008) (0.020) (0.015) (0.012)

Table 4a. Determinants of Delinquent Behaviors – Females (Continued)
Ever sold drugs
Ever stolen anything
Ever run away from home
Drove a car without
permission
Parent attended some college 0.010* 0.034*** 0.017** 0.010*
(0.006) (0.011) (0.008) (0.006)
Parent graduated from high 0.002 0.023** 0.022*** -0.003 School
(0.004) (0.011) (0.007) (0.006)
Parent did not finish high -0.004 0.011 0.013 -0.012* School
(0.006) (0.015) (0.009) (0.008)
Family received welfare 0.015** 0.035*** 0.024*** 0.021**
(0.007) (0.010) (0.008) (0.009)
Total Family Income 0.000 -0.000 -0.000 -0.000
(0.000) (0.000) (0.000) (0.000)
Parents' age 0.000 0.000 -0.001** 0.001**
(0.000) (0.001) (0.000) (0.000)
Wave One 0.012* 0.041*** 0.019* 0.028***
(0.007) (0.016) (0.010) (0.009)
Number of observations 16461 16461 16461 16461
Standard errors are shown in parentheses. Statistically significant at the ***99%, **90%, and *90% confidence level.
Controls also include dichotomous variables identifying missing values for categorical variables.
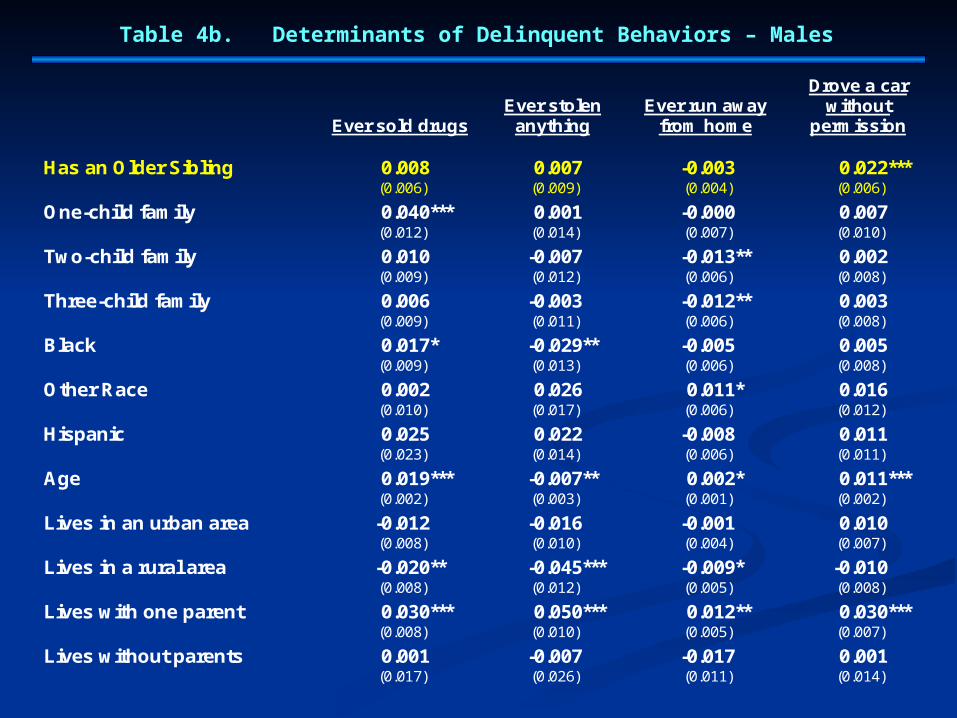
Table 4b. Determinants of Delinquent Behaviors – Males
Ever sold drugs
Ever stolen anything
Ever run away from home
Drove a car without
permission
Has an Older Sibling 0.008 0.007 -0.003 0.022*** (0.006) (0.009) (0.004) (0.006)
One-child family 0.040*** 0.001 -0.000 0.007 (0.012) (0.014) (0.007) (0.010)
Two-child family 0.010 -0.007 -0.013** 0.002 (0.009) (0.012) (0.006) (0.008)
Three-child family 0.006 -0.003 -0.012** 0.003 (0.009) (0.011) (0.006) (0.008)
Black 0.017* -0.029** -0.005 0.005 (0.009) (0.013) (0.006) (0.008)
Other Race 0.002 0.026 0.011* 0.016 (0.010) (0.017) (0.006) (0.012)
Hispanic 0.025 0.022 -0.008 0.011 (0.023) (0.014) (0.006) (0.011)
Age 0.019*** -0.007** 0.002* 0.011*** (0.002) (0.003) (0.001) (0.002)
Lives in an urban area -0.012 -0.016 -0.001 0.010 (0.008) (0.010) (0.004) (0.007)
Lives in a rural area -0.020** -0.045*** -0.009* -0.010 (0.008) (0.012) (0.005) (0.008)
Lives with one parent 0.030*** 0.050*** 0.012** 0.030*** (0.008) (0.010) (0.005) (0.007)
Lives without parents 0.001 -0.007 -0.017 0.001 (0.017) (0.026) (0.011) (0.014)
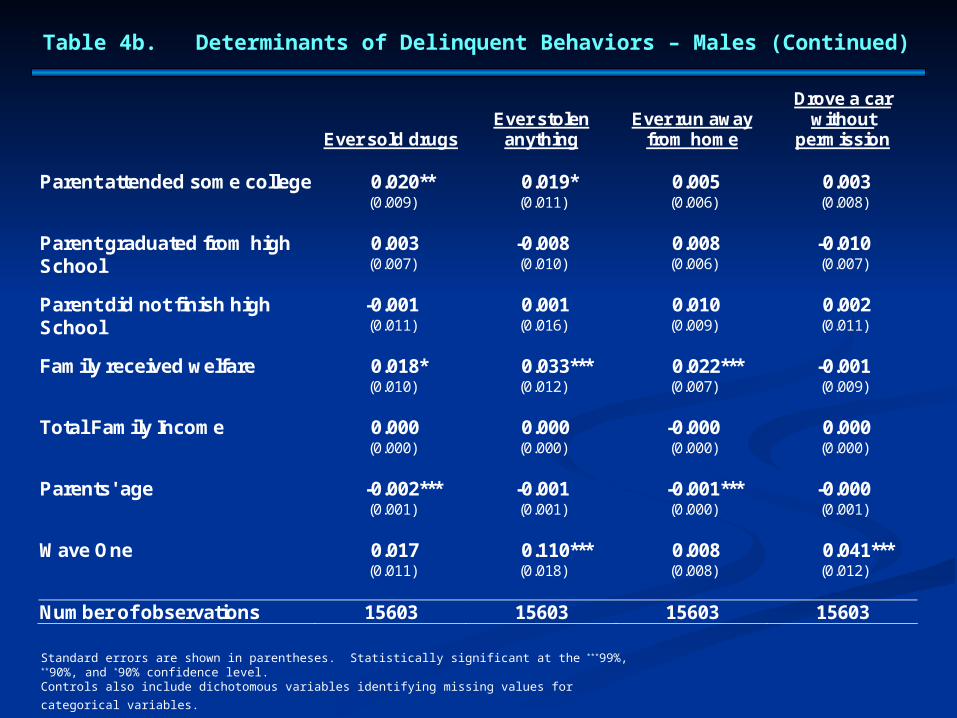
Table 4b. Determinants of Delinquent Behaviors – Males (Continued)
Ever sold drugs
Ever stolen anything
Ever run away from home
Drove a car without
permission
Parent attended some college 0.020** 0.019* 0.005 0.003
(0.009) (0.011) (0.006) (0.008)
Parent graduated from high 0.003 -0.008 0.008 -0.010 School
(0.007) (0.010) (0.006) (0.007)
Parent did not finish high -0.001 0.001 0.010 0.002 School
(0.011) (0.016) (0.009) (0.011)
Family received welfare 0.018* 0.033*** 0.022*** -0.001
(0.010) (0.012) (0.007) (0.009)
Total Family Income 0.000 0.000 -0.000 0.000
(0.000) (0.000) (0.000) (0.000)
Parents' age -0.002*** -0.001 -0.001*** -0.000
(0.001) (0.001) (0.000) (0.001)
Wave One 0.017 0.110*** 0.008 0.041***
(0.011) (0.018) (0.008) (0.012)
Number of observations 15603 15603 15603 15603
Standard errors are shown in parentheses. Statistically significant at the ***99%, **90%, and *90% confidence level.
Controls also include dichotomous variables identifying missing values for categorical variables.
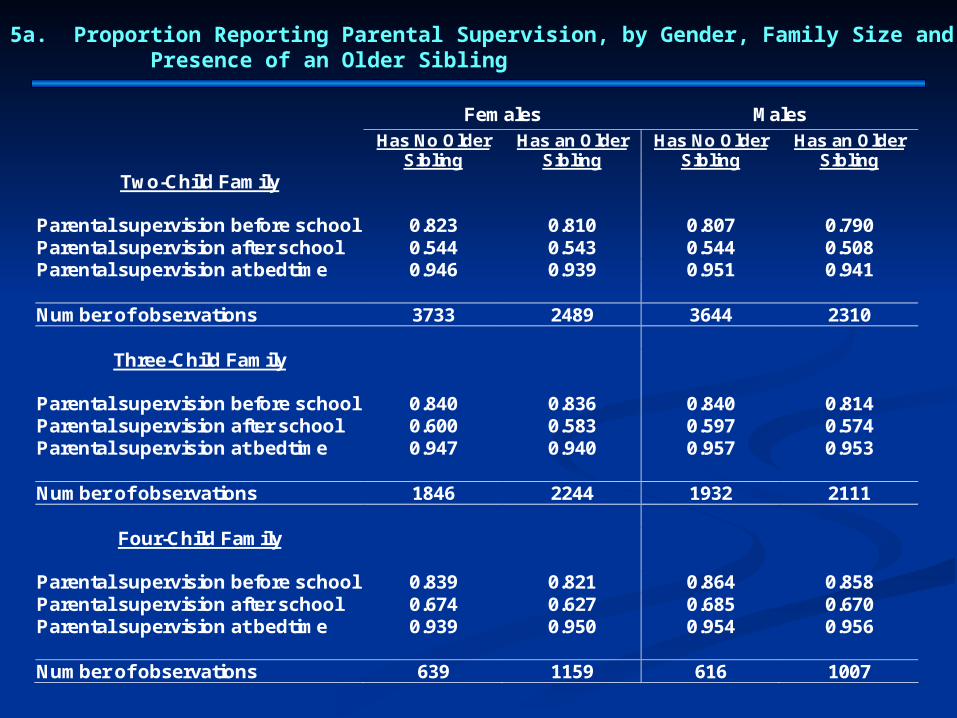
Table 5a. Proportion Reporting Parental Supervision, by Gender, Family Size and the Presence of an Older Sibling
Females Males
Has No Older
Sibling Has an Older
Sibling Has No Older
Sibling Has an Older
Sibling Two-Child Family
Parental supervision before school 0.823 0.810 0.807 0.790 Parental supervision after school 0.544 0.543 0.544 0.508 Parental supervision at bedtime 0.946 0.939 0.951 0.941 Number of observations 3733 2489 3644 2310
Three-Child Family
Parental supervision before school 0.840 0.836 0.840 0.814 Parental supervision after school 0.600 0.583 0.597 0.574 Parental supervision at bedtime 0.947 0.940 0.957 0.953 Number of observations 1846 2244 1932 2111
Four-Child Family
Parental supervision before school 0.839 0.821 0.864 0.858 Parental supervision after school 0.674 0.627 0.685 0.670 Parental supervision at bedtime 0.939 0.950 0.954 0.956 Number of observations 639 1159 616 1007

Table 5a. Proportion Reporting Parental Supervision, by Gender, Family Size and the Presence of an Older Sibling: Two Child Family
Females Males
Has No Older
Sibling Has an Older
Sibling Has No Older
Sibling Has an Older
Sibling
Parental supervision before school 0.823 0.810 0.807 0.790
Parental supervision after school 0.544 0.543 0.544 0.508
Parental supervision at bedtime 0.946 0.939 0.951 0.941
Number of observations 3733 2489 3644 2310
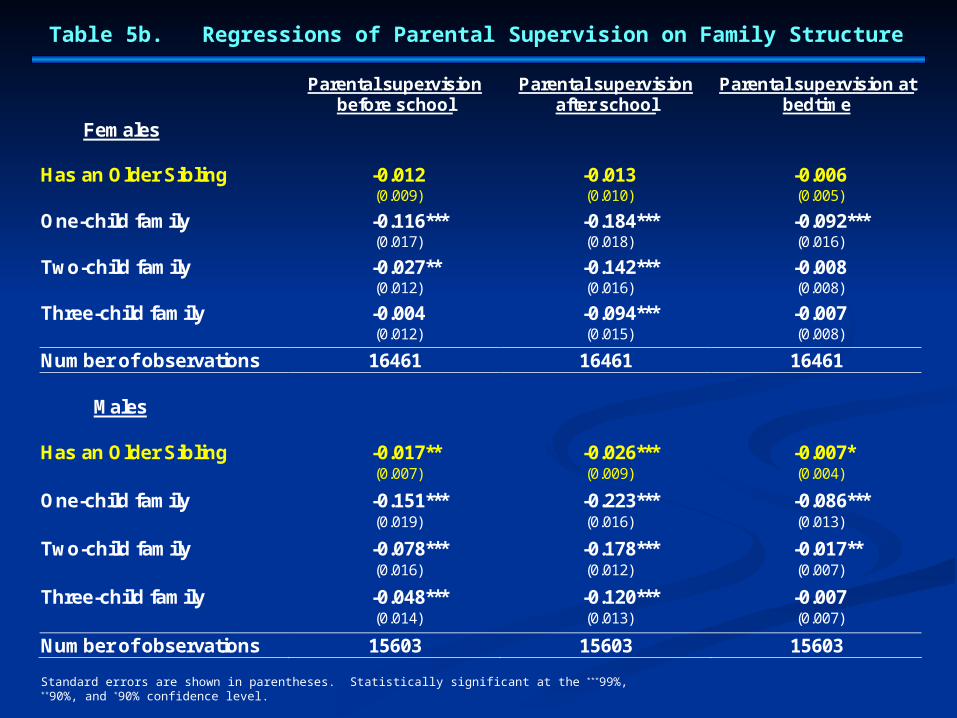
Table 5b. Regressions of Parental Supervision on Family Structure
Parental supervision
before school Parental supervision
after school Parental supervision at
bedtime
Females
Has an Older Sibling -0.012 -0.013 -0.006 (0.009) (0.010) (0.005)
One-child family -0.116*** -0.184*** -0.092*** (0.017) (0.018) (0.016)
Two-child family -0.027** -0.142*** -0.008 (0.012) (0.016) (0.008)
Three-child family -0.004 -0.094*** -0.007 (0.012) (0.015) (0.008)
Number of observations 16461 16461 16461
Males
Has an Older Sibling -0.017** -0.026*** -0.007* (0.007) (0.009) (0.004)
One-child family -0.151*** -0.223*** -0.086*** (0.019) (0.016) (0.013)
Two-child family -0.078*** -0.178*** -0.017** (0.016) (0.012) (0.007)
Three-child family -0.048*** -0.120*** -0.007 (0.014) (0.013) (0.007)
Number of observations 15603 15603 15603 Standard errors are shown in parentheses. Statistically significant at the ***99%, **90%, and *90% confidence level.
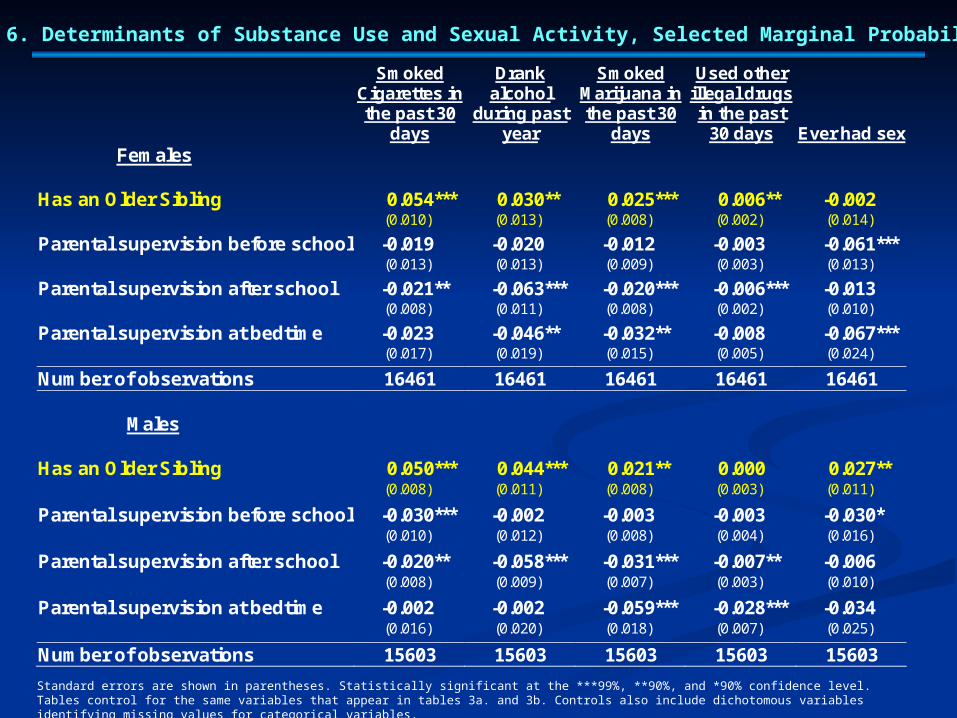
Table 6. Determinants of Substance Use and Sexual Activity, Selected Marginal Probabilities
Smoked Cigarettes in the past 30
days
Drank alcohol
during past year
Smoked Marijuana in the past 30
days
Used other illegal drugs in the past
30 days Ever had sex Females Has an Older Sibling 0.054*** 0.030** 0.025*** 0.006** -0.002 (0.010) (0.013) (0.008) (0.002) (0.014)
Parental supervision before school -0.019 -0.020 -0.012 -0.003 -0.061*** (0.013) (0.013) (0.009) (0.003) (0.013)
Parental supervision after school -0.021** -0.063*** -0.020*** -0.006*** -0.013 (0.008) (0.011) (0.008) (0.002) (0.010)
Parental supervision at bedtime -0.023 -0.046** -0.032** -0.008 -0.067*** (0.017) (0.019) (0.015) (0.005) (0.024)
Number of observations 16461 16461 16461 16461 16461
Males Has an Older Sibling 0.050*** 0.044*** 0.021** 0.000 0.027** (0.008) (0.011) (0.008) (0.003) (0.011)
Parental supervision before school -0.030*** -0.002 -0.003 -0.003 -0.030* (0.010) (0.012) (0.008) (0.004) (0.016)
Parental supervision after school -0.020** -0.058*** -0.031*** -0.007** -0.006 (0.008) (0.009) (0.007) (0.003) (0.010)
Parental supervision at bedtime -0.002 -0.002 -0.059*** -0.028*** -0.034 (0.016) (0.020) (0.018) (0.007) (0.025)
Number of observations 15603 15603 15603 15603 15603 Standard errors are shown in parentheses. Statistically significant at the ***99%, **90%, and *90% confidence level.Tables control for the same variables that appear in tables 3a. and 3b. Controls also include dichotomous variables identifying missing values for categorical variables.

Table 7. Determinants of Delinquent Behaviors, Selected Marginal Probabilities
Standard errors are shown in parentheses. Statistically significant at the ***99%, **90%, and *90% confidence level.Tables control for the same variables that appear in tables 4a. and 4b. Controls also include dichotomous variables identifying missing values for categorical variables.
Ever sold drugs Ever stolen
anything Ever run away
from home
Drove a car without
permission Females Has an Older Sibling 0.002 0.021*** -0.005 0.024*** (0.003) (0.008) (0.006) (0.006)
Parental supervision before school -0.008** -0.010 -0.016*** -0.009 (0.004) (0.009) (0.005) (0.005)
Parental supervision after school -0.005 -0.044*** -0.002 -0.014*** (0.004) (0.010) (0.004) (0.005)
Parental supervision at bedtime -0.021*** -0.028* -0.035*** -0.019* (0.008) (0.015) (0.013) (0.011)
Number of observations 16461 16461 16461 16461
Males Has an Older Sibling 0.007 0.005 -0.004 0.021*** (0.006) (0.009) (0.004) (0.006)
Parental supervision before school -0.010* 0.002 -0.006 -0.002 (0.006) (0.009) (0.004) (0.007)
Parental supervision after school -0.019*** -0.043*** -0.011*** -0.012** (0.005) (0.008) (0.004) (0.005)
Parental supervision at bedtime -0.038*** -0.024 -0.033*** -0.044*** (0.012) (0.020) (0.010) (0.014)
Number of observations 15603 15603 15603 15603

Table 8. Regressions of Parental Supervision on Sibling Gender and Family Structure
Parental supervision
before school Parental supervision
after school Parental supervision at
bedtime
Females
Has an Older Brother 0.009 0.006 -0.005 (0.009) (0.011) (0.006)
Has an Older Sister -0.027*** -0.023** -0.012 (0.010) (0.011) (0.007)
One-child family -0.116*** -0.183*** -0.097*** (0.017) (0.019) (0.017)
Two-child family -0.029** -0.143*** -0.011 (0.012) (0.016) (0.008)
Three-child family -0.004 -0.094*** -0.008 (0.012) (0.015) (0.008)
Number of observations 16461 16461 16461
Males
Has an Older Brother -0.014* -0.023** -0.005 (0.008) (0.011) (0.005)
Has an Older Sister -0.019* -0.007 -0.008 (0.010) (0.011) (0.006)
One-child family -0.154*** -0.220*** -0.087*** (0.020) (0.016) (0.013)
Two-child family -0.080*** -0.178*** -0.018** (0.016) (0.013) (0.008)
Three-child family -0.050*** -0.120*** -0.007 (0.014) (0.014) (0.007)
Number of observations 15603 15603 15603
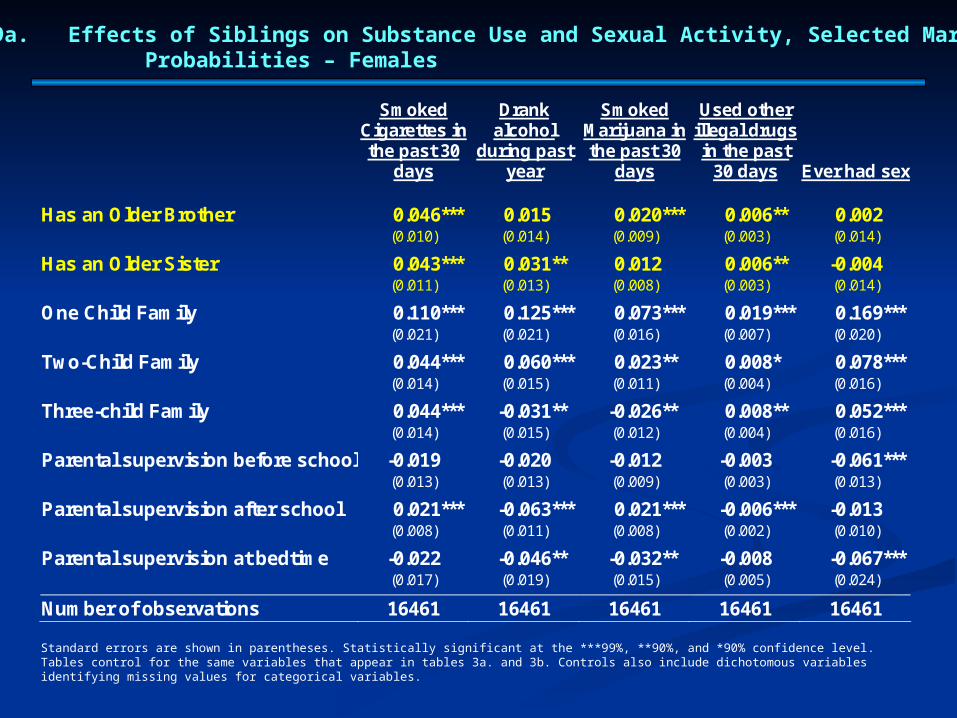
Table 9a. Effects of Siblings on Substance Use and Sexual Activity, Selected Marginal- Probabilities – Females
Standard errors are shown in parentheses. Statistically significant at the ***99%, **90%, and *90% confidence level.Tables control for the same variables that appear in tables 3a. and 3b. Controls also include dichotomous variables identifying missing values for categorical variables.
Smoked Cigarettes in the past 30
days
Drank alcohol
during past year
Smoked Marijuana in the past 30
days
Used other illegal drugs in the past
30 days
Ever had sex
Has an Older Brother 0.046*** 0.015 0.020*** 0.006** 0.002 (0.010) (0.014) (0.009) (0.003) (0.014)
Has an Older Sister 0.043*** 0.031** 0.012 0.006** -0.004 (0.011) (0.013) (0.008) (0.003) (0.014)
One Child Family 0.110*** 0.125*** 0.073*** 0.019*** 0.169*** (0.021) (0.021) (0.016) (0.007) (0.020)
Two-Child Family 0.044*** 0.060*** 0.023** 0.008* 0.078*** (0.014) (0.015) (0.011) (0.004) (0.016)
Three-child Family 0.044*** -0.031** -0.026** 0.008** 0.052*** (0.014) (0.015) (0.012) (0.004) (0.016)
Parental supervision before school -0.019 -0.020 -0.012 -0.003 -0.061*** (0.013) (0.013) (0.009) (0.003) (0.013)
Parental supervision after school 0.021*** -0.063*** 0.021*** -0.006*** -0.013 (0.008) (0.011) (0.008) (0.002) (0.010)
Parental supervision at bedtime -0.022 -0.046** -0.032** -0.008 -0.067*** (0.017) (0.019) (0.015) (0.005) (0.024)
Number of observations 16461 16461 16461 16461 16461
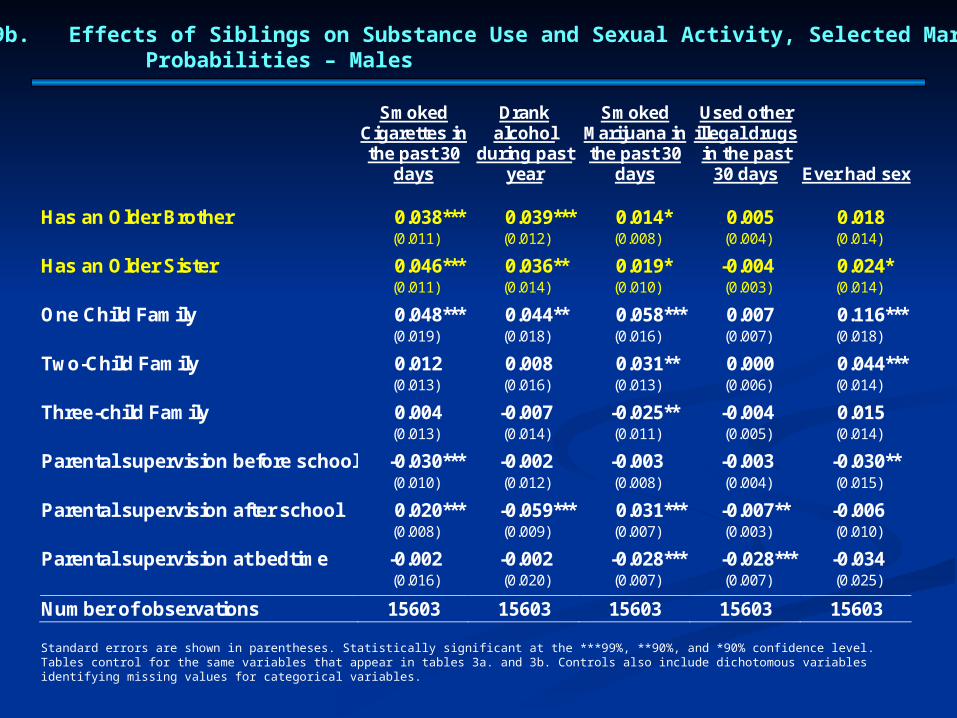
Table 9b. Effects of Siblings on Substance Use and Sexual Activity, Selected Marginal- Probabilities – Males
Standard errors are shown in parentheses. Statistically significant at the ***99%, **90%, and *90% confidence level.Tables control for the same variables that appear in tables 3a. and 3b. Controls also include dichotomous variables identifying missing values for categorical variables.
Smoked Cigarettes in the past 30
days
Drank alcohol
during past year
Smoked Marijuana in the past 30
days
Used other illegal drugs in the past
30 days
Ever had sex
Has an Older Brother 0.038*** 0.039*** 0.014* 0.005 0.018 (0.011) (0.012) (0.008) (0.004) (0.014)
Has an Older Sister 0.046*** 0.036** 0.019* -0.004 0.024* (0.011) (0.014) (0.010) (0.003) (0.014)
One Child Family 0.048*** 0.044** 0.058*** 0.007 0.116*** (0.019) (0.018) (0.016) (0.007) (0.018)
Two-Child Family 0.012 0.008 0.031** 0.000 0.044*** (0.013) (0.016) (0.013) (0.006) (0.014)
Three-child Family 0.004 -0.007 -0.025** -0.004 0.015 (0.013) (0.014) (0.011) (0.005) (0.014)
Parental supervision before school -0.030*** -0.002 -0.003 -0.003 -0.030** (0.010) (0.012) (0.008) (0.004) (0.015)
Parental supervision after school 0.020*** -0.059*** 0.031*** -0.007** -0.006 (0.008) (0.009) (0.007) (0.003) (0.010)
Parental supervision at bedtime -0.002 -0.002 -0.028*** -0.028*** -0.034 (0.016) (0.020) (0.007) (0.007) (0.025)
Number of observations 15603 15603 15603 15603 15603