Embed Size (px)
Citation preview

Innovative behaviour of Chinese manufacturing firms
1
The Effect of Internal and External Factors on Innovative
Behaviour of Chinese Manufacturing Firms
Xing SHI
Abstract: Business enterprises are playing a significant role in promoting China’s
national capacity of innovation. However, information about China’s innovative
activities is still very limited, especially at the micro level. This paper aims to
investigate both the internal and external determinants that affect firms’ innovative
behaviour by using a rich set of firm-level data and municipal-level data. It provides
interesting insight into firms’ innovative behaviour embedded in different local
systems. The analysis is based on a theoretical framework combining resource-based
views (RBV) and the theory of regional innovation system (RIS). The findings in this
study have important implications not only for China but also for the rest of the world
as Chinese firms become increasingly active internationally.
Keywords: Innovative Behaviour; Manufacturing Firms; China

Innovative behaviour of Chinese manufacturing firms
2
The Effect of Internal and External Factors on Innovative
Behaviour of Chinese Manufacturing Firms
1. Introduction
Doubtlessly, China has experienced impressive economic performance over the
last decades. To ensure broad, sustainable and equitable growth in the years to come,
however, further reforms are required and China is now at its crossroads. In the past
five years, obviously, growth has slackened. OECD projections suggest that over the
medium-term this slowdown is set to continue, partly because the working age
population will soon start to fall, and also the return to investment is diminishing.
Against this backdrop, concerns have been voiced that the Chinese economy may fail
to catch up as rapidly as in the past with the leading world economics, and may get
stuck in a so-called “middle-income trap” (OECD 2013). This trend is not surprising
for growth is generally bound to slow once a catching-up economy has reaped the
lower-hanging fruits of technology imports and urbanization. This therefore makes
nurturing innovation becomes increasingly important as the technologies used in
China catching up with global frontiers.
Building of a broad-spectrum system of innovation is widely viewed as the
central plank of growth strategies for industrialized and industrializing countries alike
(Yusuf, Wang and Nabeshima 2009; Zhang et al. 2009). The government of China is
fully aware of the critical role of innovation in economic performance especially a
sustainable development. In early 2006, after several years of intensive consultation
and research, the government announced National Program for Medium and Long
Term Development of Science and Technology (2006-2020) which established an
innovation strategy for the next 15 years. It consists four pillars: (1) “indigenous
innovation”, increasing domestic innovation capacity; (2) a “leap-forward in key
areas”, concentrating resources to achieve breakthrough in priority areas; (3)

Innovative behaviour of Chinese manufacturing firms
3
“sustaining development”, meeting the most urgent demands of economic and social
development; (4) “setting the stage for the future”, getting prepared for future
development with a long-term vision. The first pillar, indigenous innovation, codifies
the determination to reduce China’s dependence on foreign technology and is the
central theme of the new strategy. Business enterprises in technological innovation are
greater emphasized while the notion of indigenous innovation is complemented in the
2006 S&T program.
Despite business enterprises are so important in national capacity of innovation
and further a sustainable development, information about China’s innovative activities,
in particular at the micro level, is still very limited. Earlier studies are often based on
aggregate statistics (Zhang 2005; Wu 2006). A few recent empirical studies have
focused on either a particular region or an industrial sector. For example, Alcorta et al.
(2009) conducted a survey of 360 firms in China’s Jiangsu province and examined the
impact of individual, managerial and cognitive factors on knowledge generation at the
firm level. For the sector level studies, Xi et al. (2009) presented a case study of the
automobile industry and Li and Xin (2009) investigated the colour TV sector in China.
More recently, studies using Chinese firm-level data emerged. Jefferson et al (2006)
estimated knowledge production function and examined the determinants of R&D
intensity and the impact of innovation on performance using firm-level data during
1995-1999. Girma et al. (2009) explored the impact of FDI on innovation among
Chinese stated-owned enterprises (SOEs) during 1999-2005. Dong and Gou (2010)
examined data from the listed companies in China and found that the improvement of
corporate governance and stock incentive plans might eventually enhance companies’
innovation and R&D capabilities. Yanrui WU (2012) focused on R&D behaviour of
large- and medium-sized (LMEs) Chinese firms with a large dataset of 19880 firms
covering the period of 2005-2007. Some authors have also focused on the R&D
activities in China by multinational corporations (MNCs) like Gassmann and Han
(2004), von Zedtwitz (2004) and Schanz et al. (2011). Specific factors also been
discussed separately like Zhou (2014) investigated how variations in institutional
quality affect R&D efforts of firms.

Innovative behaviour of Chinese manufacturing firms
4
Generally these researches tend to use R&D investment only to depict firms’
innovative activities and shed a light on LMEs. This is partly because that R&D data
used as an innovation indicator tends to favor large firms compared to small and
medium enterprises (SMEs) due to the fact that SMEs’ R&D efforts are often informal
(Acs and Audretsch, 1990; Kleinknecht et al., 2002) and occasional (Michie, 1998). It
to some extent fails to present a complete picture of firms’ innovative behaviour in
China’s manufacturing firms as the contribution of either young or small and
medium-sized companies to technological progress through R&D and innovation has
been found to be crucial (Acs and Audretsch 1990; Audretsch 2006; Czarnitzki 2011a).
In addition, external factors are often ignored which violates the systematic nature of
innovation. According to the theory of regional innovation system (RIS), innovation
activities are collective achievements of numerous entrepreneurs both in public and
private sectors, rather than an isolated activity within a firm. Therefore, it is
reasonable to investigate firms’ innovative behavior embedded in certain regions.
This paper adds to the emerging literature by combining the firm-level data and
municipal-level data to investigate both internal and external factors that might affect
the decision of firms to innovate. The latter is an under-researched topic in the
transitional Chinese economy though well-documented for firms in many developed
economies. This study also incorporates whole sample of Chinese manufacturing
firms rather than only LMEs to present a more complete picture of China’s innovative
behaviour at micro-level. In addition, different measurements of innovation are
adopted to capture the potential informal innovative activities as R&D is not
necessarily the only way to achieve the aim of innovation (Zhou et al., 2012), firms
commonly start by reviewing and combining existing knowledge (Fagerberg, Mowery
and Nelson 2006), and also can access to open source like well-debated outsourcing
and knowledge spillover from a systematic view (Ang and Madsen 2011).
The rest of this paper begins with a theoretical framework related to both internal
and external determinants of firms’ innovative behaviour in Section 2. This is
followed by discussion of data and econometric method in Section 3. Section 4 is the
empirical part including major results and comparison between different models.

Innovative behaviour of Chinese manufacturing firms
5
Robustness tests are provided in Section 5. The final section concludes the paper with
some remarks.
2. Research Hypothesis
There is a large pool of theoretic and empirical studies of innovation
determinants at the firm level (Acs and Isberg 1991; Souitaris 2002; De Jong and
Vermeulen 2006). This section reviews relevant works in order to formulate
hypotheses for testing using Chinese firm-level data. The choice of factors to be
discussed is determined by the existing theories as well as the availability of
information in the dataset obtained.
2.1 Internal Factors
Studies based on firm-level data generally focus on identifying the internal
characteristics of firms that affect their innovation behaviour. Many of these
investigations adopt the resource-based view (RBV), which highlights the
heterogeneity of firms and the role played by internal attributes in business strategy
(Wernerfelt 1984; Vega-Jurado et al. 2008). In this perspective, each firm possesses a
unique set of resources and capacities which have been acquired and developed over
time. Their exclusive resources and capacities further determine the degree of
efficiency and therefore firms’ strategic decisions like whether to get involved in
innovation. As this paper is discussing the determinants of innovative behaviour at
firm-level, RBV will be fundamental for selecting internal factors.
The age of a firm is a possible measure of its organizational resources (Del Canto
and Gonzalez, 1999). It represents the experience and knowledge accumulated
throughout its history and is related to a better management of communication and of
necessary creativity to innovate, and to a more effective capacity for absorption. On
the other hand, older age may also make knowledge, abilities and skills obsolete, and
therefore induce organizational decay (Loderer and Waelchli, 2009).
Firm size perhaps is the most obvious and well-studied candidate. The academic

Innovative behaviour of Chinese manufacturing firms
6
inquiries about the relationship between firm size and innovation activities went back
to the work by Schumpeter (1942) who argued that the degree of innovation is
positively correlated with firm size. Generally, due to capital market imperfection,
large companies have more resources to innovate and support risky activities than do
SMEs (Damanpour, 1992; Majumdar, 1995; Tsai, 2001; Becheikh et al. 2006) and
they can benefit from economies of scale in R&D, production and marketing (Cohen
and Klepper, 1996; Stock et al. 2002). Some researchers, conversely, are supporting a
small size with the argument that they have greater flexibility, better communication,
and greater specialisation possibilities, informal and strategic controls (Klepper and
Simons 1997, Galende and de la Fuente 2003, Chang and Robin 2006).
The same argument could be applied to the Chinese state-owned enterprises
(SOEs) most of which are large and well connected with government departments.
However, on theoretical grounds, the impact of state ownership or control on
corporate R&D is ambiguous (Lin et al. 2010). In China private firms only emerged
during the reform period. The SOEs are still in transition and have partially inherited
their role from the centrally planned economic system. Therefore, it is anticipated that
SOEs may be more likely to invest in innovation.
The impact of exporting on innovation was theorized in Grossman and Helpman
(1991). The underlying points are summarized by Ganotakis and Love (2011). First,
competition in foreign markets may force firms to invest in innovation so that they
can catch up with or maintain the world best practice. Second, exporting may allow
the firms to have access to a larger market and hence the fixed costs of R&D can be
recovered over a larger sales volume. In addition, Hobday (1995) proposed a
technology-gap model and showed that innovation rates can be accelerated by foreign
consumer demand and accordingly firms’ exporting activities. Empirical evidence is
however mixed. Girma et al. (2008) showed a positive impact of exporting status on
R&D among Irish firms but not among British firms. Criscuolo et al. (2010) found
that “locally engaged firms” spend more on innovation. In a transitional economy,
Chinese exporting firms are exposed to superior foreign knowledge and technology.
The “learning by exporting” effect could boost the firm’s productivity and hence

Innovative behaviour of Chinese manufacturing firms
7
provide greater incentives to invest in innovation. Dai and Yu (2013) pointed out that
exporting requires prior R&D innovation, which can help a firm maintain a
competitive advantage in international markets over potential competitors.
These arguments may not be true for foreign firms which are engaged in
exporting in China. These firms may have less incentive to invest in R&D in China
due to either the existence of R&D activities at home or their concern about
intellectual property right protection. In addition, foreign firms producing only for the
Chinese market may be less engaged in R&D because of their superior technology or
quality relative to the local producers. Love and Roper (1999) made a similar
observation using the British firm-level data. In contrast, Cassiman and Veugelers
(2002) suggests that foreign affiliates will perform adaptive R&D to modify
technologies that originate in home countries to suit local conditions in host countries.
It is widely accepted that innovation typically result from investment in research
and development (R&D). Similar to any other investment, R&D activities require
financial resources, like debt, equity, retained earnings and so forth. Particularly,
however, R&D program involves significant sunk cost and adjusting the level of R&D
spending is costly. This is mainly due to a major part of R&D spending consists of the
wages of R&D employees which are usually high-skilled workers, hiring and training
them are very expensive and leads to low volatility in R&D spending over time (Hall
2002). Del Canto and Gonzalez (1999) pointed out that, according to the
transaction-costs economics and agency literature, availability of internal funds is
supposed to be more conductive to R&D investment than external funds. Firms may
be unable or unwilling to offer sufficient information about their intended R&D
programs to potential funding providers in order to protect their proprietary
information on innovation (Maskus et al., 2012; Zhou 2013).
From the financial perspective, government subsidies may also play a role in
promoting firm-level innovation activities when there are market failures and the
consequent under-investment in R&D activities in private firms. In addition, it is
anticipated that more efficient firms may enjoy better financial conditions and hence
have greater incentives to invest in innovation. Finally, the existence of firms’

Innovative behaviour of Chinese manufacturing firms
8
long-term investment implies earnings or cash flows in the near future and hence
could convey favourable information about the firms’ long-term prospects which
possibly increase the probability of investment in innovation.
Apart from financial resources, firms’ internal knowledge resources count as
well. The most important knowledge resource in a firm is a qualified and motivated
workforce capable of creating new technology and absorbing outside-developed ones
(Hoffiman et al. 1998; Romjin and Albaladejo 2002; Simonen and McCann 2008;
Batabyal and Nijkamp 2013). For human resources carry the most knowledge and
culture of a firm, it is anticipated that firms with higher level of human capital are
more capable of conducting innovation and further a higher probability to get
involved in innovation activities. As above-mentioned, a major part of R&D spending
goes to the wages of R&D employees which are usually high-skilled workers, this
demonstrated that the importance of highly qualified personnel in innovation and also
enable us to use firms’ average wage to represent the level of human capital.
Others associated with the RBV is the role of intangible assets and level of
technology employed in the firms. Firms with intangible assets such as patents and
trademarks may be more willing to spend in innovation probably because of either
persistence in innovation or the desire to maintain their technology lead. Possession of
intangible goods also shows a better knowledge base in that firm, which is beneficial
to innovation (Corrado et al. 2012; Fleisher et al. 2013). Similarly, firms with better
technology may be keener to invest in innovation.
2.2 External Factors
As Fagerberg, Mowery and Nelson (2006) pointed out that a central finding in
the literature is that, in most cases, innovation activities in firms depend heavily on
external resources. These resources include not only financial or human resources, but
also connections with other firms and institutions, public resources and foreign
resources. Previous studies generally include region dummies to control the
heterogeneity of locations in determining firms’ innovative behaviour, which failed to

Innovative behaviour of Chinese manufacturing firms
9
capture the regional variations in details. As Pavitt (2002) pointed out that in a
competitive era in which success depends increasingly upon the ability to produce
new or improved products and processes, tacit knowledge constitutes the most
important basis for innovation-based value creation. However, as tacit knowledge
defies easy articulation or codification (Polanyi 1997) and is difficult to exchange
over long distance, firms’ innovation activities is inevitably embedded in a certain
environment which is so-called regional innovation system (RIS) (Asheim and
Isaksen 1997; Cooke 1992, 2001).
Since the systematic nature of innovation (Nelson et al. 1993; Braczyk et al 1998;
Lundvall 2010), it is obviously suitable to adopt the concept of RIS to investigate the
external determinants of firms’ development strategy. In this perspective, innovation
activities are collective achievements that require key roles from numerous
entrepreneurs in public and private sectors (Van de Ven et al. 1999), rather than an
isolated decision within a single firm. It means that firm’s innovative behaviour is not
only determined by its internal sources and capabilities, but also influenced by the
local system it embedded. A proxy variable of completeness of regional network has
been included to investigate its impact on firms’ innovation choices.
Local government is one of the key actors in RIS as well as private enterprises,
universities and public research institutions etc. (Lundvall 2010; Kang and Park 2012).
The RIS approach allows government intervention in the form of industry policy such
that resources are effectively allocated to foster innovation. Both R&D tax policy and
subsidy on R&D projects have been widely discussed in empirical analyses
(Mansfield 1986; González 2008; Carboni 2011; Czarnitzki et al. 2011b), which
shows that the attitude of local government probably played an important role in firms’
innovative behaviour, especially in a policy-dominated country like China. The term
of “policy-induced R&D” also demonstrate that the significant role of government in
firms’ innovation decision. Therefore, it is anticipated that government support will
positively affect firms’ innovative behaviour.
As a complement of internal financial resources, external finance availability is
determined by regional financial development. Rajan and Zingales (1998) argue that

Innovative behaviour of Chinese manufacturing firms
10
financial development liberates firms from the need of generating funds internally by
helping firms raise capital from sources external to the firms at a reasonable cost
(Hyytinen and Toivanen 2005). From the perspective of RIS, knowledge intensive
business services (KIBS) are the major component of regional subsystem of
knowledge creation and diffusion (Cooke 2002; Diez and Kiese 2009), which play
significant role in promoting regional innovation development (Shi et al. 2014).
Financial services are the most important sector in KIBS. Therefore, regional
financial development should have positive relationship with firms’ innovative
behaviour.
There is no doubt that Intellectual Property Rights (IPRs) play several important
roles in innovation systems – to encourage innovation and investment in innovation,
and to encourage dissemination (diffusion) of information about the principles and
sources of innovation throughout the economy (Fagerberg, Mowery and Nelson 2006).
Whether the IP system can correct for over- or under-investment in R&D and
innovation and whether this system distorts, redirects, or blocks technological
progress has been long debated (Machlup 1958; Mazzoleni and Nelson 1998). More
recently, Chen and Puttitanun (2005) pointed out that while weak IPRs facilitate the
imitation of foreign technologies, stronger IPRs encourage domestic innovative
activities. As the wide regional disparities in China, the protection of IPRs among
regions differs as well and should be taken into consideration. Another regional
policy-related issue is regional environment protection. Same as the IPR, it worth to
investigate the wide regional disparity in terms of environment protection since
Porter’s hypothesis argued that the environmental regulation has positive impacts on
firms’ innovation (Ambec et al. 2013; Jia et al. 2013).
The impact of competition on innovation has long been debated by economists
and practitioners. Schumpeter (1934) argued that competition may reduce the
expected payoff from R&D and hence lead to less R&D and a lower rate of
innovation. This view has been challenged by other authors such as Porter (1990).
Porter claims that competition forces firms to innovate in order to survive and hence
boost R&D activities. More recently, Aghion et al. (2005) postulate an inverted
Innovative behaviour of Chinese manufacturing firms
11
U-shaped relation between innovation and competition. The prediction of their model
is that competition has a positive impact on innovation when the level of competition
is low, while at higher levels of competition an increase in competition may reduce
investment in innovation. This argument is supported by Poldahl and Tingvall (2006).
The inverted U-shaped relation is tested here by using Chinese firm-level data.
In addition, foreign direct investment (FDI) has also been widely discussed that
may have positive impact on innovation (Javorick 2004; Fu et al. 2011). This study
includes FDI in external factors to examine the foreign knowledge spillover effect
which is quite controversial in Chinese context. Furthermore, it is argued that the
incentives to innovate increases with technological opportunities (Manez-Castillejo et
al. 2006). The latter refers to the possibility of converting resources into new products
or production processes (Cohen and Levinthal 1989). Individual sectors have different
R&D intensity. It would be possible that high-tech industries have to spend more or
invest more frequently in R&D so that they can survive and grow. Thus there may be
cross-sector variations in firms’ innovative behaviour. These variations should be
taken into consideration in the empirical analysis.
3. Research Design
3.1 The Database
The sample used in this study comes from a rich firm-level panel dataset that
covers around 177,634 firms in 2002, 294200 firms in 2006 and 338040 firms in 2010.
The dataset are drawn from an annual survey of manufacturing enterprises which is
conducted by China’s National Bureau of Statistics. It contains relative complete
information on the three major accounting statements (i.e., balance sheet, profit and
loss account, and cash flow statement). Two major types of manufacturing firms - all
SOEs and non-SOEs whose annual sales are more than five million RMB (or
equivalently, $750 thousand).1 More than 100 financial variables listed in the main
1 Indeed, aggregated data on the industrial sector in the annual China’s Statistical Yearbook by the National
Bureau of Statistics are compiled from this dataset.

Innovative behaviour of Chinese manufacturing firms
12
accounting statement of all these firms are included in this dataset.2 It is reported that
the surveyed enterprises accounted for most of China’s industrial value added and
amounted to 22% of the country’s urban employment in 2005 (Cai and Liu 2009).
Thus the surveyed sample should represent China’s industrial sector well.
Although this dataset is informative, some samples are noisy and thereby
misleading, largely due to some firms’ reporting error. Following popular practices in
the literature (Jefferson et al. 2003; Cai and Liu 2009; Wu 2012; Dai and Yu 2013),
the raw data is “trimmed” by using the following criteria, so that outliers and
abnormal observations are removed. First, observations whose key financial variables
(such as total assets, net value of fixed assets, sales, and gross value of firm
productivity output) are missing or negative were dropped. Second, the number of
employees hired for a firm had to be no less than 10 people.3 The final sample used
has 236,244 observations covering three years. To include the external factors, we
also draw data from China City Statistical Yearbook for 286 cities (Lhasa is excluded
due to missing data) where these firms located at.
3.2 The Econometric Model
To get insights into the questions raised in the preceding sections, different
models are estimated to deal with issues of the determinants of innovative behaviour.
The baseline model can be represented as follows,
0
*
it j ijt j ijt itY X Z (1)
where *Y is a latent variable which may be interpreted as the expected level of
participation in innovation. X and Z are explanatory variables reflecting internal and
external factors respectively. In this study innovative behaviour is defined as a binary
variable representing whether the firm conduct innovation activities. Therefore an
index function model is needed to transform the baseline model into a probit model
which is suitable to deal with this kind of problem. It is defined as,
2 Holz (2004) offers careful scrutiny on the possible measurement problems when using Chinese data, especially
at the aggregated level. 3 Levinsohn and Petrin (2003) suggest covering all Chilean plants with at least 10 workers. We follow their
criterion in this study.

Innovative behaviour of Chinese manufacturing firms
13
1itY if 0*
itY or 0 if 0*
itY (2)
With the index function model, the corresponding probit model can be specified as
0 1it j ij( t ) j ijt itY X Z (3)
where itY is a binary variable which is defined as unity if firm i get involved in
innovation in year t, and zero otherwise. The X-variables are lagged on period to
avoid potential problem of endogeneity caused by simultaneity. Z-variables take the
current values as they are the municipal-level data which can be treated as their own
instrumental variables (Lin et al. 2011, 2012).
Based on the definition, provided by National Bureau of Statistics of China
(NBSC), of firms’ innovation activities, Zhou et al. (2012) pointed out that firms’
innovation is R&D activities with the aim of producing new product, providing new
technology and improving the quality and the efficiency of current products. However,
as argued before, that use R&D investment only to depict firms’ innovative activities
tends to favor large firms since SMEs’ R&D efforts are often informal (Acs and
Audretsch, 1991; Kleinknecht et al., 2002) and occasional (Michie, 1998).
Particularly in China, a country enjoyed a lot from catching up with technology
frontier, therefore imitation innovation rather than indigenous innovation still
dominant in manufacturing sector in the fast development period. Considering the
critical role of either young or SMEs in technological progress ((Acs and Audretsch
1990; Audretsch 2006; Czarnitzki 2011a), some other measurement of innovation
activities should be taken into consideration as well. As shown in Table 2, firms with
R&D investment account for 12.9%, 9.9% and 12.4% in three years, respectively,
while firms with new product account for 6.6%, 9.9% and 10.0% in three years,
respectively. However, over 50% of firms with new product have no R&D investment,
which means if we use R&D only then tens of thousands firms with successful
innovation will be treated as not innovative. Therefore, this study adopts three
alternative measurement of innovative behaviour to make comparison. First is
whether a firm has R&D investment, which is widely used in previous studies.
Second is whether a firm has sales of new product, which is the output of innovation.

Innovative behaviour of Chinese manufacturing firms
14
But this output could come from R&D investment or informal innovative activities.
Third, to put them together, a firm either has R&D investment or sales of new product
will be treated as innovative. By doing this, we are able to capture those potential
informal innovation activities.
Table 2 Distribution of innovative behaviour
2002 2006 2010
Firms No. % No. % No. %
None 146127 80.5% 242115 80.2% 270588 77.6
With R&D 23481 12.9% 30016 9.9% 43283 12.4%
With New product 11928 6.6% 29830 9.9% 34666 10.0%
With R&D but no new product 17728 9.8% 19661 6.5% 27504 7.9%
With new product but no R&D 6175 3.4% 19469 6.5% 18880 5.4%
With R&D and new product 5733 3.2% 10355 3.4% 15779 4.5%
Total 181536 100% 301961 100% 348537 100%
Sources: Author’s own work.
The choice of other variables depends on the objective of the investigation and
the availability of information in the database considered. X and Z in equation (1) are
observable and explained in in following paragraph and also listed in Table 1.
Specifically, the internal factors (X) are defined as follows. Age is simply the age
of the firm (year in existence); size reflects the size of the firm which is measured by
the number of employees; debt measures the degree of liability which is defined as the
ratio of total liability over the total value of assets; tech captures the level of
technology in production which is measured by the ratio of the value of fixed assets
over employment (ie. The capital-labour ratio); exp is a binary variable and has a
value of one if a firm is engaged in exporting and zero otherwise; eff is an indicator of
firm efficiency and measured simply by the firms’ labour productivity, this is the ratio
of output value over total employment; hc indicates the level of human capital in a
firm, which is approximate by using firms’ average wage; intang is a binary variable
indicating whether a firm has intangible goods; invest is also a binary variable
indicating whether a firm has long term investment; subsidy represents the amount of
subsidy a firm received. The external factors (Z) include hhi which represents the
Herfindahl index to measure the level of competition or concentration of business
Innovative behaviour of Chinese manufacturing firms
15
activities in a sector. The calculation is based on the four-digit classification of
Chinese industrial sectors; fsint measures regional development of knowledge
intensive business services and also the regional level of financial availability. It is
defined as the regional density of employees in financial service sector; fdi measures
the foreign knowledge spillover which is defined as the actual use of foreign direct
investment; govsup is defined as the ratio of regional expenditure on science and
research over the general budget spending of local finance to represent the support
degree of local government; ipr depicts the degree of IPR protection. It is defined as
the geometric mean of the intensity of patent application and the ratio of closing cases
over accepted cases of patent infringement; network measures the density and
completeness of local system, which is defined as the geometric mean of regional
GDP per capita and density of innovation unities like enterprises and universities;
recycle represents the degree of environmental protection. It is measured by the
logarithm of the output of “three wastes” utilization. Ownership dummies, sectoral
dummies and time dummy are also included to control the potential heterogeneity.
(See Appendix for details)
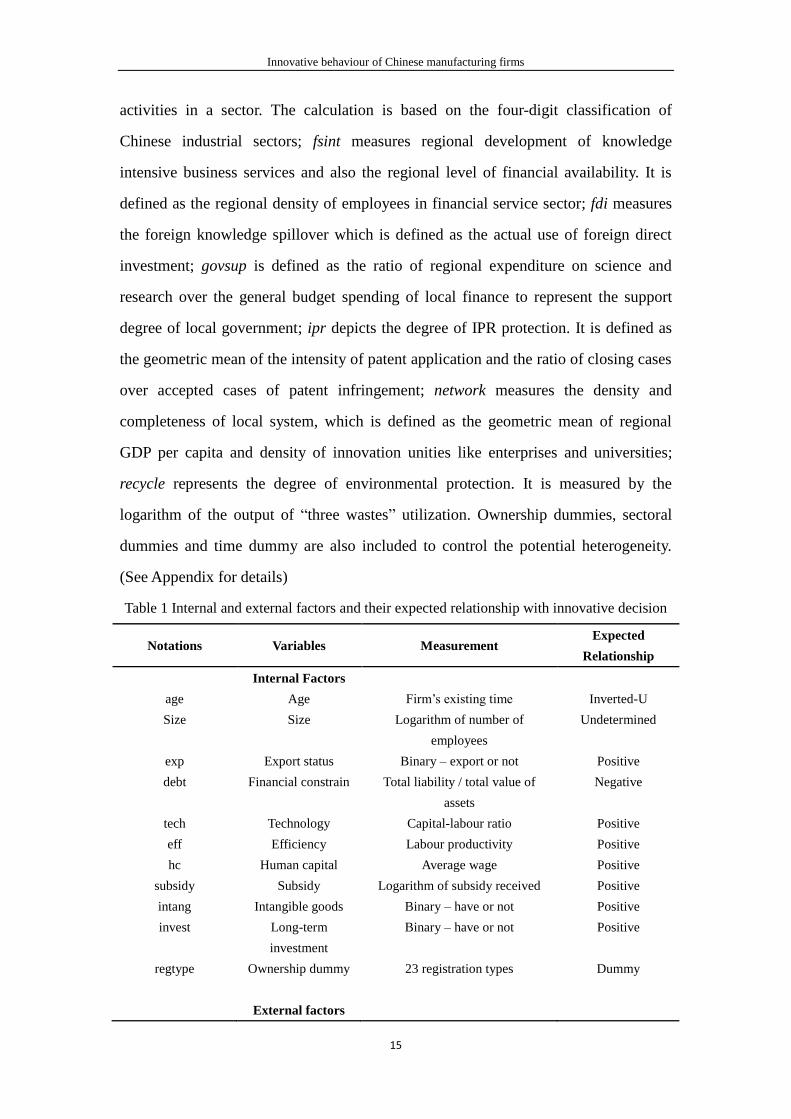
Table 1 Internal and external factors and their expected relationship with innovative decision
Notations Variables Measurement Expected
Relationship
Internal Factors
age Age Firm’s existing time Inverted-U
Size Size Logarithm of number of
employees
Undetermined
exp Export status Binary – export or not Positive
debt Financial constrain Total liability / total value of
assets
Negative
tech Technology Capital-labour ratio Positive
eff Efficiency Labour productivity Positive
hc Human capital Average wage Positive
subsidy Subsidy Logarithm of subsidy received Positive
intang Intangible goods Binary – have or not Positive
invest Long-term
investment
Binary – have or not Positive
regtype Ownership dummy 23 registration types Dummy
External factors

Innovative behaviour of Chinese manufacturing firms
16
hhi Competition Herfindahl index
four digit classification
Inverted-U
fsint Regional financial
development
Regional density of employees in
financial services sector
Positive
fdi Foreign knowledge
spillover
Logarithm of actual use of
foreign direct investment
Debatable
recycle Environment
protection
Logarithm of the output of “three
wastes” utilization
Undetermined
govsup Government support Regional expenditure on S&T /
general budget spending
Positive
ipr IPRs Geometric mean of the density of
patent applications and the ratio
of closing cases over accepted
cases of patent infringement
Positive
network Network Geometric mean of regional GDP
per capita and density of
innovation unities like enterprises
and universities
Positive
ind Sector dummy 12 sectors dummies Dummy
t Time dummy 3 years Positive
Source: Author’s own work.
Summary statistics about the sample are presented in Table 3. As shown, about
16.38% of the surveyed firms are involved in R&D activities and around 11.37% of
the firms have new product during the period. Around 35.13% of the firms are
exporters. The average age of firms is about 14 years old with about 175 employees.
The mean Herfindahl index (hhi) is 0.038 which is very small. Thus the firms may be
allocated fairly diversely across the four-digit industry sectors.
Table 3 Summary statistics
Variable Obs Mean Std. Dev. Min Max
rdc 236244 0.16 0.37 0.00 1.00
npvc 236244 0.11 0.32 0.00 1.00
inn 236244 0.22 0.41 0.00 1.00
age 236244 13.82 12.38 -1.75 409.17
size 236244 5.16 1.17 2.20 12.29
debt 236244 0.99 1.92 -1.61 113.26
tech 236244 3.66 1.48 -6.20 12.99
exp 236244 0.35 0.48 0.00 1.00
eff 236244 5.46 1.08 -4.53 12.21
hc 236244 0.10 0.14 0.00 15.80

Innovative behaviour of Chinese manufacturing firms
17
intang 236244 0.28 0.45 0.00 1.00
invest 236244 0.16 0.37 0.00 1.00
subsidy 236244 0.64 1.92 0.00 13.45
hhi 236244 0.04 0.05 0.00 1.00
fsint 236244 5.31 8.35 0.02 54.52
fdi 236244 10.95 1.97 0.00 13.92
recycle 236244 10.14 2.30 0.00 14.40
govsup 236244 0.01 0.02 0.00 0.08
ipr 236244 0.53 0.14 0.19 0.79
network 236244 1.36 1.24 0.00 6.66
Source: Author’s own work.
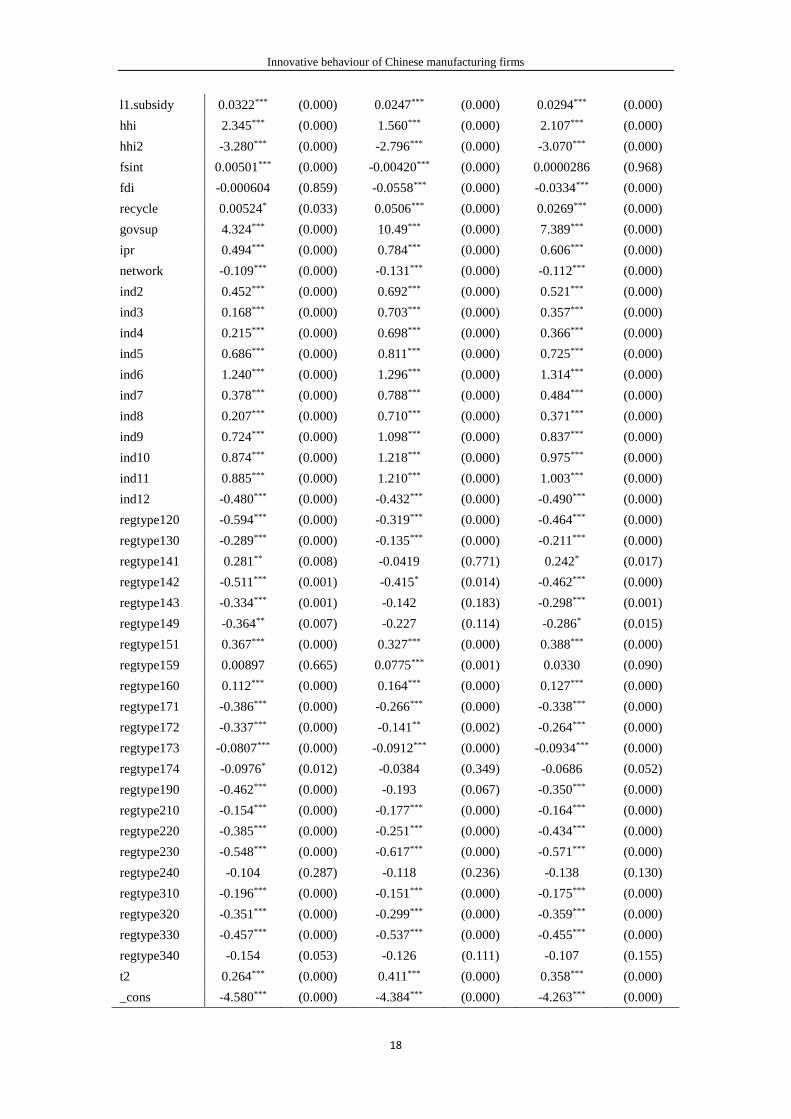
4. Empirical Results
Based on above-mentioned research design, the estimation results using the
described sample are reported in Table 4. Three alternative versions of Model 1 are
considered. Model 1A treats innovative behaviour as whether a firm has R&D
investment, while Model 1B treats innovative behaviour as whether a firm has new
product. Model 1C combined previous two by treating both R&D investment and new
product as innovative behaviour. By doing this, we are able to capture the potential
informal R&D or other form of innovative activities, especially when SMEs are
included in our sample. A probit model is adopted here and robust standard errors and
covariance are calculated.
Table 4 Regression Results4
Model
Variables
Model 1A
rdc
Model 1B
npvc
Model 1C
inn
l1.age 0.00236*** (0.000) 0.00284*** (0.000) 0.00241*** (0.000)
l1.size 0.283*** (0.000) 0.180*** (0.000) 0.261*** (0.000)
l1.debt -0.217*** (0.000) -0.118*** (0.000) -0.160*** (0.000)
l1.tech 0.0547*** (0.000) 0.0371*** (0.000) 0.0530*** (0.000)
l1.exp 0.135*** (0.000) 0.365*** (0.000) 0.229*** (0.000)
l1.eff 0.147*** (0.000) 0.0931*** (0.000) 0.135*** (0.000)
l1.hc 0.580*** (0.000) 0.339*** (0.000) 0.554*** (0.000)
l1.intang 0.207*** (0.000) 0.156*** (0.000) 0.194*** (0.000)
l1.invest 0.221*** (0.000) 0.199*** (0.000) 0.215*** (0.000)
4 Some may argue that the production of new product is a function of R&D investment. Therefore R&D
investment should be included in the model. This situation is considered and the result doesn’t affect the major
conclusions here.
Innovative behaviour of Chinese manufacturing firms
18
l1.subsidy 0.0322*** (0.000) 0.0247*** (0.000) 0.0294*** (0.000)
hhi 2.345*** (0.000) 1.560*** (0.000) 2.107*** (0.000)
hhi2 -3.280*** (0.000) -2.796*** (0.000) -3.070*** (0.000)
fsint 0.00501*** (0.000) -0.00420*** (0.000) 0.0000286 (0.968)
fdi -0.000604 (0.859) -0.0558*** (0.000) -0.0334*** (0.000)
recycle 0.00524* (0.033) 0.0506*** (0.000) 0.0269*** (0.000)
govsup 4.324*** (0.000) 10.49*** (0.000) 7.389*** (0.000)
ipr 0.494*** (0.000) 0.784*** (0.000) 0.606*** (0.000)
network -0.109*** (0.000) -0.131*** (0.000) -0.112*** (0.000)
ind2 0.452*** (0.000) 0.692*** (0.000) 0.521*** (0.000)
ind3 0.168*** (0.000) 0.703*** (0.000) 0.357*** (0.000)
ind4 0.215*** (0.000) 0.698*** (0.000) 0.366*** (0.000)
ind5 0.686*** (0.000) 0.811*** (0.000) 0.725*** (0.000)
ind6 1.240*** (0.000) 1.296*** (0.000) 1.314*** (0.000)
ind7 0.378*** (0.000) 0.788*** (0.000) 0.484*** (0.000)
ind8 0.207*** (0.000) 0.710*** (0.000) 0.371*** (0.000)
ind9 0.724*** (0.000) 1.098*** (0.000) 0.837*** (0.000)
ind10 0.874*** (0.000) 1.218*** (0.000) 0.975*** (0.000)
ind11 0.885*** (0.000) 1.210*** (0.000) 1.003*** (0.000)
ind12 -0.480*** (0.000) -0.432*** (0.000) -0.490*** (0.000)
regtype120 -0.594*** (0.000) -0.319*** (0.000) -0.464*** (0.000)
regtype130 -0.289*** (0.000) -0.135*** (0.000) -0.211*** (0.000)
regtype141 0.281** (0.008) -0.0419 (0.771) 0.242* (0.017)
regtype142 -0.511*** (0.001) -0.415* (0.014) -0.462*** (0.000)
regtype143 -0.334*** (0.001) -0.142 (0.183) -0.298*** (0.001)
regtype149 -0.364** (0.007) -0.227 (0.114) -0.286* (0.015)
regtype151 0.367*** (0.000) 0.327*** (0.000) 0.388*** (0.000)
regtype159 0.00897 (0.665) 0.0775*** (0.001) 0.0330 (0.090)
regtype160 0.112*** (0.000) 0.164*** (0.000) 0.127*** (0.000)
regtype171 -0.386*** (0.000) -0.266*** (0.000) -0.338*** (0.000)
regtype172 -0.337*** (0.000) -0.141** (0.002) -0.264*** (0.000)
regtype173 -0.0807*** (0.000) -0.0912*** (0.000) -0.0934*** (0.000)
regtype174 -0.0976* (0.012) -0.0384 (0.349) -0.0686 (0.052)
regtype190 -0.462*** (0.000) -0.193 (0.067) -0.350*** (0.000)
regtype210 -0.154*** (0.000) -0.177*** (0.000) -0.164*** (0.000)
regtype220 -0.385*** (0.000) -0.251*** (0.000) -0.434*** (0.000)
regtype230 -0.548*** (0.000) -0.617*** (0.000) -0.571*** (0.000)
regtype240 -0.104 (0.287) -0.118 (0.236) -0.138 (0.130)
regtype310 -0.196*** (0.000) -0.151*** (0.000) -0.175*** (0.000)
regtype320 -0.351*** (0.000) -0.299*** (0.000) -0.359*** (0.000)
regtype330 -0.457*** (0.000) -0.537*** (0.000) -0.455*** (0.000)
regtype340 -0.154 (0.053) -0.126 (0.111) -0.107 (0.155)
t2 0.264*** (0.000) 0.411*** (0.000) 0.358*** (0.000)
_cons -4.580*** (0.000) -4.384*** (0.000) -4.263*** (0.000)

Innovative behaviour of Chinese manufacturing firms
19
N 156802 156802 156802
pseudo R2 0.202 0.163 0.179
Note: ***, **, * mean significant at 1%, 5% and 10% level, respectively.
According to the regression results, it is found that old firms are more willing to
invest in innovation. This is different from the observation by Lin et al. (2010) who
employed a sample of 2400 Chinese firms covering the period 2000-2002. It is also
found that large firms are more likely to invest in innovation. This is consistent with
our expectation. The similar finding was also reported by Lin et al. (2010). In our
results, it can also be seen from the coefficients that, regarding the firm size, the
increased probability of invest in R&D is bigger than the increased probability of
producing new product. The debt burden significantly reduced the probability of
investment in R&D. It is consistent with our expectation as R&D is costly and
uncertain which made it is not affordable for financial constrained firms. It is also
because firms generally tend to use internal resources to conduct R&D projects in
order to keep it confidential before it is patented. Financial constrain also decrease the
probability of producing new product as commercialization and marketing are also
capital-intensive activities, but the magnitude is smaller than the one of R&D choice.
This is probably because, in this stage, firms can get access to external funds to
facilitate their commercialization processes. Firms with higher technology level are
more likely to invest in innovation. Exporters are found to have higher probability of
conducting innovative behaviour, especially in producing new product. This is mainly
because China’s exporting is not technology intensive, the higher standard in foreign
countries push Chinese exporters to improve the quality or design of their products. It
also demonstrates that the “learning by exporting” effect is mainly through
product-embodied spillover. More efficient firms have been proved to have higher
probability of innovation. It is not surprising as more efficient firms generally have
better performance and therefore sufficient profit to support its innovative behaviour.
It corresponds to the abundant internal resources and strong capability from RBV.
Higher level of human capital obviously increases the probability of investing in
innovation, as it is critical inputs of innovation process and it also represents the

Innovative behaviour of Chinese manufacturing firms
20
absorptive capability of a firm. Firms with intangible goods, long-term investment
and subsidy generally are more likely to conduct innovative activities. This is because
intangible goods represent the knowledge base of one firm, therefore providing more
internal knowledge resources, while long-term investment and subsidy provide extra
earnings and cash flow which is beneficial to risky investment like innovation.
For the external part, all dependent variables follow an inverted-U shape
relationship with competition, implying that more competition increases initially and
then reduces the probability of innovation, regardless the measurement of innovative
behaviour. This is consistent with evidence from other economies (Aghion et al. 2005;
Tingvall and Poldahl 2006). Regional financial development or the development of
financial services increased the probability of investment in R&D but reduced the
probability of producing new products. Foreign knowledge spillover doesn’t show
any significant relationship with R&D choice, while from new product perspective it
has negative relationship with innovative behaviour. This result further supports the
view that rather than positive spillover to local firms, FDI crowded out innovation
activities in local firms. Higher level of environment protection raises the possibility
of conducting innovative behaviour which is consistent with Porter’s hypothesis. But
this effect is more likely to present in producing new product rather than R&D
investment. It is doubtless that government support has significant effect on both
kinds of innovation, especially on new product sales. This is probably because part of
R&D projects are launched by government and therefore crowed out firms’ R&D
investment. IPRs have been found that increased the probability of conducting
innovative behaviour. Network variable has significant negative relationship with
innovative behaviour. This might because better network made firms to innovate as an
alliance, which probably reduced the number of innovative behaviour but improved
the quality of innovation or increase the probability of successful innovation.
The estimated coefficients of the sectoral dummy variables show that firms
engaged in manufacturing activities of fuel and chemicals (ind5), pharmaceuticals
(ind6), machinery (ind9), transport equipment (ind10), communication and other
electronic equipment (ind11) are more likely to invest in R&D compare with the base

Innovative behaviour of Chinese manufacturing firms
21
industry of mining (ind1). There industries are generally considered as high-tech
industries. Therefore those high-tech industries not only invest in innovation more
intensively but also more frequently. From the perspective of new product, all
industries, except industry 12, are more likely to produce new product. The ownership
dummies show that state-owned enterprises enjoy the highest likelihood of engaging
in innovation, while private enterprises, Hong Kong, Macau and Taiwan-owned
enterprises and foreign-owned enterprises are less likely to engage in innovation. This
finding support the argument made in Bruche (2010) and Zhou (2014). The year
dummy variables also demonstrate that the probability of innovation increase over
time.
5. Robustness and further analysis
While important findings are derived from the estimation of Model 1, the results
are subjected to further investigation. It is argued that firms that have innovated in the
past are more likely to innovate today (Parisia et al. 2006). This may simply reflect
the sunk costs involved in innovation activities or a time-invariant characteristic of the
firm such as the quality of the management. The same argument is also made in terms
of a firm’s exporting decision and hence the intensity of export (Roberts and Tybout
1997). The common practice in the literature is to consider the lagged dependent
variable as a regressor in the model. Thus equation (3) becomes the following
0 1 1it i( t ) j ij t - j ijt itY Y X Z ( ) (4)
Direct estimation of equation (4) using OLS is problematic due to the potential
presence of endogeneity. To overcome this problem, various methods have been
proposed.5 In this paper, equation (4) is estimated by replacing 1ij t -X( ) by
2ij t -X( )
and quasi-maximum likelihood (Huber-White) robust standard errors are calculated.
The variables have the same definitions as discussed in the preceding paragraph. The
sample covers one year only. The regression results are presented in Table 5.
5 Those methods include the application of dynamic probit models and GMM approach (probit models). However,
in popular econometric packages such as Eviews, Stata and LIMDEP, these techniques are not well developed.

Innovative behaviour of Chinese manufacturing firms
22
Obviously, the coefficient of the lagged dependent variable is positive and statistically
significant. Thus firms which invested in innovation in the past are more likely to
spend in innovation activities in the future. The coefficients of other variables show
some sensitivity in terms of their magnitude, sign and level of significance. The
overall findings are consistent with previous analysis. Exceptions like age and
competition which are not significant in model 2 with lagged dependent variables.
This is showing that firms might have certain inertness to innovate, once the previous
innovation behaviour is controlled, age and competition is not decisive variables for
innovation. Protection of environment reduces the probability of investing in R&D in
Model 2A, while it does increase the probability of producing new product.
Table 5 Regression results with lagged dependent variables
Model
Variables
Model 2A Model 2B Model 2C
rdc npvc inn
l1.rdc 1.942*** (0.000)
l1.npvc 2.292*** (0.000)
l1.inn 1.931*** (0.000)
l2.age 0.00102 (0.106) -0.000954 (0.176) 0.000419 (0.483)
l2.size 0.0140*** (0.000) 0.0147*** (0.000) 0.0160*** (0.000)
l2.debt -0.0897*** (0.001) -0.0925** (0.004) -0.0924*** (0.000)
l2.tech 0.0129 (0.054) 0.0370*** (0.000) 0.0231*** (0.000)
l2.exp 0.0555*** (0.001) 0.194*** (0.000) 0.129*** (0.000)
l2.eff 0.0876*** (0.000) 0.0121 (0.267) 0.0654*** (0.000)
l2.hc 0.332*** (0.000) 0.201** (0.002) 0.332*** (0.000)
l2.intang 0.140*** (0.000) 0.116*** (0.000) 0.135*** (0.000)
l2.invest 0.109*** (0.000) 0.107*** (0.000) 0.110*** (0.000)
l2.subsidy 0.00845** (0.007) 0.00655 (0.057) 0.00580* (0.048)
hhi 0.00422 (0.987) 0.636 (0.064) 0.461 (0.084)
hhi2 0.320 (0.212) 0.172 (0.563) 0.308 (0.206)
fsint 0.219* (0.044) -0.745*** (0.000) -0.0562 (0.579)
fdi -0.0187*** (0.001) -0.0587*** (0.000) -0.0404*** (0.000)
recycle -0.0106** (0.001) 0.0135** (0.003) -0.00192 (0.550)
govsup 2.149** (0.006) 5.929*** (0.000) 2.961*** (0.000)
ipr 0.361*** (0.000) 1.628*** (0.000) 1.055*** (0.000)
network -0.0339*** (0.000) -0.0216 (0.054) -0.0281** (0.002)
ind2 0.196*** (0.001) 0.839*** (0.000) 0.334*** (0.000)
ind3 0.0218 (0.700) 0.862*** (0.000) 0.247*** (0.000)
ind4 0.0114 (0.846) 0.804*** (0.000) 0.194*** (0.001)
ind5 0.358*** (0.000) 0.910*** (0.000) 0.462*** (0.000)
ind6 0.658*** (0.000) 1.102*** (0.000) 0.769*** (0.000)

Innovative behaviour of Chinese manufacturing firms
23
ind7 0.200*** (0.000) 0.800*** (0.000) 0.272*** (0.000)
ind8 0.0533 (0.417) 0.841*** (0.000) 0.281*** (0.000)
ind9 0.379*** (0.000) 1.087*** (0.000) 0.540*** (0.000)
ind10 0.477*** (0.000) 1.233*** (0.000) 0.693*** (0.000)
ind11 0.482*** (0.000) 1.152*** (0.000) 0.639*** (0.000)
ind12 -0.233*** (0.001) -0.330* (0.049) -0.233*** (0.001)
regtype120 -0.397*** (0.000) -0.366*** (0.000) -0.398*** (0.000)
regtype130 -0.272*** (0.000) -0.0774 (0.204) -0.198*** (0.000)
regtype141 0.323 (0.092) -0.116 (0.745) 0.232 (0.263)
regtype142 -0.0862 (0.696) -0.157 (0.662) -0.0211 (0.920)
regtype143 -0.407* (0.012) -0.547*** (0.001) -0.603*** (0.000)
regtype149 -0.426 (0.101) -0.0221 (0.928) -0.151 (0.468)
regtype151 0.190** (0.004) 0.131 (0.070) 0.172* (0.010)
regtype159 -0.0395 (0.249) 0.0736 (0.082) -0.00935 (0.778)
regtype160 0.113** (0.009) 0.140** (0.006) 0.128** (0.002)
regtype171 -0.294*** (0.000) -0.239*** (0.000) -0.297*** (0.000)
regtype172 -0.243** (0.002) -0.232* (0.016) -0.214** (0.003)
regtype173 -0.0456 (0.194) -0.0331 (0.446) -0.0649 (0.055)
regtype174 -0.0588 (0.351) 0.0605 (0.433) -0.0508 (0.406)
regtype190 -0.115 (0.461) -0.181 (0.388) -0.295 (0.069)
regtype210 -0.0736 (0.094) -0.0395 (0.458) -0.0606 (0.145)
regtype220 -0.320*** (0.000) -0.0994 (0.231) -0.362*** (0.000)
regtype230 -0.260*** (0.000) -0.229*** (0.000) -0.255*** (0.000)
regtype240 -0.0321 (0.848) -0.0887 (0.535) -0.0915 (0.518)
regtype310 -0.119** (0.006) 0.00221 (0.966) -0.0843* (0.040)
regtype320 -0.139 (0.080) 0.0217 (0.818) -0.0817 (0.282)
regtype330 -0.287*** (0.000) -0.230*** (0.000) -0.252*** (0.000)
regtype340 -0.0402 (0.766) -0.280* (0.041) -0.124 (0.357)
_cons -2.600*** (0.000) -3.997*** (0.000) -2.907*** (0.000)
N 78261 78261 78261
pseudo R2 0.430 0.511 0.441
Note: ***, **, * mean significant at 1%, 5% and 10% level, respectively.
In addition, to distinguish firms with only R&D, only new product or both of
them, a multinomial probit model is employed to conduct further analysis and also
make the results more comparable between different groups. It can be seen from Table
6 that there are four choices: choice (1) indicates that a firm has neither R&D nor new
product. These firms are viewed as non-innovative firms; choice (2) represents those
firms with R&D investment but no new product. They are treated as serious
innovators or major innovators, but still at the initial stage of an innovation; choice (3)
are firms with new products but no R&D investment. These firms are successful in
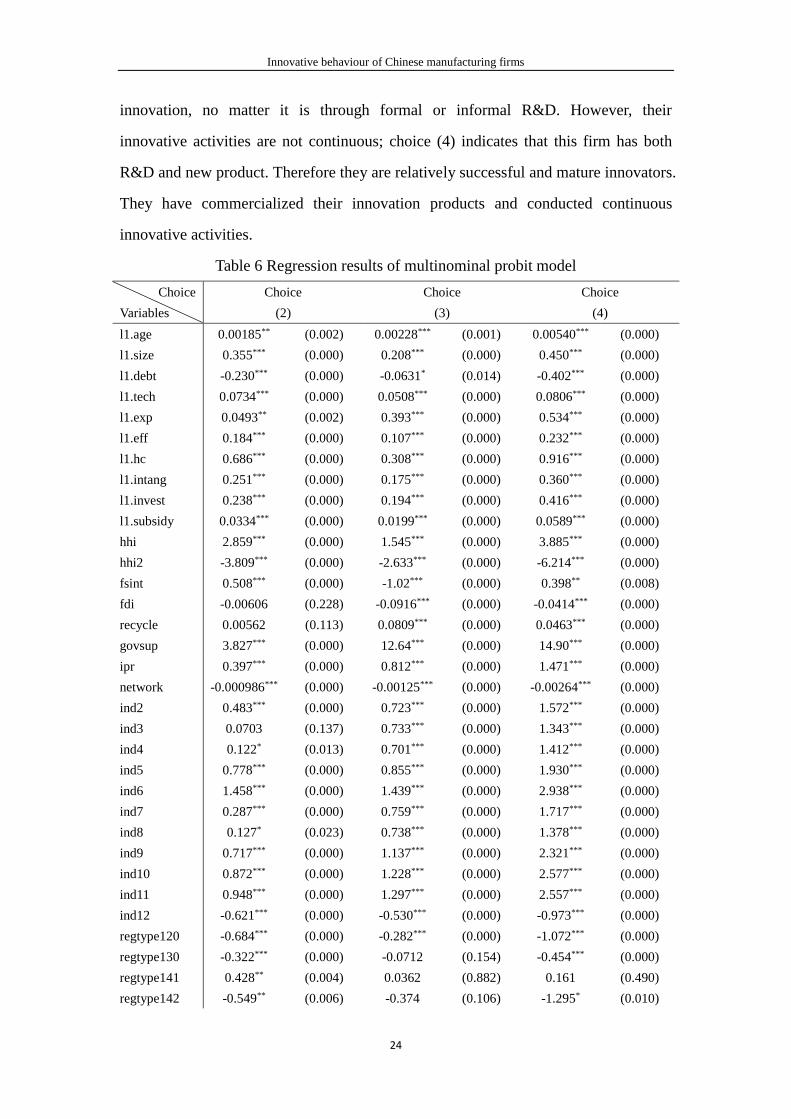
Innovative behaviour of Chinese manufacturing firms
24
innovation, no matter it is through formal or informal R&D. However, their
innovative activities are not continuous; choice (4) indicates that this firm has both
R&D and new product. Therefore they are relatively successful and mature innovators.
They have commercialized their innovation products and conducted continuous
innovative activities.
Table 6 Regression results of multinominal probit model
Choice
Variables
Choice
(2)
Choice
(3)
Choice
(4)
l1.age 0.00185** (0.002) 0.00228*** (0.001) 0.00540*** (0.000)
l1.size 0.355*** (0.000) 0.208*** (0.000) 0.450*** (0.000)
l1.debt -0.230*** (0.000) -0.0631* (0.014) -0.402*** (0.000)
l1.tech 0.0734*** (0.000) 0.0508*** (0.000) 0.0806*** (0.000)
l1.exp 0.0493** (0.002) 0.393*** (0.000) 0.534*** (0.000)
l1.eff 0.184*** (0.000) 0.107*** (0.000) 0.232*** (0.000)
l1.hc 0.686*** (0.000) 0.308*** (0.000) 0.916*** (0.000)
l1.intang 0.251*** (0.000) 0.175*** (0.000) 0.360*** (0.000)
l1.invest 0.238*** (0.000) 0.194*** (0.000) 0.416*** (0.000)
l1.subsidy 0.0334*** (0.000) 0.0199*** (0.000) 0.0589*** (0.000)
hhi 2.859*** (0.000) 1.545*** (0.000) 3.885*** (0.000)
hhi2 -3.809*** (0.000) -2.633*** (0.000) -6.214*** (0.000)
fsint 0.508*** (0.000) -1.02*** (0.000) 0.398** (0.008)
fdi -0.00606 (0.228) -0.0916*** (0.000) -0.0414*** (0.000)
recycle 0.00562 (0.113) 0.0809*** (0.000) 0.0463*** (0.000)
govsup 3.827*** (0.000) 12.64*** (0.000) 14.90*** (0.000)
ipr 0.397*** (0.000) 0.812*** (0.000) 1.471*** (0.000)
network -0.000986*** (0.000) -0.00125*** (0.000) -0.00264*** (0.000)
ind2 0.483*** (0.000) 0.723*** (0.000) 1.572*** (0.000)
ind3 0.0703 (0.137) 0.733*** (0.000) 1.343*** (0.000)
ind4 0.122* (0.013) 0.701*** (0.000) 1.412*** (0.000)
ind5 0.778*** (0.000) 0.855*** (0.000) 1.930*** (0.000)
ind6 1.458*** (0.000) 1.439*** (0.000) 2.938*** (0.000)
ind7 0.287*** (0.000) 0.759*** (0.000) 1.717*** (0.000)
ind8 0.127* (0.023) 0.738*** (0.000) 1.378*** (0.000)
ind9 0.717*** (0.000) 1.137*** (0.000) 2.321*** (0.000)
ind10 0.872*** (0.000) 1.228*** (0.000) 2.577*** (0.000)
ind11 0.948*** (0.000) 1.297*** (0.000) 2.557*** (0.000)
ind12 -0.621*** (0.000) -0.530*** (0.000) -0.973*** (0.000)
regtype120 -0.684*** (0.000) -0.282*** (0.000) -1.072*** (0.000)
regtype130 -0.322*** (0.000) -0.0712 (0.154) -0.454*** (0.000)
regtype141 0.428** (0.004) 0.0362 (0.882) 0.161 (0.490)
regtype142 -0.549** (0.006) -0.374 (0.106) -1.295* (0.010)

Innovative behaviour of Chinese manufacturing firms
25
regtype143 -0.468** (0.002) -0.189 (0.287) -0.393* (0.027)
regtype149 -0.366 (0.058) -0.147 (0.478) -0.759* (0.015)
regtype151 0.367*** (0.000) 0.272** (0.002) 0.719*** (0.000)
regtype159 -0.0186 (0.553) 0.0891* (0.016) 0.0843* (0.025)
regtype160 0.0576 (0.157) 0.114* (0.020) 0.260*** (0.000)
regtype171 -0.468*** (0.000) -0.281*** (0.000) -0.682*** (0.000)
regtype172 -0.475*** (0.000) -0.168* (0.017) -0.403*** (0.000)
regtype173 -0.0948** (0.003) -0.100** (0.009) -0.164*** (0.000)
regtype174 -0.101 (0.081) 0.00255 (0.968) -0.159* (0.029)
regtype190 -0.572*** (0.001) -0.159 (0.324) -0.699*** (0.000)
regtype210 -0.135*** (0.001) -0.153** (0.001) -0.366*** (0.000)
regtype220 -0.690*** (0.000) -0.483*** (0.000) -0.392*** (0.000)
regtype230 -0.541*** (0.000) -0.592*** (0.000) -1.357*** (0.000)
regtype240 -0.192 (0.199) -0.244 (0.187) -0.215 (0.177)
regtype310 -0.192*** (0.000) -0.113* (0.013) -0.393*** (0.000)
regtype320 -0.424*** (0.000) -0.346*** (0.000) -0.621*** (0.000)
regtype330 -0.373*** (0.000) -0.417*** (0.000) -1.222*** (0.000)
regtype340 -0.121 (0.324) -0.0516 (0.716) -0.352** (0.005)
t2 0.296*** (0.000) 0.511*** (0.000) 0.658*** (0.000)
_cons -5.698*** (0.000) -5.383*** (0.000) -9.296*** (0.000)
N 156802 156802 156802
Note: ***, **, * mean significant at 1%, 5% and 10% level, respectively.
Apart from some sensitivity in terms of magnitude, the major findings in
multinominal model are highly consistent with our previous analysis, while this time
the analysis is compare to the base choice (1) which is non-innovative firms. This
demonstrates the robustness of our results. It worth to notice that in choice (4), which
is new to previous model, coefficients of major variables are generally larger than
other choices. Therefore, compare to other choices, mature innovators are more likely
to possess either of those characteristics, namely, old vintage in terms of
commencement date, large scale production, higher level of technology and human
capital, more efficient, possess intangible goods and subsidy, exporting and has
long-term investment. They are also more sensitive to debt burden and external
environment. From ownership perspective, SOEs are more likely to become a mature
innovator rather than major innovator, while private enterprises, Hong Kong, Macau
and Taiwan-owned enterprises and foreign-owned enterprises are much less likely to
be a mature innovator than other choices. Industries have more propensities to
innovate in previous analysis are much more likely to innovate continuously.

Innovative behaviour of Chinese manufacturing firms
26
6. Conclusion
Based on a theoretical framework combining resource-based views and the
theory of regional innovation system, this paper investigates both the internal and
external determinants that affect Chinese manufacturing firms’ innovative behaviour
by using a rich set of firm-level data and municipal-level data during the period of
2002-2010. Panel probit model and mulnominal probit model are employed to
examine the determinants of innovative behaviour under different measurements.
The results found that Chinese innovative firms are generally old, large, exporter
and state-owned. Those firms which are more efficient and have higher level of
technology and human capital are generally more likely to conduct innovative
behaviour. Better knowledge base, long-term plan and extra subsidy are beneficial to
the probability of engaging in innovation. A high level of liability or debt burden is
detrimental to innovation, especially for R&D investment and mature innovator. This
is also observed in other economies such as Canada (Cumming and Macintosh 2000),
Japan (Ogawa 2007) and South Korea (Lee 2012). More competition increases
initially and then reduces the probability of innovation, regardless the measurement of
innovative behaviour. Regional financial development increased the probability of
investment in R&D but reduced the probability of producing new products. Rather
than a positive spillover to local firms, FDI crowded out innovation activities in local
firms. Consistent with Porter’s hypothesis the regional level of environment
protection has positive effect on firms’ innovation choice. Government support has
significant effect on both kinds of innovation, especially on new product sales. IPRs
have been found have positive relationship with R&D choice and producing new
product. Network variable has significant negative relationship with innovative
behaviour. Sectoral dummies show that high-tech industries (industry 5, 6, 9, 10 and
11) not only invest in R&D more intensively but also more frequently. From the
perspective of new product, all industries, except industry 12, are more likely to
produce new product. The ownership dummies show that state-owned enterprises
enjoy the highest likelihood of engaging in innovation, while private enterprises,

Innovative behaviour of Chinese manufacturing firms
27
Hong Kong, Macau and Taiwan-owned enterprises and foreign-owned enterprises are
less likely to engage in innovation. The overall findings are similar regardless the
dependent variable is R&D choice or new product sales, but slight different still worth
to be noticed. Potential endogeneity problems are carefully treated and consistent
results show the robustness of our analysis.
Apart from some sensitivity in terms of magnitude, the major findings in
multinominal model are highly consistent with our previous analysis. It worth to
notice that in choice (4), which is new to previous model, coefficients of major
variables are generally larger than other choices. Therefore, compare to other choices,
mature innovators are more likely to possess either of those characteristics. They are
also more sensitive to debt burden and external environment. From ownership
perspective, SOEs are more likely to become a mature innovator rather than major
innovator, while private enterprises, Hong Kong, Macau and Taiwan-owned
enterprises and foreign-owned enterprises are much less likely to be a mature
innovator than other choices. Industries have more propensities to innovate in
previous analysis are much more likely to innovate continuously.
The potential contribution is that, as far as we know, this paper uses the largest
available dataset of Chinese manufacturing firms. Innovative activities under different
measurement are distinguished in this paper. It is because that R&D data used as an
innovation indicator tends to favour large firms compared to small and medium
enterprises (SMES) due to the fact that SMEs’ R&D efforts are often informal and
occasional. This paper also includes the information of cities where these firms are
located, thereby capturing the external factors affecting firms’ decision to innovate.
The findings in this study have important implications not only for China but also for
the rest of the world as Chinese firms become increasingly active internationally.

Innovative behaviour of Chinese manufacturing firms
28
Appendix
Table A1 Definition of Sector Dummy Variables
Dummy
No.
Industry
Codes
Definition
1 06 Mining & Washing of Coals
07 Extraction of Petroleum & Natural Gas
08 Mining & Processing of Ferrous Metal Ores
09 Mining & Processing of Non-Ferrous Metal Ores
10 Mining & Processing of Non-metal Ores
2 13 Processing of Food from Agricultural Products
14 Manufacture of Foods
15 Manufacture of Beverages
16 Manufacture of Tobacco
3 17 Manufacture of Textile
18 Manufacture of Textile Wearing Apparel, Footwear, and Caps
19 Manufacture of Leather, Fur, Feather and Related Products
4 20 Processing of Timber, Manufacture of Wood, Bamboo, Rattan, Palm, and Straw Products
21 Manufacture of Furniture
22 Manufacture of Paper and Paper Products
23 Printing, Reproduction of Recording Media
24 Manufacture of Articles for Culture, Education and Sport Activity
5 25 Processing of Petroleum, Coking, Processing of Nuclear Fuel
26 Manufacture of Raw Chemical Materials and Chemical Products
6 27 Manufacture of Medicines
28 Manufacture of Chemical Fibres
7 29 Manufacture of Rubber
30 Manufacture of Plastics
31 Manufacture of Non-metallic Mineral Products
8 32 Smelting and Pressing of Ferrous Metals
33 Smelting and Pressing of Non-ferrous Metals
9 34 Manufacture of Metal Products
35 Manufacture of General Purpose Machinery
36 Manufacture of Special Purpose Machinery
10 37 Manufacture of Transport Equipment
11 39 Electrical Machinery & Equipment
40 Manufacture of Communication Equipment, Computers and Other Electronic Equipment
41 Manufacture of Measuring Instruments and Machinery for Cultural Activity and Office Work
42 Manufacture of Artwork and Other Manufacturing
12 43 Recycling and Disposal of Waste
44 Electric Power & Heat Power
45 Production & Supply of Gas
46 Production & Supply of Water
Source: Author’s own work. Based on National Industries Classification (GB/T 4754-2011)

Innovative behaviour of Chinese manufacturing firms
29
Table A2 Codes of Registered Types
Code Registered Types Code Registered Types
110 State-owned enterprises 173 Private limited liability company
120 Collective-owned enterprises 174 Private shareholding company
130 Shareholding cooperatives 190 Other domestic-owned enterprises
141 State-owned jointly operated enterprises 210 Hong Kong-Macau-Taiwan joint venture
142 Collective jointly operated enterprises 220 Hong Kong-Macau-Taiwan investors cooperative
143 State- and collective-owned jointly operated
enterprises
230 Hong Kong-Macau-Taiwan wholly owned enterprises
149 Other jointly operated enterprises 240 Hong Kong-Macau-Taiwan shareholding limited
liability company
151 Wholly state-owned enterprises 310 Foreign joint venture
159 Other limited liability company 320 Foreign cooperative
160 Joint stock limited liability company 330 Foreign wholly owned enterprises
171 Wholly private-owned enterprises 340 Foreign shareholding limited liability company
172 Private-cooperative enterprises
Source: Annual Survey of Manufacturing Enterprises
References
Acs, Z. J., & Audretsch, D. B. (1990). Innovation and small firms. MIT Press, Cambridge, MA.
Acs, Z. J., & Isberg, S. C. (1991). Innovation, firm size and corporate finance: an initial
inquiry. Economics Letters, 35(3), 323-326.
Aghion, P., Bloom, N., Blundell, R., Griffith, R., & Howitt, P. (2005).Competition and innovation: an
inverted-U relationship. Quarterly Journal of Economics, 120(2), 701-728.
Alcorta, L., Tomlinson, M., & Liang, A. T. (2009). Knowledge generation and innovation in
manufacturing firms in China. Industry and Innovation, 16(4-5), 435-461.
Ambec, S., Cohen, M. A., Elgie, S., & Lanoie, P. (2013). The Porter hypothesis at 20: can
environmental regulation enhance innovation and competitiveness?. Review of Environmental
Economics and Policy, res016.
Ang, J. B., & Madsen, J. B. (2011). Can second-generation endogenous growth models explain the
productivity trends and knowledge production in the Asian miracle economies?. Review of
Economics and Statistics, 93(4), 1360-1373.
Asheim, B. T., & Isaksen, A. (1997). Location, agglomeration and innovation: towards regional
innovation systems in Norway?. European Planning Studies, 5(3), 299-330.

Innovative behaviour of Chinese manufacturing firms
30
Audretsch David, B. (2006). Entrepreneurship, innovation and economic growth. Chaltham: Edward
Elgar Publishing.
Batabyal, A. A., & Nijkamp, P. (2013). Human capital use, innovation, patent protection, and economic
growth in multiple regions. Economics of Innovation and New Technology, 22(2), 113-126.
Becheikh, N., Landry, R., & Amara, N. (2006). Lessons from innovation empirical studies in the
manufacturing sector: a systematic review of the literature from 1993–2003. Technovation, 26(5),
644-664.
Braczyk, H. J., Cooke, P. N., & Heidenreich, M. (1998). Regional innovation systems. University
College London Press, London.
Bruche, G. (2010). Tata Motor’s transformational resource acquisition path. Working Paper No. 55,
Berlin School of Economics and Law, Berlin.
Cai, H., & Liu, Q. (2009). Competition and corporate tax avoidance: evidence from Chinese industrial
firms. The Economic Journal, 119(537), 764-795.
Carboni, O. A. (2011). R&D subsidies and private R&D expenditures: evidence from Italian
manufacturing data. International Review of Applied Economics, 25(4), 419-439.
Cassiman, B. and Veugelers, R. (2002). Complementarity in the innovation strategy: internal R&D,
external technology acquisition, and cooperation in R&D. CEPR Discussion Paper No. 3284.
Available at SSRN: http://ssrn.com/abstract =308601
Castillejo, J. A. M., Barrachina, M. E. R., Llopis, A. S., & Llopis, J. A. S. (2006). The decision to invest
in R&D: a panel data analysis for Spanish manufacturing. International Journal of Applied
Economics, 3(2), 80-94.
Chang, C. & Robin, S. (2006). Doing R&D and/or importing technologies: The critical importance of
firm size in Taiwan’s manufacturing industries. Review of Industrial Organization, 29(3), 253-278.
Chen, Y. & Puttitanun, T. (2005). Intellectual property rights and innovation in developing
countries. Journal of Development Economics, 78(2), 474-493.
Cohen, W. M., & Levinthal, D. A. (1989). Innovation and learning: the two faces of R&D. The
Economic Journal, 569-596.
Cohen, W. M., & Klepper, S. (1996). A reprise of size and R&D. The Economic Journal, 925-951.
Cooke, P. (1992). Regional innovation systems: competitive regulation in the new
Europe. Geoforum, 23(3), 365-382.
Innovative behaviour of Chinese manufacturing firms
31
Cooke, P. (2001). Regional innovation systems, clusters, and the knowledge economy. Industrial and
Corporate Change, 10(4), 945-974.
Cooke, P. (2002). Knowledge Economies. Clusters, Learning and Cooperative Advantage. Routledge,
London.
Corrado, Carol A. and Haskel, Jonathan and Iommi, Massimiliano and Jona Lasinio, Cecilia (2012)
Intangible Capital and Growth in Advanced Economies: Measurement and Comparative Results.
CEPR Discussion Paper No. DP9061. Available at SSRN: http://ssrn.com/abstract=2153512
Criscuolo, C., Haskel, J. E., & Slaughter, M. J. (2010). Global engagement and the innovation activities
of firms. International Journal of Industrial Organization, 28(2), 191-202.
Cuervo-Cazurra, A., & Annique Un, C. (2010). Why some firms never invest in formal R&D. Strategic
Management Journal, 31(7), 759-779.
Cumming, D. J., & MacIntosh, J. G. (2000). The determinants of R&D expenditures: a Study of the
Canadian Biotechnology Industry. Review of Industrial Organization, 17(4), 357-370.
Czarnitzki, D., & Hottenrott, H. (2011a). R&D investment and financing constraints of small and
medium-sized firms. Small Business Economics,36(1), 65-83.
Czarnitzki, D., Hanel, P., & Rosa, J. M. (2011b). Evaluating the impact of R&D tax credits on
innovation: a microeconometric study on Canadian firms. Research Policy, 40(2), 217-229.
Dai, M., & Yu, M. (2013). Firm R&D, absorptive capacity and learning by exporting: firm-level
evidence from China. The World Economy, 36(9), 1131-1145.
Damanpour, F. (1992). Organizational size and innovation. Organization Studies, 13(3), 375-402.
De Jong, J. P., & Vermeulen, P. A. (2006). Determinants of product innovation in small firms a
comparison across industries. International Small Business Journal, 24(6), 587-609.
Del Canto, J. G., & Gonzalez, I. S. (1999). A resource-based analysis of the factors determining a firm's
R&D activities. Research Policy, 28(8), 891-905.
Diez, J. R., & Kiese, M. (2009). Regional innovation systems. International Encyclopedia of Human
Geography, 246-251.
Dong, J., & Gou, Y. N. (2010). Corporate governance structure, managerial discretion, and the R&D
investment in China. International Review of Economics & Finance, 19(2), 180-188.
Fagerberg, J., Mowery, D. C., & Nelson, R. R. (2006). The Oxford Handbook of Innovation. Oxford
University Press, Oxford.

Innovative behaviour of Chinese manufacturing firms
32
Fu, X., Pietrobelli, C., & Soete, L. (2011). The role of foreign technology and indigenous innovation in
the emerging economies: technological change and catching-up. World Development, 39(7),
1204-1212.
Fleisher, Belton M. and McGuire, William H. and Smith, Adam Nicholas and Zhou, Mi (2013)
Intangible Knowledge Capital and Innovation in China. IZA Discussion Paper No. 7798. Available
at SSRN: http://ssrn.com/abstract=2367673
Galende, J., & de la Fuente, J. M. (2003). Internal factors determining a firm’s innovative
behaviour. Research Policy, 32(5), 715-736.
Ganotakis, P., & Love, J. H. (2011). R&D, product innovation, and exporting: evidence from UK new
technology based firms. Oxford Economic Papers, 63(2), 279-306.
Gassmann, O., & Han, Z. (2004). Motivations and barriers of foreign R&D activities in China. R&D
Management, 34(4), 423-437.
Girma, S., Görg, H., & Hanley, A. (2008). R&D and exporting: a comparison of British and Irish
firms. Review of World Economics, 144(4), 750-773.
Girma, S., Gong, Y., & Görg, H. (2009). What determines innovation activity in Chinese state-owned
enterprises? The role of foreign direct investment. World Development, 37(4), 866-873.
González, X., & Pazó, C. (2008). Do public subsidies stimulate private R&D spending?. Research
Policy, 37(3), 371-389.
Grossman, G. M., & Helpman, E. (1991). Trade, knowledge spillovers, and growth. European
Economic Review, 35(2), 517-526.
Hall, B. H. (2002). The financing of research and development. Oxford Review of Economic
Policy, 18(1), 35-51.
Hobday, M. (1995). East Asian latecomer firms: learning the technology of electronics. World
Development, 23(7), 1171-1193.
Hoffman, K., Parejo, M., Bessant, J., & Perren, L. (1998). Small firms, R&D, technology and
innovation in the UK: a literature review. Technovation, 18(1), 39-55.
Hyytinen, A. & Toivanen, O. (2005). Do financial constraints hold back innovation and growth?:
evidence on the role of public policy. Research Policy, 34(9), 1385-1403.
Javorcik, B. S. (2004). Does foreign direct investment increase the productivity of domestic firms? In
search of spillovers through backward linkages. American Economic Review, 605-627.

Innovative behaviour of Chinese manufacturing firms
33
Jefferson, G., Albert, G. Z., Xiaojing, G., & Xiaoyun, Y. (2003). Ownership, performance, and
innovation in China's large- and medium-size industrial enterprise sector. China Economic
Review, 14(1), 89-113.
Jefferson, G. H., Huamao, B., Xiaojing, G., & Xiaoyun, Y. (2006). R&D performance in Chinese
industry. Economics of Innovation and New Technology, 15(4-5), 345-366.
Jia, R., Guo, X., & Marinova, D. (2013). The role of the clean development mechanism in achieving
China’s goal of a resource-efficient and environmentally friendly society. Environment,
Development and Sustainability, 15(1), 133-148.
Kang, K. N., & Park, H. (2012). Influence of government R&D support and inter-firm collaborations
on innovation in Korean biotechnology SMEs. Technovation, 32(1), 68-78.
Kleinknecht, A., Van Montfort, K., & Brouwer, E. (2002). The non-trivial choice between innovation
indicators. Economics of Innovation and new technology, 11(2), 109-121.
Klepper, S., & Simons, K. L. (1997). Technological extinctions of industrial firms: an inquiry into their
nature and causes. Industrial and Corporate change, 6(2), 379-460.
Lee, S. (2012). Financial determinants of corporate R&D investment in Korea. Asian Economic
Journal, 26(2), 119-135.
Li, J. & Pu, X. (2009). Technology evolution in China's color TV industry. Industry and
Innovation, 16(4-5), 479-497.
Lin, C., Lin, P., & Song, F. (2010). Property rights protection and corporate R&D: Evidence from
China. Journal of Development Economics, 93(1), 49-62.
Lin, C., Lin, P., Song, F. M., & Li, C. (2011). Managerial incentives, CEO characteristics and corporate
innovation in China’s private sector. Journal of Comparative Economics, 39(2), 176-190.
Lin, C., Ma, Y., Malatesta, P., & Xuan, Y. (2012). Corporate ownership structure and bank loan
syndicate structure. Journal of Financial Economics, 104(1), 1-22.
Loderer, C., & Waelchli, U. (2009). Firm age and performance. Working Paper, University of Bern,
Bern.
Love, J. H., & Roper, S. (1999). The determinants of innovation: R&D, technology transfer and
networking effects. Review of Industrial Organization, 15(1), 43-64.
Lundvall, B. Å. (2010). National systems of innovation: Toward a theory of innovation and interactive
learning (Vol. 2). Anthem Press, UK.

Innovative behaviour of Chinese manufacturing firms
34
Machlup, F. (1958). An economic review of the patent system. Study No. 15 of the Subcommittee on
Patents, Trademarks, and Copyrights of the Committee on the Judiciary, US Senate, Washington,
DC: US Government Printing Office.
Majumdar, S. K. (1995). The determinants of investment in new technology: an examination of
alternative hypotheses. Technological Forecasting and Social Change, 50(3), 235-247.
Mansfield, E. (1986). The R&D tax credit and other technology policy issues. The American Economic
Review, 190-194.
Maskus, K. E., Neumann, R., & Seidel, T. (2012). How national and international financial
development affect industrial R&D. European Economic Review, 56(1), 72-83.
Mazzoleni, R., & Nelson, R. R. (1998). The benefits and costs of strong patent protection: a
contribution to the current debate. Research Policy, 27(3), 273-284.
Meyer, K. E., Wright, M., & Pruthi, S. (2009). Research notes and commentaries managing knowledge
in foreign entry strategies: a resource-based analysis. Strategic Management Journal, 30(6),
557-574.
Michie, J. (1998). Introduction. The internationalisation of the innovation process. International
Journal of the Economics of Business, 5(3), 261-277.
Nelson, R. R. (1993). National systems of innovation: a comparative study. Oxford: Oxford University
Press.
Newbert, S. L. (2008). Value, rareness, competitive advantage, and performance: a conceptual - level
empirical investigation of the resource-based view of the firm. Strategic Management
Journal, 29(7), 745-768.
OECD (2013). The People's Republic of China - Avoiding the middle-income trap: policies for
sustained and inclusive growth. Better Policies. OECD Publishing, Paris.
DOI: http://dx.doi.org/10.1787/9789264207974-en
Ogawa, K. (2007). Debt, R&D investment and technological progress: a panel study of Japanese
manufacturing firms' behaviour during the 1990s. Journal of the Japanese and International
Economies, 21(4), 403-423.
Parisi, M. L., Schiantarelli, F., & Sembenelli, A. (2006). Productivity, innovation and R&D: Micro
evidence for Italy. European Economic Review, 50(8), 2037-2061.
Pavitt, K. (2002). Knowledge about knowledge since Nelson & Winter: a mixed record (No. 83).

Innovative behaviour of Chinese manufacturing firms
35
SPRU-Science and Technology Policy Research, University of Sussex.
Polanyi, M. (1997). The tacit dimension. Knowledge in Organizations, 135-146.
Porter, M. E. (1990). The competitive advantage of nations. Harvard Business Review, 68(2), 73-93.
Rajan, R. G. and Zingales, L. (1998). Financial dependence and growth. American Economic Review,
88, 559-587.
Romijn, H., & Albaladejo, M. (2002). Determinants of innovation capability in small electronics and
software firms in southeast England. Research Policy,31(7), 1053-1067.
Roberts, M. J., & Tybout, J. R. (1997). The decision to export in Colombia: an empirical model of entry
with sunk costs. The American Economic Review, 545-564.
Schanz, C., Hüsig, S., Dowling, M., & Gerybadze, A. (2011). ‘Low cost-high tech’ innovations for
China: why setting up a separate R&D unit is not always the best approach. R&D
Management, 41(3), 307-317.
Schumpeter, J.A. (1934). The theory of economic development. Cambridge, MA: Harvard University
Press.
Schumpeter, J. A. (1942). Socialism, capitalism and democracy. New York: Harper and Brothers.
Shi, X., Wu, Y., & Zhao, D. (2014). Knowledge intensive business services and their impact on
innovation in China. Service Business, 8(4), 479-498.
Simonen, J., & McCann, P. (2008). Firm innovation: The influence of R&D cooperation and the
geography of human capital inputs. Journal of Urban Economics, 64(1), 146-154.
Souitaris, V. (2002). Technological trajectories as moderators of firm-level determinants of
innovation. Research Policy, 31(6), 877-898.
Stock, G. N., Greis, N. P., & Fischer, W. A. (2002). Firm size and dynamic technological
innovation. Technovation, 22(9), 537-549.
Tingvall, P. G., & Poldahl, A. (2006). Is there really an inverted U-shaped relation between competition
and R&D?. Economics of Innovation and New Technology, 15(2), 101-118.
Tsai, W. (2001). Knowledge transfer in intraorganizational networks: effects of network position and
absorptive capacity on business unit innovation and performance. Academy of Management
Journal, 44(5), 996-1004.
Van de Ven, A. H., D.E. Polley, R. Garud, and S. Venkataraman (1999). The innovation journey. Oxford:
Oxford University Press.
Innovative behaviour of Chinese manufacturing firms
36
Vega-Jurado, J., Gutiérrez-Gracia, A., Fernández-de-Lucio, I., & Manjarrés-Henríquez, L. (2008). The
effect of external and internal factors on firms’ product innovation. Research Policy, 37(4),
616-632.
Von Zedtwitz, M. (2004). Managing foreign R&D laboratories in China. R&D Management, 34(4),
439-452.
Wernerfelt, B. (1984). A resource-based view of the firm. Strategic Management Journal, 5(2),
171-180.
Wu, Y. (2006). R&D and productivity: an empirical study on Chinese manufacturing
industry. Economic Research Journal, 11, 60-70.
Wu, Y. (2012). R&D behaviour in Chinese firms. Economics Discussion Paper Series, Business School,
The University of Western Australia.
Xi, L., Lei, L., & Guisheng, W. (2009). Evolution of the Chinese automobile industry from a sectoral
system of innovation perspective. Industry and Innovation, 16(4-5), 463-478.
Yusuf, S., Wang, S., & Nabeshima, K. (2009). Fiscal policies for innovation. Innovation for
development and the role of government: a perspective from the East Asia and Pacific Region,
149-80. Washington, DC: World Bank.
Zhang, H. (2005). Two faces of R&D, activity of FDI and the growth of productivity of domestic
manufacturing in China. Economic Research Journal, 5, 107-117.
Zhang, C., Zeng, D.Z., Mako, W.P., Seward, J. (2009). Promoting enterprise-led innovation in China.
World Bank. Washington, DC.
Zhou, Y., He, X. & Shen, Y. (2012). An evaluation of the efficiency of Chinese industry enterprises’
innovation performance. Economic Research Journal, 5, 107-119.
Zhou, Y. (2014). Role of institutional quality in determining the R&D investment of Chinese
firms. China & World Economy, 22(4), 60-82.