Embed Size (px)
Citation preview
Games and Economic Behavior 41 (2002) 1–25www.academicpress.com
The effect of intergroup competition on groupcoordination: an experimental study✩
Gary Bornstein,a Uri Gneezy,b,∗ and Rosmarie Nagelc
a The Center for Rationality and Interactive Decision Theory, The Hebrew University of Jerusalem,Jerusalem, Israel
b The University of Chicago, Graduate School of Business and Technion, Chicago, IL 60637, USAc Department of Economics, University of Pompeu Fabra, Barcelona, Spain
Received 4 May 1999
Abstract
We studied the effect of intergroup competition on behavior in the minimal-effort game(Van Huyck et al. 1990. Amer. Econ. Rev. 80, 234–248). The group with the higherminimum won the competition and its members were paid according to the game’spayoff matrix. The members of the losing group were paid nothing. We found thatintergroup competition improved collective efficiency as compared with single-groupcontrol treatments where each group played an independent coordination game (eitherwith or without information about the minimum chosen by the outgroup). We then studiedanother intergroup competition treatment in which the members ofboth groups were paidaccording to the original payoff matrix, and, in addition, each member of the winning groupwas paid an extra flat bonus. We found that this milder type of intergroup competition alsoled to better group coordination than in the single-group case. 2002 Elsevier Science (USA). All rights reserved.
JEL classification: C70; C92
Keywords: Tacit coordination games; Strategic uncertainty; Coordination failure
✩ This project was supported by the EU-TMR Research Network ENDEAR (FMRX-CT98-0238),by the grant PB98-1076 of the Spanish Ministry of Education, and by a grant from the Israel ScienceFoundation (1997–2000).
* Corresponding author.E-mail address: [email protected] (U. Gneezy).
0899-8256/02/$ – see front matter 2002 Elsevier Science (USA). All rights reserved.PII: S0899-8256(02)00012-X
2 G. Bornstein et al. / Games and Economic Behavior 41 (2002) 1–25
1. Introduction
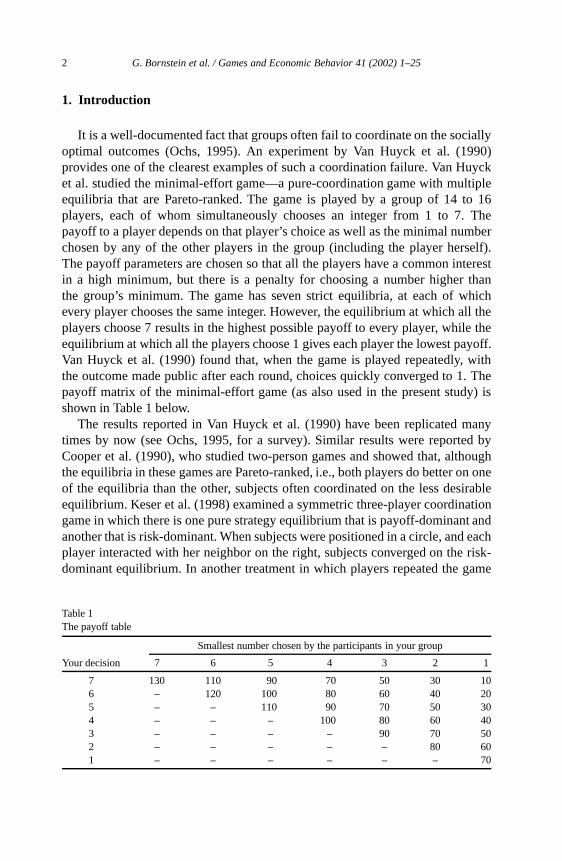
It is a well-documented fact that groups often fail to coordinate on the sociallyoptimal outcomes (Ochs, 1995). An experiment by Van Huyck et al. (1990)provides one of the clearest examples of such a coordination failure. Van Huycket al. studied the minimal-effort game—a pure-coordination game with multipleequilibria that are Pareto-ranked. The game is played by a group of 14 to 16players, each of whom simultaneously chooses an integer from 1 to 7. Thepayoff to a player depends on that player’s choice as well as the minimal numberchosen by any of the other players in the group (including the player herself).The payoff parameters are chosen so that all the players have a common interestin a high minimum, but there is a penalty for choosing a number higher thanthe group’s minimum. The game has seven strict equilibria, at each of whichevery player chooses the same integer. However, the equilibrium at which all theplayers choose 7 results in the highest possible payoff to every player, while theequilibrium at which all the players choose 1 gives each player the lowest payoff.Van Huyck et al. (1990) found that, when the game is played repeatedly, withthe outcome made public after each round, choices quickly converged to 1. Thepayoff matrix of the minimal-effort game (as also used in the present study) isshown in Table 1 below.
The results reported in Van Huyck et al. (1990) have been replicated manytimes by now (see Ochs, 1995, for a survey). Similar results were reported byCooper et al. (1990), who studied two-person games and showed that, althoughthe equilibria in these games are Pareto-ranked, i.e., both players do better on oneof the equilibria than the other, subjects often coordinated on the less desirableequilibrium. Keser et al. (1998) examined a symmetric three-player coordinationgame in which there is one pure strategy equilibrium that is payoff-dominant andanother that is risk-dominant. When subjects were positioned in a circle, and eachplayer interacted with her neighbor on the right, subjects converged on the risk-dominant equilibrium. In another treatment in which players repeated the game
Table 1The payoff table
Smallest number chosen by the participants in your group
Your decision 7 6 5 4 3 2 1
7 130 110 90 70 50 30 106 – 120 100 80 60 40 205 – – 110 90 70 50 304 – – – 100 80 60 403 – – – – 90 70 502 – – – – – 80 601 – – – – – – 70
G. Bornstein et al. / Games and Economic Behavior 41 (2002) 1–25 3
with the same counterparts, they learned to coordinate on the payoff-dominantequilibrium.
The research on group coordination cited above was restricted to single-groupsettings. However, in many real-life situations a group’s payoffs are contingenton its performancerelative to that of other groups, rather than its absolute levelof performance. This is the case in competition between different organizations(e.g., firms) as well as between subgroups within the same organization (e.g.,independent profit centers, R&D teams). Keeping other things equal (e.g., thegroups’ size, skill level, and other relevant resources), the group that wins thecompetition is the one whose members are better coordinated with one anotherthan the members of the competing groups. The purpose of the present studywas to see whether competition between groups improves coordination within thegroup.
To incorporate intergroup competition, we modified the Van Huyck et al.(1990) game in the following way. The game involved two groups,A and B,with n players in each group. Each player in each group independently chose anintegerei∈A(B) from 1 to 7. If the minimum chosen in teamA, minA = min{ei∈A},was larger than the one chosen in teamB, minB = min{ei∈B}, teamA won thecompetition and each of its members was paid according to the original payoffmatrix. Members of teamB were paid nothing. In case of a tie, minA = minB ,each player in both teams was paid half the payoff in the original matrix.
The competition between the groups does not change the set of strict equilibriawithin each group. As in the original, single-group game, the best responsein the intergroup game is for each player in each team to match the minimalnumber chosen inher team. Thus, the intergroup game, like the single-groupgame, has seven strict equilibria, with the equilibrium at which all team memberschoose 7 being the most efficient and the equilibrium at which all playerschoose 1 being the least efficient.1 However, intergroup competition may changethe equilibrium on which players coordinate. As demonstrated by Schelling(1960), players are often able to coordinate by focusing on aspects of theenvironment that are ignored by economic models. We surmise that winning (ornot losing) the competition against the outgroup might constitute such a focalpoint. This conjecture is consistent with Bornstein and Ben-Yossef (1994) andSchopler and Insko (1992), which shows that interaction between groups is highlycompetitive—much more so than interaction between individuals under the samestructural conditions. However, since none of those experiments dealt with a pure-coordination problem, substantiating this hypothesis remains an empirical matter.As pointed out by several researchers (e.g., Schelling, 1960; Lucas, 1986; and
1 In addition, there is a large number of weak equilibria where non-critical players in thelosing team can change their strategies without affecting the outcome. This issue is dealt with boththeoretically and experimentally later in the paper.
4 G. Bornstein et al. / Games and Economic Behavior 41 (2002) 1–25
Ochs, 1995), one cannot know what makes an equilibrium focal without studyinghow individuals actually behave.
2. Experimental design and procedure
2.1. Design
To study the effect of intergroup competition on behavior in the minimal-effort game, we compared the intergroup game described above with the standard,single-group game. Since coordination is a rather subtle issue, in the sense that awide variety of theoretically irrelevant cues could make an outcome prominent,we were particularly careful in designing this comparison.2 First, intergroupcompetition necessarily involves the copresence of two distinctly labeled groups.Therefore, to exclude the possibility that the mere categorization of subjects intogroups (Tajfel, 1982), rather than the actual competition between the groups,is responsible for any potential effects, we included two groups in the controlcondition as well. But rather than competing against each other, each group inthe control treatment was engaged in a separate (independent) game. Second,following each period of play, subjects in the intergroup competition treatmentwere informed about the minimal-effort chosen in both groups. Therefore, toensure that this information per se was not affecting their behavior, we included inour design a second control treatment where, in addition to the minimum chosenin their own group, the players were informed about the minimum chosen in theother group.
2.2. Subjects
The participants were 210 undergraduate students at the University of PompeuFabra with no previous experience with the task. Subjects were recruited bycampus advertisements offering monetary reward for participating in a decisiontask. Subjects participated in the experiment in cohorts of 14.
2.3. Procedure
Upon arrival each participant received 500 pesetas for showing up and eachwas seated in a separate cubicle facing a personal computer. The subjects weregiven written instructions concerning the rules and payoffs of the game (seeAppendix A) and were asked to follow the instructions as the experimenter read
2 As pointed out by Roth (1995), “. . . details of how [coordination] experiments are conductedmay be of considerable importance, even if they concern features of the environment not addressed byexisting theories” (p. 12).
G. Bornstein et al. / Games and Economic Behavior 41 (2002) 1–25 5
them aloud. Then subjects were given a quiz to test their understanding. Theiranswers were checked by the experimenters and explanations were repeated whennecessary.
At the beginning of the experiment, the 14 subjects were randomly dividedinto two equal-sized groups. Subjects played 10 rounds of the game. The numberof rounds to be played was made known in advance. In each round each subjecthad to choose an integer from 1 to 7. Following the completion of the round,each subject received feedback concerning: (a) the lowest number chosen by themembers of her group in that round; (b) her earnings (in pesetas) in that round;and (c) her cumulative earnings. In two of the treatments (as detailed below),subjects also received feedback concerning the lowest number chosen in theoutgroup. Each session lasted about 30 min with an average payment of 1109pesetas (approximately US $9) per subject (including the fixed show-up fee of500 pesetas). Subjects were paid in private. Each 14-person cohort took part inone of the three following treatments.
2.3.1. Intergroup competition (IC)The group with the higher minimum won the competition and each of its
members was paid according to the original payoff matrix. Members of the losingteam were paid nothing. In case of a tie, each player in both groups was paidhalf the payoff in the original matrix (see Appendix A). Following each round,the participants were informed about the minimum chosen inboth groups. Six14-person cohorts participated in this treatment.
2.3.2. No competition (NC)In this control treatment the payoff for each player was determined by her own
choice and the minimum chosen in her group (see Appendix A). There was nointerdependence between the two groups. The participants were informed onlyabout the minimum number chosen in their own group. Three 14-person cohortsparticipated in this treatment.
2.3.3. No competition with information (NCI)This control treatment is identical to the NC above (that is, each of the two
groups played an independent game) with one exception—following each roundsubjects were informed about the minimum of the outgroup in addition to that oftheir own group (as was the case in IC experimental treatment). Six 14-personcohorts participated in this treatment.
6 G. Bornstein et al. / Games and Economic Behavior 41 (2002) 1–25
3. Results
3.1. Overall effort levels
First we compared the three treatments with regard to the mean effort level perperiod averaged across the 10 periods of the game. The mean effort level was 5.3in the IC treatment, 3.6 in the NC treatment, and 3.5 in the NCI treatments. Thedifference between the IC and the NC treatment is statistically significant by aWilcoxon rank test3 (z = 2.248,p < 0.0246), and so is the difference betweenthe IC and NCI treatment (z = 2.830,p < 0.0047). The difference between theNC and NCI control treatments is not significant.
3.2. Convergence
Subjects’ initial decisions were unaffected by treatment. The mean effort levelin Period 1 was 5.7, 5.6, and 5.5 in treatments IC, NC, and NCI, respectively.These means are not significantly different from one another.
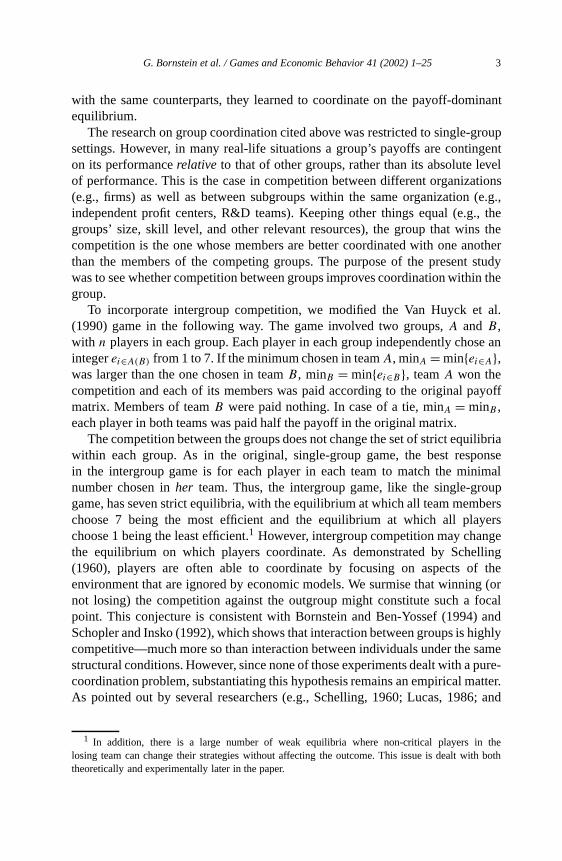
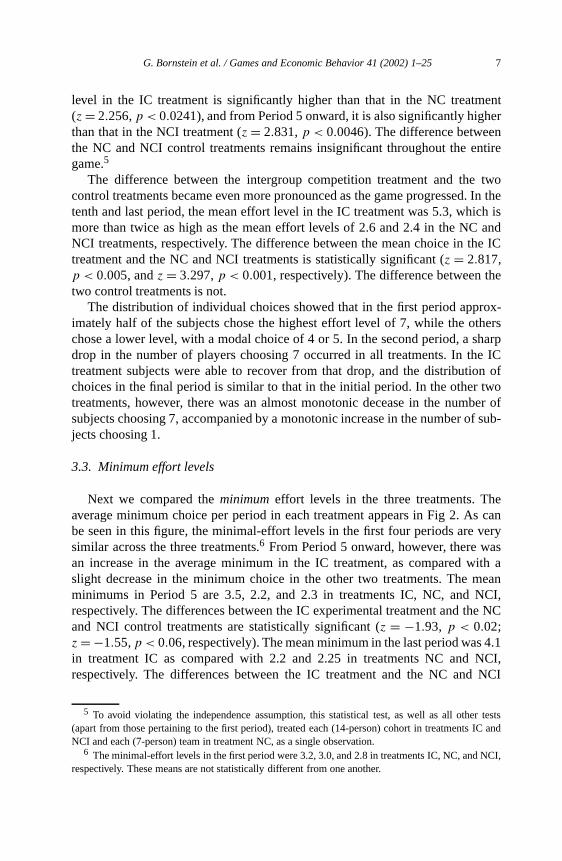
Before long, however, subjects in the NC and NCI control treatments beganreducing their effort level as compared with those in the IC experimentaltreatment, whose effort level remained, on average, quite stable throughout the10-period game. Figure 1 displays the mean choice per period in each of thethree treatments. The difference between the IC treatment and the two controltreatments is already visible in Period 3.4 From Period 4 onward, the mean effort
Fig. 1. Average mean choice over time for each treatment separately. (The ICB treatment is discussedin the next section.)
3 All reported tests are one-tailed.4 The mean effort in the third period was 5.1 in the IC treatment, as compared with 4.2 and 4.1 in
treatments NC and NCI, respectively.
G. Bornstein et al. / Games and Economic Behavior 41 (2002) 1–25 7
level in the IC treatment is significantly higher than that in the NC treatment(z = 2.256,p < 0.0241), and from Period 5 onward, it is also significantly higherthan that in the NCI treatment (z = 2.831,p < 0.0046). The difference betweenthe NC and NCI control treatments remains insignificant throughout the entiregame.5
The difference between the intergroup competition treatment and the twocontrol treatments became even more pronounced as the game progressed. In thetenth and last period, the mean effort level in the IC treatment was 5.3, which ismore than twice as high as the mean effort levels of 2.6 and 2.4 in the NC andNCI treatments, respectively. The difference between the mean choice in the ICtreatment and the NC and NCI treatments is statistically significant (z = 2.817,p < 0.005, andz = 3.297,p < 0.001, respectively). The difference between thetwo control treatments is not.
The distribution of individual choices showed that in the first period approx-imately half of the subjects chose the highest effort level of 7, while the otherschose a lower level, with a modal choice of 4 or 5. In the second period, a sharpdrop in the number of players choosing 7 occurred in all treatments. In the ICtreatment subjects were able to recover from that drop, and the distribution ofchoices in the final period is similar to that in the initial period. In the other twotreatments, however, there was an almost monotonic decease in the number ofsubjects choosing 7, accompanied by a monotonic increase in the number of sub-jects choosing 1.
3.3. Minimum effort levels
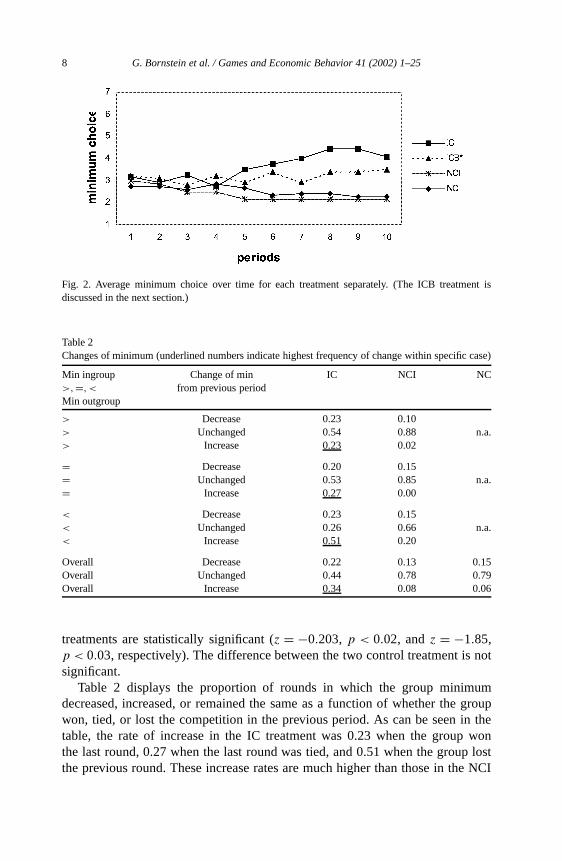
Next we compared theminimum effort levels in the three treatments. Theaverage minimum choice per period in each treatment appears in Fig 2. As canbe seen in this figure, the minimal-effort levels in the first four periods are verysimilar across the three treatments.6 From Period 5 onward, however, there wasan increase in the average minimum in the IC treatment, as compared with aslight decrease in the minimum choice in the other two treatments. The meanminimums in Period 5 are 3.5, 2.2, and 2.3 in treatments IC, NC, and NCI,respectively. The differences between the IC experimental treatment and the NCand NCI control treatments are statistically significant (z = −1.93, p < 0.02;z = −1.55,p < 0.06, respectively). The mean minimum in the last period was 4.1in treatment IC as compared with 2.2 and 2.25 in treatments NC and NCI,respectively. The differences between the IC treatment and the NC and NCI
5 To avoid violating the independence assumption, this statistical test, as well as all other tests(apart from those pertaining to the first period), treated each (14-person) cohort in treatments IC andNCI and each (7-person) team in treatment NC, as a single observation.
6 The minimal-effort levels in the first period were 3.2, 3.0, and 2.8 in treatments IC, NC, and NCI,respectively. These means are not statistically different from one another.
8 G. Bornstein et al. / Games and Economic Behavior 41 (2002) 1–25
Fig. 2. Average minimum choice over time for each treatment separately. (The ICB treatment isdiscussed in the next section.)
Table 2Changes of minimum (underlined numbers indicate highest frequency of change within specific case)
Min ingroup Change of min IC NCI NC>,=,< from previous periodMin outgroup
> Decrease 0.23 0.10> Unchanged 0.54 0.88 n.a.> Increase 0.23 0.02
= Decrease 0.20 0.15= Unchanged 0.53 0.85 n.a.= Increase 0.27 0.00
< Decrease 0.23 0.15< Unchanged 0.26 0.66 n.a.< Increase 0.51 0.20
Overall Decrease 0.22 0.13 0.15Overall Unchanged 0.44 0.78 0.79Overall Increase 0.34 0.08 0.06
treatments are statistically significant (z = −0.203, p < 0.02, andz = −1.85,p < 0.03, respectively). The difference between the two control treatment is notsignificant.
Table 2 displays the proportion of rounds in which the group minimumdecreased, increased, or remained the same as a function of whether the groupwon, tied, or lost the competition in the previous period. As can be seen in thetable, the rate of increase in the IC treatment was 0.23 when the group wonthe last round, 0.27 when the last round was tied, and 0.51 when the group lostthe previous round. These increase rates are much higher than those in the NCI
G. Bornstein et al. / Games and Economic Behavior 41 (2002) 1–25 9
treatment, where, following a “win,” a “tie,” and a “loss,” the minimum increasedin 0.02, 0.00, and 0.20, of the cases, respectively.7
The assumption that players used a fictitious-play strategy can perhaps explainwhy (1) the minimum was much more likely to increase in the IC treatment thanin the NC and NCI treatments, and (2) the rate of increases in the IC treatmentwas much higher following a loss than following a tie or a win. In the NC andNCI control treatments, if a player assumes that the behavior of all other playersremains constant, her optimal response in Periodt + 1 is to select the team’sminimum in Periodt . The same is true in treatment IC, if the ingroup won ortied the competition in the previous period. Following a loss in the IC treatment,however, a player can choose a higher effort level without decreasing her outcome.As was the case in Cachon and Camerer’s experiment (1996), there is only onedirection in which behavior can be modified to (possibly) improve one’s payoffs.
4. An additional treatment: intergroup competition for a bonus
The results just described demonstrate that intergroup competition improvescoordination in the minimum effort game by moving group members in thedirection of the collectively rational equilibria. It also shows that for this to happenthe competition must have payoff consequences. Merely providing the membersof each group with information about the performance of the other group is notsufficient to generate this effect.
Intergroup competition was induced by only paying the members of thewinning group. While we maintain that many real-life competitions are of this“winner-take-all” nature, modifying the minimum effort game in this way hadan important effect on its structure.8 The main problem faced by players in thestandard minimum effort game (such as the one in treatments NC and NCI)is a tradeoff between efficiency and security. Whereas choosing 7 maximizescollective efficiency, choosing 1 maximizes individual security, as it guaranteesa player a payoff of 70—more than can be guaranteed by any other strategy.
In contrast, in the intergroup game (such as the one in treatment IC) a playercannot guarantee a payoff of 70 by choosing 1, since in this case her group cando no better than tie the game, resulting in a payoff of 35. Therefore action 1is no longer selected for security considerations. In fact, since there is no actionthat can ensure a player a payoff greater than zero, no equilibrium is selected bysecurity.
7 It is interesting to note that the group’s minimum in the NCI treatment increased by 20%following a lose in the previous round.
8 For example, the literature on R&D races (e.g., Gilbert and Newberry, 1982; Fudenberg et al.,1983; and Amaldos et al., 2000) commonly assumes that the winner can secure monopoly profitthrough patent protection.
10 G. Bornstein et al. / Games and Economic Behavior 41 (2002) 1–25
To separate the effect of intergroup competition from that of securityconsiderations, we ran an additional treatment calledintergroup competition fora bonus (ICB). In this treatment the members of both teams were paid accordingto the original game matrixregardless of the outcome of the competition and,in addition, the members of the winning group (i.e., the one with the higherminimum) were paid a (fixed) bonus (or half of it for a tie). This new treatmentdoes not change the security considerations of the original minimal-effort game.In the ICB treatment, as in the single-group game, a player can secure a payoff of70 by choosing 1.
4.1. Subjects and procedure
The participants were 70 undergraduate students at the University of PompeuFabra having no previous experience with the task. Subjects participated inthe experiment in cohorts of 14. The procedure was identical to that describedabove for the IC treatment, except, of course, for the payoff scheme. In the ICBtreatment, the members of both groups were paid according to the original payoffmatrix. In addition, each member of the group with the higher minimum was paidan extra bonus of 100 pesetas. Members of the losing team received no bonus. Incase of a tie, each player was paid half the bonus (i.e., 50 pesetas). The participantsin this treatment earned on average 1676 pesetas per subject, including the fixedshow-up fee of 500 pesetas (approximately US $13).
4.2. Results
4.2.1. Overall effort levelThe mean effort level per period in the ICB treatment, averaged across the
10 periods of the game, was 4.5. This effort level is not significantly differentby a Wilcoxson rank-test from that observed in the IC treatment (z = −0.82,p < 0.206). However, it is significantly higher than the effort level in the NCItreatment (z = 1.55,p < 0.06).9
4.2.2. ConvergenceThe mean effort level in Period 1 of the ICB treatment was 5.5, which is
practically identical to that observed in the other treatments. In Period 10 the meaneffort level was 4. This mean is not significantly different from that in the ICtreatment (z = −1.10, p < 0.138). It is, however, significantly higher than thelast period mean in the NCI treatment (z = 1.55,p < 0.06).
9 Since the NC and NCI control treatments in the original experiment were practically identical,we discuss only the tests comparing the ICB treatment with the NCI treatment. The ICB and the NCItreatments not only have similar security considerations but also similar information available to theplayers.
G. Bornstein et al. / Games and Economic Behavior 41 (2002) 1–25 11
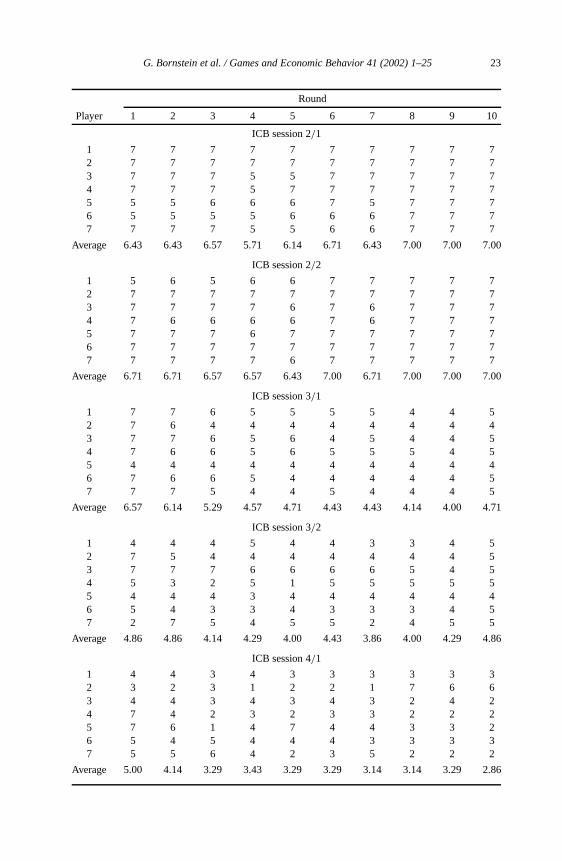
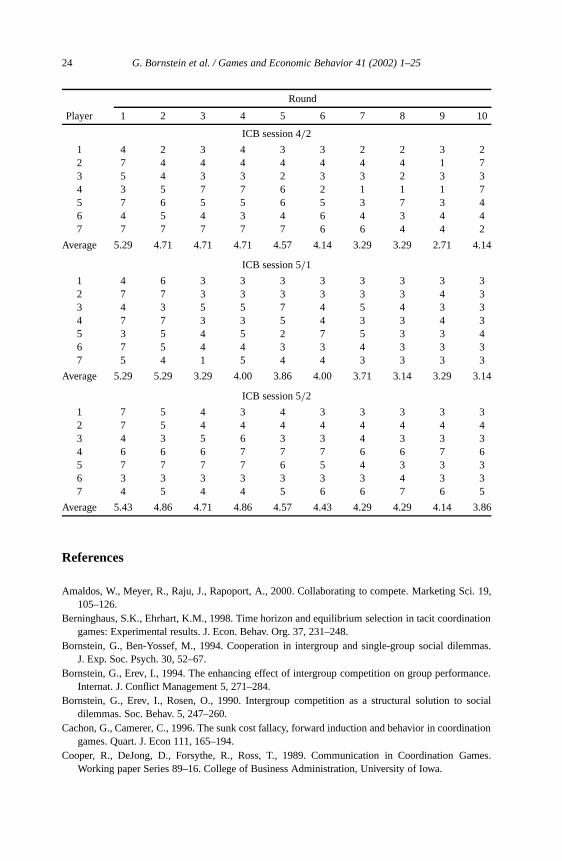
4.2.3. Minimum effort levelsNext we examined theminimum effort level in the ICB treatment. In the first
period, the average minimum choice was 3.2, which is almost identical to thefirst period minima in the other treatments. In the 10th and last period, the meanminimum in treatment ICB was 3.5. This mean is not statistically different fromthe minimum observed in the IC (z = −0.55,p < not significant) and, althoughit is somewhat higher than the mean minimum observed in treatment NCI, thisdifference does not reach acceptable levels of statistical significance (z = 1.10,p < 0.138). The mean effort levels and the minimal-effort levels in the ICBtreatment appear in Figs. 1 and 2, respectively.
4.2.4. LearningFinally, we looked at the number of times the group’s minimum in treatment
ICB decreased, increased, or remained the same as a function of whether thegroup had won, tied, or lost the competition in the previous period. Following awin or a tie, the minimum remained the same in 81% of the cases, decreasedin about 12% of the cases, and increased in the remaining 7% of the cases.This pattern of changes is similar to that observed in the NCI control treatment.Following a loss, however, the minimum in the ICB treatment increased in 41%of the cases (it decreased in 15% and remained unchanged in 44% of the rounds).This rate of increase, while somewhat lower than that in the IC treatment (i.e.,51%), is twice as high as that in the NCI treatment (i.e., 20%). It seems that,following a win or a tie, subjects in the ICB treatment acted similarly to those inthe NCI control treatment. Following a loss, however, their behavior was similarto those in the IC experimental treatment.
5. Conclusions
This paper studied the effect of intergroup competition on group coordination.First, we examined a case in which the winning group, the one which coordinatesbetter, gets the entire “pie.” We found that group coordination in this case ismuch better than that observed in the single-group control treatments. Then, westudied a milder type of intergroup competition in which the members of bothgroups benefit from better internal coordination, but the members of the bettercoordinated group benefit more, as they receive a bonus. This second treatmentenabled us to study the effect of intergroup competition while keeping the securityconsiderations of the original, single-group game intact. Our results show that,although coordination in this case is somewhat less efficient than that in thewinner take all game, it is still significantly better than in the no-competitioncontrol condition.
The present experiment demonstrates that intergroup competition improvescoordination in groups of seven. A seven-person group is somewhere between
12 G. Bornstein et al. / Games and Economic Behavior 41 (2002) 1–25
a small group (in which coordination sometimes succeeds) and a large group (inwhich coordination typically fails). Increasing group size obstructs coordinationby making the security consideration more attractive.10 Therefore, the size of thegroup is more likely to be a factor in the ICB treatment than in the IC treatment,since the structure of the IC game renders security considerations less crucial. Ofcourse, this is an empirical issue that will have to await further research.
The existing literature covers a limited set of means for improving group co-ordination. These include imposing participation costs such that coordinatingon some equilibria results in losing money (Van Huyck et al., 1993; and Ca-chon and Camerer, 1996), allowing one-sided (but not two-sided) communication(Cooper et al., 1989), repeating the game for a large number of periods (Bern-inghaus and Ehrhart, 1998), and introducing a group leader into small groups(Weber et al., 2000). The mechanism studied here, namely, competition with an-other group, appears to be considerably more useful, as it can be implementedregardless of participation cost, communication pattern, and interaction length.
5.1. Implications
Actual group performance typically falls short of its potential performance, asestimated from the capabilities of the individual group members (Steiner, 1972).This phenomenon was first documented by Ringelmann (1913), who had studentspull on a rope either alone or in groups, and discovered that groups exertedless force than could have been expected from their combined individual efforts.This drop in group production was later confirmed in numerous experimentsusing a wide variety of tasks (e.g., Latane et al., 1979; Kerr and Bruun, 1981;and Harkins and Petty, 1982). Group production loss is attributed to two basicphenomena: Free riding (e.g., when they are being evaluated and rewarded as agroup, individual group members do not pull as hard as they can; Ingham et al.,1974) and coordination loss (e.g., group members do no pull on the rope at exactlythe same time or in exactly the same direction; Steiner, 1972).
In previous research we demonstrated that intergroup competition increasesgroup productivity by decreasing free riding within the competing groups(Bornstein et al., 1990; Erev et al., 1993; and Bornstein and Erev, 1994). Thepresent study demonstrated that intergroup competition enhances productivityby improving intragroup coordination. A similar effect of competition onproductivity was reported by Nalbantian and Schotter (1997). These researcherscompared group productivity under different group incentive schemes and foundthat tournament-based group incentives led to higher outputs than all othermechanisms investigated.
10 If each player initially places a small subjective probability on anyone choosing less then 7, thenthe larger the size of the group, the larger is the probability that at least one other group member willchoose a number less than 7 (Ochs, 1995).
G. Bornstein et al. / Games and Economic Behavior 41 (2002) 1–25 13
From a policy point of view, it is clearly desirable to introduce competition incontexts where groups still act in isolation. For example, universities in Europeare funded without much regard to their performance compared to that of otheruniversities. The performance of these institutions can be greatly improved byendowing them, at least to some extent, on a competitive basis. To use Nalbantianand Schotter’s (1997) words, it indeed seems that “a little [intergroup] competitiongoes a long, long way.”
Appendix A
A.1. Instructions for the intergroup competition (IC) treatment
This is an experiment on the economics of decision making. Your earnings will depend on yourown decision and the decisions of the other participants. You will be paid in cash at the end of theexperiment. Please read the instructions carefully. The instructions are identical for all the participantsin the room. If you have a question raise your hand and the instructor will come over and answer yourquestion in private. Please do not communicate from now on with the other participants.
A.1.1. The rulesThe experiment consists of 10 rounds. At the beginning you will be divided into two groups of
seven players. The groups will stay the same for all ten rounds of the experiment.Each participants has to choose a number from 1 to 7{1,2,3,4,5,6,7} in each of the 10 rounds.
In each round the smallest number chosen in each group will be identified.Your payoff depends upon your own choice, the smallest number chosen by the participants in
your group and the smallest number chosen by the participants of the other group. More specifically,the group with the smaller of the two smallest numbers wins 0 points, while the participants in thegroup with the larger of the smallest numbers win points according to the table. In case of a tie, thepayoff table will be split evenly, with each cell being divided by 2.
Here is the payoff table:
Smallest number chosen by the participants in your group
Your decision 7 6 5 4 3 2 1
7 130 110 90 70 50 30 106 – 120 100 80 60 40 205 – – 110 90 70 50 304 – – – 100 80 60 403 – – – – 90 70 502 – – – – – 80 601 – – – – – – 70
Let us explain the table. If the smallest number in your group is higher than that of the othergroup, your points in each round depend on your own choice (indicated by the first column of thetable “your decision,” 7, 6,. . . , 1)) and the smallest number chosen in your group, including yournumber (indicated by the first row of the table 7, 6, 5,. . . , 1). Since your choice can be a number from1 to 7, the smallest number can be range from 1 to 7. Your points are determined by the cell in the rowof your decision and the column of the smallest number in your group. An example is given below.
In the table there are cells with “–.” This indicates that a combination of your choices and thesmallest chosen number in your group is not possible. For example, if you choose 4, the smallestnumber in your group cannot be 7, 6, or 5.
14 G. Bornstein et al. / Games and Economic Behavior 41 (2002) 1–25
Remember that if both groups have the same smallest number then the cell which determines yourpayoff is divided by 2. If the smallest number chosen in your group is smaller than that of the othergroup, you will win 0 points.
A.1.2. ExamplesIf the smallest number in your group is higher than that of the other group and
– you chose 3 and the smallest number in your group was 3, you win 90 points (row “3” and column“3”),
– you chose 5 and the smallest number in your group was 3, you win 70 points (row “5” and column“3”),
– you chose 5 and the smallest number in your group was 4, you win 90 points (row “5” and column“4”),
– you chose 4 and the smallest number in your group was 1, you win 40 points (row “4” and column“1”),
– you chose 3 the smallest chosen number in your group cannot be 4 (there is a – in row “3” andcolumn “4”),
– you chose 7 and the smallest number in your group is 4, your points are _____________ (WRITEDOWN YOUR POINTS).
If the smallest numbers in both groups are the same and
– you chose 5 and the smallest number in both groups is 4 , you win 45 points (row “5,” column“4,” points 90/2),
– you chose 4 and the smallest number in both groups is 1, you win 20 points (row “4,” column“1,” points 40/2),
– you chose 6 and the smallest number in both groups is 3, you win ________(WRITE DOWNYOUR POINTS).
A.1.3. Information following each roundFollowing each round you will be informed about the smallest number of your group, the smallest
number in the other group, your own payoff and your accumulated payoffs in the rounds completedso far. We also remind you of your own choice.
A.1.4. Computer screenOn the middle of the screen you will find 7 buttons labeled from 1 to 7. You can indicate your
choice by a mouse click on one of the buttons or by pressing the corresponding key from 1 to 7.You will then be asked whether you “are sure” about this choice. If you click Yes with the mouse orpress the key Y the choice will be final. If you click No with the mouse or press N, you return to thewindow to make your choice again. After you have made your decision, please wait until all the otherparticipants have completed their choices.
At the top of the screen you will find the results of the current period, with your decision, thesmallest number chosen in your group, the smallest number chosen in the other group, your payoff forthat period, and the cumulative payoffs of the rounds completed so far.
A.1.5. PaymentsAt the end of the experiment all your cumulative points will be converted into pesetas with 1 point
beingx pesetas, thus if you have made 10 points you will receivex ∗ 10 pesetas.If you have any question please raise your hand.
G. Bornstein et al. / Games and Economic Behavior 41 (2002) 1–25 15
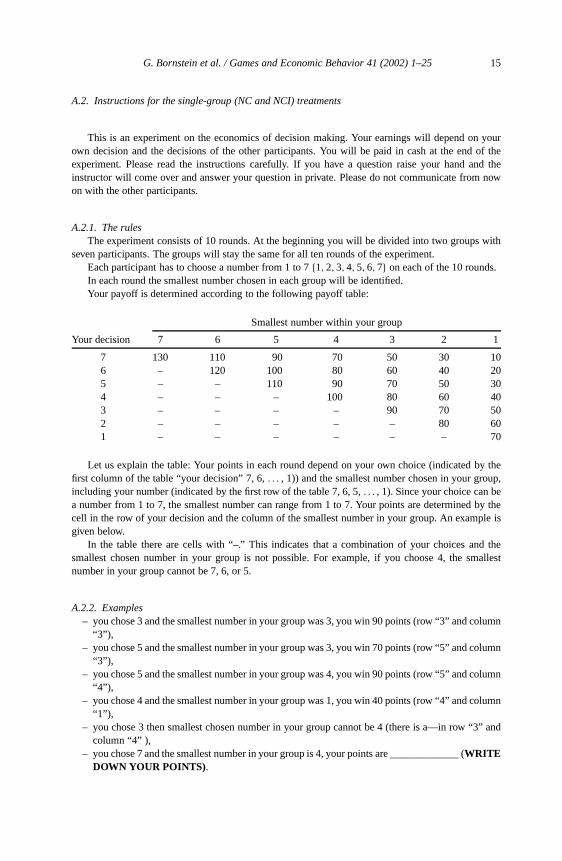
A.2. Instructions for the single-group (NC and NCI) treatments
This is an experiment on the economics of decision making. Your earnings will depend on yourown decision and the decisions of the other participants. You will be paid in cash at the end of theexperiment. Please read the instructions carefully. If you have a question raise your hand and theinstructor will come over and answer your question in private. Please do not communicate from nowon with the other participants.
A.2.1. The rulesThe experiment consists of 10 rounds. At the beginning you will be divided into two groups with
seven participants. The groups will stay the same for all ten rounds of the experiment.Each participant has to choose a number from 1 to 7{1,2,3,4,5,6,7} on each of the 10 rounds.In each round the smallest number chosen in each group will be identified.Your payoff is determined according to the following payoff table:
Smallest number within your group
Your decision 7 6 5 4 3 2 1
7 130 110 90 70 50 30 106 – 120 100 80 60 40 205 – – 110 90 70 50 304 – – – 100 80 60 403 – – – – 90 70 502 – – – – – 80 601 – – – – – – 70
Let us explain the table: Your points in each round depend on your own choice (indicated by thefirst column of the table “your decision” 7, 6,. . . , 1)) and the smallest number chosen in your group,including your number (indicated by the first row of the table 7, 6, 5,. . . , 1). Since your choice can bea number from 1 to 7, the smallest number can range from 1 to 7. Your points are determined by thecell in the row of your decision and the column of the smallest number in your group. An example isgiven below.
In the table there are cells with “–.” This indicates that a combination of your choices and thesmallest chosen number in your group is not possible. For example, if you choose 4, the smallestnumber in your group cannot be 7, 6, or 5.
A.2.2. Examples– you chose 3 and the smallest number in your group was 3, you win 90 points (row “3” and column
“3”),– you chose 5 and the smallest number in your group was 3, you win 70 points (row “5” and column
“3”),– you chose 5 and the smallest number in your group was 4, you win 90 points (row “5” and column
“4”),– you chose 4 and the smallest number in your group was 1, you win 40 points (row “4” and column
“1”),– you chose 3 then smallest chosen number in your group cannot be 4 (there is a—in row “3” and
column “4” ),– you chose 7 and the smallest number in your group is 4, your points are _____________ (WRITE
DOWN YOUR POINTS).
16 G. Bornstein et al. / Games and Economic Behavior 41 (2002) 1–25
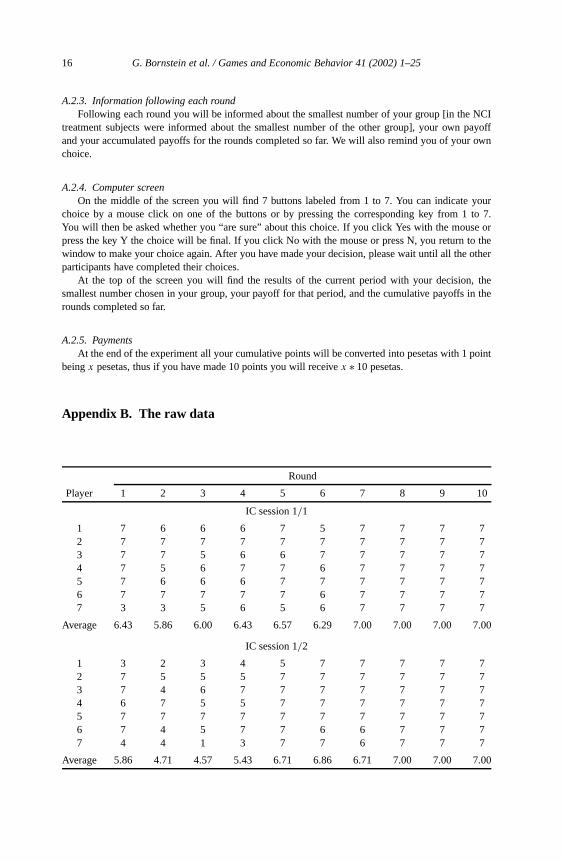
A.2.3. Information following each roundFollowing each round you will be informed about the smallest number of your group [in the NCI
treatment subjects were informed about the smallest number of the other group], your own payoffand your accumulated payoffs for the rounds completed so far. We will also remind you of your ownchoice.
A.2.4. Computer screenOn the middle of the screen you will find 7 buttons labeled from 1 to 7. You can indicate your
choice by a mouse click on one of the buttons or by pressing the corresponding key from 1 to 7.You will then be asked whether you “are sure” about this choice. If you click Yes with the mouse orpress the key Y the choice will be final. If you click No with the mouse or press N, you return to thewindow to make your choice again. After you have made your decision, please wait until all the otherparticipants have completed their choices.
At the top of the screen you will find the results of the current period with your decision, thesmallest number chosen in your group, your payoff for that period, and the cumulative payoffs in therounds completed so far.
A.2.5. PaymentsAt the end of the experiment all your cumulative points will be converted into pesetas with 1 point
beingx pesetas, thus if you have made 10 points you will receivex ∗ 10 pesetas.
Appendix B. The raw data
Round
Player 1 2 3 4 5 6 7 8 9 10
IC session 1/1
1 7 6 6 6 7 5 7 7 7 72 7 7 7 7 7 7 7 7 7 73 7 7 5 6 6 7 7 7 7 74 7 5 6 7 7 6 7 7 7 75 7 6 6 6 7 7 7 7 7 76 7 7 7 7 7 6 7 7 7 77 3 3 5 6 5 6 7 7 7 7
Average 6.43 5.86 6.00 6.43 6.57 6.29 7.00 7.00 7.00 7.00
IC session 1/2
1 3 2 3 4 5 7 7 7 7 72 7 5 5 5 7 7 7 7 7 73 7 4 6 7 7 7 7 7 7 74 6 7 5 5 7 7 7 7 7 75 7 7 7 7 7 7 7 7 7 76 7 4 5 7 7 6 6 7 7 77 4 4 1 3 7 7 6 7 7 7
Average 5.86 4.71 4.57 5.43 6.71 6.86 6.71 7.00 7.00 7.00
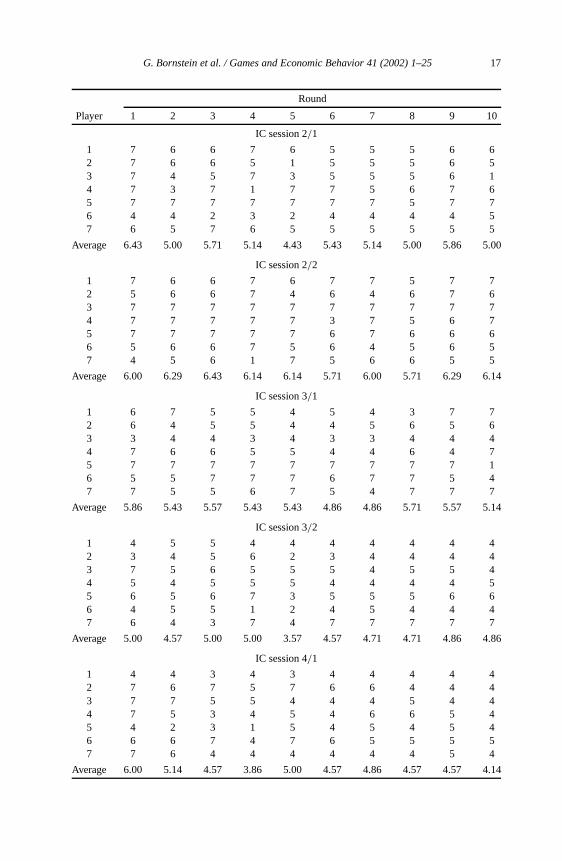
G. Bornstein et al. / Games and Economic Behavior 41 (2002) 1–25 17
Round
Player 1 2 3 4 5 6 7 8 9 10
IC session 2/1
1 7 6 6 7 6 5 5 5 6 62 7 6 6 5 1 5 5 5 6 53 7 4 5 7 3 5 5 5 6 14 7 3 7 1 7 7 5 6 7 65 7 7 7 7 7 7 7 5 7 76 4 4 2 3 2 4 4 4 4 57 6 5 7 6 5 5 5 5 5 5
Average 6.43 5.00 5.71 5.14 4.43 5.43 5.14 5.00 5.86 5.00
IC session 2/2
1 7 6 6 7 6 7 7 5 7 72 5 6 6 7 4 6 4 6 7 63 7 7 7 7 7 7 7 7 7 74 7 7 7 7 7 3 7 5 6 75 7 7 7 7 7 6 7 6 6 66 5 6 6 7 5 6 4 5 6 57 4 5 6 1 7 5 6 6 5 5
Average 6.00 6.29 6.43 6.14 6.14 5.71 6.00 5.71 6.29 6.14
IC session 3/1
1 6 7 5 5 4 5 4 3 7 72 6 4 5 5 4 4 5 6 5 63 3 4 4 3 4 3 3 4 4 44 7 6 6 5 5 4 4 6 4 75 7 7 7 7 7 7 7 7 7 16 5 5 7 7 7 6 7 7 5 47 7 5 5 6 7 5 4 7 7 7
Average 5.86 5.43 5.57 5.43 5.43 4.86 4.86 5.71 5.57 5.14
IC session 3/2
1 4 5 5 4 4 4 4 4 4 42 3 4 5 6 2 3 4 4 4 43 7 5 6 5 5 5 4 5 5 44 5 4 5 5 5 4 4 4 4 55 6 5 6 7 3 5 5 5 6 66 4 5 5 1 2 4 5 4 4 47 6 4 3 7 4 7 7 7 7 7
Average 5.00 4.57 5.00 5.00 3.57 4.57 4.71 4.71 4.86 4.86
IC session 4/1
1 4 4 3 4 3 4 4 4 4 42 7 6 7 5 7 6 6 4 4 43 7 7 5 5 4 4 4 5 4 44 7 5 3 4 5 4 6 6 5 45 4 2 3 1 5 4 5 4 5 46 6 6 7 4 7 6 5 5 5 57 7 6 4 4 4 4 4 4 5 4
Average 6.00 5.14 4.57 3.86 5.00 4.57 4.86 4.57 4.57 4.14
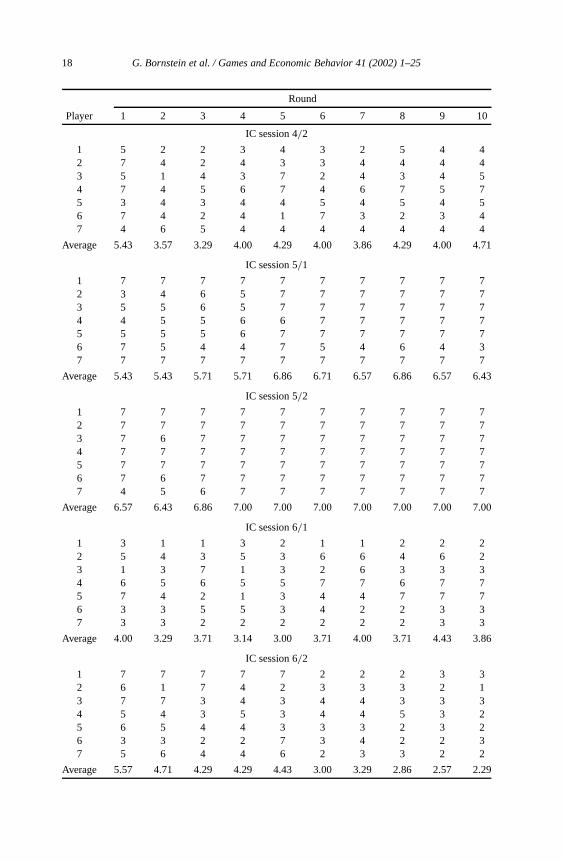
18 G. Bornstein et al. / Games and Economic Behavior 41 (2002) 1–25
Round
Player 1 2 3 4 5 6 7 8 9 10
IC session 4/2
1 5 2 2 3 4 3 2 5 4 42 7 4 2 4 3 3 4 4 4 43 5 1 4 3 7 2 4 3 4 54 7 4 5 6 7 4 6 7 5 75 3 4 3 4 4 5 4 5 4 56 7 4 2 4 1 7 3 2 3 47 4 6 5 4 4 4 4 4 4 4
Average 5.43 3.57 3.29 4.00 4.29 4.00 3.86 4.29 4.00 4.71
IC session 5/1
1 7 7 7 7 7 7 7 7 7 72 3 4 6 5 7 7 7 7 7 73 5 5 6 5 7 7 7 7 7 74 4 5 5 6 6 7 7 7 7 75 5 5 5 6 7 7 7 7 7 76 7 5 4 4 7 5 4 6 4 37 7 7 7 7 7 7 7 7 7 7
Average 5.43 5.43 5.71 5.71 6.86 6.71 6.57 6.86 6.57 6.43
IC session 5/2
1 7 7 7 7 7 7 7 7 7 72 7 7 7 7 7 7 7 7 7 73 7 6 7 7 7 7 7 7 7 74 7 7 7 7 7 7 7 7 7 75 7 7 7 7 7 7 7 7 7 76 7 6 7 7 7 7 7 7 7 77 4 5 6 7 7 7 7 7 7 7
Average 6.57 6.43 6.86 7.00 7.00 7.00 7.00 7.00 7.00 7.00
IC session 6/1
1 3 1 1 3 2 1 1 2 2 22 5 4 3 5 3 6 6 4 6 23 1 3 7 1 3 2 6 3 3 34 6 5 6 5 5 7 7 6 7 75 7 4 2 1 3 4 4 7 7 76 3 3 5 5 3 4 2 2 3 37 3 3 2 2 2 2 2 2 3 3
Average 4.00 3.29 3.71 3.14 3.00 3.71 4.00 3.71 4.43 3.86
IC session 6/2
1 7 7 7 7 7 2 2 2 3 32 6 1 7 4 2 3 3 3 2 13 7 7 3 4 3 4 4 3 3 34 5 4 3 5 3 4 4 5 3 25 6 5 4 4 3 3 3 2 3 26 3 3 2 2 7 3 4 2 2 37 5 6 4 4 6 2 3 3 2 2
Average 5.57 4.71 4.29 4.29 4.43 3.00 3.29 2.86 2.57 2.29
G. Bornstein et al. / Games and Economic Behavior 41 (2002) 1–25 19
Round
Player 1 2 3 4 5 6 7 8 9 10
NC session 1/1
1 7 5 5 4 4 4 4 5 4 42 7 7 4 4 4 4 4 4 4 43 6 7 7 6 6 5 5 4 5 44 7 7 4 4 4 4 4 4 4 45 6 7 7 4 4 4 4 4 4 46 7 7 4 4 4 4 4 5 6 47 4 4 4 4 4 4 4 4 4 4
Average 6.29 6.29 5.00 4.29 4.29 4.14 4.14 4.29 4.43 4.00
NC session 1/2
1 7 4 6 4 3 1 2 1 1 12 7 7 6 4 4 3 1 1 2 13 6 7 6 6 6 6 4 6 1 14 3 4 3 3 2 3 3 2 3 25 7 7 6 5 6 5 5 5 4 36 4 4 5 4 4 3 3 2 2 17 6 6 6 5 3 3 2 2 1 1
Average 5.71 5.57 5.43 4.43 4.00 3.43 2.86 2.71 2.00 1.43
NC session 2/1
1 4 3 3 3 3 2 3 2 2 22 6 4 2 5 4 3 3 2 3 23 7 7 7 7 7 5 3 3 3 34 7 7 7 7 7 5 4 4 2 75 3 4 4 4 3 4 2 3 2 36 7 1 4 5 3 3 3 3 3 27 3 4 2 2 2 2 3 2 3 2
Average 5.29 4.29 4.14 4.71 4.14 3.43 3.00 2.71 2.57 3.00
NC session 2/2
1 7 6 7 7 6 5 4 4 4 42 7 6 6 6 4 4 5 5 4 63 6 5 6 6 5 4 5 5 4 44 7 7 7 7 7 7 7 7 7 15 4 5 6 5 4 4 4 4 4 46 7 6 6 6 5 4 6 5 4 57 7 5 4 4 3 5 4 4 5 4
Average 6.43 5.71 6.00 5.86 4.86 4.71 5.00 4.86 4.57 4.00
NC session 3/1
1 4 4 3 3 2 1 1 1 2 12 7 7 2 1 2 1 1 1 1 13 7 5 1 1 2 1 1 1 1 14 7 4 2 1 1 1 1 1 1 15 3 2 4 1 1 2 1 1 1 16 4 5 5 4 4 4 3 1 1 17 4 4 4 3 3 2 2 2 1 1
Average 5.14 4.43 3.00 2.00 2.14 1.71 1.43 1.14 1.14 1.00
20 G. Bornstein et al. / Games and Economic Behavior 41 (2002) 1–25
Round
Player 1 2 3 4 5 6 7 8 9 10
NC session 3/2
1 3 7 3 2 1 1 1 1 1 72 7 7 1 1 5 1 1 1 1 13 5 5 3 2 2 2 1 1 1 14 7 5 1 1 2 1 1 1 1 15 4 2 1 2 1 2 1 1 1 26 1 1 1 6 3 1 1 1 1 47 7 3 1 1 1 1 1 1 1 1
Average 4.86 4.29 1.57 2.14 2.14 1.29 1.00 1.00 1.00 2.43
NCI session 1/1
1 7 6 5 6 6 6 5 6 6 72 7 7 7 4 7 7 6 5 6 43 7 4 5 5 5 5 5 4 4 44 3 4 6 4 5 6 5 5 4 55 7 7 7 5 7 6 4 5 4 46 7 7 7 7 7 7 5 5 5 57 7 6 1 5 6 1 6 6 5 4
Average 6.43 5.86 5.43 5.14 6.14 5.43 5.14 5.14 4.86 4.71
NCI session 1/2
1 7 7 7 5 7 7 5 7 7 52 5 5 5 5 5 5 5 5 5 53 7 6 6 6 5 5 5 5 5 54 6 7 7 7 6 5 5 6 5 65 7 7 7 7 7 7 7 7 6 56 7 5 6 6 5 5 6 5 5 57 4 5 6 6 5 6 5 5 5 5
Average 6.14 6.00 6.29 6.00 5.71 5.71 5.43 5.71 5.43 5.14
NCI session 2/1
1 6 5 4 3 2 2 2 2 2 22 7 4 2 7 4 2 2 3 2 23 4 3 2 2 3 3 2 2 3 24 7 7 6 6 2 2 2 4 2 25 5 3 2 3 2 2 3 2 4 26 7 7 5 3 3 3 2 2 2 27 7 7 3 4 2 2 2 2 2 2
Average 6.14 5.14 3.43 4.00 2.57 2.29 2.14 2.43 2.43 2.00
NCI session 2/2
1 7 5 1 1 2 1 1 1 1 12 7 5 3 1 1 2 1 1 1 13 2 2 1 1 1 1 1 1 1 14 4 1 1 1 1 1 1 1 1 15 4 7 5 7 5 6 4 3 1 16 5 5 1 1 1 1 1 1 1 17 5 3 3 1 1 1 1 1 1 1
Average 4.86 4.00 2.14 1.86 1.71 1.86 1.43 1.29 1.00 1.00
G. Bornstein et al. / Games and Economic Behavior 41 (2002) 1–25 21
Round
Player 1 2 3 4 5 6 7 8 9 10
NCI session 3/1
1 7 5 4 4 4 4 3 3 3 32 5 5 4 4 4 3 3 3 3 33 2 3 3 4 3 3 4 3 3 34 5 7 6 3 3 3 3 3 3 35 7 5 4 4 3 3 3 3 3 36 5 5 4 4 4 3 4 3 3 47 7 5 4 4 3 3 3 4 3 3
Average 5.43 5.00 4.14 3.86 3.43 3.14 3.29 3.14 3.00 3.14
NCI session 3/2
1 4 4 4 3 1 3 2 1 1 22 5 5 2 3 2 2 1 1 1 13 6 5 4 4 3 2 1 1 1 14 4 3 4 2 2 1 1 1 1 15 7 7 2 1 7 1 1 1 1 56 7 7 7 7 1 2 2 1 2 17 5 6 4 4 3 1 7 1 1 2
Average 5.43 5.29 3.86 3.43 2.71 1.71 2.14 1.00 1.14 1.86
NCI session 4/1
1 4 3 4 3 3 4 3 4 3 32 7 5 3 6 3 4 4 4 3 43 4 3 6 7 4 3 7 5 6 54 4 5 5 4 5 4 4 4 4 35 7 6 5 4 3 4 3 3 3 36 5 4 4 5 4 3 4 3 3 37 3 4 2 7 3 3 3 3 4 3
Average 4.86 4.29 4.14 5.14 3.57 3.57 4.00 3.71 3.71 3.43
NCI session 4/2
1 7 4 3 4 1 1 3 1 3 12 7 5 3 4 3 3 1 1 1 23 7 6 5 5 4 3 1 2 2 14 3 3 4 2 2 1 3 2 1 15 7 6 4 4 1 2 1 2 1 16 5 7 4 3 4 2 1 1 1 17 2 3 4 3 3 4 2 2 1 2
Average 5.43 4.86 3.86 3.57 2.57 2.29 1.71 1.57 1.43 1.29
NCI session 5/1
1 4 4 5 4 4 3 1 2 1 12 7 7 7 7 4 5 3 2 2 23 3 4 3 2 3 1 1 1 1 14 7 7 7 3 3 1 3 1 2 15 6 5 4 5 1 3 1 4 1 16 6 6 6 4 4 3 1 1 1 47 5 6 4 4 3 1 3 1 1 3
Average 5.43 5.57 5.14 4.14 3.14 2.43 1.86 1.71 1.29 1.86
22 G. Bornstein et al. / Games and Economic Behavior 41 (2002) 1–25
Round
Player 1 2 3 4 5 6 7 8 9 10
NCI session 5/2
1 7 7 7 7 7 7 7 7 7 72 7 4 4 4 4 4 4 4 4 43 7 7 6 5 4 4 5 4 4 44 4 6 4 4 5 4 4 4 4 45 7 6 5 4 5 4 4 4 4 46 7 6 5 4 4 4 4 4 4 47 6 5 5 5 4 4 4 4 4 4
Average 6.43 5.86 5.14 4.71 4.71 4.43 4.57 4.43 4.43 4.43
NCI session 6/1
1 1 1 1 1 1 1 1 1 1 12 7 1 2 2 1 2 1 1 1 13 7 7 7 1 1 1 1 1 1 34 7 1 1 1 1 1 1 1 1 15 1 1 2 1 1 1 1 1 1 16 5 1 1 1 1 1 1 1 1 17 1 1 1 1 1 1 1 1 1 1
Average 4.14 1.86 2.14 1.14 1.00 1.14 1.00 1.00 1.00 1.29
NCI session 6/2
1 3 1 5 6 2 1 7 1 1 42 7 5 1 1 1 1 1 1 1 13 5 3 1 1 1 1 1 1 1 14 7 7 7 1 1 1 1 1 1 15 1 2 2 1 2 1 1 1 1 16 7 5 3 1 1 1 2 1 1 17 7 7 7 2 1 1 1 1 1 1
Average 5.29 4.29 3.71 1.86 1.29 1.00 2.00 1.00 1.00 1.43
ICB session 1/1
1 6 6 7 7 7 5 4 3 2 42 5 4 4 4 4 4 4 4 3 33 3 3 3 3 3 3 3 3 3 34 5 4 3 3 3 4 3 3 3 35 7 6 7 5 6 7 5 3 3 26 4 5 3 6 3 4 3 5 3 37 5 6 3 4 3 3 3 3 4 3
Average 5.00 4.86 4.29 4.57 4.14 4.29 3.57 3.43 3.00 3.00
ICB session 1/2
1 4 6 3 3 3 1 1 1 1 12 4 3 3 2 3 1 1 2 1 23 6 5 7 3 3 1 2 1 2 14 6 5 1 5 4 4 3 3 3 35 6 7 5 3 3 1 1 4 1 16 1 4 6 2 1 3 1 1 3 67 3 1 2 1 1 2 1 3 1 1
Average 4.29 4.43 3.86 2.71 2.57 1.86 1.43 2.14 1.71 2.14
G. Bornstein et al. / Games and Economic Behavior 41 (2002) 1–25 23
Round
Player 1 2 3 4 5 6 7 8 9 10
ICB session 2/1
1 7 7 7 7 7 7 7 7 7 72 7 7 7 7 7 7 7 7 7 73 7 7 7 5 5 7 7 7 7 74 7 7 7 5 7 7 7 7 7 75 5 5 6 6 6 7 5 7 7 76 5 5 5 5 6 6 6 7 7 77 7 7 7 5 5 6 6 7 7 7
Average 6.43 6.43 6.57 5.71 6.14 6.71 6.43 7.00 7.00 7.00
ICB session 2/2
1 5 6 5 6 6 7 7 7 7 72 7 7 7 7 7 7 7 7 7 73 7 7 7 7 6 7 6 7 7 74 7 6 6 6 6 7 6 7 7 75 7 7 7 6 7 7 7 7 7 76 7 7 7 7 7 7 7 7 7 77 7 7 7 7 6 7 7 7 7 7
Average 6.71 6.71 6.57 6.57 6.43 7.00 6.71 7.00 7.00 7.00
ICB session 3/1
1 7 7 6 5 5 5 5 4 4 52 7 6 4 4 4 4 4 4 4 43 7 7 6 5 6 4 5 4 4 54 7 6 6 5 6 5 5 5 4 55 4 4 4 4 4 4 4 4 4 46 7 6 6 5 4 4 4 4 4 57 7 7 5 4 4 5 4 4 4 5
Average 6.57 6.14 5.29 4.57 4.71 4.43 4.43 4.14 4.00 4.71
ICB session 3/2
1 4 4 4 5 4 4 3 3 4 52 7 5 4 4 4 4 4 4 4 53 7 7 7 6 6 6 6 5 4 54 5 3 2 5 1 5 5 5 5 55 4 4 4 3 4 4 4 4 4 46 5 4 3 3 4 3 3 3 4 57 2 7 5 4 5 5 2 4 5 5
Average 4.86 4.86 4.14 4.29 4.00 4.43 3.86 4.00 4.29 4.86
ICB session 4/1
1 4 4 3 4 3 3 3 3 3 32 3 2 3 1 2 2 1 7 6 63 4 4 3 4 3 4 3 2 4 24 7 4 2 3 2 3 3 2 2 25 7 6 1 4 7 4 4 3 3 26 5 4 5 4 4 4 3 3 3 37 5 5 6 4 2 3 5 2 2 2
Average 5.00 4.14 3.29 3.43 3.29 3.29 3.14 3.14 3.29 2.86
24 G. Bornstein et al. / Games and Economic Behavior 41 (2002) 1–25
Round
Player 1 2 3 4 5 6 7 8 9 10
ICB session 4/2
1 4 2 3 4 3 3 2 2 3 22 7 4 4 4 4 4 4 4 1 73 5 4 3 3 2 3 3 2 3 34 3 5 7 7 6 2 1 1 1 75 7 6 5 5 6 5 3 7 3 46 4 5 4 3 4 6 4 3 4 47 7 7 7 7 7 6 6 4 4 2
Average 5.29 4.71 4.71 4.71 4.57 4.14 3.29 3.29 2.71 4.14
ICB session 5/1
1 4 6 3 3 3 3 3 3 3 32 7 7 3 3 3 3 3 3 4 33 4 3 5 5 7 4 5 4 3 34 7 7 3 3 5 4 3 3 4 35 3 5 4 5 2 7 5 3 3 46 7 5 4 4 3 3 4 3 3 37 5 4 1 5 4 4 3 3 3 3
Average 5.29 5.29 3.29 4.00 3.86 4.00 3.71 3.14 3.29 3.14
ICB session 5/2
1 7 5 4 3 4 3 3 3 3 32 7 5 4 4 4 4 4 4 4 43 4 3 5 6 3 3 4 3 3 34 6 6 6 7 7 7 6 6 7 65 7 7 7 7 6 5 4 3 3 36 3 3 3 3 3 3 3 4 3 37 4 5 4 4 5 6 6 7 6 5
Average 5.43 4.86 4.71 4.86 4.57 4.43 4.29 4.29 4.14 3.86
References
Amaldos, W., Meyer, R., Raju, J., Rapoport, A., 2000. Collaborating to compete. Marketing Sci. 19,105–126.
Berninghaus, S.K., Ehrhart, K.M., 1998. Time horizon and equilibrium selection in tacit coordinationgames: Experimental results. J. Econ. Behav. Org. 37, 231–248.
Bornstein, G., Ben-Yossef, M., 1994. Cooperation in intergroup and single-group social dilemmas.J. Exp. Soc. Psych. 30, 52–67.
Bornstein, G., Erev, I., 1994. The enhancing effect of intergroup competition on group performance.Internat. J. Conflict Management 5, 271–284.
Bornstein, G., Erev, I., Rosen, O., 1990. Intergroup competition as a structural solution to socialdilemmas. Soc. Behav. 5, 247–260.
Cachon, G., Camerer, C., 1996. The sunk cost fallacy, forward induction and behavior in coordinationgames. Quart. J. Econ 111, 165–194.
Cooper, R., DeJong, D., Forsythe, R., Ross, T., 1989. Communication in Coordination Games.Working paper Series 89–16. College of Business Administration, University of Iowa.
G. Bornstein et al. / Games and Economic Behavior 41 (2002) 1–25 25
Cooper, R., DeJong, D., Forsythe, R., Ross, T., 1990. Selection criteria in coordination games: Someexperimental results. Amer. Econ. Rev. 80, 218–233.
Erev, I., Bornstein, G., Galili, R., 1993. Constructive intergroup competition as a solution to the freerider problem: A field experiment. J. Exp. Soc. Psych. 29, 463–478.
Fudenberg, D., Gilbert, R., Stiglitz, J., Tirole, J., 1983. Preemption, leap-frogging and competition inpatent races. European Econ. Rev. 22, 3–31.
Gilbert, R., Newberry, D., 1982. Preemptive patenting and the persistent of monopoly. Amer. Econ.Rev. 72, 54–526.
Harkins, S.G., Petty, R.E., 1982. Effects of task difficulty and task uniqueness on social loafing.J. Personal. Soc. Psych. 43, 1214–1229.
Ingham, A.G., Levinger, G., Graves, J., Peckham, V., 1974. The Ringlemann effect: Studies of groupsize and group performance. J. Exp. Soc. Psych. 10, 371–384.
Kerr, N., Bruun, S., 1981. Ringlemann revisited: Alternative explanations for the social loafing effect.Personal. Soc. Psych. Bull. 7, 224–231.
Keser, C., Ehrhart, K.M., Siegfried, K.B., 1998. Coordination and local interaction: Experimentalevidence. Econ. Lett. 58, 269–275.
Latane, B., Williams, K., Harkins, S., 1979. Many hands make light the work: The causes andconsequences of social loafing. J. Personal. Soc. Psych. 37, 822–832.
Lucas, R.E., 1986. Adaptive behavior and economic theory. In: Hogarth, R., Reder, M. (Eds.), RationalChoice: The Contrast Between Economics and Psychology. University of Chicago Press, Chicago,pp. 217–242.
Nalbantian, H.R., Schotter, A., 1997. Productivity under group incentives: An experimental study.Amer. Econ. Rev. 87, 314–341.
Ochs, J., 1995. Coordination problems. In: Roth, A., Kagel, J. (Eds.), Handbook of ExperimentalEconomics. Princeton University Press, Princeton.
Ringelmann, M., 1913. Recherches sur les moteurs animes: Travail de l’homme. Annales de l’InstitutNational Agronomique 12, 1–40.
Roth, A., 1995. Introduction. In: Roth, A., Kagel, J. (Eds.), Handbook of Experimental Economics.Princeton University Press, Princeton.
Schelling, T., 1960. The Strategy of Conflict. Harvard University Press, Cambridge, MA.Schopler, J., Insko, C., 1992. The discontinuity effect in interpersonal and intergroup relations:
Generality and mediation. European Rev. Soc. Psych. 3, 121–151.Steiner, I.D., 1972. Group Processes and Productivity. Academic Press, New York.Tajfel, H., 1982. Social psychology of intergroup relations. Ann. Rev. Psych. 33, 1–39.Van Huyck, J., Battalio, R., Beil, R., 1993. Asset markets as an euqilibrium selection mechanism.
Games Econ. Behav. 5, 485–504.Van Huyck, J., Battalio, R., Beil, R., 1990. Tacit coordination games, strategic uncertainty, and
coordination failure. Amer. Econ. Rev. 80, 234–248.Weber, R., Camerer, C., Rottenstreich, Y., Knez, M., 2000. The illusion of leadership: Misattribution
of cause in coordination games. Discussion paper.