Embed Size (px)
Citation preview
University of Central Florida University of Central Florida
STARS STARS
Electronic Theses and Dissertations, 2004-2019
2016
The effect of glycerol on readily biodegradable chemical oxygen The effect of glycerol on readily biodegradable chemical oxygen
demand (RBCOD) in a wastewater stream demand (RBCOD) in a wastewater stream
Rojina Rawut University of Central Florida
Part of the Environmental Engineering Commons
Find similar works at: https://stars.library.ucf.edu/etd
University of Central Florida Libraries http://library.ucf.edu
This Masters Thesis (Open Access) is brought to you for free and open access by STARS. It has been accepted for
inclusion in Electronic Theses and Dissertations, 2004-2019 by an authorized administrator of STARS. For more
information, please contact [email protected].
STARS Citation STARS Citation Rawut, Rojina, "The effect of glycerol on readily biodegradable chemical oxygen demand (RBCOD) in a wastewater stream" (2016). Electronic Theses and Dissertations, 2004-2019. 5332. https://stars.library.ucf.edu/etd/5332
THE EFFECT OF GLYCEROL ON READILY BIODEGRADABLE CHEMICAL OXYGEN
DEMAND (RBCOD) IN A WASTEWATER STREAM
by
ROJINA RAWUT
M.Sc. School of Environmental Science and Management (SchEMS), 2009
A thesis submitted in partial fulfillment of the requirements
for the degree of Master of Science
in the Department of Civil, Environmental and Construction Engineering
in the College of Engineering and Computer Science
at the University of Central Florida
Orlando, Florida
Spring Term
2016
Major Professor: Anwar Sadmani

ii
© 2016 Rojina Rawut
iii
ABSTRACT
This study evaluated the short-term effects of glycerol addition on readily biodegradable
(RB) chemical oxygen demand (COD) in a carbon limited wastewater influent. The presence of
an RB fraction provides with a suitable substrate for microorganisms to produce volatile fatty acids
(VFA). The oxygen utilization rate (OUR) has been used to evaluate the oxygen consumption for
RB substrate in wastewater. Wastewater with low organic content contains limited RB substrate,
and thus, additional carbon source is required to improve biological treatment capability. Acetate,
propionate, methanol, and glycerol are the commonly available carbon sources for biological
treatment process. However, the cost of acetate and propionate are relatively high, and it is not
economical to use these carbon sources in the wastewater plant. The use of methanol as a carbon
source inherently poses safety issues in field applications due to its toxic and flammable properties.
On the other hand, crude glycerol is the byproduct of biodiesel, which is an excellent carbon source
alternative. However, crude glycerol contains impurities and requires a certain degree of
purification to enhance the performance.
The samples for the study were collected from the Iron Bridge Wastewater Reclamation
Facility (Oviedo, FL) designed for treating municipal wastewater. The total COD (TCOD) of the
sample influent was in the range of 237 to 408 mg COD/L, and RBCOD value was between 38
and 80.5 mg COD/L, containing up to 10 mg COD/L of VFA. This study also demonstrates the
relationship between the glycerol concentration and OURs during the diauxic growth phase from
the addition of glycerol. The growth was due to the existence of RB substrate and availability of
glycerol for the microorganisms. TCOD increased from 284 to 378 mg COD/L and from 284 mg
iv
COD/L to 323 mg COD/L by spiking approximately 30 and 15 mL of glycerol stock solution (6.67
g/L), respectively. RBCOD increased from 45 to 89 mg COD/L and 55 mg COD/ L by spiking
30 mL and 15 ml glycerol stock solution, respectively. The initial influent heterotrophic active
biomass (ZBH) increased from 5.4 to 15.8 mg VSS/L (8 to 23.4 mg COD/L) due to the addition of
glycerol, indicating that the glycerol may be an adequate carbon source. The COD of wastewater
with limited VFA (e.g., 10 mg COD/L) increased up to 2,502 mg COD/L where propionic acid
(2,468 mg COD/L) exists as the primary end product with a small quantity of acetic acid (34 mg
COD/L). Propionic acid was the main VFA component fermented from the glycerol addition.
Glycerol addition led to increased RBCOD accompanied by high VFA production. This research
investigated the short-term effect of glycerol addition on existing RBCOD in wastewater. It is
recommended to explore the effect of increased RBCOD by the addition of glycerol to the effluent
N and P for future study.
Keywords: Wastewater, readily biodegradable oxygen demand (RBCOD), oxygen
utilization rate (OUR), Glycerol, biological nutrient removal
v
ACKNOWLEDGMENTS
It is my great privilege to acknowledge and express the deep gratitude to my advisor Dr.
Anwar Sadmani for his effectual guidance. I owe a profound intellectual debt to Dr. Andrew
Randall for his ideas and contributions to shaping my thinking on this subject.
I would like to express my gratefulness to my mentor Dr. Jae-Hoon Hwang for providing
the stimulus and encouragement in writing this thesis. This thesis would not have completed
without his immense effort.
I would also like to thank my committee members Dr. Steven Duranceau and Dr. Woo
Hyoung Lee for their review, guidance and support during my studies.
Lastly, I would like to express my sincere thanks to Sultan Salamah, Marzeih Ghasemi and
Elizabeth Groves for their laboratory assistance and cooperation to accomplish my course and
prepare this thesis.
vi
TABLE OF CONTENTS
LIST OF FIGURES ........................................................................................................... ix
LIST OF TABLES .............................................................................................................. x
LIST OF ABBREVATIONS ............................................................................................. xi
CHAPTER 1: INTRODUCTION ....................................................................................... 1
1.1 Background ........................................................................................................... 1
1.2 Project Objective ................................................................................................... 4
CHAPTER 2: LITERATURE REVIEW ............................................................................ 5
2.1 RBCOD:-TP vs. VFA:-TP in EBPR ..................................................................... 5
2.2 RBCOD for Denitrification ................................................................................... 7
2.3 Biodiesel .............................................................................................................. 10
2.4 Glycerol ............................................................................................................... 13
2.5 Impact of Glycerol in EBPR ............................................................................... 17
2.6 Impact of Glycerol in Denitrification .................................................................. 20
CHAPTER 3: MATERIALS AND METHODS .............................................................. 24
3.1 OUR Calibration ................................................................................................. 27
3.1.1 Main Knob for Calibration ............................................................................ 27
3.1.2 Gain knob for Calibration ............................................................................. 27
3.2 Analytical Procedures ......................................................................................... 29
vii
3.2.1 RBCOD ......................................................................................................... 29
3.2.2 Glycerol ......................................................................................................... 30
3.2.3 VFA ............................................................................................................... 30
3.2.4 Laboratory Quality Control ........................................................................... 31
CHAPTER 4: RESULTS AND DISCUSSION ................................................................ 32
4.1 Phase I ................................................................................................................. 36
4.2 Phase II ................................................................................................................ 39
4.2.1 Time Series .................................................................................................... 40
4.3 Phase III............................................................................................................... 44
4.4 Glycerol Effects................................................................................................... 47
4.5 Future Study ........................................................................................................ 50
CHAPTER 5: CONCLUSIONS ....................................................................................... 52
APPENDIX A: OXYGEN SOLUBILITY ...................................................................... 53
APPENDIX B: FORUMULAS ....................................................................................... 55
APPENDIX C: QUALITY ASSURANCE AND QUALITY CONTROL (QA & QC) .. 57
APPENDIX D: UN-SPIKED RAW DATA .................................................................... 60
APPENDIX E: SPIKED SAMPLE DATA (30 mL) ....................................................... 69
APPENDIX F: SPIKED SAMPLE DATA (15 mL) ....................................................... 79
APPENDIX G: GLYCEROL PLUS ACCLIMATED MASS ........................................ 82
viii
APPENDIX H: GLYCEROL EFFECT ........................................................................... 87
APPENDIX I: WASTEWATER CHARACTERISTICS ............................................... 104
REFERENCES ............................................................................................................... 107
ix
LIST OF FIGURES
Figure 2.1: Transesterification for Vegetative Oil. ........................................................... 10
Figure 2.2: Biodiesel Production by Interesterification of Methyl-acetate....................... 11
Figure 2.3: Basic Technology for Biodiesel Formation.................................................... 12
Figure 2.4: Structure of Glycerol. ..................................................................................... 13
Figure 2.5: Propionic Acid Fermentation Pathway From Glycerol. ................................. 15
Figure 3.1: DO/OUR Meter. ............................................................................................. 28
Figure 3.2: RBCOD Experiment Sample.......................................................................... 29
Figure 4.1: Initial TCOD of Influent Wastewater. ............................................................ 32
Figure 4.2: OUR Plot vs. Time ......................................................................................... 33
Figure 4.3: TCOD/RBCOD Trend in Wastewater ............................................................ 34
Figure 4.4: Effect of Glycerol on Different RBCOD Spike (30 mL) Samples. ................ 37
Figure 4.5: Comparison of Un-spike Sample with Spike Sample. ................................... 39
Figure 4.6: Time Series Data for Glycerol. ....................................................................... 41
Figure 4.7: Time Series Data for Volatile Fatty Acid (VFA). .......................................... 42
Figure 4.8: Prefermenter. .................................................................................................. 44
Figure 4.9: Comparison between Spike vs. Spike Plus Inoculate..................................... 45
Figure 4.10: Glycerol Effect on Phase I and Phase II. ...................................................... 47
Figure 4.11: Diagram for the Oxygen Demand in Wastewater. ....................................... 50
x
LIST OF TABLES
Table 3.1: Characteristics of the Wastewater ................................................................... 24
Table 3.2: List of Methods and Equipment for RBCOD Study ........................................ 25
Table 4.1: Results of Phase I Statistical Data ................................................................... 38
Table 4.2: Results of Phase II Statistical Data .................................................................. 40
Table 4.3: Results of Phase III Statistical Data ................................................................. 46
xi
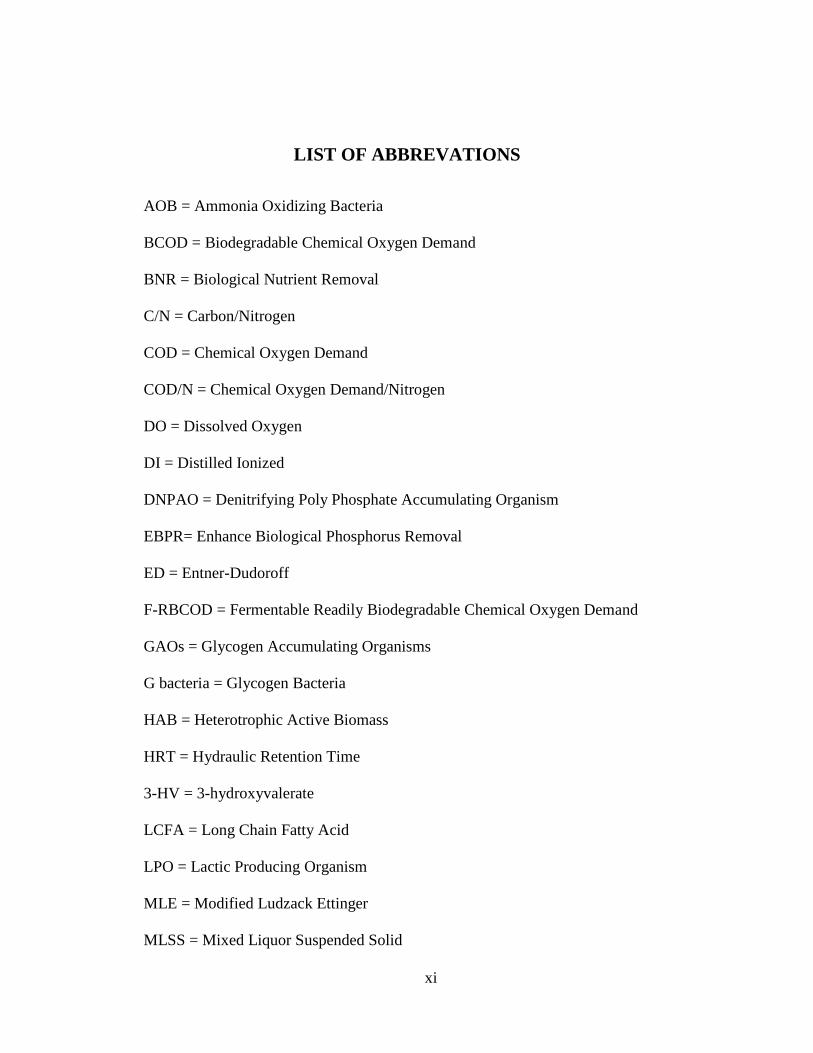
LIST OF ABBREVATIONS
AOB = Ammonia Oxidizing Bacteria
BCOD = Biodegradable Chemical Oxygen Demand
BNR = Biological Nutrient Removal
C/N = Carbon/Nitrogen
COD = Chemical Oxygen Demand
COD/N = Chemical Oxygen Demand/Nitrogen
DO = Dissolved Oxygen
DI = Distilled Ionized
DNPAO = Denitrifying Poly Phosphate Accumulating Organism
EBPR= Enhance Biological Phosphorus Removal
ED = Entner-Dudoroff
F-RBCOD = Fermentable Readily Biodegradable Chemical Oxygen Demand
GAOs = Glycogen Accumulating Organisms
G bacteria = Glycogen Bacteria
HAB = Heterotrophic Active Biomass
HRT = Hydraulic Retention Time
3-HV = 3-hydroxyvalerate
LCFA = Long Chain Fatty Acid
LPO = Lactic Producing Organism
MLE = Modified Ludzack Ettinger
MLSS = Mixed Liquor Suspended Solid
xii
NAR = Nitrite Accumulation Ratio
NDAS = Nitrification Denitrification Activated Sludge
NOB = Nitrite Oxidizing Bacteria
NO = Nitric Oxide
N2O = Nitrous Oxide
OHO = Ordinary Heterotrophic Organism
OUR = Oxygen Utilization Rate
TOC = Total Organic Carbon
TCOD = Total Chemical Oxygen Demand
TP = Total Phosphorus
TSS = Total Suspended Solids
PAO = Polyphosphate Accumulating Organism
PHA = Poly-hydroxy-alkanoate
PHB = Poly-hydroxy-butyrate
PHV = Poly-hydroxy-valerate
RBCOD = Readily Biodegradable Chemical Oxygen Demand
SBCOD = Slowly Biodegradable Chemical Oxygen Demand
SCVFA = Short Chain Volatile Fatty Acid
SRT = Sludge Retention Time
SS = Suspended Solids
TDS = Total Dissolved Solids
TKN = Total Kjeldahl Nitrogen
xiii
TN = Total Nitrogen
TP = Total Phosphorus
TS = Total Solids
VFA= Volatile Fatty Acid
VSS = Volatile Suspended Solid
WWTP = Waste Water Treatment Plant
ZBH = Initial Heterotrophic Active Biomass
1
CHAPTER 1: INTRODUCTION
1.1 Background
In municipal wastewater, the biodegradable substrate that is consumed easily and quickly by
the activated sludge is referred to as readily biodegradable chemical oxygen demand (RBCOD).
The substrate that is difficult to be degraded by bacteria is considered as slowly biodegradable
chemical oxygen demand (SBCOD). RBCOD is further divided into short-chain volatile fatty acids
(SCVFAs) and non-SCVFAs, which are represented as volatile fatty acids (VFAs) and fermentable
RBCOD (F-RBCOD) (Rossle et al., 2001). RBCOD in raw wastewaters varies from 8 to 25 %,
whereas in settled wastewaters from 10 to 35 % of total COD (Henze et al., 2001; Rossle et al.,
2001; Orhon et al., 2002; Dauknys et al., 2009). SBCOD constitutes 50 to 70 % of a raw
wastewater and 45 to 85 % in the case of a settled wastewater (Rossle et al., 2001). Thus, the
characterization of RBCOD provides meaningful information on the biokinetics of an activated
sludge system. In an anaerobic zone, RBCOD is easily converted into VFA (Marais et al., 1976).
VFA is the primary substrate that is related to synthesis and metabolism for microbial growth. An
adequate supply of RBCOD has great importance in the design and operation of N and P removal
in denitrification and enhanced biological phosphorus removal (EBPR) (Wentzel et al., 1995).
EBPR uses a series of anaerobic and aerobic reactors. In an aerobic condition of EBPR, significant
amount of aerobic biomass and suitable substrate (e.g., VFAs) are available (Chu et al., 1994;
Randall et al., 1997; Guerrero et al., 2012). For EBPR, SCVFAs are mostly acetic and propionic
acids, which are the driving forces of the aerobic microbial metabolism. In denitrification, a more
readily biodegradable substrate (RBCOD) is used for the conversion of nitrate to nitrite and drives
the higher kinetic rate (Uprety et al., 2013). The recommended range of RBCOD requirement for
2
the removal of 1 g nitrogen (N) is 4 g to 15 g (Dauknys et al., 2009; Melidis et al., 2009). However,
as denitrification processes utilize the available readily biodegradable substrate, the consequent
fermentation processes may be hindered (Barnard et al., 2006). Similarly, for phosphorus removal,
the suggested minimum ratio is 16:1 for RBCOD/P (Stephens et al., 2004; Dauknys et al., 2009).
In a wastewater, fermentation of the organic compound to VFA by the fermentative
organism is the crucial phenomenon for phosphorus and nitrogen removal (Danesh et al., 1997).
The municipal waste with low or medium organic content and VFA causes the failure of nutrient
removal (Taslie et al., 1999). In order to improve the performance, organic compounds like
methanol, ethanol, glycerol, or acetic acid need to be added because of their readily biodegradable
characteristics (Cho et al., 2004; Katarzyna et al., 2015). Methanol is the most commonly used
external carbon source for denitrification. However, it has safety issues due to its toxic and
flammable properties (Lu et al., 2011). Acetic acid is another common carbon source considered
but the competition between denitrifying bacteria and polyphosphate accumulating organism
(PAO) for carbon affects the nutrient removal (Cho et al., 2004). However, this additional carbon
source causes an extra cost and thus it is not economical and hence lower cost alternative sources
needs to be considered in wastewater treatment plants (WWTPs).
Crude glycerol is a byproduct of biodiesel, and one kilogram of biodiesel can produce
approximately hundred grams of glycerol (Yazdani et al., 2007). The discharge industry derived
crude glycerol can significantly affect the hydro-ecosystems. One of the mitigation strategies is to
use the crude glycerol as an alternative sustainable carbon source. Crude glycerol contains high
3
impurities such as salts, VFAs, long-chain fatty acids (LCFAs), and other organic contaminations,
resulting in a low commercial value due to its subsequent purification and disposal cost (Yazdani
et al., 2007; Taya et al., 2015). Pure glycerol is becoming popular due to its 95 % purity and can
be utilized as a source of carbon and energy. Yuan et al. (2010) found that glycerol, when
fermented with waste activated sludge, can be used as co-substrate and results in a successful
operation of EBPR. Guerrero et al. (2012) stated that in full-scale wastewater treatment plant
(WWTP), appropriate anaerobic hydraulic retention time was necessary to use glycerol as a sole
carbon source. The study of glycerol in the denitrification process also has a positive implication.
Glycerol-based denitrification was three times more efficient than methanol (Lu et al., 2010).
When glycerol was added in denitrification tank, denitrification efficiency increased by 2.0 to 5.0
mg NO3-N per 100 L of glycerol (Bodik et al., 2009). Glycerol, when used as a sole carbon source,
increased the nitrogen removal in the range of 75.9 to 99.9 % to landfill leachate (Meldis et al.,
2009). In industrial wastewater treatment, by increasing glycerol content from C/N 3 to 5, nitrate
reduction was accomplished at 44 mg N/g.d biomass (Cyplik et al., 2013).
4
1.2 Project Objective
This thesis focuses on the effect of pure glycerol on readily biodegradable waste using
oxygen utilization rate (OUR). The main objective of the study is to evaluate the effect of glycerol
as an external carbon on readily biodegradable oxygen demand (RBCOD) for carbon limited
wastewater. This research:
• Demonstrates the relationship between the RBCOD and total COD from the addition of
glycerol to raw wastewater
• Illustrates the correlation of glycerol with OUR by microbial metabolism.
• Demonstrates volatile fatty acid (VFA) measurements by the addition of glycerol.
5
CHAPTER 2: LITERATURE REVIEW
2.1 RBCOD:-TP vs. VFA:-TP in EBPR
The wastewater organic matter in terms of total COD is divided into biodegradable,
unbiodegradable and heterotrophic active mass (Wentzel et al., 1995). The biodegradable COD is
further divided into readily biodegradable COD (RBCOD) and slowly biodegradable COD
(SBCOD). The influent biodegradable substrate is separated into ordinary heterotrophic organisms
(OHOs) and phosphate accumulating organisms (PHAs) (Wentzel et al., 1990). The steady state
model is used to calculate the total use of influent RBCOD. In Biological nutrient removal
activated sludge (BNRAS), influent RBCOD enters the anaerobic zone, and ordinary heterotrophic
organisms (OHO) for the formation of VFAs act upon fermentable RBCOD. Another function in
the anaerobic zone is the uptake of VFAs by the polyphosphate accumulating organisms (PAO)
and stored as polyhdroxyalkanoates (PHAs) (Hu et al., 2002).
A study recommends the RBCOD value to be more than 25 mg/L in anaerobic zone for
EBPR process with nitrification and denitrification (Sperandio et al., 2000). In an anaerobic zone,
RBCOD is followed by the fermentation process to form VFA and stored within the cell as PHAs,
which are subsequently consumed in the aerobic and anoxic zone (Ekama et al., 1983). The
minimum required ratio of RBCOD/P for achieving the soluble effluent P less than 0.5 mg/L in
EBPR is 18:1 and for VFA/P is 8:1 (Metcalf et al., 2013). The total VFA essential for phosphorus
removal is reported as 4 to 16 mg per mg phosphorus (Randall et al., 1992). Barnard et al. (2006)
assumed that there would be less significance of VFA if all of the RBCOD were converted into
VFA in the anaerobic zone. However, the presence of high VFA in influent waste points out the
6
process of ongoing fermentation. In most wastewater treatment plants, 80% of influent wastewater
is comprises RBCOD in the anaerobic zone.
Different studies have suggested different values for RBCOD and VFA ratio with
phosphorus. The flocculation filtration method is commonly used to determine the difference
between COD concentration from the influent and effluent to find RBCOD concentration (Mamais
et al., 1993). The research recommended a minimum ratio of 8 to 10 g/g for RBCOD/P in the
acetate fed SBR EBPR (Schuler et al., 2003). Gu et al. (2008) illustrated that the EBPR process
with high RBCOD would have more phosphorus removal and presented the ratio of 5 to 38 mg
RBCOD/mg P for the effluent phosphorus less than 1 mg/L. The proportion of VFA to phosphorus
is commonly found in the ranges of 4 to 16 (Barnard et al., 2006). A study by Janssen et al. (1996)
demonstrated that 10 g of readily biodegradable carbon was required to remove 1 g of phosphorus.
Yuan et al. (2011) also reported a similar result.
7
2.2 RBCOD for Denitrification
In municipal wastewater, readily biodegradable substrate constitutes about 10 to 30 % and
slowly biodegradable substrate about 40 to 60% of the total COD (Drewnowski et al., 2014). In
the biodegradable substrate, nitrogen removal is mainly related to readily biodegradable substrate
by microorganism than the slowly biodegradable substrate. The available RBCOD is essential for
the wastewater plant where the influent waste has low-carbon content (Yuan et al., 2011).
If the available organic content is limited, competition for the substrate can occur between
the denitrifying bacteria and polyphosphate accumulating organism (PAO). In such conditions, the
extra carbon source is required to support the low concentration of influent carbon. For
denitrification, the commonly used carbon sources are methanol, ethanol, glucose and acetic acid
which were added to the anoxic zone of single sludge system. In denitrification, more readily
degradable compounds drive the higher kinetic rate. RBCOD has electron donating capacity and
contributes to the high denitrification rate. Therefore, the correct estimation of RBCOD is essential
to measure nitrogen removal in the system. The denitrification potential of RBCOD can be
calculated by assuming the entire fraction is used (Eq. 1) (Henz., et al, 2008):
Dp/RBCOD = fsb´s Sbs (1-fcvYHV)/2.86 (1) (mg NO3-N/L)
Where,
Dp/RBCOD: denitrification potential of the influent RBCOD in primary anoxic reactor
Sbs : influent biodegradable COD (mg COD/L)
8
fsb´s : RBCOD fraction of Sbs
YHV : OHO yield (0.45 mg VSS/ mg COD)
2.86 : Oxygen equivalent of nitrate
In aerobic condition, autotrophic nitrifying bacteria cause the oxidation of ammonium to
nitrate in conventional biological process of nitrogen removal. Anoxic zone heterotrophic
denitrifying bacteria convert the nitrate to nitrogen (Kuai et al., 1999). Ekama et al. (1979)
hypothesized that the first part of denitrification was related to RBCOD and the second phase to
SBCOD in anoxic phase. When PHA stored was lost in anoxic zone, denitrification had to rely on
the rest of the available substrate, which was slowly biodegradable (SB) COD.
A study by Clayton et al. (1991) illustrated the use of RBCOD for two purposes. First in
the anaerobic reactor by poly P organism and second in the primary anoxic zone for denitrification
with the hypothesis of using all RBCOD by poly P organism and non poly P organism in the anoxic
system. RBCOD is the small molecules, which can pass easily through the cell wall and used for
the metabolism of organisms (Wentzel et al., 1992). The rate of specific growth is calculated
according to the Monod equation by active mass. However, SBCOD is a complex compound and
hydrolyzed to RBCOD.
The influent readily biodegradable substrate enters the anoxic zone and is consumed by the
ordinary heterotrophic organism for the nitrogen removal in nitrification-denitrification activated
sludge (NDAS) systems (Hu et al., 2002). RBCOD behaves as an electron donor. The presence of
9
low RBCOD delays nitrite reduction during anoxic operation (Uprety et al., 2013). Thus, once the
level of RBCOD decreases, the rate of denitrification also depletes and relies on the compound
particulate material (Naidoo et al., 2000).
Gong et al. (2013) reported that by using a ratio of 2.5:1.0 for the RBCOD to nitrate
(RBCOD: NO3-), the ideal condition of 71.7 % of the nitrite accumulation ratio (NAR) was
obtained for acetate feast-famine condition. According to Sheping et al. (2006), in the anoxic zone,
the wastewater with the high fraction of RBCOD would have the highest rate of denitrification.
10
2.3 Biodiesel
Biodiesel is the renewable source of energy and used as the substitute for petroleum and
gasoline to improve the emission of pollutants. Biodiesel is produced from vegetable oil or animal
fats. One problem with vegetable oil is its high viscosity compared to the diesel engine and need
to be reduced before use as alternative fuel (Demirbas et al., 2009). Transesterification is one of
the general terms used to describe the process of conversion of oil to the ester (biodiesel) which is
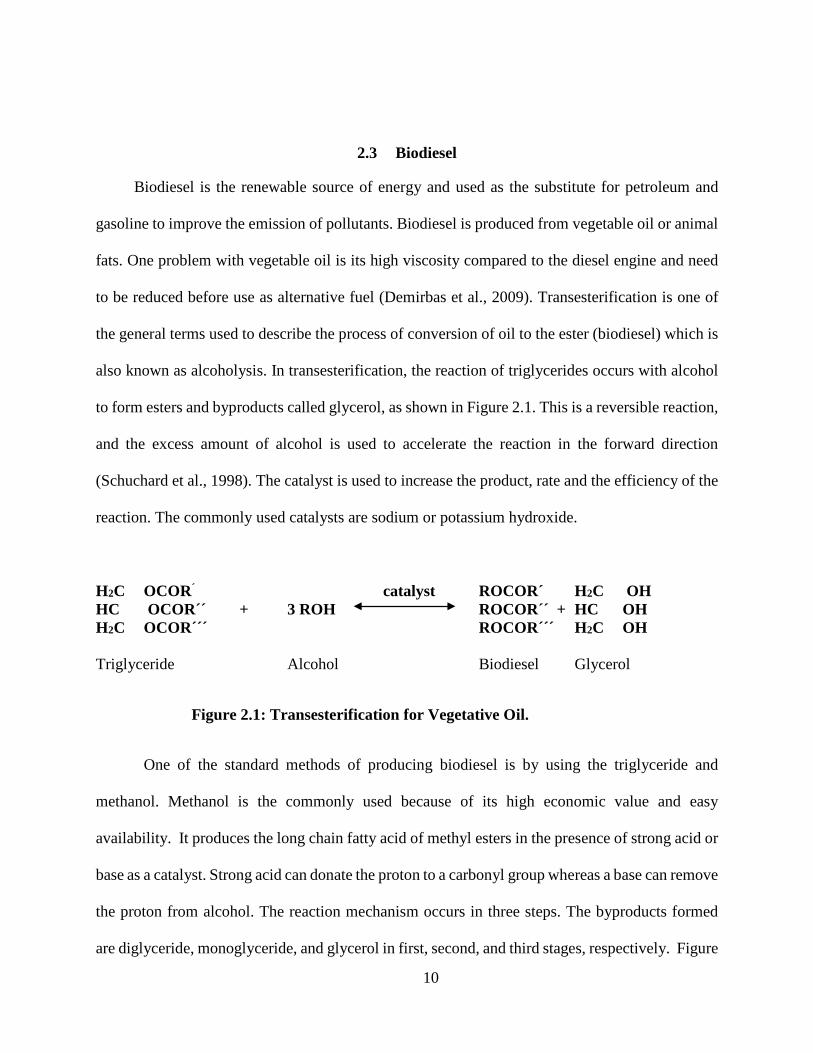
also known as alcoholysis. In transesterification, the reaction of triglycerides occurs with alcohol
to form esters and byproducts called glycerol, as shown in Figure 2.1. This is a reversible reaction,
and the excess amount of alcohol is used to accelerate the reaction in the forward direction
(Schuchard et al., 1998). The catalyst is used to increase the product, rate and the efficiency of the
reaction. The commonly used catalysts are sodium or potassium hydroxide.
H2C OCOR´ catalyst ROCOR´ H2C OH HC OCOR´´ + 3 ROH ROCOR´´ + HC OH H2C OCOR´´´ ROCOR´´´ H2C OH
Triglyceride Alcohol Biodiesel Glycerol
Figure 2.1: Transesterification for Vegetative Oil.
One of the standard methods of producing biodiesel is by using the triglyceride and
methanol. Methanol is the commonly used because of its high economic value and easy
availability. It produces the long chain fatty acid of methyl esters in the presence of strong acid or
base as a catalyst. Strong acid can donate the proton to a carbonyl group whereas a base can remove
the proton from alcohol. The reaction mechanism occurs in three steps. The byproducts formed
are diglyceride, monoglyceride, and glycerol in first, second, and third stages, respectively. Figure
11
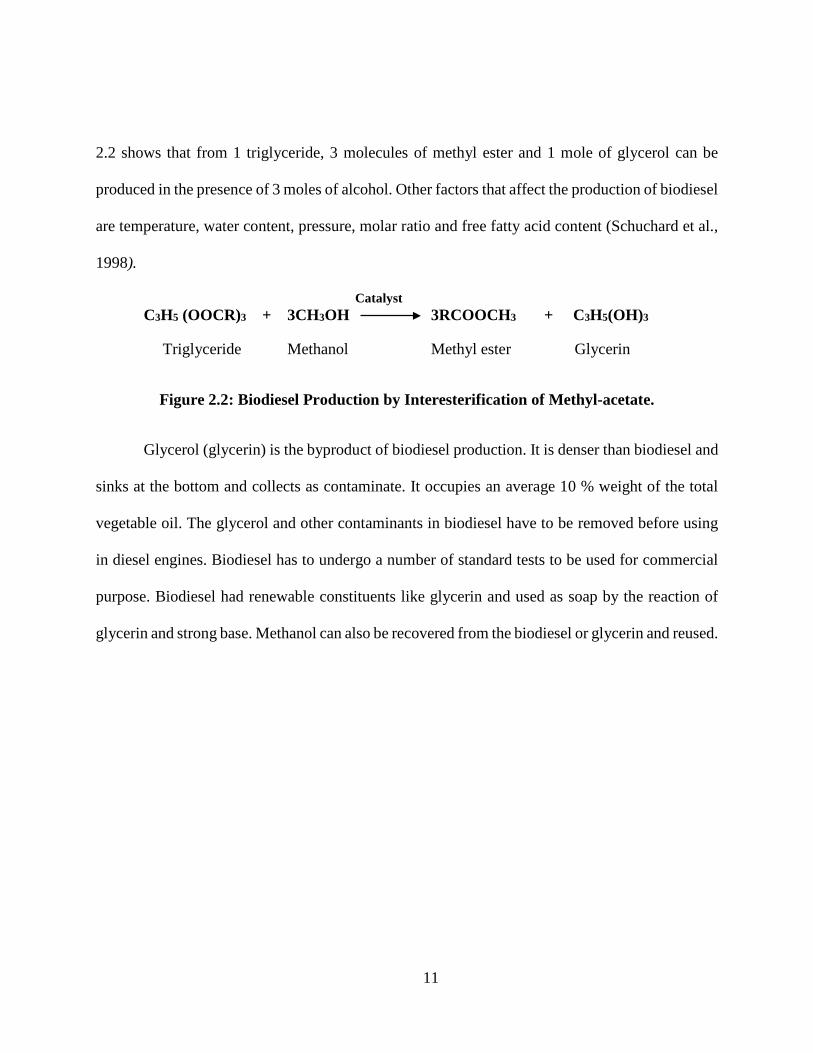
2.2 shows that from 1 triglyceride, 3 molecules of methyl ester and 1 mole of glycerol can be
produced in the presence of 3 moles of alcohol. Other factors that affect the production of biodiesel
are temperature, water content, pressure, molar ratio and free fatty acid content (Schuchard et al.,
1998).
Catalyst C3H5 (OOCR)3 + 3CH3OH 3RCOOCH3 + C3H5(OH)3
Triglyceride Methanol Methyl ester Glycerin
Figure 2.2: Biodiesel Production by Interesterification of Methyl-acetate.
Glycerol (glycerin) is the byproduct of biodiesel production. It is denser than biodiesel and
sinks at the bottom and collects as contaminate. It occupies an average 10 % weight of the total
vegetable oil. The glycerol and other contaminants in biodiesel have to be removed before using
in diesel engines. Biodiesel has to undergo a number of standard tests to be used for commercial
purpose. Biodiesel had renewable constituents like glycerin and used as soap by the reaction of
glycerin and strong base. Methanol can also be recovered from the biodiesel or glycerin and reused.
12
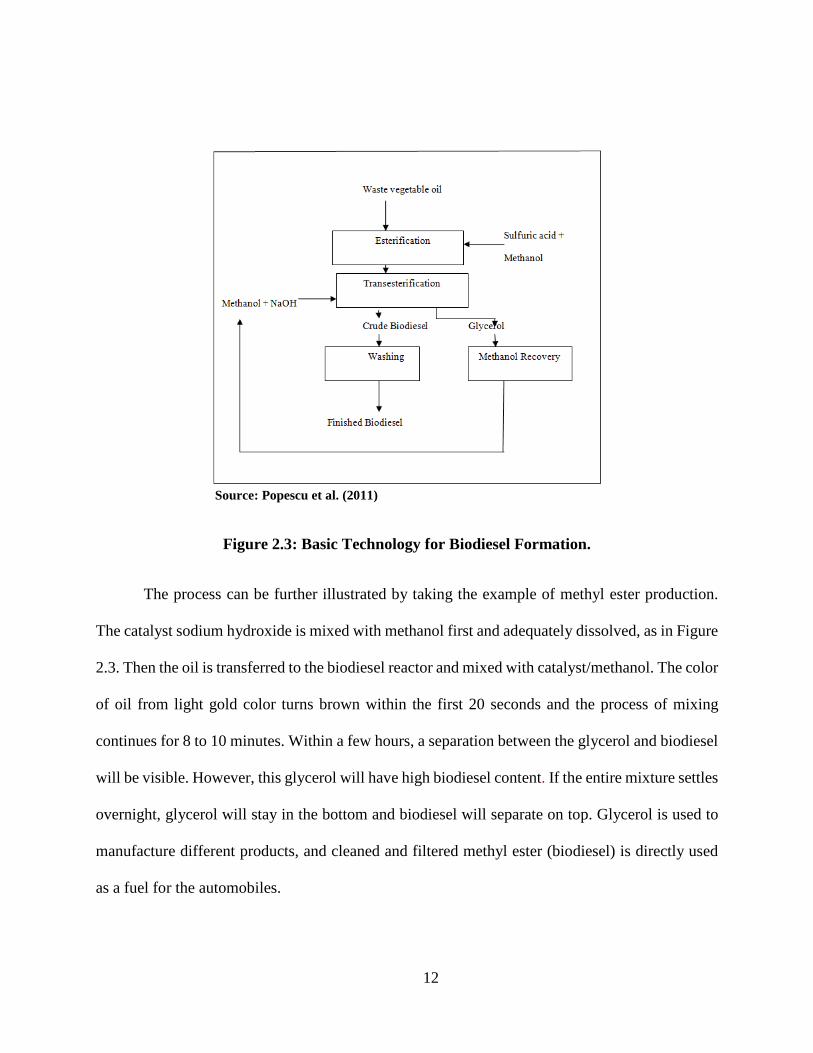
Source: Popescu et al. (2011)
Figure 2.3: Basic Technology for Biodiesel Formation.
The process can be further illustrated by taking the example of methyl ester production.
The catalyst sodium hydroxide is mixed with methanol first and adequately dissolved, as in Figure
2.3. Then the oil is transferred to the biodiesel reactor and mixed with catalyst/methanol. The color
of oil from light gold color turns brown within the first 20 seconds and the process of mixing
continues for 8 to 10 minutes. Within a few hours, a separation between the glycerol and biodiesel
will be visible. However, this glycerol will have high biodiesel content. If the entire mixture settles
overnight, glycerol will stay in the bottom and biodiesel will separate on top. Glycerol is used to
manufacture different products, and cleaned and filtered methyl ester (biodiesel) is directly used
as a fuel for the automobiles.
13
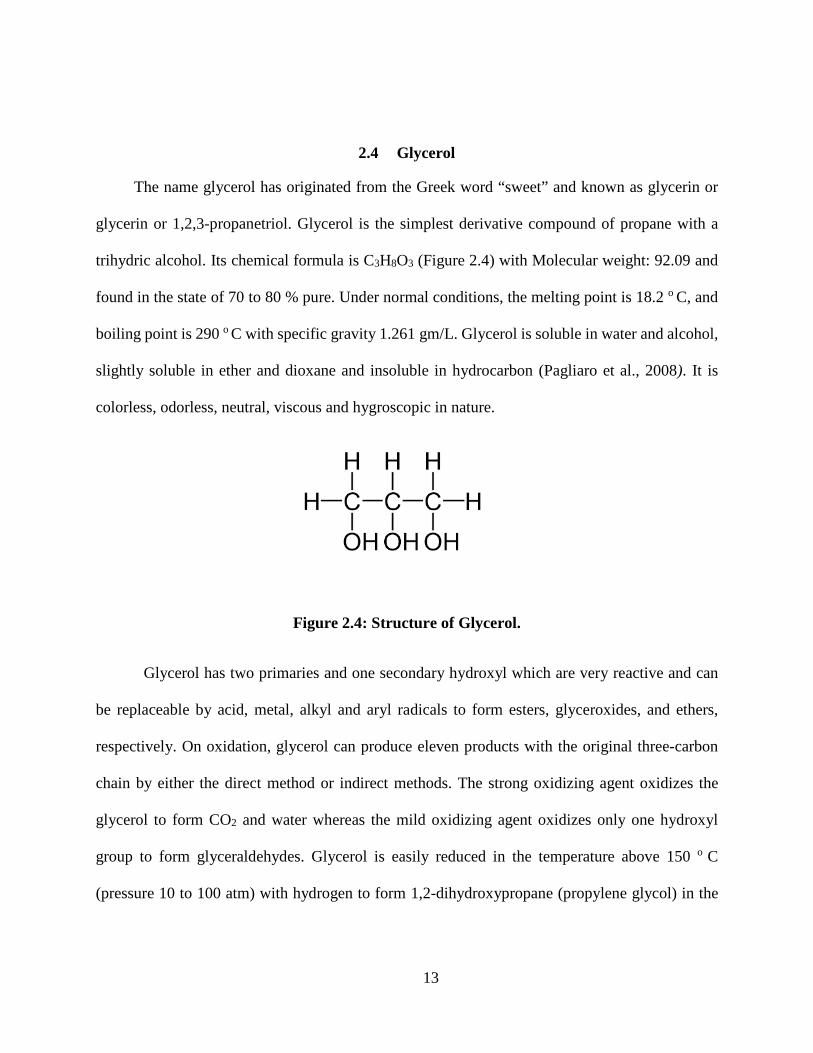
2.4 Glycerol
The name glycerol has originated from the Greek word “sweet” and known as glycerin or
glycerin or 1,2,3-propanetriol. Glycerol is the simplest derivative compound of propane with a
trihydric alcohol. Its chemical formula is C3H8O3 (Figure 2.4) with Molecular weight: 92.09 and
found in the state of 70 to 80 % pure. Under normal conditions, the melting point is 18.2 o C, and
boiling point is 290 o C with specific gravity 1.261 gm/L. Glycerol is soluble in water and alcohol,
slightly soluble in ether and dioxane and insoluble in hydrocarbon (Pagliaro et al., 2008). It is
colorless, odorless, neutral, viscous and hygroscopic in nature.
Figure 2.4: Structure of Glycerol.
Glycerol has two primaries and one secondary hydroxyl which are very reactive and can
be replaceable by acid, metal, alkyl and aryl radicals to form esters, glyceroxides, and ethers,
respectively. On oxidation, glycerol can produce eleven products with the original three-carbon
chain by either the direct method or indirect methods. The strong oxidizing agent oxidizes the
glycerol to form CO2 and water whereas the mild oxidizing agent oxidizes only one hydroxyl
group to form glyceraldehydes. Glycerol is easily reduced in the temperature above 150 o C
(pressure 10 to 100 atm) with hydrogen to form 1,2-dihydroxypropane (propylene glycol) in the
14
presence of the catalyst. Glycerol is also reduced to isopropyl iodide when heated to 135 o C to 140
o C in the excess of hydroiodic acid.
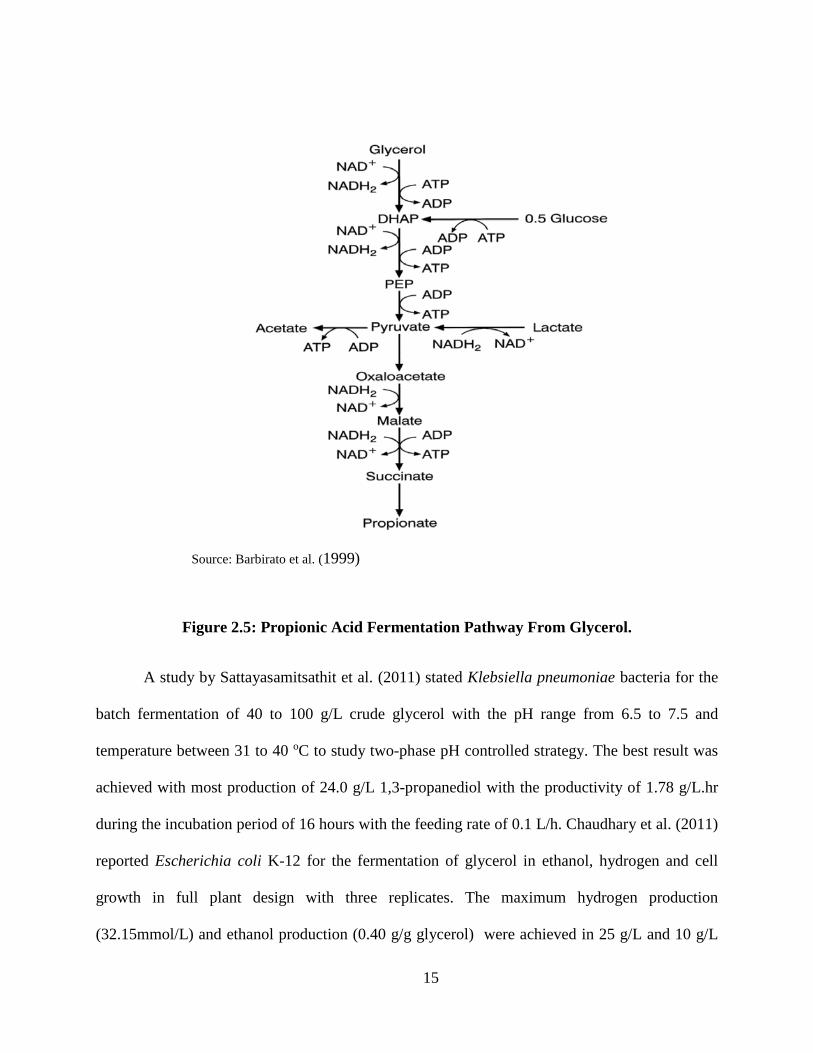
The medium concentration of glycerol can be used as a carbon source for many organisms,
either by active transport or passive transport during aerobic and anaerobic condition (Viana et al.,
2012). There are two ways of the metabolic pathways for the anaerobic fermentation of glycerol
(Yazdani et al., 2007). The first is the oxidative pathways where dehydrogenating of glycerol
occurs by the NAD-linked glycerol dehydrogenase to form dihydroxyacetone. This is
phosphorylated by the enzyme dihydroxyacetone kinase to form the various product like succinate,
propionate, pyruvate, oxaloacetate, and malate as in Figure 2.5. The formation of a product
depends on the environmental factors like temperature, alkalinity, pH, mixing and SRT.
In the second reductive method, glycerol was dehydrated to form 3-
hydroxypropionaldehyde by coenzyme glycerol dehydratase which further reduced to 1,3-
propanediol by a 1,3-propanediol dehydrogenase. The first principal product of glycerol 1,3-
propanediol from fermentation was observed by Werkman et al. (1932). The formation of 1,3-
propanediol from glycerol had been studied for several bacteria like Clostridium butyricum
(Papanikolaou et al., 2004), Paenibacillus macerans (Gupta et al., 2009), Escherichi coli
(Dharmadi et al., 2006; Chaudhary et al., 2010), Propionibacterium freudenreichii ssp. Shermanii
(Kosmider et al., 2010), Citrobacter freundii and Hafnia alvei (Drozdzynska et al., 2014).
15
Source: Barbirato et al. (1999)
Figure 2.5: Propionic Acid Fermentation Pathway From Glycerol.
A study by Sattayasamitsathit et al. (2011) stated Klebsiella pneumoniae bacteria for the
batch fermentation of 40 to 100 g/L crude glycerol with the pH range from 6.5 to 7.5 and
temperature between 31 to 40 oC to study two-phase pH controlled strategy. The best result was
achieved with most production of 24.0 g/L 1,3-propanediol with the productivity of 1.78 g/L.hr
during the incubation period of 16 hours with the feeding rate of 0.1 L/h. Chaudhary et al. (2011)
reported Escherichia coli K-12 for the fermentation of glycerol in ethanol, hydrogen and cell
growth in full plant design with three replicates. The maximum hydrogen production
(32.15mmol/L) and ethanol production (0.40 g/g glycerol) were achieved in 25 g/L and 10 g/L
16
glycerol concentration, respectively. The experiment also showed the negative effects of hydrogen
production on the cell growth.
In wastewater, fermentation of glycerol to a simpler form (volatile fatty acid) like acetate,
propionate, or succinate is essential for the ideal use by the microorganism. The production of
propionic acid is associated with the Gram-positive Propionibacterium genera which are capable
of utilizing glycerol during the fermentation process (Clomburg et al., 2013). Propionibacterium
acidipropionic could produce 46 g/L propionic acid from 80 g/L glycerol with the productivity of
0.36 g/L.hr. Barbirato et al. (1997) tested the Propionibacterium acidipropionic,
Propionibacterium acnes and Clostridium propionicum for the conversion of 20 g/L glycerol to
propionic acid during the batch fermentation. Propionibacterium acidipropionic showed the high
efficiency compared to the other two species regarding production. Propionic acid generation from
glycerol was compared with other carbon sources such as glucose and lactic acid. The total
productivity of propionic acid was 0.18 g/L.hr by glycerol whereas, the conversion decreased by
17 % and 13% while using glucose and lactic acid, respectively. Himmi et al. (2000) also focused
on the fermentation of propionic acid by using Propionibacterium acidipropionic,
Propionibacterium freuenreichii ssp. and Shermani with two carbon sources as glycerol and
glucose in an aerobic batch reactor. The study showed that in 20 g/L glycerol or glucose, the
primary end product was propionic acid followed by acetic acid, n-propanol, and succinic acid.
Propionibacterium acidipropionic had greater efficiency with the production of 0.42 g/L.hr (0.79
mol/mol) propionic acid. Similarly, in another review of 20 g/L glycerol by Propionibacterium
acidipropionic and Propionibacterium freuenreichii ssp., Shermani, the production of propionic
acid were 0.79 and 0.58 mol/mol, respectively (Bories et al., 2003).
17
2.5 Impact of Glycerol in EBPR
Enhanced biological phosphorus removal (EBPR) lowers the phosphorus level without using
chemical through activated sludge process (Oehmen et al., 2007). The group of microorganism
responsible for phosphorus removal is polyphosphate accumulating organisms (PAOs). These
organisms are capable of storing the phosphate as intracellular polyphosphate. Under anaerobic
condition, polyphosphate is used to generate energy to transport volatile fatty acid (VFAs) into the
cell and store them into Poly-β-hydroxyalkanoates (PHAs). VFAs, which need reducing
equivalents for biotransformation into PHAs, are supplied through the glycolysis of the glycogen.
The anaerobic condition is favorable for the growth of PHAs by decreasing the amount of
polyphosphate and glycogen. In aerobic condition, PHA oxidizes in the presence of oxygen by
producing energy and storing in newly form polyphosphate. Aerobic condition favors the
formation of glycogen and polyphosphate thus decreasing the formation of PHAs. Some of the
PHA carbons are also transforming into glycogen. Glycogen accumulating organism (GAOs) uses
the glycogen for energy and converts into PHAs. In an anaerobic condition, some of the GAOs
compete with PAOs for the substrate like VFAs and sugars.
EBPR is commonly used for the removal of phosphorus in wastewater treatment. The
GAO and PAO are the two dominant organisms for EBPR. PAO is capable of storing the
phosphorus as polyphosphate and hence contributes to the phosphorus removal by releasing
orthophosphate in the solution. GAO uses the VFAs and does not contribute to removing
phosphorus. One of the main reasons for the failure of EBPR can be the superfluous growth of
GAO over PAO and GAO competition for biomass substrate over PAO (Oehmen et al., 2006).
18
Therefore, the favorable environment for PAO helps to improve EBPR process. Acetate and
propionate are commonly used as a carbon substrate for phosphorus removal in EPBR. Acetate
provides the convenient adaptability to polyphosphate accumulating organism under anaerobic and
aerobic conditions to synthesize the intracellular storage compound. PHA products were mainly
poly-hydroxy-butyrate (PHB) and poly-hydroxy-valerate (PHV) when using acetate and
propionate, respectively (Randall et al., 2002). When acetate and propionate were used as the
carbon source, anaerobic P release is less in propionate, whereas aerobic P uptake and anaerobic
VFA uptake were similar in both cases (Pijuan et al., 2004).
Several researchers have investigated glycerol as a carbon source in EBPR. Glycerol was
fermented with waste activated sludge to study its impact on biological phosphorus removal (Yuan
et al., 2010). The waste activated sludge from the reactor was replaced by the same amount of
glycerol to increase the production of volatile fatty acids (VFA). The results showed the significant
amount of VFAs with propionic acid as the primary end product. This enhanced the EBPR without
causing the adverse impact on denitrification.
The low-level of organic content in influent wastewater results in the failure of EBPR in
full-scale plant. In such situations, an external carbon source is necessary to get the desired level
of phosphorus removal. A study of Guerrero et al. (2012) highlighted the use of glycerol for two
different strategies. In the first case, glycerol was directly used as a sole carbon source and the
second instance involved the two types of association between glycerol anaerobic degraders and
PAO. The result was favorable in longer anaerobic phase for glycerol as a sole carbon source. A
19
longer anaerobic phase also favored the degradation of anaerobic glycerol to PAO due to the
availability of high sludge. The proper configurations obtained were 4h and 3.5h for anaerobic and
aerobic, respectively as a single carbon source. This research for the first time showed the
feasibility of glycerol in the single sludge configuration.
Crude glycerol is considered as an alternative carbon source. Long chain fatty acid (LCFA),
one of the glycerol parameters, was studied to find the effect on PAO (Taya et al., 2015). The study
focused on the effect of LCFA for short-term and long-term exposure. The results showed that
excess use of glycerol decreased PAO activity by adsorption on the surface of microorganisms.
The short-term study was able to sustain the PAO activity. However, a long-term exposure created
operational problems by increased biomass.
Coats et al. (2015) focused on the different aspects than anaerobic phosphorus release for
successful EBPR by using crude glycerol. The study illustrated the carbon cycle by PAOs
anaerobically to generate ATP energy for VFA uptake. PAO only consumed poly P reserves if the
substrate energy was low for metabolism.
20
2.6 Impact of Glycerol in Denitrification
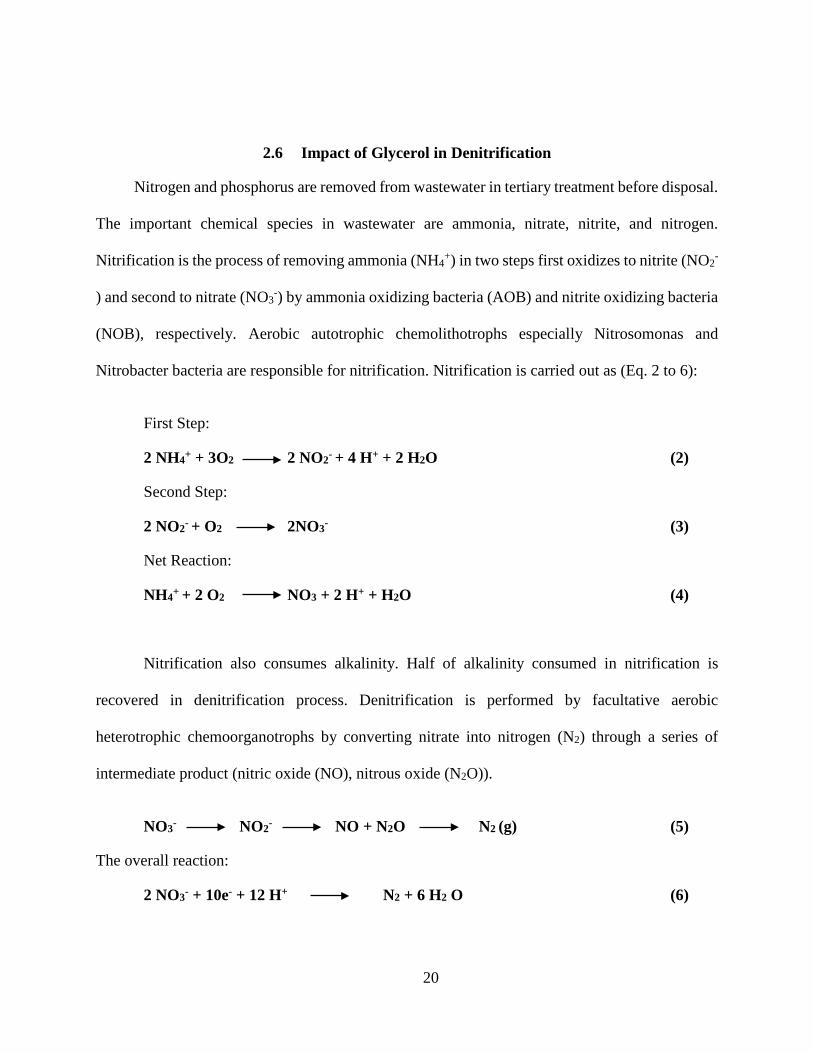
Nitrogen and phosphorus are removed from wastewater in tertiary treatment before disposal.
The important chemical species in wastewater are ammonia, nitrate, nitrite, and nitrogen.
Nitrification is the process of removing ammonia (NH4+) in two steps first oxidizes to nitrite (NO2
-
) and second to nitrate (NO3-) by ammonia oxidizing bacteria (AOB) and nitrite oxidizing bacteria
(NOB), respectively. Aerobic autotrophic chemolithotrophs especially Nitrosomonas and
Nitrobacter bacteria are responsible for nitrification. Nitrification is carried out as (Eq. 2 to 6):
First Step:
2 NH4+ + 3O2 2 NO2- + 4 H+ + 2 H2O (2)
Second Step:
2 NO2- + O2 2NO3- (3)
Net Reaction:
NH4+ + 2 O2 NO3 + 2 H+ + H2O (4)
Nitrification also consumes alkalinity. Half of alkalinity consumed in nitrification is
recovered in denitrification process. Denitrification is performed by facultative aerobic
heterotrophic chemoorganotrophs by converting nitrate into nitrogen (N2) through a series of
intermediate product (nitric oxide (NO), nitrous oxide (N2O)).
NO3- NO2- NO + N2O N2 (g) (5)
The overall reaction:
2 NO3- + 10e- + 12 H+ N2 + 6 H2 O (6)

21
Organic matter is also essential for denitrification. Denitrification is commonly used in
wastewater to remove nitrogen. The Modified Ludzack- Ettinger (MLE) process is a common
biological process for the nitrogen removal (Uprety et al., 2012). In biological nutrient removal
(BNR), it is necessary to keep nitrate out of the anaerobic zone to have nitrification and
denitrification for stable phosphorous removal. The partial denitrification can cause breaking of
nitrite and nitrate in the aerobic zone and filamentous bulking as well. The presence of nitrite
reduces denitrifying phosphate uptake both in the aerobic and anoxic zone. It provides the
favorable environment for GAO and competes with PAO in anaerobic zone (Saito et al., 2004).
The denitrifying bacteria compete with PAO for the metabolic substrate and inhibit the
release of anaerobic phosphorus and EBPR activity. Denitrification rate depends on the nature
and availability of biodegradable organics. It also depends on the environmental condition like pH,
temperature, dissolved oxygen, and presence of carbon and nitrite (Foglar et al., 2003). There are
two types of PAO recognized: denitrifying PAO and denitrifying Poly P accumulating organisms
(DNPAO) (Seviour et al., 2003). PAOs have a lower endogenous decay coefficient. In order to
protect from the breakpoint, the anoxic zone is designed to prevent the nitrate from anaerobic zone
for complete denitrification by proper use of COD/N and internal recycle ratio. Wastewaters with
high COD/N ratio need to have high recycled ratio or post-denitrification to remove the total
nitrogen (Lee et al., 2001).
In order to meet the nitrogen limit, additional carbon source as electron donor has to be
added in BNR process. In the past decade, different carbon sources have studied to find the
22
effectiveness and improvement in N removal. The commonly used carbon sources for the study
are methanol, acetic acid, benzoic acid and glucose. A research work of Her et al. (1995) signified
aromatic (benzoic) compound with less denitrification efficiency than non-aromatic compound
under a constant C/N ratio. For non-aromatic (methanol, acetic acid, and glucose) compounds,
efficiency depended on the molecular weight and chemical structure and required minimum C/N
ratio. Among non-aromatic compounds, the requirement for the minimum C/N ratio depended on
the molecular weight and increased with weight.
When the complex compound (sucrose) was used as the carbon source, enhanced biological
phosphorus removal process failed (Guerrero et al., 2012). The presence of nitrite inhibited the
fermentation process for VFA production and caused the failure of phosphorus removal. The
carbon source with a lower molecular weight was easily degradable and allowed high
denitrification rate.
A limited supply of carbon results in the intermediate nitrites species whereas; the extra
supply caused the carbon breakthrough. It is also important to select the appropriate carbon source
for the BNR. Cost-effective and low chain carbon source results in less sludge and efficient
denitrification (Uprety et al., 2013). The research studied the effect of methanol, pure glycerol and
biodiesel glycerol waste in three sequencing batch reactors. The high amount of carbon resulted in
the small nitrogen residual. However, low dose only removed the partial TN in all three reactors.
Glycerol reactor had high nitrite accumulation than the methanol.
23
In a study by Hinojosa et al. (2008), biodiesel byproduct glycerol was added during the
denitrification process to study denitrification rate, C: N ratio and maximum growth rate in the
batch experiments. The study showed the minimum C/N ratio calculated as 4.2 mg COD/mg NOx-
N with the maximum growth rate of 3.4/d. Another study on glycerol evaluated the effectiveness
in a landfill by Melidis et al. (2009). The study analyzed the results from the use of carbon and
without carbon for the nitrogen compound removal. When there was no carbon source, N removal
was insignificant, and there was an accumulation of nitrate and nitrite. However, with the use of
glycerol as a carbon source the nitrogen removal improved in the range of 75.9 % to 99.9 %.
In the study of constructed wetland, use of glucose as a carbon source increased the nitrate
removal of 30 to 40 mg/L nitrate. In summer, the removal increased from 20 % to more than 50 %
and in winter increased from 10 % to 30 % with the retention time of 24 hour (Songliu et al., 2009).
However, more supply of carbon source in summer and winter increased the acclimation of
nitrogen from 0.15 mg/ L to 2 mg/L in the effluent.
Glycerol was studied to find the appropriate C/N ratio for complete removal of nitrate
without activating the anaerobic glycerol metabolic pathway of denitrification. The C/N ratio of 3
was considered as the best practice with the entire removal of nitrates with the formation of 0.16
g/L 1, 3-propanediol and 0.11 g/L acetic acid (Cyplik et al., 2013). In another study, the C/N ratio
of 2 showed a higher N2O in the gass phase than C/N ratio of 3 to 4 causing incomplete nitrite
removal (Katarzyna et al., 2015). Denitrification was found efficient in C/N ratio between 2.5 to
4.0 with an optimal ratio of 3 for glycerin.
24
CHAPTER 3: MATERIALS AND METHODS
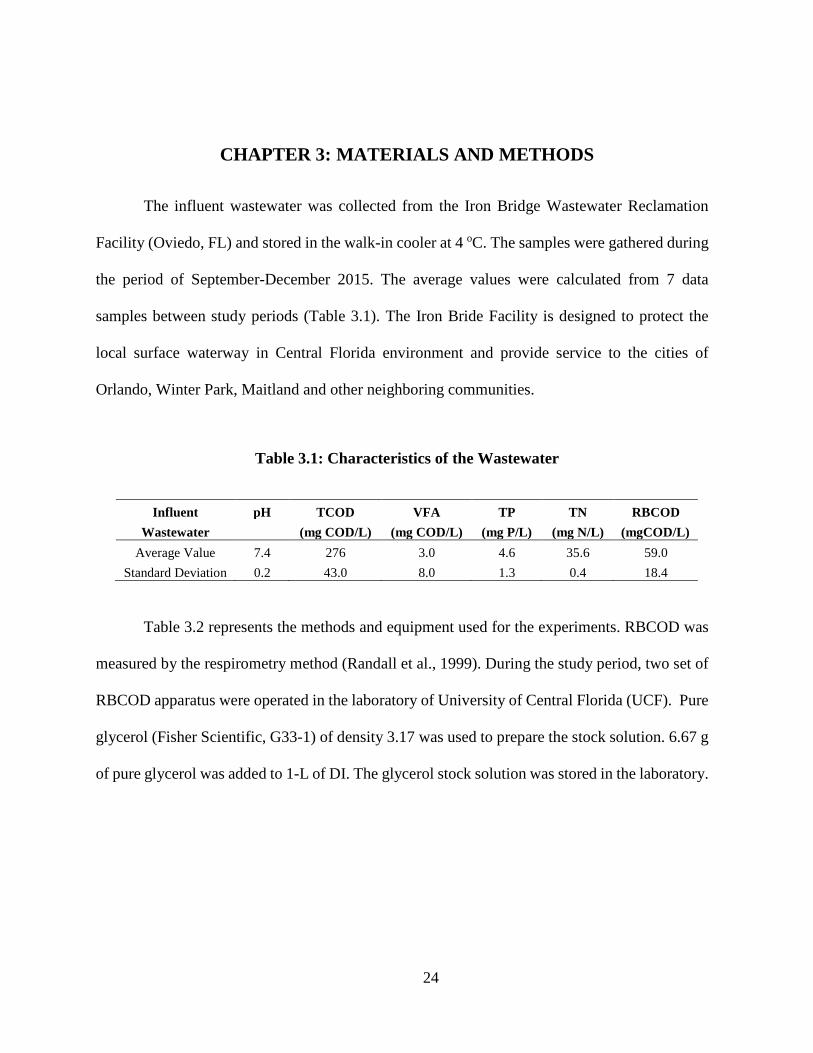
The influent wastewater was collected from the Iron Bridge Wastewater Reclamation
Facility (Oviedo, FL) and stored in the walk-in cooler at 4 oC. The samples were gathered during
the period of September-December 2015. The average values were calculated from 7 data
samples between study periods (Table 3.1). The Iron Bride Facility is designed to protect the
local surface waterway in Central Florida environment and provide service to the cities of
Orlando, Winter Park, Maitland and other neighboring communities.
Table 3.1: Characteristics of the Wastewater
Influent pH TCOD VFA TP TN RBCOD Wastewater (mg COD/L) (mg COD/L) (mg P/L) (mg N/L) (mgCOD/L)
Average Value 7.4 276 3.0 4.6 35.6 59.0 Standard Deviation 0.2 43.0 8.0 1.3 0.4 18.4
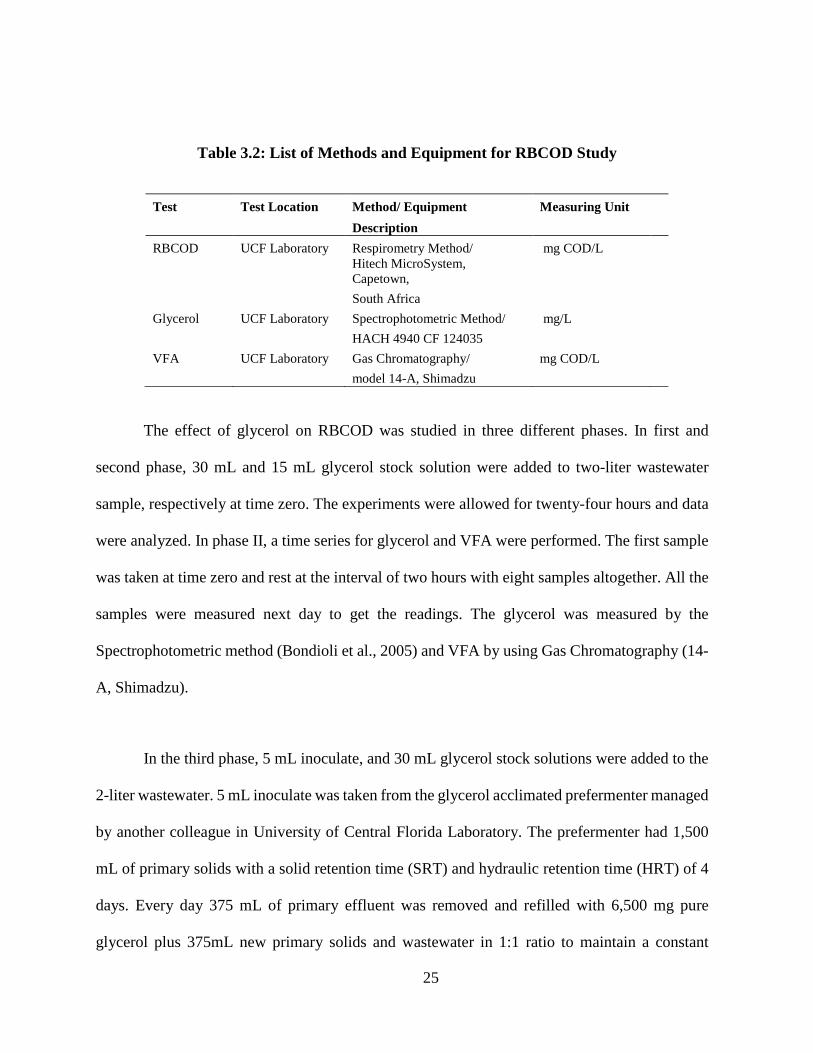
Table 3.2 represents the methods and equipment used for the experiments. RBCOD was
measured by the respirometry method (Randall et al., 1999). During the study period, two set of
RBCOD apparatus were operated in the laboratory of University of Central Florida (UCF). Pure
glycerol (Fisher Scientific, G33-1) of density 3.17 was used to prepare the stock solution. 6.67 g
of pure glycerol was added to 1-L of DI. The glycerol stock solution was stored in the laboratory.
25
Table 3.2: List of Methods and Equipment for RBCOD Study
Test Test Location Method/ Equipment Measuring Unit Description RBCOD UCF Laboratory Respirometry Method/ mg COD/L
Hitech MicroSystem, Capetown,
South Africa Glycerol UCF Laboratory Spectrophotometric Method/ mg/L HACH 4940 CF 124035 VFA UCF Laboratory Gas Chromatography/ mg COD/L model 14-A, Shimadzu
The effect of glycerol on RBCOD was studied in three different phases. In first and
second phase, 30 mL and 15 mL glycerol stock solution were added to two-liter wastewater
sample, respectively at time zero. The experiments were allowed for twenty-four hours and data
were analyzed. In phase II, a time series for glycerol and VFA were performed. The first sample
was taken at time zero and rest at the interval of two hours with eight samples altogether. All the
samples were measured next day to get the readings. The glycerol was measured by the
Spectrophotometric method (Bondioli et al., 2005) and VFA by using Gas Chromatography (14-
A, Shimadzu).
In the third phase, 5 mL inoculate, and 30 mL glycerol stock solutions were added to the
2-liter wastewater. 5 mL inoculate was taken from the glycerol acclimated prefermenter managed
by another colleague in University of Central Florida Laboratory. The prefermenter had 1,500
mL of primary solids with a solid retention time (SRT) and hydraulic retention time (HRT) of 4
days. Every day 375 mL of primary effluent was removed and refilled with 6,500 mg pure
glycerol plus 375mL new primary solids and wastewater in 1:1 ratio to maintain a constant
26
volume in the prefermenter. The prefermenter was operated to remove the significant amount of
glycerol. The mixed liquor suspended solid (MLSS) of glycerol acclimated biomass was
measured as 5,500 mg/L with the VSS/TSS ratio of 0.88. The main reason to add acclimated
glycerol sludge was to see the effect on the wastewater.
27
3.1 OUR Calibration
3.1.1 Main Knob for Calibration
Once the DO/OUR Meter (IP55-685.008, Hitech Micro Systems, Capetown, South
Africa) was turned on, temperature and DO (mg/L) displayed on the front panel. F key was
pressed to change the operation mode (Mode A). Sodium sulphite solution of 100 mg in 100 mL
DI water was prepared. Every time the solution was freshly made and used within 30 minutes.
The DO probe (YSI, 5739) and the wire thermometer (Mylar Screened Cable, 0.22mm) were
placed in the sodium sulphite solution and suspended 1 inch above the bottom and allowed for 1
min to get the stable reading. The Main knob (Zero knob) located on the left side of the unit was
adjusted such that the DO was less than or equal to 0.5 mg/L. Once it was calibrated, the DO
probe and wire thermometer were removed from the solution and rinsed with DI water. In order
to verify the zero setting, the DO probe and wire thermometer were placed in sodium sulphite
solution again to get the reading, and the both are cleaned with DI water. The calibration of Main
knob could be done twice a month or once having the peculiar results.
3.1.2 Gain knob for Calibration
A beaker was filled with 100mL DI water, and aeration stone was added. The beaker was
covered with plastic wrap to limit the oxygen diffusion from surface to water. The pump button
was turned on and allowed the aeration until the water was fully saturated and showed the stable
DO reading. The beaker was left for 3 minutes. Once the water reached the saturated condition,
the DO probe and temperature wire were placed 1 inch above the bottom. In order to calibrate,
28
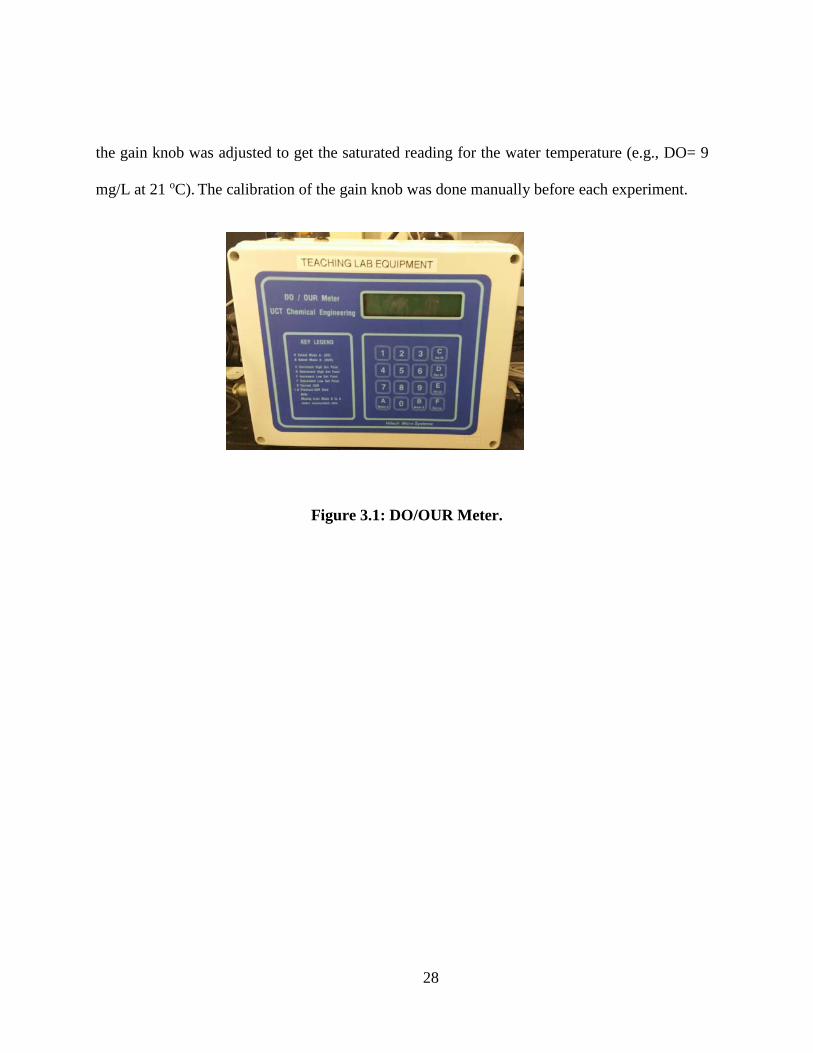
the gain knob was adjusted to get the saturated reading for the water temperature (e.g., DO= 9
mg/L at 21 oC). The calibration of the gain knob was done manually before each experiment.
Figure 3.1: DO/OUR Meter.
29
3.2 Analytical Procedures
3.2.1 RBCOD
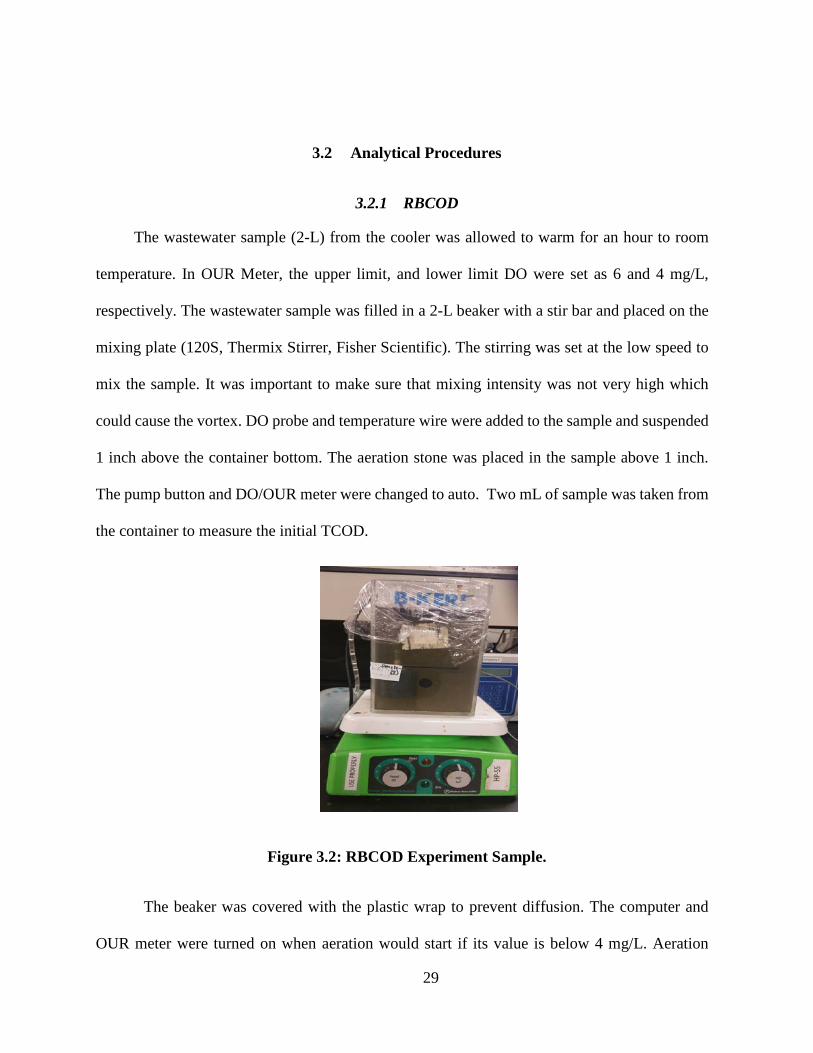
The wastewater sample (2-L) from the cooler was allowed to warm for an hour to room
temperature. In OUR Meter, the upper limit, and lower limit DO were set as 6 and 4 mg/L,
respectively. The wastewater sample was filled in a 2-L beaker with a stir bar and placed on the
mixing plate (120S, Thermix Stirrer, Fisher Scientific). The stirring was set at the low speed to
mix the sample. It was important to make sure that mixing intensity was not very high which
could cause the vortex. DO probe and temperature wire were added to the sample and suspended
1 inch above the container bottom. The aeration stone was placed in the sample above 1 inch.
The pump button and DO/OUR meter were changed to auto. Two mL of sample was taken from
the container to measure the initial TCOD.
Figure 3.2: RBCOD Experiment Sample.
The beaker was covered with the plastic wrap to prevent diffusion. The computer and
OUR meter were turned on when aeration would start if its value is below 4 mg/L. Aeration
30
continued until it reached 6 mg/L and the process continued as DO value drops. This experiment
was carried out for 24 hours. The computed data for the experiment were recorded in DOMWIN
software program. After 24 hours, the data were downloaded from DOMWIN to a thumb drive
or any floppy disk. The probe, thermometer and aeration stone were removed from the sample
container and properly cleaned with DI. The DO probe was placed back into the storage bottle
and all other at the proper place. The final TCOD was measured for the sample.
3.2.2 Glycerol
A spectrophotometric method was used to determine the glycerol concentration in the
wastewater samples. The working reagents of an acetic acid stock solution of 1.6M (9.6 g/100 mL)
and ammonium acetate stock solution of 4.0 M (30.8 g/100 mL) were prepared. The acetylacetone
solution (0.2 M) and sodium periodate solution (10mM) were also prepared. The samples were
collected as 0, 0.5, 1, 1.5 and 2 mL in test tubes, and 1.2 mL of 10mM sodium periodate solution
was added to the samples. In the samples, 1.2 mL of acetylacetone solution was added and stirred
manually. The samples were measured with the spectrophotometer set (HACH 4940 CF 124035)
in double beam mode at 410 nm.
3.2.3 VFA
Short chain volatile fatty acids (SCVFAs) were measured by the gas chromatography
(model 14-A, Shimadzu) method. The samples were analyzed in the initial column temperature of
110 oC which increased with the rate of 5 oC/min until 190 oC. The 1.5 mL of samples filtered by
0.45 µm membrane filters were transferred to the GC vials and acidified with 2 µL of 3 % H2PO4.
The samples were measured by injecting volatile free acid mix containing 10 mM SCVFAs.
31
3.2.4 Laboratory Quality Control
During the data analysis, duplicates and spike samples were collected to check the accuracy
and consistency of the data. A duplicate sample and spike sample were measured for every two
samples during the glycerol and VFA analysis. The accuracy of data for batch tests was evaluated
by COD mass balance as equation 7.
COD Recovery (%) = CODtt=T+∫ OUR dtt=T
t=0CODt=0
× 100
Where,
t = time (hr)
CODt=T = total unfiltered COD concentration at end of test (t=T) (mg COD/L)
OUR = Oxygen utilization rate (mgO2/L.hr)
∫ OUR dtt=Tt=0 = integral area under the OUR vs. time plot between start and end of test (mgO2/L)
= oxygen concentration consumed over the test
The industrial statistics (I statistics) as in equation 8 was used to measure the precision of
the data. In an equation, A represents the sample value and B as the duplicate value.
I = |𝐴𝐴−𝐵𝐵|𝐴𝐴+𝐵𝐵
(8)
32
CHAPTER 4: RESULTS AND DISCUSSION
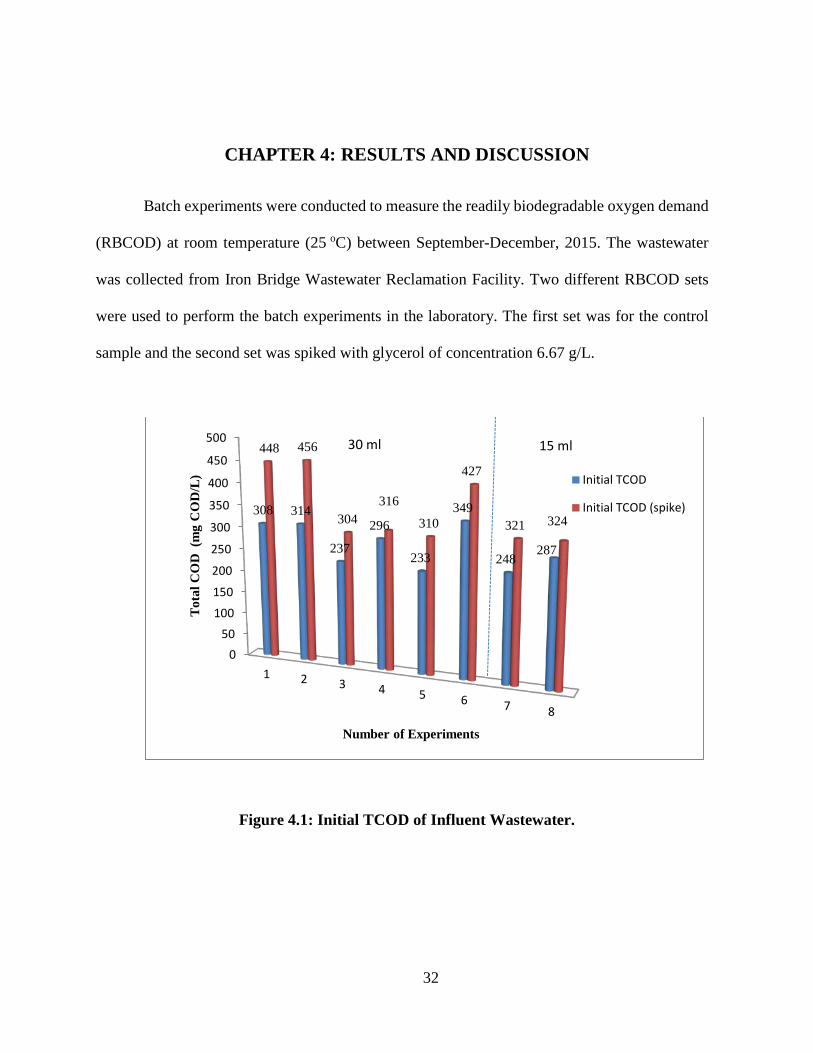
Batch experiments were conducted to measure the readily biodegradable oxygen demand
(RBCOD) at room temperature (25 oC) between September-December, 2015. The wastewater
was collected from Iron Bridge Wastewater Reclamation Facility. Two different RBCOD sets
were used to perform the batch experiments in the laboratory. The first set was for the control
sample and the second set was spiked with glycerol of concentration 6.67 g/L.
Figure 4.1: Initial TCOD of Influent Wastewater.
050
100
150
200
250
300
350
400
450
500
1 2 3 4 5 6 7 8
308 314
237
296
233
349
248287
448 456
304316
310
427
321 324
Tot
al C
OD
(m
g C
OD
/L)
Number of Experiments
Initial TCOD
Initial TCOD (spike)
30 ml 15 ml
33
Average total chemical oxygen demand (TCOD) in wastewater were 284 mg COD/L and
increased up to 378 mg COD/L and 323 mg COD/L for 30 mL and 15 mL glycerol concentration,
respectively. Effect of glycerol on TCOD level is shown in Figure 4.1. The TCOD levels in all
experiments are increased by glycerol addition.
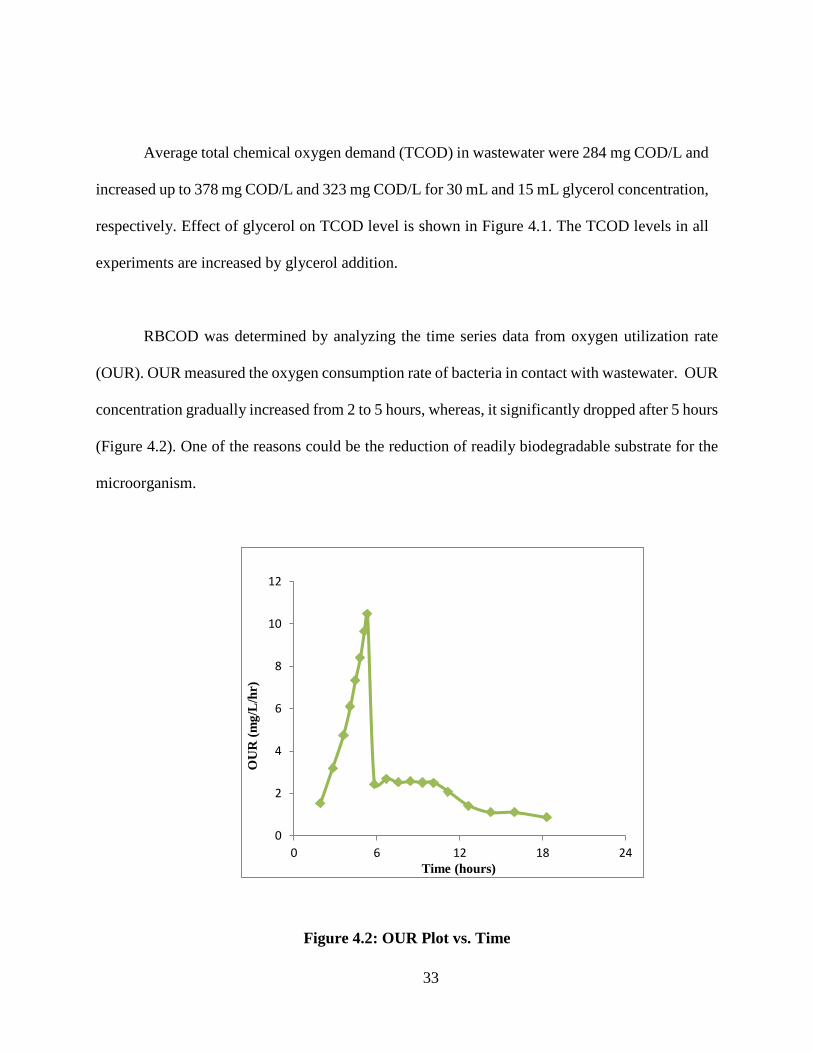
RBCOD was determined by analyzing the time series data from oxygen utilization rate
(OUR). OUR measured the oxygen consumption rate of bacteria in contact with wastewater. OUR
concentration gradually increased from 2 to 5 hours, whereas, it significantly dropped after 5 hours
(Figure 4.2). One of the reasons could be the reduction of readily biodegradable substrate for the
microorganism.
Figure 4.2: OUR Plot vs. Time
0
2
4
6
8
10
12
0 6 12 18 24
OU
R (m
g/L
/hr)
Time (hours)
34
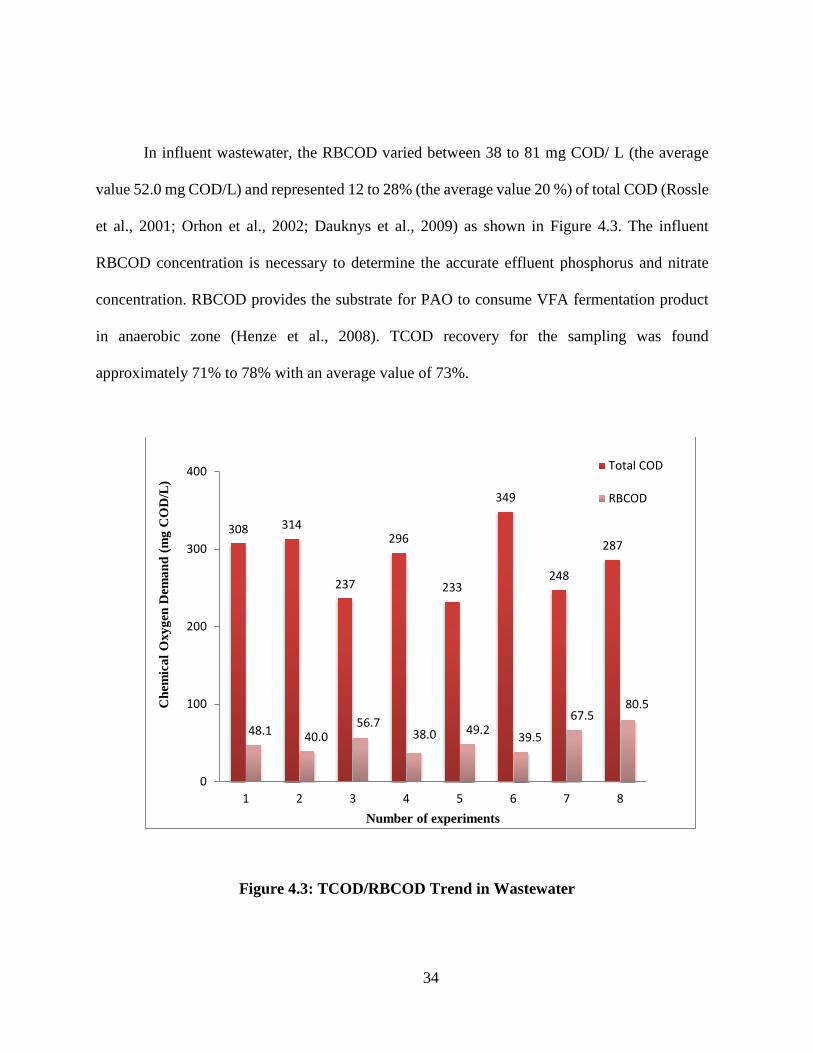
In influent wastewater, the RBCOD varied between 38 to 81 mg COD/ L (the average
value 52.0 mg COD/L) and represented 12 to 28% (the average value 20 %) of total COD (Rossle
et al., 2001; Orhon et al., 2002; Dauknys et al., 2009) as shown in Figure 4.3. The influent
RBCOD concentration is necessary to determine the accurate effluent phosphorus and nitrate
concentration. RBCOD provides the substrate for PAO to consume VFA fermentation product
in anaerobic zone (Henze et al., 2008). TCOD recovery for the sampling was found
approximately 71% to 78% with an average value of 73%.
Figure 4.3: TCOD/RBCOD Trend in Wastewater
308 314
237
296
233
349
248
287
48.1 40.056.7
38.0 49.2 39.5
67.580.5
0
100
200
300
400
1 2 3 4 5 6 7 8
Che
mic
al O
xyge
n D
eman
d (m
g C
OD
/L)
Number of experiments
Total COD
RBCOD
35
RBCOD is further divided into fermentation products (VFAs) and readily fermentable
biodegradable fraction (F-RBCOD). VFAs comprise 2 to 10 % of total COD whereas fermentable
RBCOD consist of 10 to 20 % of total COD (Rossle et al., 2001; Naidoo et al., 1999). In the
influent wastewater, the rate of VFA uptake is very high by the microorganism for the microbial
growth and reproduction (especially by PAO) and stored as polyhydroxyalkanoates (PHA) in the
cells in anaerobic condition. The readily fermentable substrates are directly available to the
heterotrophic microorganisms and form the substrate for the fermentation (Naidoo et al., 1999).
SBCOD represents 50 % to 77 % of TCOD (Rossle et al., 2001). SBCOD are slowly
consumed and metabolized by microorganisms and represents the rate of 10 % compared to
RBCOD uptake (Naidoo et al., 1999). The complex compound is broken down into the simpler
molecules by the extracellular enzyme and utilized by the microorganism.
36
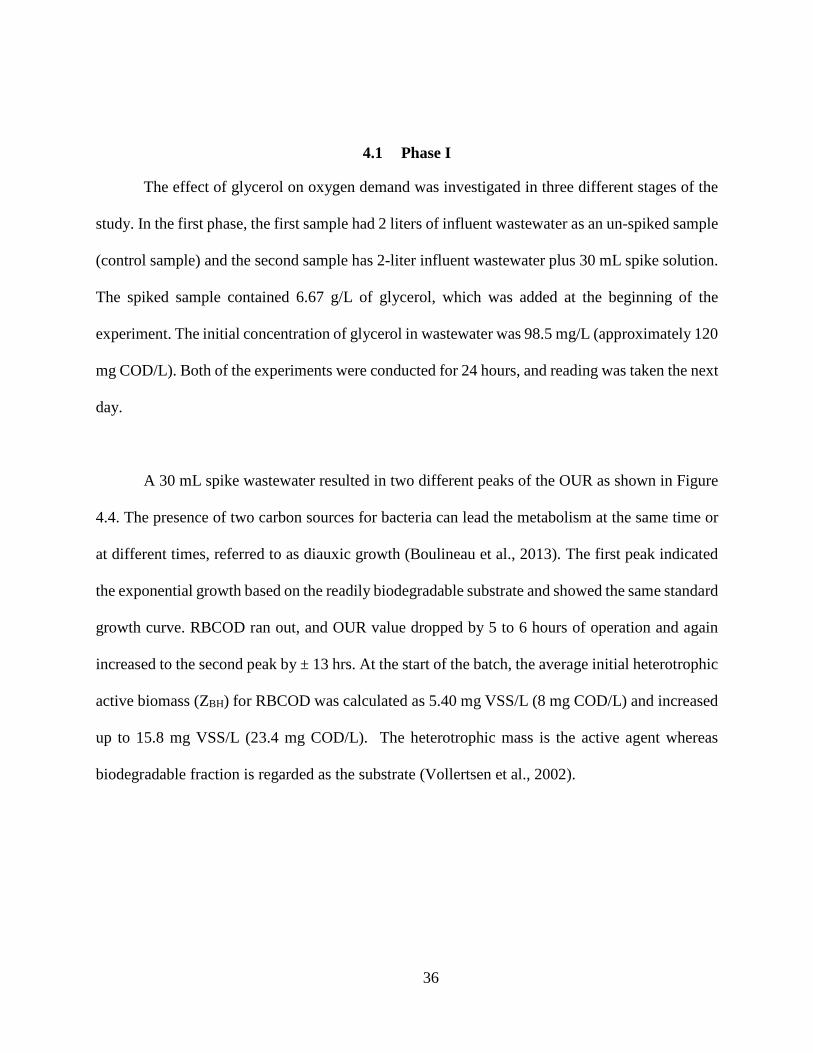
4.1 Phase I
The effect of glycerol on oxygen demand was investigated in three different stages of the
study. In the first phase, the first sample had 2 liters of influent wastewater as an un-spiked sample
(control sample) and the second sample has 2-liter influent wastewater plus 30 mL spike solution.
The spiked sample contained 6.67 g/L of glycerol, which was added at the beginning of the
experiment. The initial concentration of glycerol in wastewater was 98.5 mg/L (approximately 120
mg COD/L). Both of the experiments were conducted for 24 hours, and reading was taken the next
day.
A 30 mL spike wastewater resulted in two different peaks of the OUR as shown in Figure
4.4. The presence of two carbon sources for bacteria can lead the metabolism at the same time or
at different times, referred to as diauxic growth (Boulineau et al., 2013). The first peak indicated
the exponential growth based on the readily biodegradable substrate and showed the same standard
growth curve. RBCOD ran out, and OUR value dropped by 5 to 6 hours of operation and again
increased to the second peak by ± 13 hrs. At the start of the batch, the average initial heterotrophic
active biomass (ZBH) for RBCOD was calculated as 5.40 mg VSS/L (8 mg COD/L) and increased
up to 15.8 mg VSS/L (23.4 mg COD/L). The heterotrophic mass is the active agent whereas
biodegradable fraction is regarded as the substrate (Vollertsen et al., 2002).
37
OUR graph (09/01/2015) OUR graph (09/02/2015) OUR graph (09/24/2015)
OUR graph (09/25/2015) OUR graph (09/28/2015) OUR graph (09/29/2015)
Figure 4.4: Effect of Glycerol on Different RBCOD Spike (30 mL) Samples.
02468
1012141618
0 6 12 18 24
OU
R (m
g/L
.hr)
Time (hrs)
02468
1012141618
0 6 12 18 24
OU
R (m
g/L
.hr)
Time (hrs)
02468
1012141618
0 6 12 18 24
OU
R (m
g/L
.hr)
Time (hrs)
02468
1012141618
0 6 12 18 24
OU
R (m
g/L
.hr)
Time (hrs)
02468
1012141618
0 6 12 18 24
OU
R (m
g/L
.hr)
Time (hrs)
02468
1012141618
0 6 12 18 24
OU
R (m
g/L
.hr)
Time (hrs)
38
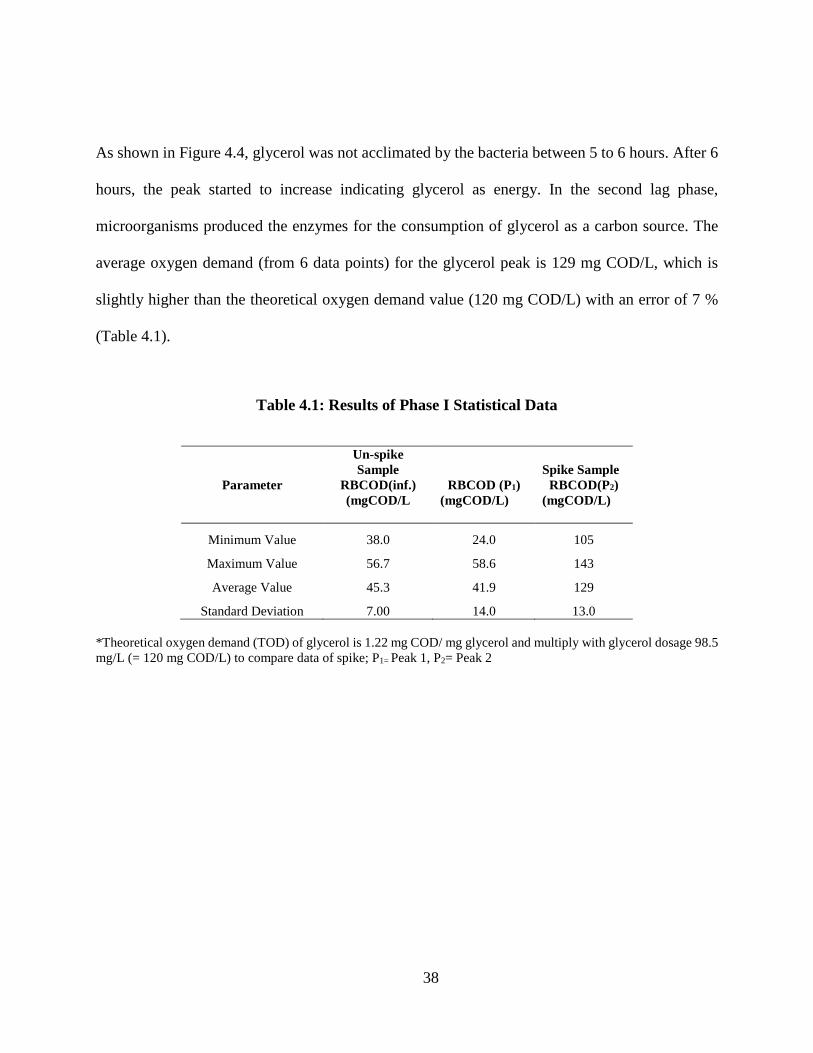
As shown in Figure 4.4, glycerol was not acclimated by the bacteria between 5 to 6 hours. After 6
hours, the peak started to increase indicating glycerol as energy. In the second lag phase,
microorganisms produced the enzymes for the consumption of glycerol as a carbon source. The
average oxygen demand (from 6 data points) for the glycerol peak is 129 mg COD/L, which is
slightly higher than the theoretical oxygen demand value (120 mg COD/L) with an error of 7 %
(Table 4.1).
Table 4.1: Results of Phase I Statistical Data
Un-spike Sample Spike Sample
Parameter RBCOD(inf.) (mgCOD/L
RBCOD (P1) (mgCOD/L)
RBCOD(P2) (mgCOD/L)
Minimum Value 38.0 24.0 105
Maximum Value 56.7 58.6 143
Average Value 45.3 41.9 129
Standard Deviation 7.00 14.0 13.0 *Theoretical oxygen demand (TOD) of glycerol is 1.22 mg COD/ mg glycerol and multiply with glycerol dosage 98.5 mg/L (= 120 mg COD/L) to compare data of spike; P1= Peak 1, P2= Peak 2
39
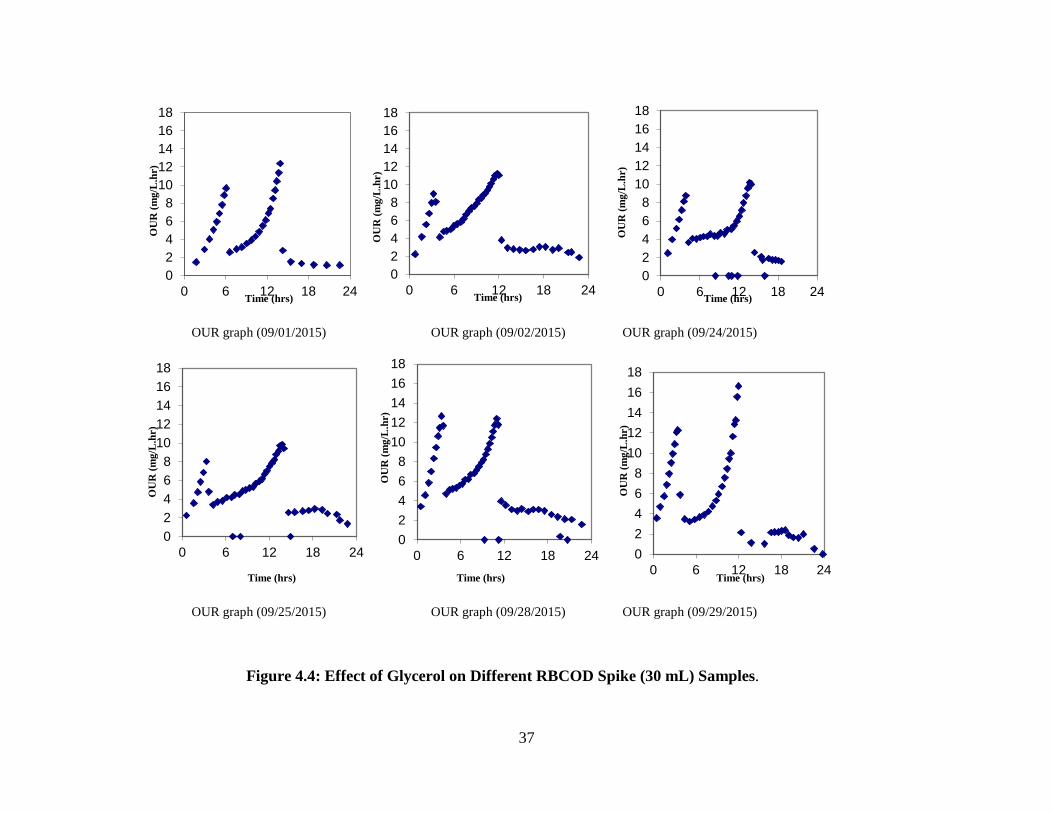
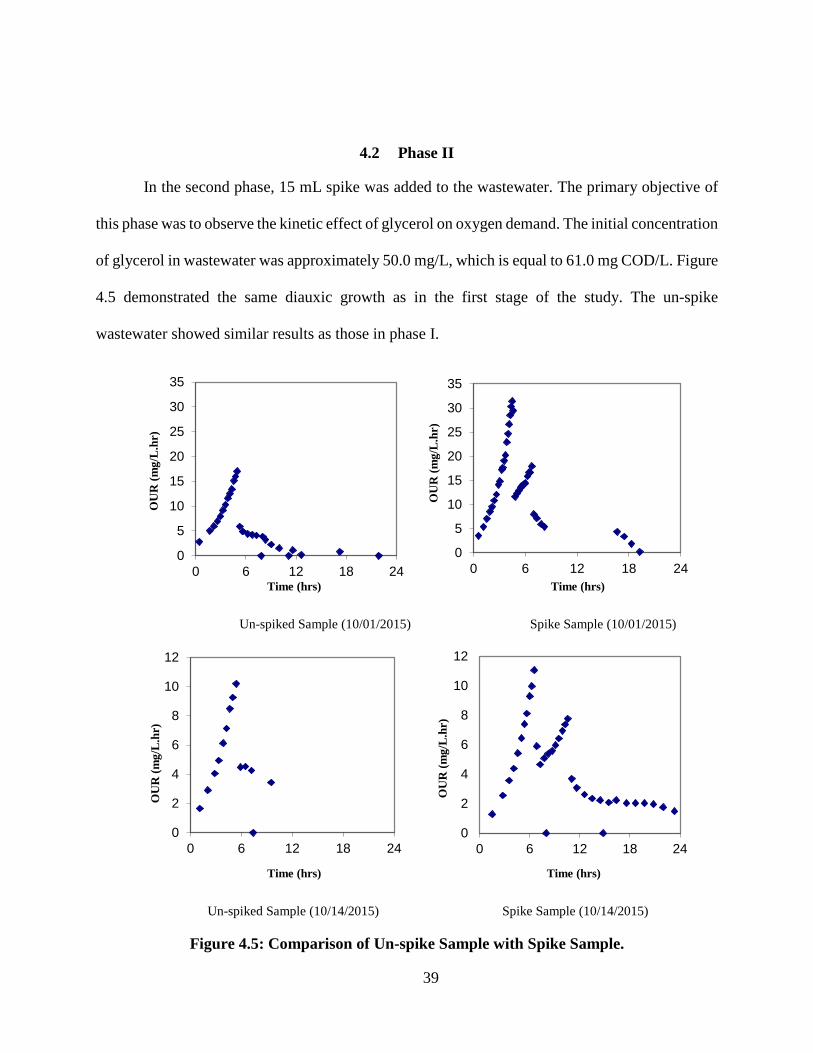
4.2 Phase II
In the second phase, 15 mL spike was added to the wastewater. The primary objective of
this phase was to observe the kinetic effect of glycerol on oxygen demand. The initial concentration
of glycerol in wastewater was approximately 50.0 mg/L, which is equal to 61.0 mg COD/L. Figure
4.5 demonstrated the same diauxic growth as in the first stage of the study. The un-spike
wastewater showed similar results as those in phase I.
Un-spiked Sample (10/01/2015) Spike Sample (10/01/2015)
Un-spiked Sample (10/14/2015) Spike Sample (10/14/2015)
Figure 4.5: Comparison of Un-spike Sample with Spike Sample.
0
5
10
15
20
25
30
35
0 6 12 18 24
OU
R (m
g/L
.hr)
Time (hrs)
0
5
10
15
20
25
30
35
0 6 12 18 24
OU
R (m
g/L
.hr)
Time (hrs)
0
2
4
6
8
10
12
0 6 12 18 24
OU
R (m
g/L
.hr)
Time (hrs)
0
2
4
6
8
10
12
0 6 12 18 24
OU
R (m
g/L
.hr)
Time (hrs)
40
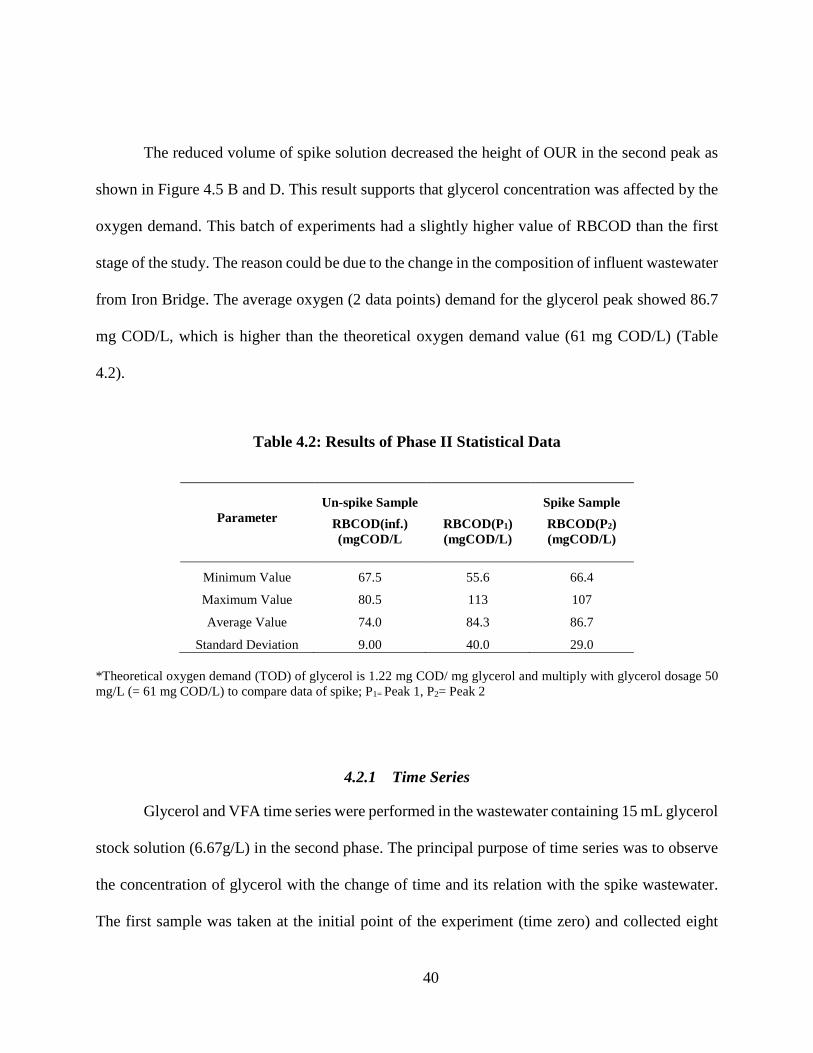
The reduced volume of spike solution decreased the height of OUR in the second peak as
shown in Figure 4.5 B and D. This result supports that glycerol concentration was affected by the
oxygen demand. This batch of experiments had a slightly higher value of RBCOD than the first
stage of the study. The reason could be due to the change in the composition of influent wastewater
from Iron Bridge. The average oxygen (2 data points) demand for the glycerol peak showed 86.7
mg COD/L, which is higher than the theoretical oxygen demand value (61 mg COD/L) (Table
4.2).
Table 4.2: Results of Phase II Statistical Data
Un-spike Sample Spike Sample Parameter
RBCOD(inf.) (mgCOD/L
RBCOD(P1) (mgCOD/L)
RBCOD(P2) (mgCOD/L)
Minimum Value 67.5 55.6 66.4
Maximum Value 80.5 113 107
Average Value 74.0 84.3 86.7
Standard Deviation 9.00 40.0 29.0 *Theoretical oxygen demand (TOD) of glycerol is 1.22 mg COD/ mg glycerol and multiply with glycerol dosage 50 mg/L (= 61 mg COD/L) to compare data of spike; P1= Peak 1, P2= Peak 2
4.2.1 Time Series
Glycerol and VFA time series were performed in the wastewater containing 15 mL glycerol
stock solution (6.67g/L) in the second phase. The principal purpose of time series was to observe
the concentration of glycerol with the change of time and its relation with the spike wastewater.
The first sample was taken at the initial point of the experiment (time zero) and collected eight
41
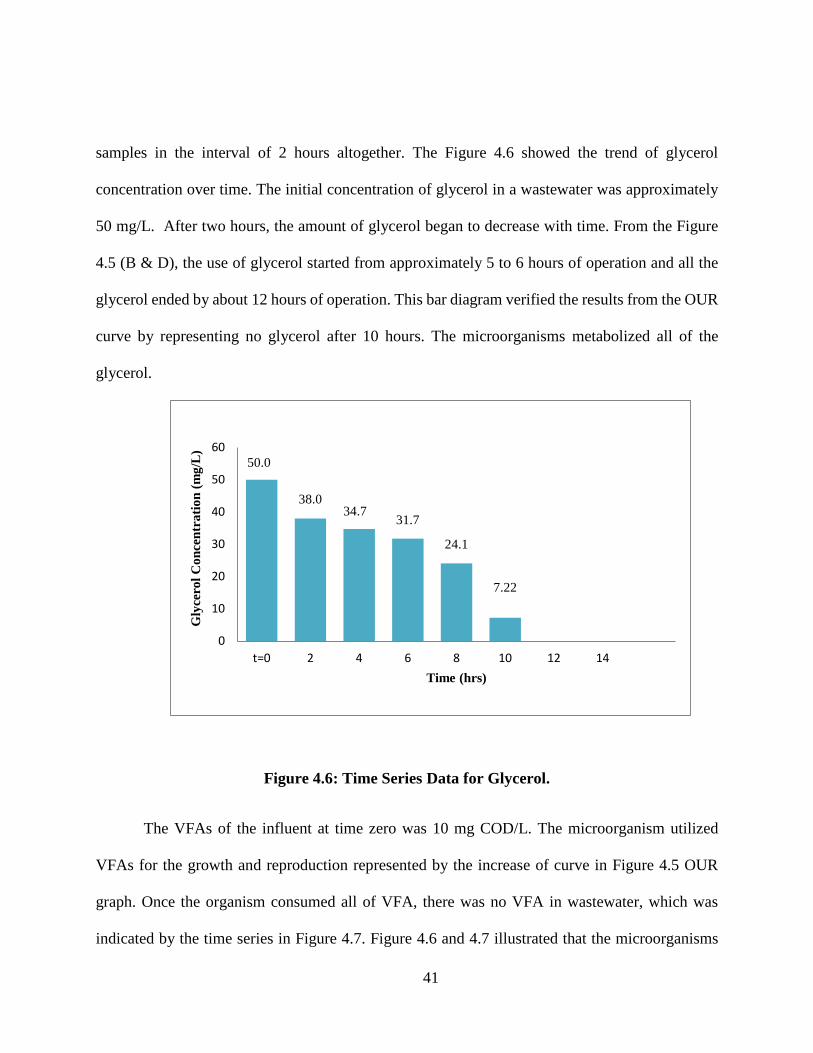
samples in the interval of 2 hours altogether. The Figure 4.6 showed the trend of glycerol
concentration over time. The initial concentration of glycerol in a wastewater was approximately
50 mg/L. After two hours, the amount of glycerol began to decrease with time. From the Figure
4.5 (B & D), the use of glycerol started from approximately 5 to 6 hours of operation and all the
glycerol ended by about 12 hours of operation. This bar diagram verified the results from the OUR
curve by representing no glycerol after 10 hours. The microorganisms metabolized all of the
glycerol.
Figure 4.6: Time Series Data for Glycerol.
The VFAs of the influent at time zero was 10 mg COD/L. The microorganism utilized
VFAs for the growth and reproduction represented by the increase of curve in Figure 4.5 OUR
graph. Once the organism consumed all of VFA, there was no VFA in wastewater, which was
indicated by the time series in Figure 4.7. Figure 4.6 and 4.7 illustrated that the microorganisms
50.0
38.034.7
31.7
24.1
7.22
0
10
20
30
40
50
60
t=0 2 4 6 8 10 12 14
Gly
cero
l Con
cent
ratio
n (m
g/L
)
Time (hrs)
42
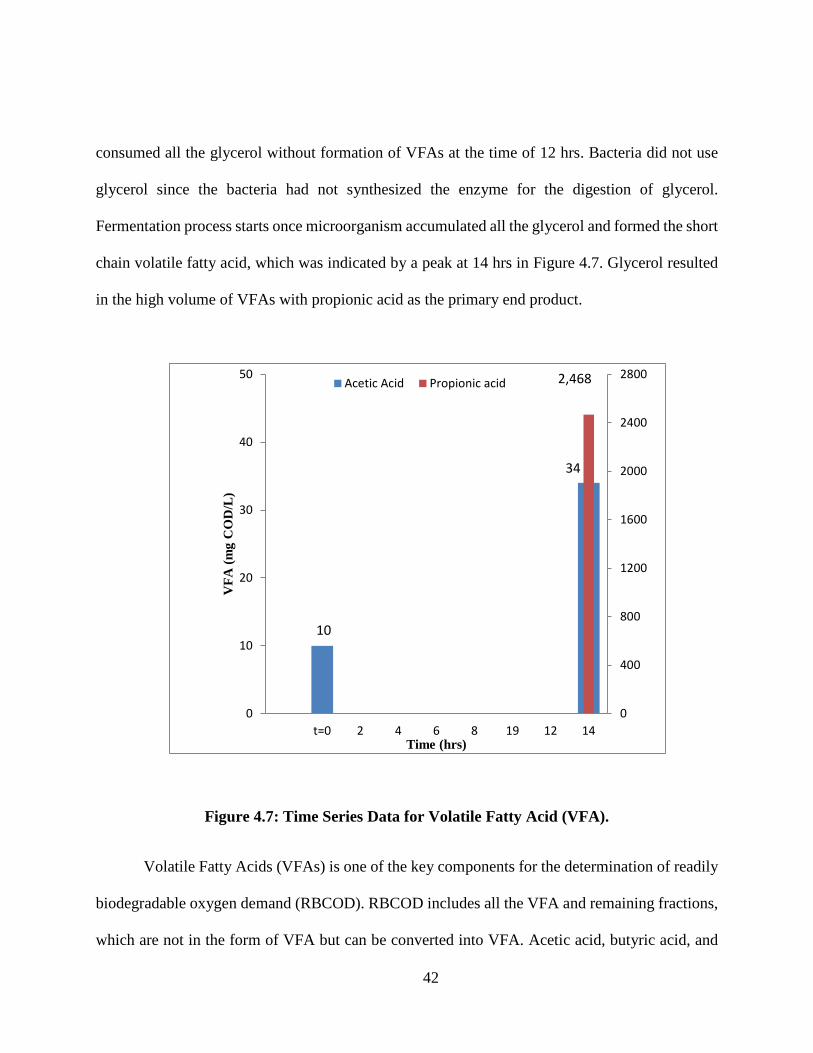
consumed all the glycerol without formation of VFAs at the time of 12 hrs. Bacteria did not use
glycerol since the bacteria had not synthesized the enzyme for the digestion of glycerol.
Fermentation process starts once microorganism accumulated all the glycerol and formed the short
chain volatile fatty acid, which was indicated by a peak at 14 hrs in Figure 4.7. Glycerol resulted
in the high volume of VFAs with propionic acid as the primary end product.
Figure 4.7: Time Series Data for Volatile Fatty Acid (VFA).
Volatile Fatty Acids (VFAs) is one of the key components for the determination of readily
biodegradable oxygen demand (RBCOD). RBCOD includes all the VFA and remaining fractions,
which are not in the form of VFA but can be converted into VFA. Acetic acid, butyric acid, and
0
400
800
1200
1600
2000
2400
2800
0
10
20
30
40
50
t=0 2 4 6 8 19 12 14
VFA
(mg
CO
D/L
)
Time (hrs)
Acetic Acid Propionic acid
10
34
2,468
43
propionic acid are the most common volatile fatty acids in municipal waste. The presence of VFA
in influent waste plays the prominent role in the success of Enhance biological phosphorus removal
(EBPR).
Glycerol is used as a carbon substrate where bacteria can grow and reproduce. Glycerol is
a good carbon source to generate the propionic acid in high quantity with fewer by-products. 50
mg/L glycerol produces 2,468 mg COD/L propionic acid, which represents 98.6 % of total VFAs.
The review of other results illustrated glycerol yields as 0.475 propionic g/g glycerol (Liu et al.,
2011). In another study of 20 g/L glycerol, the major product formed were propionic acid (0.844
mol/mol), succinic acid (0.055 mol/mol), acetic acid (0.023 mol/mol), and formic acid (0.020
mol/mol) at pH 6.8 (Barbirato et al., 1997). This experiment also suggested the use of glycerol in
wastewater by producing abundant VFAs.
44
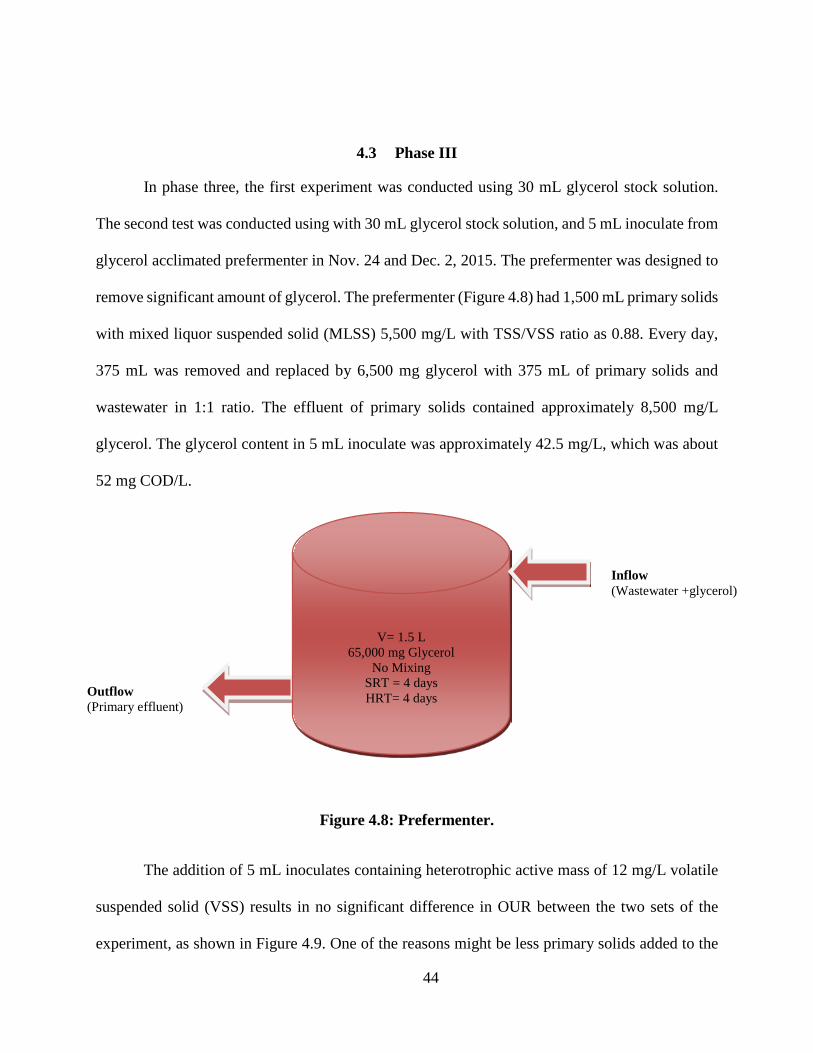
4.3 Phase III
In phase three, the first experiment was conducted using 30 mL glycerol stock solution.
The second test was conducted using with 30 mL glycerol stock solution, and 5 mL inoculate from
glycerol acclimated prefermenter in Nov. 24 and Dec. 2, 2015. The prefermenter was designed to
remove significant amount of glycerol. The prefermenter (Figure 4.8) had 1,500 mL primary solids
with mixed liquor suspended solid (MLSS) 5,500 mg/L with TSS/VSS ratio as 0.88. Every day,
375 mL was removed and replaced by 6,500 mg glycerol with 375 mL of primary solids and
wastewater in 1:1 ratio. The effluent of primary solids contained approximately 8,500 mg/L
glycerol. The glycerol content in 5 mL inoculate was approximately 42.5 mg/L, which was about
52 mg COD/L.
Figure 4.8: Prefermenter.
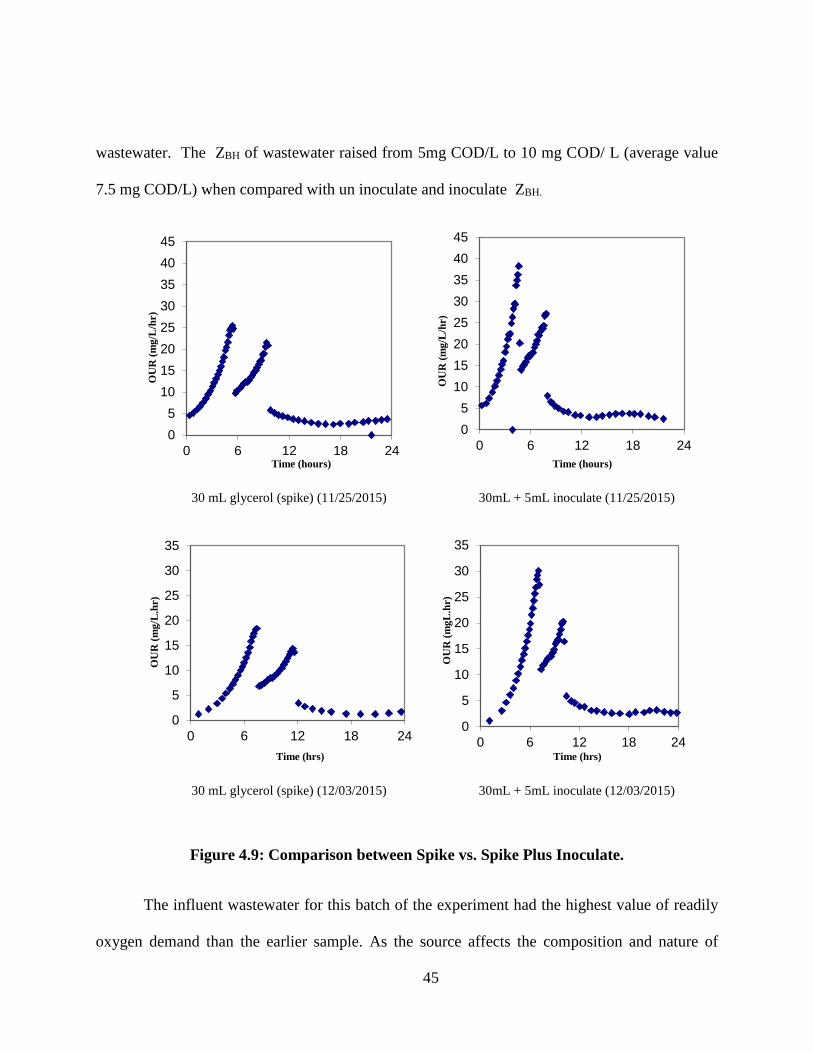
The addition of 5 mL inoculates containing heterotrophic active mass of 12 mg/L volatile
suspended solid (VSS) results in no significant difference in OUR between the two sets of the
experiment, as shown in Figure 4.9. One of the reasons might be less primary solids added to the
Inflow (Wastewater +glycerol)
Outflow (Primary effluent)
V= 1.5 L 65,000 mg Glycerol
No Mixing SRT = 4 days HRT= 4 days
45
wastewater. The ZBH of wastewater raised from 5mg COD/L to 10 mg COD/ L (average value
7.5 mg COD/L) when compared with un inoculate and inoculate ZBH.
30 mL glycerol (spike) (11/25/2015) 30mL + 5mL inoculate (11/25/2015)
30 mL glycerol (spike) (12/03/2015) 30mL + 5mL inoculate (12/03/2015)
Figure 4.9: Comparison between Spike vs. Spike Plus Inoculate.
The influent wastewater for this batch of the experiment had the highest value of readily
oxygen demand than the earlier sample. As the source affects the composition and nature of
05
1015202530354045
0 6 12 18 24
OU
R (m
g/L
/hr)
Time (hours)
05
1015202530354045
0 6 12 18 24O
UR
(mg/
L/h
r)
Time (hours)
0
5
10
15
20
25
30
35
0 6 12 18 24
OU
R (m
g/L
.hr)
Time (hrs)
0
5
10
15
20
25
30
35
0 6 12 18 24
OU
R (m
gL.h
r)
Time (hrs)
46
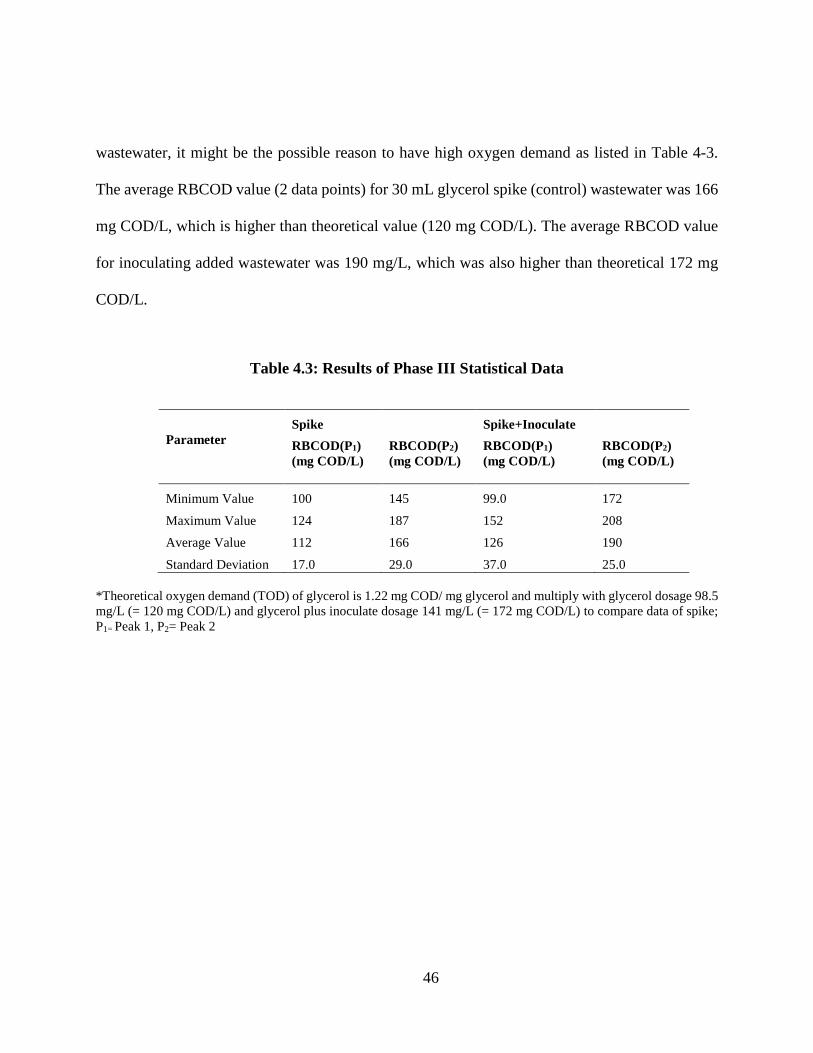
wastewater, it might be the possible reason to have high oxygen demand as listed in Table 4-3.
The average RBCOD value (2 data points) for 30 mL glycerol spike (control) wastewater was 166
mg COD/L, which is higher than theoretical value (120 mg COD/L). The average RBCOD value
for inoculating added wastewater was 190 mg/L, which was also higher than theoretical 172 mg
COD/L.
Table 4.3: Results of Phase III Statistical Data
Spike Spike+Inoculate Parameter
RBCOD(P1) (mg COD/L)
RBCOD(P2) (mg COD/L)
RBCOD(P1) (mg COD/L)
RBCOD(P2) (mg COD/L)
Minimum Value 100 145 99.0 172
Maximum Value 124 187 152 208
Average Value 112 166 126 190
Standard Deviation 17.0 29.0 37.0 25.0
*Theoretical oxygen demand (TOD) of glycerol is 1.22 mg COD/ mg glycerol and multiply with glycerol dosage 98.5 mg/L (= 120 mg COD/L) and glycerol plus inoculate dosage 141 mg/L (= 172 mg COD/L) to compare data of spike; P1= Peak 1, P2= Peak 2
47
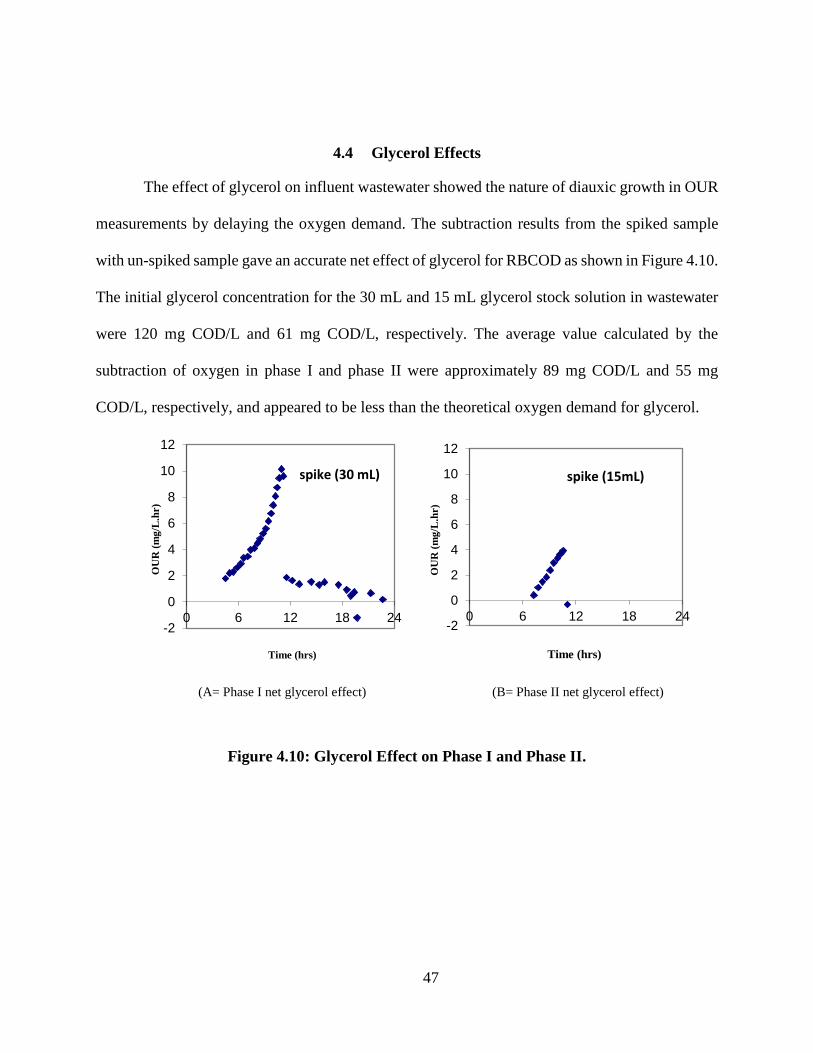
4.4 Glycerol Effects
The effect of glycerol on influent wastewater showed the nature of diauxic growth in OUR
measurements by delaying the oxygen demand. The subtraction results from the spiked sample
with un-spiked sample gave an accurate net effect of glycerol for RBCOD as shown in Figure 4.10.
The initial glycerol concentration for the 30 mL and 15 mL glycerol stock solution in wastewater
were 120 mg COD/L and 61 mg COD/L, respectively. The average value calculated by the
subtraction of oxygen in phase I and phase II were approximately 89 mg COD/L and 55 mg
COD/L, respectively, and appeared to be less than the theoretical oxygen demand for glycerol.
(A= Phase I net glycerol effect) (B= Phase II net glycerol effect)
Figure 4.10: Glycerol Effect on Phase I and Phase II.
-2
0
2
4
6
8
10
12
0 6 12 18 24
OU
R (m
g/L
.hr)
Time (hrs)
spike (30 mL)
-2
0
2
4
6
8
10
12
0 6 12 18 24
OU
R (m
g/L
.hr)
Time (hrs)
spike (15mL)
48
The first phase study showed an increase in the average value of RBCOD from
approximately 45 mg COD/L to 89 mg COD/L, which represented about the 97.8 % increment. In
the second phase, the average value of RBCOD increased by 17.16 %from 74 mg COD/L to 86.7
mg COD/L. This verified the use of glycerol to produce abundant volatile fatty acids. Another
important output was the shift in oxygen demand due to the change in spike volume.
The limited availability of RBCOD hinders a complete removal of nutrients (phosphorus
and nitrogen) in wastewater treatment plants (Yuan et al., 2011). The wastewater that has low
RBCOD is operated in different COD/P conditions as 25:1, 15:1, and 10:1. In dairy processing
wastewater, propionate as a carbon source has high phosphorus removal with COD: P as 13:1 over
acetate (Broughton et al., 2007). When sodium acetate is used as a carbon source to determine the
RBCOD by single our method, oxygen consumption represents 17 % of COD. When the substrate
was increased from the 10 g COD to 18 g COD, the dissolved oxygen increased from the 99.5 to
99.9 % (Ziglio et al., 2001). Methanol is also a carbon source for the increment of the VFAs.
However, competition for substrate between the acetogens and methanogens affects the VFA
production rate (Taya et al., 2012).
In the influent waste, readily biodegradable substrate is converted into volatile fatty acid
by the ordinary heterotrophic organism (OHO) via fermentation process and used by
polyphosphate accumulating organisms (PAO) (Wentzel et al., 1985). The presence of VFAs is
essential for high removal of phosphorus in wastewater (Randall et al., 1997). The common VFAs
found in wastewater are acetic acid and propionic acid. Glycerol is a trihydric alcohol and can be
49
used as a carbon source to increase the carbon content in wastewater. It can form enormous amount
of propionic acid, which contributes to amplify VFA (Barbirato et al., 1997; Yuan et al., 2010).
Nowadays, glycerol end product is considered as a suitable substrate for enhanced biological
phosphorus removal (Ohemen et al., 2006; Guerrero et al., 2012; Jeon et al., 2000) with
nitrification and denitrification (Melidis et al., 2009; Uprety et al., 2013).
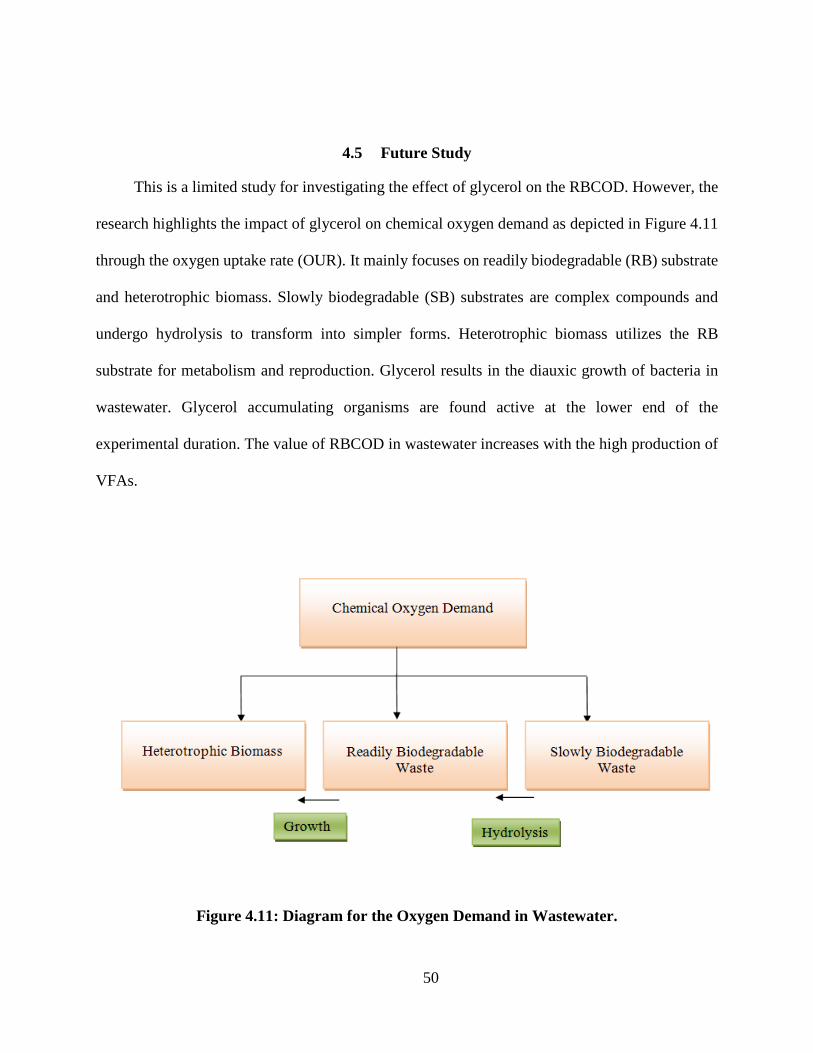
50
4.5 Future Study
This is a limited study for investigating the effect of glycerol on the RBCOD. However, the
research highlights the impact of glycerol on chemical oxygen demand as depicted in Figure 4.11
through the oxygen uptake rate (OUR). It mainly focuses on readily biodegradable (RB) substrate
and heterotrophic biomass. Slowly biodegradable (SB) substrates are complex compounds and
undergo hydrolysis to transform into simpler forms. Heterotrophic biomass utilizes the RB
substrate for metabolism and reproduction. Glycerol results in the diauxic growth of bacteria in
wastewater. Glycerol accumulating organisms are found active at the lower end of the
experimental duration. The value of RBCOD in wastewater increases with the high production of
VFAs.
Figure 4.11: Diagram for the Oxygen Demand in Wastewater.
51
However, due to resource and time constraint, the study is limited to examine the short-
term effect of glycerol addition to RBCOD. For future study:
• RBCOD increase from glycerol can be explored to study the effect on effluent nitrogen
and phosphorus
• Study other carbon sources like acetic acid, propionic acid, methanol or crude glycerol for
RBCOD
• Glycerol can be one of the alternative carbon sources for the low or medium organic
content wastewater treatment plant (WWTP).
52
CHAPTER 5: CONCLUSIONS
The conclusions that can be drawn from the research are:
• Wastewater from Iron Bridge had the low content of RBCOD with 0 mg COD/L to 10 mg
COD/L VFA
• Oxygen demand increased by the addition of glycerol due to the diauxic nature of growth
• RBCOD consisted of 12-28 % of TCOD
• Glycerol (50 mg/L) could produce a significant amount of propionic acid (2,502 mg
COD/L) which is one of the main components of VFAs.
53
APPENDIX A: OXYGEN SOLUBILITY
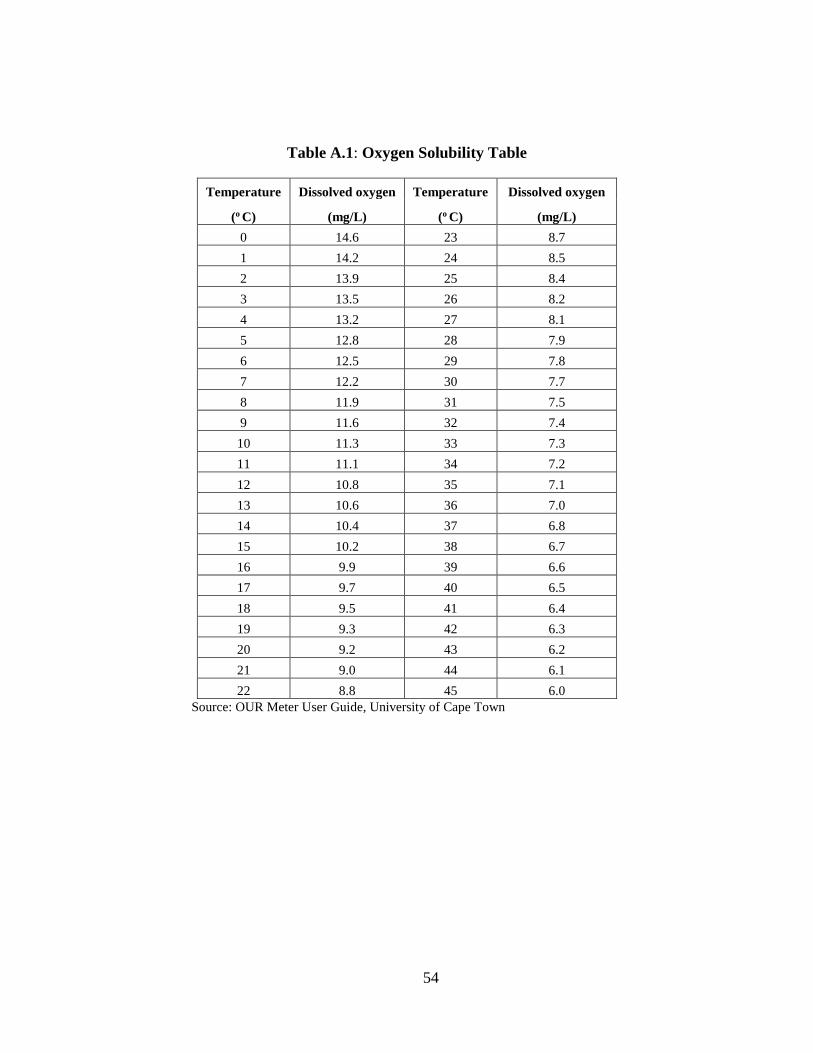
54
Table A.1: Oxygen Solubility Table
Temperature Dissolved oxygen Temperature Dissolved oxygen
(o C) (mg/L) (o C) (mg/L) 0 14.6 23 8.7 1 14.2 24 8.5 2 13.9 25 8.4 3 13.5 26 8.2 4 13.2 27 8.1 5 12.8 28 7.9 6 12.5 29 7.8 7 12.2 30 7.7 8 11.9 31 7.5 9 11.6 32 7.4 10 11.3 33 7.3 11 11.1 34 7.2 12 10.8 35 7.1 13 10.6 36 7.0 14 10.4 37 6.8 15 10.2 38 6.7 16 9.9 39 6.6 17 9.7 40 6.5 18 9.5 41 6.4 19 9.3 42 6.3 20 9.2 43 6.2 21 9.0 44 6.1 22 8.8 45 6.0
Source: OUR Meter User Guide, University of Cape Town

55
APPENDIX B: FORUMULAS
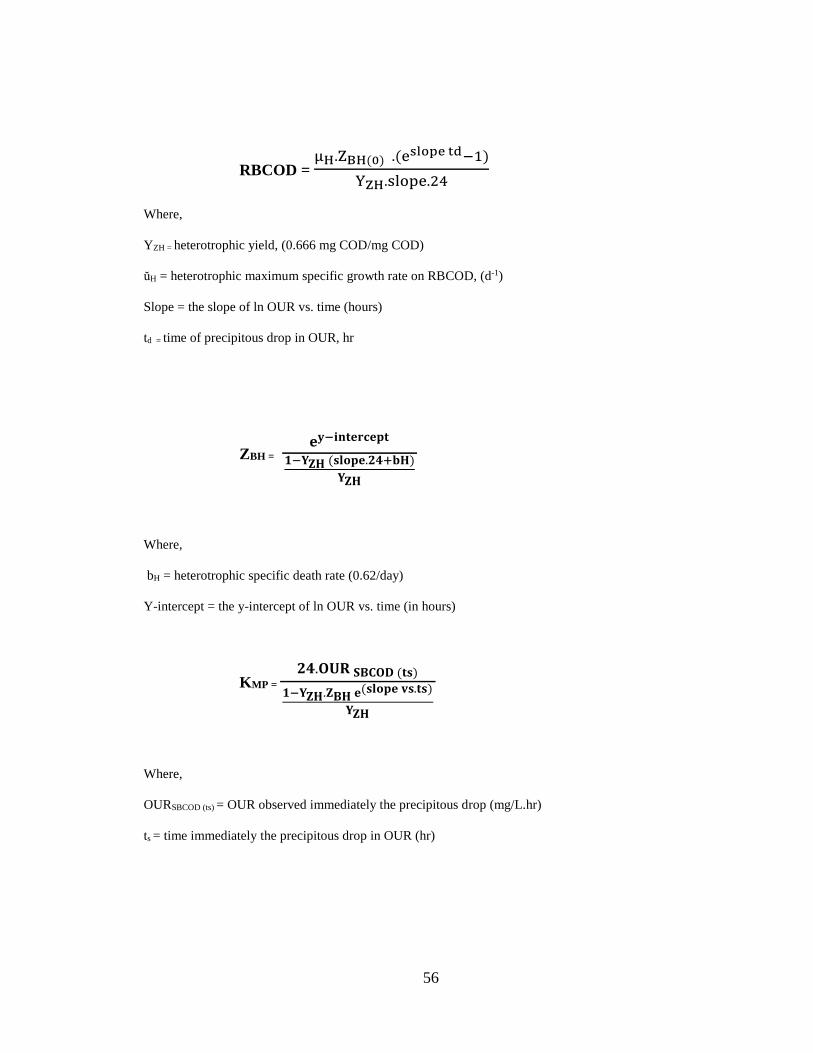
56
RBCOD = µH.ZBH(0) .(eslope td−1)
YZH.slope.24
Where,
YZH = heterotrophic yield, (0.666 mg COD/mg COD)
ŭH = heterotrophic maximum specific growth rate on RBCOD, (d-1)
Slope = the slope of ln OUR vs. time (hours)
td = time of precipitous drop in OUR, hr
ZBH = 𝐞𝐞𝐲𝐲−𝐢𝐢𝐢𝐢𝐢𝐢𝐞𝐞𝐢𝐢𝐢𝐢𝐞𝐞𝐢𝐢𝐢𝐢
𝟏𝟏−𝐘𝐘𝐙𝐙𝐙𝐙 (𝐬𝐬𝐬𝐬𝐬𝐬𝐢𝐢𝐞𝐞.𝟐𝟐𝟐𝟐+𝐛𝐛𝐙𝐙)𝐘𝐘𝐙𝐙𝐙𝐙
Where,
bH = heterotrophic specific death rate (0.62/day)
Y-intercept = the y-intercept of ln OUR vs. time (in hours)
KMP = 𝟐𝟐𝟐𝟐.𝐎𝐎𝐎𝐎𝐎𝐎 𝐒𝐒𝐒𝐒𝐒𝐒𝐎𝐎𝐒𝐒 (𝐢𝐢𝐬𝐬)
𝟏𝟏−𝐘𝐘𝐙𝐙𝐙𝐙.𝐙𝐙𝐒𝐒𝐙𝐙 𝐞𝐞(𝐬𝐬𝐬𝐬𝐬𝐬𝐢𝐢𝐞𝐞 𝐯𝐯𝐬𝐬.𝐢𝐢𝐬𝐬)
𝐘𝐘𝐙𝐙𝐙𝐙
Where,
OURSBCOD (ts) = OUR observed immediately the precipitous drop (mg/L.hr)
ts = time immediately the precipitous drop in OUR (hr)
57
APPENDIX C: QUALITY ASSURANCE AND QUALITY CONTROL
(QA & QC)
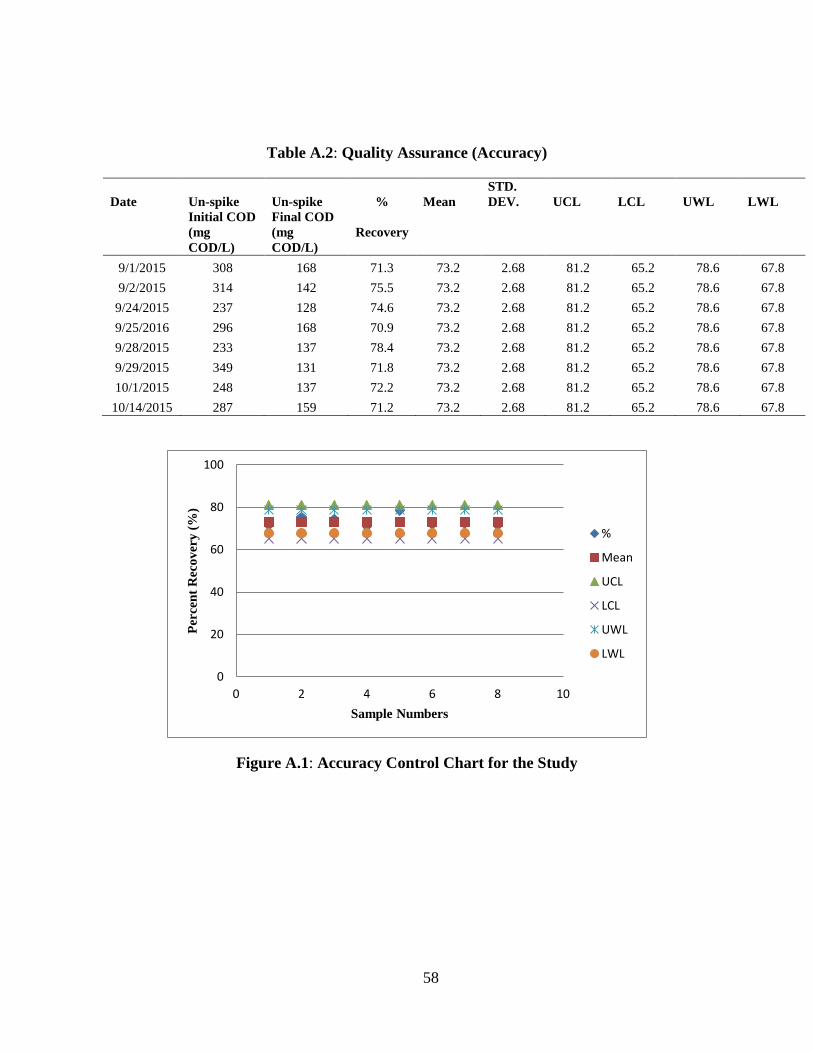
58
Table A.2: Quality Assurance (Accuracy)
Date Un-spike Un-spike % Mean STD. DEV. UCL LCL UWL LWL
Initial COD (mg COD/L)
Final COD (mg COD/L)
Recovery
9/1/2015 308 168 71.3 73.2 2.68 81.2 65.2 78.6 67.8 9/2/2015 314 142 75.5 73.2 2.68 81.2 65.2 78.6 67.8
9/24/2015 237 128 74.6 73.2 2.68 81.2 65.2 78.6 67.8 9/25/2016 296 168 70.9 73.2 2.68 81.2 65.2 78.6 67.8 9/28/2015 233 137 78.4 73.2 2.68 81.2 65.2 78.6 67.8 9/29/2015 349 131 71.8 73.2 2.68 81.2 65.2 78.6 67.8 10/1/2015 248 137 72.2 73.2 2.68 81.2 65.2 78.6 67.8
10/14/2015 287 159 71.2 73.2 2.68 81.2 65.2 78.6 67.8
Figure A.1: Accuracy Control Chart for the Study
0
20
40
60
80
100
0 2 4 6 8 10
Perc
ent R
ecov
ery
(%)
Sample Numbers
%
Mean
UCL
LCL
UWL
LWL
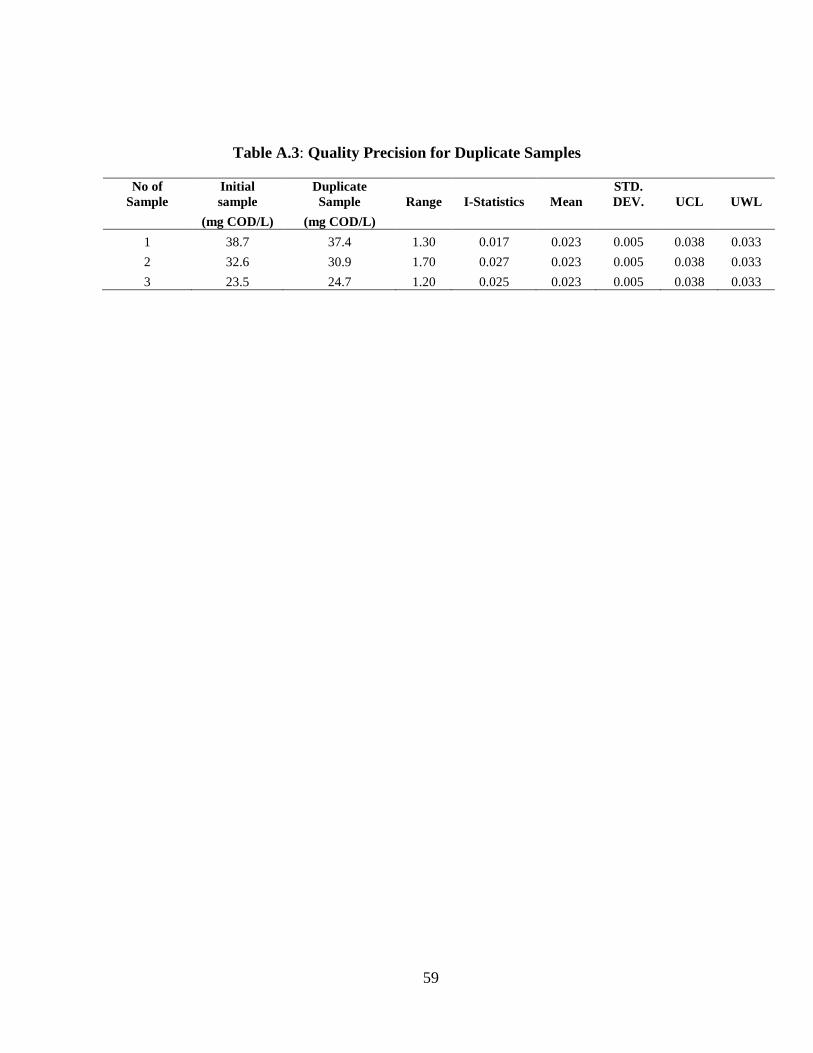
59
Table A.3: Quality Precision for Duplicate Samples
No of Sample
Initial sample
Duplicate Sample Range I-Statistics Mean
STD. DEV. UCL UWL
(mg COD/L) (mg COD/L) 1 38.7 37.4 1.30 0.017 0.023 0.005 0.038 0.033 2 32.6 30.9 1.70 0.027 0.023 0.005 0.038 0.033 3 23.5 24.7 1.20 0.025 0.023 0.005 0.038 0.033

60
APPENDIX D: UN-SPIKED RAW DATA

61
Table A.4: Un-spiked Raw Data on 09/01/2015
Cycle CTime OxOffT STime ETime Slope CC SNum Temp number (mins) (mins) (secs) (secs) (mg/L.hr) (oC)
1 137.2 0.7300 6456 9918 1.570 -0.9900 3462 20.40 2 201.0 167.9 1135 2842 3.160 -1.000 1707 21.90 3 239.1 217.2 730.0 1893 4.640 -1.000 1163 22.70 4 267.2 250.8 530.0 1435 5.980 -1.000 905.0 23.30 5 290.1 276.8 424.0 1167 7.260 -1.000 743.0 23.70 6 309.6 298.4 359.0 991.0 8.530 -1.000 632.0 24.00 7 326.9 317.0 310.0 870.0 9.630 -1.000 560.0 24.30 8 433.9 403.8 768.0 2833 2.580 -1.000 2065 25.40 9 484.9 453.4 848.0 2934 2.580 -1.000 2086 25.70
10 530.7 504.8 0.0000 3109 2.570 -0.9900 3109 25.80 11 593.3 559.2 861.0 3223 2.280 -0.9900 2362 25.90 12 792.6 743.8 1101 4760 1.470 -0.9900 3659 26.50 13 881.4 826.3 1165 5450 1.250 -0.9700 4285 26.60 14 980.8 921.4 1212 5921 1.120 -0.9500 4709 26.60 15 1078 1025 1102 5314 1.280 -0.9700 4212 26.70 16 1174 1123 1015 5126 1.300 -0.9800 4111 26.90 17 1263 1212 1099 4974 1.380 -0.9800 3875 27.10
*Note: CTime= Current Time, OxoffT= Air off Time, STime= Start Time, CC= correlation coefficient, SNum= No. of Samples, Temp= Temperature (oC)
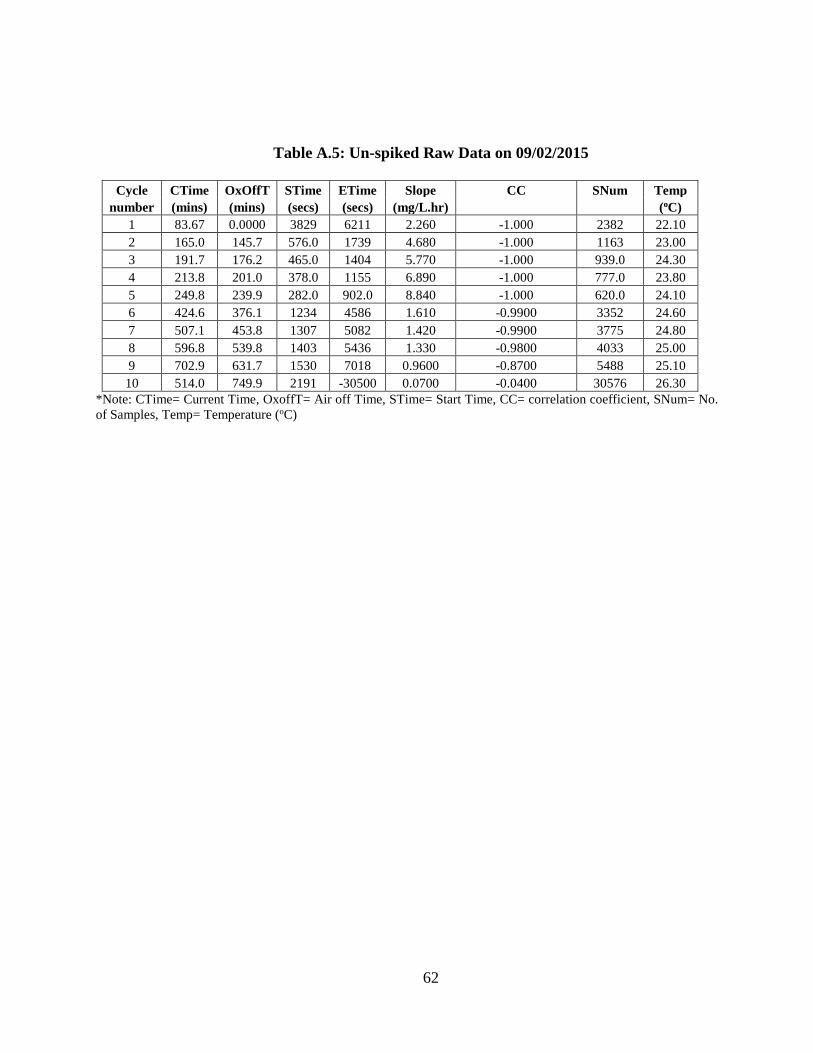
62
Table A.5: Un-spiked Raw Data on 09/02/2015
Cycle CTime OxOffT STime ETime Slope CC SNum Temp number (mins) (mins) (secs) (secs) (mg/L.hr) (oC)
1 83.67 0.0000 3829 6211 2.260 -1.000 2382 22.10 2 165.0 145.7 576.0 1739 4.680 -1.000 1163 23.00 3 191.7 176.2 465.0 1404 5.770 -1.000 939.0 24.30 4 213.8 201.0 378.0 1155 6.890 -1.000 777.0 23.80 5 249.8 239.9 282.0 902.0 8.840 -1.000 620.0 24.10 6 424.6 376.1 1234 4586 1.610 -0.9900 3352 24.60 7 507.1 453.8 1307 5082 1.420 -0.9900 3775 24.80 8 596.8 539.8 1403 5436 1.330 -0.9800 4033 25.00 9 702.9 631.7 1530 7018 0.9600 -0.8700 5488 25.10 10 514.0 749.9 2191 -30500 0.0700 -0.0400 30576 26.30
*Note: CTime= Current Time, OxoffT= Air off Time, STime= Start Time, CC= correlation coefficient, SNum= No. of Samples, Temp= Temperature (oC)
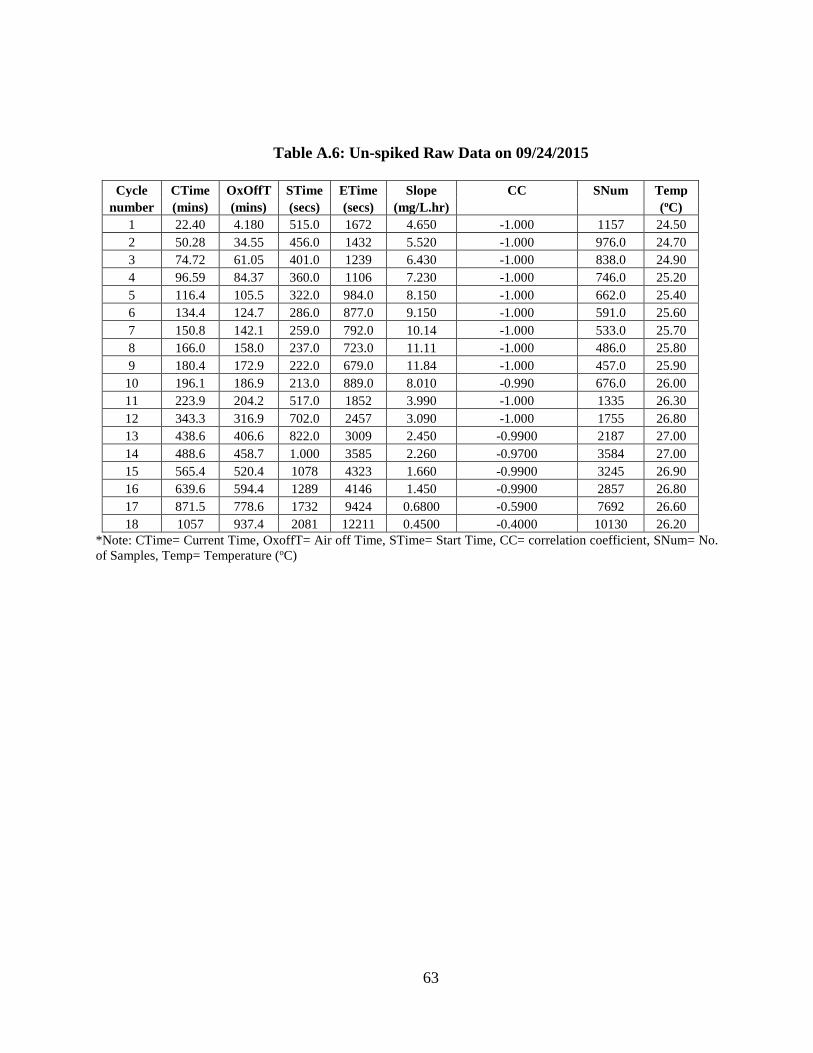
63
Table A.6: Un-spiked Raw Data on 09/24/2015
Cycle CTime OxOffT STime ETime Slope CC SNum Temp number (mins) (mins) (secs) (secs) (mg/L.hr) (oC)
1 22.40 4.180 515.0 1672 4.650 -1.000 1157 24.50 2 50.28 34.55 456.0 1432 5.520 -1.000 976.0 24.70 3 74.72 61.05 401.0 1239 6.430 -1.000 838.0 24.90 4 96.59 84.37 360.0 1106 7.230 -1.000 746.0 25.20 5 116.4 105.5 322.0 984.0 8.150 -1.000 662.0 25.40 6 134.4 124.7 286.0 877.0 9.150 -1.000 591.0 25.60 7 150.8 142.1 259.0 792.0 10.14 -1.000 533.0 25.70 8 166.0 158.0 237.0 723.0 11.11 -1.000 486.0 25.80 9 180.4 172.9 222.0 679.0 11.84 -1.000 457.0 25.90
10 196.1 186.9 213.0 889.0 8.010 -0.990 676.0 26.00 11 223.9 204.2 517.0 1852 3.990 -1.000 1335 26.30 12 343.3 316.9 702.0 2457 3.090 -1.000 1755 26.80 13 438.6 406.6 822.0 3009 2.450 -0.9900 2187 27.00 14 488.6 458.7 1.000 3585 2.260 -0.9700 3584 27.00 15 565.4 520.4 1078 4323 1.660 -0.9900 3245 26.90 16 639.6 594.4 1289 4146 1.450 -0.9900 2857 26.80 17 871.5 778.6 1732 9424 0.6800 -0.5900 7692 26.60 18 1057 937.4 2081 12211 0.4500 -0.4000 10130 26.20
*Note: CTime= Current Time, OxoffT= Air off Time, STime= Start Time, CC= correlation coefficient, SNum= No. of Samples, Temp= Temperature (oC)
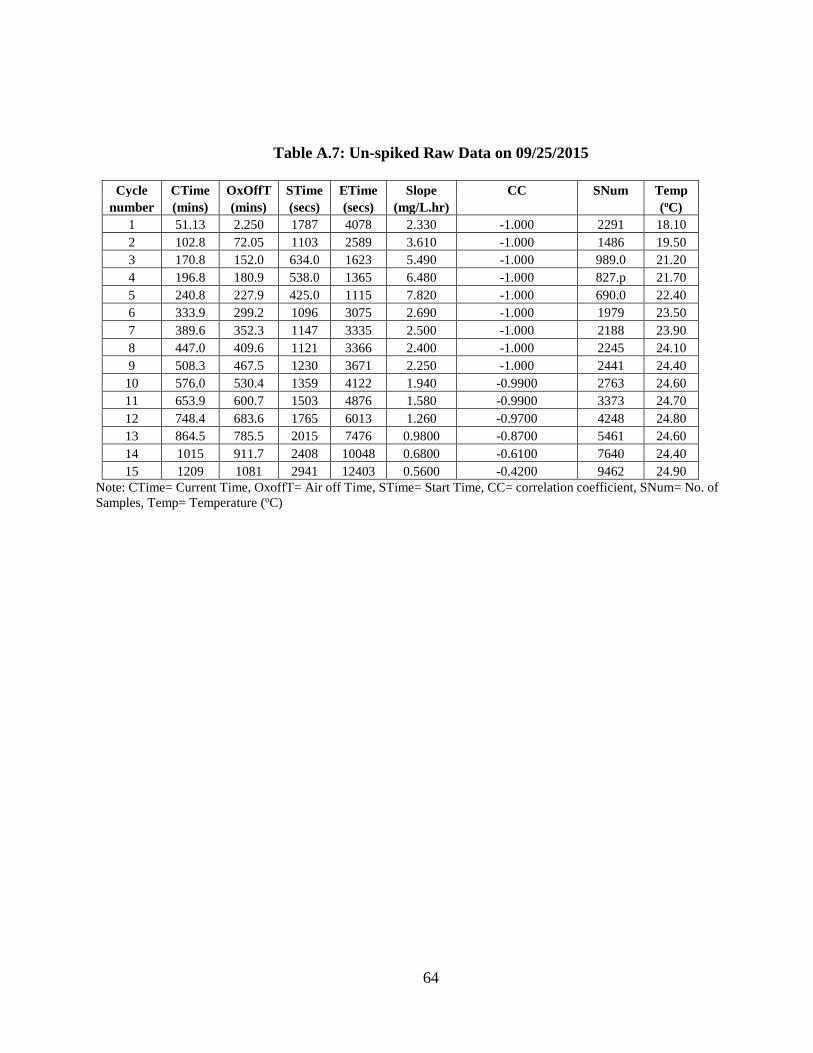
64
Table A.7: Un-spiked Raw Data on 09/25/2015
Cycle CTime OxOffT STime ETime Slope CC SNum Temp number (mins) (mins) (secs) (secs) (mg/L.hr) (oC)
1 51.13 2.250 1787 4078 2.330 -1.000 2291 18.10 2 102.8 72.05 1103 2589 3.610 -1.000 1486 19.50 3 170.8 152.0 634.0 1623 5.490 -1.000 989.0 21.20 4 196.8 180.9 538.0 1365 6.480 -1.000 827.p 21.70 5 240.8 227.9 425.0 1115 7.820 -1.000 690.0 22.40 6 333.9 299.2 1096 3075 2.690 -1.000 1979 23.50 7 389.6 352.3 1147 3335 2.500 -1.000 2188 23.90 8 447.0 409.6 1121 3366 2.400 -1.000 2245 24.10 9 508.3 467.5 1230 3671 2.250 -1.000 2441 24.40
10 576.0 530.4 1359 4122 1.940 -0.9900 2763 24.60 11 653.9 600.7 1503 4876 1.580 -0.9900 3373 24.70 12 748.4 683.6 1765 6013 1.260 -0.9700 4248 24.80 13 864.5 785.5 2015 7476 0.9800 -0.8700 5461 24.60 14 1015 911.7 2408 10048 0.6800 -0.6100 7640 24.40 15 1209 1081 2941 12403 0.5600 -0.4200 9462 24.90
Note: CTime= Current Time, OxoffT= Air off Time, STime= Start Time, CC= correlation coefficient, SNum= No. of Samples, Temp= Temperature (oC)
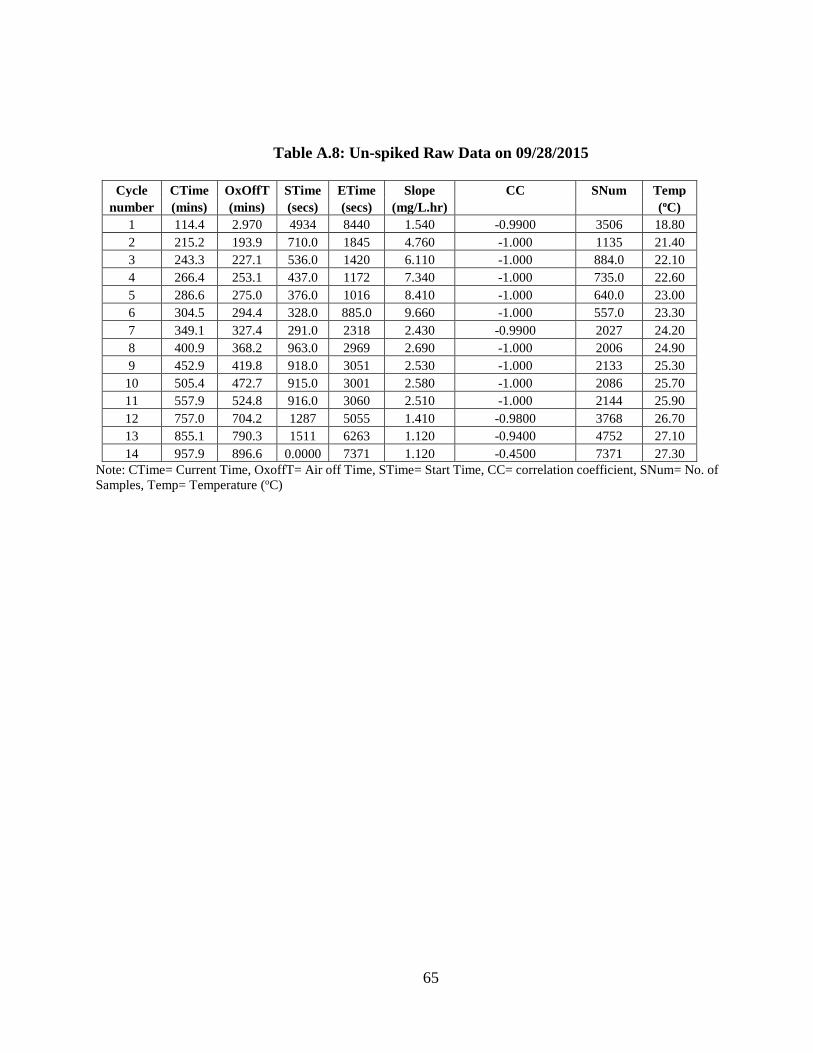
65
Table A.8: Un-spiked Raw Data on 09/28/2015
Cycle CTime OxOffT STime ETime Slope CC SNum Temp number (mins) (mins) (secs) (secs) (mg/L.hr) (oC)
1 114.4 2.970 4934 8440 1.540 -0.9900 3506 18.80 2 215.2 193.9 710.0 1845 4.760 -1.000 1135 21.40 3 243.3 227.1 536.0 1420 6.110 -1.000 884.0 22.10 4 266.4 253.1 437.0 1172 7.340 -1.000 735.0 22.60 5 286.6 275.0 376.0 1016 8.410 -1.000 640.0 23.00 6 304.5 294.4 328.0 885.0 9.660 -1.000 557.0 23.30 7 349.1 327.4 291.0 2318 2.430 -0.9900 2027 24.20 8 400.9 368.2 963.0 2969 2.690 -1.000 2006 24.90 9 452.9 419.8 918.0 3051 2.530 -1.000 2133 25.30
10 505.4 472.7 915.0 3001 2.580 -1.000 2086 25.70 11 557.9 524.8 916.0 3060 2.510 -1.000 2144 25.90 12 757.0 704.2 1287 5055 1.410 -0.9800 3768 26.70 13 855.1 790.3 1511 6263 1.120 -0.9400 4752 27.10 14 957.9 896.6 0.0000 7371 1.120 -0.4500 7371 27.30
Note: CTime= Current Time, OxoffT= Air off Time, STime= Start Time, CC= correlation coefficient, SNum= No. of Samples, Temp= Temperature (oC)
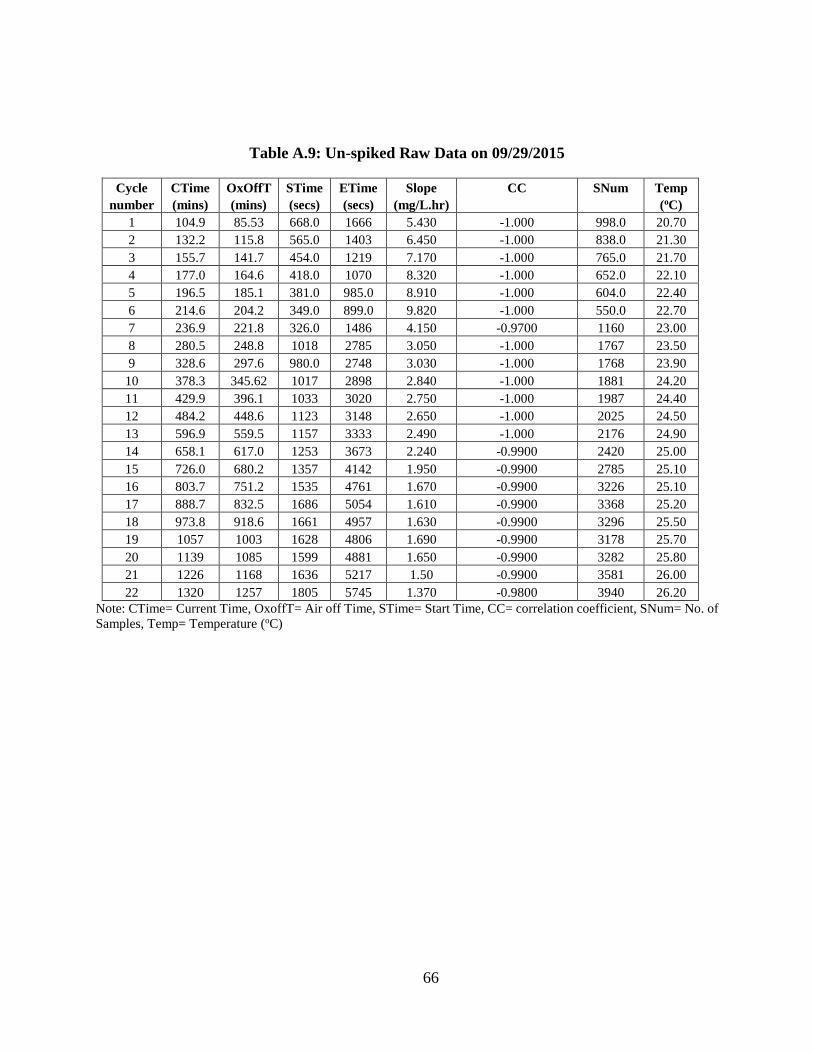
66
Table A.9: Un-spiked Raw Data on 09/29/2015
Cycle CTime OxOffT STime ETime Slope CC SNum Temp number (mins) (mins) (secs) (secs) (mg/L.hr) (oC)
1 104.9 85.53 668.0 1666 5.430 -1.000 998.0 20.70 2 132.2 115.8 565.0 1403 6.450 -1.000 838.0 21.30 3 155.7 141.7 454.0 1219 7.170 -1.000 765.0 21.70 4 177.0 164.6 418.0 1070 8.320 -1.000 652.0 22.10 5 196.5 185.1 381.0 985.0 8.910 -1.000 604.0 22.40 6 214.6 204.2 349.0 899.0 9.820 -1.000 550.0 22.70 7 236.9 221.8 326.0 1486 4.150 -0.9700 1160 23.00 8 280.5 248.8 1018 2785 3.050 -1.000 1767 23.50 9 328.6 297.6 980.0 2748 3.030 -1.000 1768 23.90
10 378.3 345.62 1017 2898 2.840 -1.000 1881 24.20 11 429.9 396.1 1033 3020 2.750 -1.000 1987 24.40 12 484.2 448.6 1123 3148 2.650 -1.000 2025 24.50 13 596.9 559.5 1157 3333 2.490 -1.000 2176 24.90 14 658.1 617.0 1253 3673 2.240 -0.9900 2420 25.00 15 726.0 680.2 1357 4142 1.950 -0.9900 2785 25.10 16 803.7 751.2 1535 4761 1.670 -0.9900 3226 25.10 17 888.7 832.5 1686 5054 1.610 -0.9900 3368 25.20 18 973.8 918.6 1661 4957 1.630 -0.9900 3296 25.50 19 1057 1003 1628 4806 1.690 -0.9900 3178 25.70 20 1139 1085 1599 4881 1.650 -0.9900 3282 25.80 21 1226 1168 1636 5217 1.50 -0.9900 3581 26.00 22 1320 1257 1805 5745 1.370 -0.9800 3940 26.20
Note: CTime= Current Time, OxoffT= Air off Time, STime= Start Time, CC= correlation coefficient, SNum= No. of Samples, Temp= Temperature (oC)
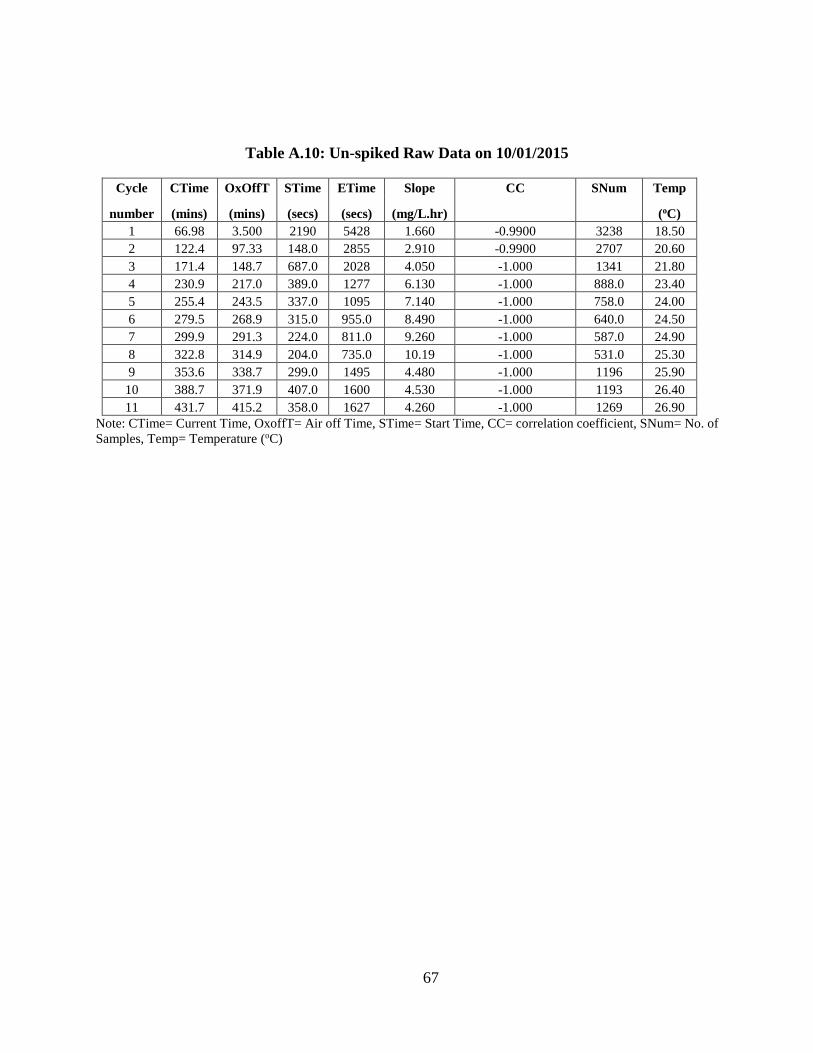
67
Table A.10: Un-spiked Raw Data on 10/01/2015
Cycle CTime OxOffT STime ETime Slope CC SNum Temp
number (mins) (mins) (secs) (secs) (mg/L.hr) (oC) 1 66.98 3.500 2190 5428 1.660 -0.9900 3238 18.50 2 122.4 97.33 148.0 2855 2.910 -0.9900 2707 20.60 3 171.4 148.7 687.0 2028 4.050 -1.000 1341 21.80 4 230.9 217.0 389.0 1277 6.130 -1.000 888.0 23.40 5 255.4 243.5 337.0 1095 7.140 -1.000 758.0 24.00 6 279.5 268.9 315.0 955.0 8.490 -1.000 640.0 24.50 7 299.9 291.3 224.0 811.0 9.260 -1.000 587.0 24.90 8 322.8 314.9 204.0 735.0 10.19 -1.000 531.0 25.30 9 353.6 338.7 299.0 1495 4.480 -1.000 1196 25.90
10 388.7 371.9 407.0 1600 4.530 -1.000 1193 26.40 11 431.7 415.2 358.0 1627 4.260 -1.000 1269 26.90
Note: CTime= Current Time, OxoffT= Air off Time, STime= Start Time, CC= correlation coefficient, SNum= No. of Samples, Temp= Temperature (oC)
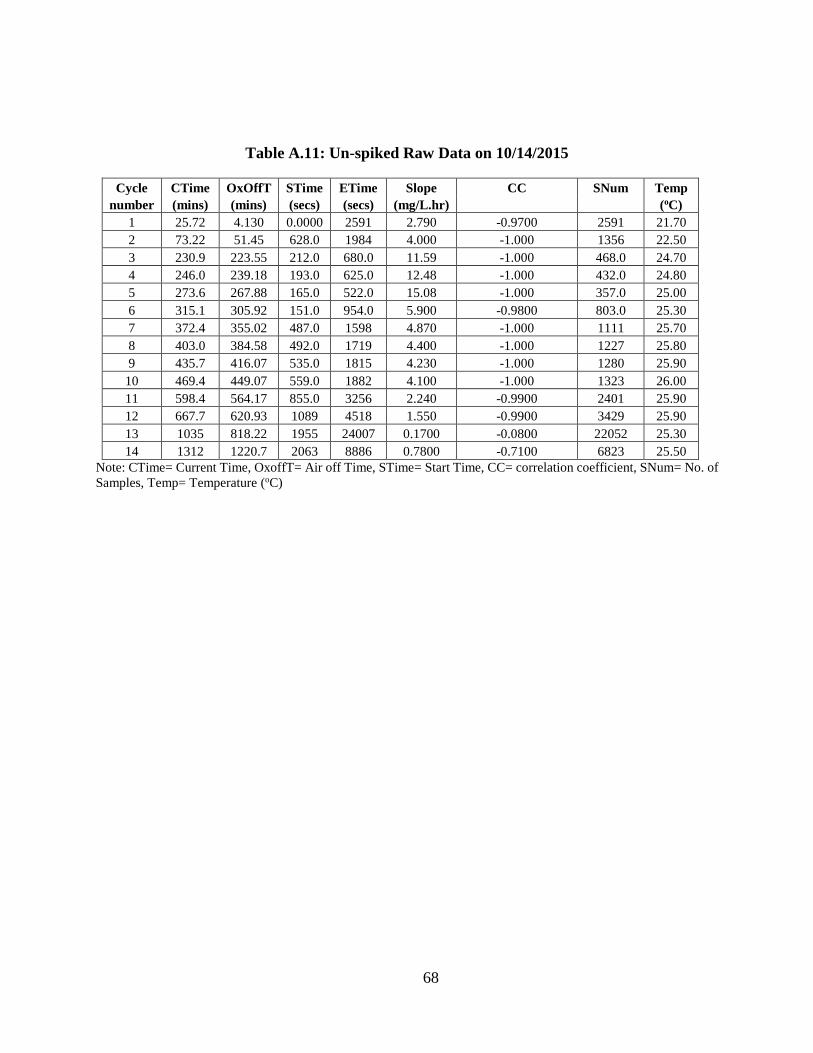
68
Table A.11: Un-spiked Raw Data on 10/14/2015
Cycle CTime OxOffT STime ETime Slope CC SNum Temp number (mins) (mins) (secs) (secs) (mg/L.hr) (oC)
1 25.72 4.130 0.0000 2591 2.790 -0.9700 2591 21.70 2 73.22 51.45 628.0 1984 4.000 -1.000 1356 22.50 3 230.9 223.55 212.0 680.0 11.59 -1.000 468.0 24.70 4 246.0 239.18 193.0 625.0 12.48 -1.000 432.0 24.80 5 273.6 267.88 165.0 522.0 15.08 -1.000 357.0 25.00 6 315.1 305.92 151.0 954.0 5.900 -0.9800 803.0 25.30 7 372.4 355.02 487.0 1598 4.870 -1.000 1111 25.70 8 403.0 384.58 492.0 1719 4.400 -1.000 1227 25.80 9 435.7 416.07 535.0 1815 4.230 -1.000 1280 25.90
10 469.4 449.07 559.0 1882 4.100 -1.000 1323 26.00 11 598.4 564.17 855.0 3256 2.240 -0.9900 2401 25.90 12 667.7 620.93 1089 4518 1.550 -0.9900 3429 25.90 13 1035 818.22 1955 24007 0.1700 -0.0800 22052 25.30 14 1312 1220.7 2063 8886 0.7800 -0.7100 6823 25.50
Note: CTime= Current Time, OxoffT= Air off Time, STime= Start Time, CC= correlation coefficient, SNum= No. of Samples, Temp= Temperature (oC)
69
APPENDIX E: SPIKED SAMPLE DATA (30 mL)
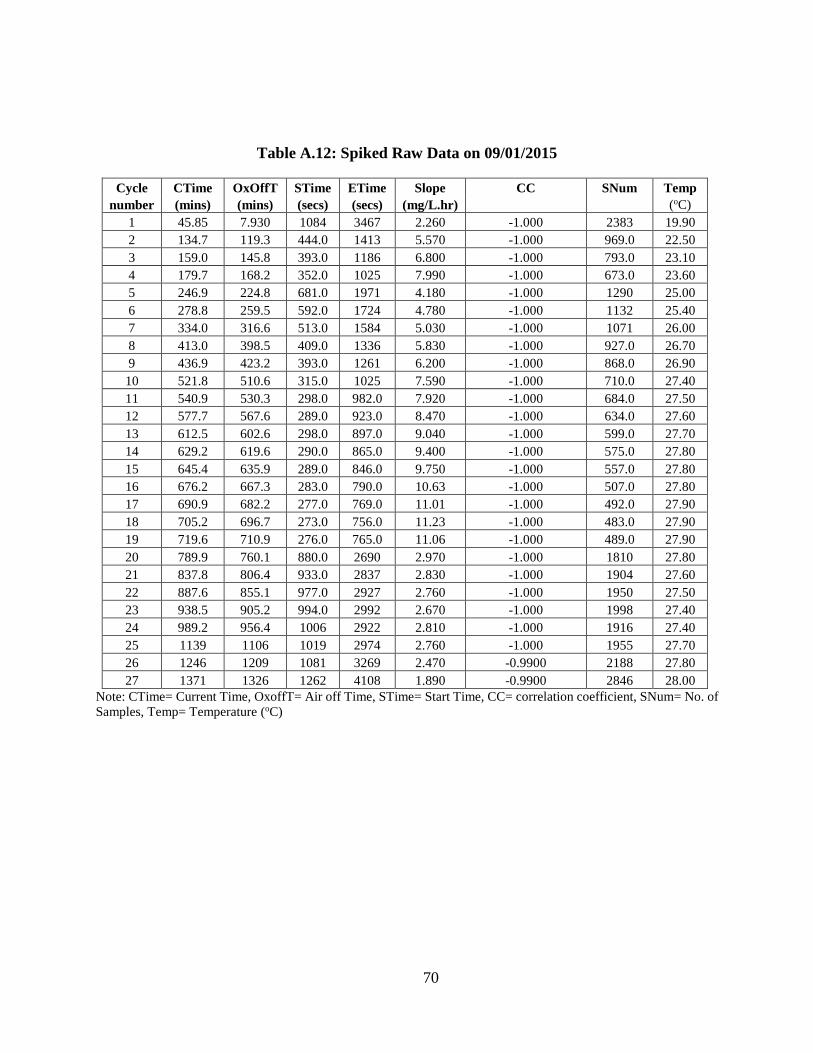
70
Table A.12: Spiked Raw Data on 09/01/2015
Cycle CTime OxOffT STime ETime Slope CC SNum Temp number (mins) (mins) (secs) (secs) (mg/L.hr) (oC)
1 45.85 7.930 1084 3467 2.260 -1.000 2383 19.90 2 134.7 119.3 444.0 1413 5.570 -1.000 969.0 22.50 3 159.0 145.8 393.0 1186 6.800 -1.000 793.0 23.10 4 179.7 168.2 352.0 1025 7.990 -1.000 673.0 23.60 5 246.9 224.8 681.0 1971 4.180 -1.000 1290 25.00 6 278.8 259.5 592.0 1724 4.780 -1.000 1132 25.40 7 334.0 316.6 513.0 1584 5.030 -1.000 1071 26.00 8 413.0 398.5 409.0 1336 5.830 -1.000 927.0 26.70 9 436.9 423.2 393.0 1261 6.200 -1.000 868.0 26.90 10 521.8 510.6 315.0 1025 7.590 -1.000 710.0 27.40 11 540.9 530.3 298.0 982.0 7.920 -1.000 684.0 27.50 12 577.7 567.6 289.0 923.0 8.470 -1.000 634.0 27.60 13 612.5 602.6 298.0 897.0 9.040 -1.000 599.0 27.70 14 629.2 619.6 290.0 865.0 9.400 -1.000 575.0 27.80 15 645.4 635.9 289.0 846.0 9.750 -1.000 557.0 27.80 16 676.2 667.3 283.0 790.0 10.63 -1.000 507.0 27.80 17 690.9 682.2 277.0 769.0 11.01 -1.000 492.0 27.90 18 705.2 696.7 273.0 756.0 11.23 -1.000 483.0 27.90 19 719.6 710.9 276.0 765.0 11.06 -1.000 489.0 27.90 20 789.9 760.1 880.0 2690 2.970 -1.000 1810 27.80 21 837.8 806.4 933.0 2837 2.830 -1.000 1904 27.60 22 887.6 855.1 977.0 2927 2.760 -1.000 1950 27.50 23 938.5 905.2 994.0 2992 2.670 -1.000 1998 27.40 24 989.2 956.4 1006 2922 2.810 -1.000 1916 27.40 25 1139 1106 1019 2974 2.760 -1.000 1955 27.70 26 1246 1209 1081 3269 2.470 -0.9900 2188 27.80 27 1371 1326 1262 4108 1.890 -0.9900 2846 28.00
Note: CTime= Current Time, OxoffT= Air off Time, STime= Start Time, CC= correlation coefficient, SNum= No. of Samples, Temp= Temperature (oC)
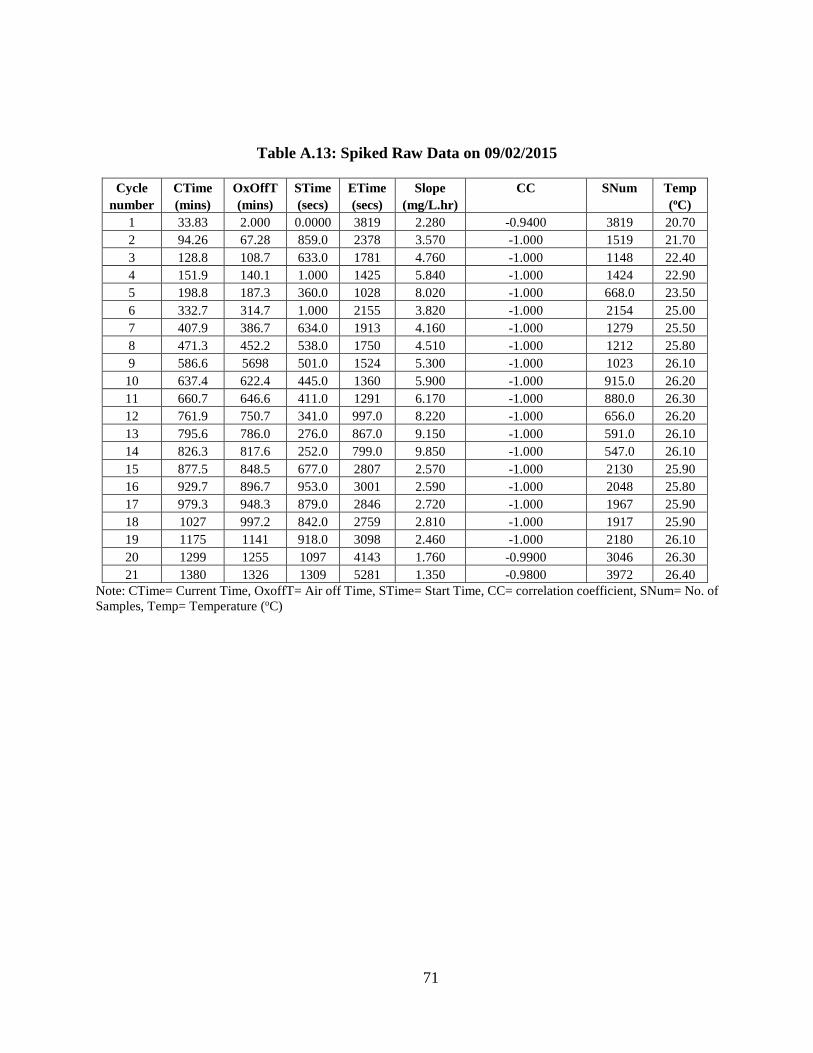
71
Table A.13: Spiked Raw Data on 09/02/2015
Cycle CTime OxOffT STime ETime Slope CC SNum Temp number (mins) (mins) (secs) (secs) (mg/L.hr) (oC)
1 33.83 2.000 0.0000 3819 2.280 -0.9400 3819 20.70 2 94.26 67.28 859.0 2378 3.570 -1.000 1519 21.70 3 128.8 108.7 633.0 1781 4.760 -1.000 1148 22.40 4 151.9 140.1 1.000 1425 5.840 -1.000 1424 22.90 5 198.8 187.3 360.0 1028 8.020 -1.000 668.0 23.50 6 332.7 314.7 1.000 2155 3.820 -1.000 2154 25.00 7 407.9 386.7 634.0 1913 4.160 -1.000 1279 25.50 8 471.3 452.2 538.0 1750 4.510 -1.000 1212 25.80 9 586.6 5698 501.0 1524 5.300 -1.000 1023 26.10 10 637.4 622.4 445.0 1360 5.900 -1.000 915.0 26.20 11 660.7 646.6 411.0 1291 6.170 -1.000 880.0 26.30 12 761.9 750.7 341.0 997.0 8.220 -1.000 656.0 26.20 13 795.6 786.0 276.0 867.0 9.150 -1.000 591.0 26.10 14 826.3 817.6 252.0 799.0 9.850 -1.000 547.0 26.10 15 877.5 848.5 677.0 2807 2.570 -1.000 2130 25.90 16 929.7 896.7 953.0 3001 2.590 -1.000 2048 25.80 17 979.3 948.3 879.0 2846 2.720 -1.000 1967 25.90 18 1027 997.2 842.0 2759 2.810 -1.000 1917 25.90 19 1175 1141 918.0 3098 2.460 -1.000 2180 26.10 20 1299 1255 1097 4143 1.760 -0.9900 3046 26.30 21 1380 1326 1309 5281 1.350 -0.9800 3972 26.40
Note: CTime= Current Time, OxoffT= Air off Time, STime= Start Time, CC= correlation coefficient, SNum= No. of Samples, Temp= Temperature (oC)
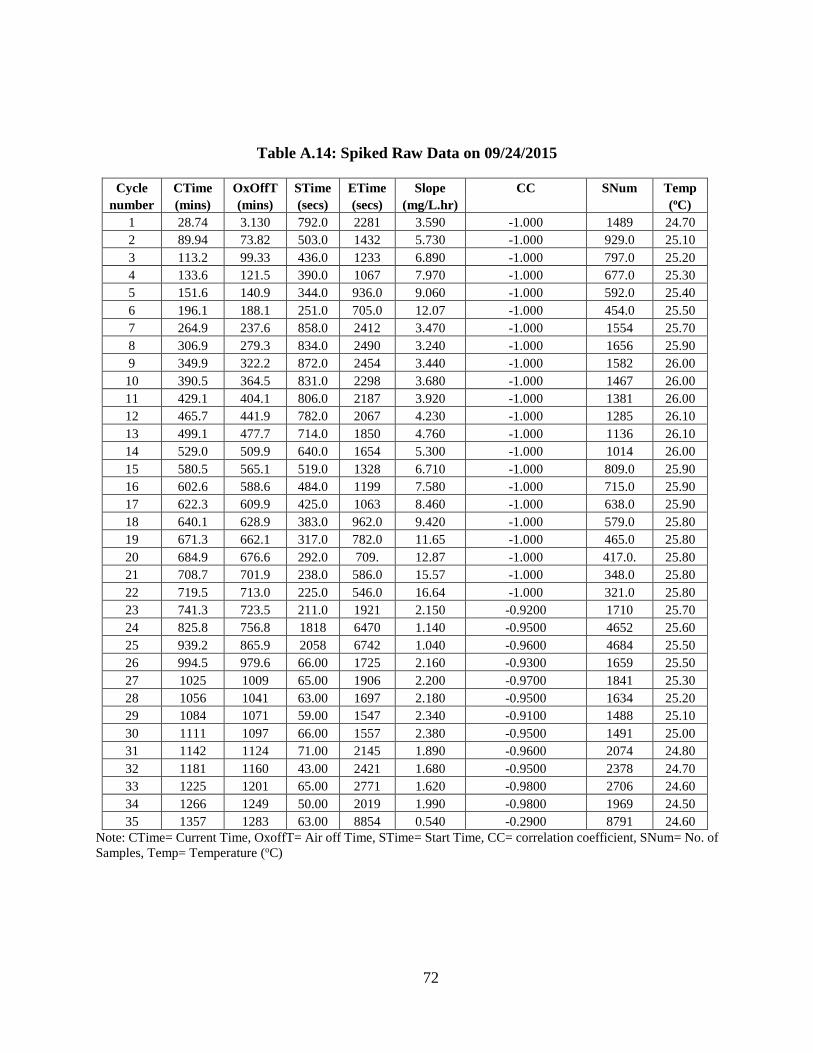
72
Table A.14: Spiked Raw Data on 09/24/2015
Cycle CTime OxOffT STime ETime Slope CC SNum Temp number (mins) (mins) (secs) (secs) (mg/L.hr) (oC)
1 28.74 3.130 792.0 2281 3.590 -1.000 1489 24.70 2 89.94 73.82 503.0 1432 5.730 -1.000 929.0 25.10 3 113.2 99.33 436.0 1233 6.890 -1.000 797.0 25.20 4 133.6 121.5 390.0 1067 7.970 -1.000 677.0 25.30 5 151.6 140.9 344.0 936.0 9.060 -1.000 592.0 25.40 6 196.1 188.1 251.0 705.0 12.07 -1.000 454.0 25.50 7 264.9 237.6 858.0 2412 3.470 -1.000 1554 25.70 8 306.9 279.3 834.0 2490 3.240 -1.000 1656 25.90 9 349.9 322.2 872.0 2454 3.440 -1.000 1582 26.00 10 390.5 364.5 831.0 2298 3.680 -1.000 1467 26.00 11 429.1 404.1 806.0 2187 3.920 -1.000 1381 26.00 12 465.7 441.9 782.0 2067 4.230 -1.000 1285 26.10 13 499.1 477.7 714.0 1850 4.760 -1.000 1136 26.10 14 529.0 509.9 640.0 1654 5.300 -1.000 1014 26.00 15 580.5 565.1 519.0 1328 6.710 -1.000 809.0 25.90 16 602.6 588.6 484.0 1199 7.580 -1.000 715.0 25.90 17 622.3 609.9 425.0 1063 8.460 -1.000 638.0 25.90 18 640.1 628.9 383.0 962.0 9.420 -1.000 579.0 25.80 19 671.3 662.1 317.0 782.0 11.65 -1.000 465.0 25.80 20 684.9 676.6 292.0 709. 12.87 -1.000 417.0. 25.80 21 708.7 701.9 238.0 586.0 15.57 -1.000 348.0 25.80 22 719.5 713.0 225.0 546.0 16.64 -1.000 321.0 25.80 23 741.3 723.5 211.0 1921 2.150 -0.9200 1710 25.70 24 825.8 756.8 1818 6470 1.140 -0.9500 4652 25.60 25 939.2 865.9 2058 6742 1.040 -0.9600 4684 25.50 26 994.5 979.6 66.00 1725 2.160 -0.9300 1659 25.50 27 1025 1009 65.00 1906 2.200 -0.9700 1841 25.30 28 1056 1041 63.00 1697 2.180 -0.9500 1634 25.20 29 1084 1071 59.00 1547 2.340 -0.9100 1488 25.10 30 1111 1097 66.00 1557 2.380 -0.9500 1491 25.00 31 1142 1124 71.00 2145 1.890 -0.9600 2074 24.80 32 1181 1160 43.00 2421 1.680 -0.9500 2378 24.70 33 1225 1201 65.00 2771 1.620 -0.9800 2706 24.60 34 1266 1249 50.00 2019 1.990 -0.9800 1969 24.50 35 1357 1283 63.00 8854 0.540 -0.2900 8791 24.60
Note: CTime= Current Time, OxoffT= Air off Time, STime= Start Time, CC= correlation coefficient, SNum= No. of Samples, Temp= Temperature (oC)
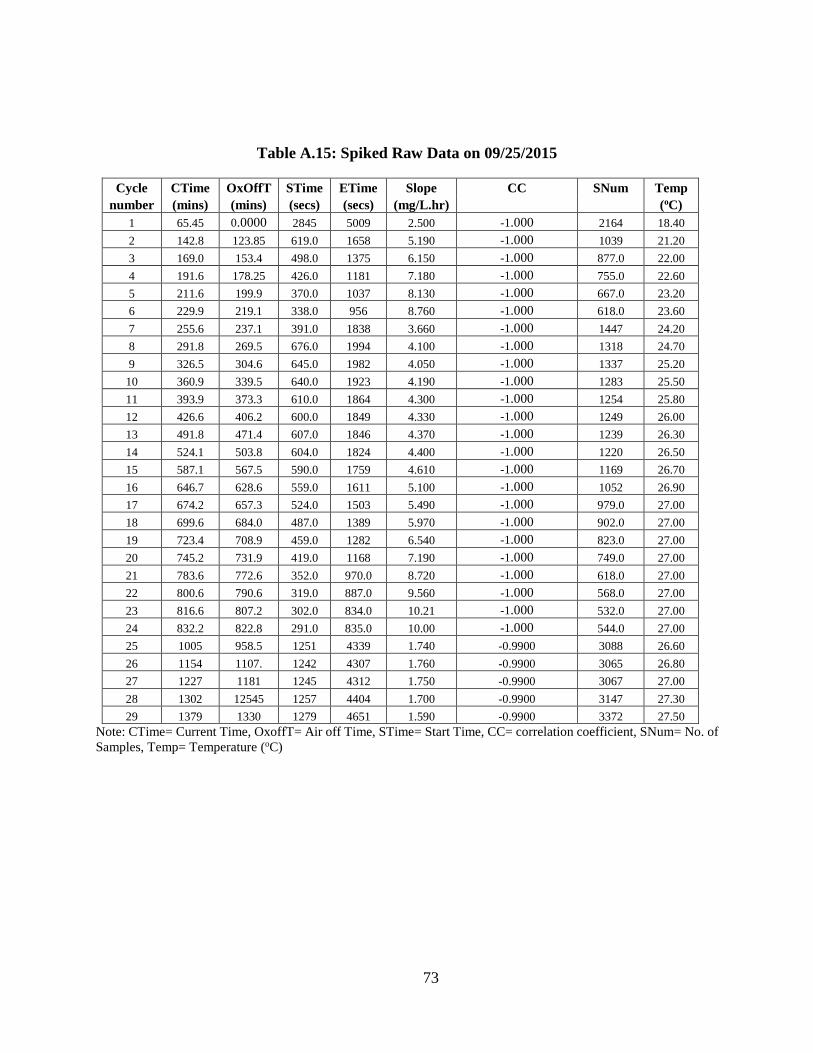
73
Table A.15: Spiked Raw Data on 09/25/2015
Cycle CTime OxOffT STime ETime Slope CC SNum Temp number (mins) (mins) (secs) (secs) (mg/L.hr) (oC)
1 65.45 0.0000 2845 5009 2.500 -1.000 2164 18.40 2 142.8 123.85 619.0 1658 5.190 -1.000 1039 21.20 3 169.0 153.4 498.0 1375 6.150 -1.000 877.0 22.00 4 191.6 178.25 426.0 1181 7.180 -1.000 755.0 22.60 5 211.6 199.9 370.0 1037 8.130 -1.000 667.0 23.20 6 229.9 219.1 338.0 956 8.760 -1.000 618.0 23.60 7 255.6 237.1 391.0 1838 3.660 -1.000 1447 24.20 8 291.8 269.5 676.0 1994 4.100 -1.000 1318 24.70 9 326.5 304.6 645.0 1982 4.050 -1.000 1337 25.20
10 360.9 339.5 640.0 1923 4.190 -1.000 1283 25.50 11 393.9 373.3 610.0 1864 4.300 -1.000 1254 25.80 12 426.6 406.2 600.0 1849 4.330 -1.000 1249 26.00 13 491.8 471.4 607.0 1846 4.370 -1.000 1239 26.30 14 524.1 503.8 604.0 1824 4.400 -1.000 1220 26.50 15 587.1 567.5 590.0 1759 4.610 -1.000 1169 26.70 16 646.7 628.6 559.0 1611 5.100 -1.000 1052 26.90 17 674.2 657.3 524.0 1503 5.490 -1.000 979.0 27.00 18 699.6 684.0 487.0 1389 5.970 -1.000 902.0 27.00 19 723.4 708.9 459.0 1282 6.540 -1.000 823.0 27.00 20 745.2 731.9 419.0 1168 7.190 -1.000 749.0 27.00 21 783.6 772.6 352.0 970.0 8.720 -1.000 618.0 27.00 22 800.6 790.6 319.0 887.0 9.560 -1.000 568.0 27.00 23 816.6 807.2 302.0 834.0 10.21 -1.000 532.0 27.00 24 832.2 822.8 291.0 835.0 10.00 -1.000 544.0 27.00 25 1005 958.5 1251 4339 1.740 -0.9900 3088 26.60 26 1154 1107. 1242 4307 1.760 -0.9900 3065 26.80 27 1227 1181 1245 4312 1.750 -0.9900 3067 27.00 28 1302 12545 1257 4404 1.700 -0.9900 3147 27.30 29 1379 1330 1279 4651 1.590 -0.9900 3372 27.50
Note: CTime= Current Time, OxoffT= Air off Time, STime= Start Time, CC= correlation coefficient, SNum= No. of Samples, Temp= Temperature (oC)
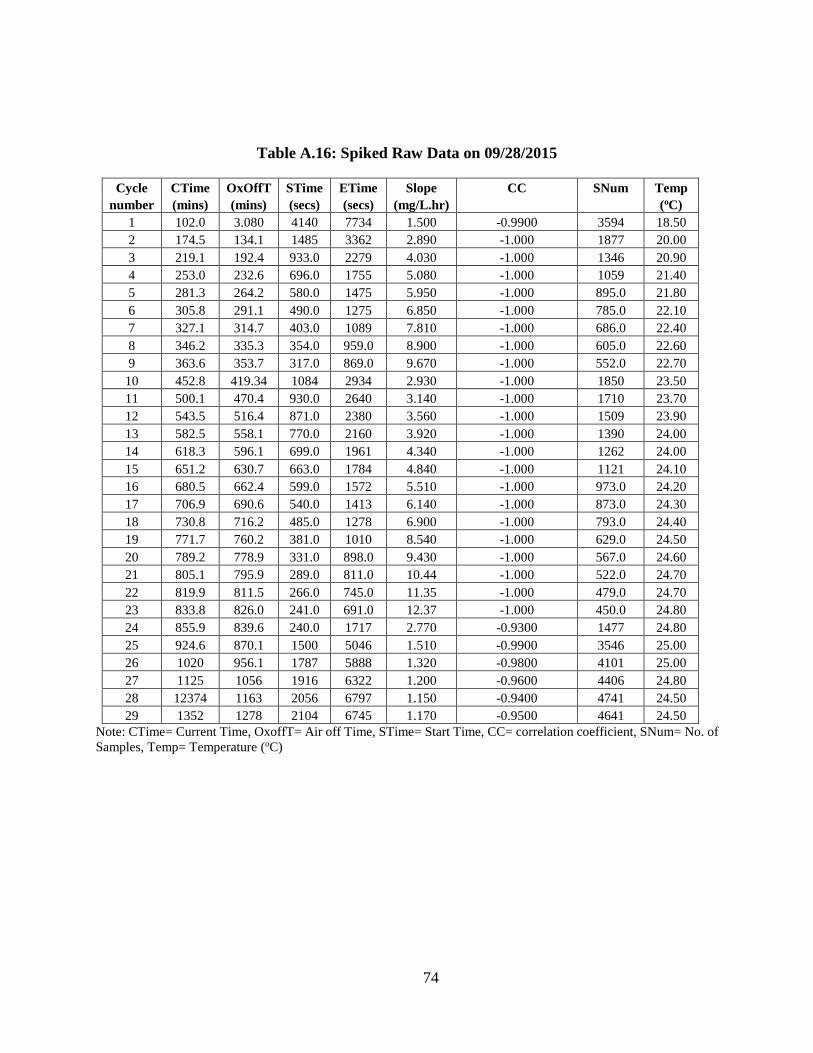
74
Table A.16: Spiked Raw Data on 09/28/2015
Cycle CTime OxOffT STime ETime Slope CC SNum Temp number (mins) (mins) (secs) (secs) (mg/L.hr) (oC)
1 102.0 3.080 4140 7734 1.500 -0.9900 3594 18.50 2 174.5 134.1 1485 3362 2.890 -1.000 1877 20.00 3 219.1 192.4 933.0 2279 4.030 -1.000 1346 20.90 4 253.0 232.6 696.0 1755 5.080 -1.000 1059 21.40 5 281.3 264.2 580.0 1475 5.950 -1.000 895.0 21.80 6 305.8 291.1 490.0 1275 6.850 -1.000 785.0 22.10 7 327.1 314.7 403.0 1089 7.810 -1.000 686.0 22.40 8 346.2 335.3 354.0 959.0 8.900 -1.000 605.0 22.60 9 363.6 353.7 317.0 869.0 9.670 -1.000 552.0 22.70
10 452.8 419.34 1084 2934 2.930 -1.000 1850 23.50 11 500.1 470.4 930.0 2640 3.140 -1.000 1710 23.70 12 543.5 516.4 871.0 2380 3.560 -1.000 1509 23.90 13 582.5 558.1 770.0 2160 3.920 -1.000 1390 24.00 14 618.3 596.1 699.0 1961 4.340 -1.000 1262 24.00 15 651.2 630.7 663.0 1784 4.840 -1.000 1121 24.10 16 680.5 662.4 599.0 1572 5.510 -1.000 973.0 24.20 17 706.9 690.6 540.0 1413 6.140 -1.000 873.0 24.30 18 730.8 716.2 485.0 1278 6.900 -1.000 793.0 24.40 19 771.7 760.2 381.0 1010 8.540 -1.000 629.0 24.50 20 789.2 778.9 331.0 898.0 9.430 -1.000 567.0 24.60 21 805.1 795.9 289.0 811.0 10.44 -1.000 522.0 24.70 22 819.9 811.5 266.0 745.0 11.35 -1.000 479.0 24.70 23 833.8 826.0 241.0 691.0 12.37 -1.000 450.0 24.80 24 855.9 839.6 240.0 1717 2.770 -0.9300 1477 24.80 25 924.6 870.1 1500 5046 1.510 -0.9900 3546 25.00 26 1020 956.1 1787 5888 1.320 -0.9800 4101 25.00 27 1125 1056 1916 6322 1.200 -0.9600 4406 24.80 28 12374 1163 2056 6797 1.150 -0.9400 4741 24.50 29 1352 1278 2104 6745 1.170 -0.9500 4641 24.50
Note: CTime= Current Time, OxoffT= Air off Time, STime= Start Time, CC= correlation coefficient, SNum= No. of Samples, Temp= Temperature (oC)
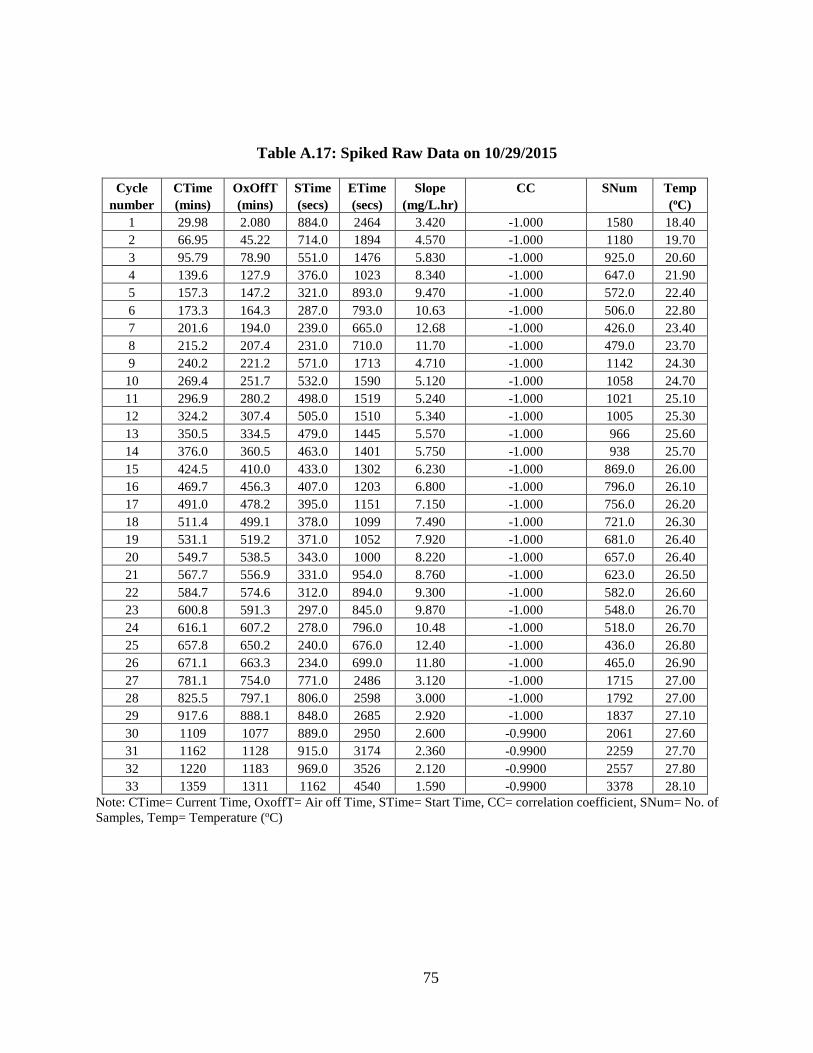
75
Table A.17: Spiked Raw Data on 10/29/2015
Cycle CTime OxOffT STime ETime Slope CC SNum Temp number (mins) (mins) (secs) (secs) (mg/L.hr) (oC)
1 29.98 2.080 884.0 2464 3.420 -1.000 1580 18.40 2 66.95 45.22 714.0 1894 4.570 -1.000 1180 19.70 3 95.79 78.90 551.0 1476 5.830 -1.000 925.0 20.60 4 139.6 127.9 376.0 1023 8.340 -1.000 647.0 21.90 5 157.3 147.2 321.0 893.0 9.470 -1.000 572.0 22.40 6 173.3 164.3 287.0 793.0 10.63 -1.000 506.0 22.80 7 201.6 194.0 239.0 665.0 12.68 -1.000 426.0 23.40 8 215.2 207.4 231.0 710.0 11.70 -1.000 479.0 23.70 9 240.2 221.2 571.0 1713 4.710 -1.000 1142 24.30 10 269.4 251.7 532.0 1590 5.120 -1.000 1058 24.70 11 296.9 280.2 498.0 1519 5.240 -1.000 1021 25.10 12 324.2 307.4 505.0 1510 5.340 -1.000 1005 25.30 13 350.5 334.5 479.0 1445 5.570 -1.000 966 25.60 14 376.0 360.5 463.0 1401 5.750 -1.000 938 25.70 15 424.5 410.0 433.0 1302 6.230 -1.000 869.0 26.00 16 469.7 456.3 407.0 1203 6.800 -1.000 796.0 26.10 17 491.0 478.2 395.0 1151 7.150 -1.000 756.0 26.20 18 511.4 499.1 378.0 1099 7.490 -1.000 721.0 26.30 19 531.1 519.2 371.0 1052 7.920 -1.000 681.0 26.40 20 549.7 538.5 343.0 1000 8.220 -1.000 657.0 26.40 21 567.7 556.9 331.0 954.0 8.760 -1.000 623.0 26.50 22 584.7 574.6 312.0 894.0 9.300 -1.000 582.0 26.60 23 600.8 591.3 297.0 845.0 9.870 -1.000 548.0 26.70 24 616.1 607.2 278.0 796.0 10.48 -1.000 518.0 26.70 25 657.8 650.2 240.0 676.0 12.40 -1.000 436.0 26.80 26 671.1 663.3 234.0 699.0 11.80 -1.000 465.0 26.90 27 781.1 754.0 771.0 2486 3.120 -1.000 1715 27.00 28 825.5 797.1 806.0 2598 3.000 -1.000 1792 27.00 29 917.6 888.1 848.0 2685 2.920 -1.000 1837 27.10 30 1109 1077 889.0 2950 2.600 -0.9900 2061 27.60 31 1162 1128 915.0 3174 2.360 -0.9900 2259 27.70 32 1220 1183 969.0 3526 2.120 -0.9900 2557 27.80 33 1359 1311 1162 4540 1.590 -0.9900 3378 28.10
Note: CTime= Current Time, OxoffT= Air off Time, STime= Start Time, CC= correlation coefficient, SNum= No. of Samples, Temp= Temperature (oC)
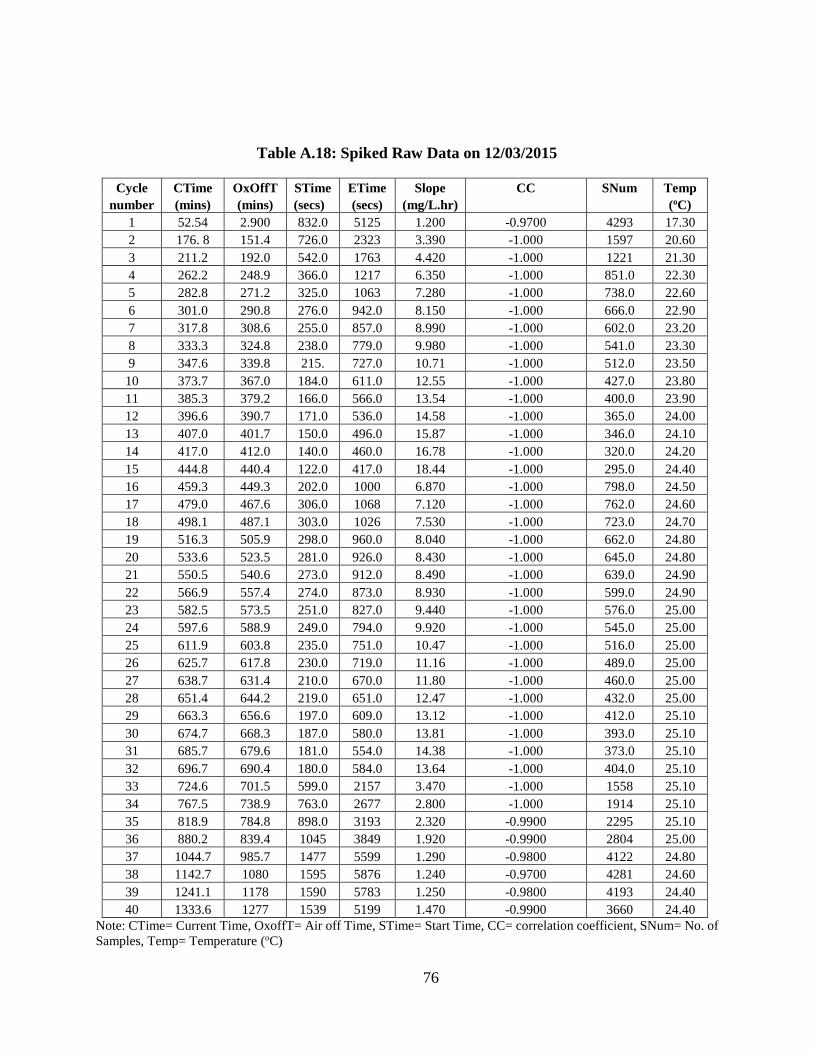
76
Table A.18: Spiked Raw Data on 12/03/2015
Cycle CTime OxOffT STime ETime Slope CC SNum Temp number (mins) (mins) (secs) (secs) (mg/L.hr) (oC)
1 52.54 2.900 832.0 5125 1.200 -0.9700 4293 17.30 2 176. 8 151.4 726.0 2323 3.390 -1.000 1597 20.60 3 211.2 192.0 542.0 1763 4.420 -1.000 1221 21.30 4 262.2 248.9 366.0 1217 6.350 -1.000 851.0 22.30 5 282.8 271.2 325.0 1063 7.280 -1.000 738.0 22.60 6 301.0 290.8 276.0 942.0 8.150 -1.000 666.0 22.90 7 317.8 308.6 255.0 857.0 8.990 -1.000 602.0 23.20 8 333.3 324.8 238.0 779.0 9.980 -1.000 541.0 23.30 9 347.6 339.8 215. 727.0 10.71 -1.000 512.0 23.50 10 373.7 367.0 184.0 611.0 12.55 -1.000 427.0 23.80 11 385.3 379.2 166.0 566.0 13.54 -1.000 400.0 23.90 12 396.6 390.7 171.0 536.0 14.58 -1.000 365.0 24.00 13 407.0 401.7 150.0 496.0 15.87 -1.000 346.0 24.10 14 417.0 412.0 140.0 460.0 16.78 -1.000 320.0 24.20 15 444.8 440.4 122.0 417.0 18.44 -1.000 295.0 24.40 16 459.3 449.3 202.0 1000 6.870 -1.000 798.0 24.50 17 479.0 467.6 306.0 1068 7.120 -1.000 762.0 24.60 18 498.1 487.1 303.0 1026 7.530 -1.000 723.0 24.70 19 516.3 505.9 298.0 960.0 8.040 -1.000 662.0 24.80 20 533.6 523.5 281.0 926.0 8.430 -1.000 645.0 24.80 21 550.5 540.6 273.0 912.0 8.490 -1.000 639.0 24.90 22 566.9 557.4 274.0 873.0 8.930 -1.000 599.0 24.90 23 582.5 573.5 251.0 827.0 9.440 -1.000 576.0 25.00 24 597.6 588.9 249.0 794.0 9.920 -1.000 545.0 25.00 25 611.9 603.8 235.0 751.0 10.47 -1.000 516.0 25.00 26 625.7 617.8 230.0 719.0 11.16 -1.000 489.0 25.00 27 638.7 631.4 210.0 670.0 11.80 -1.000 460.0 25.00 28 651.4 644.2 219.0 651.0 12.47 -1.000 432.0 25.00 29 663.3 656.6 197.0 609.0 13.12 -1.000 412.0 25.10 30 674.7 668.3 187.0 580.0 13.81 -1.000 393.0 25.10 31 685.7 679.6 181.0 554.0 14.38 -1.000 373.0 25.10 32 696.7 690.4 180.0 584.0 13.64 -1.000 404.0 25.10 33 724.6 701.5 599.0 2157 3.470 -1.000 1558 25.10 34 767.5 738.9 763.0 2677 2.800 -1.000 1914 25.10 35 818.9 784.8 898.0 3193 2.320 -0.9900 2295 25.10 36 880.2 839.4 1045 3849 1.920 -0.9900 2804 25.00 37 1044.7 985.7 1477 5599 1.290 -0.9800 4122 24.80 38 1142.7 1080 1595 5876 1.240 -0.9700 4281 24.60 39 1241.1 1178 1590 5783 1.250 -0.9800 4193 24.40 40 1333.6 1277 1539 5199 1.470 -0.9900 3660 24.40
Note: CTime= Current Time, OxoffT= Air off Time, STime= Start Time, CC= correlation coefficient, SNum= No. of Samples, Temp= Temperature (oC)
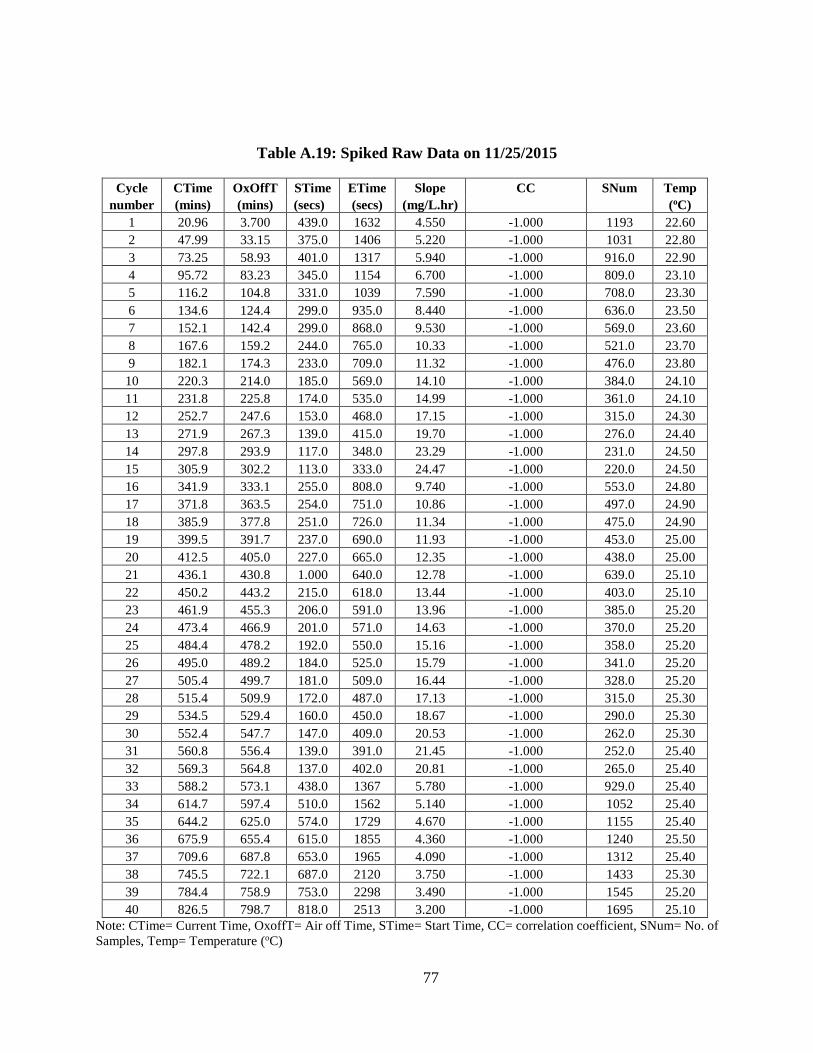
77
Table A.19: Spiked Raw Data on 11/25/2015
Cycle CTime OxOffT STime ETime Slope CC SNum Temp number (mins) (mins) (secs) (secs) (mg/L.hr) (oC)
1 20.96 3.700 439.0 1632 4.550 -1.000 1193 22.60 2 47.99 33.15 375.0 1406 5.220 -1.000 1031 22.80 3 73.25 58.93 401.0 1317 5.940 -1.000 916.0 22.90 4 95.72 83.23 345.0 1154 6.700 -1.000 809.0 23.10 5 116.2 104.8 331.0 1039 7.590 -1.000 708.0 23.30 6 134.6 124.4 299.0 935.0 8.440 -1.000 636.0 23.50 7 152.1 142.4 299.0 868.0 9.530 -1.000 569.0 23.60 8 167.6 159.2 244.0 765.0 10.33 -1.000 521.0 23.70 9 182.1 174.3 233.0 709.0 11.32 -1.000 476.0 23.80 10 220.3 214.0 185.0 569.0 14.10 -1.000 384.0 24.10 11 231.8 225.8 174.0 535.0 14.99 -1.000 361.0 24.10 12 252.7 247.6 153.0 468.0 17.15 -1.000 315.0 24.30 13 271.9 267.3 139.0 415.0 19.70 -1.000 276.0 24.40 14 297.8 293.9 117.0 348.0 23.29 -1.000 231.0 24.50 15 305.9 302.2 113.0 333.0 24.47 -1.000 220.0 24.50 16 341.9 333.1 255.0 808.0 9.740 -1.000 553.0 24.80 17 371.8 363.5 254.0 751.0 10.86 -1.000 497.0 24.90 18 385.9 377.8 251.0 726.0 11.34 -1.000 475.0 24.90 19 399.5 391.7 237.0 690.0 11.93 -1.000 453.0 25.00 20 412.5 405.0 227.0 665.0 12.35 -1.000 438.0 25.00 21 436.1 430.8 1.000 640.0 12.78 -1.000 639.0 25.10 22 450.2 443.2 215.0 618.0 13.44 -1.000 403.0 25.10 23 461.9 455.3 206.0 591.0 13.96 -1.000 385.0 25.20 24 473.4 466.9 201.0 571.0 14.63 -1.000 370.0 25.20 25 484.4 478.2 192.0 550.0 15.16 -1.000 358.0 25.20 26 495.0 489.2 184.0 525.0 15.79 -1.000 341.0 25.20 27 505.4 499.7 181.0 509.0 16.44 -1.000 328.0 25.20 28 515.4 509.9 172.0 487.0 17.13 -1.000 315.0 25.30 29 534.5 529.4 160.0 450.0 18.67 -1.000 290.0 25.30 30 552.4 547.7 147.0 409.0 20.53 -1.000 262.0 25.30 31 560.8 556.4 139.0 391.0 21.45 -1.000 252.0 25.40 32 569.3 564.8 137.0 402.0 20.81 -1.000 265.0 25.40 33 588.2 573.1 438.0 1367 5.780 -1.000 929.0 25.40 34 614.7 597.4 510.0 1562 5.140 -1.000 1052 25.40 35 644.2 625.0 574.0 1729 4.670 -1.000 1155 25.40 36 675.9 655.4 615.0 1855 4.360 -1.000 1240 25.50 37 709.6 687.8 653.0 1965 4.090 -1.000 1312 25.40 38 745.5 722.1 687.0 2120 3.750 -1.000 1433 25.30 39 784.4 758.9 753.0 2298 3.490 -1.000 1545 25.20 40 826.5 798.7 818.0 2513 3.200 -1.000 1695 25.10
Note: CTime= Current Time, OxoffT= Air off Time, STime= Start Time, CC= correlation coefficient, SNum= No. of Samples, Temp= Temperature (oC)
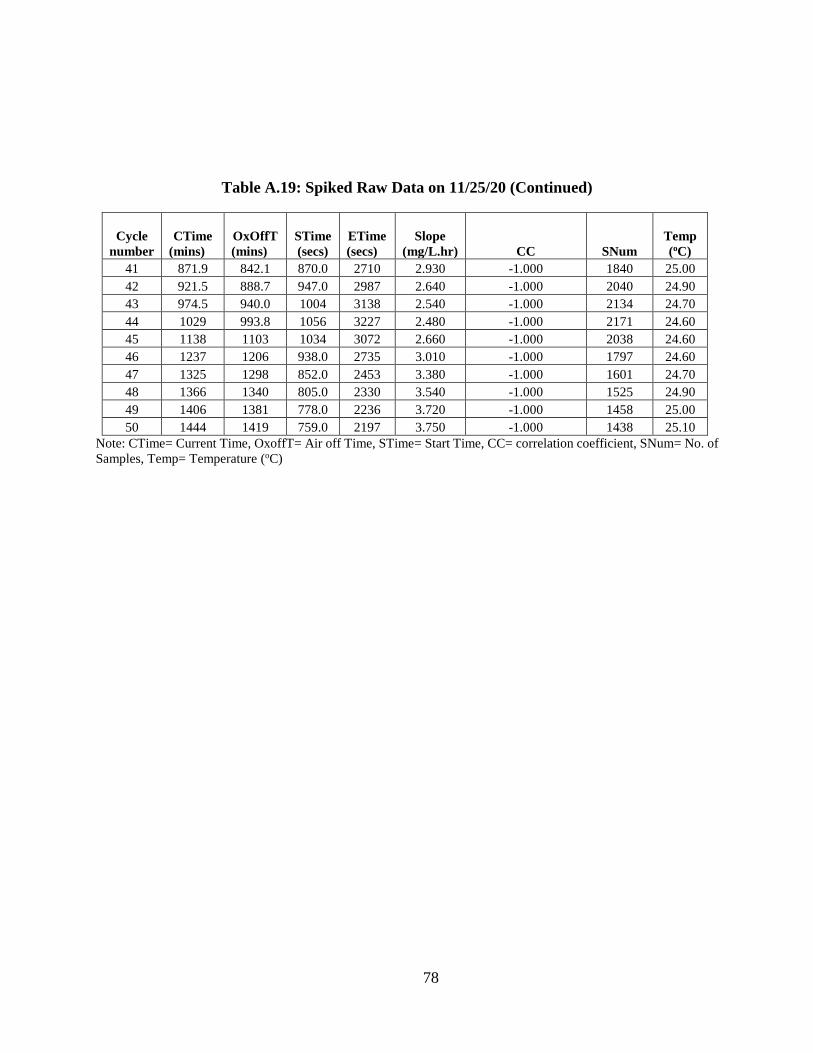
78
Table A.19: Spiked Raw Data on 11/25/20 (Continued)
Cycle number
CTime (mins)
OxOffT (mins)
STime (secs)
ETime (secs)
Slope (mg/L.hr) CC SNum
Temp (oC)
41 871.9 842.1 870.0 2710 2.930 -1.000 1840 25.00 42 921.5 888.7 947.0 2987 2.640 -1.000 2040 24.90 43 974.5 940.0 1004 3138 2.540 -1.000 2134 24.70 44 1029 993.8 1056 3227 2.480 -1.000 2171 24.60 45 1138 1103 1034 3072 2.660 -1.000 2038 24.60 46 1237 1206 938.0 2735 3.010 -1.000 1797 24.60 47 1325 1298 852.0 2453 3.380 -1.000 1601 24.70 48 1366 1340 805.0 2330 3.540 -1.000 1525 24.90 49 1406 1381 778.0 2236 3.720 -1.000 1458 25.00 50 1444 1419 759.0 2197 3.750 -1.000 1438 25.10
Note: CTime= Current Time, OxoffT= Air off Time, STime= Start Time, CC= correlation coefficient, SNum= No. of Samples, Temp= Temperature (oC)
79
APPENDIX F: SPIKED SAMPLE DATA (15 mL)
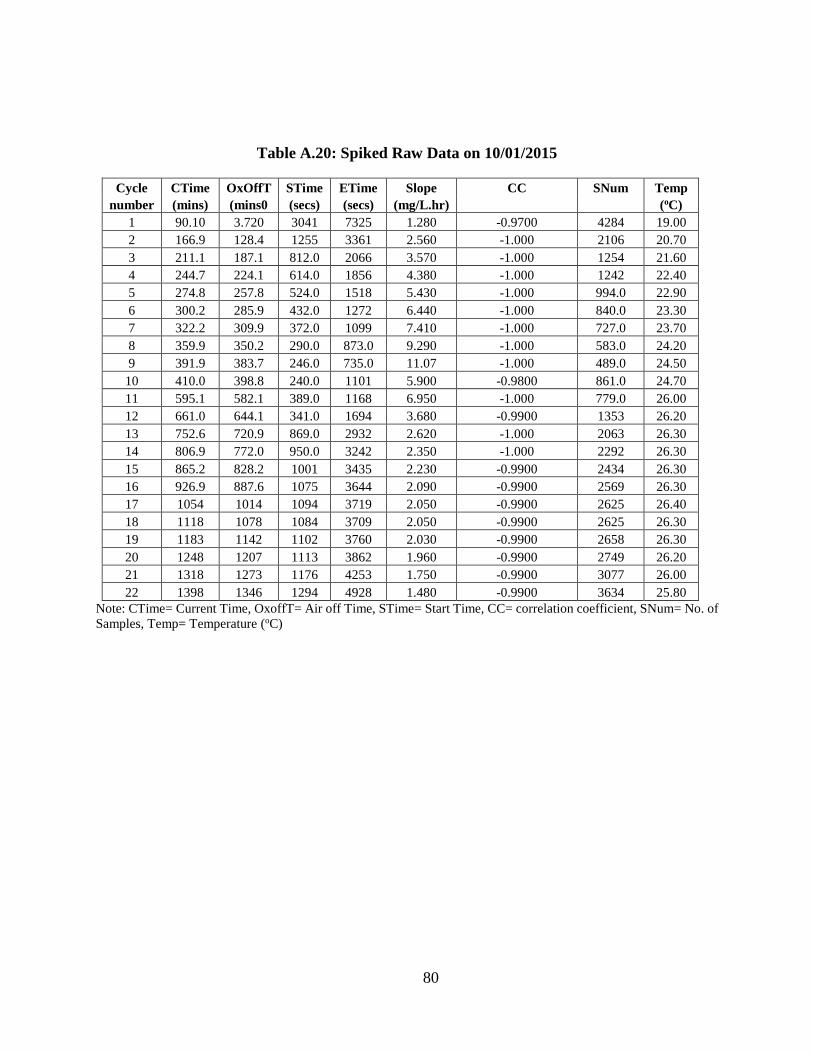
80
Table A.20: Spiked Raw Data on 10/01/2015
Cycle CTime OxOffT STime ETime Slope CC SNum Temp number (mins) (mins0 (secs) (secs) (mg/L.hr) (oC)
1 90.10 3.720 3041 7325 1.280 -0.9700 4284 19.00 2 166.9 128.4 1255 3361 2.560 -1.000 2106 20.70 3 211.1 187.1 812.0 2066 3.570 -1.000 1254 21.60 4 244.7 224.1 614.0 1856 4.380 -1.000 1242 22.40 5 274.8 257.8 524.0 1518 5.430 -1.000 994.0 22.90 6 300.2 285.9 432.0 1272 6.440 -1.000 840.0 23.30 7 322.2 309.9 372.0 1099 7.410 -1.000 727.0 23.70 8 359.9 350.2 290.0 873.0 9.290 -1.000 583.0 24.20 9 391.9 383.7 246.0 735.0 11.07 -1.000 489.0 24.50
10 410.0 398.8 240.0 1101 5.900 -0.9800 861.0 24.70 11 595.1 582.1 389.0 1168 6.950 -1.000 779.0 26.00 12 661.0 644.1 341.0 1694 3.680 -0.9900 1353 26.20 13 752.6 720.9 869.0 2932 2.620 -1.000 2063 26.30 14 806.9 772.0 950.0 3242 2.350 -1.000 2292 26.30 15 865.2 828.2 1001 3435 2.230 -0.9900 2434 26.30 16 926.9 887.6 1075 3644 2.090 -0.9900 2569 26.30 17 1054 1014 1094 3719 2.050 -0.9900 2625 26.40 18 1118 1078 1084 3709 2.050 -0.9900 2625 26.30 19 1183 1142 1102 3760 2.030 -0.9900 2658 26.30 20 1248 1207 1113 3862 1.960 -0.9900 2749 26.20 21 1318 1273 1176 4253 1.750 -0.9900 3077 26.00 22 1398 1346 1294 4928 1.480 -0.9900 3634 25.80
Note: CTime= Current Time, OxoffT= Air off Time, STime= Start Time, CC= correlation coefficient, SNum= No. of Samples, Temp= Temperature (oC)
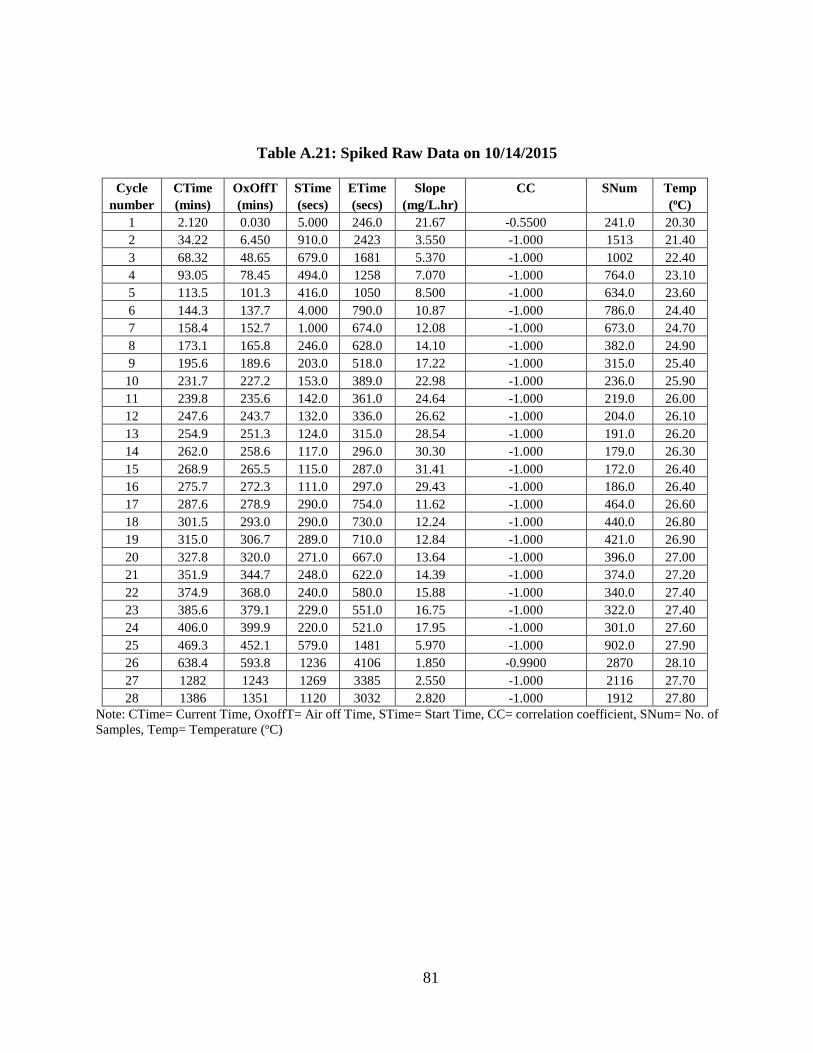
81
Table A.21: Spiked Raw Data on 10/14/2015
Cycle CTime OxOffT STime ETime Slope CC SNum Temp number (mins) (mins) (secs) (secs) (mg/L.hr) (oC)
1 2.120 0.030 5.000 246.0 21.67 -0.5500 241.0 20.30 2 34.22 6.450 910.0 2423 3.550 -1.000 1513 21.40 3 68.32 48.65 679.0 1681 5.370 -1.000 1002 22.40 4 93.05 78.45 494.0 1258 7.070 -1.000 764.0 23.10 5 113.5 101.3 416.0 1050 8.500 -1.000 634.0 23.60 6 144.3 137.7 4.000 790.0 10.87 -1.000 786.0 24.40 7 158.4 152.7 1.000 674.0 12.08 -1.000 673.0 24.70 8 173.1 165.8 246.0 628.0 14.10 -1.000 382.0 24.90 9 195.6 189.6 203.0 518.0 17.22 -1.000 315.0 25.40 10 231.7 227.2 153.0 389.0 22.98 -1.000 236.0 25.90 11 239.8 235.6 142.0 361.0 24.64 -1.000 219.0 26.00 12 247.6 243.7 132.0 336.0 26.62 -1.000 204.0 26.10 13 254.9 251.3 124.0 315.0 28.54 -1.000 191.0 26.20 14 262.0 258.6 117.0 296.0 30.30 -1.000 179.0 26.30 15 268.9 265.5 115.0 287.0 31.41 -1.000 172.0 26.40 16 275.7 272.3 111.0 297.0 29.43 -1.000 186.0 26.40 17 287.6 278.9 290.0 754.0 11.62 -1.000 464.0 26.60 18 301.5 293.0 290.0 730.0 12.24 -1.000 440.0 26.80 19 315.0 306.7 289.0 710.0 12.84 -1.000 421.0 26.90 20 327.8 320.0 271.0 667.0 13.64 -1.000 396.0 27.00 21 351.9 344.7 248.0 622.0 14.39 -1.000 374.0 27.20 22 374.9 368.0 240.0 580.0 15.88 -1.000 340.0 27.40 23 385.6 379.1 229.0 551.0 16.75 -1.000 322.0 27.40 24 406.0 399.9 220.0 521.0 17.95 -1.000 301.0 27.60 25 469.3 452.1 579.0 1481 5.970 -1.000 902.0 27.90 26 638.4 593.8 1236 4106 1.850 -0.9900 2870 28.10 27 1282 1243 1269 3385 2.550 -1.000 2116 27.70 28 1386 1351 1120 3032 2.820 -1.000 1912 27.80
Note: CTime= Current Time, OxoffT= Air off Time, STime= Start Time, CC= correlation coefficient, SNum= No. of Samples, Temp= Temperature (oC)

82
APPENDIX G: GLYCEROL PLUS ACCLIMATED MASS
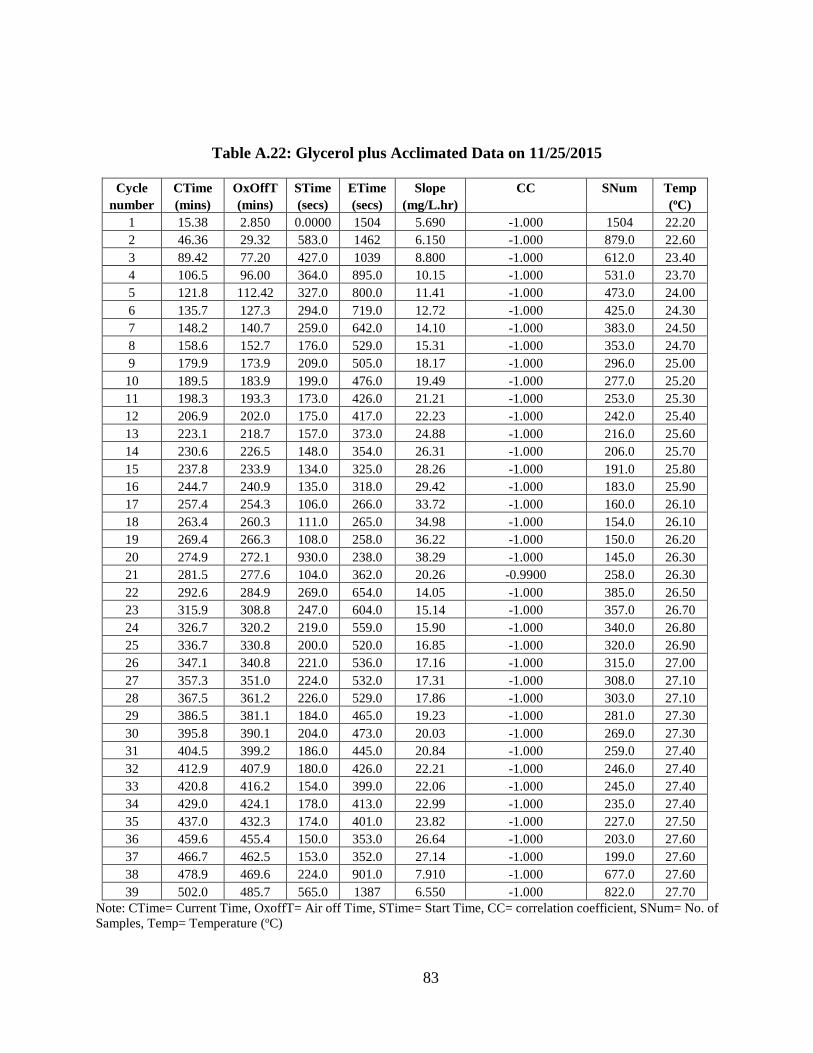
83
Table A.22: Glycerol plus Acclimated Data on 11/25/2015
Cycle CTime OxOffT STime ETime Slope CC SNum Temp number (mins) (mins) (secs) (secs) (mg/L.hr) (oC)
1 15.38 2.850 0.0000 1504 5.690 -1.000 1504 22.20 2 46.36 29.32 583.0 1462 6.150 -1.000 879.0 22.60 3 89.42 77.20 427.0 1039 8.800 -1.000 612.0 23.40 4 106.5 96.00 364.0 895.0 10.15 -1.000 531.0 23.70 5 121.8 112.42 327.0 800.0 11.41 -1.000 473.0 24.00 6 135.7 127.3 294.0 719.0 12.72 -1.000 425.0 24.30 7 148.2 140.7 259.0 642.0 14.10 -1.000 383.0 24.50 8 158.6 152.7 176.0 529.0 15.31 -1.000 353.0 24.70 9 179.9 173.9 209.0 505.0 18.17 -1.000 296.0 25.00 10 189.5 183.9 199.0 476.0 19.49 -1.000 277.0 25.20 11 198.3 193.3 173.0 426.0 21.21 -1.000 253.0 25.30 12 206.9 202.0 175.0 417.0 22.23 -1.000 242.0 25.40 13 223.1 218.7 157.0 373.0 24.88 -1.000 216.0 25.60 14 230.6 226.5 148.0 354.0 26.31 -1.000 206.0 25.70 15 237.8 233.9 134.0 325.0 28.26 -1.000 191.0 25.80 16 244.7 240.9 135.0 318.0 29.42 -1.000 183.0 25.90 17 257.4 254.3 106.0 266.0 33.72 -1.000 160.0 26.10 18 263.4 260.3 111.0 265.0 34.98 -1.000 154.0 26.10 19 269.4 266.3 108.0 258.0 36.22 -1.000 150.0 26.20 20 274.9 272.1 930.0 238.0 38.29 -1.000 145.0 26.30 21 281.5 277.6 104.0 362.0 20.26 -0.9900 258.0 26.30 22 292.6 284.9 269.0 654.0 14.05 -1.000 385.0 26.50 23 315.9 308.8 247.0 604.0 15.14 -1.000 357.0 26.70 24 326.7 320.2 219.0 559.0 15.90 -1.000 340.0 26.80 25 336.7 330.8 200.0 520.0 16.85 -1.000 320.0 26.90 26 347.1 340.8 221.0 536.0 17.16 -1.000 315.0 27.00 27 357.3 351.0 224.0 532.0 17.31 -1.000 308.0 27.10 28 367.5 361.2 226.0 529.0 17.86 -1.000 303.0 27.10 29 386.5 381.1 184.0 465.0 19.23 -1.000 281.0 27.30 30 395.8 390.1 204.0 473.0 20.03 -1.000 269.0 27.30 31 404.5 399.2 186.0 445.0 20.84 -1.000 259.0 27.40 32 412.9 407.9 180.0 426.0 22.21 -1.000 246.0 27.40 33 420.8 416.2 154.0 399.0 22.06 -1.000 245.0 27.40 34 429.0 424.1 178.0 413.0 22.99 -1.000 235.0 27.40 35 437.0 432.3 174.0 401.0 23.82 -1.000 227.0 27.50 36 459.6 455.4 150.0 353.0 26.64 -1.000 203.0 27.60 37 466.7 462.5 153.0 352.0 27.14 -1.000 199.0 27.60 38 478.9 469.6 224.0 901.0 7.910 -1.000 677.0 27.60 39 502.0 485.7 565.0 1387 6.550 -1.000 822.0 27.70
Note: CTime= Current Time, OxoffT= Air off Time, STime= Start Time, CC= correlation coefficient, SNum= No. of Samples, Temp= Temperature (oC)
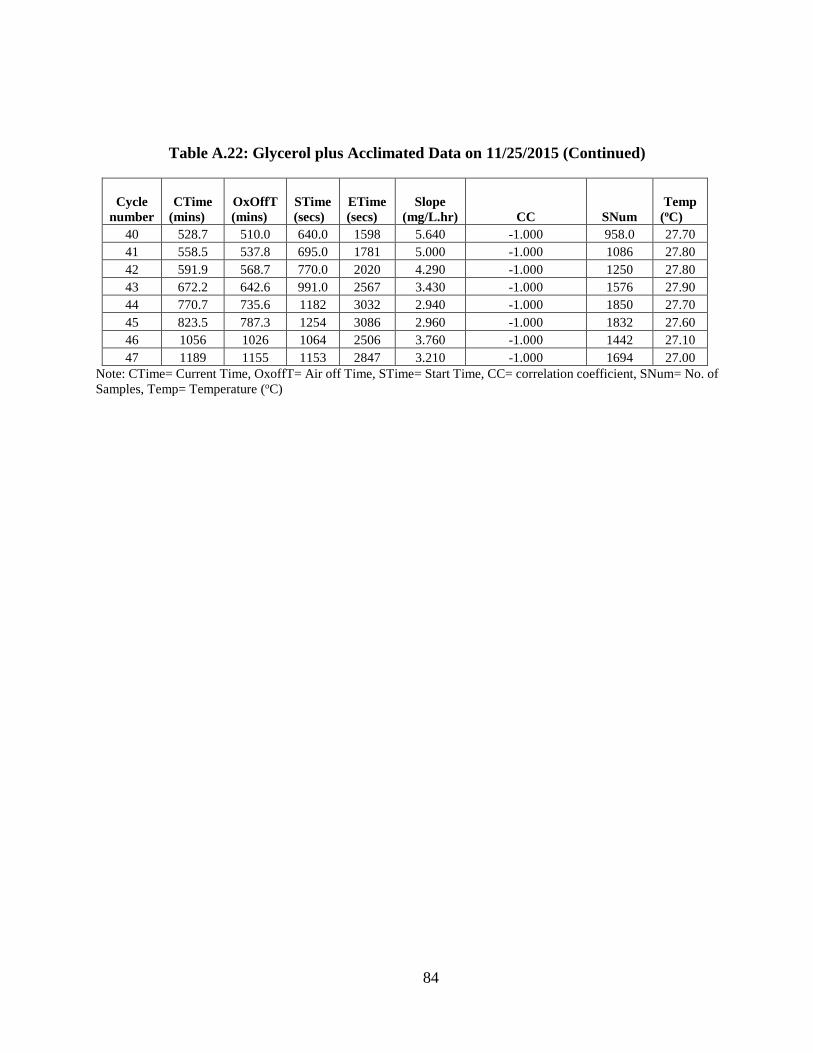
84
Table A.22: Glycerol plus Acclimated Data on 11/25/2015 (Continued)
Cycle number
CTime (mins)
OxOffT (mins)
STime (secs)
ETime (secs)
Slope (mg/L.hr) CC SNum
Temp (oC)
40 528.7 510.0 640.0 1598 5.640 -1.000 958.0 27.70 41 558.5 537.8 695.0 1781 5.000 -1.000 1086 27.80 42 591.9 568.7 770.0 2020 4.290 -1.000 1250 27.80 43 672.2 642.6 991.0 2567 3.430 -1.000 1576 27.90 44 770.7 735.6 1182 3032 2.940 -1.000 1850 27.70 45 823.5 787.3 1254 3086 2.960 -1.000 1832 27.60 46 1056 1026 1064 2506 3.760 -1.000 1442 27.10 47 1189 1155 1153 2847 3.210 -1.000 1694 27.00
Note: CTime= Current Time, OxoffT= Air off Time, STime= Start Time, CC= correlation coefficient, SNum= No. of Samples, Temp= Temperature (oC)
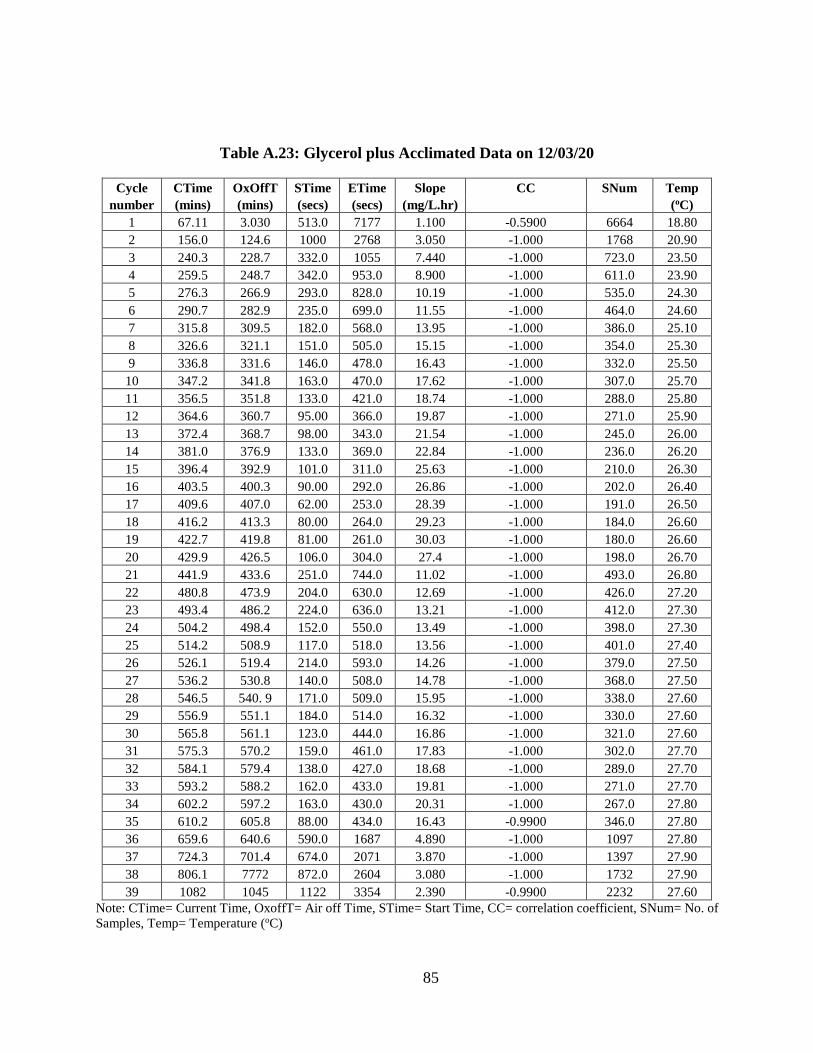
85
Table A.23: Glycerol plus Acclimated Data on 12/03/20
Cycle CTime OxOffT STime ETime Slope CC SNum Temp number (mins) (mins) (secs) (secs) (mg/L.hr) (oC)
1 67.11 3.030 513.0 7177 1.100 -0.5900 6664 18.80 2 156.0 124.6 1000 2768 3.050 -1.000 1768 20.90 3 240.3 228.7 332.0 1055 7.440 -1.000 723.0 23.50 4 259.5 248.7 342.0 953.0 8.900 -1.000 611.0 23.90 5 276.3 266.9 293.0 828.0 10.19 -1.000 535.0 24.30 6 290.7 282.9 235.0 699.0 11.55 -1.000 464.0 24.60 7 315.8 309.5 182.0 568.0 13.95 -1.000 386.0 25.10 8 326.6 321.1 151.0 505.0 15.15 -1.000 354.0 25.30 9 336.8 331.6 146.0 478.0 16.43 -1.000 332.0 25.50 10 347.2 341.8 163.0 470.0 17.62 -1.000 307.0 25.70 11 356.5 351.8 133.0 421.0 18.74 -1.000 288.0 25.80 12 364.6 360.7 95.00 366.0 19.87 -1.000 271.0 25.90 13 372.4 368.7 98.00 343.0 21.54 -1.000 245.0 26.00 14 381.0 376.9 133.0 369.0 22.84 -1.000 236.0 26.20 15 396.4 392.9 101.0 311.0 25.63 -1.000 210.0 26.30 16 403.5 400.3 90.00 292.0 26.86 -1.000 202.0 26.40 17 409.6 407.0 62.00 253.0 28.39 -1.000 191.0 26.50 18 416.2 413.3 80.00 264.0 29.23 -1.000 184.0 26.60 19 422.7 419.8 81.00 261.0 30.03 -1.000 180.0 26.60 20 429.9 426.5 106.0 304.0 27.4 -1.000 198.0 26.70 21 441.9 433.6 251.0 744.0 11.02 -1.000 493.0 26.80 22 480.8 473.9 204.0 630.0 12.69 -1.000 426.0 27.20 23 493.4 486.2 224.0 636.0 13.21 -1.000 412.0 27.30 24 504.2 498.4 152.0 550.0 13.49 -1.000 398.0 27.30 25 514.2 508.9 117.0 518.0 13.56 -1.000 401.0 27.40 26 526.1 519.4 214.0 593.0 14.26 -1.000 379.0 27.50 27 536.2 530.8 140.0 508.0 14.78 -1.000 368.0 27.50 28 546.5 540. 9 171.0 509.0 15.95 -1.000 338.0 27.60 29 556.9 551.1 184.0 514.0 16.32 -1.000 330.0 27.60 30 565.8 561.1 123.0 444.0 16.86 -1.000 321.0 27.60 31 575.3 570.2 159.0 461.0 17.83 -1.000 302.0 27.70 32 584.1 579.4 138.0 427.0 18.68 -1.000 289.0 27.70 33 593.2 588.2 162.0 433.0 19.81 -1.000 271.0 27.70 34 602.2 597.2 163.0 430.0 20.31 -1.000 267.0 27.80 35 610.2 605.8 88.00 434.0 16.43 -0.9900 346.0 27.80 36 659.6 640.6 590.0 1687 4.890 -1.000 1097 27.80 37 724.3 701.4 674.0 2071 3.870 -1.000 1397 27.90 38 806.1 7772 872.0 2604 3.080 -1.000 1732 27.90 39 1082 1045 1122 3354 2.390 -0.9900 2232 27.60
Note: CTime= Current Time, OxoffT= Air off Time, STime= Start Time, CC= correlation coefficient, SNum= No. of Samples, Temp= Temperature (oC)
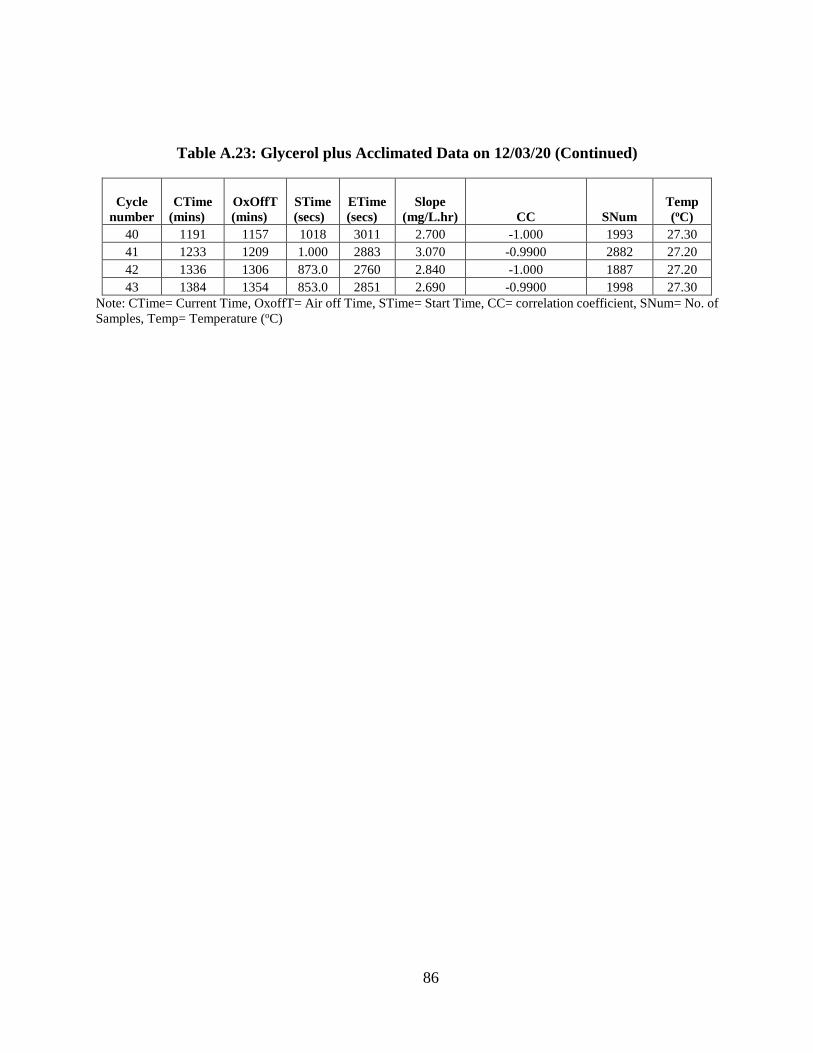
86
Table A.23: Glycerol plus Acclimated Data on 12/03/20 (Continued)
Cycle number
CTime (mins)
OxOffT (mins)
STime (secs)
ETime (secs)
Slope (mg/L.hr) CC SNum
Temp (oC)
40 1191 1157 1018 3011 2.700 -1.000 1993 27.30 41 1233 1209 1.000 2883 3.070 -0.9900 2882 27.20 42 1336 1306 873.0 2760 2.840 -1.000 1887 27.20 43 1384 1354 853.0 2851 2.690 -0.9900 1998 27.30
Note: CTime= Current Time, OxoffT= Air off Time, STime= Start Time, CC= correlation coefficient, SNum= No. of Samples, Temp= Temperature (oC)
87
APPENDIX H: GLYCEROL EFFECT
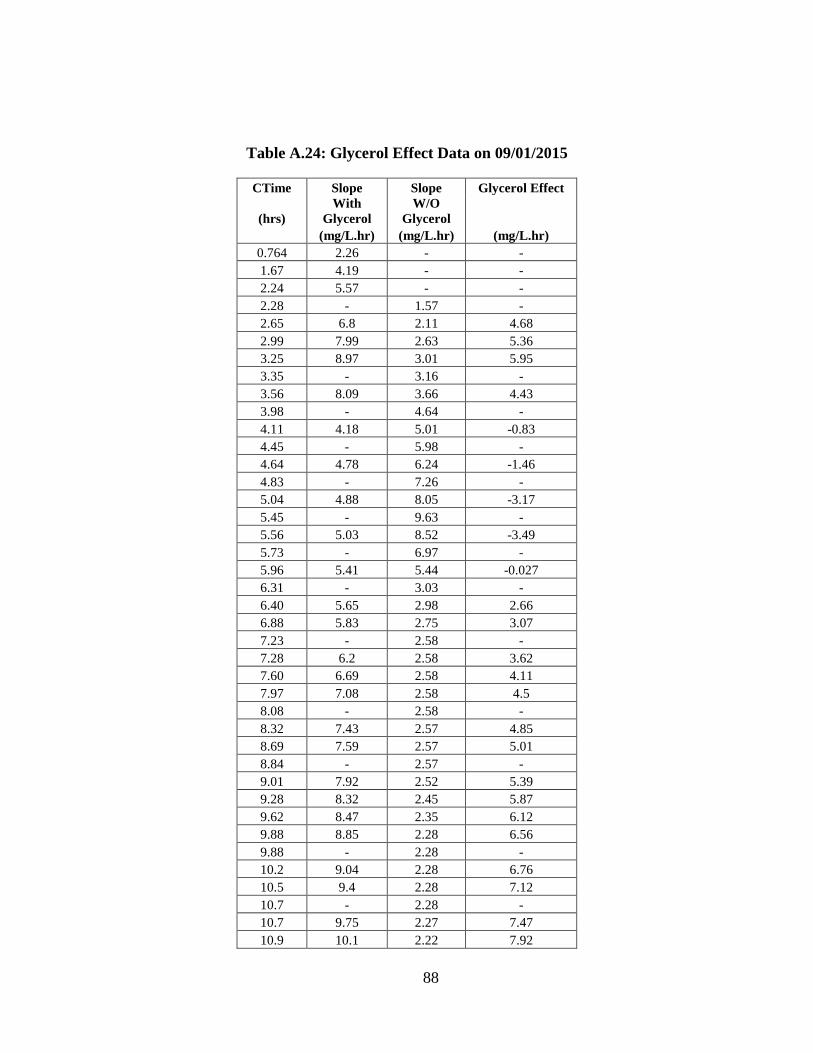
88
Table A.24: Glycerol Effect Data on 09/01/2015
CTime Slope Slope Glycerol Effect
(hrs) With
Glycerol W/O
Glycerol (mg/L.hr) (mg/L.hr) (mg/L.hr)
0.764 2.26 - - 1.67 4.19 - - 2.24 5.57 - - 2.28 - 1.57 - 2.65 6.8 2.11 4.68 2.99 7.99 2.63 5.36 3.25 8.97 3.01 5.95 3.35 - 3.16 - 3.56 8.09 3.66 4.43 3.98 - 4.64 - 4.11 4.18 5.01 -0.83 4.45 - 5.98 - 4.64 4.78 6.24 -1.46 4.83 - 7.26 - 5.04 4.88 8.05 -3.17 5.45 - 9.63 - 5.56 5.03 8.52 -3.49 5.73 - 6.97 - 5.96 5.41 5.44 -0.027 6.31 - 3.03 - 6.40 5.65 2.98 2.66 6.88 5.83 2.75 3.07 7.23 - 2.58 - 7.28 6.2 2.58 3.62 7.60 6.69 2.58 4.11 7.97 7.08 2.58 4.5 8.08 - 2.58 - 8.32 7.43 2.57 4.85 8.69 7.59 2.57 5.01 8.84 - 2.57 - 9.01 7.92 2.52 5.39 9.28 8.32 2.45 5.87 9.62 8.47 2.35 6.12 9.88 8.85 2.28 6.56 9.88 - 2.28 - 10.2 9.04 2.28 6.76 10.5 9.4 2.28 7.12 10.7 - 2.28 - 10.7 9.75 2.27 7.47 10.9 10.1 2.22 7.92
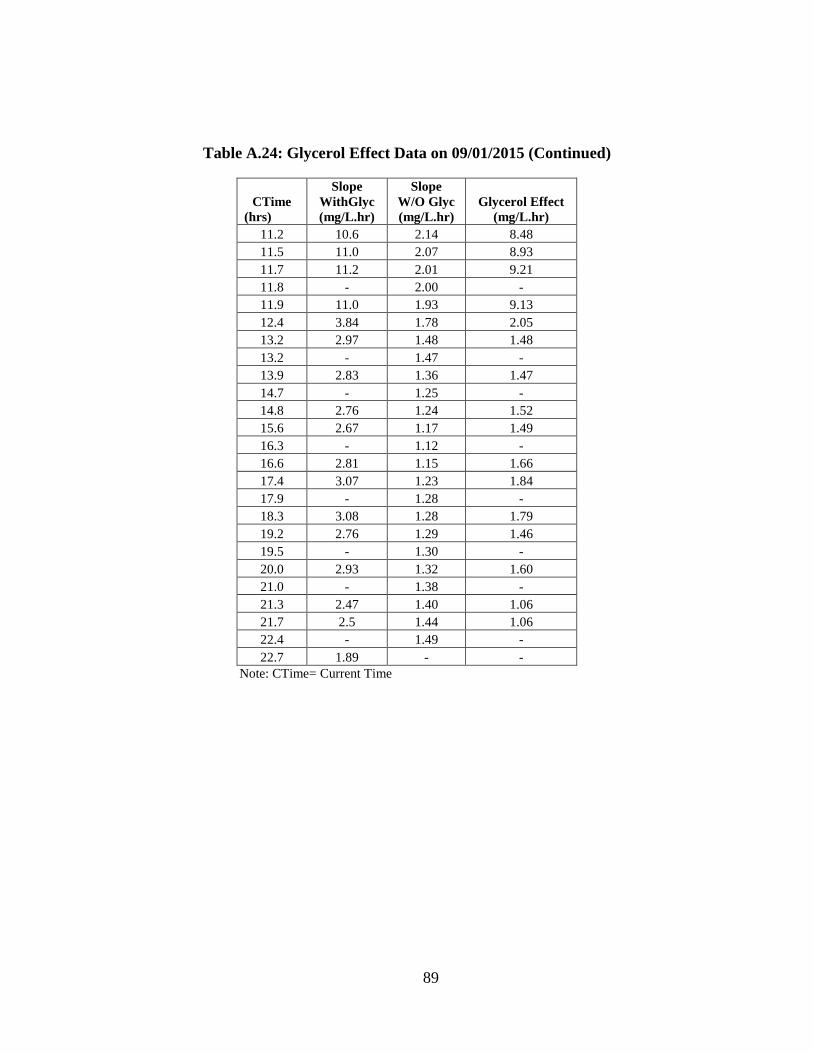
89
Table A.24: Glycerol Effect Data on 09/01/2015 (Continued)
CTime (hrs)
Slope WithGlyc (mg/L.hr)
Slope W/O Glyc (mg/L.hr)
Glycerol Effect (mg/L.hr)
11.2 10.6 2.14 8.48 11.5 11.0 2.07 8.93 11.7 11.2 2.01 9.21 11.8 - 2.00 - 11.9 11.0 1.93 9.13 12.4 3.84 1.78 2.05 13.2 2.97 1.48 1.48 13.2 - 1.47 - 13.9 2.83 1.36 1.47 14.7 - 1.25 - 14.8 2.76 1.24 1.52 15.6 2.67 1.17 1.49 16.3 - 1.12 - 16.6 2.81 1.15 1.66 17.4 3.07 1.23 1.84 17.9 - 1.28 - 18.3 3.08 1.28 1.79 19.2 2.76 1.29 1.46 19.5 - 1.30 - 20.0 2.93 1.32 1.60 21.0 - 1.38 - 21.3 2.47 1.40 1.06 21.7 2.5 1.44 1.06 22.4 - 1.49 - 22.7 1.89 - -
Note: CTime= Current Time
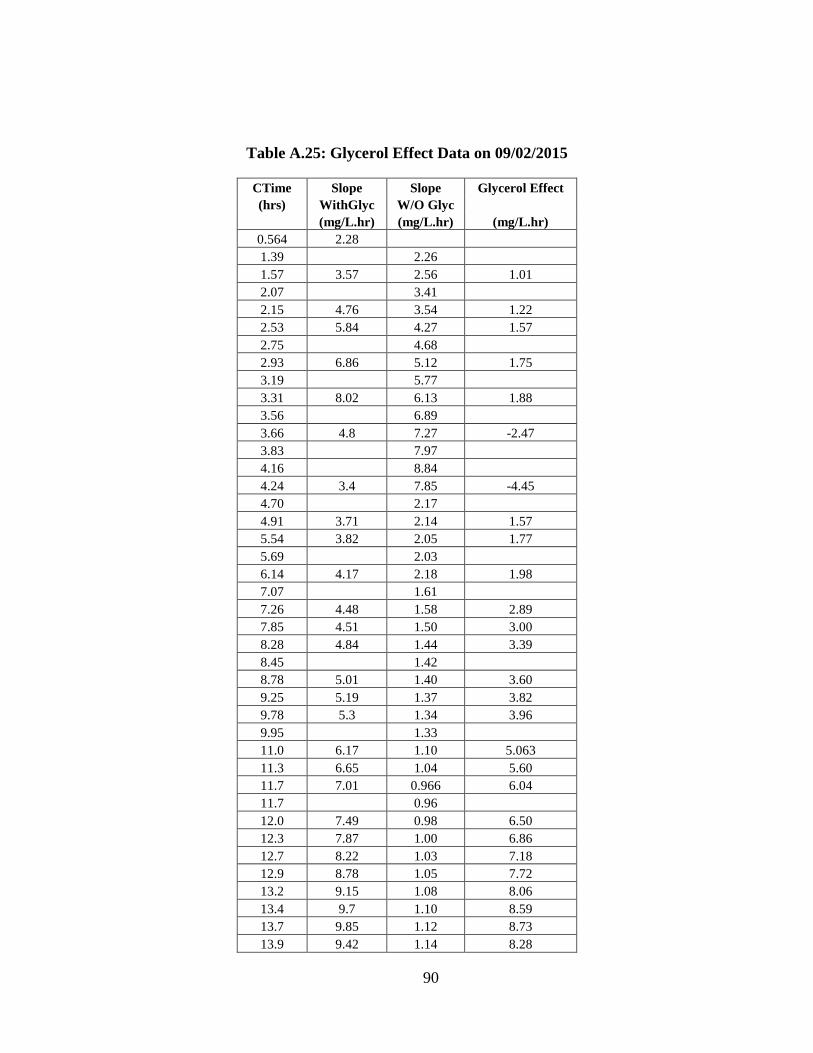
90
Table A.25: Glycerol Effect Data on 09/02/2015
CTime Slope Slope Glycerol Effect (hrs) WithGlyc W/O Glyc
(mg/L.hr) (mg/L.hr) (mg/L.hr) 0.564 2.28 1.39 2.26 1.57 3.57 2.56 1.01 2.07 3.41 2.15 4.76 3.54 1.22 2.53 5.84 4.27 1.57 2.75 4.68 2.93 6.86 5.12 1.75 3.19 5.77 3.31 8.02 6.13 1.88 3.56 6.89 3.66 4.8 7.27 -2.47 3.83 7.97 4.16 8.84 4.24 3.4 7.85 -4.45 4.70 2.17 4.91 3.71 2.14 1.57 5.54 3.82 2.05 1.77 5.69 2.03 6.14 4.17 2.18 1.98 7.07 1.61 7.26 4.48 1.58 2.89 7.85 4.51 1.50 3.00 8.28 4.84 1.44 3.39 8.45 1.42 8.78 5.01 1.40 3.60 9.25 5.19 1.37 3.82 9.78 5.3 1.34 3.96 9.95 1.33 11.0 6.17 1.10 5.063 11.3 6.65 1.04 5.60 11.7 7.01 0.966 6.04 11.7 0.96 12.0 7.49 0.98 6.50 12.3 7.87 1.00 6.86 12.7 8.22 1.03 7.18 12.9 8.78 1.05 7.72 13.2 9.15 1.08 8.06 13.4 9.7 1.10 8.59 13.7 9.85 1.12 8.73 13.9 9.42 1.14 8.28
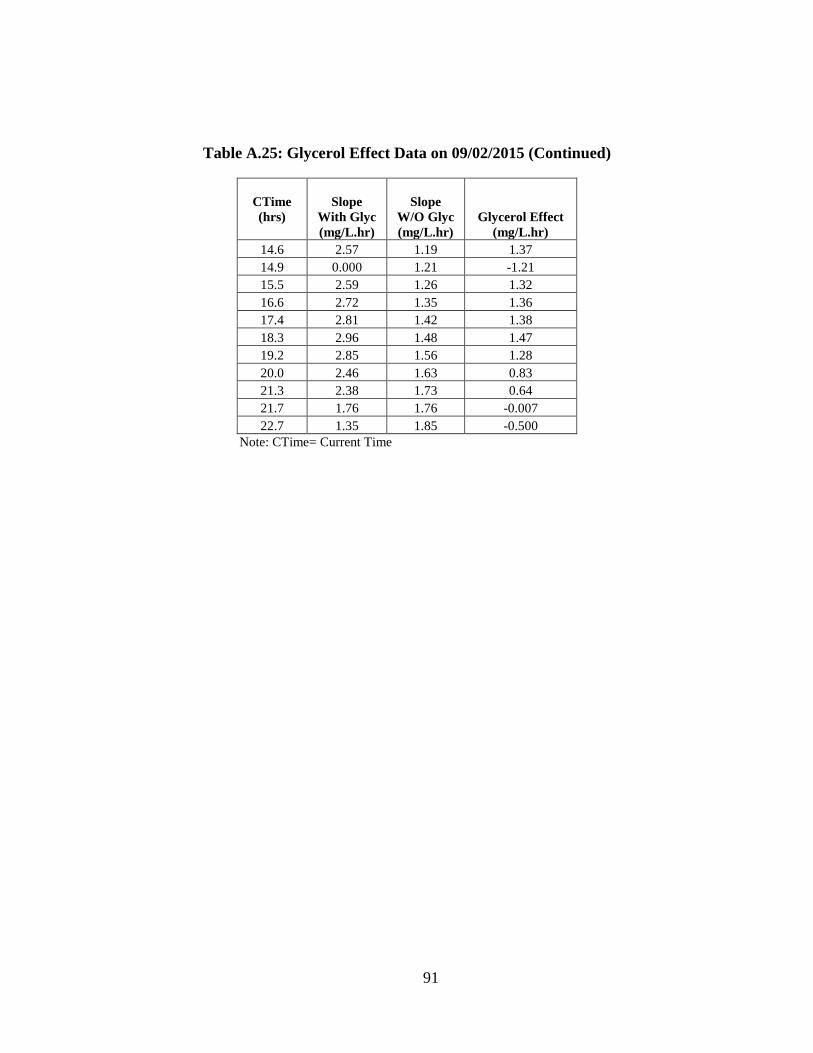
91
Table A.25: Glycerol Effect Data on 09/02/2015 (Continued)
CTime (hrs)
Slope With Glyc (mg/L.hr)
Slope W/O Glyc (mg/L.hr)
Glycerol Effect (mg/L.hr)
14.6 2.57 1.19 1.37 14.9 0.000 1.21 -1.21 15.5 2.59 1.26 1.32 16.6 2.72 1.35 1.36 17.4 2.81 1.42 1.38 18.3 2.96 1.48 1.47 19.2 2.85 1.56 1.28 20.0 2.46 1.63 0.83 21.3 2.38 1.73 0.64 21.7 1.76 1.76 -0.007 22.7 1.35 1.85 -0.500
Note: CTime= Current Time
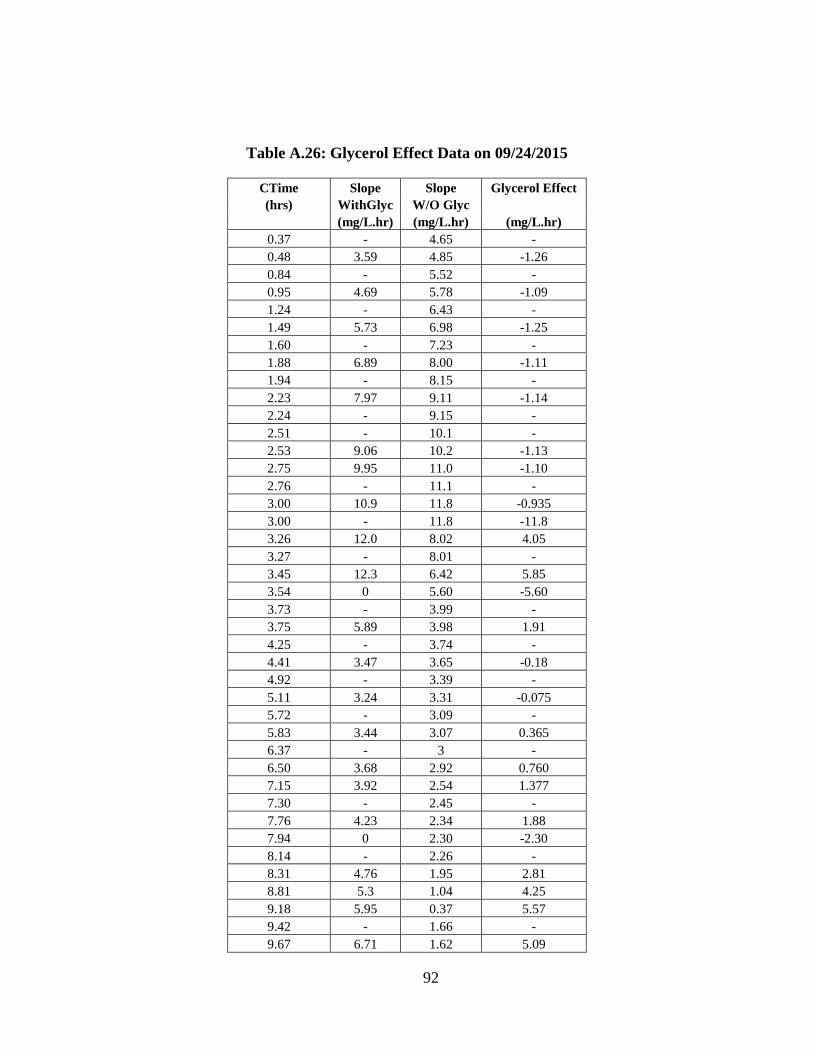
92
Table A.26: Glycerol Effect Data on 09/24/2015
CTime Slope Slope Glycerol Effect (hrs) WithGlyc W/O Glyc
(mg/L.hr) (mg/L.hr) (mg/L.hr) 0.37 - 4.65 - 0.48 3.59 4.85 -1.26 0.84 - 5.52 - 0.95 4.69 5.78 -1.09 1.24 - 6.43 - 1.49 5.73 6.98 -1.25 1.60 - 7.23 - 1.88 6.89 8.00 -1.11 1.94 - 8.15 - 2.23 7.97 9.11 -1.14 2.24 - 9.15 - 2.51 - 10.1 - 2.53 9.06 10.2 -1.13 2.75 9.95 11.0 -1.10 2.76 - 11.1 - 3.00 10.9 11.8 -0.935 3.00 - 11.8 -11.8 3.26 12.0 8.02 4.05 3.27 - 8.01 - 3.45 12.3 6.42 5.85 3.54 0 5.60 -5.60 3.73 - 3.99 - 3.75 5.89 3.98 1.91 4.25 - 3.74 - 4.41 3.47 3.65 -0.18 4.92 - 3.39 - 5.11 3.24 3.31 -0.075 5.72 - 3.09 - 5.83 3.44 3.07 0.365 6.37 - 3 - 6.50 3.68 2.92 0.760 7.15 3.92 2.54 1.377 7.30 - 2.45 - 7.76 4.23 2.34 1.88 7.94 0 2.30 -2.30 8.14 - 2.26 - 8.31 4.76 1.95 2.81 8.81 5.3 1.04 4.25 9.18 5.95 0.37 5.57 9.42 - 1.66 - 9.67 6.71 1.62 5.09
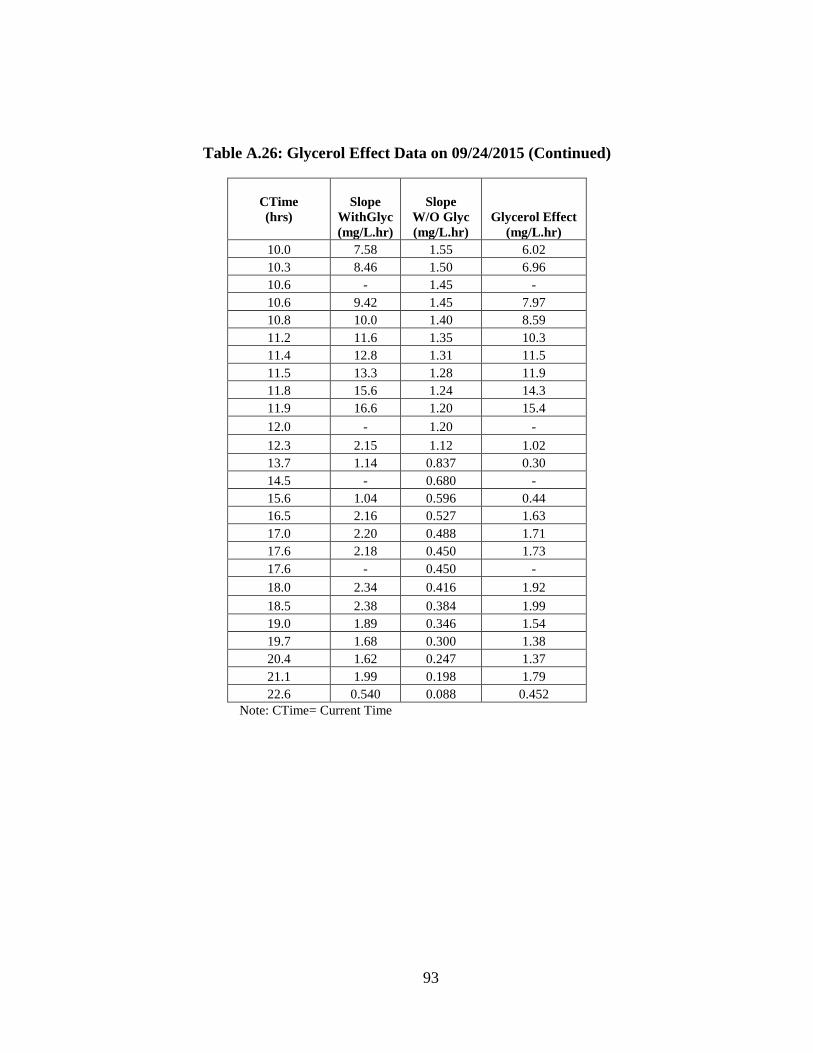
93
Table A.26: Glycerol Effect Data on 09/24/2015 (Continued)
CTime (hrs)
Slope WithGlyc (mg/L.hr)
Slope W/O Glyc (mg/L.hr)
Glycerol Effect (mg/L.hr)
10.0 7.58 1.55 6.02 10.3 8.46 1.50 6.96 10.6 - 1.45 - 10.6 9.42 1.45 7.97 10.8 10.0 1.40 8.59 11.2 11.6 1.35 10.3 11.4 12.8 1.31 11.5 11.5 13.3 1.28 11.9 11.8 15.6 1.24 14.3 11.9 16.6 1.20 15.4 12.0 - 1.20 - 12.3 2.15 1.12 1.02 13.7 1.14 0.837 0.30 14.5 - 0.680 - 15.6 1.04 0.596 0.44 16.5 2.16 0.527 1.63 17.0 2.20 0.488 1.71 17.6 2.18 0.450 1.73 17.6 - 0.450 - 18.0 2.34 0.416 1.92 18.5 2.38 0.384 1.99 19.0 1.89 0.346 1.54 19.7 1.68 0.300 1.38 20.4 1.62 0.247 1.37 21.1 1.99 0.198 1.79 22.6 0.540 0.088 0.452
Note: CTime= Current Time
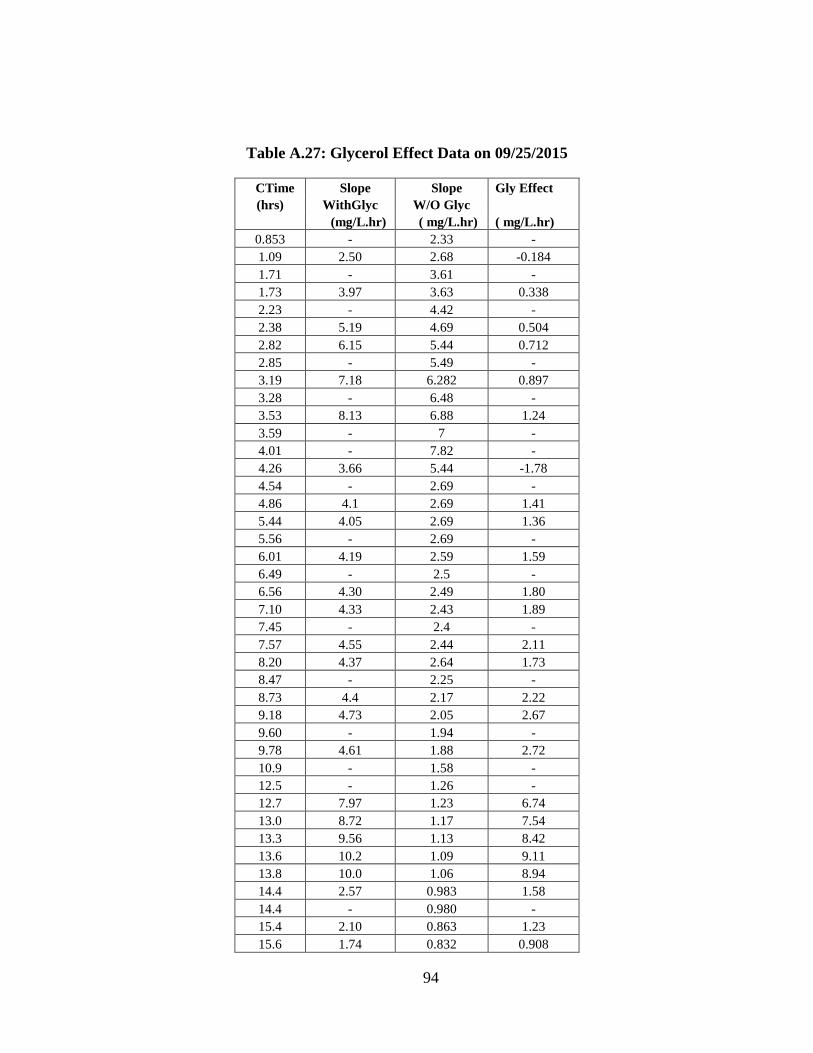
94
Table A.27: Glycerol Effect Data on 09/25/2015
CTime Slope Slope Gly Effect (hrs) WithGlyc W/O Glyc
(mg/L.hr) ( mg/L.hr) ( mg/L.hr) 0.853 - 2.33 - 1.09 2.50 2.68 -0.184 1.71 - 3.61 - 1.73 3.97 3.63 0.338 2.23 - 4.42 - 2.38 5.19 4.69 0.504 2.82 6.15 5.44 0.712 2.85 - 5.49 - 3.19 7.18 6.282 0.897 3.28 - 6.48 - 3.53 8.13 6.88 1.24 3.59 - 7 - 4.01 - 7.82 - 4.26 3.66 5.44 -1.78 4.54 - 2.69 - 4.86 4.1 2.69 1.41 5.44 4.05 2.69 1.36 5.56 - 2.69 - 6.01 4.19 2.59 1.59 6.49 - 2.5 - 6.56 4.30 2.49 1.80 7.10 4.33 2.43 1.89 7.45 - 2.4 - 7.57 4.55 2.44 2.11 8.20 4.37 2.64 1.73 8.47 - 2.25 - 8.73 4.4 2.17 2.22 9.18 4.73 2.05 2.67 9.60 - 1.94 - 9.78 4.61 1.88 2.72 10.9 - 1.58 - 12.5 - 1.26 - 12.7 7.97 1.23 6.74 13.0 8.72 1.17 7.54 13.3 9.56 1.13 8.42 13.6 10.2 1.09 9.11 13.8 10.0 1.06 8.94 14.4 2.57 0.983 1.58 14.4 - 0.980 - 15.4 2.10 0.863 1.23 15.6 1.74 0.832 0.908
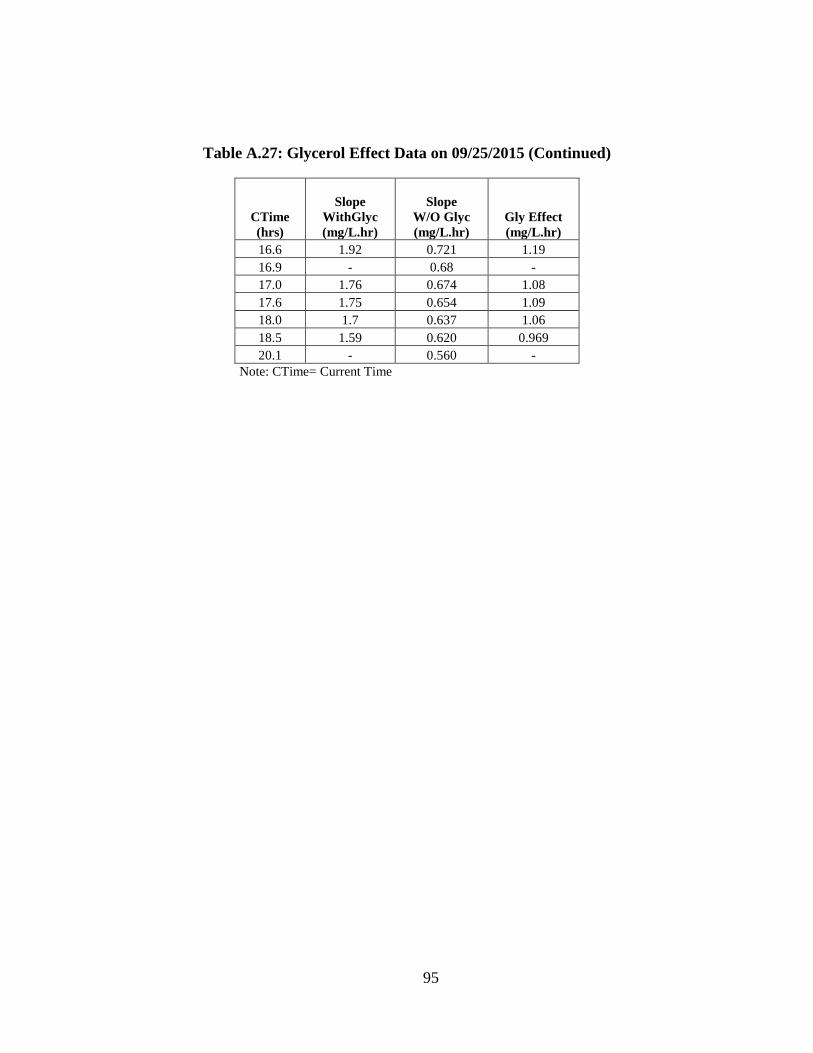
95
Table A.27: Glycerol Effect Data on 09/25/2015 (Continued)
CTime (hrs)
Slope WithGlyc (mg/L.hr)
Slope W/O Glyc (mg/L.hr)
Gly Effect (mg/L.hr)
16.6 1.92 0.721 1.19 16.9 - 0.68 - 17.0 1.76 0.674 1.08 17.6 1.75 0.654 1.09 18.0 1.7 0.637 1.06 18.5 1.59 0.620 0.969 20.1 - 0.560 -
Note: CTime= Current Time
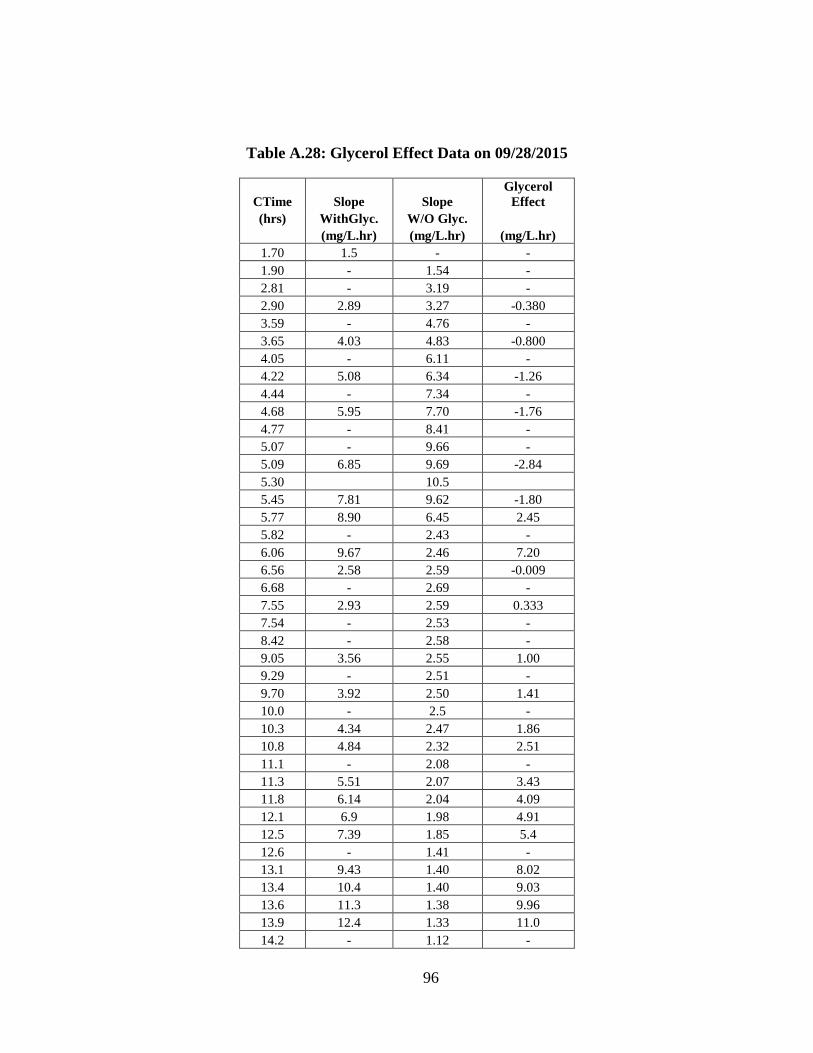
96
Table A.28: Glycerol Effect Data on 09/28/2015
CTime Slope Slope Glycerol
Effect (hrs) WithGlyc. W/O Glyc.
(mg/L.hr) (mg/L.hr) (mg/L.hr) 1.70 1.5 - - 1.90 - 1.54 - 2.81 - 3.19 - 2.90 2.89 3.27 -0.380 3.59 - 4.76 - 3.65 4.03 4.83 -0.800 4.05 - 6.11 - 4.22 5.08 6.34 -1.26 4.44 - 7.34 - 4.68 5.95 7.70 -1.76 4.77 - 8.41 - 5.07 - 9.66 - 5.09 6.85 9.69 -2.84 5.30 10.5 5.45 7.81 9.62 -1.80 5.77 8.90 6.45 2.45 5.82 - 2.43 - 6.06 9.67 2.46 7.20 6.56 2.58 2.59 -0.009 6.68 - 2.69 - 7.55 2.93 2.59 0.333 7.54 - 2.53 - 8.42 - 2.58 - 9.05 3.56 2.55 1.00 9.29 - 2.51 - 9.70 3.92 2.50 1.41 10.0 - 2.5 - 10.3 4.34 2.47 1.86 10.8 4.84 2.32 2.51 11.1 - 2.08 - 11.3 5.51 2.07 3.43 11.8 6.14 2.04 4.09 12.1 6.9 1.98 4.91 12.5 7.39 1.85 5.4 12.6 - 1.41 - 13.1 9.43 1.40 8.02 13.4 10.4 1.40 9.03 13.6 11.3 1.38 9.96 13.9 12.4 1.33 11.0 14.2 - 1.12 -
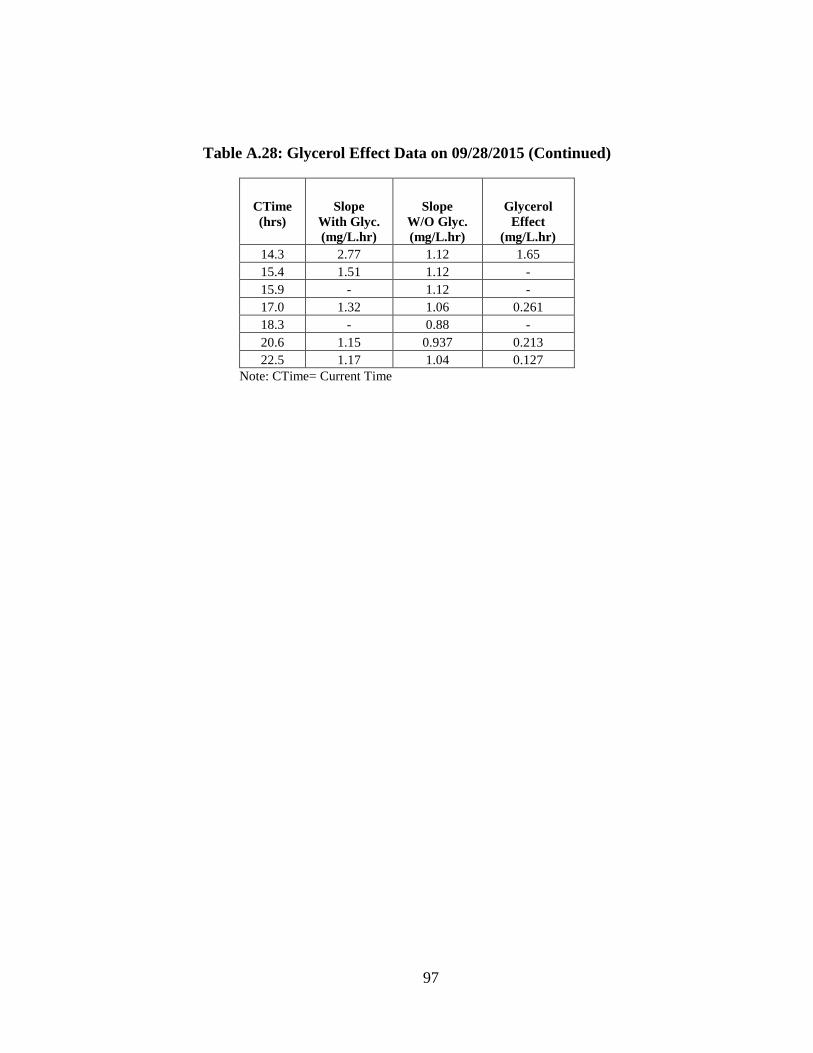
97
Table A.28: Glycerol Effect Data on 09/28/2015 (Continued)
CTime (hrs)
Slope With Glyc. (mg/L.hr)
Slope W/O Glyc. (mg/L.hr)
Glycerol Effect
(mg/L.hr) 14.3 2.77 1.12 1.65 15.4 1.51 1.12 - 15.9 - 1.12 - 17.0 1.32 1.06 0.261 18.3 - 0.88 - 20.6 1.15 0.937 0.213 22.5 1.17 1.04 0.127
Note: CTime= Current Time
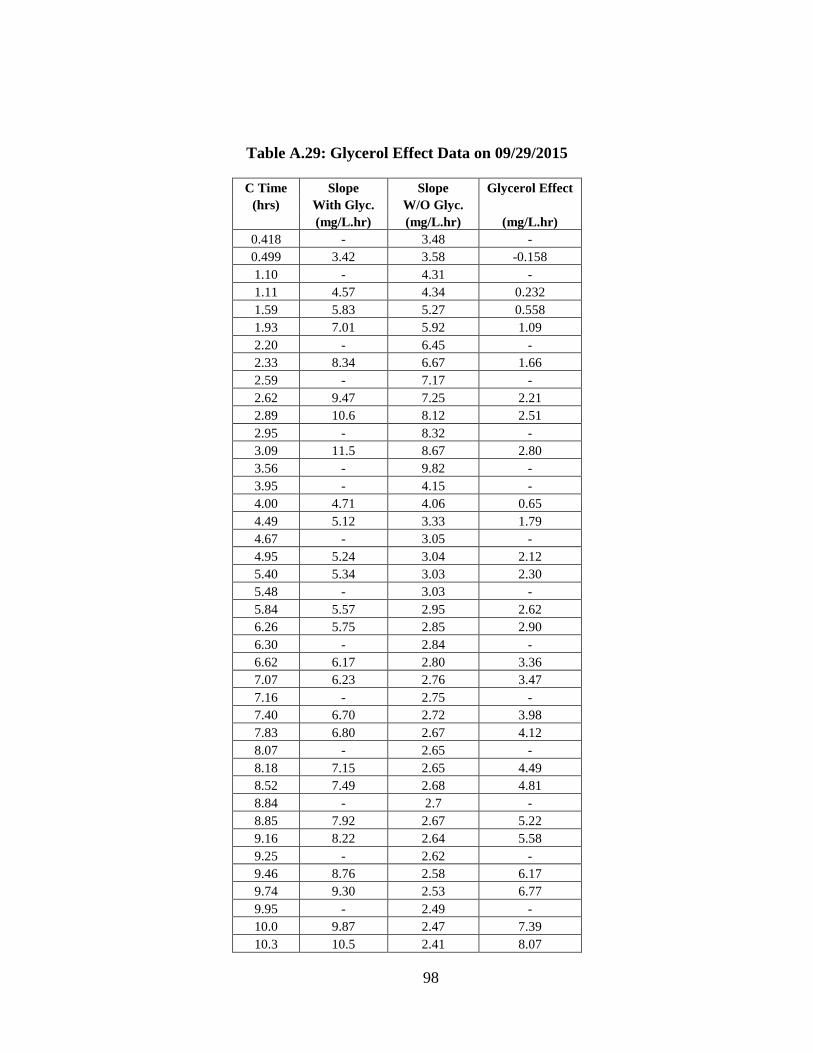
98
Table A.29: Glycerol Effect Data on 09/29/2015
C Time Slope Slope Glycerol Effect (hrs) With Glyc. W/O Glyc.
(mg/L.hr) (mg/L.hr) (mg/L.hr) 0.418 - 3.48 - 0.499 3.42 3.58 -0.158 1.10 - 4.31 - 1.11 4.57 4.34 0.232 1.59 5.83 5.27 0.558 1.93 7.01 5.92 1.09 2.20 - 6.45 - 2.33 8.34 6.67 1.66 2.59 - 7.17 - 2.62 9.47 7.25 2.21 2.89 10.6 8.12 2.51 2.95 - 8.32 - 3.09 11.5 8.67 2.80 3.56 - 9.82 - 3.95 - 4.15 - 4.00 4.71 4.06 0.65 4.49 5.12 3.33 1.79 4.67 - 3.05 - 4.95 5.24 3.04 2.12 5.40 5.34 3.03 2.30 5.48 - 3.03 - 5.84 5.57 2.95 2.62 6.26 5.75 2.85 2.90 6.30 - 2.84 - 6.62 6.17 2.80 3.36 7.07 6.23 2.76 3.47 7.16 - 2.75 - 7.40 6.70 2.72 3.98 7.83 6.80 2.67 4.12 8.07 - 2.65 - 8.18 7.15 2.65 4.49 8.52 7.49 2.68 4.81 8.84 - 2.7 - 8.85 7.92 2.67 5.22 9.16 8.22 2.64 5.58 9.25 - 2.62 - 9.46 8.76 2.58 6.17 9.74 9.30 2.53 6.77 9.95 - 2.49 - 10.0 9.87 2.47 7.39 10.3 10.5 2.41 8.07
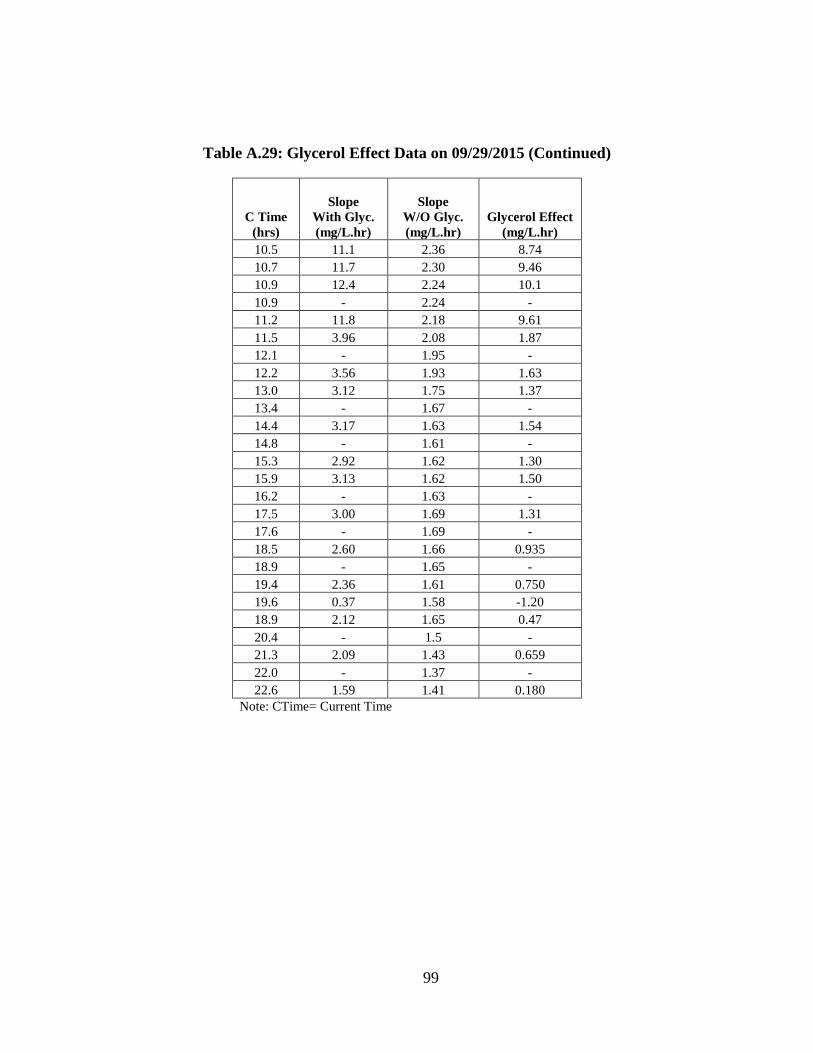
99
Table A.29: Glycerol Effect Data on 09/29/2015 (Continued)
C Time (hrs)
Slope With Glyc. (mg/L.hr)
Slope W/O Glyc. (mg/L.hr)
Glycerol Effect (mg/L.hr)
10.5 11.1 2.36 8.74 10.7 11.7 2.30 9.46 10.9 12.4 2.24 10.1 10.9 - 2.24 - 11.2 11.8 2.18 9.61 11.5 3.96 2.08 1.87 12.1 - 1.95 - 12.2 3.56 1.93 1.63 13.0 3.12 1.75 1.37 13.4 - 1.67 - 14.4 3.17 1.63 1.54 14.8 - 1.61 - 15.3 2.92 1.62 1.30 15.9 3.13 1.62 1.50 16.2 - 1.63 - 17.5 3.00 1.69 1.31 17.6 - 1.69 - 18.5 2.60 1.66 0.935 18.9 - 1.65 - 19.4 2.36 1.61 0.750 19.6 0.37 1.58 -1.20 18.9 2.12 1.65 0.47 20.4 - 1.5 - 21.3 2.09 1.43 0.659 22.0 - 1.37 - 22.6 1.59 1.41 0.180
Note: CTime= Current Time
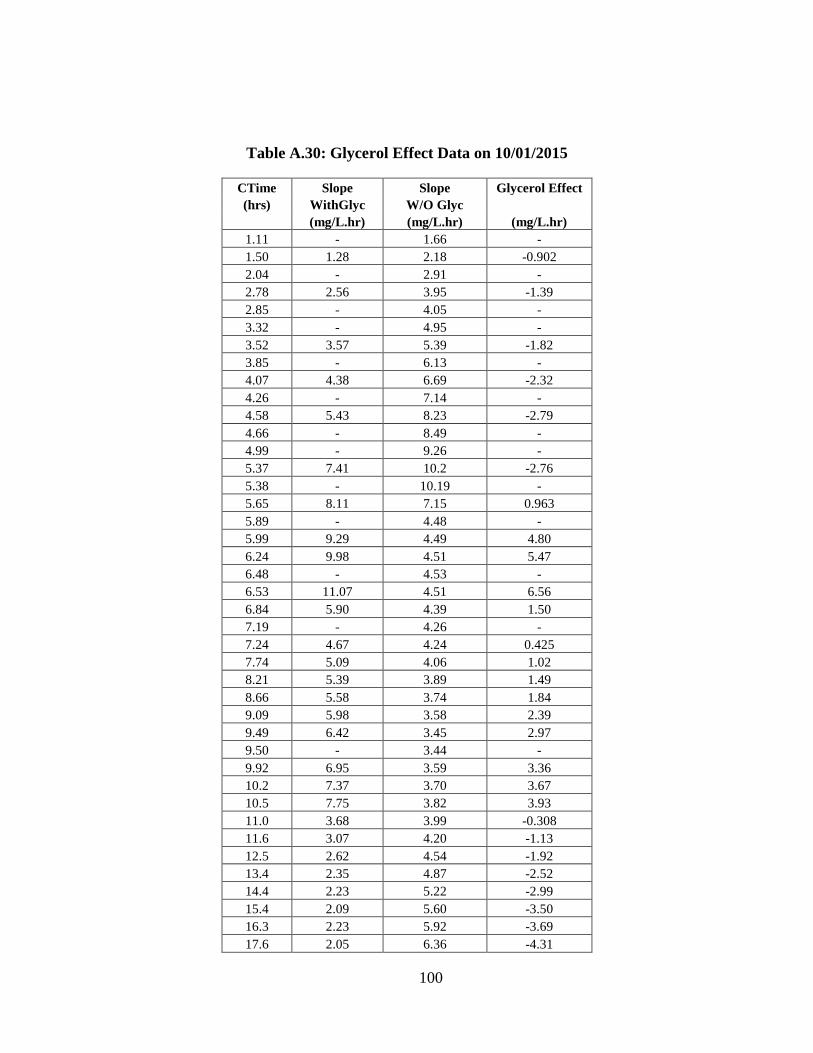
100
Table A.30: Glycerol Effect Data on 10/01/2015
CTime Slope Slope Glycerol Effect (hrs) WithGlyc W/O Glyc
(mg/L.hr) (mg/L.hr) (mg/L.hr) 1.11 - 1.66 - 1.50 1.28 2.18 -0.902 2.04 - 2.91 - 2.78 2.56 3.95 -1.39 2.85 - 4.05 - 3.32 - 4.95 - 3.52 3.57 5.39 -1.82 3.85 - 6.13 - 4.07 4.38 6.69 -2.32 4.26 - 7.14 - 4.58 5.43 8.23 -2.79 4.66 - 8.49 - 4.99 - 9.26 - 5.37 7.41 10.2 -2.76 5.38 - 10.19 - 5.65 8.11 7.15 0.963 5.89 - 4.48 - 5.99 9.29 4.49 4.80 6.24 9.98 4.51 5.47 6.48 - 4.53 - 6.53 11.07 4.51 6.56 6.84 5.90 4.39 1.50 7.19 - 4.26 - 7.24 4.67 4.24 0.425 7.74 5.09 4.06 1.02 8.21 5.39 3.89 1.49 8.66 5.58 3.74 1.84 9.09 5.98 3.58 2.39 9.49 6.42 3.45 2.97 9.50 - 3.44 - 9.92 6.95 3.59 3.36 10.2 7.37 3.70 3.67 10.5 7.75 3.82 3.93 11.0 3.68 3.99 -0.308 11.6 3.07 4.20 -1.13 12.5 2.62 4.54 -1.92 13.4 2.35 4.87 -2.52 14.4 2.23 5.22 -2.99 15.4 2.09 5.60 -3.50 16.3 2.23 5.92 -3.69 17.6 2.05 6.36 -4.31
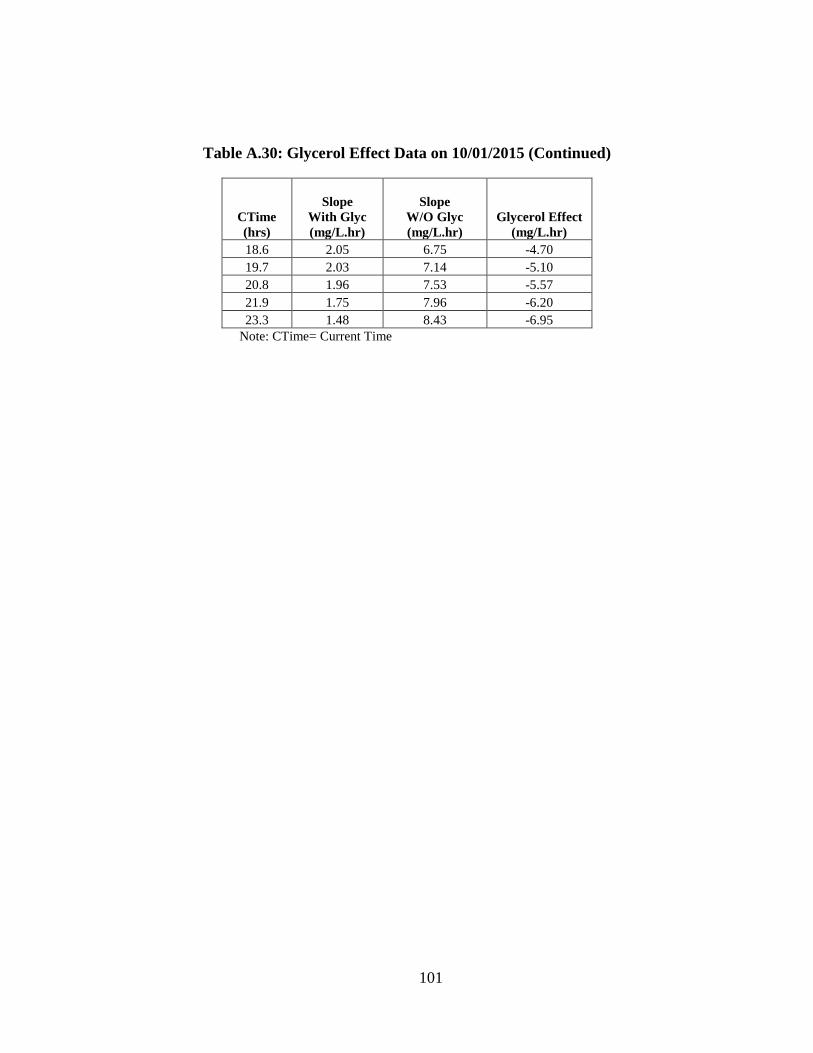
101
Table A.30: Glycerol Effect Data on 10/01/2015 (Continued)
CTime (hrs)
Slope With Glyc (mg/L.hr)
Slope W/O Glyc (mg/L.hr)
Glycerol Effect (mg/L.hr)
18.6 2.05 6.75 -4.70 19.7 2.03 7.14 -5.10 20.8 1.96 7.53 -5.57 21.9 1.75 7.96 -6.20 23.3 1.48 8.43 -6.95
Note: CTime= Current Time
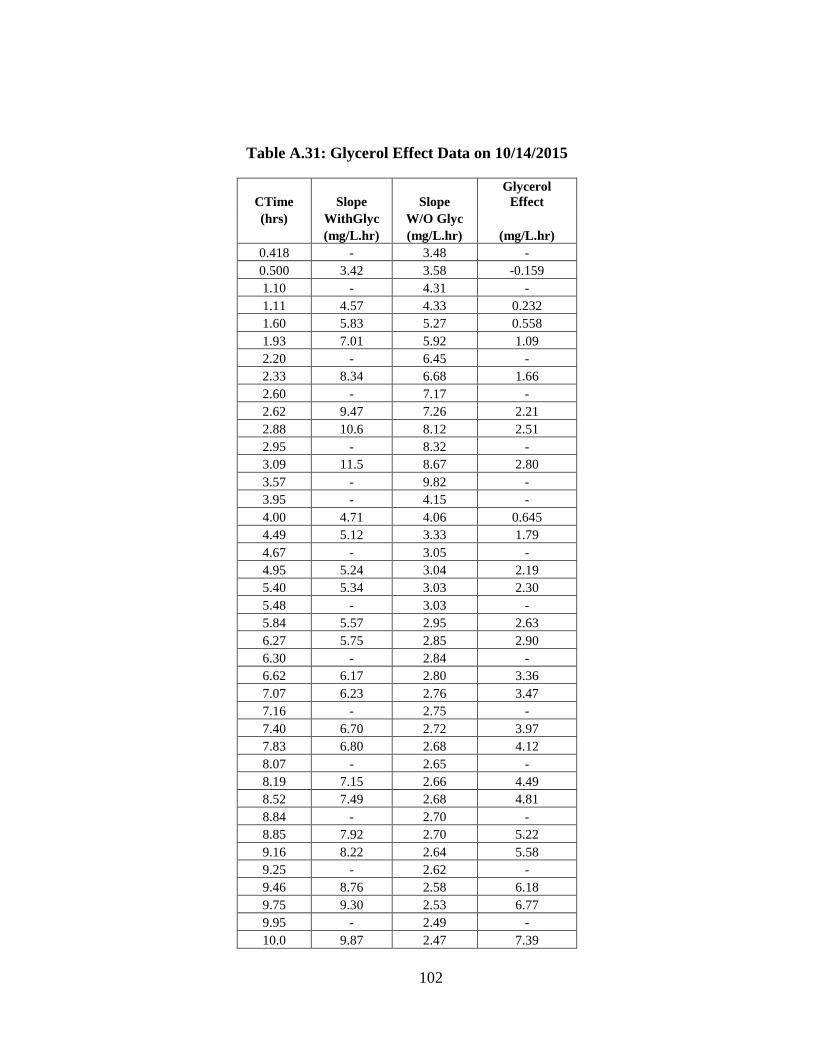
102
Table A.31: Glycerol Effect Data on 10/14/2015
CTime Slope Slope Glycerol
Effect (hrs) WithGlyc W/O Glyc
(mg/L.hr) (mg/L.hr) (mg/L.hr) 0.418 - 3.48 - 0.500 3.42 3.58 -0.159 1.10 - 4.31 - 1.11 4.57 4.33 0.232 1.60 5.83 5.27 0.558 1.93 7.01 5.92 1.09 2.20 - 6.45 - 2.33 8.34 6.68 1.66 2.60 - 7.17 - 2.62 9.47 7.26 2.21 2.88 10.6 8.12 2.51 2.95 - 8.32 - 3.09 11.5 8.67 2.80 3.57 - 9.82 - 3.95 - 4.15 - 4.00 4.71 4.06 0.645 4.49 5.12 3.33 1.79 4.67 - 3.05 - 4.95 5.24 3.04 2.19 5.40 5.34 3.03 2.30 5.48 - 3.03 - 5.84 5.57 2.95 2.63 6.27 5.75 2.85 2.90 6.30 - 2.84 - 6.62 6.17 2.80 3.36 7.07 6.23 2.76 3.47 7.16 - 2.75 - 7.40 6.70 2.72 3.97 7.83 6.80 2.68 4.12 8.07 - 2.65 - 8.19 7.15 2.66 4.49 8.52 7.49 2.68 4.81 8.84 - 2.70 - 8.85 7.92 2.70 5.22 9.16 8.22 2.64 5.58 9.25 - 2.62 - 9.46 8.76 2.58 6.18 9.75 9.30 2.53 6.77 9.95 - 2.49 - 10.0 9.87 2.47 7.39
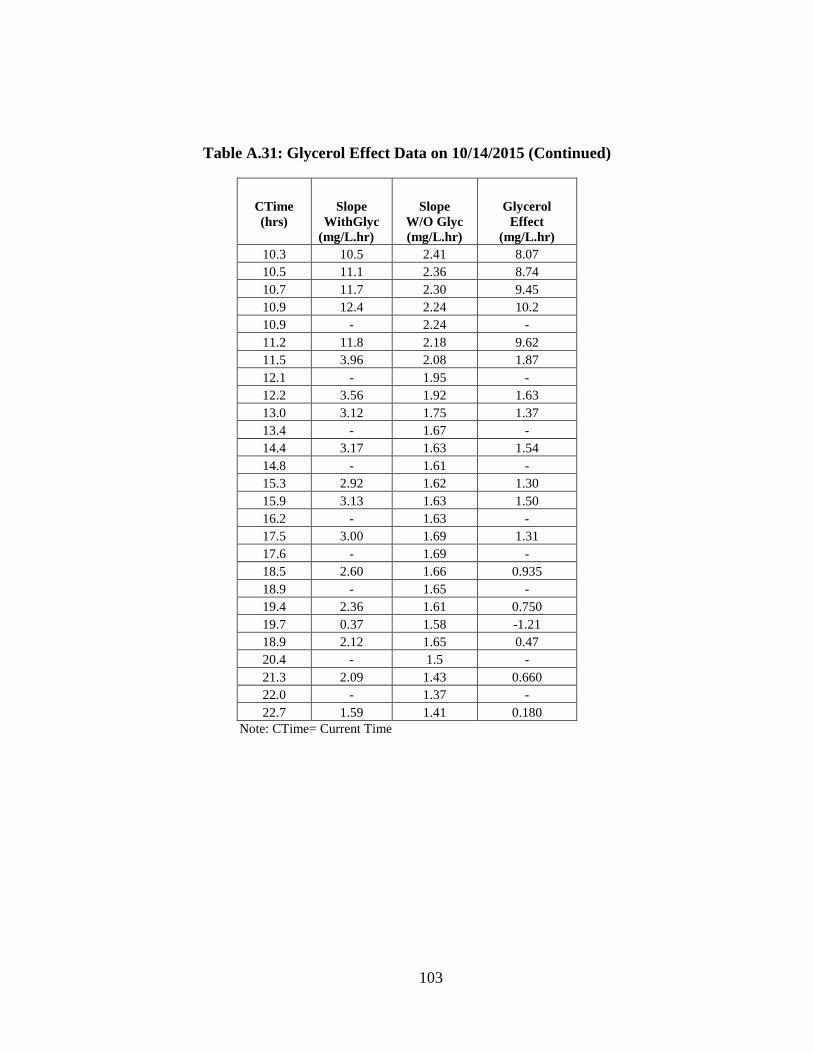
103
Table A.31: Glycerol Effect Data on 10/14/2015 (Continued)
CTime (hrs)
Slope WithGlyc
(mg/L.hr)
Slope W/O Glyc (mg/L.hr)
Glycerol Effect
(mg/L.hr) 10.3 10.5 2.41 8.07 10.5 11.1 2.36 8.74 10.7 11.7 2.30 9.45 10.9 12.4 2.24 10.2 10.9 - 2.24 - 11.2 11.8 2.18 9.62 11.5 3.96 2.08 1.87 12.1 - 1.95 - 12.2 3.56 1.92 1.63 13.0 3.12 1.75 1.37 13.4 - 1.67 - 14.4 3.17 1.63 1.54 14.8 - 1.61 - 15.3 2.92 1.62 1.30 15.9 3.13 1.63 1.50 16.2 - 1.63 - 17.5 3.00 1.69 1.31 17.6 - 1.69 - 18.5 2.60 1.66 0.935 18.9 - 1.65 - 19.4 2.36 1.61 0.750 19.7 0.37 1.58 -1.21 18.9 2.12 1.65 0.47 20.4 - 1.5 - 21.3 2.09 1.43 0.660 22.0 - 1.37 - 22.7 1.59 1.41 0.180
Note: CTime= Current Time
104
APPENDIX I: WASTEWATER CHARACTERISTICS
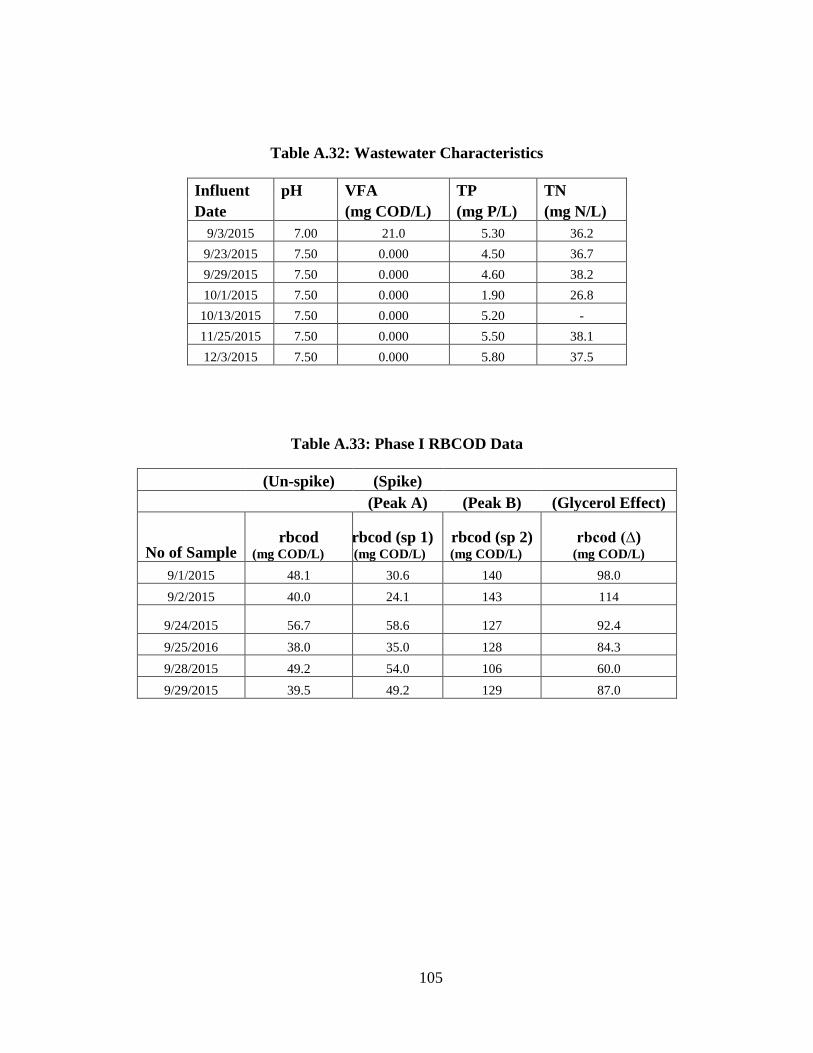
105
Table A.32: Wastewater Characteristics
Influent pH VFA TP TN Date (mg COD/L) (mg P/L) (mg N/L)
9/3/2015 7.00 21.0 5.30 36.2 9/23/2015 7.50 0.000 4.50 36.7 9/29/2015 7.50 0.000 4.60 38.2 10/1/2015 7.50 0.000 1.90 26.8
10/13/2015 7.50 0.000 5.20 - 11/25/2015 7.50 0.000 5.50 38.1 12/3/2015 7.50 0.000 5.80 37.5
Table A.33: Phase I RBCOD Data
(Un-spike) (Spike) (Peak A) (Peak B) (Glycerol Effect)
No of Sample rbcod
(mg COD/L) rbcod (sp 1) ((mg COD/L)
rbcod (sp 2) (mg COD/L)
rbcod (∆) (mg COD/L)
9/1/2015 48.1 30.6 140 98.0 9/2/2015 40.0 24.1 143 114
9/24/2015 56.7 58.6 127 92.4 9/25/2016 38.0 35.0 128 84.3 9/28/2015 49.2 54.0 106 60.0 9/29/2015 39.5 49.2 129 87.0
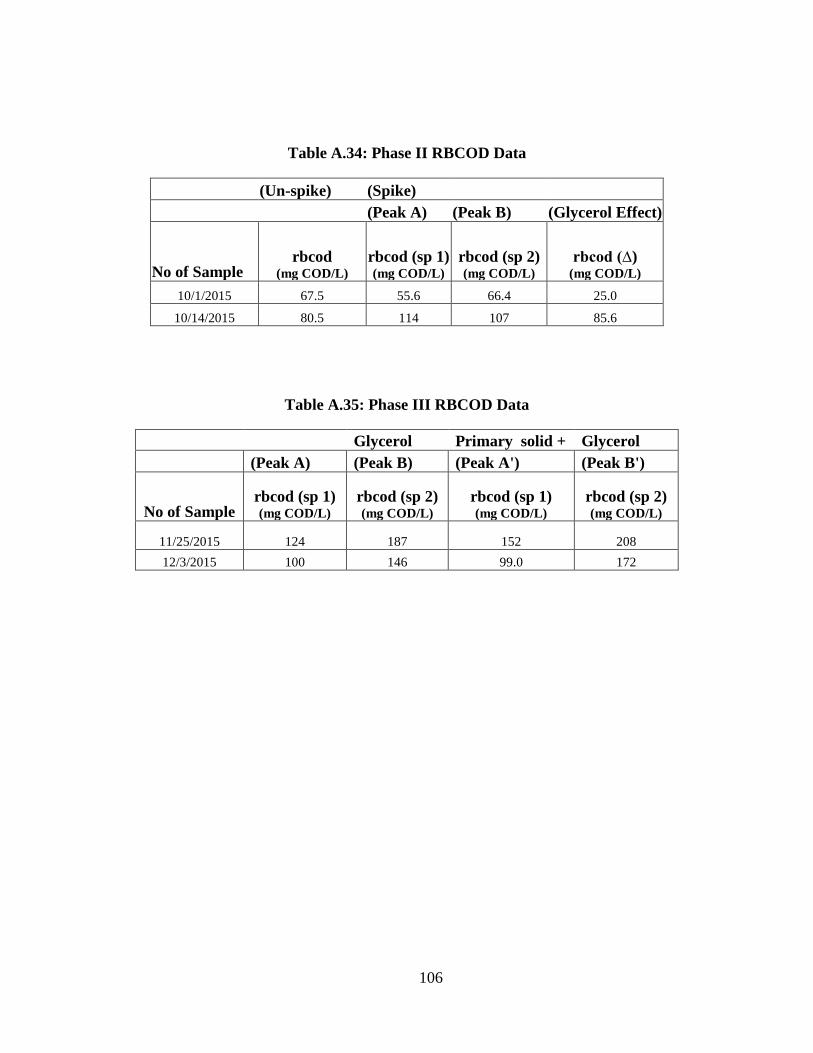
106
Table A.34: Phase II RBCOD Data
(Un-spike) (Spike) (Peak A) (Peak B) (Glycerol Effect)
No of Sample rbcod
(mg COD/L) rbcod (sp 1) (mg COD/L)
rbcod (sp 2) (mg COD/L)
rbcod (∆) (mg COD/L)
10/1/2015 67.5 55.6 66.4 25.0
10/14/2015 80.5 114 107 85.6
Table A.35: Phase III RBCOD Data
Glycerol Primary solid + Glycerol (Peak A) (Peak B) (Peak A') (Peak B')
No of Sample rbcod (sp 1) (mg COD/L)
rbcod (sp 2) (mg COD/L)
rbcod (sp 1) (mg COD/L)
rbcod (sp 2) (mg COD/L)
11/25/2015 124 187 152 208 12/3/2015 100 146 99.0 172
107
REFERENCES
Barbirato, F., Chedaille, D., and Bories, A., 1997. Propionic acid fermentation from glycerol: comparison with conventional substrates. Applied Microbiology Biotechnology, 47, 441-446.
Barnard, J.L., and Abraham, K., 2006. Key features of successful BNR operation. Water Science and Technology, 53, 1-9.
Bodik, I., Blstakova, A., Sedlacek, S., and Hutnan, M., 2009. Biodiesel waste as source of organic carbon for municipal WWTP denitrification. Bioresource Technology, 100, 2452-2456.
Bondioli, P., and Bella, L.D., 2005. An alternative spectrophotometric model for the determination of free glycerol in biodiesel. European Journal of Lipid Science and Technology, 107, 153-157.
Bories, A., Himmi, E.H., Jauregul, J.A., and Gonzales, V.A., 2003. Glycerol fermentation with propionibacteria and optimisation of the production of propionic acid. Science Des Aliments, 24.2, 121-135.
Boulineau, S., Tostevin, F., Kiviet, D.J., Wolde, P.R.t., Nghe, P., and Tans, S.J., 2013. Single-cell dynamics reveals sustained growth during diauxic shifts. PLoS ONE 8(4): e61686. doi:10.1371/journal.pone.0061686.
Broughton, A., Pratt, S., and Shilton, A., 2008. Enhanced biological phosphorus removal for high-strenght wastewater with a low rbcod:p ratio. Bioresource Technology, 99, 1236–1241.
Chaudhary, N., 2010. Anaerobic fermentation of glycerol by Escherichia coli K12 for the production of ethanol. Research in partial fulfillment of degree of Master in science, McGill University, Montreal, Quebec, Canada
Chaudhary, N., Ngadi, M.O., Simpson, B.K and Kassama, L.S., 2011. Biosynthesis of ethanol and hydrogen by glycerol fermentation using Escherichia coli. Advances in Chemical Engineering and Science, 1, 83-89.
Cho, E., and Molof, H.A., 2004. Effect of sequentially combining methanol and acetic acid on the performance of biological nitrogen and phosphorus removal. Journal of Environmental Management, 73, 183-187.
Chu, A., Mavinic, D,S., Kelly, H.G., and Ramey, W.D., 1994. Volatile fatty acid production in thermophilic aerobic digestion of sludge. Water Resource, 28, 1513-1522.
108
Clayton, J.A., Ekama, G.A, Wentzel, M.C., and Maris, G.V.R., 1991. Denitrification kinetics in biological nitrogen and phosphorus removal activated sludge systems treating municipal wastewaters. Water Science Technology, 23, 1025-1035.
Clomburg, J.M., and Gonzalez, R., 2013. Anaerobic fermentation of glycerol: a platform for renewable fuels and chemicals. Trends Biotechnology, 31, 20-28.
Coats, E.R., Dobroth, Z.T., and Brinkman, C.K., 2015. EBPR using crude glycerol: assessing process resiliency and exploring metabolic anomalies. Water Environment Resource, 87, 68-79.
,Cyplik, P., Juzwa, W., Marecik, R., Czarny, P.J., Cyplik, P.A., Czarny, J., Drozdzynska, R., and Chrzanowski, L., 2013. Denitrification of industrial wastewater: Influence of glycerol addition on metabolic activity and community shifts in a microbial consortium. Chemosphere, 93, 2823-2831.
Danesh, S., and Oleszkiewicz J.A., 1997. Volatile fatty acid production and uptake in biological nutrient removal systems with process separation. Water Environment Resource, 69, 1106-1111.
Dauknys, R., Vaboliene, G., Valentukeviciene, M., and Rimeika, M., 2009. Influence of substrate on biological removal of phosphours. Ekologija, 55, 220-225.
Demirbas, A., 2009. Biofuels: Securing the Planet’s Future Energy Needs. Green Energy and Technology, pp-162.
Dharmadi, Y., A. Murarka., and R. Gonzalez., 2006. Anaerobic fermentation of glycerol by Escherichia coli: a new platform for metabolic engineering. Biotechnology and Bioengineering. 94, 821-829.
Drewnoswski, J., 2014. The impact of slowly biodegradable organic compounds on the oxygen uptake rate in activated sludge systems. Water Science Technology, 69, 1136-1144.
Drozdzynska, A., Pawlicka, J., Kubiak, P., Kosmider, A., Pranke, D., Schmidt, A.O., and Czaczyk, K., 2014. Conversion of glycerol to 1.3-propanediol by Citrobacter freundii and Hafnia alvei- newly isolated strains from the Enterobaceteriaceae. New Biotechnology, 31, 402-410.
Ekama, G.A., and Marais, G.v.R., 1979. Dynamic behavior of the activated sludge process. Water pollution control federation Part I, 51, 534-556.
Ekama, G.A., Siebritz, I.P., and Marais, G.V., 1983. Considerations in the process design of nutrient removal activated sludge process. Water Science and Technology, 15, 283-318.
109
Foglar, L., and Briski, F., 2003. Wastewater denitrification process- the influence of methanol and kinetic analysis. Process Biochemistry, 39, 95-103.
Gong, L., Huo, M., Yang, Q., Li, J., Ma, B., Zhu, R., Wang, S., and Peng, Y., 2013. Performance of heterotrophic partial denitirification under feast-famine condition of electron donor: A case study using acetate as external carbon source. Bioresource Technology, 133, 263-269.
Gu, A.Z., Saunders, A., Neethling, J.B., Stensel, H.D., and Blackall, L.L., 2008. Functionally relevant microorganisms to enhanced biological phosphours removal performance at full-scale wastewater treatment plants in the Unites States. Water Environment Resource, 80, 688-698.
Guerrero, J., Taya, C., Guisasola, A., and Baeza J.A., 2012 Glycerol as a sole carbon source for enhance biological phosphorus removal. Water Research, 46, 2983-2991.
Gupta, A., Murarka, A., Campbell, P., and Gonzalez, R., 2009. Anaerobic fermentation of glycerol in Paenibacillus macerans: metabolic pathways and environmental determinants. Applied and Environmental Microbiology, 75, 5871-5883.
Hinojosa, J., Riffat, R., Fink, S., Murthy, S., Selock, K., Bott, C., Takacs, I., Dold, P., and Wimmer, (2008). Estimating the Kinetics and Stoichiometry of Heterotrophic Denitrifying Bacteria with Glycerol as an External Carbon Source. Proceedings of the Water Environment Federation, WEFTEC, Session 1-10, 274-288.
Her, J. J., and Huang, J.S., 1995 Influence of carbon source and C/N ratio on nitrate/nitrite denitrification and carbon breakthrough. Bioresource Technology, 54, 45-51.
Henz, M.P., Harremoes, J, la C., and Janse E.A, 2001. Wastewater treatment biological and chemical processes. 3rd edn: Springer Verlag. pp-436.
Henz, M., Loosdrecht, M.CM.v., Ekama, G.A., and Brdjanovic, D., 2008. Biological wastewater treatment: Principle, Modeling and design pp-82, 115.
Himmi,E.H., Bories, A., Boussaid, A., and Hassani, L., 2000. Propionic acid fermentation of glycerol and glucose by Propionibacterium acidipropionici and Propionibacterium freudenreichii ssp. Shermanii. Applied Microbiol Biotechnology, 53, 435-440.
Hu, Z.R., Wentzel, M., and Ekama, G.A., 2002. The significance of denitrifying polyphosphate accumulating organisms in biological nutrient removal activated sludge systems. Water Science Technology. 46, 129-138.
Janssen, P.M.J., Roest, H.F.V., and Eggers, E., 1996. The Carrousel and the Carrousel-2000 systems: A guarantee for total nutrient removal. European Water Pollution Control, 6, 10-16.
110
Jeon, C.O., and Park, J.M., 2000. Enhanced biological phosphours removal in a sequencing batch reactor supplied with glucose as a sole carbon source. Water Resource, 34, 2160-2170.
Katarzyna, B., Dorota, K., and Karol, Z., 2015. Glycerine as a carbon source in nitrite removal and sludge production. Chemical Engineering Journal, 267, 324-331.
Kosimider, A., Drozdzynska, A., Blaszka, K., Leja, K., and Czaczyk, K. 2010. Propionic acid production by Propionibacterium freudenreichii ssp. shermanii using crude glycerol and whey lactose industrial wastes. Polish Journal of Environmental Studies, 19, 1249-1253.
Kuai, L., and Verstraete, W., 1999. Autotrophic denitrification with elemental sulphur in small-scale wastewater treatment facilities. Environmental Technology, 20, 201-209.
Lee, D.U., Lee, I.S., Choi, Y.D., and Bae, J.H., 2001. Effects of external carbon source and empty bed contact time on simultaneous heterotrophic and sulfur-utilizing autotrophic denitrification. Process Biochemistry, 36, 1215-1224.
Liu, Y., Zhang, Y.G., Zhang, R.B., Zhang, F., and Zhu, J., 2011. Glycerol/Glucose Co-Fermentation: One More Proficient Process to produce Propionic Acid by Propionibacterium acidipropionici. Current Microbiology, 62, 152–158.
Melidis, P., and Tseles, D., 2009 Nitrogen removal from landfill leachate by addition of biodiesel glycerol waste as external carbon source. Proceedings of the 11th International conference on Environmental Science and Technology, A 916-922
Metcalf and Eddy Inc., Tchobanoglous, G., Stensel, H.D., and Burton, F., 2013. Wastewater engineering treatment and reuse (5th ed.) Mc Graw Hill Higher Education. pp-874, ISBN: 0073401188.
Marais, G.V.R., and Ekama, G.A., 1976. The activated sludge process, Part 1: Steady state behaviour. Water SA, 2, 163–200.
Naidoo, V., 1997. Municipal wastewater characterization-Application of denitrification batch tests. Academic requirement for the degree of Doctor of Philosophy University of Natal, Durban.
Naidoo, V., Urbain, V., Ginestet, P., and Buckley, C.A., 2000. Reliability of the anoxic respirometeric technique for wastewater characterization using EBPR and non-EBPR sludge. Water Institute for Southern African Biennial Conference, Sun City, South Africa, May 28-June 1, Water Institute for Southern Africa; Midrand, South Africa.
Oehmen, A., Lemos, P.C., Carvalho, G., Yuan, Z., Keller, J., Blackall, L.L., and Reis, M.A.M., 2007. Advances in enhanced biological phophours removal: From micro to macro scale. Water Research, 41, 2271-2300.
111
Oehmen, A., Saunders, A.M., Vives, M.T., Yuan, Z., and Keller, J., 2006. Competition between polyphosphate and glycogen accumulating organisms in enhanced biological phosphorus removal systems with acetate and propionate as carbon sources. Journal of Biotechnology, 123, 22-32.
Orhon, D., Okutman D., and Insel, G., 2002. Characterisation and biodegrdation of settleable organic matter for domestic wastewater. Water SA, 28, 299-306.
Pagliaro, M., and Rossi, M., 2008. The future of glycerol: new uses of a versatile raw material. RSC green chemistry book series, pp- 1-17.
Papanikolaous, S., Fick, M., and Aggelis, G., 2004 .The effect of raw glycerol concentration on the production of 1,3-propanediol by Clostridium butyricum. Journal of Chemical Technology and Biotechnology, 79, 1189-1196.
Pijuan, M.,Saunders, A.M., Guisasola, A., Baeza, J.A., Casa, C., and Blackall, L.L., 2004. Enhanced biological phosphorus removal in a sequencing batch reactor using propionate as the sole carbon source. Biotechnology Bioengineering, 85, 56-67.
Popsecu, F., and Lonel, L., 2011. Waste animal fats with high FFA as a renewable energy source for biodiesel production-concept, experimental production and impact evaluation on air quality. Alternative Fuel, Dr. Maximino Manzanera (Ed.), ISBN: 978-953-307-372-9, InTech, DOI: 10.5772/20409.
Randall, A.A., Benefield, L.D., Hill, W.E., Nicol, J.P., Boman, G.K., and Jling, S.R., 1997. The effect of volatile fatty acids on enhanced biological phosphorus removal and population structure in anaerobic/aerobic sequencing batch reactors. Water science Technology, 35, 153-160.
Randall, A.A., and Liu, Y.H., 2002. Polyhydroxyalkanoates form potentially a key aspect of aerobic phosphorus uptake in enhanced biological phosphorous removal. Water Resource, 36, 3473-3478.
Randall, C.W., Barnard, J.L., and Stensel, H.D., 1992. Design and retrofit of wastewater treatment plants for biological nutrient removal. Water Quality Management Library, 5, Technomic Publishing Company, Lancaster, PA,
Randall, E.W., Wilkinson, A., and Ekama, G.A., 1999. An instrument for the direct determination of oxygen utilisation rate. Water SA, 17, 11-18.
Retfalvi, T., Hajos, A.T., Albert, L., and Marosvolgyi, B., 2011. Laboratory scale examination of the effects of overloading on the anaerobic digestion by glycerol. Bioresource Technology, 102, 5270-5275.
112
Rossle, W.H., and Pretorius, W.A., 2001. A review of characterization requirements for in-line prefermenters Paper 1: Wastewater characterization. Water SA, 27, 405-412.
Saito, T., Brdjanovic, D., and van Loosdrecht, M.C.M., 2004 Effect of nitrite on phosphate uptake by phosphate accumulating organisms. Water Research, 38, 3760-3768.
Sattayasamitsathit, S., Methacanon, P., and Prasertsan, P., 2011. Enhance 1,3-propanediol production from crude glycerol in batch and fed-batch fermentation with two phase pH-controlled strategy. Electronic journal of Biotechnology, 14, 4-4.
ESchuchardta, U., Serchelia, R., and Vargas, R.M., 1998. Transesterification of Vegetable oils: a review. Journal of Brazilian Chemical Society, 9, 199-210.
Schuler, A.J., and Jenkins, D., 2003. Enhanced biological phosphorus removal from wastewater by biomass with different phosphorus contents, Part I: Experimental results and comparison with metabolic models. Water Environment Science, 75, 485-498.
Seviour, J., R., Mino, T., and Onuki, M., 2003 The microbiology of biological phosphorus removal in activated sludge systems. FEMS Microbiology Reviews, 27, 99-127.
Sheping, W., Lifang, Y., Guanghui, H., Hairong, Z., and Dangcong, P., 2006. A pilot study on a step-feeding anoxic/oxic activated sludge system. Water Science and Technology, 53, 95-101.
Songliu, L.U., Hongying, H.U., Yingxue, S., and Jia, Y., 2009. Effect of carbon source on the denitrification in constructed wetlands. Journal of Environmental Sciences, 21, 1036-1043.
Sperandio, M., and Paul, E.,2000. Estimation of wastewater biodegradable COD fractions by combining respirotmetric experiments in various So/Xo ratios. Water Research, 34, 1233-1246.
Stephens, H., 2004. Comprehensive analysis of full-scale enhance biological phosphorus removal facilities. WEFTEC 77th Annual Technical Exhibition and Conference, October 2–6, 2004, New Orleans, Session 83.
Tasli, R., Orhon, D., and Artan, N., 1999. The effect of substrate composition on the nutrient removal potential of sequencing batch reactors. Waster SA, 25, 337-344.
Taya, C., Guerrero, J., Suarez-Ojeda, M, E., Guisasola, A., and Baeza, J, A., 2015 Assessment of crude glycerol for Enhanced Biological Phosphorus Removal: Stability and role of long chain fatty acids. Chemosphere, 141, 50-56.
Taya, C., Guerrero, J., Vanneste, G., Guisasola, A., and Baeza, J.A., 2012. Methanol-Driven Enhanced Biological Phosphours Removal with a syntrophic consortium. Biotechnology and Bioengineering, 110, 391-400.
113
Uprety, K., Charles, B., Chris, B., Kevin, P., Bill, B., Katya, B., and Ron, L., 2012. Glycerol-driven denitrification: Evaluating the specialist-generalist theory and partial denitrification to nitrite. Water Environment Federation Session, 51-60, 3747-3771.
Uprety, K., 2013. Evaluation of Glycerol and Waste Alcohol as Supplemental Carbon Sources for Denitrification Partial fulfillment for the requirement of Master Thesis. Virginia Polytechnic Institute and State University
Viana. M.B., Freitas, A.V., Leitao, R.C., Pinto, G.A.S., and Santaella, S.T. 2012 Anaerobic digestion of crude glycerol: a review. Environmental Technology Review, 1, 81-92.
Vollertsen, J., and Jacobsen, T.H., 2002. Biodegradability of wastewater- a method for COD-fractionation. Water Science Technology, 45, 25-34.
Wentzel M.C., Dold P.L., Ekama G.A., and Marais G.v.R., 1990. Biological excess phosphorus removal - Steady state process design. Water SA, 16, 29-48.
Wentzel, M.C., Ekama, G.A., and Marais, G.v.R., 1992. Process and modelling of nitrification denitrification biological excess phosphorus biological excess phosphorus removal systems-a review. Water Science Technology, 25, 59-82.
Wentzel, M.C., Mbewe, A., and Ekama, G. A., 1995. Batch test for measurement of readily biodegradable COD and active organism concentrations in municipal wastewaters. Water SA, 21, 117-123.
Werkman, C.H., and Gillen, G.F., 1932. Bacteria producing trimethylene glycol. Journal Bacteriology, 23, 167-182.
Yazdani, S.S., and Gonzalez, R., 2007. Anaerobic fermentation of glycerol: a path to economic vialbility for the biofuels industry. Current option in biotechnology, 18, 213-219.
Yuan., Q., 2011. Fermentation –Enhanced Sustainable Biological Phosphorus Removal. In partial fulfillment of the requirements of the degree of DOCTOR OF PHILOSOPHY, University of Manitoba.
Yuan, Q., Sparling, P. L., Lee, M., Taniguchi, D., and Oleszkiewicz, J.A., 2010. Enhancing biological phosphorus removal with glycerol. Water Science and Technology, 61, 1837-1843.
Ziglio, G., Andreottola, G., Foladori, P., and Ragazzi, M., 2001. Experimental Validation of a single-Our method for wastewater RBCOD characterization. Water science and Technology, 43, 119-126.