Embed Size (px)
Citation preview
The effect of fire regime on tropical savannas of
north-eastern Australia: interpreting floristic
patterns through critical life events.
Thesis submitted by
Paul Richard Williams BSc (Hons) University of New England
in June 2002
for the degree of Doctor of Philosophy
in Tropical Plant Sciences
School of Tropical Biology
James Cook University

Statement of access.
Statement of Access.
I, the undersigned, the author of this thesis, understand that James Cook University will
make it available for use within the University library and, by microfilm or other
means, allow access to users in other approved libraries. All users consulting this thesis
will have to sign the following statement:
In consulting this thesis I agree not to copy or closely paraphrase it in whole or
in part without the written consent of the author; and to make proper public
written acknowledgement for any assistance which I have obtained from it.
Beyond this, I do not wish to place any restriction on access to this thesis.
…………………………………………. ……………………….
Paul Williams
i

Statement on sources declaration.
Statement on Sources Declaration.
I declare that this thesis is my own work and has not been submitted in any form for
another degree or diploma at any university or other institution of tertiary education.
Information derived from published or unpublished work of others has been
acknowledged in the text and a list of references is given.
…………………………………………. ……………………….
Paul Williams
ii

Acknowledgements.
Acknowledgements.
This thesis greatly benefited from the complete support and expert advice provided
throughout the project by my three supervisors, whom I thank sincerely for their
friendship and dedication: Dr Bob Congdon (James Cook University), Dr Tony Grice
(CSIRO) and Dr Peter Clarke (University of New England). This research would not
have occurred if were not for the enthusiastic support of the Townsville staff of
Queensland Parks and Wildlife Service, who implemented the fires at the Cape
Cleveland, Mt Elliot and Many Peaks Range sites, and maintained the fire breaks at
Cape Cleveland: Col Adams, Steve Brooker, Graeme Bulley, Michael Dicketts, Jim
Denison, Brett Galloway, Rob Graham, Doug Harrison and Denis Masters.
Mike Lloyd (Kings Park Botanic Gardens, Perth) kindly provided advice on the design
of the apparatus to produce the smoke exposure treatments and Brett Galloway
(Queensland Parks and Wildlife Service) expertly welded the smoke equipment
together.
James Cook University generously provided funding for field equipment, travel to
Christchurch to present some of the results of this research at the Bushfire 2001
conference, and to finalise the completion of the thesis. Queensland Parks and Wildlife
Service gave permission for the research to be undertaken at Bowling Green Bay
National Park and Town Common Conservation Park, and allowed me time during
work to implement the fires and undertake the annual floristic surveys (Chapter 2).
Townsville City Council, with particular thanks to Greg Bruce, provided permission to
survey plant regeneration on Castle Hill.
Thanks to Drs Malcolm Gill and Gay Crowley for providing valuable comments on a
draft of Chapter 1, and to the Queensland Herbarium staff, particularly Russell
Cumming, for taxonomical advice and identifying several specimens for me. Drs Mike
Steele (James Cook University) and Bob Mayer (Queensland Department of Primary
Industries) provided expert statistical advice. I appreciate the input from the many
friends with whom I discussed this project and fire management of savannas in general,
including Col Adams, Grant Anchen, Graeme Bulley, Greg Calvert, Gay Crowley, Tim
iii

Acknowledgements.
iv
Devlin, Leasie Felderhof, Adam Felton, Annika Felton, Malcolm Gill, Rob Graham,
Dave Green, John Hunter, Janice Jackson, Shayne Kimlin, Ken McMahon, Mark
Parsons, Jeremy Russell-Smith and Eddie Staier. Thanks also to Adam Felton for
producing the scanning electron microscope images of the Crotalaria montana seed
(Figure 4.1 and the inside-cover image), to Kate O’Donnell (CRC Tropical Savannas)
for producing Figure 1.1 and to Sharon King (Environmental Protection Agency) for
producing Figure 2.1.
I give special thanks to my wonderful girlfriend, Eleanor Collins, for your full support
throughout the project, assistance in the field, skill in scanning all photographs, as
general thesis editor, and for enduring my absence at Cape Cleveland during weekends
and holidays for 5 years. Most importantly of all, you kept things in perspective so that
I could continue to enjoy life while producing this thesis. Thank you.
I dedicate this thesis to the memory of my late father, John Cambell Williams, for his
commitment as a father and because his 48 years service with the one company
demonstrated to me perseverance.
Abstract.
Abstract.
The degree to which fire influences plant species composition and abundance (referred
to in this thesis as floristic patterns) in Australian tropical savannas has been the subject
of debate. Available information emphasises floristic patterns rather than the
mechanisms that determine patterns. The assessment of critical events in a plant’s life
cycle (referred to in this thesis as critical life events) is necessary to understand
population dynamics and therefore the processes that determine floristic patterns. Fire
may affect population size through its influence on one or more critical life events
including seed dormancy release, seed bank dynamics, seedling emergence, seedling
survival and the survival and growth of juvenile and mature plants.
This thesis presents data on floristic patterns in response to fire regimes in savannas of
north-eastern Australia, a region with limited quantitative information on fire response
at a community level; and contributes to the broader understanding of savanna function,
through an examination of life cycle processes. The aims of the research were to
examine the effect of fire regime on:
a) floristic patterns in eucalypt savannas in the vicinity of Townsville, north-eastern
Australia; and
b) critical life events, to investigate mechanisms determining floristic patterns.
To achieve these objectives, laboratory and shadehouse experiments were carried out
and surveys of seedling emergence and vegetative post-fire regeneration were
undertaken at four sites in the Townsville region. At one of these sites, Cape Cleveland,
floristic patterns and critical life events were studied in detail using a manipulative fire
experiment which examined three fire regimes between 1997 and 2001:
1. Control: savanna burnt in the mid dry season (July) 1997 only.
2. Early burnt: savanna burnt in the mid dry season 1997 and early dry season (May)
1999.
3. Late burnt: savanna burnt in the mid dry season 1997 and late dry season (Oct)
1999.
v
Abstract.
Five annual surveys of permanent plots at Cape Cleveland demonstrated a high degree
of stability in species composition, however the abundance of several species was
affected by fire regime. A significant increase in the abundance of various subshrubs,
ephemeral and twining perennial forbs, and grasses was detected in the first year after
fire, particularly following late dry season burning. The abundance of these species
declined towards pre-fire levels in the second year after fire. The dominant grass
Heteropogon triticeus significantly declined in abundance, and tree density increased,
with fire intervals of four years.
Investigations of critical life events detected mechanisms that determine floristic
patterns. A pulse of seedling emergence of subshrubs and herbaceous species occurred
in the post-fire wet season, with greatest seedling density following late dry season
fires. This pulse of seedling emergence explained the increase in plant abundance
documented in the year following fire. It resulted from seed dormancy release,
triggered by multiple fire-related agents, including the removal of herbaceous cover,
which increased germination of a range of species; and the exposure to: heat-shock,
which increased the germination of a range of forbs; smoke, which promoted the
germination of upright perennial forbs and grasses; and nitrate, which interacted with
heat shock to increase germination of at least two forbs.
The germinable soil seed bank was dominated by grasses and forbs, and seed banks of
trees and shrubs were scarce and short-lived. Seasonal fluctuations were evident in the
seed bank, which increased through the dry season to a maximum density in the late dry
season, and declined to a minimum by the mid wet season. The high intensity late dry
season fires reduced seed production by the dominant tree Corymbia clarksoniana in
the year following burning, however the effect of fire on soil seed bank dynamics was
limited due to the annual wet season decline in seed reserves that occurred irrespective
of fire. These data indicate that late dry season fires promoted the emergence of a
greater density of herb seedlings, compared with early dry season fires, by stimulating
seed dormancy release in a higher proportion of seeds, and because more soil seed
reserves were available in the late dry season to be affected by fire.
vi
Abstract.
Seedling survival of herbaceous species was higher for those that emerged from
recently burnt rather than unburnt savanna. High rates of seedling mortality of
perennial species, and the short lifespan of ephemeral forbs, explained the decline in
plant abundance documented in the second year following fire. A moderate proportion
of seedlings of common sprouter species developed the capacity to survive fire within
one year of germination. Only five percent of C. clarksoniana seedlings survived in
unburnt, and fewer in burnt savanna, three years after germination.
In savanna that remained unburnt for four years, growth of juvenile trees above 2 m in
height accounted for the observed increase in tree density. The capacity of the majority
of species to sprout after fire, and rapid seed production of non-sprouter species,
explained the stability in species composition documented in the annual floristic
surveys at Cape Cleveland. Fire-promoted stem reproduction via root-suckering
explained the increase in abundance detected in the subshrub Breynia oblongifolia
following burning.
This thesis provides important information on the processes that drive tropical savanna
function. It indicates that seedling recruitment is a process that limits population
growth. Seedling recruitment of trees and shrubs is scarce and episodic, apparently
linked to high rainfall years. The seedling recruitment of subshrubs and herbaceous
species is driven by opportunities for seed dormancy release, which are primarily
restricted to fire events, and limited by the low to moderate soil seed bank density and
poor levels of seedling survival. Growth of juvenile trees beyond 2 m in height, and
hence to reproductive maturity, requires fire-free intervals of at least four years and is
therefore an event that is restricted by fire and limits population growth. The high
proportion of sprouting species enables plant persistence, so that juvenile and mature
plant survival are life events that provide population resilience. For ephemeral species,
the soil seed bank provides a storage mechanism that provides population resilience.
This thesis provides practical information to improve the management of this
widespread and important ecosystem. Conservation management of these savannas will
need to balance the role of regular fires in maintaining the diversity of herbaceous
species with the requirement of fire intervals of at least four years for allowing
vii

Abstract.
viii
recruitment, and therefore population maintenance, of trees. While late dry season fires
may cause some tree mortality, the use of occasional late fires will promote dense
seedling recruitment of herbaceous species, which may be necessary to maintain
sustainable populations of many grasses and forbs.

Table of contents.
Table of Contents.
Statement of Access ………………………………..………………….….……………i
Statement on Sources Declaration ……….…………………………………………..ii
Acknowledgements ………....………………………………………………………...iii
Abstract ………………………………………………………………………………..v
Table of contents………………...………………………….…………………………ix
List of Tables……………………………………………………………...…………xvii
List of Figures………………………………………………………...……………...xxi
Chapter 1. Introduction to the effect of fire regime on floristic patterns and
critical life events in Australian tropical savannas……………………..1
1.1 Context…………………………………………………….……...………....2
1.2 The effect of fire regime on floristic patterns in Australian tropical
savannas …………………………………………………………………….2
1.2.1 Australian tropical savannas…………………………………….2
1.2.2 Fire in Australian tropical savannas ...………………………….4
1.2.3 Structural and floristic patterns …………………………………5
1.3 The assessment of critical life events for interpreting floristic patterns ……6
1.3.1 The value of examining critical life events ……………………..6
1.3.2 The effect of fire regime on seed production and dispersal …….7
1.3.3 The effect of fire regime on seed dormancy release ……………8
1.3.4 The effect of fire regime on soil seed bank dynamics ………….9
1.3.5 The effect of fire regime on seedling emergence ……………..11
1.3.6 The effect of fire regime on seedling survival ………………...12
1.3.7 The effect of fire regime on the survival and growth of
juvenile and mature plants …………………………………….12
1.4 This study ……………………………….…………………………………14
1.4.1 Aims of this study ……………………………………………..14
1.4.2 Thesis structure ………………………………………………..16
ix
Table of contents.
Chapter 2. Study sites, climate and design of the Cape Cleveland fire regime
experiment ………………………………………………………………19
2.1 Study sites and climate…………………………………………………….20
2.2 Design and implementation of the Cape Cleveland fire regime
experiment ………………………………………………………………..23
Chapter 3. The effect of fire regime on floristic patterns in a tropical savanna of
north-eastern Australia ………………………………………………..27
3.1 Introduction……………………………………………………………...…28
3.2 Methods……………………………………………………………………29
3.2.1 Study site…………………………………………………….…..29
3.2.2 Sampling methods……………………………………………….29
3.2.2a Fuel load sampling ……………………………………..29
3.2.2b Fire intensity sampling ………………………………...30
3.2.2c Floristic sampling ………………………………………31
3.2.3 Statistical analyses……………………………………………….33
3.2.3a Fuel load analyses ……………………………………...33
3.2.3b Fire intensity analyses ………………………………….33
3.2.3c Multivariate analyses of floristic dynamics ……………34
3.2.3d Univariate analyses of species richness and abundance 38
3.3 Results……………………………………………………………………...41
3.3.1 Fuel load dynamics ……………………………………………...41
3.3.2 Fire intensity …………………………………………………… 43
3.3.3 Multivariate analyses of species composition and abundance…..43
3.3.3a Cluster analyses ...……………………………………...43
3.3.3b Principle Components Analysis ………………………..44
3.3.3c Partial Redundancy Analysis …………………………..51
3.3.3d Univariate analyses of species richness and abundance 57
3.4 Discussion………………………………………………………………….70
3.4.1 Fuel load dynamics ……………………………………………...70
3.4.2 Fire intensity …………………………………………………….70
3.4.3 Multivariate analyses of species composition and abundance .....71
3.4.4 Univariate analyses of species richness and abundance ………...72
x
Table of contents.
3.4.5 Study constraints ………………………………………………...73
3.5 Conclusion ………………………………………………………………...74
Chapter 4. The effect of fire regime on seed dormancy release in Australian
tropical savanna species.……………………………………………….78
4.1 Introduction………………………………………………………………...79
4.2 Methods……………………………………………………………………81
4.2.1 General methods…………………………………………………81
4.2.1a Laboratory experiment …………………………………81
4.2.1b Temperature elevation in the topsoil during the passage
of fire ………………………………………………………….85
4.2.1.c Depth of seed germination …………………………….88
4.2.2 Statistical analyses……………………………………………….88
4.2.2a Laboratory experiment …………………………………88
4.2.2b Temperature elevation in the topsoil during the
passage of fire..…………………………………………89
4.2.2.c Depth of seed germination …………………………….89
4.3 Results……………………………………………………………………..90
4.3.1 Laboratory experiment ………………………………….……….90
4.3.2 Temperature elevation in the topsoil during the passage of fire ...95
4.3.3 Depth of seed germination ……………………………………....97
4.4 Discussion………………………………………………………………...100
4.4.1 Laboratory experiment …………………………………………100
4.4.2 Temperature elevation in the topsoil during the passage of fire 102
4.4.3 Depth of seed germination ……………………………….…….103
4.5 Conclusion ……………………………………………………………….104
Chapter 5. The effect of fire regime on soil seed bank dynamics in a tropical
savanna of north-eastern Australia……………………………….….106
5.1 Introduction……………………………………………………………….107
5.2 Methods…………………………………………………………………..111
5.2.1 Sampling methods……………………………………………...111
5.2.1a Soil seed bank sampling ………………………………111
5.2.1b Phenology of seed production ...……………………...116
xi
Table of contents.
5.2.1c Fire effects on Corymbia clarksoniana seed
production ……………………………………………116
5.2.2 Statistical analyses………...……………………………………117
5.2.2a Overview of analyses …………………………………117
5.2.2b Seed bank dynamics pre- and post-mid dry season 1997
fire …………………………………………………... 118
5.2.2c Seasonal and annual fluctuations with time since fire 119
5.2.2d Seed bank dynamics immediately before and after
the 1999 fire season treatments ……………………….120
5.2.2e Seed bank dynamics following fire season treatments ...121
5.2.2f Comparison of seed bank compositions with the
standing vegetation …………………………………….121
5.2.2g Fire effects on Corymbia clarksoniana seed
production ……………………………………………...121
5.3 Results……………………………………………………………………122
5.3.1 Seed bank dynamics pre- and post-mid dry season 1997 fire …122
5.3.2 Seasonal and annual fluctuations with time since fire …………126
5.3.3 Seed bank dynamics immediately before and after the 1999
fire season treatments ………………………………………….133
5.3.4 Seed bank dynamics following fire season treatments ………...141
5.3.5 Phenology of seed production …………………………………149
5.3.6 Comparison of seed bank compositions with the standing
vegetation ………………………………………………………149
5.3.7 Fire effects on Corymbia clarksoniana seed production ………152
5.4 Discussion………………………………………………………………...154
5.4.1 The effect of fire on the balance between dormant and active
soil seed banks ………………………………………………..154
5.4.2 Distribution of seed in the topsoil ……………………………..156
5.4.3 Seed bank composition and abundance ……………………….156
5.4.4 Seasonal and annual dynamics in the soil seed bank ………….159
5.4.5 Fire effects on Corymbia clarksoniana seed production ………160
5.5 Conclusion ……………………………………………………………….161
xii
Table of contents.
Chapter 6. The effect of fire on seedling emergence in tropical savannas of north-
eastern Australia ………………………………………………………163
6.1 Introduction ………………..…………………………………………….164
6.2 Methods ………………………………………………………………….166
6.2.1 Sampling methods …………………………………………….166
6.2.1a Seedling emergence surveys in the Townsville region 166
6.2.1b Seedling emergence surveys at Cape Cleveland ……..168
6.2.1c Safe sites for Corymbia clarksoniana ………………..169
6.2.1d Total seedling emergence surveys at Cape Cleveland ..170
6.2.2 Statistical analyses ……………………………………………..171
6.2.2a Seedling emergence surveys in the Townsville region 171
6.2.2b Seedling emergence surveys at Cape Cleveland ……..172
6.2.2c Species composition of seedling emergence, soil seed
bank and floristic surveys ……………………………173
6.2.2d Safe sites for Corymbia clarksoniana ………………..173
6.2.2e Total seedling emergence surveys at Cape Cleveland 174
6.3 Results ……………………………………………………………………175
6.3.1 Seedling emergence surveys around Townsville ………………175
6.3.2 Seedling emergence surveys at Cape Cleveland ……………….177
6.3.3 Species composition of seedling emergence, soil seed bank
and floristic surveys ……………………………………………186
6.3.4 Safe sites for Corymbia clarksoniana ………………………….189
6.3.5 Total seedling emergence surveys at Cape Cleveland …………189
6.3.6 Total seedling emergence as a proportion of the soil seed bank 194
6.4 Discussion ………………………………………………………………..196
6.4.1 Seedling emergence surveys …………………………………...196
6.4.2 Safe sites for Corymbia clarksoniana ………………………….200
6.4.3 Species composition of seedling emergence, soil seed bank and
floristic surveys ………………………………………………...201
6.4.4 Total seedling emergence ……………………………………...202
6.4.5 Total seedling emergence as a proportion of the soil seed bank 204
6.5 Conclusion ……………………………………………………………….206
xiii

Table of contents.
Chapter 7. The effect of fire regime on seedling survival in a tropical savanna of
north-eastern Australia …………………….………………………...208
7.1 Introduction ………………..……………………………………………..209
7.2 Methods ……..…………………………………………………………...212
7.2.1 Sampling methods ……………………………………………..212
7.2.1a Survival of seedlings emerging from burnt, cut and
undisturbed savanna ………………………………….212
7.2.1b Ability of seedlings to survive fire within one year of
germination …………………………………………..213
7.2.1c The effect of fire season on the survival of Corymbia
clarksoniana seedlings that emerged prior to fire …...213
7.2.2 Statistical analyses ……………………………………………..214
7.2.2a Survival of seedlings emerging from burnt, cut and
undisturbed savanna ………………………………….214
7.2.2b Ability of seedlings to survive fire within one year of
germination …………………………………………..215
7.2.2c The effect of fire season on the survival of pre-fire
Corymbia clarksoniana seedlings ……………………215
7.3 Results ……………………………………………………………………216
7.3.1 Survival of seedlings emerging from burnt, cut and undisturbed
savanna ...………………………………………………………216
7.3.2 Ability of seedlings to survive fire within one year of
germination …………………………………………………….220
7.3.3 The effect of fire season on the survival of pre-fire Corymbia
clarksoniana seedlings …………………………………………220
7.4 Discussion ………………………………………………………………..224
7.4.1 Survival of seedlings emerging from burnt, cut and
undisturbed savanna ……………………………………………224
7.4.2 Ability of seedlings to survive fire within one year of
germination …………………………………………………….226
7.4.3 The effect of fire season on the survival of pre-fire Corymbia
clarksoniana seedlings …………………………………………227
7.5 Conclusion ……………………………………………………………….228
xiv
Table of contents.
Chapter 8. The effect of fire on the survival and growth of juveniles and
mature plants …………………………………………………………230
8.1 Introduction ……………………………………………………………..231
8.2 Methods …………………………………………………………………234
8.2.1 Sampling ……………………………………………………….234
8.2.1a Regenerative capacity of savanna species ……………234
8.2.1b Survival and growth of trees …………………………235
8.2.1c Survival and growth of Corymbia clarksoniana
juveniles ……………………………………………..235
8.2.1d Stem regeneration after burning and cutting in the
early and late dry season …………………………….235
8.2.1e Survival of mature herbs ……………………………..236
8.2.2 Statistical analyses …………………………………………….237
8.2.2a Regenerative capacity of savanna species ……………237
8.2.2b Survival and growth of trees …………………………237
8.2.2c Survival and growth of Corymbia clarksoniana
juveniles ……………………………………………..237
8.2.2d Stem regeneration after burning and cutting in the
early and late dry season …………………………….237
8.2.2e Survival of mature herbs ……………………………...238
8.3 Results ……………………………………………………………………238
8.3.1 Regenerative capacity of savanna species ……………………..238
8.3.2 Survival and growth of trees …………………………………...239
8.3.3 Survival and growth of Corymbia clarksoniana juveniles ……243
8.3.4 Stem regeneration after burning and cutting in the early and
late dry season ………………………………………………….245
8.3.5 Survival of mature herbs ……………………………………….245
8.4 Discussion ………………………………………………………………..248
8.4.1 Regenerative capacity of savanna species ……………………..248
8.4.2 Survival and growth of trees …………………………………...251
8.4.3 Survival and growth of Corymbia clarksoniana juveniles …….252
8.4.4 Stem regeneration after burning and cutting in the early and
late dry season …………………………………………………253
xv
Table of contents.
xvi
8.4.5 Survival of mature herbs ………………………………………254
8.5 Conclusion ……………………………………………………………….254
Chapter 9. Summary and conclusions …………………………………………….256
9.1. Thesis objectives ………………………………………………………...257
9.2 Summary of results ………………………………………………………258
9.2.1 The effect of fire regime on floristic patterns ………………….258
9.2.2 The effect of fire regime on seed dormancy release …………...260
9.2.2 The effect of fire regime on soil seed bank dynamics …………261
9.2.4 The effect of fire regime on seedling emergence ……………...262
9.2.5 The effect of fire regime on seedling survival …………………263
9.2.6 The effect of fire regime on survival and growth of juvenile
and mature plants ……………………………………………..264
9.3. Functional ecology of Townsville eucalypt savannas …………………..265
9.4 Management implications and further research ………………………….268
References……………………………………………………………………………271
Appendix 1. Species composition of floristic surveys, soil seed bank samples
and seedling emergence surveys……………………………………..299
Appendix 2. Post-fire regeneration observations from eucalypt savanna at
Cape Cleveland, Castle Hill, Many Peaks Range and Mt Elliot ….302
List of tables.
List of Tables.________________________________________________
Table 2.1. Monthly rainfall between 1997 and 2001 at the Townsville airport and
Cape Cleveland ...…………………………………………………………22
Table 3.1. Summary of fuel samples from eucalypt savanna at Cape Cleveland …….30
Table 3.2. Partial RDA of floristic variation across the 180 surveys at Cape
Cleveland, between 1997 and 2001 ………………….……………………52
Table 3.3. Forward selection results of the partial RDA of floristic variation across
the 180 surveys at Cape Cleveland, between 1997 and 2001 ……………..53
Table 3.4. Partial RDA of floristic variation across surveys undertaken in both
1999 and 2000 ……………………………………………………………..55
Table 3.5. Forward selection results of the partial RDA of floristic variance across
the 1999 and 2000 surveys ...……………………………….……………..56
Table 3.6. Species number and abundance of growth form groups in the five
annual surveys in eucalypt savanna at Cape Cleveland …………………...59
Table 3.7. Mean (standard error) of species richness, abundance of species groups
and the 21 most common species, and statistical results, for fire regimes
in eucalypt savanna at Cape Cleveland ....…………………………………62
Table 4.1. Species and treatments examined in the laboratory experiment of
fire-related seed dormancy mechanisms ……………..……………………87
Table 4.2. Mean (standard error) seed weight, percentage viability and size
ranking of each species examined in the laboratory experiment…………..90
Table 4.3. Statistical results of one- and two-factor ANOVAs for the laboratory
experiment of seed germination …………………………………………...92
Table 4.4. Statistical results of non-parametric Mann-Whitney U-tests of soil
temperatures at the base of grass tussocks compared with grass gaps,
during early and late dry season fires in eucalypt savanna at Cape
Cleveland…………………………………………………………………..97
Table 4.5. Statistical results of non-parametric Mann-Whitney U-tests comparing
soil temperatures during early and late dry season fires in eucalypt
savanna at Cape Cleveland ………………………………………………..97
Table 4.6. Results of the Spearman rank correlation analysis of seed germination
depth with temperatures recorded at four separate soil depths ……………99
xvii
List of tables.
Table 5.1. ANOVA results of soil treatment and depth of germinable soil seed
bank collected before and after fire in July 1997 at Cape Cleveland .…….124
Table 5.2. Mean (standard error) germinable soil seed bank density of native and
exotic species, growth form groups and common species, collected at
three soil depths before and after the July 1997 fire at Cape Cleveland ….125
Table 5.3. Statistical significance of differences between soil treatment, annual and
seasonal fluctuations in germinable soil seed bank collected between
February 1998 and October 2000 in eucalypt savanna last burnt in July
1997, at Cape Cleveland …………………………………..……………..128
Table 5.4a. Mean (standard error) untreated and heated germinable soil seed bank
density (m-2) of species, collected in the wet season, early, mid and late
dry seasons of 1998 at Cape Cleveland, in savanna last burnt in July
1997 ……………………………………………………………………...130
Table 5.4b. Mean (standard error) untreated and heated germinable soil seed bank
density (m-2) of species, collected in the wet season, early, mid and late
dry seasons of 1999 at Cape Cleveland, in savanna last burnt in July
1997 ……………………………………………………………………...131
Table 5.4c. Mean (standard error) untreated and heated germinable soil seed bank
density (m-2) of species, collected in the wet season, early, mid and late
dry seasons of 2000 at Cape Cleveland, in savanna last burnt in July
1997 ……………………………………………………………………...132
Table 5.5. ANOVA of the statistical significance of differences between fire
treatment, soil treatment and season of soil seed bank collection, before
and after the 1999 fire season treatments in eucalypt savanna at Cape
Cleveland ………………………………………………………………...135
Table 5.6a. Mean (standard error) germinable soil seed bank density (m-2) of
untreated and heated soil samples collected between May 1999 and
February 2000 at Cape Cleveland, from the control treatment …………137
Table 5.6b Mean (standard error) germinable soil seed bank density (m-2) of
untreated and heated soil samples collected between May 1999 and
February 2000 at Cape Cleveland, from early burnt savanna …………138
xviii
List of tables.
Table 5.6c. Mean (standard error) germinable soil seed bank density (m-2) of
untreated and heated soil samples collected between May 1999 and
February 2000 at Cape Cleveland, from late burnt savanna ……………139
Table 5.7. Results of an independent t-test of untreated germinable soil seed bank
after early dry season fire (control vs early burnt of July 1999 soil
collection) and late dry season fire (control vs late burnt of October
1999 soil collection) at Cape Cleveland …………………………………140
Table 5.8. ANOVA results of fire treatment, soil treatment, and seasonal of
collection in germinable soil seed bank collected in the year following
fire, between May and October 2000, at Cape Cleveland ………………143
Table 5.9a. Mean (standard error) germinable soil seed bank density (m-2)
collected from control treatment (i.e. savanna last burnt in July 1997),
at Cape Cleveland between May and October 2000 ……………………146
Table 5.9b. Mean (standard error) germinable soil seed bank density (m-2)
collected from early burnt savanna (last burnt in May 1999), at
Cape Cleveland between May and October 2000 ………………………147
Table 5.9c. Mean (standard error) germinable soil seed bank density (m-2)
collected from late burnt savanna (last burnt in October 1999), at
Cape Cleveland between May and October 2000 ………………………148
Table 5.10. Phenology of seed production of eucalypt savanna plants at Cape
Cleveland ……………………………………………………………….150
Table 5.11. Response to soil treatments, total number of species, seed density and
the most abundant growth form detected in germinable soil seed bank
studies undertaken in eucalypt communities across Australia …………157
Table 6.1. Mean (standard error) seedling density (m-2) and results of the Mann-
Whitney U-tests comparing seedling density in recently burnt, and
longer unburnt eucalypt savanna of Mt Elliot, Many Peaks Range and
Castle Hill, Townsville …………………………………………………176
Table 6.2. Mean (standard error) species richness and seedling density (m-2),
and results of statistical analyses of fire treatment and year of survey
in eucalypt savanna at Cape Cleveland, between 1997 and 2001 ………178
xix
List of tables.
xx
Table 6.3. Results of two-factor ANOVA of the effect of micro-site disturbance
and seed burial on seedling emergence of Corymbia clarksoniana in
eucalypt savanna at Cape Cleveland ……………………………………191
Table 6.4. Mean (standard error) species richness and total seedling density (m-2),
and Kruskal-Wallis ANOVA results, in undisturbed, early burnt, late
burnt, early cut and late cut plots at Cape Cleveland …………………...192
Table 7.1. Mean (standard error) percentage survival after at least 18 months,
and ANOVA results, of seedlings of native and exotic species, growth
form groups and common species emerging from eucalypt savanna at
Cape Cleveland …………………………………………………………219
Table 7.2. ANOVA results of fire season treatments on the survival of Corymbia
clarksoniana seedlings that emerged seven months prior to the early
dry season fire ……………………………………………………………224
Table 8.1 Summary of post-fire regeneration of growth form groups in eucalypt
savanna in the vicinity of Townsville ……………………………………239
Table 8.2. Repeated measures ANOVA results for the effect of fire on the density
of all trees (> 2m height) and the four most abundant trees, between
1997 to 2001 at Cape Cleveland …………………………………………240
Table 8.3. Repeated measures ANOVA results for the effect of fire (control, early
burnt, late burnt) on the basal area of all trees (> 2m height) and the
four dominant species, between 1998 to 2001 at Cape Cleveland ………243
Table 8.4. Repeated measures ANOVA results of Corymbia clarksoniana
juvenile density and height between 1999 and 2001 in control, early
and late burnt blocks …………………………………………………….244
Table 8.5. Kruskal-Wallis ANOVA by ranks statistical results for the percentage
survival of common herbaceous species after burning and cutting in the
early and late dry seasons in eucalypt savanna at Cape Cleveland ……...246
Table 8.6. Comparison of the percentage of sprouting species within a range of
Australian vegetation types ………………………………………………249
List of figures.
List of Figures.
Figure 1.1 The distribution of Australian tropical savannas.…………………………3
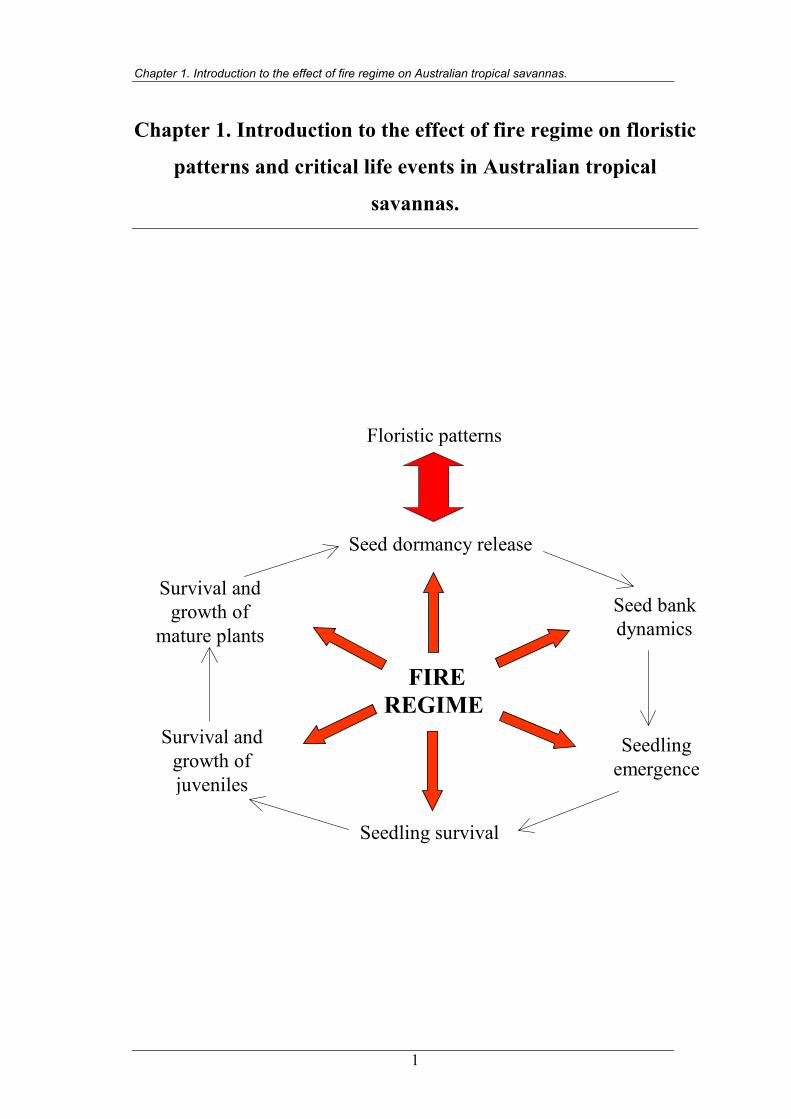
Figure 1.2 Diagrammatic model of the influence of fire regime on critical life
events and floristic patterns in tropical savannas ……………………….16
Figure 2.1 Map of study sites ……………………………………………………….21
Figure 2.2 Mean monthly rainfall, and mean daily minimum and maximum
temperatures per month, at Townsville ………………………………….22
Figure 2.3 Eucalypt savanna at the Cape Cleveland fire regime experimental site …23
Figure 2.4 Schematic diagram of the experimental fire regime layout at the Cape
Cleveland study site …………………………………………………..….25
Figure 3.1 Species-area curve of the mean (± 1 standard error) number of species
per unit area within 20 plots in eucalypt savanna………………………...32
Figure 3.2 Diagrammatic key to the distinction of growth form groups used
throughout this thesis …………………………………………………….39
Figure 3.3 Mean (± 1 standard error) fuel accumulation with years since fire in
eucalypt savanna at Cape Cleveland……………………………………...42
Figure 3.4 Mean (± 1 standard error) fuel load in unburnt, early burnt and late
dry season burnt eucalypt savanna at Cape Cleveland in (a) 2000 and
(b) 2001 …………………………………………………………………..42
Figure 3.5. Intensity of the mid dry season (1997), early dry season (1999) and late dry season (1999) fires in eucalypt savanna at Cape Cleveland …...43
Figure 3.6. Cluster analysis dendrogram from the 180 surveys in eucalypt
savanna at Cape Cleveland, based on species composition data only …...45 Figure 3.7. Cluster analysis dendrogram from the 180 surveys in eucalypt savanna
at Cape Cleveland, based on species composition and abundance data ….47 Figure 3.8. PCA scatter plot of the 180 surveys in eucalypt savanna at Cape
Cleveland, from 1997 to 2001 ……………………………………………50 Figure 3.9. Simplified PCA scatter plot showing the pattern of floristic change
from 1997 to 2001 ………………………………………………………..51 Figure 3.10. Biplot from the partial RDA of the entire 180 surveys in eucalypt
savanna at Cape Cleveland from 1997 to 2001 …………………………..54
xxi
List of figures.
Figure 3.11. Biplot from the partial RDA of surveys in eucalypt savanna at Cape Cleveland in 1999 and 2000 ……………………………………………...58
Figure 4.1 Scanning electron microscope image of the strophiolar plug, magnified
350 times, of an untreated Crotalaria montana seed. ……………….…..80
Figure 4.2 Mean (± 1 standard error) percentage seed germination at different
incubation temperatures during the pilot trial for Chamaecrista
mimosoides, Crotalaria lanceolata and Crotalaria pallida.……………...83
Figure 4.3. Apparatus used to produce smoke at ambient temperature. ……………...84
Figure 4.4. Placement of a temperature measurement strip at the 30 mm depth.……..86
Figure 4.5. Mean (± 1 standard error) percentage germination of viable seed after
exposure to various levels of heat shock, as well smoke and nitrate …….91
Figure 4.6. Modal temperatures recorded at four depths in the topsoil during
(a) early and (b) late dry season fires in eucalypt savanna at Cape
Cleveland during 1999 …………………………………………………...96
Figure 4.7. Depth of seed germination in eucalypt savanna that has been slashed,
or burnt early or late in the dry season for (a) Galactia tenuiflora and
(b) Indigofera hirsuta ……………………………………………………98
Figure 4.8. Mean seedling density (± 1 standard error) of Galactia tenuiflora and
Indigofera hirsuta at four temperature measurement points in early
and late dry season burnt eucalypt savanna at Cape Cleveland ………….99
Figure 5.1. Model of the influence of fire on soil seed bank dynamics……………..110
Figure 5.2. Schematic diagram of the sampling design used in the July 1997
germinable soil seed bank study in eucalypt savanna at Cape
Cleveland ...……………………………………………………………...113
Figure 5.3. Schematic diagram of the sampling design used in the soil seed bank
study of eucalypt savanna at Cape Cleveland between October 1997
and October 2000 ……………………………………………………….115
Figure 5.4. Image of smoke application to soil seed bank samples collected from
eucalypt savanna at Cape Cleveland in May, July and October 2000 ….116
Figure 5.5 Mean (± 1 standard error) (a) species richness per sample and (b) total
seed density of germinable soil seed bank, collected in eucalypt savanna
at Cape Cleveland, before and after the 1997 mid dry season fire ……..123
xxii
List of figures.
Figure 5.6. Mean (± 1 standard error) (a) species richness per sample and (b) total
seed density of germinable soil seed bank, collected in eucalypt
savanna at Cape Cleveland, between February 1998 and October 2000,
in sites last burnt in July 1997 …………………………………………..127
Figure 5.7. Mean (± 1 standard error) (a) species richness and (b) total seed density of
germinable soil seed bank, collected in eucalypt savanna at Cape Cleveland,
between May 1999 and February 2000 ……………………134
Figure 5.8. Mean (± 1 standard error) (a) species richness and (b) total seed
density of germinable soil seed bank, collected in eucalypt savanna
at Cape Cleveland, between May and October 2000 …………………...142
Figure 5.9. PCA scatter plot of species composition in the 288 soil seed bank
samples and 180 floristic surveys ………………………………………153
Figure 5.10. Mean (± 1 standard error) seed production of Corymbia clarksoniana
at Cape Cleveland in December 2000, in savanna with different fire
histories …………………………………………………………………154
Figure 6.1. Mean (± 1 standard error) seedling density of Corymbia clarksoniana
in eucalypt savanna in December 1999, at Cape Cleveland ……………183
Figure 6.2. PCA scatter plot of species composition within floristic surveys, soil
seed bank samples and seedling emergence surveys in eucalypt
savanna at Cape Cleveland ……………………………………………...188
Figure 6.3. Mean (± 1 standard error) percentage seedling emergence of viable
seeds of Corymbia clarksoniana in eucalypt savanna at Cape
Cleveland ………………………………………………………………..190
Figure 6.4. Mean (± 1 standard error) percentage seedling emergence of surface
sown and buried viable seeds of Corymbia clarksoniana in eucalypt
savanna at Cape Cleveland ……………………………………………...190
Figure 6.5. Rate of seedling emergence in eucalypt savanna at Cape Cleveland …...191
Figure 6.6. Mean (± 1 standard error) percentage seedling emergence of soil
seed bank at Cape Cleveland ………………………………………… 195
Figure 7.1. Mean (± 1 standard error) percentage (a) species survival and
(b) seedling survival, at least 18 months after seedling emergence in
eucalypt savanna at Cape Cleveland ……………………………………218
xxiii
List of figures.
xxiv
Figure 7.2. Correlation between percentage seedling survival and seedling density 221
Figure 7.3. Mean (± 1 standard error) percentage survival of seedlings that
emerged less than eight months prior to an early dry season fire
(May 1999) in eucalypt savanna at Cape Cleveland ……………………222
Figure 7.4. Mean (± 1 standard error) percentage (a) seedling survival and
(b) seedling height with age of Corymbia clarksoniana in eucalypt
savanna at Cape Cleveland ……………………………………………..223
Figure 8.1. Mean (± 1 standard error) tree density in control, early and late dry
season burnt eucalypt savanna at Cape Cleveland, between 1997
and 2001 ………………………………………………………………241
Figure 8.2. Mean (± 1 standard error) tree basal area in control, early burnt and
late dry season burnt eucalypt savanna at Cape Cleveland between
1997 and 2001 ……………………………………………………..242
Figure 8.3. Mean (± 1 standard error) (a) density and (b) height of Corymbia
clarksoniana juveniles between 1999 and 2000 in control, early and
late dry season burnt savanna at Cape Cleveland ………………………244
Figure 8.4. Mean (± 1 standard error) growth of Corymbia clarksoniana juveniles
(< 2 m tall in 1999) with years since fire in eucalypt savanna at Cape
Cleveland ………………………………………………………………..245
Figure 8.5. Mean (± 1 standard error) Breynia oblongifolia stem density before,
and after treatments in eucalypt savanna at Cape Cleveland …………...246
Figure 8.6. Mean (± 1 standard error) % survival of (a) Galactia tenuiflora, (b)
Glycine tomentella, (c) Heteropogon triticeus, (d) Passiflora foetida,
(e) Pycnospora lutescens in eucalypt savanna at Cape Cleveland ……..247
Figure 9.1. Critical life events that limit population growth and provide stability
to populations …………………………………………………………...266
Chapter 1. Introduction to the effect of fire regime on Australian tropical savannas.
Chapter 1. Introduction to the effect of fire regime on floristic
patterns and critical life events in Australian tropical
savannas.
FIREREGIME
Seed dormancy release
Floristic patterns
Seed bankdynamics
Seedlingemergence
Survival andgrowth ofjuveniles
Survival andgrowth of
mature plants
Seedling survival
1
Chapter 1. Introduction to the effect of fire regime on Australian tropical savannas.
1.1 Context
This thesis examines the influence of fire regime on plant species composition and
abundance (referred to as floristic patterns) within tropical eucalypt savannas of north-
eastern Australia. The mechanisms determining floristic patterns are investigated
through an assessment of critical events in a plant’s life cycle (referred to as critical life
events). These include seed dormancy release, soil seed bank dynamics, seedling
emergence, seedling survival and the survival and growth of juvenile and mature plants.
The relative importance of key factors that drive savanna function, including climate,
soils, biological interactions and fire, is debated (Scholes and Archer 1997; Higgins et
al. 2000). An examination of life cycle processes that produce floristic patterns is
critical for understanding how savannas function and allows predictions of how
savannas will respond to fire regimes, and forecast climate change (Whelan et al.
2002).
There has been only limited research into the influence of fire regimes on floristic
patterns in savannas of north-eastern Australia. Therefore floristic patterns within
eucalypt savannas of this region were examined using manipulative field and laboratory
experiments, coupled with surveys of seedling and vegetative regeneration after a range
of fires in several locations in the vicinity of Townsville, north-east Queensland (19°
15’S, 146° 46’E; Figure 1.1). These data contribute to our broader understanding of
how tropical savannas function and provide essential information to aid the
management of this widespread ecosystem.
1.2 The effect of fire regime on floristic patterns in Australian tropical savannas
1.2.1 Australian tropical savannas
Tropical savannas cover approximately 13% of the world’s land surface (Scholes and
Archer 1997). The “dual significance” of herbaceous and woody species is a
characteristic feature of these savannas, which possess a sparse to moderate tree canopy
and an abundance of grasses and forbs (Mott et al. 1985; Walker 1985; Higgins et al.
2000).
2
Chapter 1. Introduction to the effect of fire regime on Australian tropical savannas.
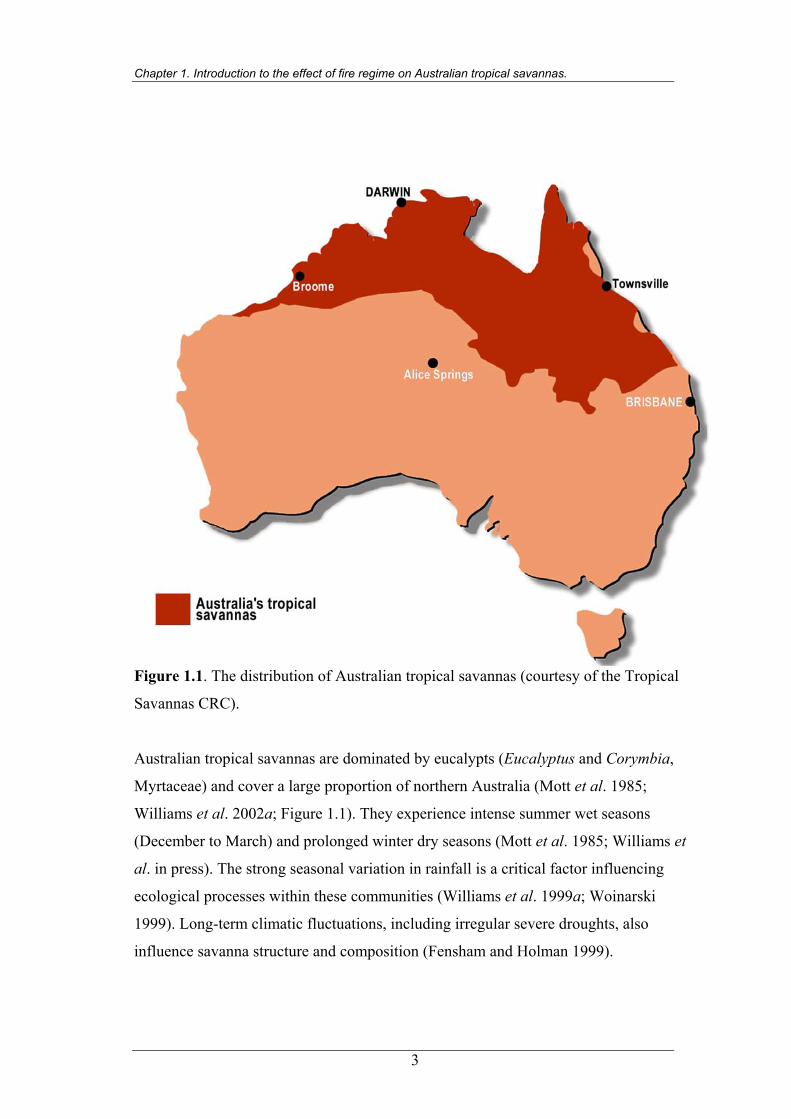
Figure 1.1. The distribution of Australian tropical savannas (courtesy of the Tropical
Savannas CRC).
Australian tropical savannas are dominated by eucalypts (Eucalyptus and Corymbia,
Myrtaceae) and cover a large proportion of northern Australia (Mott et al. 1985;
Williams et al. 2002a; Figure 1.1). They experience intense summer wet seasons
(December to March) and prolonged winter dry seasons (Mott et al. 1985; Williams et
al. in press). The strong seasonal variation in rainfall is a critical factor influencing
ecological processes within these communities (Williams et al. 1999a; Woinarski
1999). Long-term climatic fluctuations, including irregular severe droughts, also
influence savanna structure and composition (Fensham and Holman 1999).
3
Chapter 1. Introduction to the effect of fire regime on Australian tropical savannas.
1.2.2 Fire in Australian tropical savannas
The intense summer wet seasons in Australian tropical savannas yield a large biomass
of grass, which cures during the subsequent dry season (Walker 1981). The consistency
of this cycle leads to frequent and extensive fires (Wilson and Bowman 1987; Gill et al.
1996). Grasses rapidly regenerate after fire in northern Australia, re-establishing fuel
loads and creating the potential for fire intervals as low as one or two years (Walker
1981; Gill et al. 2000). Contemporary fire intervals typically range from one to three
years in the high rainfall region of the Northern Territory and Kimberley, and two to
five years in the north and central coast of Queensland (Burrows and Burrows 1992;
Crowley 1995; Craig 1997; Russell-Smith et al. 1997; Crowley and Garnett 2000).
As a consequence of progressive grass curing through the dry season, the timing of fire
has a strong influence on intensity (Bowman 1988). Low intensity, patchy fires are
typical of the early dry season, with higher intensity and extensive fires produced by
later dry season burning (Gill et al. 1990). Fire intensity in Australian tropical savannas
is typically lower than in southern Australia and crown fires are rare (Craig 1997).
Annual early dry season fire intensities can be in the order of < 1000 to 2200 kWm-1
and annual mid to late dry season fires from 1000 to 7700 kWm-1 (Williams et al.
1999b; Russell-Smith et al. in press). A single late dry season fire in a savanna unburnt
for seven years was estimated to have an intensity of approximately 20 000 kWm-1
(Williams et al. 1999b).
Soils of many Australian tropical savannas are low in nutrients (Mordelet et al. 1996;
Morgan et al. 2000; Jackson and Ash 2001). Volatilization of nutrients occurs during
fire, although most are returned via rain and ash redistribution (Cook 1994). Repeated
annual burning may be too frequent to allow the replacement of lost nitrogen in
savannas of the Northern Territory (Cook 1994; Russell-Smith et al. in press). However
the dynamics of soil nutrition may vary significantly between fires and communities, as
the nitrogen content of a south-eastern Queensland eucalypt forest burnt annually for
thirty years was similar to that of adjacent unburnt forest (Lamb et al. 1989).
4
Chapter 1. Introduction to the effect of fire regime on Australian tropical savannas.
1.2.3 Structural and floristic patterns
The high fire frequency experienced in tropical savannas may be expected to impact on
community structure and composition. Indeed, frequent fire is often linked with
reduced tree densities in tropical savannas throughout the world, including southern
Africa (Trollope 1982; Skowno et al. 1999), India (Puyravaud et al. 1995) South
America (Hoffman 1996) and Australia (Sandercoe 1988; Williams et al. 1999b). The
season and intensity of fire can be as important in affecting floristic patterns as fire
frequency. Annual late dry season fires can lead to reduced tree densities, while early
annual fires can promote tree density (Trapnell 1959).
Increases in tree density typically result from the growth of stunted juvenile trees (< 2
m in height) with fire intervals of greater than two or three years (Bowman and Panton
1995; Russell-Smith et al. in press). The release of stunted juveniles following fire
protection may be most rapid for non-eucalypts, such as Acacia spp., Melaleuca
viridiflora and other broad-leaved species (Bowman et al. 1988; Fensham 1990;
Crowley and Garnett 1998). The release of eucalypt juveniles in the absence of fire is
often slow and in some species not apparent after a fire interval of 21 years (Russell-
Smith et al. in press).
Charcoal and pollen records indicate the distributions of rainforest and eucalypt-
dominated communities in northern Australia has been dynamic over thousands of
years (Kershaw et al. 1991; Hopkins et al. 1993). Rainforest invasion into eucalypt
forests has occurred in the Wet Tropics region of north-eastern Australia (Harrington
and Sanderson 1994) and parts of Cape York Peninsula (Stanton and Roeger 2001).
However, the establishment of rainforest, or vine thicket, species in savannas away
from the east coast is generally limited, or at least slow (Bowman et al. 1988; Fensham
1990; Bowman 1993; Bowman 1994; Williams et al. in press; Russell-Smith et al. in
press). In fact, across much of northern Australia, many rainforests and stands of
Callitris intratropica and Acacia shirleyi, have declined in distribution as a result of
damage from repeated high intensity fires that spread from adjacent eucalypt savannas
(Price and Bowman 1994; Woinarski and Fisher 1995; Bowman 2000; Russell-Smith
and Stanton 2002).
5
Chapter 1. Introduction to the effect of fire regime on Australian tropical savannas.
The herbaceous component of tropical savannas is a diverse and important feature, yet
assessment of fire effects has been largely confined to the dominant grasses. Many of
these perennial and annual grasses maintain high densities with fire intervals of one to
three years, although a few grasses are favoured by less frequent burning (Shaw 1957;
Mott and Andrew 1985; Mott et al. 1985; Russell-Smith et al. in press). The season of
fire may have a significant impact, with early and late dry season fires promoting
different grasses, and wet season burning reducing the abundance of both perennial and
annual species (Stocker and Sturtz 1966; Walker et al. 1989; Williams and Lane 1999).
Although there has been limited research into the effects of fire on forbs in Australian
tropical savannas, it is apparent that fire can affect their abundance. Many are most
abundant with high fire frequency or in recently burnt savanna (Hoare et al. 1980;
Sandercoe 1988; Fensham 1990; Williams et al. 2002b). Forb composition can also be
affected by the season of fire (Bowman et al. 1988; Williams and Lane 1999).
1.3 The assessment of critical life events for interpreting floristic patterns
1.3.1 The value of examining critical life events To understand how a community functions in response to fire, details are required of
the mechanisms that drive floristic patterns. The assessment of critical events in a
plant’s life cycle provides an understanding of population, and therefore community,
dynamics (Harper 1977; Whelan et al. 2002). Population changes can be driven by the
variation in fire intervals, the unique characteristics of each fire event, and/or density-
dependent processes (Bond and van Wilgen 1996). Fire can influence the persistence of
standing plants and seeds; the density of seed germination; the establishment of
seedlings; the progression from seedling to mature plant; and seed production (Whelan
1995; Keith 1996; Whelan et al. 2002).
There is currently very little data on the effect of fire on the demographics of Australian
tropical savanna species. The most detailed information has been collected for Sorghum
intrans, which dominates some savannas of the Northern Territory and Western
Australia, and highlights the value of a demographic assessment. Knowledge of the
mass recruitment of this annual grass at the onset of the wet season, the fire-sensitivity
of seedlings, and the transient nature of the soil seed bank provide an insight into the
6
Chapter 1. Introduction to the effect of fire regime on Australian tropical savannas.
mechanisms that cause a decline in this species after wet season burning (Stocker and
Sturtz 1966; Andrew and Mott 1983; Andrew 1986).
Further work is needed to assess the influence of fire on critical life events in the life
cycle of a wider range of savanna species, to provide data on seed production, seed
dispersal, seed dormancy, seed bank dynamics, seedling emergence, and the survival
and growth of seedlings, juveniles and mature plants. Hence this thesis aims to
investigate fire effects on critical life events of a range of savanna species, which will
improve the current understanding of processes that govern savanna function. The
following discussion introduces the current knowledge of fire effects on these life
events.
1.3.2 The effect of fire regime on seed production and dispersal
Plants in Australian tropical savanna are pollinated by a wide range of vectors
including bats, gliders, birds, insects and wind (House 1997; Franklin and Noske 2000;
Hansman 2001). Their reproductive phenology reflects the annual wet-dry cycle
(Burrows and Burrows 1992; Setterfield and Williams 1996; Williams et al. 1999a).
Peak seed fall of grasses occurs from the middle of the wet to the early dry season
(Tothill 1977a; Andrew and Mott 1983; Mott and Andrew 1985). Forb seed fall peaks
in the late wet to mid dry season, while the late dry season and onset of the wet season
is the major period of seed fall for woody species (Brennan 1996; Setterfield and
Williams 1996; Williams et al. 1999a).
Fire influences seed production of tropical savanna plants by promoting flowering,
affecting pollinator abundance and by damaging reproductive structures before seed set
(Woinarski 1990; Brennan 1996; Setterfield 1997a). The pattern of seed production can
vary with fire response, as vegetative regenerating “sprouter” species tend to put fewer
resources into seed production compared with fire-killed, “obligate seeder” species
(Pate et al. 1990; Bond and van Wilgen 1996; Bond and Midgley 2001).
Seed of savanna plants are dispersed by non-biotic agents, including gravity, wind and
water (Grice 1996; Pettit and Froend 2001). Biotic seed dispersers (and predators)
include ants, cattle, birds, feral pigs and wallabies (Andersen 1991; Grice 1996;
7
Chapter 1. Introduction to the effect of fire regime on Australian tropical savannas.
Setterfield 1997b). Explosive capsules can also increase the distance of seed dispersal
(Auld 1996). Fire can influence seed dispersal and predation. For instance, seed
harvesting ants in the Northern Territory, which both consume seed and disperse seed
undamaged, can be most abundant with high fire frequency (Andersen 1991).
Several dominant grasses of tropical savannas possess awns with a hygroscopic
mechanism that buries seed into the topsoil, so that they are insulated from lethal
temperatures during the passage of fire (Tothill 1969; Andrew and Mott 1983).
1.3.3 The effect of fire regime on seed dormancy release
Viable, fresh seeds are considered to possess a primary, or “innate”, dormancy if they
will not germinate without a further stimulus when provided with moisture and
temperatures suitable for germination (Harper 1977; Bell 1999). A secondary dormancy
may develop if environmental conditions are inappropriate for germination (Bell 1999).
Secondary dormancy may be induced in buried seed by darkness or temperature regime
and may explain why viable seeds that lack an innate dormancy remain stored in the
soil seed bank (Bell et al. 1999; Auld et al. 2000).
Seed dormancy can allow a seed to persist through unfavourable environmental
conditions until climatic and micro-site factors favour seedling establishment (Bell
1999). Cues for releasing seeds from a state of dormancy are often linked with seasonal
conditions, including day length and exposure to high or low temperatures (Beardsell
and Mullett 1984; Bell et al. 1993; Battaglia 1996; Clarke et al. 2000).
Fire can improve micro-site conditions that influence seedling survival and growth,
such as increased nutrient and light availability (Whelan 1995). It is not surprising then
that many plants of fire-prone environments have dormancy mechanisms that cue seeds
to germinate after fire. Fire-related cues found to break seed dormancy include
exposure to heat shock (i.e. a short duration of elevated temperature), smoke, charcoal
and nitrate (Bell et al. 1987a; Auld and O’Connell 1991; Dixon et al. 1995; Bell et al.
1999; Clarke et al. 2000).
8
Chapter 1. Introduction to the effect of fire regime on Australian tropical savannas.
Some species show enhanced germination after exposure to multiple germination cues,
such as heat shock and smoke (Keith 1997; Kenny 2000; Morris 2000). Several
different factors may be required to cue the germination of co-existing species and a
germination trigger for one species may inhibit the recruitment of an adjacent species
(Clarke et al. 2000; McIvor and Howden 2000). Such variation in germination
requirements may help explain levels of species diversity (Grubb 1977).
Several grasses of northern Australia show an after-ripening requirement, whereby the
embryo of fresh seed requires further time to mature before the seed will germinate
(Bell 1999). The after-ripening dormancy in these species expires during the dry season
allowing dense germination with the onset of the wet season (Andrew and Mott 1983;
McIvor and Howden 2000). Some tropical eucalypts and grasses have no apparent
innate seed dormancy, being capable of germination immediately after seed fall
(Setterfield 1997b; Crowley and Garnett 2001).
Few studies have quantified the link between fire and seed dormancy of tropical
savanna plants. Smoke-triggered germination has been documented for several tropical
species including Themeda triandra (Baxter et al. 1994), Callitris intratropica (Roche
et al. 1997) and Heteropogon contortus (Campbell et al. 1996). Heat shock has been
shown to promote several semi-arid shrubs, including Acacia aneura and Senna
nemophila (Hogkinson and Oxley 1990). Clearly fire plays a role in seed dormancy
release of some tropical savanna species, and therefore savanna function, and further
research is required to examine additional species.
1.3.4 The effect of fire regime on soil seed bank dynamics
Seed dormancy allows the development of seed storage, typically referred to as “seed
banks” (Harper 1977). Seed banks bridge the temporal gap between seed production
and seed germination, provide a storage mechanism for regeneration after disturbance
and can be essential where limited seed dispersal distances result in little seed
immigration from adjacent areas (Whelan 1986; Lunt 1997).
Seed can be stored on the plant or in the soil (Whelan 1995). The storage of seed in the
canopy is generally referred to as “serotiny” or “bradyspory” (Lamont et al. 1991;
9
Chapter 1. Introduction to the effect of fire regime on Australian tropical savannas.
Whelan 1995). Seed storage on or below the soil surface is referred to as the “soil seed
bank” and is the principal means of seed storage in Australian tropical savanna species
(Shaw 1957; Mott and Andrew 1985; Andrew 1986; McIvor 1987; Williams et al. in
press).
Many species do not produce a seed bank, as their seeds either germinate, rot or are
eaten by predators soon after seed fall (Crowley and Garnett 2001; Pettit and Froend
2001). Species whose seeds remain viable in the seed bank for less than a year are
referred to as possessing a “transient” seed bank (Thompson and Grime 1979). To
remain within a community, these species rely on the persistence of standing plants or
annual recruitment and seed production, or seed dispersal from outside the community.
Some species produce seeds that remain viable within a seed bank for many years. This
is referred to as a “persistent” seed bank and is an important storage mechanism,
especially for annual species that do not germinate every year (Thompson and Grime
1979; Bond and van Wilgen 1996).
Research into the seed banks of Australian tropical savanna species has primarily
focused on dominant grasses. While some, such as Alloteropsis semialata and
Dichanthium fecundum, produce no apparent seed bank, many annual and perennial
grasses produce a transient seed bank that expires just prior to further seed input during
the wet season (Andrew and Mott 1983; Mott and Andrew 1985; Crowley and Garnett
2001). Soil seed banks of tropical savanna trees and shrubs are rarely detected, and
when present, tend to be transient (McIvor 1987; Higgins et al. 2000; Rogers 2000;
Pettit and Froend 2001).
Fire can affect seed bank dynamics by influencing seed input, killing stored seed, or
promoting germination (Keith 1996). While the bradysporous seed banks tend to
increase with fire interval (e.g. Witkowski et al. 1991; Pannell and Myerscough 1993),
the effect of fire on soil seed banks is more variable. Zammit and Zedler (1988) found
fire interval influenced soil seed banks of one shrub and nine herbs in California
chaparral. The soil seed bank of several South African fynbos shrubs decline
immediately after fire, but do not show annual increases with time since fire (Pierce
and Cowling 1991).
10
Chapter 1. Introduction to the effect of fire regime on Australian tropical savannas.
Research in tropical savannas has indicated that, in addition to affecting seed
production (Setterfield 1997a), fire can affect soil seed banks through direct mortality
of surface seeds and enhanced seed predation (Crowley and Garnett 1999). Further
research is required to address the influence of fire on soil seed bank dynamics at a
community level in Australian tropical savannas.
1.3.5 The effect of fire regime on seedling emergence
The term “seedling emergence” is used throughout this thesis to signify the emergence
of seedlings above the soil surface, following seed germination. Micro-site, seed
dispersers and predators, seed dormancy triggers, and seasonal conditions influence the
density and rate of seedling emergence (Ashton 1979; McIvor and Gardener 1985;
Wellington 1989; Stoneman and Dell 1994; Clarke and Davidson 2001).
Seedling emergence may be cued to seasonal cycles, irregular climatic events or
disturbance. Many Australian tropical savanna trees and shrubs, including the dominant
eucalypts, are known to recruit seedlings episodically (Lacey 1974; Fensham 1992).
The emergence of many annual grass and forb seedlings occurs at the start of each wet
season, irrespective of fire (Andrew and Mott 1983; Brennan 1996; Crowley and
Garnett 1999; Crowley and Garnett 2001).
The influence of fire on seedling emergence varies, depending on many factors. These
include the size of the seed bank at the time of fire; the level of seed mortality during
fire; the proportion of the seed bank released from dormancy; and the loss of seed due
to predation, disease and desiccation before germination (Whelan 1995; Bond and van
Wilgen 1996; Keith 1996). While seedling emergence of some Australian tropical trees
may be greater in unburnt rather than burnt savanna (Setterfield 1997b), seedling
density of several perennial grasses, most notably Heteropogon contortus, is increased
by fire (Shaw 1957; Tothill 1969).
There are limited data on the complex factors promoting seedling emergence of
savanna species (Higgins et al. 2000) and more information is required on the influence
of fire on seedling emergence in northern Australia. Fire frequency and season affect
11
Chapter 1. Introduction to the effect of fire regime on Australian tropical savannas.
seedling emergence through their influence on seed bank size and fire intensity. Fire
intensity affects seed mortality and the release from seed dormancy.
1.3.6 The effect of fire regime on seedling survival
Seedling survival is an important process that can limit population growth (Keith
1996). Conditions that promote seedling survival may differ from those that increase
the density of seedling emergence (Lamont et al. 1993; Stoneman and Dell 1994;
Stoneman et al. 1994; Keith 2002). Seedling mortality can result from desiccation,
herbivory, insufficient nutrients, disease, shading, and disturbance (Lacey 1974;
Hoffman 1998; Facelli et al. 1999). Both inter- and intra-specific competition for
resources can be high for seedlings (Morgan 1998). Conversely, the establishment of
seedlings may be facilitated by adjacent plants (Kellman 1985). Resource competition,
herbivory and disease can lead to density-dependent mortality of seedlings (Andrew
1986; Whelan 1995; Bond and van Wilgen 1996).
Seedling survival can be strongly influenced by fire (Pate et al. 1990; Keith 1996).
Seedlings recruited into the immediate post-fire environment can benefit from reduced
competition and enhanced nutrient and light availability (Ashton and Chinner 1999).
Herbivore pressure may be either magnified or diminished, depending on species and
fire characteristics (Whelan and Main 1979; Keith 1996).
Percentage seedling survival in Australian tropical savannas varies between species,
sites and seasons (Andrew and Mott 1983; Setterfield 1997b; Crowley and Garnett
1999). Further information is required on the interaction of burning with other factors
that limit survival and the time required for seedlings to develop the capacity to survive
fire and to produce seed (i.e. the primary juvenile period, Gill 1975).
1.3.7 The effect of fire regime on the survival and growth of juvenile and mature
plants
The persistence of standing plants provides stability to a community (Bond and
Midgley 2001). Longevity of Australian tropical savanna species ranges from annuals
that survive as standing plants for less than one year, to trees that can survive for more
than one hundred years (Mucha 1979; Watkinson et al. 1989). Growth rates are related
12
Chapter 1. Introduction to the effect of fire regime on Australian tropical savannas.
to environmental factors, especially temperature, rainfall, and soil fertility (Barbour
1987). Both soil moisture and nutrients have been found to limit plant growth in
tropical savannas (Cook and Andrew 1991; Jackson and Ash 1998).
Fire can have a significant impact on the survival and longevity of plants. The mode of
post-fire regeneration forms the basis of several life history classifications (e.g. Noble
and Slatyer 1980; Gill 1981; Bond and van Wilgen 1996). Species that survive and
vegetatively regrow after complete canopy scorch are described as “sprouters” or
“resprouters” (Gill 1981; Whelan 1995; Bond and van Wilgen 1996; Keith 1996).
Vegetative regrowth can result from subterranean buds, located in rhizomes, roots and
the base of stems, which are insulated from lethal temperatures by the soil (Gill 1981).
Post-fire regeneration from subterranean buds can result in the proliferation of stems
(Lacey 1974; Hoffman 1998).
Sprouting may also originate from aerial buds, located on the trunk or branches. This is
described as “epicormic” sprouting and the insulation of aerial buds is provided by the
bark (Gill 1975; Burrows 2002). An additional sprouting mechanism, most notably
found in Xanthorrhoea spp., involves bud protection within the stem apex (Gill 1981).
Plants that are killed by fire when completely scorched are often described as “non-
sprouters” or “obligate seeders”, in reference to their reliance on regeneration via
seedlings (Gill 1981; Whelan 1995; Bond and van Wilgen 1996). The term “fire
ephemerals” is also used, in reference to plants that germinate in response to fire and
complete their life cycle within a few years (Pate et al. 1985; Whelan 1995).
Both plant survival and growth are affected by fire regime. High fire frequencies can
stunt juvenile plant growth by repeated top kill (Midgley and Bond 2001). Suppression
of juveniles through regular burning in savannas in high rainfall regions may be an
important factor limiting tree density and allowing the coexistence of grasses and trees
(Higgins et al. 2000). In the absence of fire, the growth of juveniles of tropical
eucalypts may be slower than that of other trees and may also require release from
overstorey competition (Bowman et al. 1988; Fensham 1990; Fensham and Bowman
1992; Russell-Smith et al. in press).
13
Chapter 1. Introduction to the effect of fire regime on Australian tropical savannas.
Frequent fire can cause mortality of sprouters if they are unable to replenish the
necessary bud or carbohydrate reserves, or protective tissue, within fire intervals
(Whelan 1995; Keith 1996). Perennial grasses, such as Heteropogon contortus and
Themeda triandra, may senesce during long fire intervals (e.g. more than five years),
and their populations decline due to an absence of fire-promoted seedling recruitment
to replace senesced individuals (Mott and Andrew 1985; Mott et al. 1985; Morgan and
Lunt 1999).
The intensity of a fire can affect plant mortality. Obligate seeders may survive low
intensity fires, when their canopy is not completely scorched (Gill 1981). Percentage
stem and whole-plant mortality of sprouter species is proportional to fire intensity
(Williams et al. 1999b). Fire season can also influence survival and re-growth (Bond
and van Wilgen 1996). The higher intensity, late dry season fires tend to produce
greater plant mortality than early fires in tropical savannas (Williams et al. 1999b). Soil
moisture at the time of burning and the period before post-fire rain can be critical for
plant survival. Up to 50% mortality of the perennial grass, Aristida latifolia, can result
from burning during the mid dry season, when there is no follow-up rain for two or
three months (Phelps 2001). Burning during a period of rapid growth may also cause
greater damage than when the plant is in a state of dormancy (Whelan 1995), and the
season of fire that causes the least damage to standing plants may be the very season
that produces the lowest density of seedling emergence and establishment (Keith 1996).
Further research is required to examine processes governing survival and growth in
tropical savannas. Variation in survival after different fire events may result from
differences in the survival of regenerative buds and/or the quantity of stored carbon
reserves (Bond and van Wilgen 1996). The dominance of sprouting species may
provide stability to savanna composition and therefore the survival of the passage of
fire by juveniles and mature plants may be a critical life event that maintains savanna
function.
14
Chapter 1. Introduction to the effect of fire regime on Australian tropical savannas.
1.4 This study
1.4.1 Aims of this study
The degree to which fire influences floristic patterns in Australian tropical savannas is
debated (Duff and Braithwaite 1989; Williams et al. 2002a). It has been argued that the
long history of frequent fire has lead to savanna communities that are resilient to fire
regimes and driven by edaphic and climatic factors (Wilson and Bowman 1987;
Bowman et al. 1988). While a high level of stability in floristic composition has been
demonstrated in response to a range of fire regimes, fire effects on species abundance
and savanna structure are apparent (Bowman and Panton 1995; Williams and Lane
1999; Russell-Smith et al. in press). Research into the influence of fire on floristic
patterns has primarily been carried out in the monsoonal regions of the Northern
Territory and Cape York Peninsula, so that less is known about the savannas of north-
eastern Australia, south of Cape York Peninsula.
Available information emphasises floristic patterns rather than the mechanisms that
determine patterns in Australian tropical savannas. Fire may limit population growth,
and therefore affect floristic patterns, through its influence on one or more life cycle
processes, including plant survival during the fire event and intervals between fires,
seed production and seedling recruitment (Whelan et al. 2002). Higgins et al. (2000)
proposed that the seedling emergence of trees, governed by rainfall, and the release of
stunted juvenile trees to the canopy, controlled by fire, may be critical events limiting
tree density in savannas and allowing the coexistence of grasses and trees. This
hypothesis requires testing in a range of savannas and further information is required on
the factors driving seedling recruitment of grasses and forbs. The ability of established
plants to sprout after fire may be a critical process that provides population stability
(Bond and Midgley 2001) and may explain reports of resilience in species composition
in frequently burnt savannas (e.g. Bowman et al. 1988; Williams et al. in press).
Given this theoretic context, this thesis focuses on patterns and processes in Australian
tropical savannas to:
1. determine the effect of a series of fires on floristic patterns in a tropical savanna in
north-eastern Australia; and
15
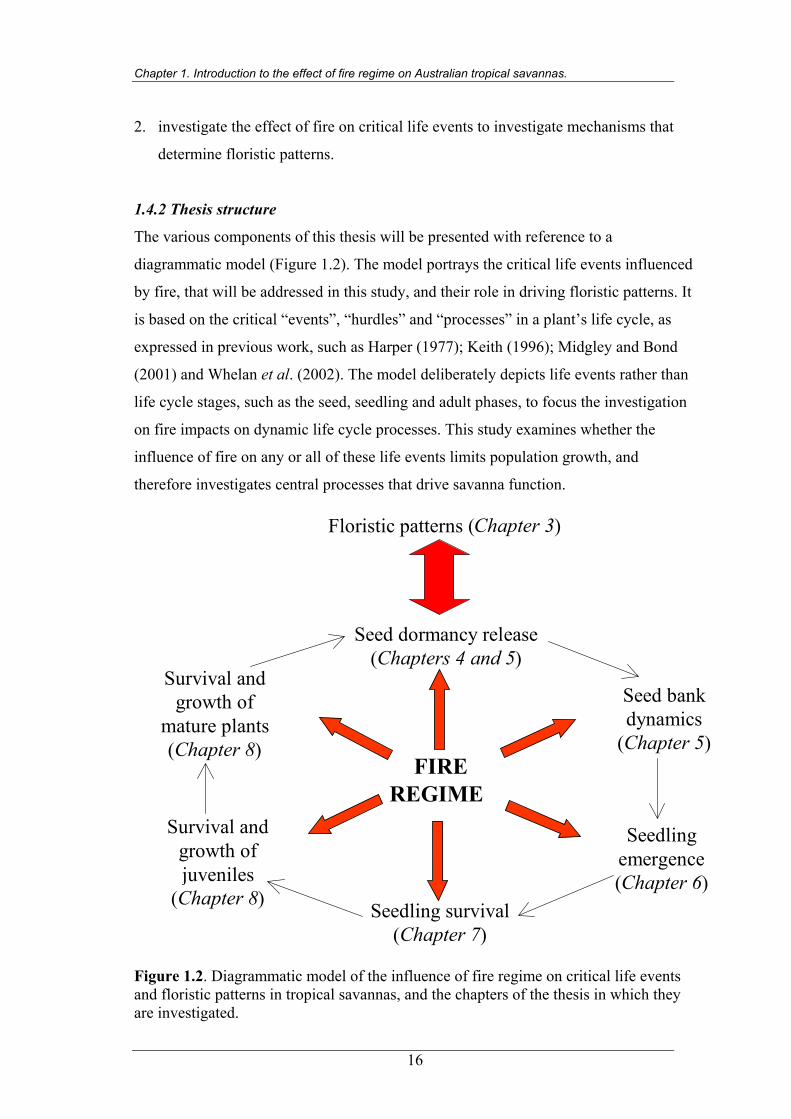
Chapter 1. Introduction to the effect of fire regime on Australian tropical savannas.
2. investigate the effect of fire on critical life events to investigate mechanisms that
determine floristic patterns.
1.4.2 Thesis structure
The various components of this thesis will be presented with reference to a
diagrammatic model (Figure 1.2). The model portrays the critical life events influenced
by fire, that will be addressed in this study, and their role in driving floristic patterns. It
is based on the critical “events”, “hurdles” and “processes” in a plant’s life cycle, as
expressed in previous work, such as Harper (1977); Keith (1996); Midgley and Bond
(2001) and Whelan et al. (2002). The model deliberately depicts life events rather than
life cycle stages, such as the seed, seedling and adult phases, to focus the investigation
on fire impacts on dynamic life cycle processes. This study examines whether the
influence of fire on any or all of these life events limits population growth, and
therefore investigates central processes that drive savanna function.
FIREREGIME
Seed dormancy release(Chapters 4 and 5)
Floristic patterns (Chapter 3)
Seed bankdynamics
(Chapter 5)
Seedlingemergence(Chapter 6)
Survival andgrowth ofjuveniles
(Chapter 8)
Survival andgrowth of
mature plants(Chapter 8)
Seedling survival(Chapter 7)
Figure 1.2. Diagrammatic model of the influence of fire regime on critical life events and floristic patterns in tropical savannas, and the chapters of the thesis in which they are investigated.
16
Chapter 1. Introduction to the effect of fire regime on Australian tropical savannas.
Chapter 2 describes the study site, climate and the design of a manipulative fire regime
experiment. Chapter 3 examines the dynamic patterns in species composition and
abundance in response to variation in fire regime. The assessment of floristic patterns is
based on changes detected over five years using annual plot surveys. Multivariate
analyses are used to detect community-level changes, and univariate analyses to
examine fire effects on the abundance of species groups and common species. Fuel load
dynamics and fire intensities are also examined.
Chapters 4 to 8 examine the effect of fire regime on critical life events to investigate the
way in which fire affects floristic patterns (Figure 1.2). The effect of fire on seed
production is only directly assessed for the dominant tree, Corymbia clarksoniana, and
seed dispersal is not specifically examined, however the outcome of these important
events are examined in the study of soil seed bank dynamics.
Chapter 4 examines the effect of fire on seed dormancy release of ten legumes (both
native and exotic) in a laboratory experiment that investigates the effects of exposure to
heat shock, smoke and nitrate on seed germination. These factors are related to the
passage of fire and have been shown to break seed dormancy in species of fire-prone
communities (Bell 1999). The temperatures during the passage of early and late dry
season fires are documented and the link between temperature elevation and depth of
seed germination in the topsoil is examined and interpreted with reference to the results
of the laboratory experiment.
Chapter 5 broadens the investigation of seed dormancy to examine a wide range of
species while investigating the effect of fire on seasonal and annual fluctuations in the
germinable soil seed bank. The dynamics in soil seed bank are related to fruiting
phenology and the species composition is also compared with that of the standing
vegetation documented in Chapter 3.
Chapter 6 assesses patterns of seedling emergence. It examines whether germination is
an annual wet season event or primarily a response to fire. An assessment is made of
the influence of fire season on seedling emergence, and the experimental removal of
herbaceous biomass is used to test the importance of ground cover removal during fire
17
Chapter 1. Introduction to the effect of fire regime on Australian tropical savannas.
18
on seedling emergence. A further experiment examines the safe site requirements for
the germination of the dominant tree, Corymbia clarksoniana. The species composition
of the seedling surveys is compared with that of the standing vegetation and germinable
soil seed bank detected in Chapters 3 and 5, to help determine processes involved with
seedling emergence.
Chapter 7 examines the influence of fire regime on seedling survival. It compares the
survival of seedlings that germinated from recently burnt savanna, unburnt savanna
with the herbaceous layer removed or undisturbed savanna. The fire tolerance of
seedlings of common perennial species is documented. The survival of seedlings of the
dominant tree C. clarksoniana is assessed three years after a mass germination event.
Chapter 8 documents the sprouting ability of all species and assesses the influence of
fire on the survival and growth of juvenile and mature trees, and the survival of
common herbs. This chapter also examines the effect of disturbance type (burning and
cutting) and season of disturbance on stem reproduction in a root suckering subshrub,
Breynia oblongifolia.
Chapter 9 ties together information on the effect of fire on critical life events to
interpret floristic patterns. The implications of the results are discussed in terms of
current concepts of the role of fire in tropical savanna function and the management of
tropical eucalypt savannas in north-eastern Australia.
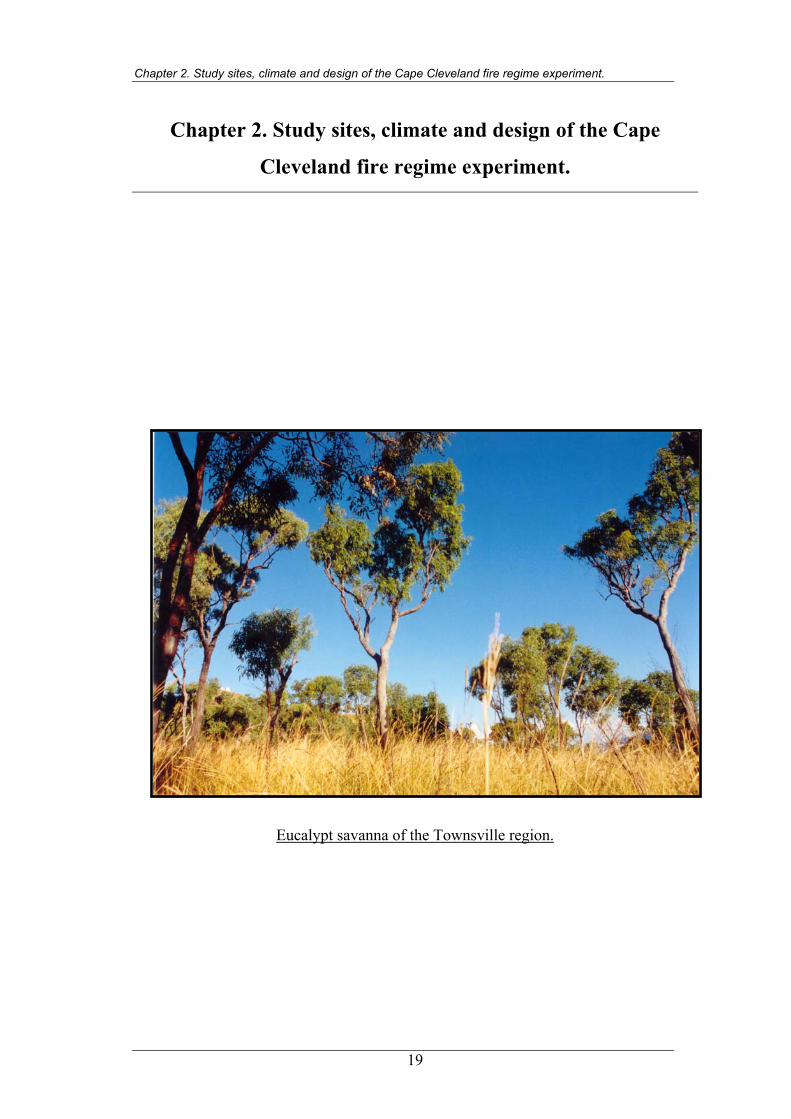
Chapter 2. Study sites, climate and design of the Cape Cleveland fire regime experiment.
Chapter 2. Study sites, climate and design of the Cape
Cleveland fire regime experiment.
Eucalypt savanna of the Townsville region.
19
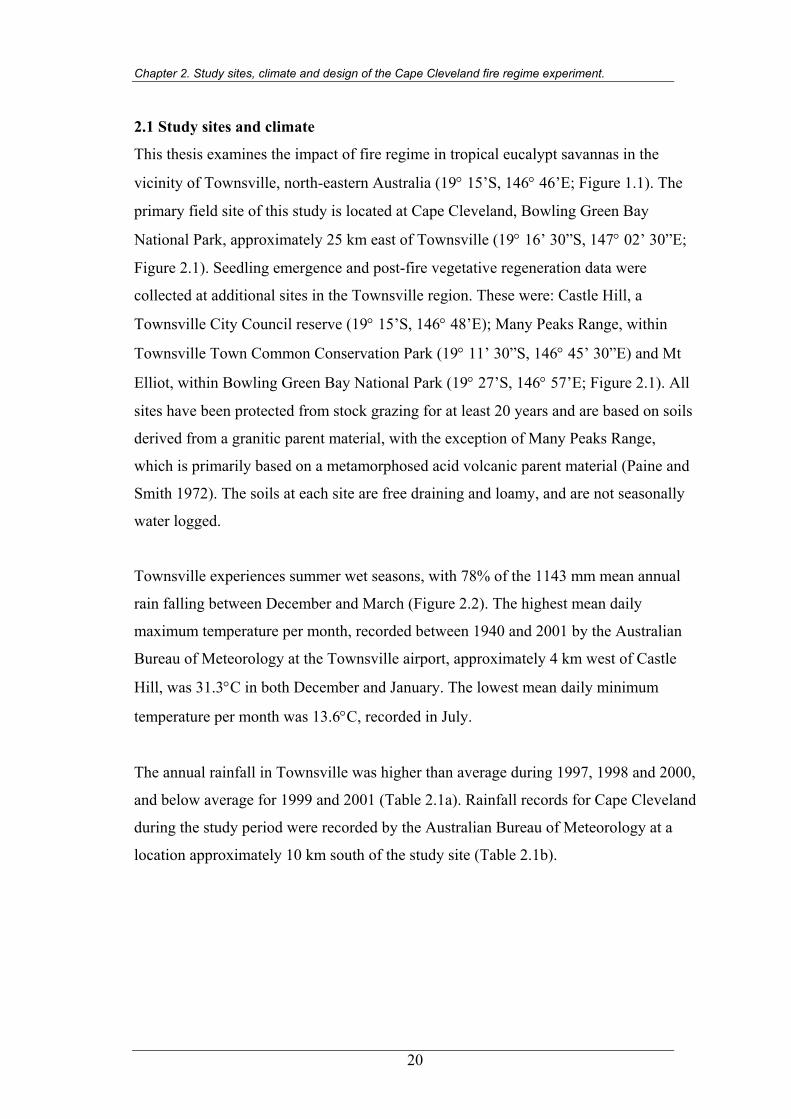
Chapter 2. Study sites, climate and design of the Cape Cleveland fire regime experiment.
2.1 Study sites and climate
This thesis examines the impact of fire regime in tropical eucalypt savannas in the
vicinity of Townsville, north-eastern Australia (19° 15’S, 146° 46’E; Figure 1.1). The
primary field site of this study is located at Cape Cleveland, Bowling Green Bay
National Park, approximately 25 km east of Townsville (19° 16’ 30”S, 147° 02’ 30”E;
Figure 2.1). Seedling emergence and post-fire vegetative regeneration data were
collected at additional sites in the Townsville region. These were: Castle Hill, a
Townsville City Council reserve (19° 15’S, 146° 48’E); Many Peaks Range, within
Townsville Town Common Conservation Park (19° 11’ 30”S, 146° 45’ 30”E) and Mt
Elliot, within Bowling Green Bay National Park (19° 27’S, 146° 57’E; Figure 2.1). All
sites have been protected from stock grazing for at least 20 years and are based on soils
derived from a granitic parent material, with the exception of Many Peaks Range,
which is primarily based on a metamorphosed acid volcanic parent material (Paine and
Smith 1972). The soils at each site are free draining and loamy, and are not seasonally
water logged.
Townsville experiences summer wet seasons, with 78% of the 1143 mm mean annual
rain falling between December and March (Figure 2.2). The highest mean daily
maximum temperature per month, recorded between 1940 and 2001 by the Australian
Bureau of Meteorology at the Townsville airport, approximately 4 km west of Castle
Hill, was 31.3°C in both December and January. The lowest mean daily minimum
temperature per month was 13.6°C, recorded in July.
The annual rainfall in Townsville was higher than average during 1997, 1998 and 2000,
and below average for 1999 and 2001 (Table 2.1a). Rainfall records for Cape Cleveland
during the study period were recorded by the Australian Bureau of Meteorology at a
location approximately 10 km south of the study site (Table 2.1b).
20
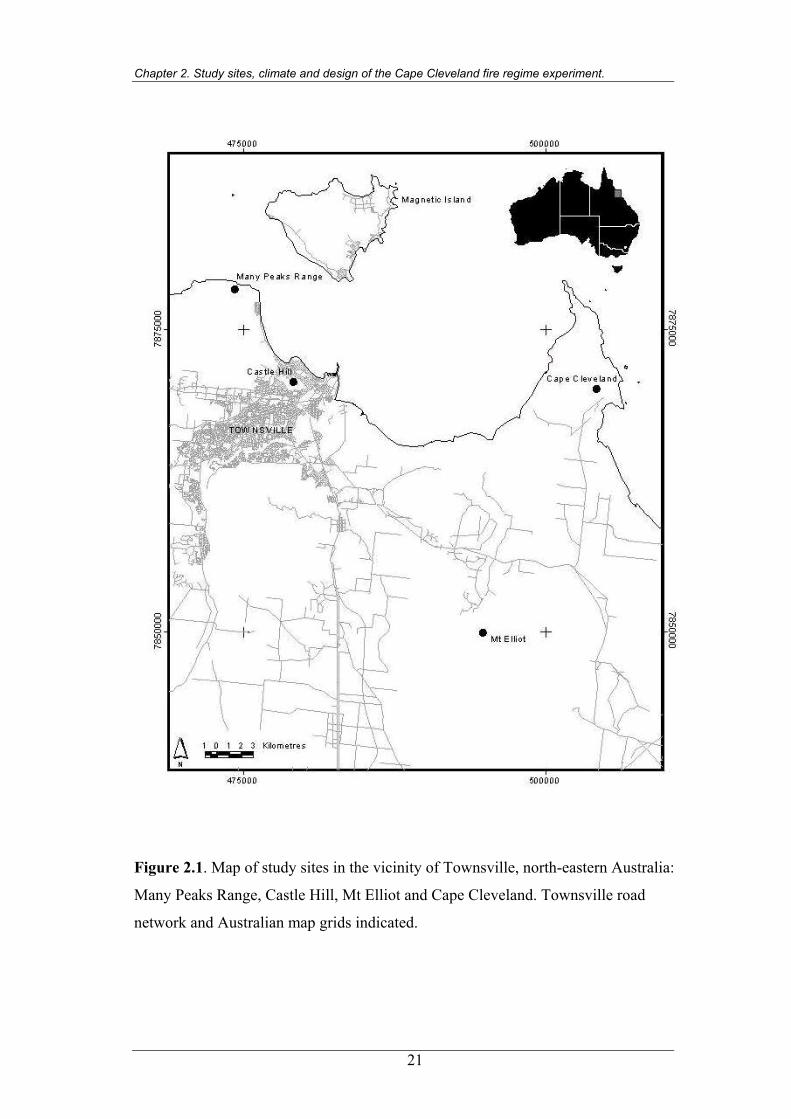
Chapter 2. Study sites, climate and design of the Cape Cleveland fire regime experiment.
Figure 2.1. Map of study sites in the vicinity of Townsville, north-eastern Australia:
Many Peaks Range, Castle Hill, Mt Elliot and Cape Cleveland. Townsville road
network and Australian map grids indicated.
21
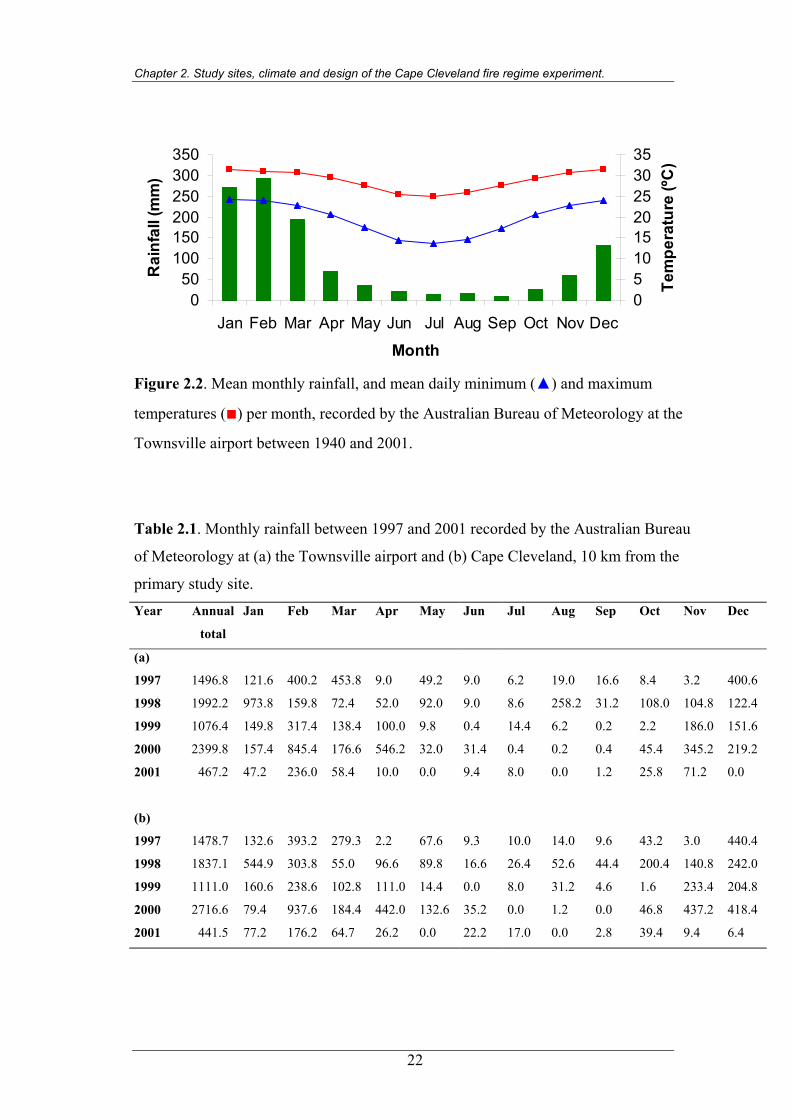
Chapter 2. Study sites, climate and design of the Cape Cleveland fire regime experiment.
Figure 2.2. Mean monthly rainfall, and mean daily minimum (▲) and maximum
temperatures (■) per month, recorded by the Australian Bureau of Meteorology at the
Townsville airport between 1940 and 2001.
050100150200250300350
Jan Feb Mar Apr May Jun Jul Aug Sep Oct Nov Dec
Month
Rai
nfal
l (m
m)
05101520253035
Tem
pera
ture
(ºC
)
Table 2.1. Monthly rainfall between 1997 and 2001 recorded by the Australian Bureau
of Meteorology at (a) the Townsville airport and (b) Cape Cleveland, 10 km from the
primary study site.
Year
Annual
total
Jan Feb Mar Apr May Jun Jul Aug Sep Oct Nov Dec
(a)
1997 1496.8 121.6 400.2 453.8 9.0 49.2 9.0 6.2 19.0 16.6 8.4 3.2 400.6
1998 1992.2 973.8 159.8 72.4 52.0 92.0 9.0 8.6 258.2 31.2 108.0 104.8 122.4
1999 1076.4 149.8 317.4 138.4 100.0 9.8 0.4 14.4 6.2 0.2 2.2 186.0 151.6
2000 2399.8 157.4 845.4 176.6 546.2 32.0 31.4 0.4 0.2 0.4 45.4 345.2 219.2
2001 467.2 47.2 236.0 58.4 10.0 0.0 9.4 8.0 0.0 1.2 25.8 71.2 0.0
(b)
1997 1478.7 132.6 393.2 279.3 2.2 67.6 9.3 10.0 14.0 9.6 43.2 3.0 440.4
1998 1837.1 544.9 303.8 55.0 96.6 89.8 16.6 26.4 52.6 44.4 200.4 140.8 242.0
1999 1111.0 160.6 238.6 102.8 111.0 14.4 0.0 8.0 31.2 4.6 1.6 233.4 204.8
2000 2716.6 79.4 937.6 184.4 442.0 132.6 35.2 0.0 1.2 0.0 46.8 437.2 418.4
2001 441.5 77.2 176.2 64.7 26.2 0.0 22.2 17.0 0.0 2.8 39.4 9.4 6.4
22
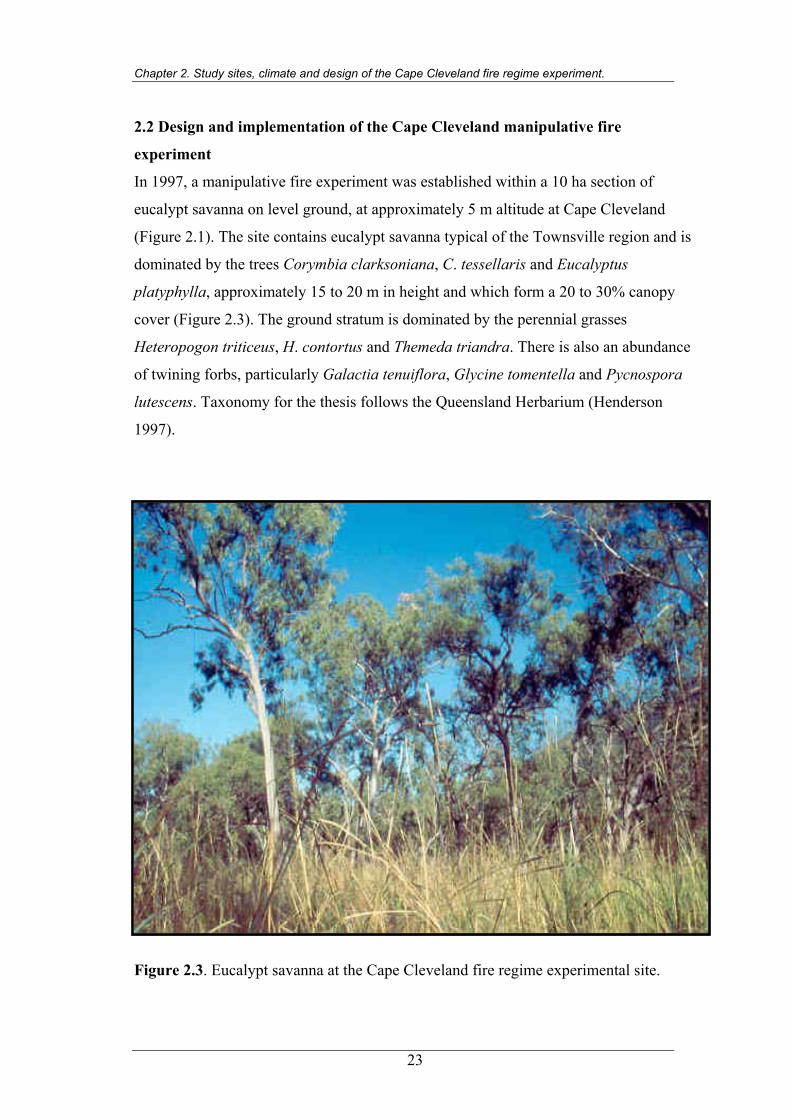
Chapter 2. Study sites, climate and design of the Cape Cleveland fire regime experiment.
2.2 Design and implementation of the Cape Cleveland manipulative fire
experiment
In 1997, a manipulative fire experiment was established within a 10 ha section of
eucalypt savanna on level ground, at approximately 5 m altitude at Cape Cleveland
(Figure 2.1). The site contains eucalypt savanna typical of the Townsville region and is
dominated by the trees Corymbia clarksoniana, C. tessellaris and Eucalyptus
platyphylla, approximately 15 to 20 m in height and which form a 20 to 30% canopy
cover (Figure 2.3). The ground stratum is dominated by the perennial grasses
Heteropogon triticeus, H. contortus and Themeda triandra. There is also an abundance
of twining forbs, particularly Galactia tenuiflora, Glycine tomentella and Pycnospora
lutescens. Taxonomy for the thesis follows the Queensland Herbarium (Henderson
1997).
Figure 2.3. Eucalypt savanna at the Cape Cleveland fire regime experimental site.
23
Chapter 2. Study sites, climate and design of the Cape Cleveland fire regime experiment.
The Cape Cleveland site was grazed by a low density of free ranging cattle from the
early 1900’s to the 1970’s (C. Adams pers. com. 1997). Queensland Parks and Wildlife
Service records indicate the eucalypt savanna of Cape Cleveland has a history of
regular fires, with intervals ranging from one to five years and typically occurring
between May to December. The trial site was burnt prior to this study by unplanned
fires in December 1990 and December 1994.
Three experimental fire regimes were implemented across the Cape Cleveland site,
between 1997 and 2001:
1. Control: savanna burnt mid dry season (July) 1997 only.
2. Early burnt: savanna burnt July 1997 and early dry season (May) 1999.
3. Late burnt: savanna burnt July 1997 and late dry season (Oct) 1999.
The benefit of this experimental design is that it examines fire regimes of mixed
intervals, intensity and season, typical of the Townsville region. One of the criticisms
of previous savanna fire trials has been the repeated implementation of fixed fire
regime treatments (e.g. successive annual early dry season fires), which were not true
representations of contemporary fire regimes (Russell-Smith et al. in press).
The entire 10 ha study site was deliberately burnt in the mid dry season of 1997, after
the establishment of permanent survey plots (Chapter 3). The fire was ignited at 1 pm,
15th July. The air temperature at ignition was 25º C, relative humidity was 54% and a
north-easterly wind was fluctuating around 8 km hr -1. Ignition began in the south-west
corner of the block and drip torches were used to guide the fire around the site
perimeter in both clock-wise and anti-clockwise directions along slashed fire lines. This
initial mid dry season fire was undertaken across the entire 10 ha area to provide
valuable pre-fire floristic data for all plots, including those that remained unburnt for
the remainder of the study (Chapter 3). While it is acknowledged that burning the
whole site as one unit in 1997 fire does not adequately replicate the mid dry season fire,
the unit of comparison for the experiment is the fire regime encompassing the five
years of study and no analyses were undertaken on responses to the 1997 fire in
isolation.
24
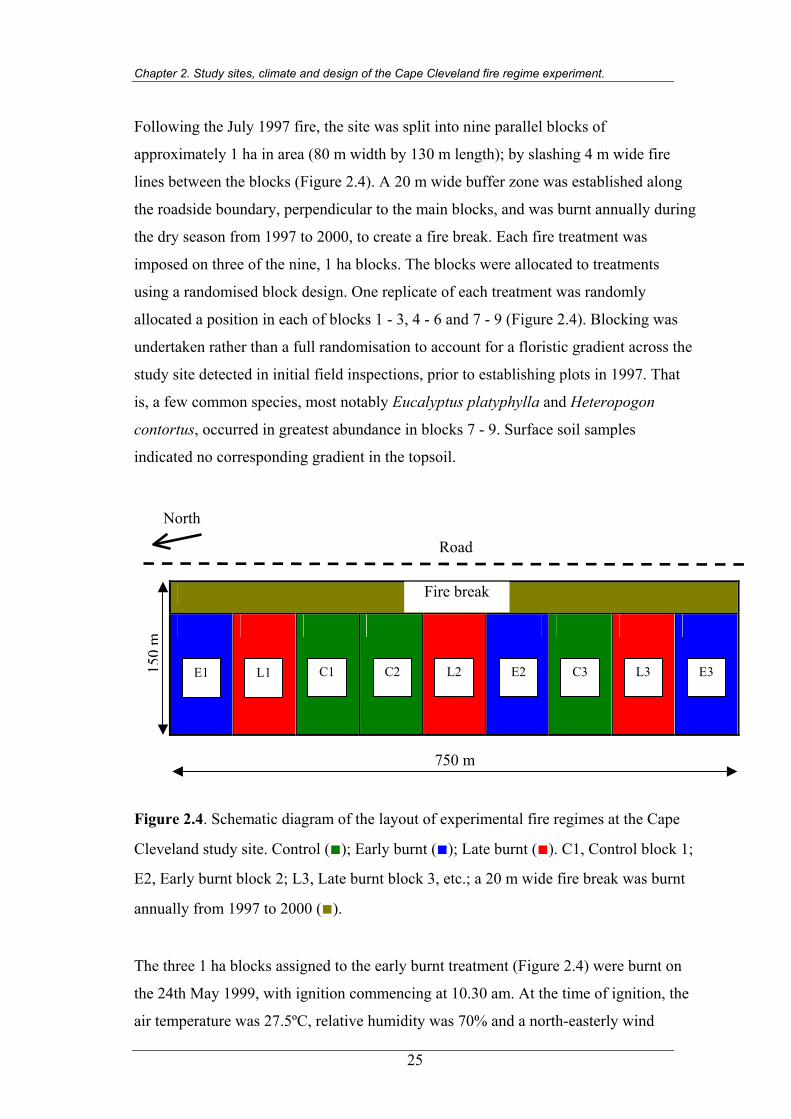
Chapter 2. Study sites, climate and design of the Cape Cleveland fire regime experiment.
Following the July 1997 fire, the site was split into nine parallel blocks of
approximately 1 ha in area (80 m width by 130 m length); by slashing 4 m wide fire
lines between the blocks (Figure 2.4). A 20 m wide buffer zone was established along
the roadside boundary, perpendicular to the main blocks, and was burnt annually during
the dry season from 1997 to 2000, to create a fire break. Each fire treatment was
imposed on three of the nine, 1 ha blocks. The blocks were allocated to treatments
using a randomised block design. One replicate of each treatment was randomly
allocated a position in each of blocks 1 - 3, 4 - 6 and 7 - 9 (Figure 2.4). Blocking was
undertaken rather than a full randomisation to account for a floristic gradient across the
study site detected in initial field inspections, prior to establishing plots in 1997. That
is, a few common species, most notably Eucalyptus platyphylla and Heteropogon
contortus, occurred in greatest abundance in blocks 7 - 9. Surface soil samples
indicated no corresponding gradient in the topsoil.
150
m
North
E2 L2 C2 C1 L1 E1
Road
Fire break
C3 L3 E3
750 m
Figure 2.4. Schematic diagram of the layout of experimental fire regimes at the Cape
Cleveland study site. Control (■); Early burnt (■); Late burnt (■). C1, Control block 1;
E2, Early burnt block 2; L3, Late burnt block 3, etc.; a 20 m wide fire break was burnt
annually from 1997 to 2000 (■).
The three 1 ha blocks assigned to the early burnt treatment (Figure 2.4) were burnt on
the 24th May 1999, with ignition commencing at 10.30 am. At the time of ignition, the
air temperature was 27.5ºC, relative humidity was 70% and a north-easterly wind
25
Chapter 2. Study sites, climate and design of the Cape Cleveland fire regime experiment.
26
remained < 5 km hr -1. The three 1 ha blocks assigned to the late burnt treatment
(Figure 2.4) were burnt on the 13th October 1999, with ignition commencing at 8.10
am. At the time of ignition, the air temperature was 28ºC, relative humidity was 53%
and a north-easterly wind typically ranged from 5 to 10 km hr -1. The implementation
technique used for the early and late dry season fires was the same as that described for
the July 1997 fire. Ignition began in the south-west corner of the relevant block and the
fire was guided around the perimeter of the block in both clock-wise and anti-clockwise
directions using drip-torches.
Surveys of standing plants and seedlings were undertaken across the Cape Cleveland
study site between 1997 and 2001. The specific methodologies for assessing floristic
patterns and the effect of fire on critical life events at Cape Cleveland and additional
sites, at Castle Hill, Many Peaks Range and Mt Elliot (Figure 2.1), are described in
Chapters 3 to 7.
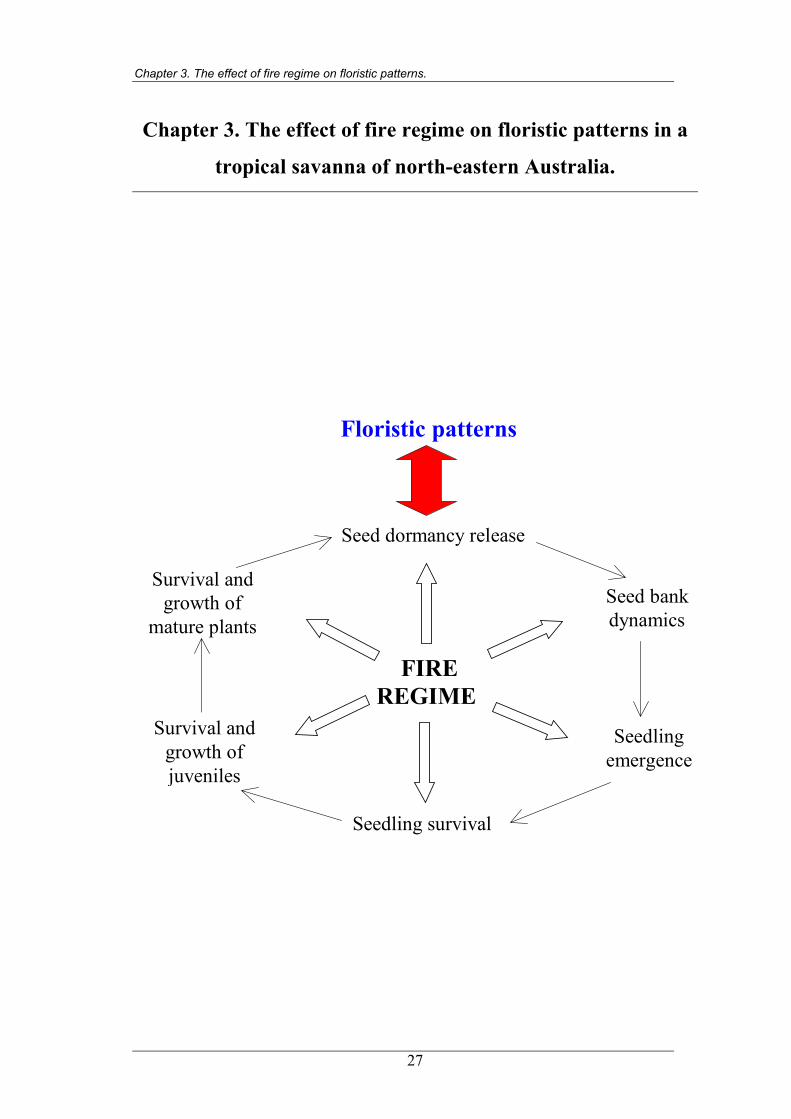
Chapter 3. The effect of fire regime on floristic patterns.
Chapter 3. The effect of fire regime on floristic patterns in a
tropical savanna of north-eastern Australia.
FIREREGIME
Seed dormancy release
Floristic patterns
Seed bankdynamics
Seedlingemergence
Survival andgrowth ofjuveniles
Survival andgrowth of
mature plants
Seedling survival
27
Chapter 3. The effect of fire regime on floristic patterns.
3.1 Introduction
Australian tropical savannas display stability of floristic composition in response to a
range of fire regimes (Bowman et al. 1988; Williams et al. in press). However, fire
regime can affect floristic patterns, primarily through changes in species abundance
rather than significant species replacement (Bowman et al. 1988; Fensham 1990;
Lonsdale and Braithwaite 1991; Russell-Smith et al. in press).
Contrasting responses to fire frequency have been detected in savanna species. For
instance, the annual grass Sorghum stipoideum, and the sprouting shrub Grevillea
goodii increase in density with annual burning, while the perennial grass Alloteropsis
semialata and the obligate seeder shrub Acacia holosericea show a preference for
longer fire intervals (Russell-Smith et al. in press; Williams et al. in press). The density
of some savanna trees, especially non-eucalypts, also increase with fire intervals of
three or more years (Sandercoe 1988; Pressland et al. 1989; Fensham 1990; Bowman
and Panton 1995; Williams et al. 1999b). Eucalypts vary in their response to fire
protection, with increased tree density documented in several species, including
Eucalyptus tetrodonta, whereas the density of E. miniata remains stable, even after 21
years of fire exclusion (Fensham 1990; Bowman and Panton 1995; Russell-Smith et al.
in press).
The timing and intensity of fire can affect floristic patterns in Australian tropical
savannas. The mortality of woody species is directly related to fire intensity (Williams
et al. 1999b). Late dry season fires can promote some grasses, such as Heteropogon
contortus, while earlier dry season fires may promote others, including Themeda
triandra (Shaw 1957; Walker et al. 1989; Orr et al. 1991). Wet season fires can reduce
the abundance of both annual and perennial grasses, while promoting some annual
forbs (Williams and Lane 1999). The abundance of many woody and herbaceous
species is also correlated with climatic, edaphic and topographic variables (Fensham
1990; Williams et al. 2002a).
Much of the research into fire effects on floristic patterns in Australian tropical
savannas has centred on the monsoonal regions of the Northern Territory and, to a
lesser extent, Cape York Peninsula (e.g. Bowman et al. 1988; Fensham 1990; Crowley
28
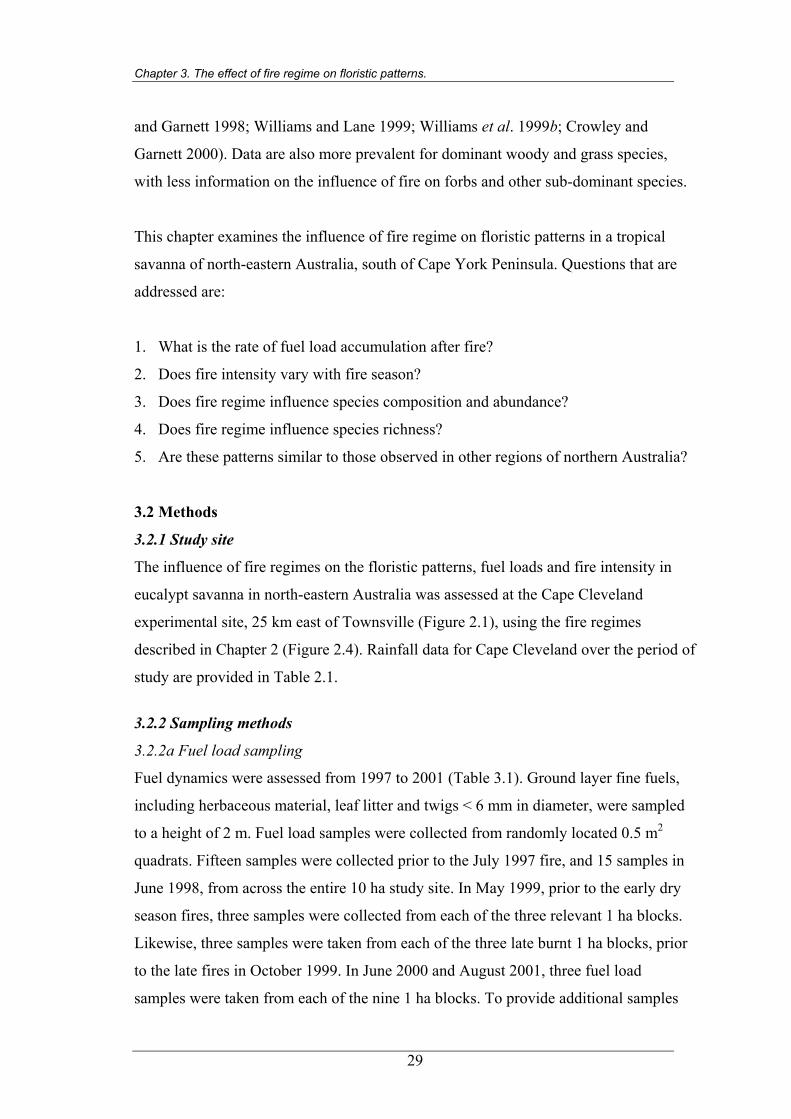
Chapter 3. The effect of fire regime on floristic patterns.
and Garnett 1998; Williams and Lane 1999; Williams et al. 1999b; Crowley and
Garnett 2000). Data are also more prevalent for dominant woody and grass species,
with less information on the influence of fire on forbs and other sub-dominant species.
This chapter examines the influence of fire regime on floristic patterns in a tropical
savanna of north-eastern Australia, south of Cape York Peninsula. Questions that are
addressed are:
1. What is the rate of fuel load accumulation after fire?
2. Does fire intensity vary with fire season?
3. Does fire regime influence species composition and abundance?
4. Does fire regime influence species richness?
5. Are these patterns similar to those observed in other regions of northern Australia?
3.2 Methods
3.2.1 Study site
The influence of fire regimes on the floristic patterns, fuel loads and fire intensity in
eucalypt savanna in north-eastern Australia was assessed at the Cape Cleveland
experimental site, 25 km east of Townsville (Figure 2.1), using the fire regimes
described in Chapter 2 (Figure 2.4). Rainfall data for Cape Cleveland over the period of
study are provided in Table 2.1.
3.2.2 Sampling methods
3.2.2a Fuel load sampling
Fuel dynamics were assessed from 1997 to 2001 (Table 3.1). Ground layer fine fuels,
including herbaceous material, leaf litter and twigs < 6 mm in diameter, were sampled
to a height of 2 m. Fuel load samples were collected from randomly located 0.5 m2
quadrats. Fifteen samples were collected prior to the July 1997 fire, and 15 samples in
June 1998, from across the entire 10 ha study site. In May 1999, prior to the early dry
season fires, three samples were collected from each of the three relevant 1 ha blocks.
Likewise, three samples were taken from each of the three late burnt 1 ha blocks, prior
to the late fires in October 1999. In June 2000 and August 2001, three fuel load
samples were taken from each of the nine 1 ha blocks. To provide additional samples
29
Chapter 3. The effect of fire regime on floristic patterns.
from recently burnt savanna, four samples were collected from the annually burnt
roadside fire break block in September 1998 and three in May 1999. All fuel load
samples were oven dried at 65ºC for at least 48 hours prior to weighing.
Table 3.1. Summary of fuel samples from eucalypt savanna at Cape Cleveland. Date of collection Number of
samples (0.5m2)
Fire regime Years since fire
July 1997 15 Combined 3
June 1998 15 Combined 1
September 1998 4 Annual fire (roadside fire break) 1
May 1999 9 Early burnt 2
May 1999 3 Annual fire (roadside fire break) 1
October 1999 9 Late burnt 2
June 2000 9 Control 3
June 2000 9 Early burnt 1
June 2000 9 Late burnt 1
August 2001 9 Control 4
August 2001 9 Early burnt 2
August 2001 9 Late burnt 2
3.2.2b Fire intensity sampling
The entire 10 ha study site was burnt in a single fire implemented in the mid dry season
of 1997 (Chapter 2) and the rate of spread was determined at ten separate locations
across the site. At each location, two metal markers, spaced between 2 m and 7 m apart,
were dropped in front of, and perpendicular to, the fire front. The time taken for the fire
front to move between markers was recorded. The exact distance between the markers
was measured after the fire and the rate of spread calculated by dividing the distance
between the markers by the time taken for the fire to move between them. The mean
from the ten measurements was used as the rate of spread in the calculation of fire
intensity for the 1997 fire.
The rate of spread estimates of the early and late dry season 1999 fires differed from
that of the 1997 fire. The time taken for the fire front to move between two or three
pairs of trees was measured from the fire line. This is a less precise, although still
effective, measure of fire spread than that of the July 1997 fire, but was necessary as all
30
Chapter 3. The effect of fire regime on floristic patterns.
personnel were involved in implementing the 1999 fires. While the ground layer was
completely combusted during the October 1999 fires, there were unconsumed grass
stalks after the May 1999 fires, up to 0.75 m in height. Three 0.5 m2 samples of the
remaining fuel were collected and used to subtract from the original fuel load to
provide a figure of fuel actually consumed in the fire. The post-fire fuel load after the
July 1997 fire was not quantified, and therefore is a slightly high estimate of fire
intensity.
Fire intensity was calculated using the standard equation (Byram’s fire line intensity):
Fire intensity = heat yield of burnt fuel (constant of 20 000 kJ kg-1) X fuel consumed in
fire (g m-2) X rate of fire spread (m sec-1) (Byram 1959; Gill and Knight 1991).
3.2.2c Floristic sampling
Species composition and abundance data were sampled at Cape Cleveland to determine
the effect of fire on floristic patterns. Studies of fire regimes in tropical savannas of the
Northern Territory have detected only subtle and sometimes variable species responses
(e.g. Bowman et al. 1998). This lead Lonsdale and Braithwaite (1991) to recommend
the use of repeated surveys of permanent plots to document species change over time,
rather than once-off comparative studies of plots with different recent fire histories.
Repeated surveys have been successful in detecting significant floristic patterns in
response to fire regimes in savannas of the Northern Territory (Hoare et al. 1980;
Russell-Smith et al. in press; Williams et al. in press).
Changes in species abundance were determined using annual surveys of permanently
marked plots at the Cape Cleveland study site. A pilot study was used to determine an
appropriate plot size, through an assessment of the relationship between species
richness and plot area. A species-area curve was produced using 20 separate plots, each
with nested sub-plots increasing in size from 1 m2 to 400 m2 (Figure 3.1). The point
where the species- area curve begins to plateau, in this case at 100 m2, is considered the
minimal area required for effective samples, although the value of “minimal area” has
been debated (Barbour et al. 1987). Plots of 100 m2 have successfully detected floristic
patterns in previous studies in Australian tropical savannas (Bowman et al. 1988;
Fensham 1990). Four spatially separate plots were used to sample the variation across
31
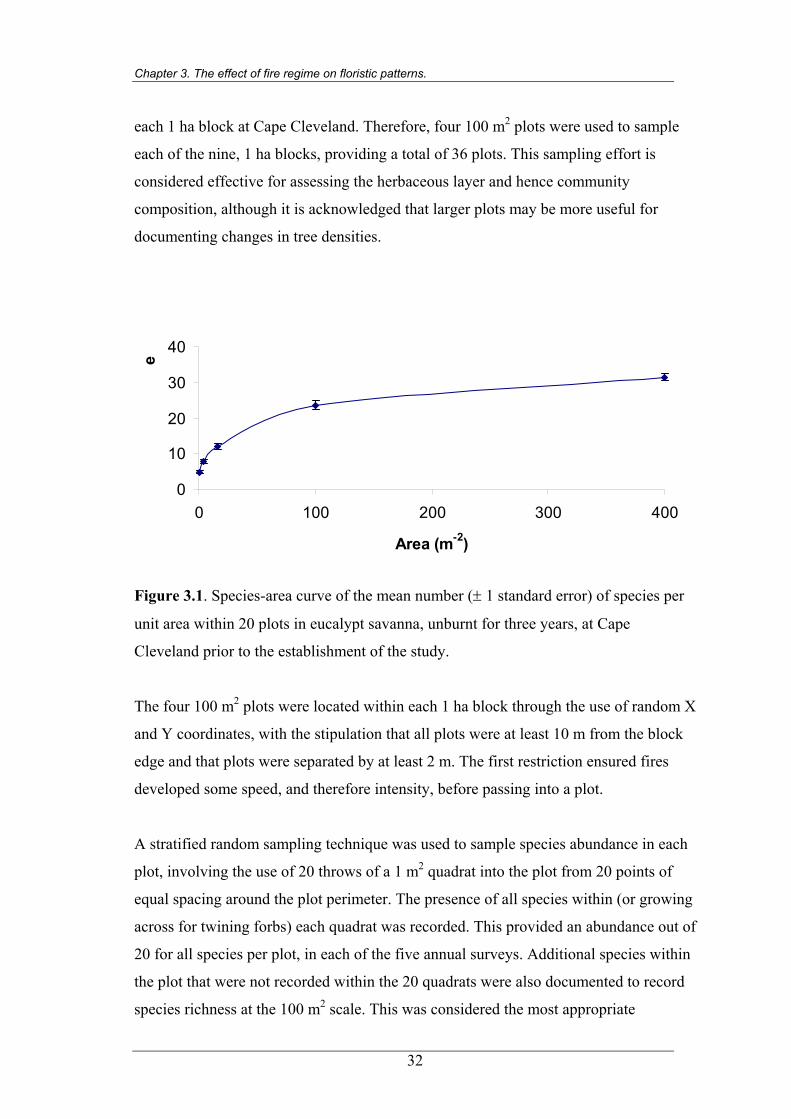
Chapter 3. The effect of fire regime on floristic patterns.
each 1 ha block at Cape Cleveland. Therefore, four 100 m2 plots were used to sample
each of the nine, 1 ha blocks, providing a total of 36 plots. This sampling effort is
considered effective for assessing the herbaceous layer and hence community
composition, although it is acknowledged that larger plots may be more useful for
documenting changes in tree densities.
s
eci
f sp
er o
mb
Nu
0
10
20
30
40
0 100 200 300 400
Area (m-2)
e
Figure 3.1. Species-area curve of the mean number (± 1 standard error) of species per
unit area within 20 plots in eucalypt savanna, unburnt for three years, at Cape
Cleveland prior to the establishment of the study.
The four 100 m2 plots were located within each 1 ha block through the use of random X
and Y coordinates, with the stipulation that all plots were at least 10 m from the block
edge and that plots were separated by at least 2 m. The first restriction ensured fires
developed some speed, and therefore intensity, before passing into a plot.
A stratified random sampling technique was used to sample species abundance in each
plot, involving the use of 20 throws of a 1 m2 quadrat into the plot from 20 points of
equal spacing around the plot perimeter. The presence of all species within (or growing
across for twining forbs) each quadrat was recorded. This provided an abundance out of
20 for all species per plot, in each of the five annual surveys. Additional species within
the plot that were not recorded within the 20 quadrats were also documented to record
species richness at the 100 m2 scale. This was considered the most appropriate
32
Chapter 3. The effect of fire regime on floristic patterns.
estimation of species abundance, although frequency does not distinguish abundance
within each quadrat. A pilot trial of percentage cover estimates indicated large variation
between re-assessments of quadrats, making this sampling unrepeatable. The difficulty
in this method arose from the difficulty in estimating the comparative cover of
different growth forms, particularly tufted grasses, woody species and the twining
forbs. Point cover estimates did not detect the many sub-dominant species. Density
counts were not possible for many herbaceous and multi-stemmed subshrub species, as
individual plants could not be distinguished. Density measures are effective for many
woody species, and counts of the dominant trees were undertaken during the annual
surveys to document survival and growth, which are presented in Chapter 8. However a
single measure of species abundance was required to assess floristic patterns at a
community level, and therefore density was not appropriate.
All of the 36 plots were surveyed annually for five years (1997 to 2001), in the late wet
to early dry seasons (March to May), to ensure detection of annual species. Thus the
five annual surveys provided a total of 180 survey records.
3.2.3 Statistical analyses
3.2.3a Fuel load analyses
Analyses of variance (ANOVA) were performed separately on the 2000 and 2001 fuel
loads, to assess the significance of variations between the three fire treatments (unburnt
control, and burnt early and late dry season 1999). A third ANOVA assessed the
significance of differences in fuel load between times since last fire categories, with
samples grouped to the nearest year. All univariate analyses in this thesis were
computed using the Statistica program (StatSoft 1999). The ANOVA assumption of
homogeneity of variances was assessed using Cochran’s test (Underwood 1997). Log
(x) transformations were required to resolve variance heterogeneity in the analysis of
the 2000 fuel loads.
3.2.3b Fire intensity analyses
A t-test was used to examine differences between the May and October 1999 fires. No
statistical comparisons were made using the July 1997 fire data, due to a lack of
33
Chapter 3. The effect of fire regime on floristic patterns.
replication. A Cochran’s test indicated homogeneity of variances of raw data, hence no
transformations were required.
3.2.3c Multivariate analyses of floristic dynamics
The aim of the multivariate analyses was to determine community level dynamics in
floristic composition and abundance. This was done by comparing the species
composition and abundance data for the 180 surveys of the 36 plots, as well as
comparisons of the fire treatments in a subset of years. The term “survey(s)” is used
here to refer to the floristic composition and abundance data collected during one or
more annual inspections of the 36 permanent plots at Cape Cleveland.
First, to detect the influence of fire regime on floristic composition, a cluster analysis
was performed on the 180 surveys, based on species composition data (i.e. species
presence or absence), using the PATN program (Belbin 1995). An agglomerative
hierarchical method of clustering was performed using the Kulczynski distance
measure and group average linkage agglomerate technique (unweighted pair group
arithmetic averaging, UPGMA; Belbin 1995). The Kulczynski distance measure
calculates similarity scores for plots, based on comparisons of species presence or
absence in each survey. This distance measure is effective in determining survey
similarities for ecological data (Faith et al. 1987). The UPGMA technique groups
surveys based on the similarities scores for the centre of each developing cluster, and is
especially useful for grouping surveys with compositions intermediate between two
clusters (McArdle 2001). The resulting clusters were presented in a dendrogram.
An additional cluster analysis was performed using species abundance scores
documented in the 180 surveys. This analysis incorporates fluctuations in species
abundance with the compositional data to assess the influence of fire on both species
composition and abundance. The cluster analysis was undertaken using the same
technique described above, with the Kulczynski distance measure and the group
average linkage agglomerate technique, based on species abundance rather than
presence or absence data, and was computed using the PATN program (Belbin 1995).
34
Chapter 3. The effect of fire regime on floristic patterns.
Secondly, a Principle Components Analysis (PCA) was performed on the species
composition and abundance data using the CANOCO program (ter Braak and Smilauer
1998). PCA, which is an ordination technique, displays the inter-relationships between
all surveys, without forcing them into groups (ter Braak and Wiertz 1994). PCA is a
linear response model, which is appropriate when the variation between surveys is
narrow, such as this study of repeated annual surveys of permanent plots (ter Braak and
Prentice 1988). Other ordination methods, such as semistrong hybrid multidimensional
scaling, were assessed and produced similar scatterplots.
A PCA was undertaken to look at community composition and abundance relationships
for all 180 surveys (1997-2001), and the results are presented in a scatter plot. To assist
in the interpretation of the PCA of the entire 180 surveys, an additional scatter plot was
produced using the mean PCA coordinates for each fire regime, for each of the five
years.
Thirdly, a partial Redundancy Analysis (RDA) was used to assess the correlation
between species composition and fire variables, using the CANOCO program (ter
Braak and Smilauer 1998). A RDA is based on PCA and performs a multiple regression
of environmental variables and species abundance data (McArdle 2001). A “partial”
RDA uses additional environmental variables as covariates, to help decipher the unique
effect of the environmental variables of interest. For example, Morrison et al. (1995)
used time since last fire as a covariate to focus an analysis onto the effect of inter-fire
interval of species abundance. A partial RDA is especially useful for examining
permanent plot data, because it allows the removal of background effects, such as
intrinsic plot differences and fluctuations over time that are consistent to all treatments
(ter Braak and Smilauer 1998).
A partial RDA was performed for the entire data set (1997 to 2001 surveys) to correlate
species composition with elements of the fire regime. Knowledge of the fire history of
the area prior to 1997 (i.e. fires in December 1990 and 1994) allowed allocation of fire
variables for the initial 1997 plot surveys. The fire variables correlated with species
composition were: (i) time since last fire (years); (ii) fire interval prior to last fire
(years); and (iii) season of last fire. Fire season alternatives used were early dry (May),
35
Chapter 3. The effect of fire regime on floristic patterns.
mid dry (July), late dry (October) and early wet season (December). The fire seasons
were represented as nominal variables. That is, each of the four fire season options
were represented by a separate row in the spread sheet being analysed and surveys were
allocated a zero or one to indicate the relevant fire season (ter Braak and Smilauer
1998).
Three covariates were used to remove background differences between the 180 surveys
that were not attributable to fire variables. The 36 plots were identified as covariables.
This allowed the removal of background differences between plots that were
irrespective of the fire treatments. As a randomised block design was used in the survey
design (Chapter 2; Figure 2.4), blocking was used as a covariate to remove differences
between the three groups of blocks across the trial plot (i.e. C, E and L block 1; C, E
and L block 2; C, E and L block 3; Figure 2.4). The third covariate used was the year of
survey (1997 to 2001), which allowed the removal of annual fluctuations not
attributable to fire treatments.
A partial RDA of the 1999 and 2000 surveys assessed the effect of fire season on
species composition and abundance in the year following fire. An additional fire
variable, fire intensity (using logged data due to large variances), was available for this
analysis because the intensity of the most recent fire was known for both 1999 and
2000 recordings. Fire intensity data was not available for analysis of the full 1997 to
2001 data set, because the intensity of the fire prior to the initial 1997 recordings (i.e.
the 1994 fire) was unknown.
The analyses of both the 1997 to 2001 surveys and the 1999 and 2000 subset, followed
ter Braak and Smilauer’s (1998) recommendations for before and after, control and
impact (BACI) studies. Monte Carlo permutations (199 permutations for each analysis)
were used to assess the significance of the correlation between species variation and
environmental variables. This is a test of significance obtained by repeated shuffling of
samples (ter Braak and Smilauer 1998). The annual surveys were permutated as a time-
series of the 36 plots.
36
Chapter 3. The effect of fire regime on floristic patterns.
Initially all fire variables were analysed as a group, with the plot, block and year of
survey as covariates. This determined the variance in species abundance explained by
the fire variables. A forward selection analysis was then undertaken on the individual
fire variables, which is analogous to a post-hoc test (ter Braak and Smilauer 1998). The
importance of each individual fire variable was ranked and the species variation
explained separately by each fire variable was denoted as “Lambda-1”. Lambda-1 is the
eigenvalue of the ordination when only that individual variable is used with the
covariables. Secondly, a model is produced to determine the best combination of fire
variables for explaining species variation. The variable with the largest Lambda-1 is
used as the basis, with separate variables subsequently tested to see which combination
of two variables provides the best explanation of species variance. The significance to
the model of the additional variable is tested using a Monte Carlo permutation test.
“Lambda-A” describes the additional species variance explained by the fire variable,
given those already in the model. This continues until no further correlation with the
species dataset can be provided by extra fire variables.
To quantify the relative effect of the three covariates and their interactions, separate
analyses were run using plot and then years, with the remaining two covariates plus the
fire variables designated as “covariables”, as described by ter Braak and Smilauer
(1998, pp. 263 - 266). The floristic variation accounted for by specific variables and
interactions is denoted as “% variation explained”. This is the sum of canonical
eigenvalues for each respective analysis, and is analogous to the sums of squares in
ANOVA (ter Braak and Smilauer 1998). The significance of specific variables was
assessed using a Monte Carlo test with 199 permutations. As blocking was a
fundamental element in the analyses, it could not be analysed separately as an
independent variable. The assessment of species variance between blocks was
calculated by deducting the sum of all unconstrained eigenvalues from the total
variance of 1.0. The unexplained variance represents the variance that remains after
fitting all variables, including blocks, and was calculated as the sum of all
unconstrained eigenvalues minus the sum of all canonical eigenvalues (ter Braak and
Smilauer 1998).
37
Chapter 3. The effect of fire regime on floristic patterns.
3.2.3d Univariate analyses of species richness and abundance
The aim of the univariate analyses was to examine the response to fire regime of
individual species and growth form groups. Univariate analyses assessed the effects of
fire regime, rather than survey clusters or axes determined from mulitvariate analyses.
This is a more direct assessment of fire regime and Lonsdale and Braithwaite (1991)
argued that univariate analyses of groups determined from DCA analyses were not
sensitive to the variable and subtle species dynamics in tropical savannas.
Species were grouped according to growth form to aid the interpretation of fire
response, and their abundance scores were summed to provide the abundance of each
growth form. The determination of growth form groups is presented in Figure 3.2. All
species were first separated into woody and herbaceous species, due to the importance
of these functionally distinct groups (Walker 1985). The woody species were divided
into trees and shrubs, and subshrubs, based on height at maturity (the latter group being
less than 2 m; Harden 1990). The trees and shrubs were then separated into woodland
and rainforest species, because these two groups may respond differently to fire
regimes. The distinction between these groups is subjective, with species more
commonly found in savanna than rainforest allocated to the “woodland trees and
shrubs” group. The selection of species within the “rainforest” group was conservative
and restricted to those primarily found within rainforest patches, rather than ecotonal
species.
Herbaceous species were first split into monocotyledons and dicotyledons (i.e. forbs as
defined by Harden 1990). The grasses were assessed separately from all other
monocotyledons due to the significance of grasses in savanna function (Higgins et al.
2000). All monocotyledons other than grasses were broadly labelled as “non-grass
monocots”.
Herbaceous dicotyledons were separated into perennial and ephemeral forbs. The latter
typically complete their life cycle within a year, although a few individuals of these
species may survive into a second year. The perennial forbs were divided on the basis
of growth form into twining and upright forbs.
38
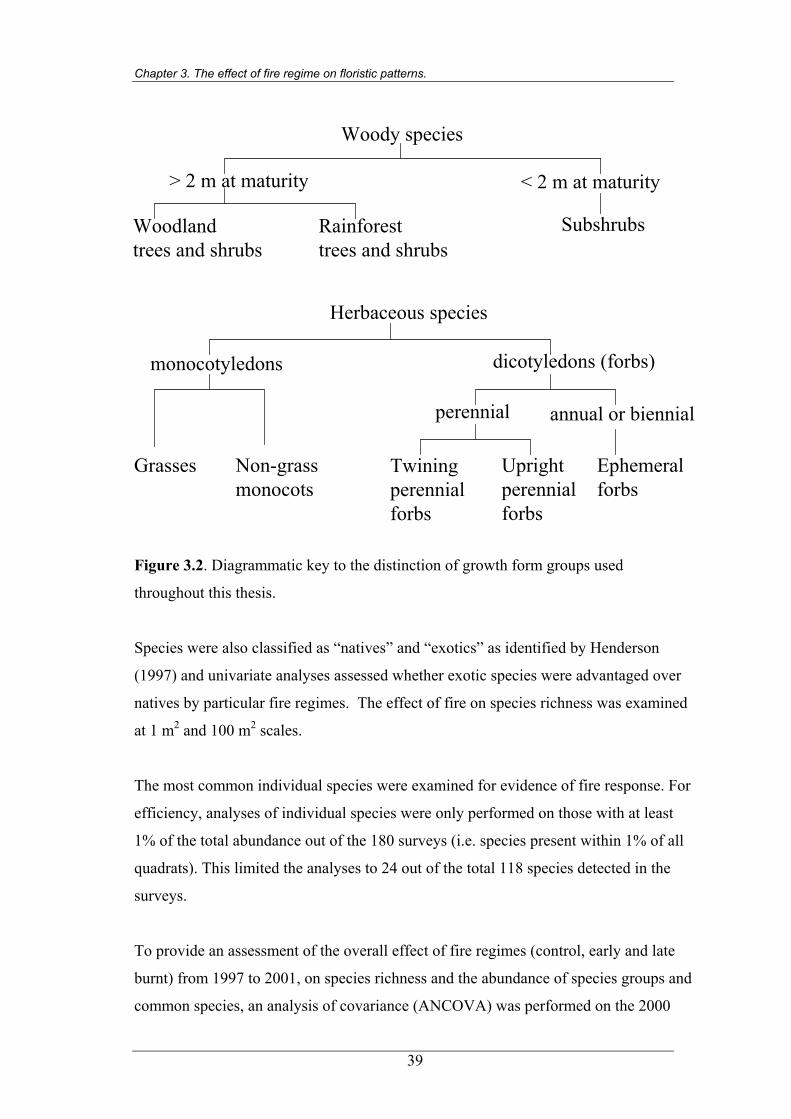
Chapter 3. The effect of fire regime on floristic patterns.
Woody species
> 2 m at maturity < 2 m at maturity
Woodland trees and shrubs
Rainforesttrees and shrubs
Subshrubs
Herbaceous species
monocotyledons dicotyledons (forbs)
Grasses Non-grass monocots
perennial annual or biennial
Twiningperennialforbs
Uprightperennialforbs
Ephemeral forbs
Figure 3.2. Diagrammatic key to the distinction of growth form groups used
throughout this thesis.
Species were also classified as “natives” and “exotics” as identified by Henderson
(1997) and univariate analyses assessed whether exotic species were advantaged over
natives by particular fire regimes. The effect of fire on species richness was examined
at 1 m2 and 100 m2 scales.
The most common individual species were examined for evidence of fire response. For
efficiency, analyses of individual species were only performed on those with at least
1% of the total abundance out of the 180 surveys (i.e. species present within 1% of all
quadrats). This limited the analyses to 24 out of the total 118 species detected in the
surveys.
To provide an assessment of the overall effect of fire regimes (control, early and late
burnt) from 1997 to 2001, on species richness and the abundance of species groups and
common species, an analysis of covariance (ANCOVA) was performed on the 2000
39

Chapter 3. The effect of fire regime on floristic patterns.
survey data using the 1997 data as a covariate (Zar 1999). This allowed the assessment
of changes over the course of the five year fire experiment, by analysing the differences
at the end of the trial (2001) once adjusted for differences present prior to the trial
(1997). Separate analyses were not undertaken on the unique effects of the 1997 fire,
due to a lack of unburnt comparisons.
The effect of the 1999 fire season experiment on species richness and the abundance of
species groups and common species, was analysed using two complimentary univariate
analyses. First, an ANCOVA was performed on the 2000 survey data using the 1999
data as a covariate, to assess the change before and immediately after the fire
treatments (control, early and late burnt). In addition, a repeated measures ANOVA of
the three fire treatments in the 1999, 2000 and 2001 data sets was performed, thus
assessing the change in species with fire treatment before fire through to the second
year after fire. The critical factor in repeated measures ANOVA of before and after
impact assessments (BACIs) is the interaction between year and treatment (Green
1993).
In each of these analyses, the four plots in each of the three replicate 1 ha blocks were
considered nested within the fire treatments (control, early or late burnt). The nested
plots were treated as random factors, while fire treatments (and year in the repeated
measures ANOVA) as fixed factors. Where the variation between treatment replicates
of separate blocks was low (P > 0.25), the block replicates were pooled to increase the
power of the tests (Underwood 1997).
ANOVA assumptions of homogeneity of variances between treatments were checked
using Cochran’s test (Underwood 1997) and where significant differences were
detected, analyses were performed on log (x + 1) transformed data. Where data
transformation did not fix significant heterogeneity of variances, a non-parametric test
was used. However, no non-parametric test is available that simultaneously assesses
both the change over time and the differences between the fire treatments. Therefore
separate Kruskal-Wallis ANOVA by ranks tests were performed to check for
significant fire treatment differences in each of 1999, 2000 and 2001 surveys. This
enabled an assessment of pre-existing differences as well as differences in the first and
40
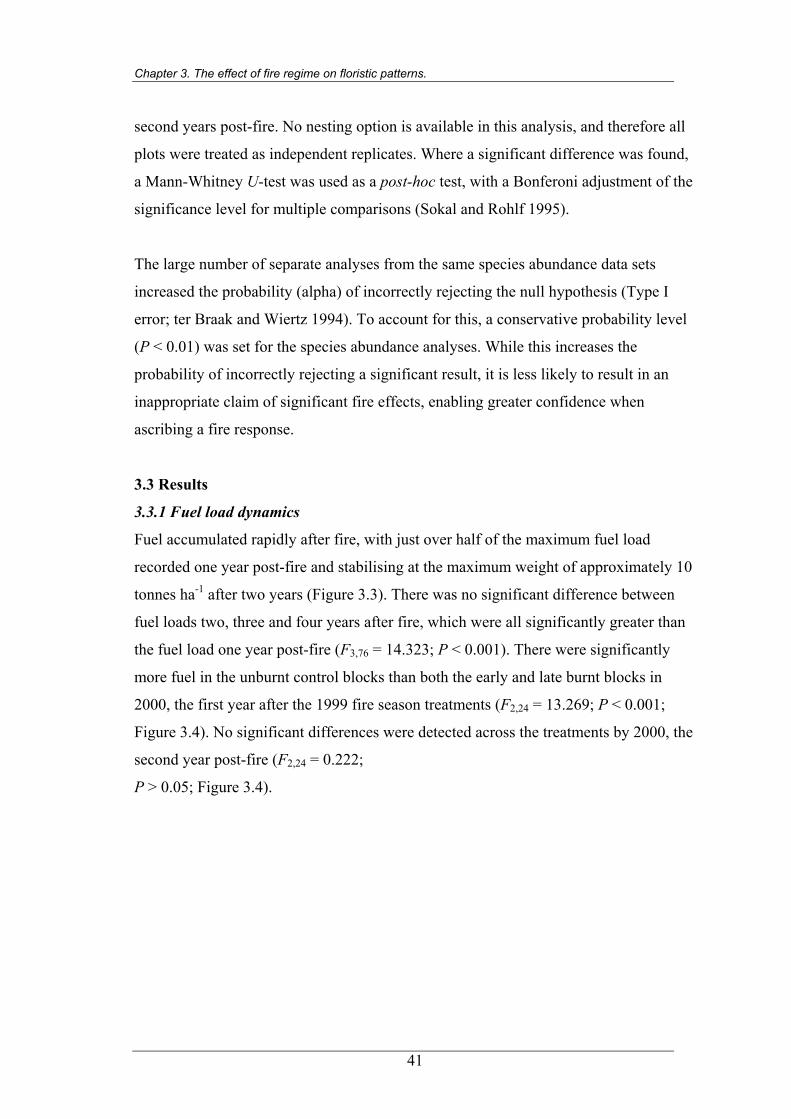
Chapter 3. The effect of fire regime on floristic patterns.
second years post-fire. No nesting option is available in this analysis, and therefore all
plots were treated as independent replicates. Where a significant difference was found,
a Mann-Whitney U-test was used as a post-hoc test, with a Bonferoni adjustment of the
significance level for multiple comparisons (Sokal and Rohlf 1995).
The large number of separate analyses from the same species abundance data sets
increased the probability (alpha) of incorrectly rejecting the null hypothesis (Type I
error; ter Braak and Wiertz 1994). To account for this, a conservative probability level
(P < 0.01) was set for the species abundance analyses. While this increases the
probability of incorrectly rejecting a significant result, it is less likely to result in an
inappropriate claim of significant fire effects, enabling greater confidence when
ascribing a fire response.
3.3 Results
3.3.1 Fuel load dynamics
Fuel accumulated rapidly after fire, with just over half of the maximum fuel load
recorded one year post-fire and stabilising at the maximum weight of approximately 10
tonnes ha-1 after two years (Figure 3.3). There was no significant difference between
fuel loads two, three and four years after fire, which were all significantly greater than
the fuel load one year post-fire (F3,76 = 14.323; P < 0.001). There were significantly
more fuel in the unburnt control blocks than both the early and late burnt blocks in
2000, the first year after the 1999 fire season treatments (F2,24 = 13.269; P < 0.001;
Figure 3.4). No significant differences were detected across the treatments by 2000, the
second year post-fire (F2,24 = 0.222;
P > 0.05; Figure 3.4).
41
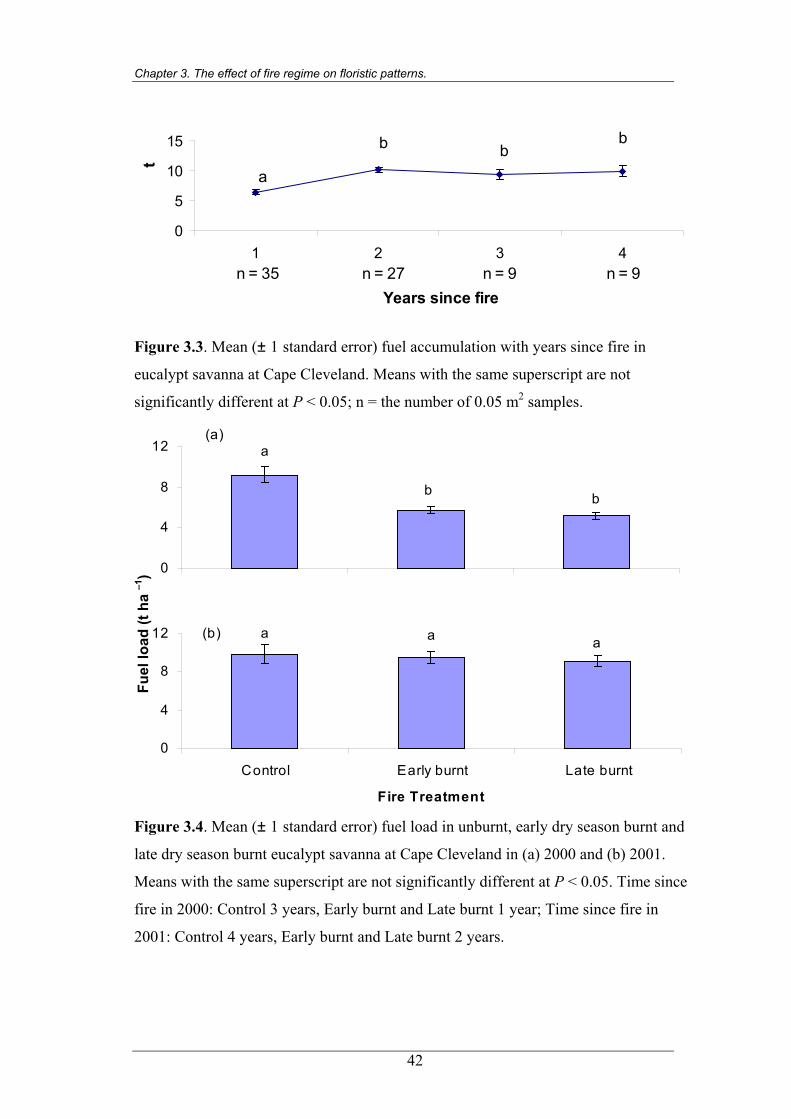
Chapter 3. The effect of fire regime on floristic patterns.
-1
) h
a
ad (
l lo
Fue
0
5
10
15
1 2 3 4
Years since fire
t
a
b b b
n = 35 n = 27 n = 9 n = 9
Figure 3.3. Mean (± 1 standard error) fuel accumulation with years since fire in
eucalypt savanna at Cape Cleveland. Means with the same superscript are not
significantly different at P < 0.05; n = the number of 0.05 m2 samples.
0
4
8
12
Control Early burnt Late burnt
a
b b
(a)
0
4
8
Control Early burnt Late burnt
Fire Treatment
a a a(b)
Figure 3.4. Mean (± 1 standard error) fuel load in unburnt, early dry season burnt and
late dry season burnt eucalypt savanna at Cape Cleveland in (a) 2000 and (b) 2001.
Means with the same superscript are not significantly different at P < 0.05. Time since
fire in 2000: Control 3 years, Early burnt and Late burnt 1 year; Time since fire in
2001: Control 4 years, Early burnt and Late burnt 2 years.
12
Fuel
load
(t h
a –1
)
42
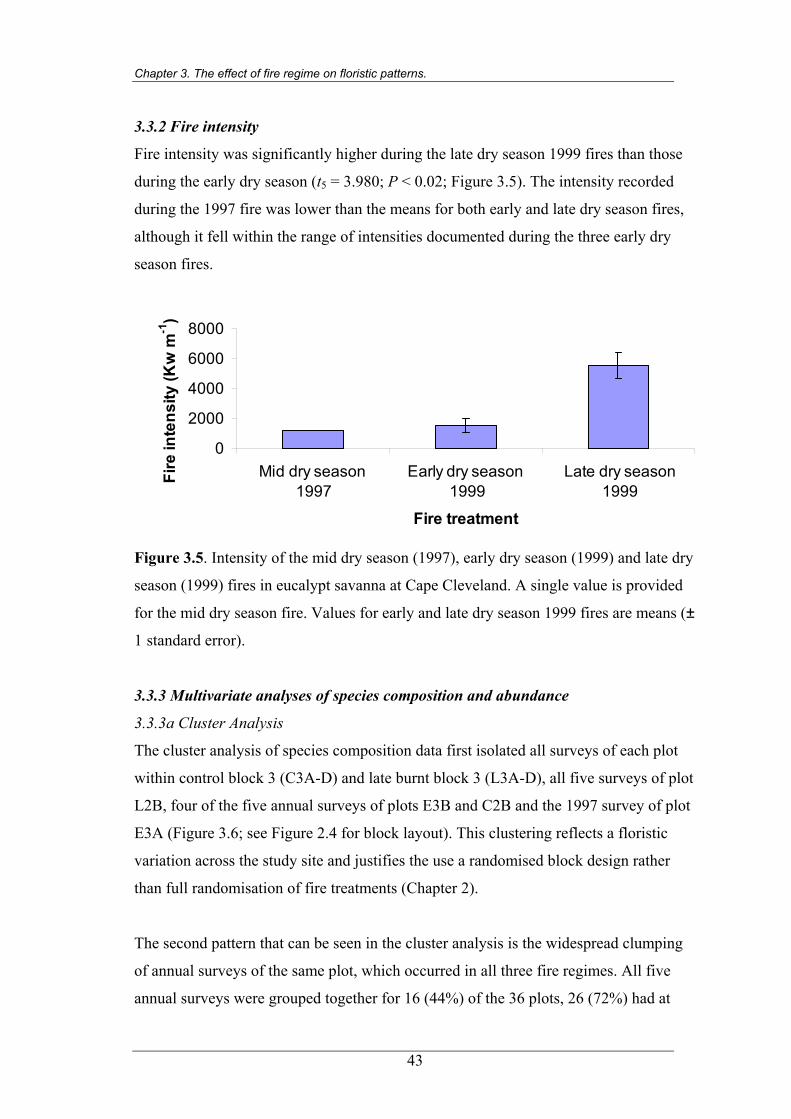
Chapter 3. The effect of fire regime on floristic patterns.
3.3.2 Fire intensity
Fire intensity was significantly higher during the late dry season 1999 fires than those
during the early dry season (t5 = 3.980; P < 0.02; Figure 3.5). The intensity recorded
during the 1997 fire was lower than the means for both early and late dry season fires,
although it fell within the range of intensities documented during the three early dry
season fires.
0
2000
4000
6000
8000
Mid dry season 1997
Early dry season 1999
Late dry season1999
Fire treatment
Fire
inte
nsity
(Kw
m-1
)
Figure 3.5. Intensity of the mid dry season (1997), early dry season (1999) and late dry
season (1999) fires in eucalypt savanna at Cape Cleveland. A single value is provided
for the mid dry season fire. Values for early and late dry season 1999 fires are means (±
1 standard error).
3.3.3 Multivariate analyses of species composition and abundance
3.3.3a Cluster Analysis
The cluster analysis of species composition data first isolated all surveys of each plot
within control block 3 (C3A-D) and late burnt block 3 (L3A-D), all five surveys of plot
L2B, four of the five annual surveys of plots E3B and C2B and the 1997 survey of plot
E3A (Figure 3.6; see Figure 2.4 for block layout). This clustering reflects a floristic
variation across the study site and justifies the use a randomised block design rather
than full randomisation of fire treatments (Chapter 2).
The second pattern that can be seen in the cluster analysis is the widespread clumping
of annual surveys of the same plot, which occurred in all three fire regimes. All five
annual surveys were grouped together for 16 (44%) of the 36 plots, 26 (72%) had at
43
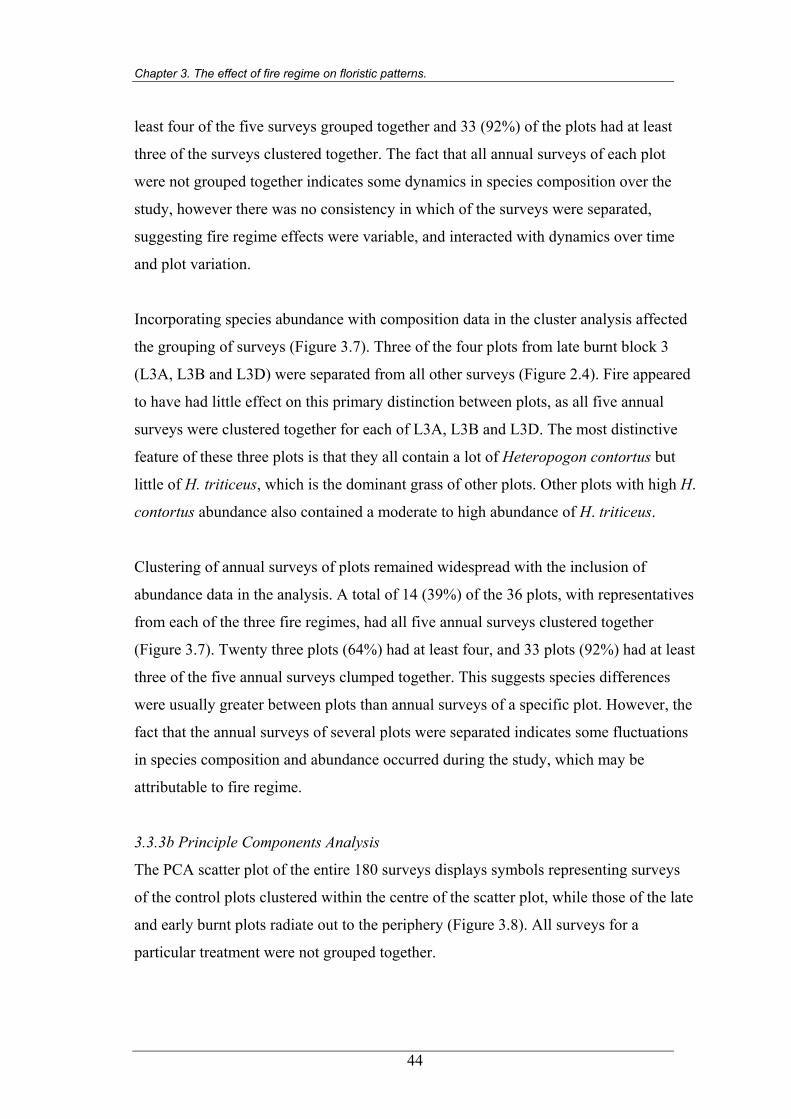
Chapter 3. The effect of fire regime on floristic patterns.
least four of the five surveys grouped together and 33 (92%) of the plots had at least
three of the surveys clustered together. The fact that all annual surveys of each plot
were not grouped together indicates some dynamics in species composition over the
study, however there was no consistency in which of the surveys were separated,
suggesting fire regime effects were variable, and interacted with dynamics over time
and plot variation.
Incorporating species abundance with composition data in the cluster analysis affected
the grouping of surveys (Figure 3.7). Three of the four plots from late burnt block 3
(L3A, L3B and L3D) were separated from all other surveys (Figure 2.4). Fire appeared
to have had little effect on this primary distinction between plots, as all five annual
surveys were clustered together for each of L3A, L3B and L3D. The most distinctive
feature of these three plots is that they all contain a lot of Heteropogon contortus but
little of H. triticeus, which is the dominant grass of other plots. Other plots with high H.
contortus abundance also contained a moderate to high abundance of H. triticeus.
Clustering of annual surveys of plots remained widespread with the inclusion of
abundance data in the analysis. A total of 14 (39%) of the 36 plots, with representatives
from each of the three fire regimes, had all five annual surveys clustered together
(Figure 3.7). Twenty three plots (64%) had at least four, and 33 plots (92%) had at least
three of the five annual surveys clumped together. This suggests species differences
were usually greater between plots than annual surveys of a specific plot. However, the
fact that the annual surveys of several plots were separated indicates some fluctuations
in species composition and abundance occurred during the study, which may be
attributable to fire regime.
3.3.3b Principle Components Analysis
The PCA scatter plot of the entire 180 surveys displays symbols representing surveys
of the control plots clustered within the centre of the scatter plot, while those of the late
and early burnt plots radiate out to the periphery (Figure 3.8). All surveys for a
particular treatment were not grouped together.
44
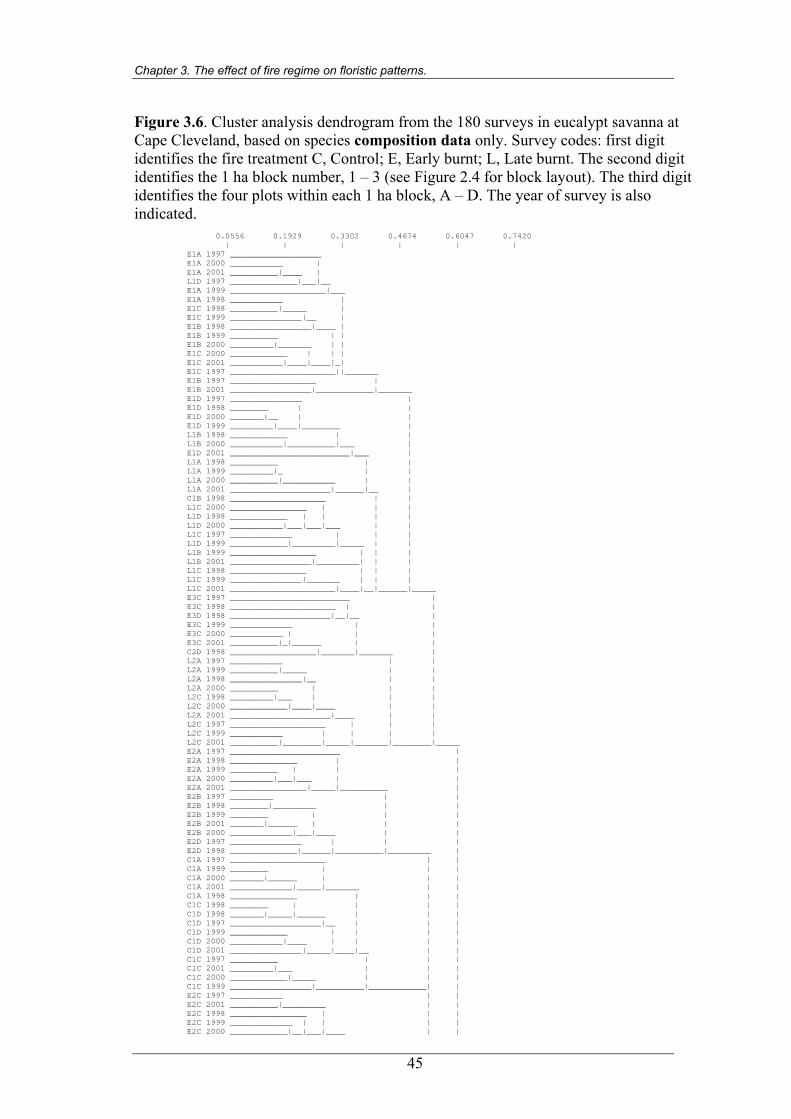
Chapter 3. The effect of fire regime on floristic patterns.
Figure 3.6. Cluster analysis dendrogram from the 180 surveys in eucalypt savanna at Cape Cleveland, based on species composition data only. Survey codes: first digit identifies the fire treatment C, Control; E, Early burnt; L, Late burnt. The second digit identifies the 1 ha block number, 1 – 3 (see Figure 2.4 for block layout). The third digit identifies the four plots within each 1 ha block, A – D. The year of survey is also indicated.
0.0556 0.1929 0.3302 0.4674 0.6047 0.7420 | | | | | | E1A 1997 ___________________ E1A 2000 ___________ | E1A 2001 __________|____ | L1D 1997 ______________|___|__ E1A 1999 ____________________|___ E1A 1998 ___________ | E1C 1998 __________|_____ | E1C 1999 _______________|__ | E1B 1998 _________________|____ | E1B 1999 __________ | | E1B 2000 _________|_______ | | E1C 2000 ____________ | | | E1C 2001 ___________|____|____|_| E1C 1997 ______________________||_______ E1B 1997 __________________ | E1B 2001 _________________|____________|_______ E1D 1997 _______________ | E1D 1998 ________ | | E1D 2000 _______|__ | | E1D 1999 _________|____|________ | L1B 1998 ____________ | | L1B 2000 ___________|__________|___ | E1D 2001 _________________________|___ | L1A 1998 __________ | | L1A 1999 _________|_ | | L1A 2000 __________|___________ | | L1A 2001 _____________________|______|__ | C1B 1998 ____________________ | | L1C 2000 ________________ | | | L1D 1998 ____________ | | | | L1D 2000 ___________|___|___|___ | | L1C 1997 _____________ | | | L1D 1999 ____________|_________|_____ | | L1B 1999 __________________ | | | L1B 2001 _________________|_________| | | L1C 1998 ________________ | | | L1C 1999 _______________|_______ | | | L1C 2001 ______________________|____|__|______|_____ E3C 1997 _________________________ | E3C 1998 ______________________ | | E3D 1998 _____________________|__|__ | E3C 1999 _____________ | | E3C 2000 ___________ | | | E3C 2001 __________|_|______ | | C2D 1998 __________________|_______|_______ | L2A 1997 ___________ | | L2A 1999 __________|_____ | | L2A 1998 _______________|__ | | L2A 2000 __________ | | | L2C 1998 _________|___ | | | L2C 2000 ____________|____|____ | | L2A 2001 _____________________|____ | | L2C 1997 ____________________ | | | L2C 1999 ___________ | | | | L2C 2001 __________|________|_____|_______|________|_____ E2A 1997 _______________________ | E2A 1998 ______________ | | E2A 1999 __________ | | | E2A 2000 _________|___|___ | | E2A 2001 ________________|_____|__________ | E2B 1997 _________ | | E2B 1998 ________|_________ | | E2B 1999 ________ | | | E2B 2001 _______|______ | | | E2B 2000 _____________|___|____ | | E2D 1997 _______________ | | | E2D 1998 ______________|______|__________|_________ | C1A 1997 ____________________ | | C1A 1999 ________ | | | C1A 2000 _______|______ | | | C1A 2001 _____________|_____|_______ | | C1A 1998 ______________ | | | C1C 1998 ________ | | | | C1D 1998 _______|_____|______ | | | C1D 1997 ___________________|__ | | | C1D 1999 ____________ | | | | C1D 2000 ___________|____ | | | | C1D 2001 _______________|_____|____|__ | | C1C 1997 __________ | | | C1C 2001 _________|___ | | | C1C 2000 ____________|_____ | | | C1C 1999 _________________|__________|____________| | E2C 1997 ___________ | | E2C 2001 __________|_________ | | E2C 1998 ________________ | | | E2C 1999 _____________ | | | | E2C 2000 ____________|__|___|____ | |
45
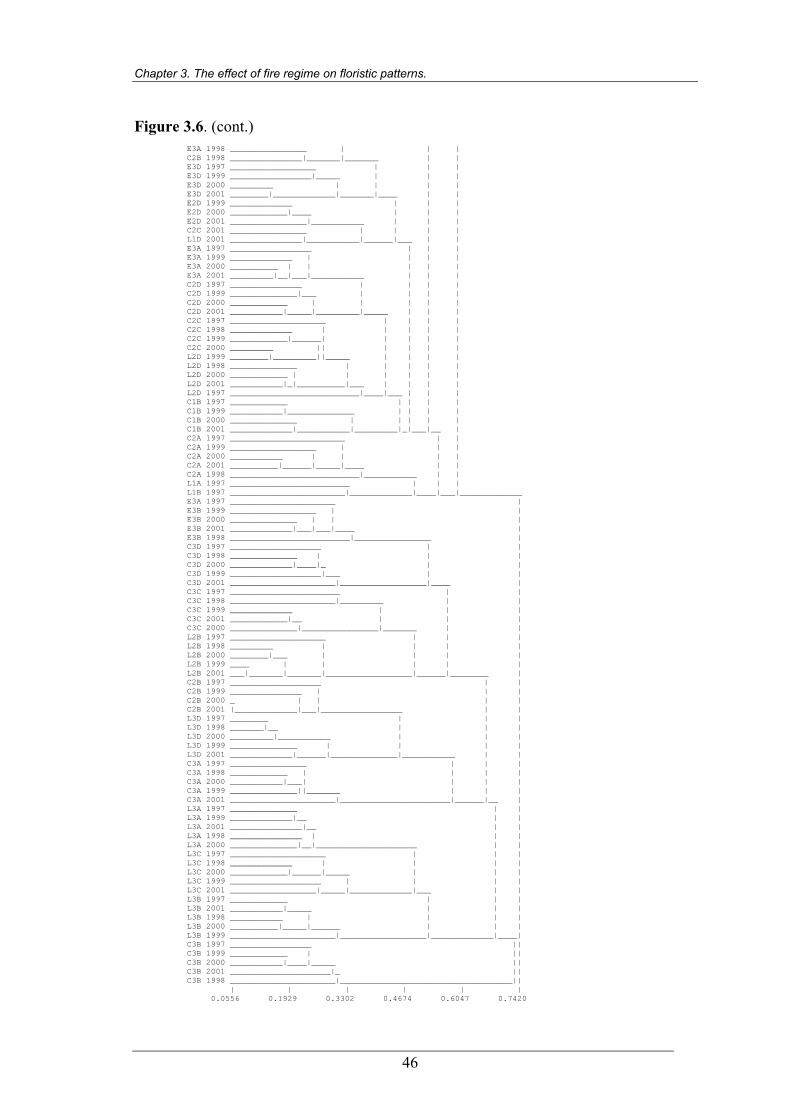
Chapter 3. The effect of fire regime on floristic patterns.
Figure 3.6. (cont.) E3A 1998 ________________ | | | C2B 1998 _______________|_______|_______ | | E3D 1997 __________________ | | | E3D 1999 _________________|_____ | | | E3D 2000 _________ | | | | E3D 2001 ________|_____________|_______|____ | | E2D 1999 _____________ | | | E2D 2000 ____________|____ | | | E2D 2001 ________________|___________ | | | C2C 2001 ________________ | | | | L1D 2001 _______________|___________|______|___ | | E3A 1997 _________________ | | | E3A 1999 _____________ | | | | E3A 2000 __________ | | | | | E3A 2001 _________|__|___|___________ | | | C2D 1997 _______________ | | | | C2D 1999 ______________|___ | | | | C2D 2000 ____________ | | | | | C2D 2001 ___________|_____|_________|_____ | | | C2C 1997 ____________________ | | | | C2C 1998 _____________ | | | | | C2C 1999 ____________|______| | | | | C2C 2000 _________ || | | | | L2D 1999 ________|_________||_____ | | | | L2D 1998 ______________ | | | | | L2D 2000 ____________ | | | | | | L2D 2001 ___________|_|__________|___ | | | | L2D 1997 ___________________________|____|___ | | | C1B 1997 ____________ | | | | C1B 1999 ___________|______________ | | | | C1B 2000 ______________ | | | | | C1B 2001 _____________|___________|_________|_|___|__ | C2A 1997 ________________________ | | C2A 1999 __________________ | | | C2A 2000 ___________ | | | | C2A 2001 __________|______|_____|____ | | C2A 1998 ___________________________|___________ | | L1A 1997 _________________________ | | | L1B 1997 ________________________|_____________|____|___|_____________ E3A 1997 ______________________ | E3B 1999 __________________ | | E3B 2000 ______________ | | | E3B 2001 _____________|___|___|____ | E3B 1998 _________________________|________________ | C3D 1997 ___________________ | | C3D 1998 ______________ | | | C3D 2000 _____________|____|_ | | C3D 1999 ___________________|___ | | C3D 2001 ______________________|__________________|____ | C3C 1997 _______________________ | | C3C 1998 ______________________|_________ | | C3C 1999 _____________ | | | C3C 2001 ____________|__ | | | C3C 2000 ______________|________________|_______ | | L2B 1997 ____________________ | | | L2B 1998 _________ | | | | L2B 2000 ________|___ | | | | L2B 1999 ____ | | | | | L2B 2001 ___|_______|_______|__________________|______|________ | C2B 1997 ___________________ | | C2B 1999 _______________ | | | C2B 2000 _ | | | | C2B 2001 |_____________|___|_________________ | | L3D 1997 ________ | | | L3D 1998 _______|__ | | | L3D 2000 _________|___________ | | | L3D 1999 ______________ | | | | L3D 2001 _____________|______|______________|___________ | | C3A 1997 ________________ | | | C3A 1998 ____________ | | | | C3A 2000 ___________|___| | | | C3A 1999 ______________||_______ | | | C3A 2001 ______________________|_______________________|______|__ | L3A 1997 ______________ | | L3A 1999 _____________|__ | | L3A 2001 _______________|__ | | L3A 1998 _______________ | | | L3A 2000 ______________|__|_____________________ | | L3C 1997 ____________________ | | | L3C 1998 _____________ | | | | L3C 2000 ____________|______|_____ | | | L3C 1999 ___________________ | | | | L3C 2001 __________________|_____|_____________|___ | | L3B 1997 ____________ | | | L3B 2001 ___________|_____ | | | L3B 1998 ___________ | | | | L3B 2000 __________|_____|______ | | | L3B 1999 ______________________|__________________|_____________|____| C3B 1997 _________________ || C3B 1999 ____________ | || C3B 2000 ___________|____|_____ || C3B 2001 _____________________|_ || C3B 1998 ______________________|____________________________________|| | | | | | | 0.0556 0.1929 0.3302 0.4674 0.6047 0.7420
46
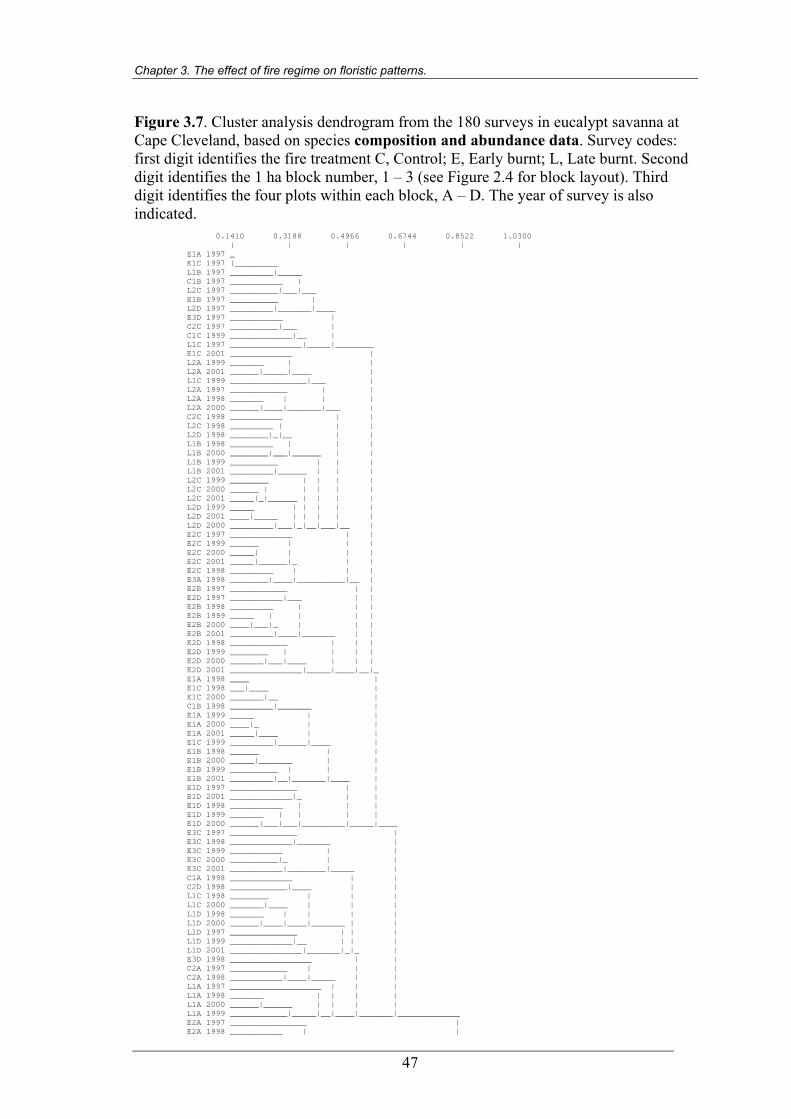
Chapter 3. The effect of fire regime on floristic patterns.
Figure 3.7. Cluster analysis dendrogram from the 180 surveys in eucalypt savanna at Cape Cleveland, based on species composition and abundance data. Survey codes: first digit identifies the fire treatment C, Control; E, Early burnt; L, Late burnt. Second digit identifies the 1 ha block number, 1 – 3 (see Figure 2.4 for block layout). Third digit identifies the four plots within each block, A – D. The year of survey is also indicated.
0.1410 0.3188 0.4966 0.6744 0.8522 1.0300 | | | | | | E1A 1997 _ E1C 1997 |_________ L1B 1997 _________|_____ C1B 1997 ___________ | L2C 1997 __________|___|___ E1B 1997 __________ | L2D 1997 _________|_______|____ E3D 1997 ___________ | C2C 1997 __________|___ | C1C 1999 _____________|__ | L1C 1997 _______________|_____|________ E1C 2001 _____________ | L2A 1999 _______ | | L2A 2001 ______|_____|____ | L1C 1999 ________________|___ | L2A 1997 ____________ | | L2A 1998 _______ | | | L2A 2000 ______|____|_______|___ | C2C 1998 ___________ | | L2C 1998 _________ | | | L2D 1998 ________|_|__ | | L1B 1998 _________ | | | L1B 2000 ________|___|______ | | L1B 1999 __________ | | | L1B 2001 _________|______ | | | L2C 1999 ________ | | | | L2C 2000 ______ | | | | | L2C 2001 _____|_|______ | | | | L2D 1999 _____ | | | | | L2D 2001 ____|_____ | | | | | L2D 2000 _________|___|_|__|___|__ | E2C 1997 _____________ | | E2C 1999 ______ | | | E2C 2000 _____| | | | E2C 2001 _____|______|_ | | E2C 1998 _________ | | | E3A 1998 ________|____|__________|__ | E2B 1997 ____________ | | E2D 1997 ___________|___ | | E2B 1998 _________ | | | E2B 1999 _____ | | | | E2B 2000 ____|___|_ | | | E2B 2001 _________|____|_______ | | E2D 1998 ____________ | | | E2D 1999 ________ | | | | E2D 2000 _______|___|____ | | | E2D 2001 _______________|_____|____|__|_ E1A 1998 ____ | E1C 1998 ___|____ | E1C 2000 _______|__ | C1B 1998 _________|_______ | E1A 1999 _____ | | E1A 2000 ____|_ | | E1A 2001 _____|____ | | E1C 1999 _________|______|____ | E1B 1998 ______ | | E1B 2000 _____|_______ | | E1B 1999 __________ | | | E1B 2001 _________|__|_______|____ | E1D 1997 ______________ | | E1D 2001 _____________|_ | | E1D 1998 ___________ | | | E1D 1999 _______ | | | | E1D 2000 ______|___|___|_________|_____|____ E3C 1997 ______________ | E3C 1998 _____________|_______ | E3C 1999 ___________ | | E3C 2000 __________|_ | | E3C 2001 ___________|________|_____ | C1A 1998 _____________ | | C2D 1998 ____________|____ | | L1C 1998 ________ | | | L1C 2000 _______|____ | | | L1D 1998 _______ | | | | L1D 2000 ______|____|____|_______ | | L1D 1997 ______________ | | | L1D 1999 _____________|__ | | | L1D 2001 _______________|_______|_|_ | E3D 1998 _________________ | | C2A 1997 ____________ | | | C2A 1998 ___________|____|_____ | | L1A 1997 ___________________ | | | L1A 1998 _______ | | | | L1A 2000 ______|______ | | | | L1A 1999 ____________|_____|__|____|_______|_____________ E2A 1997 ________________ | E2A 1998 ___________ | |
47
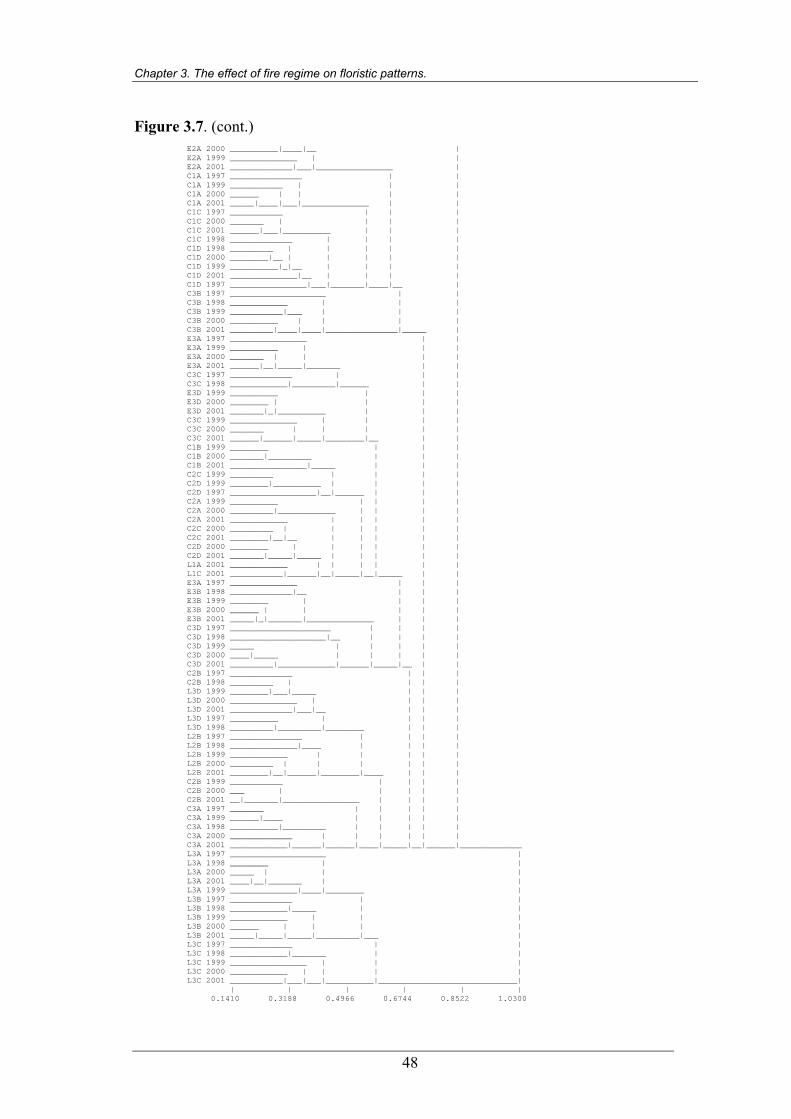
Chapter 3. The effect of fire regime on floristic patterns.
Figure 3.7. (cont.) E2A 2000 __________|____|__ | E2A 1999 ______________ | | E2A 2001 _____________|___|________________ | C1A 1997 _______________ | | C1A 1999 ___________ | | | C1A 2000 ______ | | | | C1A 2001 _____|____|___|______________ | | C1C 1997 ___________ | | | C1C 2000 _______ | | | | C1C 2001 ______|___|__________ | | | C1C 1998 _____________ | | | | C1D 1998 _________ | | | | | C1D 2000 ________|__ | | | | | C1D 1999 __________|_|__ | | | | C1D 2001 ______________|__ | | | | C1D 1997 ________________|___|_______|____|__ | C3B 1997 ____________________ | | C3B 1998 ____________ | | | C3B 1999 ___________|___ | | | C3B 2000 __________ | | | | C3B 2001 _________|____|____|_______________|_____ | E3A 1997 ________________ | | E3A 1999 __________ | | | E3A 2000 _______ | | | | E3A 2001 ______|__|_____|_______ | | C3C 1997 _____________ | | | C3C 1998 ____________|_________|______ | | E3D 1999 __________ | | | E3D 2000 ________ | | | | E3D 2001 _______|_|__________ | | | C3C 1999 ______________ | | | | C3C 2000 _______ | | | | | C3C 2001 ______|______|_____|________|__ | | C1B 1999 ________ | | | C1B 2000 _______|_________ | | | C1B 2001 ________________|_____ | | | C2C 1999 _________ | | | | C2D 1999 ________|__________ | | | | C2D 1997 __________________|__|______ | | | C2A 1999 __________ | | | | C2A 2000 _________|____________ | | | | C2A 2001 ____________ | | | | | C2C 2000 _________ | | | | | | C2C 2001 ________|__|__ | | | | | C2D 2000 ________ | | | | | | C2D 2001 _______|_____|_____ | | | | | L1A 2001 ____________ | | | | | | L1C 2001 ___________|______|__|_____|__|_____ | | E3A 1997 ______________ | | | E3B 1998 _____________|__ | | | E3B 1999 ________ | | | | E3B 2000 ______ | | | | | E3B 2001 _____|_|_______|______________ | | | C3D 1997 _____________________ | | | | C3D 1998 ____________________|__ | | | | C3D 1999 _____ | | | | | C3D 2000 ____|_____ | | | | | C3D 2001 _________|____________|______|_____|__ | | C2B 1997 _____________ | | | C2B 1998 _________ | | | | L3D 1999 ________|___|_____ | | | L3D 2000 ______________ | | | | L3D 2001 _____________|___|__ | | | L3D 1997 __________ | | | | L3D 1998 _________|_________|________ | | | L2B 1997 _______________ | | | | L2B 1998 ______________|____ | | | | L2B 1999 ____________ | | | | | L2B 2000 _________ | | | | | | L2B 2001 ________|__|______|________|____ | | | C2B 1999 ___________ | | | | C2B 2000 ___ | | | | | C2B 2001 __|_______|________________ | | | | C3A 1997 _______ | | | | | C3A 1999 ______|____ | | | | | C3A 1998 __________|_________ | | | | | C3A 2000 _____________ | | | | | | C3A 2001 ____________|______|______|____|_____|__|______|_____________ L3A 1997 ____________________ | L3A 1998 ________ | | L3A 2000 _____ | | | L3A 2001 ____|__|_______ | | L3A 1999 ______________|____|________ | L3B 1997 _____________ | | L3B 1998 ____________|_____ | | L3B 1999 ____________ | | | L3B 2000 ______ | | | | L3B 2001 _____|_____|_____|_________|___ | L3C 1997 _____________ | | L3C 1998 ____________|_______ | | L3C 1999 ________________ | | | L3C 2000 ____________ | | | | L3C 2001 ___________|___|___|__________|_____________________________| | | | | | | 0.1410 0.3188 0.4966 0.6744 0.8522 1.0300
48
Chapter 3. The effect of fire regime on floristic patterns.
A simplified scatter plot of the PCA for the entire 180 surveys is presented in Figure
3.9. The trends in floristic response to fire treatments over the five years can be seen
from the shift in symbols between years. Each symbol represents the mean PCA
coordinate for an annual survey of the 12 plots (i.e. the four plots in each of the three 1
ha blocks) in each of the three fire regimes. There is consistency in the shift in symbols
from 1997 to 1999 for the three fire regimes, when all plots received identical
treatment. However, the shift in symbols from 1999 to 2000 differs between treatments
following the 1999 fires, indicating different floristic patterns. The symbol representing
the control plots in 2000 is more negative on axis 1 and positive on axis 2 than the 1999
symbol. The 2000 symbols for the early and late burnt plots are more positive on axis
1, so that the shift between the 1999 and 2000 is towards the right of the scatter plot. In
2001, the symbols representing the early and late burnt plots shift in a similar direction
to that of the control plots.
These scatter plots document a similar trend in floristic patterns while all plots received
the same treatment, prior to the 1999 fires (which were implemented after the 1999
surveys). The floristic patterns differ between fire regime in the first year after the 1999
fires (i.e. the 2000 surveys), but return to a similar pattern in 2001. The scatter plots
also suggest that the floristic composition and abundance in 2001 differed to that of
1997, so that even in control plots, four years after fire, the species composition and
abundance differed to that of the start of the study.
49
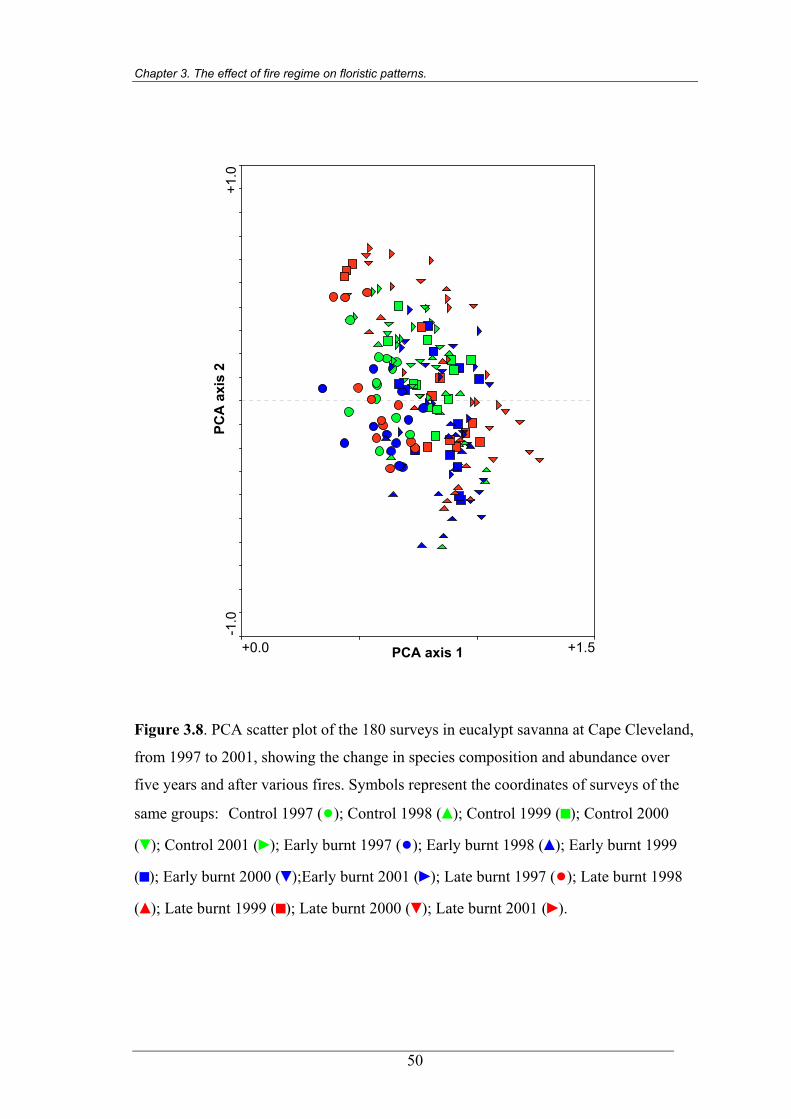
Chapter 3. The effect of fire regime on floristic patterns.
PCA
axi
s 2
PCA axis 1+0.0 +1.5
-1.0
+1.0
Figure 3.8. PCA scatter plot of the 180 surveys in eucalypt savanna at Cape Cleveland,
from 1997 to 2001, showing the change in species composition and abundance over
five years and after various fires. Symbols represent the coordinates of surveys of the
same groups: Control 1997 (●); Control 1998 (▲); Control 1999 (■); Control 2000
(▼); Control 2001 (►); Early burnt 1997 (●); Early burnt 1998 (▲); Early burnt 1999
(■); Early burnt 2000 (▼);Early burnt 2001 (►); Late burnt 1997 (●); Late burnt 1998
(▲); Late burnt 1999 (■); Late burnt 2000 (▼); Late burnt 2001 (►).
50
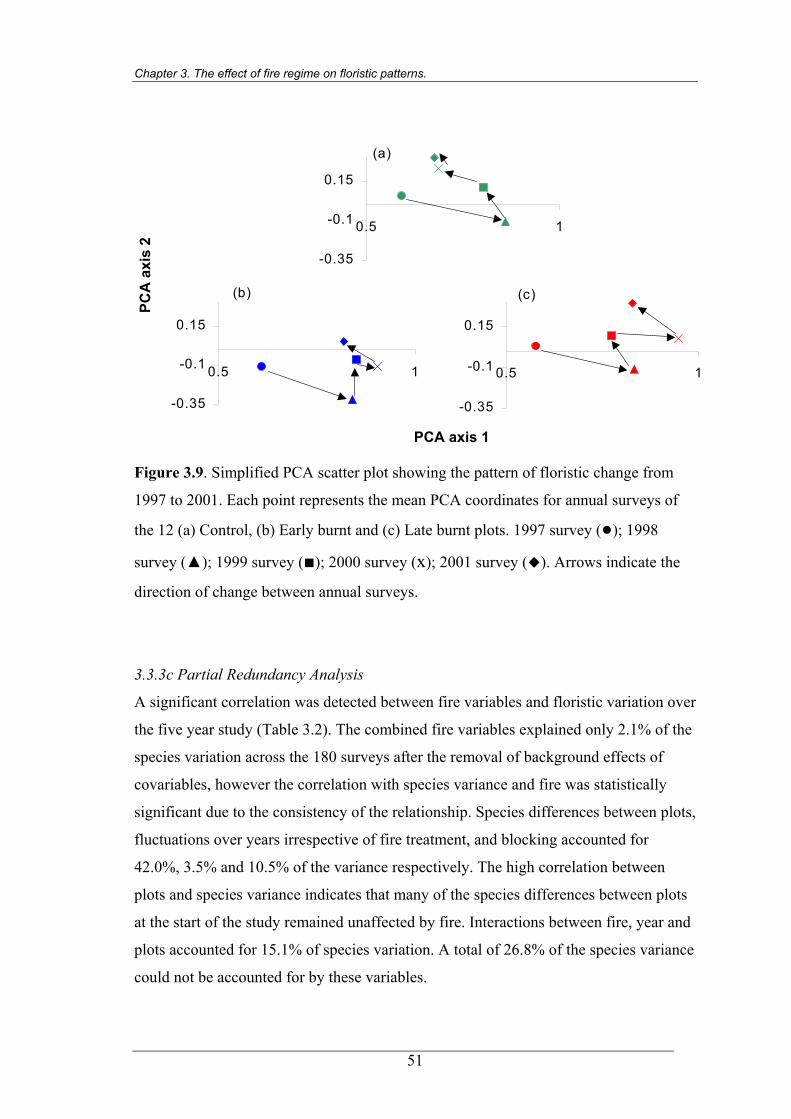
Chapter 3. The effect of fire regime on floristic patterns.
-0.35
-0.1
0.15
0.5 1
(a)
-0.35
-0.1
0.15
0.5 1
(b)
-0.35
-0.1
0.15
0.5 1
(c)
PCA axis 1
PCA
axi
s 2
Figure 3.9. Simplified PCA scatter plot showing the pattern of floristic change from
1997 to 2001. Each point represents the mean PCA coordinates for annual surveys of
the 12 (a) Control, (b) Early burnt and (c) Late burnt plots. 1997 survey (●); 1998
survey (▲); 1999 survey (■); 2000 survey (x); 2001 survey ( ). Arrows indicate the
direction of change between annual surveys.
3.3.3c Partial Redundancy Analysis
A significant correlation was detected between fire variables and floristic variation over
the five year study (Table 3.2). The combined fire variables explained only 2.1% of the
species variation across the 180 surveys after the removal of background effects of
covariables, however the correlation with species variance and fire was statistically
significant due to the consistency of the relationship. Species differences between plots,
fluctuations over years irrespective of fire treatment, and blocking accounted for
42.0%, 3.5% and 10.5% of the variance respectively. The high correlation between
plots and species variance indicates that many of the species differences between plots
at the start of the study remained unaffected by fire. Interactions between fire, year and
plots accounted for 15.1% of species variation. A total of 26.8% of the species variance
could not be accounted for by these variables.
51
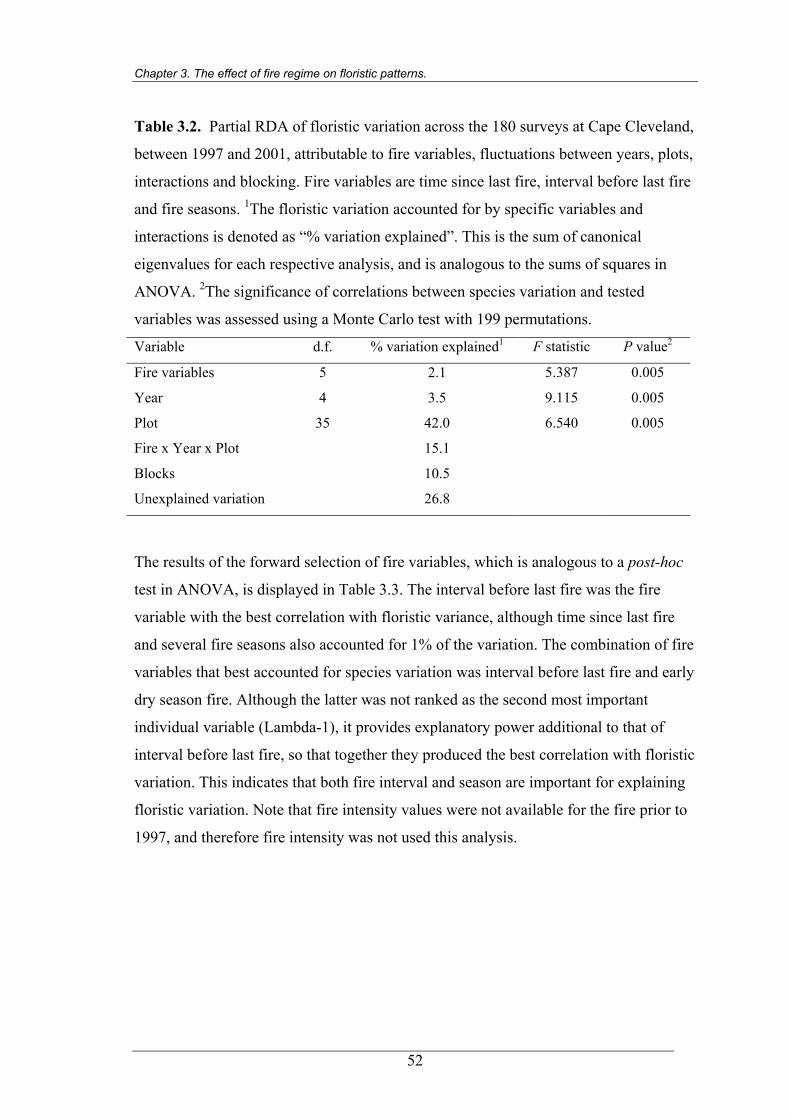
Chapter 3. The effect of fire regime on floristic patterns.
Table 3.2. Partial RDA of floristic variation across the 180 surveys at Cape Cleveland,
between 1997 and 2001, attributable to fire variables, fluctuations between years, plots,
interactions and blocking. Fire variables are time since last fire, interval before last fire
and fire seasons. 1The floristic variation accounted for by specific variables and
interactions is denoted as “% variation explained”. This is the sum of canonical
eigenvalues for each respective analysis, and is analogous to the sums of squares in
ANOVA. 2The significance of correlations between species variation and tested
variables was assessed using a Monte Carlo test with 199 permutations.
Variable d.f. % variation explained1 F statistic P value2
Fire variables 5 2.1 5.387 0.005
Year 4 3.5 9.115 0.005
Plot 35 42.0 6.540 0.005
Fire x Year x Plot 15.1
Blocks 10.5
Unexplained variation 26.8
The results of the forward selection of fire variables, which is analogous to a post-hoc
test in ANOVA, is displayed in Table 3.3. The interval before last fire was the fire
variable with the best correlation with floristic variance, although time since last fire
and several fire seasons also accounted for 1% of the variation. The combination of fire
variables that best accounted for species variation was interval before last fire and early
dry season fire. Although the latter was not ranked as the second most important
individual variable (Lambda-1), it provides explanatory power additional to that of
interval before last fire, so that together they produced the best correlation with floristic
variation. This indicates that both fire interval and season are important for explaining
floristic variation. Note that fire intensity values were not available for the fire prior to
1997, and therefore fire intensity was not used this analysis.
52
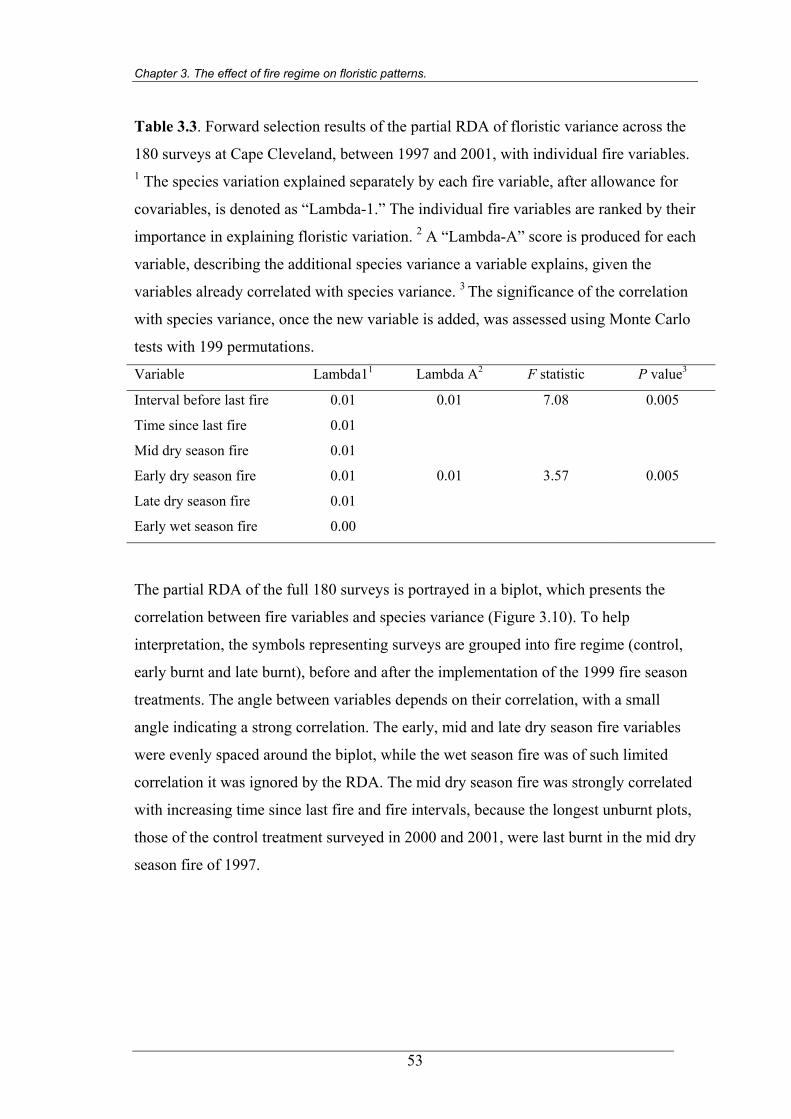
Chapter 3. The effect of fire regime on floristic patterns.
Table 3.3. Forward selection results of the partial RDA of floristic variance across the
180 surveys at Cape Cleveland, between 1997 and 2001, with individual fire variables. 1 The species variation explained separately by each fire variable, after allowance for
covariables, is denoted as “Lambda-1.” The individual fire variables are ranked by their
importance in explaining floristic variation. 2 A “Lambda-A” score is produced for each
variable, describing the additional species variance a variable explains, given the
variables already correlated with species variance. 3 The significance of the correlation
with species variance, once the new variable is added, was assessed using Monte Carlo
tests with 199 permutations.
Variable Lambda11 Lambda A2 F statistic P value3
Interval before last fire 0.01 0.01 7.08 0.005
Time since last fire 0.01
Mid dry season fire 0.01
Early dry season fire 0.01 0.01 3.57 0.005
Late dry season fire 0.01
Early wet season fire 0.00
The partial RDA of the full 180 surveys is portrayed in a biplot, which presents the
correlation between fire variables and species variance (Figure 3.10). To help
interpretation, the symbols representing surveys are grouped into fire regime (control,
early burnt and late burnt), before and after the implementation of the 1999 fire season
treatments. The angle between variables depends on their correlation, with a small
angle indicating a strong correlation. The early, mid and late dry season fire variables
were evenly spaced around the biplot, while the wet season fire was of such limited
correlation it was ignored by the RDA. The mid dry season fire was strongly correlated
with increasing time since last fire and fire intervals, because the longest unburnt plots,
those of the control treatment surveyed in 2000 and 2001, were last burnt in the mid dry
season fire of 1997.
53
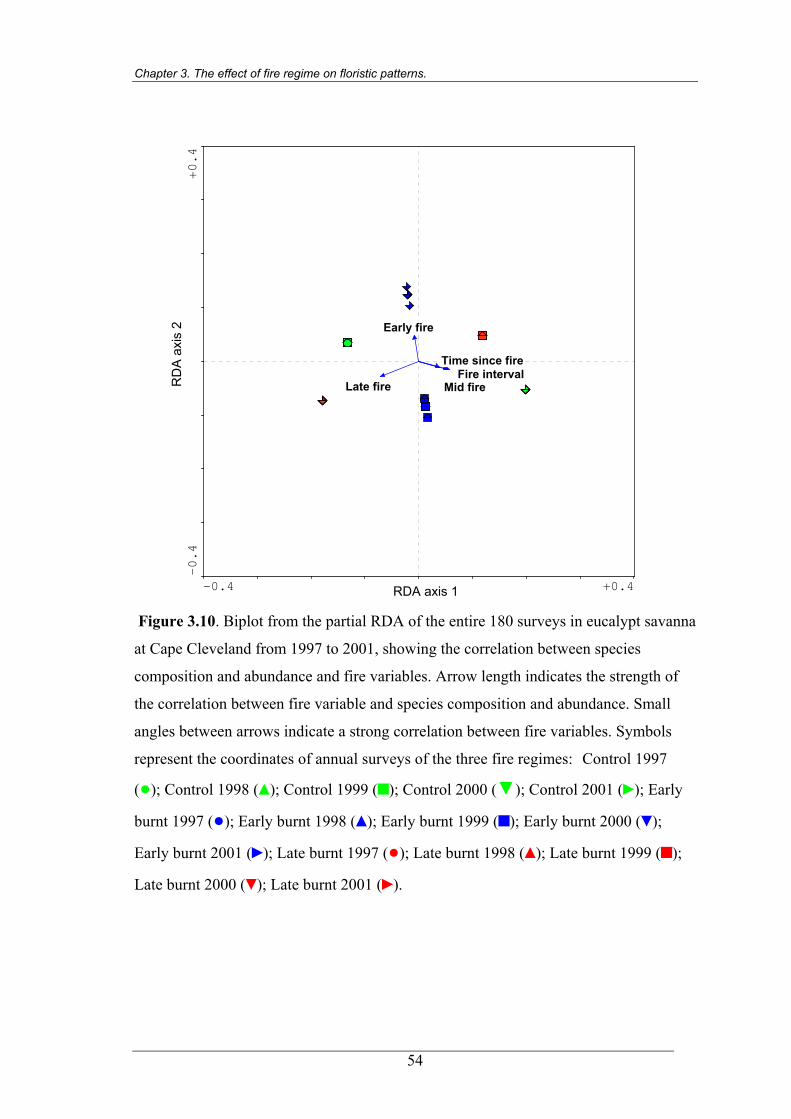
Chapter 3. The effect of fire regime on floristic patterns.
RD
A a
xis
2
RDA axis 1-0.4 +0.4
-0.4
+0.4
Late fire
Time since fire
Mid fireFire interval
Early fire
Figure 3.10. Biplot from the partial RDA of the entire 180 surveys in eucalypt savanna
at Cape Cleveland from 1997 to 2001, showing the correlation between species
composition and abundance and fire variables. Arrow length indicates the strength of
the correlation between fire variable and species composition and abundance. Small
angles between arrows indicate a strong correlation between fire variables. Symbols
represent the coordinates of annual surveys of the three fire regimes: Control 1997
(●); Control 1998 (▲); Control 1999 (■); Control 2000 (▼); Control 2001 (►); Early
burnt 1997 (●); Early burnt 1998 (▲); Early burnt 1999 (■); Early burnt 2000 (▼);
Early burnt 2001 (►); Late burnt 1997 (●); Late burnt 1998 (▲); Late burnt 1999 (■);
Late burnt 2000 (▼); Late burnt 2001 (►).
54
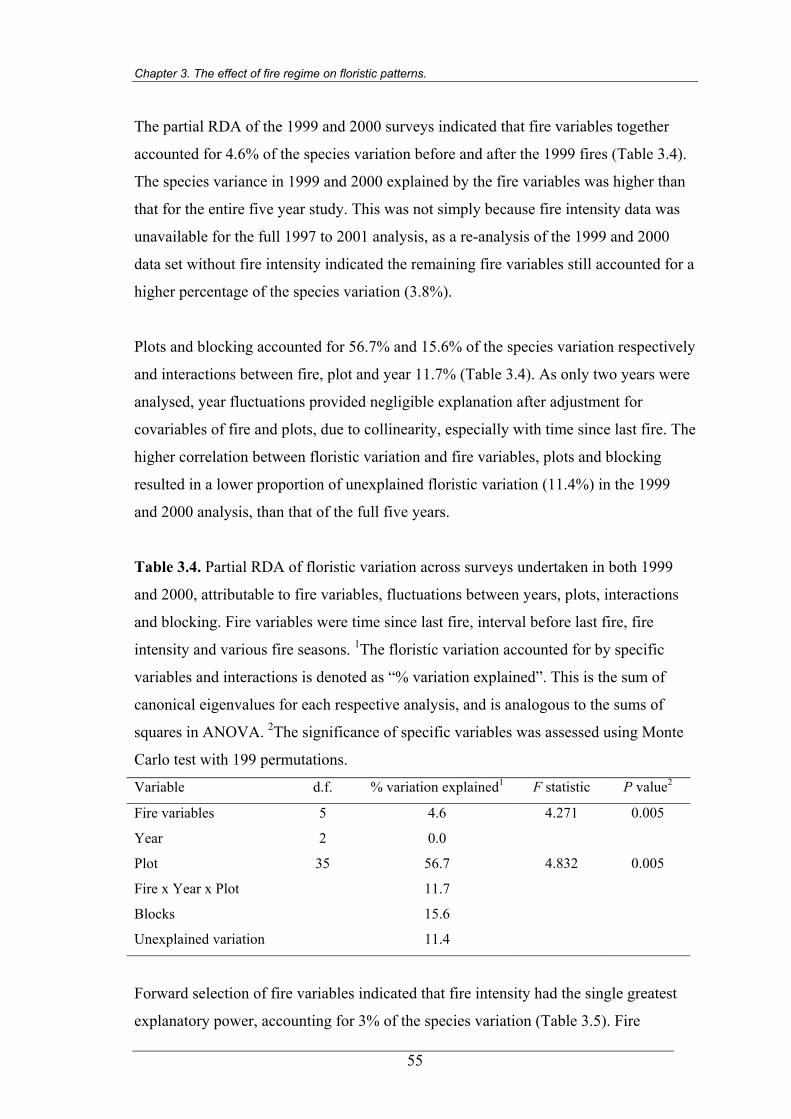
Chapter 3. The effect of fire regime on floristic patterns.
The partial RDA of the 1999 and 2000 surveys indicated that fire variables together
accounted for 4.6% of the species variation before and after the 1999 fires (Table 3.4).
The species variance in 1999 and 2000 explained by the fire variables was higher than
that for the entire five year study. This was not simply because fire intensity data was
unavailable for the full 1997 to 2001 analysis, as a re-analysis of the 1999 and 2000
data set without fire intensity indicated the remaining fire variables still accounted for a
higher percentage of the species variation (3.8%).
Plots and blocking accounted for 56.7% and 15.6% of the species variation respectively
and interactions between fire, plot and year 11.7% (Table 3.4). As only two years were
analysed, year fluctuations provided negligible explanation after adjustment for
covariables of fire and plots, due to collinearity, especially with time since last fire. The
higher correlation between floristic variation and fire variables, plots and blocking
resulted in a lower proportion of unexplained floristic variation (11.4%) in the 1999
and 2000 analysis, than that of the full five years.
Table 3.4. Partial RDA of floristic variation across surveys undertaken in both 1999
and 2000, attributable to fire variables, fluctuations between years, plots, interactions
and blocking. Fire variables were time since last fire, interval before last fire, fire
intensity and various fire seasons. 1The floristic variation accounted for by specific
variables and interactions is denoted as “% variation explained”. This is the sum of
canonical eigenvalues for each respective analysis, and is analogous to the sums of
squares in ANOVA. 2The significance of specific variables was assessed using Monte
Carlo test with 199 permutations.
Variable d.f. % variation explained1 F statistic P value2
Fire variables 5 4.6 4.271 0.005
Year 2 0.0
Plot 35 56.7 4.832 0.005
Fire x Year x Plot 11.7
Blocks 15.6
Unexplained variation 11.4
Forward selection of fire variables indicated that fire intensity had the single greatest
explanatory power, accounting for 3% of the species variation (Table 3.5). Fire
55
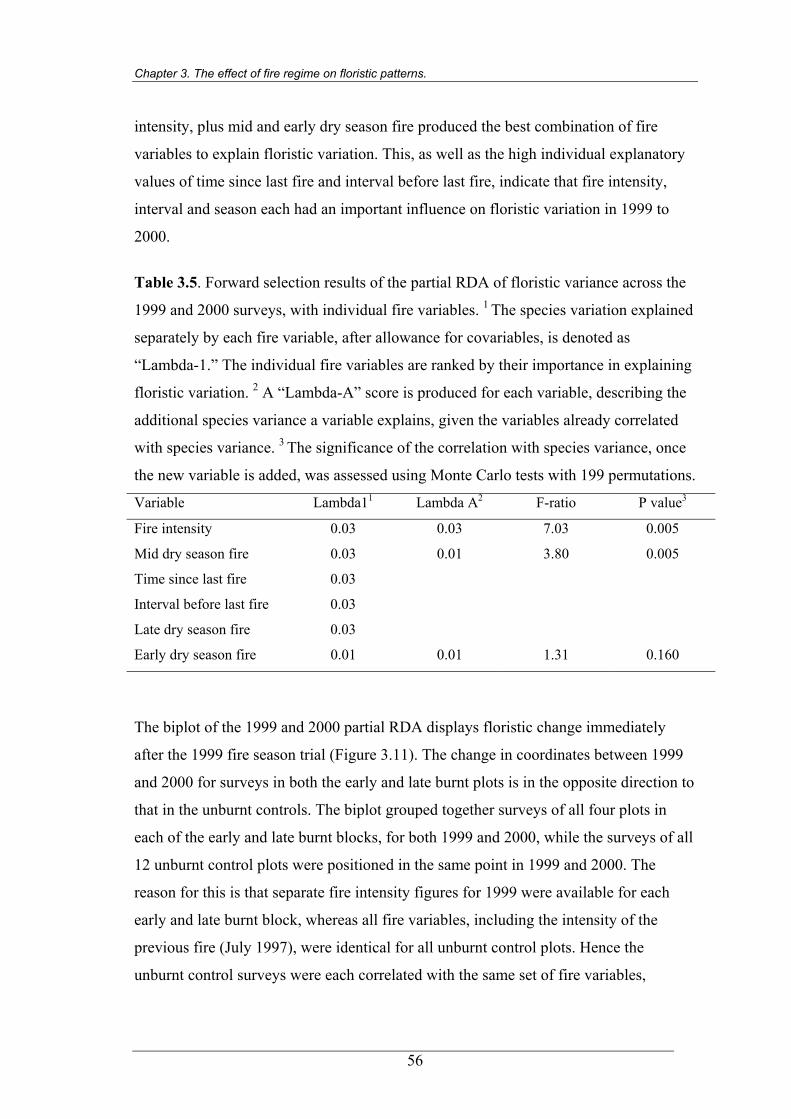
Chapter 3. The effect of fire regime on floristic patterns.
intensity, plus mid and early dry season fire produced the best combination of fire
variables to explain floristic variation. This, as well as the high individual explanatory
values of time since last fire and interval before last fire, indicate that fire intensity,
interval and season each had an important influence on floristic variation in 1999 to
2000.
Table 3.5. Forward selection results of the partial RDA of floristic variance across the
1999 and 2000 surveys, with individual fire variables. 1 The species variation explained
separately by each fire variable, after allowance for covariables, is denoted as
“Lambda-1.” The individual fire variables are ranked by their importance in explaining
floristic variation. 2 A “Lambda-A” score is produced for each variable, describing the
additional species variance a variable explains, given the variables already correlated
with species variance. 3 The significance of the correlation with species variance, once
the new variable is added, was assessed using Monte Carlo tests with 199 permutations.
Variable Lambda11 Lambda A2 F-ratio P value3
Fire intensity 0.03 0.03 7.03 0.005
Mid dry season fire 0.03 0.01 3.80 0.005
Time since last fire 0.03
Interval before last fire 0.03
Late dry season fire 0.03
Early dry season fire 0.01 0.01 1.31 0.160
The biplot of the 1999 and 2000 partial RDA displays floristic change immediately
after the 1999 fire season trial (Figure 3.11). The change in coordinates between 1999
and 2000 for surveys in both the early and late burnt plots is in the opposite direction to
that in the unburnt controls. The biplot grouped together surveys of all four plots in
each of the early and late burnt blocks, for both 1999 and 2000, while the surveys of all
12 unburnt control plots were positioned in the same point in 1999 and 2000. The
reason for this is that separate fire intensity figures for 1999 were available for each
early and late burnt block, whereas all fire variables, including the intensity of the
previous fire (July 1997), were identical for all unburnt control plots. Hence the
unburnt control surveys were each correlated with the same set of fire variables,
56
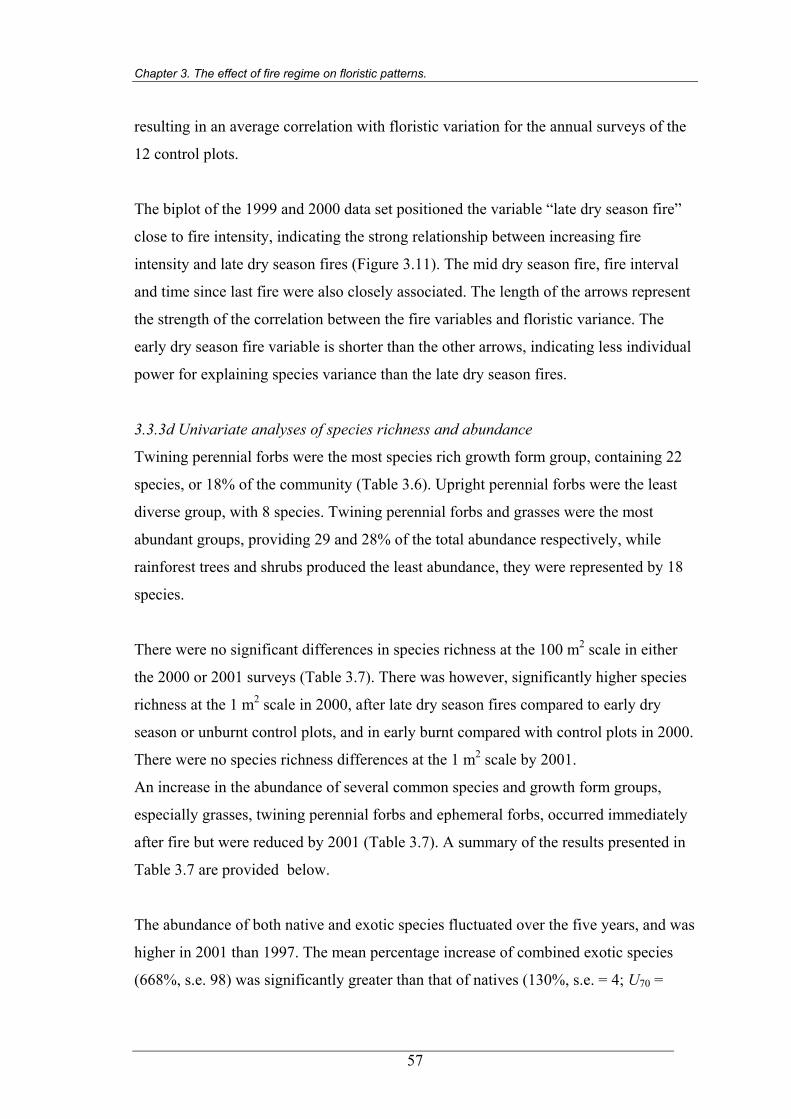
Chapter 3. The effect of fire regime on floristic patterns.
resulting in an average correlation with floristic variation for the annual surveys of the
12 control plots.
The biplot of the 1999 and 2000 data set positioned the variable “late dry season fire”
close to fire intensity, indicating the strong relationship between increasing fire
intensity and late dry season fires (Figure 3.11). The mid dry season fire, fire interval
and time since last fire were also closely associated. The length of the arrows represent
the strength of the correlation between the fire variables and floristic variance. The
early dry season fire variable is shorter than the other arrows, indicating less individual
power for explaining species variance than the late dry season fires.
3.3.3d Univariate analyses of species richness and abundance
Twining perennial forbs were the most species rich growth form group, containing 22
species, or 18% of the community (Table 3.6). Upright perennial forbs were the least
diverse group, with 8 species. Twining perennial forbs and grasses were the most
abundant groups, providing 29 and 28% of the total abundance respectively, while
rainforest trees and shrubs produced the least abundance, they were represented by 18
species.
There were no significant differences in species richness at the 100 m2 scale in either
the 2000 or 2001 surveys (Table 3.7). There was however, significantly higher species
richness at the 1 m2 scale in 2000, after late dry season fires compared to early dry
season or unburnt control plots, and in early burnt compared with control plots in 2000.
There were no species richness differences at the 1 m2 scale by 2001.
An increase in the abundance of several common species and growth form groups,
especially grasses, twining perennial forbs and ephemeral forbs, occurred immediately
after fire but were reduced by 2001 (Table 3.7). A summary of the results presented in
Table 3.7 are provided below.
The abundance of both native and exotic species fluctuated over the five years, and was
higher in 2001 than 1997. The mean percentage increase of combined exotic species
(668%, s.e. 98) was significantly greater than that of natives (130%, s.e. = 4; U70 =
57
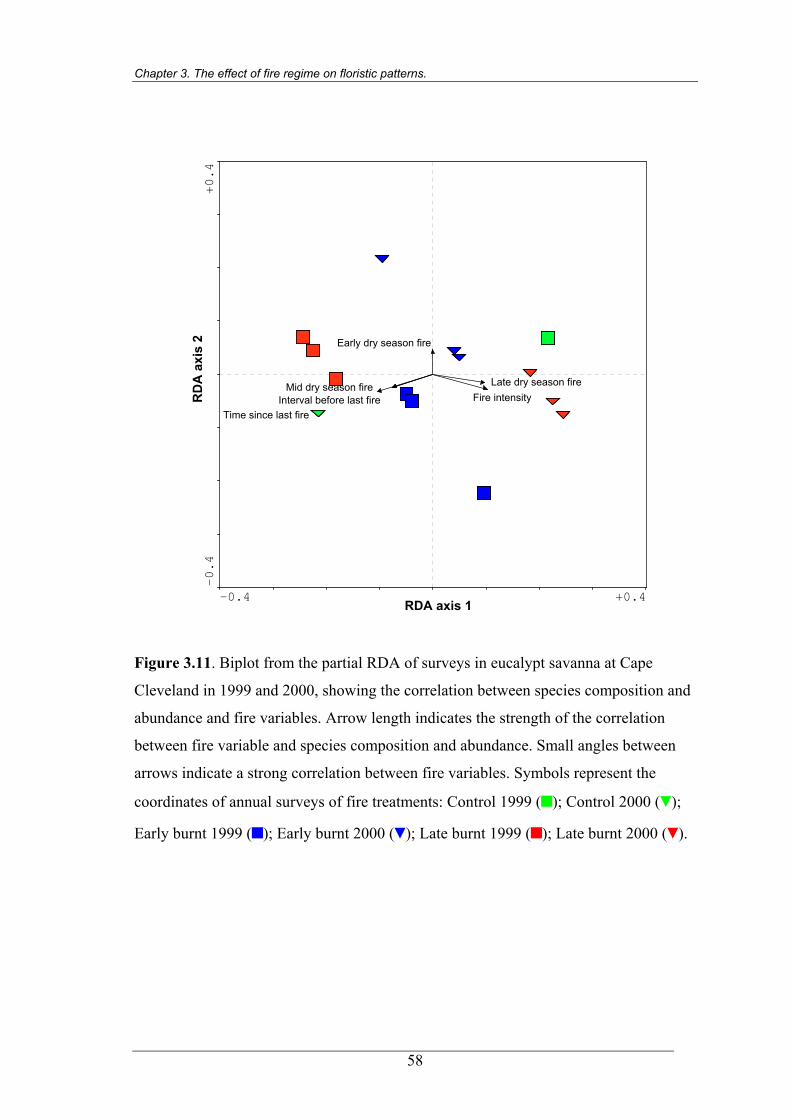
Chapter 3. The effect of fire regime on floristic patterns.
RDA axis 1
RD
A a
xis
2
-0.4 +0.4
-0.4
+0.4
Time since last fire
Fire intensityLate dry season fire
Interval before last fireMid dry season fire
Early dry season fire
Figure 3.11. Biplot from the partial RDA of surveys in eucalypt savanna at Cape
Cleveland in 1999 and 2000, showing the correlation between species composition and
abundance and fire variables. Arrow length indicates the strength of the correlation
between fire variable and species composition and abundance. Small angles between
arrows indicate a strong correlation between fire variables. Symbols represent the
coordinates of annual surveys of fire treatments: Control 1999 (■); Control 2000 (▼);
Early burnt 1999 (■); Early burnt 2000 (▼); Late burnt 1999 (■); Late burnt 2000 (▼).
58
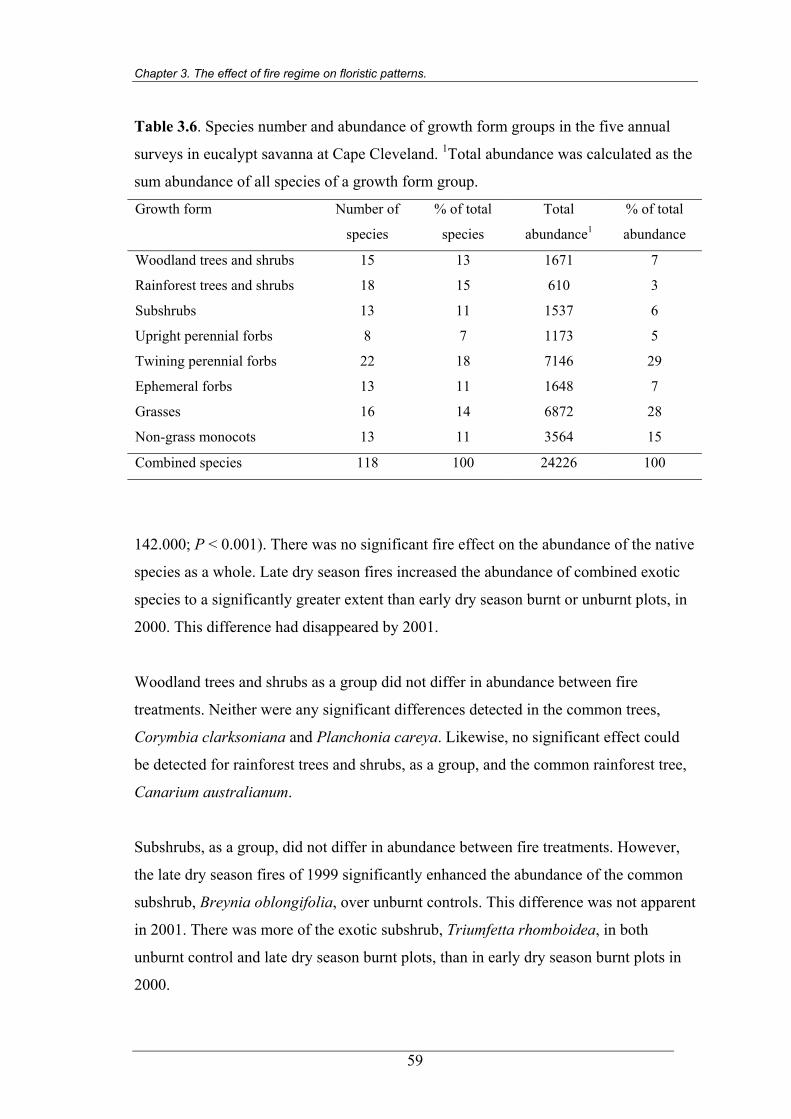
Chapter 3. The effect of fire regime on floristic patterns.
Table 3.6. Species number and abundance of growth form groups in the five annual
surveys in eucalypt savanna at Cape Cleveland. 1Total abundance was calculated as the
sum abundance of all species of a growth form group.
Growth form Number of
species
% of total
species
Total
abundance1
% of total
abundance
Woodland trees and shrubs 15 13 1671 7
Rainforest trees and shrubs 18 15 610 3
Subshrubs 13 11 1537 6
Upright perennial forbs 8 7 1173 5
Twining perennial forbs 22 18 7146 29
Ephemeral forbs 13 11 1648 7
Grasses 16 14 6872 28
Non-grass monocots 13 11 3564 15
Combined species 118 100 24226 100
142.000; P < 0.001). There was no significant fire effect on the abundance of the native
species as a whole. Late dry season fires increased the abundance of combined exotic
species to a significantly greater extent than early dry season burnt or unburnt plots, in
2000. This difference had disappeared by 2001.
Woodland trees and shrubs as a group did not differ in abundance between fire
treatments. Neither were any significant differences detected in the common trees,
Corymbia clarksoniana and Planchonia careya. Likewise, no significant effect could
be detected for rainforest trees and shrubs, as a group, and the common rainforest tree,
Canarium australianum.
Subshrubs, as a group, did not differ in abundance between fire treatments. However,
the late dry season fires of 1999 significantly enhanced the abundance of the common
subshrub, Breynia oblongifolia, over unburnt controls. This difference was not apparent
in 2001. There was more of the exotic subshrub, Triumfetta rhomboidea, in both
unburnt control and late dry season burnt plots, than in early dry season burnt plots in
2000.
59
Chapter 3. The effect of fire regime on floristic patterns.
Upright perennial forbs, as well as the common species Hybanthus stellarioides and
Rostellularia adscendens, showed no significant fire effects. There was, however, a
significant fluctuation between the years 1999 and 2001 in the upright perennial forb
group that was not related to fire treatment.
Twining perennial forbs responded to fire treatment, with significantly greater
abundance in the late dry season burnt plots compared to unburnt control plots in 2000.
Treatment effects disappeared by 2001. The abundance of the dominant twiner,
Galactia tenuifolia, was significantly enhanced by burning. This was the only species
to show a significantly greater enhancement after early rather than late dry season
burning. The exotic twining perennial forb Passiflora foetida was significantly more
abundant after late dry season fires than early dry season fires or unburnt controls, in
both 2000 and 2001. This fire effect was confirmed by a significant fire by year
interaction, between 1999 and 2001.
The common twining perennial forbs, Flemingia parvifolia, Jasminum didymum and
the exotic Macroptilium atropurpureum showed no significant response to fire regime.
Glycine tomentella and Pycnospora lutescens showed significant fluctuations between
1999 and 2001 that were not related to fire regime.
Ephemeral forbs, as a group, showed a strong response to fire. Their highest abundance
occurred in 2000, following fire, with greater abundance after both early and late dry
season fires compared to unburnt controls. Few ephemeral forbs were present in the
2001 survey and consequently there were no treatment differences in that year. There
was significantly greater abundance of the ephemeral forb Indigofera hirsuta in early
and late burnt plots than unburnt controls in 2000. There was no significant fire effect
detected for Tephrosia juncea.
The grasses, as a group, were significantly more abundant in late dry season burnt plots
than unburnt controls in 2000, however this difference was not evident by 2001. No
significant fire effects could be detected for the common perennial grasses Digitaria
breviglumis, Heteropogon contortus and Themeda triandra. In 2001, the dominant
60
Chapter 3. The effect of fire regime on floristic patterns.
grass H. triticeus, was significantly more abundant in early and late dry season burnt
plots than control plots, which had remained unburnt for four years by that time.
There were no significant fire effects detected for the non-grass monocots, or the
common monocots Commelina spp., Curculigo ensifolia, Eustrephus latifolius and
Scleria mackaviensis.
61
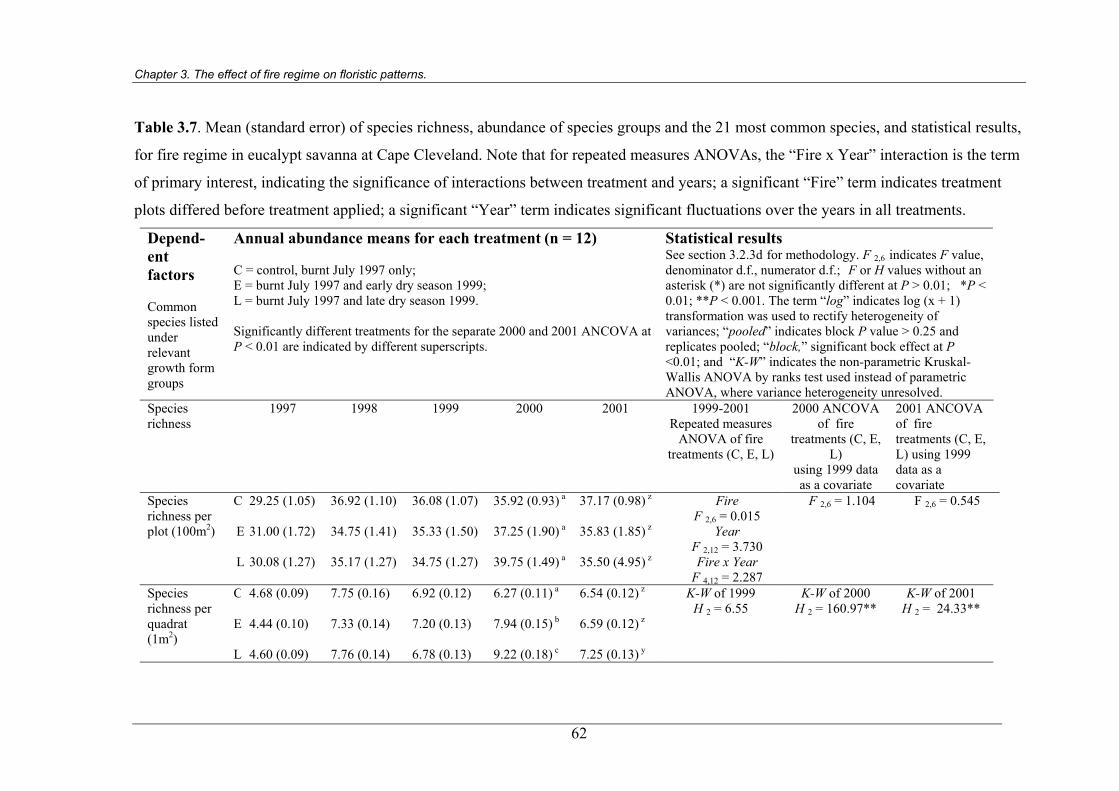
Chapter 3. The effect of fire regime on floristic patterns.
Table 3.7. Mean (standard error) of species richness, abundance of species groups and the 21 most common species, and statistical results,
for fire regime in eucalypt savanna at Cape Cleveland. Note that for repeated measures ANOVAs, the “Fire x Year” interaction is the term
of primary interest, indicating the significance of interactions between treatment and years; a significant “Fire” term indicates treatment
plots differed before treatment applied; a significant “Year” term indicates significant fluctuations over the years in all treatments.
Depend-ent factors Common species listed under relevant growth form groups
Annual abundance means for each treatment (n = 12) C = control, burnt July 1997 only; E = burnt July 1997 and early dry season 1999; L = burnt July 1997 and late dry season 1999. Significantly different treatments for the separate 2000 and 2001 ANCOVA at P < 0.01 are indicated by different superscripts.
Statistical results See section 3.2.3d for methodology. F 2,6 indicates F value, denominator d.f., numerator d.f.; F or H values without an asterisk (*) are not significantly different at P > 0.01; *P < 0.01; **P < 0.001. The term “log” indicates log (x + 1) transformation was used to rectify heterogeneity of variances; “pooled” indicates block P value > 0.25 and replicates pooled; “block,” significant bock effect at P <0.01; and “K-W” indicates the non-parametric Kruskal-Wallis ANOVA by ranks test used instead of parametric ANOVA, where variance heterogeneity unresolved.
Species richness
1997 1998 1999 2000 2001 1999-2001Repeated measures
ANOVA of fire treatments (C, E, L)
2000 ANCOVA of fire
treatments (C, E, L)
using 1999 data as a covariate
2001 ANCOVA of fire treatments (C, E, L) using 1999 data as a covariate
C 29.25 (1.05) 36.92 (1.10) 36.08 (1.07) 35.92 (0.93) a 37.17 (0.98) z Fire F 2,6 = 0.015
F 2,6 = 1.104 F 2,6 = 0.545
E 31.00 (1.72) 34.75 (1.41) 35.33 (1.50) 37.25 (1.90) a
35.83 (1.85) z Year F 2,12 = 3.730
Species richness per plot (100m2)
L 30.08 (1.27) 35.17 (1.27) 34.75 (1.27) 39.75 (1.49) a 35.50 (4.95) z Fire x Year F 4,12 = 2.287
C 4.68 (0.09) 7.75 (0.16) 6.92 (0.12) 6.27 (0.11) a 6.54 (0.12) z K-W of 1999 H 2 = 6.55
K-W of 2000 H 2 = 160.97**
K-W of 2001 H 2 = 24.33**
Species richness per quadrat (1m2)
E 4.44 (0.10) 7.33 (0.14) 7.20 (0.13) 7.94 (0.15) b
6.59 (0.12) z
L 4.60 (0.09) 7.76 (0.14) 6.78 (0.13) 9.22 (0.18) c 7.25 (0.13) y
62
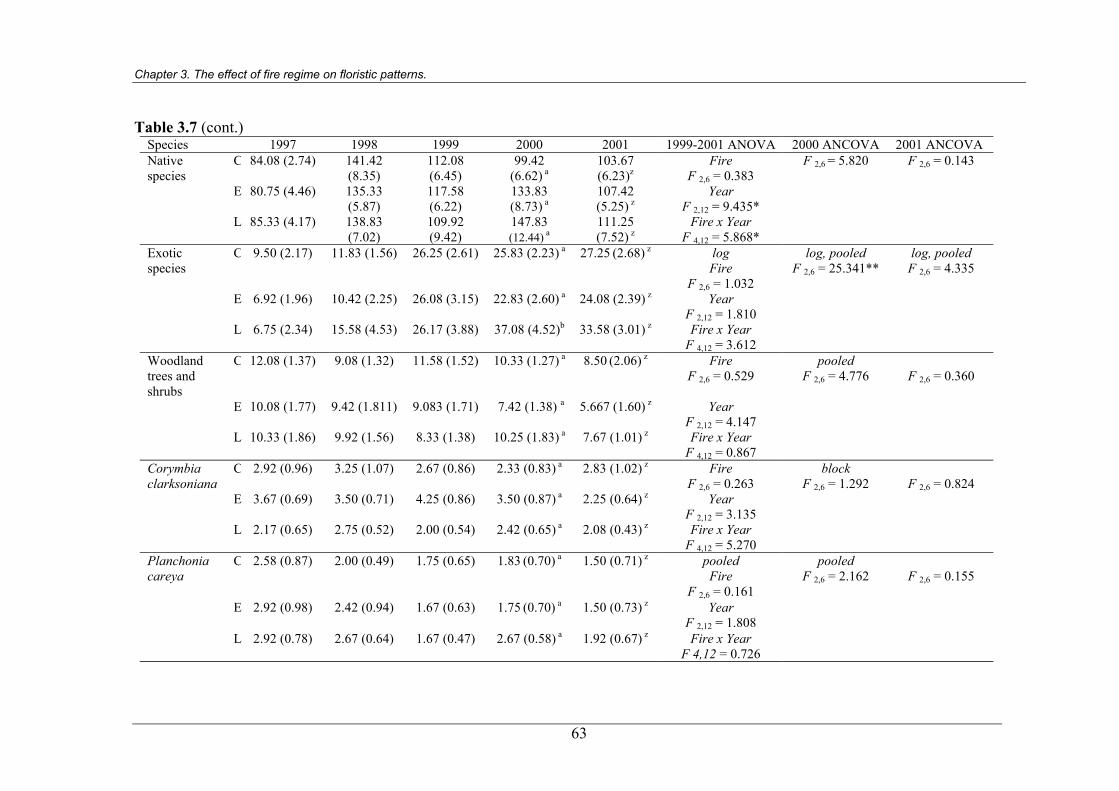
Chapter 3. The effect of fire regime on floristic patterns.
Table 3.7 (cont.) Species 1997 1998 1999 2000 2001 1999-2001 ANOVA 2000 ANCOVA 2001 ANCOVA
C 84.08 (2.74) 141.42 (8.35)
112.08 (6.45)
99.42 (6.62) a
103.67 (6.23)z
Fire F 2,6 = 0.383
F 2,6 = 5.820
F 2,6 = 0.143
E 80.75 (4.46) 135.33 (5.87)
117.58 (6.22)
133.83 (8.73) a
107.42 (5.25) z
Year F 2,12 = 9.435*
Native species
L 85.33 (4.17) 138.83 (7.02)
109.92 (9.42)
147.83 (12.44) a
111.25 (7.52) z
Fire x Year F 4,12 = 5.868*
C 9.50 (2.17) 11.83 (1.56) 26.25 (2.61) 25.83 (2.23) a 27.25 (2.68) z log Fire
F 2,6 = 1.032
log, pooled F 2,6 = 25.341**
log, pooled F 2,6 = 4.335
E 6.92 (1.96) 10.42 (2.25) 26.08 (3.15) 22.83 (2.60) a
24.08 (2.39) z Year F 2,12 = 1.810
Exotic species
L 6.75 (2.34) 15.58 (4.53) 26.17 (3.88) 37.08 (4.52)b 33.58 (3.01) z Fire x Year F 4,12 = 3.612
C 12.08 (1.37) 9.08 (1.32) 11.58 (1.52) 10.33 (1.27) a 8.50 (2.06) z Fire F 2,6 = 0.529
pooled F 2,6 = 4.776
F 2,6 = 0.360
E 10.08 (1.77) 9.42 (1.811) 9.083 (1.71) 7.42 (1.38) a
5.667 (1.60) z Year F 2,12 = 4.147
Woodland trees and shrubs
L 10.33 (1.86) 9.92 (1.56) 8.33 (1.38) 10.25 (1.83) a 7.67 (1.01) z Fire x Year F 4,12 = 0.867
C 2.92 (0.96) 3.25 (1.07) 2.67 (0.86) 2.33 (0.83) a 2.83 (1.02) z Fire F 2,6 = 0.263
block F 2,6 = 1.292
F 2,6 = 0.824
E 3.67 (0.69) 3.50 (0.71) 4.25 (0.86) 3.50 (0.87) a
2.25 (0.64) z Year F 2,12 = 3.135
Corymbia clarksoniana
L 2.17 (0.65) 2.75 (0.52) 2.00 (0.54) 2.42 (0.65) a 2.08 (0.43) z Fire x Year F 4,12 = 5.270
C 2.58 (0.87) 2.00 (0.49) 1.75 (0.65) 1.83 (0.70) a 1.50 (0.71) z pooled Fire
F 2,6 = 0.161
pooled F 2,6 = 2.162
F 2,6 = 0.155
E 2.92 (0.98) 2.42 (0.94) 1.67 (0.63) 1.75 (0.70) a
1.50 (0.73) z Year F 2,12 = 1.808
Planchonia careya
L 2.92 (0.78) 2.67 (0.64) 1.67 (0.47) 2.67 (0.58) a 1.92 (0.67) z Fire x Year F 4,12 = 0.726
63
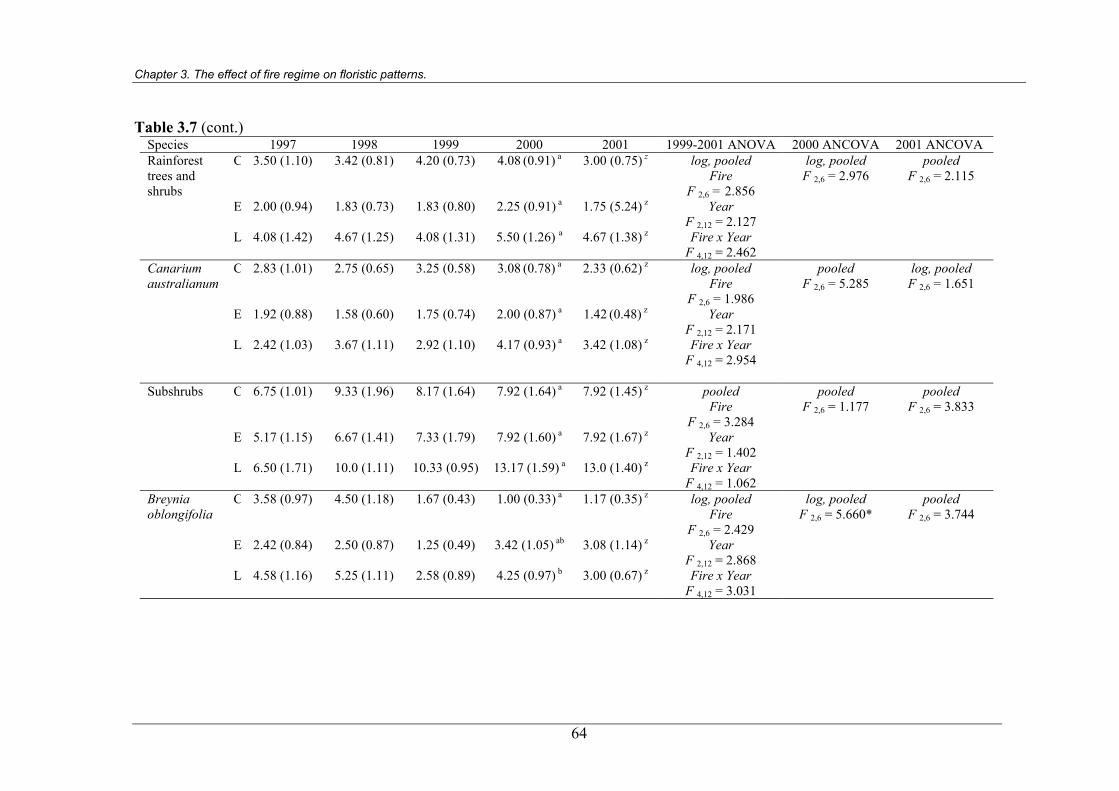
Chapter 3. The effect of fire regime on floristic patterns.
Table 3.7 (cont.) Species 1997 1998 1999 2000 2001 1999-2001 ANOVA 2000 ANCOVA 2001 ANCOVA Rainforest trees and shrubs
C 3.50 (1.10) 3.42 (0.81) 4.20 (0.73) 4.08 (0.91) a 3.00 (0.75) z log, pooledFire
F 2,6 = 2.856
log, pooled F 2,6 = 2.976
pooled F 2,6 = 2.115
E 2.00 (0.94) 1.83 (0.73) 1.83 (0.80) 2.25 (0.91) a
1.75 (5.24) z Year F 2,12 = 2.127
L 4.08 (1.42) 4.67 (1.25) 4.08 (1.31) 5.50 (1.26) a 4.67 (1.38) z Fire x Year F 4,12 = 2.462
Canarium australianum
C 2.83 (1.01) 2.75 (0.65) 3.25 (0.58) 3.08 (0.78) a 2.33 (0.62) z log, pooled Fire
F 2,6 = 1.986
pooled F 2,6 = 5.285
log, pooled F 2,6 = 1.651
E 1.92 (0.88) 1.58 (0.60) 1.75 (0.74) 2.00 (0.87) a
1.42 (0.48) z Year F 2,12 = 2.171
L 2.42 (1.03) 3.67 (1.11) 2.92 (1.10) 4.17 (0.93) a 3.42 (1.08) z Fire x Year F 4,12 = 2.954
Subshrubs C 6.75 (1.01) 9.33 (1.96) 8.17 (1.64) 7.92 (1.64) a 7.92 (1.45) z pooled
Fire F 2,6 = 3.284
pooled F 2,6 = 1.177
pooled F 2,6 = 3.833
E 5.17 (1.15) 6.67 (1.41) 7.33 (1.79) 7.92 (1.60) a
7.92 (1.67) z Year F 2,12 = 1.402
L 6.50 (1.71) 10.0 (1.11) 10.33 (0.95) 13.17 (1.59) a 13.0 (1.40) z Fire x Year F 4,12 = 1.062
Breynia oblongifolia
C 3.58 (0.97) 4.50 (1.18) 1.67 (0.43) 1.00 (0.33) a 1.17 (0.35) z log, pooled Fire
F 2,6 = 2.429
log, pooled F 2,6 = 5.660*
pooled F 2,6 = 3.744
E 2.42 (0.84) 2.50 (0.87) 1.25 (0.49) 3.42 (1.05) ab
3.08 (1.14) z Year F 2,12 = 2.868
L 4.58 (1.16) 5.25 (1.11) 2.58 (0.89) 4.25 (0.97) b 3.00 (0.67) z Fire x Year F 4,12 = 3.031
64
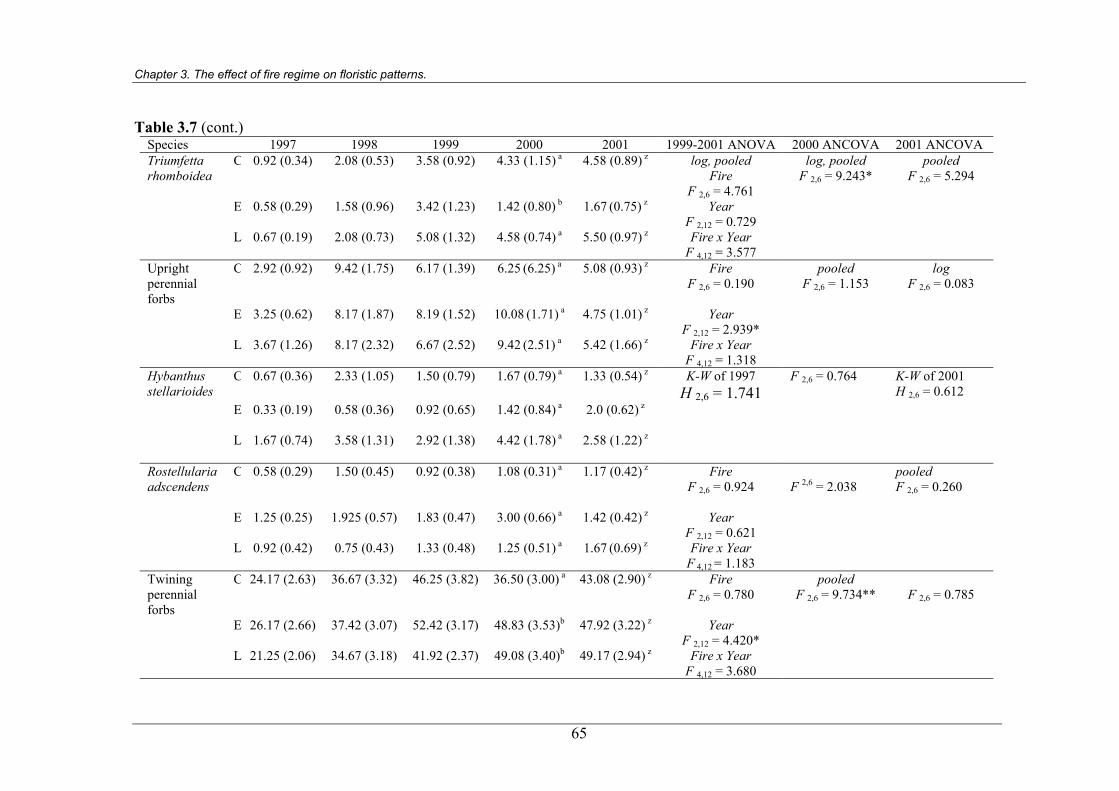
Chapter 3. The effect of fire regime on floristic patterns.
Table 3.7 (cont.) Species 1997 1998 1999 2000 2001 1999-2001 ANOVA 2000 ANCOVA 2001 ANCOVA Triumfetta rhomboidea
C 0.92 (0.34) 2.08 (0.53) 3.58 (0.92) 4.33 (1.15) a 4.58 (0.89) z log, pooled Fire
F 2,6 = 4.761
log, pooled F 2,6 = 9.243*
pooled F 2,6 = 5.294
E 0.58 (0.29) 1.58 (0.96) 3.42 (1.23) 1.42 (0.80) b
1.67 (0.75) z Year F 2,12 = 0.729
L 0.67 (0.19) 2.08 (0.73) 5.08 (1.32) 4.58 (0.74) a 5.50 (0.97) z Fire x Year F 4,12 = 3.577
Upright perennial forbs
C 2.92 (0.92) 9.42 (1.75) 6.17 (1.39) 6.25 (6.25) a 5.08 (0.93) z Fire F 2,6 = 0.190
pooled F 2,6 = 1.153
log F 2,6 = 0.083
E 3.25 (0.62) 8.17 (1.87) 8.19 (1.52) 10.08 (1.71) a
4.75 (1.01) z Year F 2,12 = 2.939*
L 3.67 (1.26) 8.17 (2.32) 6.67 (2.52) 9.42 (2.51) a 5.42 (1.66) z Fire x Year F 4,12 = 1.318
Hybanthus stellarioides
C 0.67 (0.36) 2.33 (1.05) 1.50 (0.79) 1.67 (0.79) a 1.33 (0.54) z K-W of 1997 H 2,6 = 1.741
F 2,6 = 0.764 K-W of 2001 H 2,6 = 0.612
E 0.33 (0.19) 0.58 (0.36) 0.92 (0.65)
1.42 (0.84) a
2.0 (0.62) z
L 1.67 (0.74) 3.58 (1.31) 2.92 (1.38) 4.42 (1.78) a 2.58 (1.22) z
Rostellularia adscendens
C 0.58 (0.29) 1.50 (0.45) 0.92 (0.38) 1.08 (0.31) a 1.17 (0.42) z Fire F 2,6 = 0.924
F 2,6 = 2.038
pooled F 2,6 = 0.260
E 1.25 (0.25) 1.925 (0.57) 1.83 (0.47) 3.00 (0.66) a
1.42 (0.42) z Year F 2,12 = 0.621
L 0.92 (0.42) 0.75 (0.43) 1.33 (0.48) 1.25 (0.51) a 1.67 (0.69) z Fire x Year F 4,12 = 1.183
Twining perennial forbs
C 24.17 (2.63) 36.67 (3.32) 46.25 (3.82) 36.50 (3.00) a 43.08 (2.90) z Fire F 2,6 = 0.780
pooled F 2,6 = 9.734**
F 2,6 = 0.785
E 26.17 (2.66) 37.42 (3.07) 52.42 (3.17) 48.83 (3.53)b
47.92 (3.22) z Year F 2,12 = 4.420*
L 21.25 (2.06) 34.67 (3.18) 41.92 (2.37) 49.08 (3.40)b 49.17 (2.94) z Fire x Year F 4,12 = 3.680
65
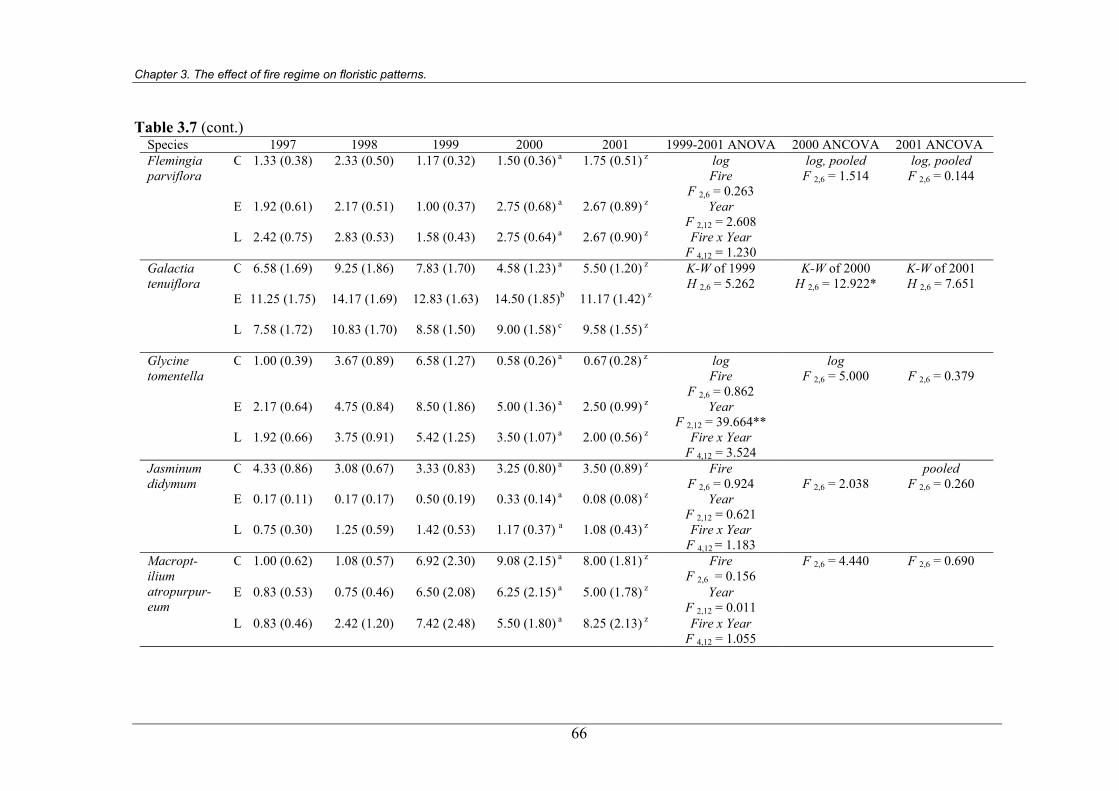
Chapter 3. The effect of fire regime on floristic patterns.
Table 3.7 (cont.) Species 1997 1998 1999 2000 2001 1999-2001 ANOVA 2000 ANCOVA 2001 ANCOVA Flemingia parviflora
C 1.33 (0.38) 2.33 (0.50) 1.17 (0.32) 1.50 (0.36) a 1.75 (0.51) z log Fire
F 2,6 = 0.263
log, pooled F 2,6 = 1.514
log, pooled F 2,6 = 0.144
E 1.92 (0.61) 2.17 (0.51) 1.00 (0.37) 2.75 (0.68) a
2.67 (0.89) z Year F 2,12 = 2.608
L 2.42 (0.75) 2.83 (0.53) 1.58 (0.43) 2.75 (0.64) a 2.67 (0.90) z Fire x Year F 4,12 = 1.230
Galactia tenuiflora
C 6.58 (1.69)
9.25 (1.86) 7.83 (1.70) 4.58 (1.23) a 5.50 (1.20) z K-W of 1999 H 2,6 = 5.262
K-W of 2000 H 2,6 = 12.922*
K-W of 2001 H 2,6 = 7.651
E 11.25 (1.75)
14.17 (1.69)
12.83 (1.63) 14.50 (1.85)b 11.17 (1.42) z
L 7.58 (1.72) 10.83 (1.70)
8.58 (1.50) 9.00 (1.58) c 9.58 (1.55) z
Glycine tomentella
C 1.00 (0.39) 3.67 (0.89) 6.58 (1.27) 0.58 (0.26) a 0.67 (0.28) z log Fire
F 2,6 = 0.862
log F 2,6 = 5.000
F 2,6 = 0.379
E 2.17 (0.64) 4.75 (0.84) 8.50 (1.86) 5.00 (1.36) a
2.50 (0.99) z Year F 2,12 = 39.664**
L 1.92 (0.66) 3.75 (0.91) 5.42 (1.25) 3.50 (1.07) a 2.00 (0.56) z Fire x Year F 4,12 = 3.524
Jasminum didymum
C 4.33 (0.86) 3.08 (0.67) 3.33 (0.83) 3.25 (0.80) a 3.50 (0.89) z Fire F 2,6 = 0.924
F 2,6 = 2.038
pooled F 2,6 = 0.260
E 0.17 (0.11) 0.17 (0.17) 0.50 (0.19) 0.33 (0.14) a
0.08 (0.08) z Year F 2,12 = 0.621
L 0.75 (0.30) 1.25 (0.59) 1.42 (0.53) 1.17 (0.37) a 1.08 (0.43) z Fire x Year F 4,12 = 1.183
C 1.00 (0.62) 1.08 (0.57) 6.92 (2.30) 9.08 (2.15) a 8.00 (1.81) z Fire F 2,6 = 0.156
F 2,6 = 4.440 F 2,6 = 0.690
E 0.83 (0.53) 0.75 (0.46) 6.50 (2.08) 6.25 (2.15) a
5.00 (1.78) z Year F 2,12 = 0.011
Macropt-ilium atropurpur-eum
L 0.83 (0.46) 2.42 (1.20) 7.42 (2.48) 5.50 (1.80) a 8.25 (2.13) z Fire x Year F 4,12 = 1.055
66
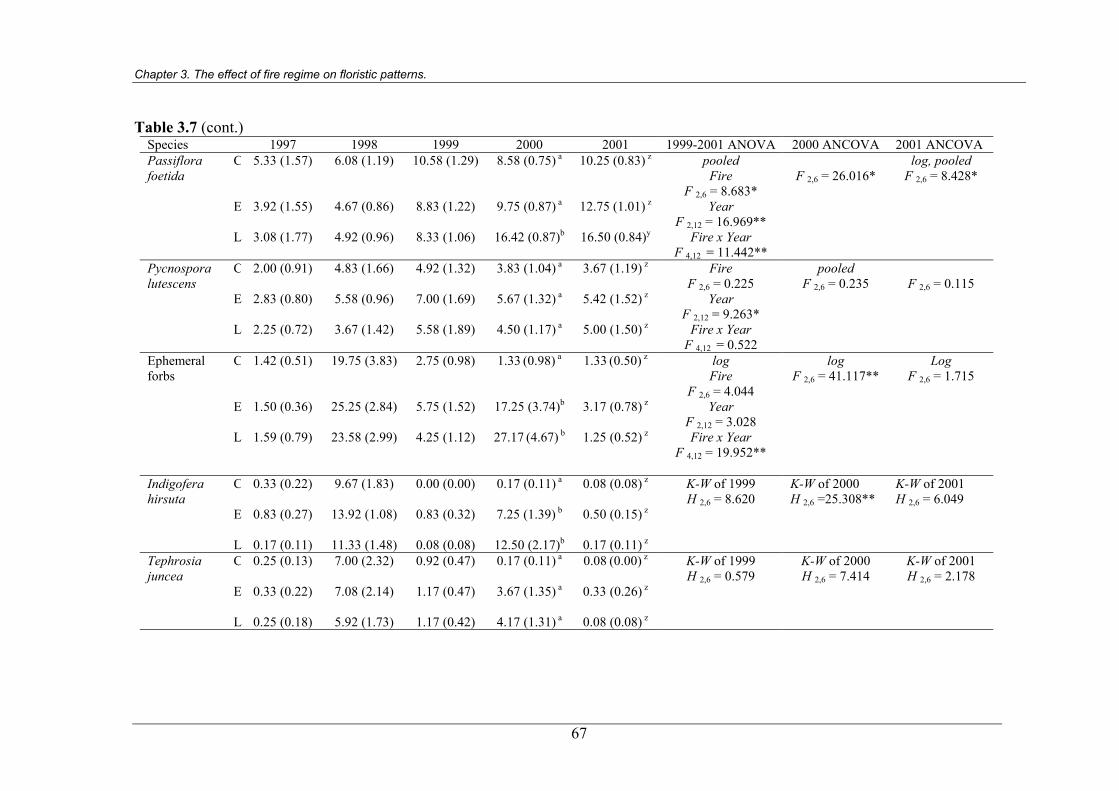
Chapter 3. The effect of fire regime on floristic patterns.
Table 3.7 (cont.) Species 1997 1998 1999 2000 2001 1999-2001 ANOVA 2000 ANCOVA 2001 ANCOVA Passiflora foetida
C 5.33 (1.57) 6.08 (1.19) 10.58 (1.29) 8.58 (0.75) a 10.25 (0.83) z pooled Fire
F 2,6 = 8.683*
F 2,6 = 26.016*
log, pooled F 2,6 = 8.428*
E 3.92 (1.55) 4.67 (0.86) 8.83 (1.22) 9.75 (0.87) a
12.75 (1.01) z Year F 2,12 = 16.969**
L 3.08 (1.77) 4.92 (0.96) 8.33 (1.06) 16.42 (0.87)b 16.50 (0.84)y Fire x Year F 4,12 = 11.442**
Pycnospora lutescens
C 2.00 (0.91) 4.83 (1.66) 4.92 (1.32) 3.83 (1.04) a 3.67 (1.19) z Fire F 2,6 = 0.225
pooled F 2,6 = 0.235
F 2,6 = 0.115
E 2.83 (0.80) 5.58 (0.96) 7.00 (1.69) 5.67 (1.32) a
5.42 (1.52) z Year F 2,12 = 9.263*
L 2.25 (0.72) 3.67 (1.42) 5.58 (1.89) 4.50 (1.17) a 5.00 (1.50) z Fire x Year F 4,12 = 0.522
Ephemeral forbs
C 1.42 (0.51) 19.75 (3.83) 2.75 (0.98) 1.33 (0.98) a 1.33 (0.50) z log Fire
F 2,6 = 4.044
log F 2,6 = 41.117**
Log F 2,6 = 1.715
E 1.50 (0.36) 25.25 (2.84) 5.75 (1.52) 17.25 (3.74)b
3.17 (0.78) z Year F 2,12 = 3.028
L 1.59 (0.79) 23.58 (2.99) 4.25 (1.12) 27.17 (4.67) b 1.25 (0.52) z Fire x Year F 4,12 = 19.952**
Indigofera hirsuta
C 0.33 (0.22)
9.67 (1.83) 0.00 (0.00) 0.17 (0.11) a 0.08 (0.08) z K-W of 1999 H 2,6 = 8.620
K-W of 2000 H 2,6 =25.308**
K-W of 2001 H 2,6 = 6.049
E 0.83 (0.27) 13.92 (1.08)
0.83 (0.32) 7.25 (1.39) b 0.50 (0.15) z
L 0.17 (0.11) 11.33 (1.48) 0.08 (0.08) 12.50 (2.17)b 0.17 (0.11) z Tephrosia juncea
C 0.25 (0.13) 7.00 (2.32) 0.92 (0.47) 0.17 (0.11) a 0.08 (0.00) z
K-W of 1999 H 2,6 = 0.579
K-W of 2000 H 2,6 = 7.414
K-W of 2001 H 2,6 = 2.178
E 0.33 (0.22) 7.08 (2.14) 1.17 (0.47) 3.67 (1.35) a
0.33 (0.26) z
L 0.25 (0.18) 5.92 (1.73) 1.17 (0.42) 4.17 (1.31) a 0.08 (0.08) z
67
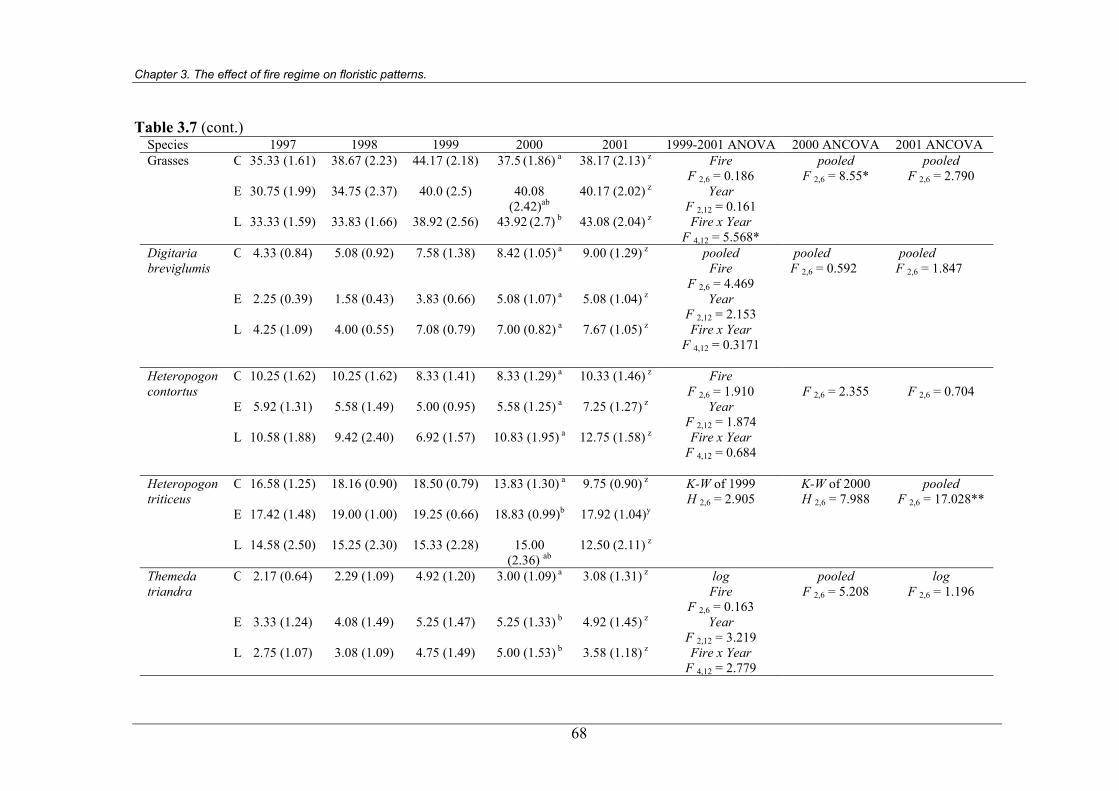
Chapter 3. The effect of fire regime on floristic patterns.
Table 3.7 (cont.) Species 1997 1998 1999 2000 2001 1999-2001 ANOVA 2000 ANCOVA 2001 ANCOVA Grasses C 35.33 (1.61) 38.67 (2.23) 44.17 (2.18) 37.5 (1.86) a 38.17 (2.13) z Fire
F 2,6 = 0.186 pooled
F 2,6 = 8.55* pooled
F 2,6 = 2.790 E 30.75 (1.99) 34.75 (2.37) 40.0 (2.5) 40.08
(2.42)ab 40.17 (2.02) z Year
F 2,12 = 0.161
L 33.33 (1.59) 33.83 (1.66) 38.92 (2.56) 43.92 (2.7) b 43.08 (2.04) z Fire x Year F 4,12 = 5.568*
Digitaria breviglumis
C 4.33 (0.84) 5.08 (0.92) 7.58 (1.38) 8.42 (1.05) a 9.00 (1.29) z pooled Fire
F 2,6 = 4.469
pooled F 2,6 = 0.592
pooled F 2,6 = 1.847
E 2.25 (0.39) 1.58 (0.43) 3.83 (0.66) 5.08 (1.07) a
5.08 (1.04) z Year F 2,12 = 2.153
L 4.25 (1.09) 4.00 (0.55) 7.08 (0.79) 7.00 (0.82) a 7.67 (1.05) z Fire x Year F 4,12 = 0.3171
Heteropogon contortus
C 10.25 (1.62) 10.25 (1.62) 8.33 (1.41) 8.33 (1.29) a 10.33 (1.46) z Fire F 2,6 = 1.910
F 2,6 = 2.355
F 2,6 = 0.704
E 5.92 (1.31) 5.58 (1.49) 5.00 (0.95) 5.58 (1.25) a
7.25 (1.27) z Year F 2,12 = 1.874
L 10.58 (1.88) 9.42 (2.40) 6.92 (1.57) 10.83 (1.95) a 12.75 (1.58) z Fire x Year F 4,12 = 0.684
Heteropogon triticeus
C 16.58 (1.25) 18.16 (0.90) 18.50 (0.79) 13.83 (1.30) a 9.75 (0.90) z K-W of 1999 H 2,6 = 2.905
K-W of 2000 H 2,6 = 7.988
pooled F 2,6 = 17.028**
E 17.42 (1.48) 19.00 (1.00) 19.25 (0.66)
18.83 (0.99)b 17.92 (1.04)y
L 14.58 (2.50) 15.25 (2.30) 15.33 (2.28) 15.00 (2.36) ab
12.50 (2.11) z
Themeda triandra
C 2.17 (0.64) 2.29 (1.09) 4.92 (1.20) 3.00 (1.09) a 3.08 (1.31) z log Fire
F 2,6 = 0.163
pooled F 2,6 = 5.208
log F 2,6 = 1.196
E 3.33 (1.24) 4.08 (1.49) 5.25 (1.47) 5.25 (1.33) b
4.92 (1.45) z Year F 2,12 = 3.219
L 2.75 (1.07) 3.08 (1.09) 4.75 (1.49) 5.00 (1.53) b 3.58 (1.18) z Fire x Year F 4,12 = 2.779
68
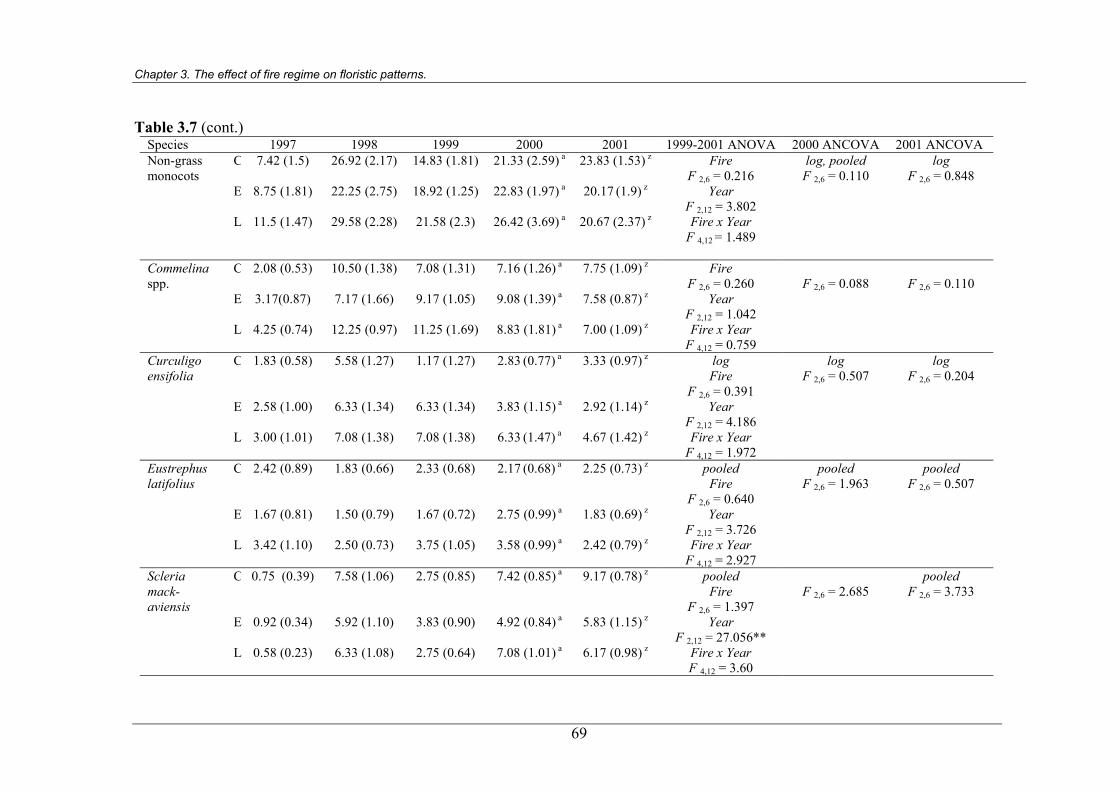
Chapter 3. The effect of fire regime on floristic patterns.
Table 3.7 (cont.) Species 1997 1998 1999 2000 2001 1999-2001 ANOVA 2000 ANCOVA 2001 ANCOVA Non-grass monocots
C 7.42 (1.5) 26.92 (2.17) 14.83 (1.81) 21.33 (2.59) a 23.83 (1.53) z Fire F 2,6 = 0.216
log, pooled F 2,6 = 0.110
log F 2,6 = 0.848
E 8.75 (1.81) 22.25 (2.75) 18.92 (1.25) 22.83 (1.97) a
20.17 (1.9) z Year F 2,12 = 3.802
L 11.5 (1.47) 29.58 (2.28) 21.58 (2.3) 26.42 (3.69) a 20.67 (2.37) z Fire x Year F 4,12 = 1.489
Commelina spp.
C 2.08 (0.53) 10.50 (1.38) 7.08 (1.31) 7.16 (1.26) a 7.75 (1.09) z Fire F 2,6 = 0.260
F 2,6 = 0.088
F 2,6 = 0.110
E 3.17(0.87) 7.17 (1.66) 9.17 (1.05) 9.08 (1.39) a
7.58 (0.87) z Year F 2,12 = 1.042
L 4.25 (0.74) 12.25 (0.97) 11.25 (1.69) 8.83 (1.81) a 7.00 (1.09) z Fire x Year F 4,12 = 0.759
Curculigo ensifolia
C 1.83 (0.58) 5.58 (1.27) 1.17 (1.27) 2.83 (0.77) a 3.33 (0.97) z log Fire
F 2,6 = 0.391
log F 2,6 = 0.507
log F 2,6 = 0.204
E 2.58 (1.00) 6.33 (1.34) 6.33 (1.34) 3.83 (1.15) a
2.92 (1.14) z Year F 2,12 = 4.186
L 3.00 (1.01) 7.08 (1.38) 7.08 (1.38) 6.33 (1.47) a 4.67 (1.42) z Fire x Year F 4,12 = 1.972
Eustrephus latifolius
C 2.42 (0.89) 1.83 (0.66) 2.33 (0.68) 2.17 (0.68) a 2.25 (0.73) z pooled Fire
F 2,6 = 0.640
pooled F 2,6 = 1.963
pooled F 2,6 = 0.507
E 1.67 (0.81) 1.50 (0.79) 1.67 (0.72) 2.75 (0.99) a
1.83 (0.69) z Year F 2,12 = 3.726
L 3.42 (1.10) 2.50 (0.73) 3.75 (1.05) 3.58 (0.99) a 2.42 (0.79) z Fire x Year F 4,12 = 2.927
Scleria mack-aviensis
C 0.75 (0.39) 7.58 (1.06) 2.75 (0.85) 7.42 (0.85) a 9.17 (0.78) z pooled Fire
F 2,6 = 1.397
F 2,6 = 2.685
pooled F 2,6 = 3.733
E 0.92 (0.34) 5.92 (1.10) 3.83 (0.90) 4.92 (0.84) a
5.83 (1.15) z Year F 2,12 = 27.056**
L 0.58 (0.23) 6.33 (1.08) 2.75 (0.64) 7.08 (1.01) a 6.17 (0.98) z Fire x Year F 4,12 = 3.60
69
Chapter 3. The effect of fire regime on floristic patterns.
3.4 Discussion
3.4.1 Fuel load dynamics
Fine-fuel in eucalypt savanna at Cape Cleveland accumulated rapidly after fire,
reaching approximately half the maximum biomass over the first wet season, and
stabilising after two years, at approximately ten tonnes per hectare (Figure 3.3). Fuel
loads of around six tonnes per hectare, recorded one year after fire, are similar, or
slightly higher than those documented in annually burnt savannas in the Northern
Territory (Williams et al. 1999b; Russell-Smith et al. in press). While this study only
sampled fuel to four years post-fire, 10 tonnes per hectare is probably the maximum for
this savanna, as it is the maximum fuel load recorded in eucalypt savannas of the
Northern Territory that have remained unburnt for 21 years (Russell-Smith et al. in
press), and in “long unburnt” savanna on Magnetic Island, off the coast from
Townsville (Sandercoe 1989).
3.4.2 Fire intensity
After two years without fire, burning during the late dry season produced significantly
higher fire intensities than in the early dry season (Figure 3.5). The late dry season fires
were also of greater intensity than the single mid dry season fire implemented after a
three year interval. The fire intensities recorded at Cape Cleveland are within the range
recorded in other Australian tropical savanna studies (Williams et al. 1999b; Russell-
Smith et al. in press). However annual late dry season fires in eucalypt savanna at
Kapalga research station, in the Northern Territory, were greater than those recorded
after a two year interval at Cape Cleveland (Williams et al. 1999b). A late dry season
fire after a seven year interval was considerably more intense again (Williams et al.
1999b).
Given that maximum fine fuel biomass is reached after two years in savanna at Cape
Cleveland, the season of burning will have a greater influence on fire intensity than the
number of years since last fire, once two years has elapsed. This has implications for
hazard reduction maintenance in north-eastern Australia.
70
Chapter 3. The effect of fire regime on floristic patterns.
3.4.3 Multivariate analyses of species composition and abundance
The cluster analyses, of species composition alone and composition plus abundance
data, clustered together many of the annual surveys of the same plots, with clusters
primarily reflecting differences in the 36 plots (Figures 3.6 and 3.7). However, the fact
that there was separation of annual surveys for some plots indicates some floristic
changes occurred during the course of the study, and increased species variation was
detected once species abundance was included in the analysis. Thus the cluster analyses
suggest that much of the pre-existing species variation between plots was not
dramatically altered by the fire treatments, however some floristic changes were
apparent. This indicates fire has an influence on floristic patterns but that a strong
degree of stability in composition is displayed in response to dry season fires over five
years and fire protection for four years.
The fact that the PCA scatter plot did not position together all surveys of any fire
treatments confirms the cluster analyses result that pre-existing plot differences were
not overturned by fire regimes (Figure 3.8). However, the PCA scatter plot documents
distinct floristic patterns which fluctuate both annually and in response to fire regimes
(Figures 3.8 and 3.9). They indicate floristic response to the mid dry season 1997 fire
was consistent across plots, and differed only after the implementation of different fire
season treatments in 1999. It is noteworthy that the scatter plots show that species
composition and abundance did not return to that of the initial 1997 surveys. This may
in part be a response to a general increase in the abundance of exotic and to some
degree native species over the duration of the study, which was consistent across all
treatments (Table 3.7).
The partial RDA demonstrated fire variables were significantly correlated with floristic
variation, although after the removal of background effects of intrinsic plot variation,
annual fluctuations consistent to all treatments, and differences between blocks, fire
variables accounted for only a small percentage of species variance (Tables 3.2 and
3.4). All aspects of the fire regime proved important, with fire interval, intensity and
season each affecting species dynamics (Tables 3.3 and 3.5).
71
Chapter 3. The effect of fire regime on floristic patterns.
The factor with the greatest correlation with floristic variance between the surveys was
the intrinsic differences between the 36 plots (Tables 3.2 and 3.4). That is, pre-existing
plot differences, and subtle changes within each plot that were irrespective of fire,
accounted for species variation between surveys to a greater extent than the fire
treatments. The large interaction between fire, plot and year suggests that considerable
floristic changes did occur after fire that were dependent on existing species
composition within plots, and annual conditions such as rainfall. This may have
resulted from increases in the abundance of existing species in response to fire. The
partial RDA results confirm a strong degree of stability in species composition and
abundance in response to several dry season fires and fire protection for four years, but
also provides evidence that fire was responsible for floristic patterns, particularly by
interacting with or enhancing existing plot variation.
The importance of intrinsic plot variation re-enforces the value of repeat surveys of
permanently marked plots and BACI designs in understanding fire dynamics in tropical
savannas (Lonsdale and Braithwaite 1991). It is apparent that the use of one-off surveys
in this savanna to distinguish short-term fire history effects, such as differences in
season of the most recent fires, would inadvertently mix the effect of recent fire with
pre-existing plot differences. Species variation between plots may be due to a complex
interaction between edaphic, climatic and topographic factors (Fensham 1990) as well
as biotic factors, including short distances of seed dispersal (Whelan 1985) and the
persistence of established plants (Bond and Midgley 2001).
3.4.4 Univariate analyses of species richness and abundance
Late dry season fires increased species richness at the 1 m2 scale in the year following
fire, but as there was no corresponding effect at the 100 m2 scale, this probably reflects
an increase in the density, rather than number of species in the savanna (Whelan 1995).
The documented species richness of 30 to 40 species 100 m-2 is similar to that of
eucalypt savanna in the Northern Territory (Fensham 1990). However, Fensham (1990)
was able to detect significantly lower species richness at the 100 m2 scale in plots
unburnt for ten years, compared with regularly and irregularly burnt savanna.
Assessment of longer fire intervals than examined in this study may detect a similar
decline in species richness in the absence of fire in savannas of north-eastern Australia.
72
Chapter 3. The effect of fire regime on floristic patterns.
A significant response to dry season fires was not detected in several of the growth
form groups and common species, over the five year experiment (Table 3.7). This was
apparent for trees and shrubs, upright perennial forbs, and non-grass monocots, and
reflects the floristic stability documented in the multivariate analyses. However,
burning did enhance several other common species and growth form groups in the year
immediately following fire (Table 3.7). This was apparent for the subshrub Breynia
oblongifolia, combined twining perennial forbs, the common twiners Galactia
tenuiflora and Passiflora foetida, combined ephemeral forbs, Indigofera hirsuta, and
grasses as a group. Late dry season fire typically produced the greatest change in
abundance, although for Galactia tenuiflora, the highest abundance was produced
under early dry season burning. The increase in species abundance in the first year after
fire corresponds with the period of lowest fuel load, suggesting a competitive inhibition
by dense ground cover. While most fire effects were undetectable by the second year
after fire, Passiflora foetida maintained a higher abundance in recently burnt plots and
the dominant grass, Heteropogon triticeus, significantly declined with the absence of
fire for four years.
3.4.5 Study Constraints
As with all research, these results must be considered within the study limitations. This
experiment was restricted to replicate blocks of 1 ha. While this provided a manageable
size for the limited resources available for implementing the study, there may be
problems with these relatively small experimental units. For example, it has been
argued that 1 ha blocks may not provide the full potential fire intensity, nor the
patchiness, produced by a larger landscape fire (Russell-Smith et al. in press). While
the lack of patchiness in burnt and unburnt ground is certain, fire intensity may not
have been significantly reduced, as recent research indicates fire fronts of 120 m or
greater (as present in this trial of 130 m long blocks) reach their maximum potential
rate of spread, and hence potential intensity, almost immediately (Cheney et al. 2001).
Small fire block sizes may also lead to concentrated herbivory in recently burnt ground
(Whelan 1995). While no cattle were within the trial area during the study, native
herbivores, specifically Agile wallabies (Macropus agilis), were present throughout
the five years. However, the intensity of herbivory after the July 1997 fire was probably
73
Chapter 3. The effect of fire regime on floristic patterns.
minimised by the 10 ha extent of the fire. In August 1999, a wildfire burnt the
surrounding savanna, hence greatly increasing the area of recently burnt ground soon
after the first 1999 fires and prior to any seedling emergence in the early burnt blocks
(Chapter 6).
The restriction of the experiment to a single 10 ha section of savanna may limit
extrapolation of results. However, comparisons with other Australian tropical savanna
studies allow some evaluation of the broader applicability of results. Data on
regeneration after fire from additional sites around Townsville are also provided in
Chapters 6 and 8 to examine the consistency of fire response across the Townsville
region.
Only a few combinations of fire frequency, intensity and season were assessed in this
experiment, and differing results may occur with other regimes. However, the
assessment of fire intervals from two to four years, with burning undertaken at differing
times throughout the dry season, is relevant to the current fire regimes experienced in
tropical savannas of north-eastern Australia (Crowley 1995; Queensland Parks and
Wildlife Service unpublished fire history records for Townsville).
The short time span of this study (five years) may also limit the ability to establish fire
effects. However, the fire response of herbaceous species, detected over 21 years in
eucalypt savanna at Munmarlary, Northern Territory, were generally evident within the
initial five years (Russell-Smith et al. in press).
3.5 Conclusion
Fine fuel loads in eucalypt savanna at Cape Cleveland reach an equilibrium of
approximately ten tonnes per hectare in the second year after fire. While data are only
available for four years post-fire, evidence from other sites in tropical eucalypt savanna
suggest fuel loads can remain in equilibrium at ten tonnes per hectare for several
decades in the absence of fire. This indicates that by the second year after fire, fire
season, rather than time since fire, governs fire intensity, with highest intensity during
late dry season burns.
74
Chapter 3. The effect of fire regime on floristic patterns.
It is apparent that the eucalypt savanna of Cape Cleveland has a high degree of floristic
stability in the response to one or two dry season fires over a period of five years and
fire protection for four years. Intrinsic plot differences were of greater importance in
explaining floristic variation than recent fire history. However, floristic patterns were
influenced by fire regime, and the interaction between fire, plot and year increased
existing plot variation. The effects of fire regime were most evident in the herbaceous
layer, particularly in promoting ephemeral and twining perennial forbs and grasses. The
only trends identified in the abundance of woody species was the short-term promotion
of the subshrub Breynia oblongifolia by late dry season fire.
Both the interval between fires and the fire events themselves affected floristic
composition and abundance. An initial flush of abundance of combined twining
perennial forbs, the common twiners Galactia tenuiflora and Passiflora foetida,
combined ephemeral forbs, the common ephemeral Indigofera hirsuta, and grasses as a
group, occurred in the year following fire. With the except of Galactia tenuiflora, the
flush of abundance was especially apparent after late dry season fires. Many
herbaceous species may store carbon reserves, enhance seed production and recruit
seedlings in the immediate post-fire period. The decline in the dominant grass
Heteropogon triticeus with fire intervals of four years reduces competition faced by co-
existing species, although the maintenance of high fuel loads at four years post-fire
indicates the decline in biomass of H. triticeus is replaced by the increase in biomass of
other species.
The failure to detect effects of fire on trees and shrubs may have been due to the use of
frequency rather than density counts (although see Chapter 8). Changes in the overall
abundance of woody species in Australian tropical savannas are less common than
dynamics of size classes, although significant differences in the overall density of non-
eucalypt trees and shrubs, and Eucalyptus tetrodonta and E. porrecta have been
detected between frequently burnt and long unburnt savanna (Bowman and Panton
1995; Russell-Smith et al. in press; Williams et al. in press).
The lack of short-term fire effects detected for rainforest trees and shrubs is consistent
with the results of other studies in Australian tropical savanna (Bowman et al. 1988;
75
Chapter 3. The effect of fire regime on floristic patterns.
Fensham 1990; Bowman 1993; Bowman and Panton 1995; Russell-Smith et al. in
press; Williams et al. in press). The assessment of fire effects on different life events,
such as seedling emergence and survival, and growth rates of juvenile trees, is needed
to shed further light onto the influence of fire regime on this group.
A variety of responses to fire regime have been documented for herbaceous species in
Australian tropical savannas (e.g. Bowman et al. 1988; Fensham 1990; Williams and
Lane 1999). However, the significant effect of fire on both species richness and the
abundance of herbaceous species contrasts with the findings of Williams et al. (in
press) who did not detect clear fire effects on grasses and forbs during a five year
experiment in eucalypt savanna at the Kapalga research station in the Northern
Territory. Neither the abundance of herbs nor species richness responded to fire regime
at Kapalga, but responded instead to fluctuations in wet season rainfall and the cover of
annual Sorghum species. The cause of these differences between Kapalga and Cape
Cleveland may in part lie in the high proportion of dry season dormant forbs and the
dominance of annual grasses at Kapalga, which show strong germination and growth
responses to the intense wet and dry seasons of the Northern Territory (Brennan 1996;
Williams et al. in press).
Frequent fires over two decades have been shown to promote the dominance of a few
annual grasses in eucalypt savanna of the Northern Territory (Russell-Smith et al. in
press). An increased abundance of perennial grasses has also been documented in
recently or frequently burnt tropical savanna (e.g. Shaw 1957; Norman 1963;
Sandercoe 1989; Walker et al. 1989; Orr et al. 1991; Trollope 1996). While much
attention has been given to Heteropogon contortus, less research has examined the
larger H. triticeus. It has been found at greatest abundance in frequently or most
recently burnt plots (Sandercoe 1989; Fensham 1990). However, H. triticeus has also
increased simultaneously in annually burnt and unburnt savanna of the Northern
Territory (Russell-Smith et al. in press), and has been documented at reduced
abundance in recently burnt plots on Cape York Peninsula (Crowley and Garnett 1998).
Differences in response may result from edaphic, climatic and biotic factors, including
competitive interactions, and the examination of life events is crucial to resolving the
reasons of these differences.
76
Chapter 3. The effect of fire regime on floristic patterns.
77
Forbs have been found to respond variously to fire regime (Bowman et al. 1988;
Fensham 1990). Some forbs, such as the leguminous Crotalaria spp. are more abundant
in frequently burnt savanna, while the ephemeral Polygala orbicularis has shown
contrasting responses to fire frequency (Bowman et al. 1988; Fensham 1990). Fire-
enhanced short-term pulses of forb abundance have also been documented in sandstone
heathy communities of the Northern Territory and north-western Queensland (Russell-
Smith et al. 2002; Williams et al. 2002b).
Fire regime therefore was found to influence floristic patterns by affecting the
abundance of herbaceous species. However, details of the fire-related mechanisms that
determine floristic patterns are required to better understand the effects of fire regimes.
The remainder of this thesis systematically examines the effect of fire on critical life
events on a range of coexisting savanna species, to provide an insight into the processes
that allow fire to influence floristic patterns.
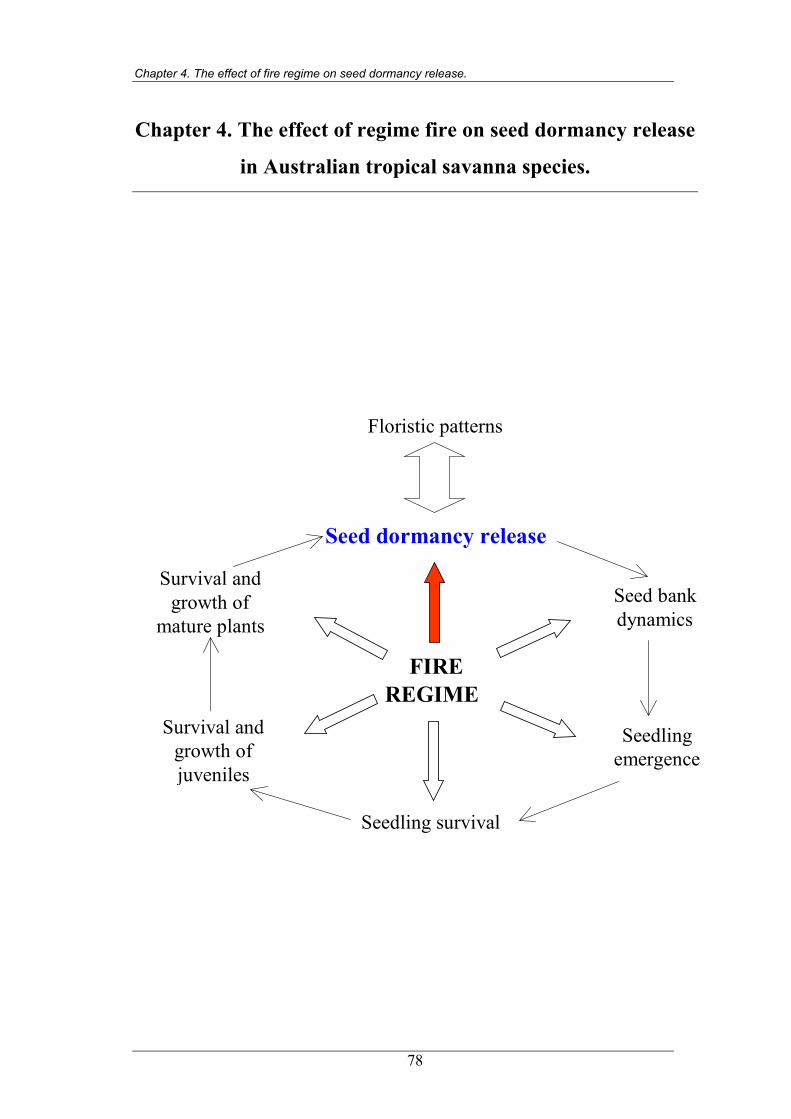
Chapter 4. The effect of fire regime on seed dormancy release.
Chapter 4. The effect of regime fire on seed dormancy release
in Australian tropical savanna species.
FIREREGIME
Seed dormancy release
Floristic patterns
Seed bankdynamics
Seedlingemergence
Survival andgrowth ofjuveniles
Survival andgrowth of
mature plants
Seedling survival
78
Chapter 4. The effect of fire regime on seed dormancy release.
4.1 Introduction
Seed dormancy is a critical mechanism that can increase the chances of seedling
establishment by delaying germination until the presence of appropriate climatic and
micro-site conditions, and spreading the germination of a seed bank across several
rainfall events (Harper 1977; Bell 1999). Some Australian tropical savanna species
possess no apparent innate dormancy, being capable of germination immediately after
seed fall. Examples of these include Eucalyptus miniata and Alloteropsis semialata
(Setterfield 1997; Crowley and Garnett 2001). The seeds of many grasses possess an
after-ripening requirement in the seed embryo that lapses during the dry season, linking
germination with the onset of the wet season (Bell 1999). This has been detected in
both annual and perennial grasses, including Chrysopogon fallax, Heteropogon
contortus, Sorghum spp. and Themeda triandra (Mott 1978; Andrew and Mott 1983;
Mott and Andrew 1985; McIvor and Howden 2000).
There has been limited research into fire-related dormancy mechanisms in Australian
tropical savanna species. Fire-related chemicals that have been found to break seed
dormancy include nitrates, the availability of which can increase in the soil with the
first rain following fire (Thanos and Rundel 1995; Bell et al. 1999), as well as
compounds present in smoke (Dixon et al. 1995; Keith 1997) and charcoal (Bell et al.
1987). Smoke has been demonstrated to break seed dormancy of the tropical savanna
grasses Heteropogon contortus and Themeda triandra, and the fire sensitive tree
Callitris intratropica (Baxter et al. 1994; Campbell et al. 1996; Roche et al. 1997).
The brief exposure of seeds to elevated temperatures is known as “heat shock” (Bell et
al. 1993). Heat shock typically breaks a physical barrier in the seed coat that inhibits
moisture uptake by the seed (Bell 1999). This can result from either the cracking of the
cuticular layer or opening of a strophiolar plug in the seed coat (Figure 4.1; Bell et al.
1993). Heat shock may also influence physiological processes within the embryo (Bell
and Williams 1998). High soil surface temperatures experienced in the late dry season
(30ºC to 60ºC) can increase seed germination of some tropical savanna grasses (Mott
1978). Exposure to elevated temperatures between 40ºC to 120ºC break innate seed
79
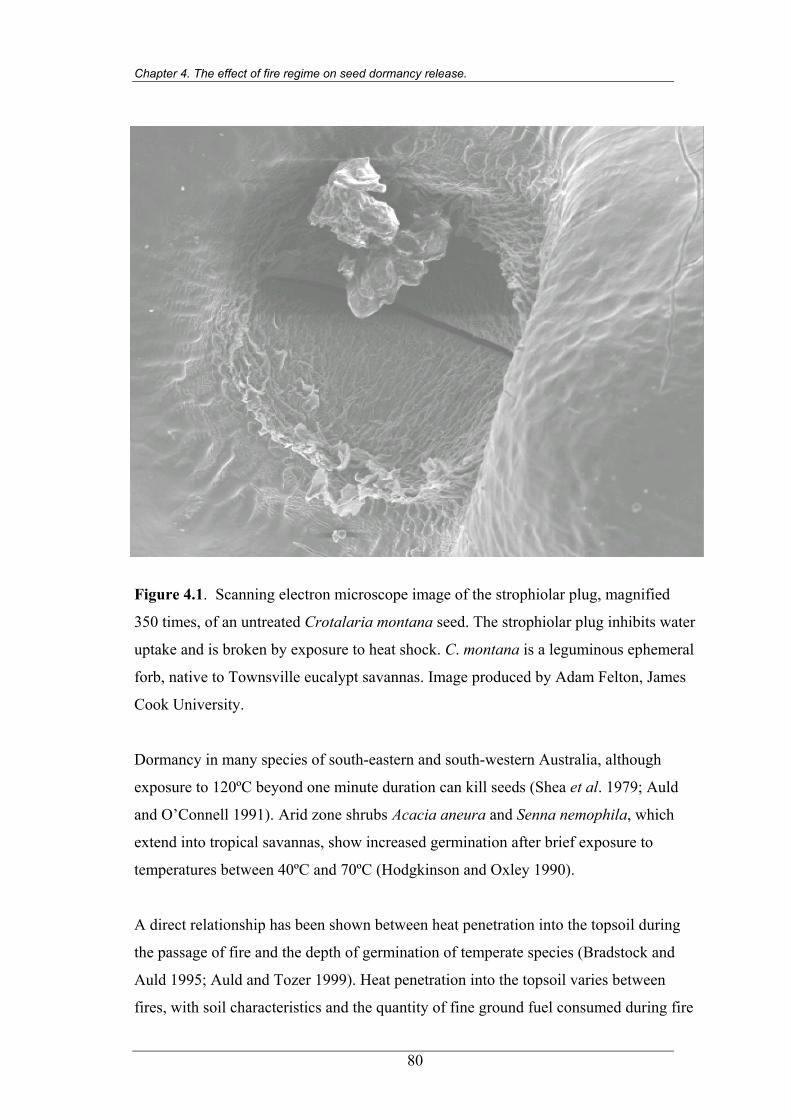
Chapter 4. The effect of fire regime on seed dormancy release.
Figure 4.1. Scanning electron microscope image of the strophiolar plug, magnified
350 times, of an untreated Crotalaria montana seed. The strophiolar plug inhibits water
uptake and is broken by exposure to heat shock. C. montana is a leguminous ephemeral
forb, native to Townsville eucalypt savannas. Image produced by Adam Felton, James
Cook University.
Dormancy in many species of south-eastern and south-western Australia, although
exposure to 120ºC beyond one minute duration can kill seeds (Shea et al. 1979; Auld
and O’Connell 1991). Arid zone shrubs Acacia aneura and Senna nemophila, which
extend into tropical savannas, show increased germination after brief exposure to
temperatures between 40ºC and 70ºC (Hodgkinson and Oxley 1990).
A direct relationship has been shown between heat penetration into the topsoil during
the passage of fire and the depth of germination of temperate species (Bradstock and
Auld 1995; Auld and Tozer 1999). Heat penetration into the topsoil varies between
fires, with soil characteristics and the quantity of fine ground fuel consumed during fire
80
Chapter 4. The effect of fire regime on seed dormancy release.
(Bradstock and Auld 1995; Whelan 1995). During fires that consume sufficient fine
fuel, seeds in the top few centimetres of soil can be exposed to temperatures that break
seed dormancy in legumes of southern Australia (Floyd 1976; Bradstock and Auld
1995; Smith et al. 2000).
This chapter examines the role of fire in breaking innate seed dormancy in species of
Townsville eucalypt savannas. To date, research into the effects of fire on seed
germination in Australian tropical savannas has focused primarily of dominant grasses
(e.g. Andrew and Mott 1983; Mott and Andrew 1985; Campbell et al. 1996; McIvor
and Howden 2000). Ten legume species were selected for investigation in this study,
because legumes as group account for 20% of the species diversity at Cape Cleveland,
representing both twining perennial forbs and ephemeral forbs, and several of the test
species increased in abundance after fire, which suggests fire-driven release from seed
dormancy (Chapter 3). Questions to be addressed in this chapter include:
1. Is the percentage germination of legumes in Australian tropical savannas increased
by exposure to heat shock?
2. Is the percentage germination of legumes increased by exposure to chemicals
related to the passage of fire, specifically nitrate and compounds found in smoke?
3. Is the percentage germination of legumes enhanced by exposure to heat shock and
chemicals?
4. If heat shock does increase germination, do those temperatures occur in the topsoil
during the passage of early and late dry season fires?
5. Does the depth of seed germination, of species with seed dormancy released by heat
shock, increase with greater heat penetration into the topsoil?
4.2 Methods
4.2.1 General methods
4.2.1a Laboratory experiment
The ten species examined in the laboratory experiment are listed in Table 4.1. Seeds
were collected between March and June 1999, from a wide variety of plants along the
roadside fire break block and adjacent areas at Cape Cleveland (Figure 2.4). Seeds were
not collected from within the nine, 1 ha blocks, so that seed bank and seedling
81
Chapter 4. The effect of fire regime on seed dormancy release.
emergence processes remained unaffected. Seeds were stored in paper bags in the dark
at room temperature, for several months prior to the germination experiment.
An initial pilot study was used to assess an appropriate incubation temperature for the
laboratory experiment. Three species were examined in this pilot trial: Chamaecrista
mimosoides, Crotalaria lanceolata and C. pallida. Three replicates of 30 seeds were
exposed to 80ºC for five minutes before placement onto filter paper in petri dishes and
storage in germination cabinets in total darkness. This temperature and exposure time
were used because they have been shown to enhance germination of a range Australian
legumes (e.g. Shea et al. 1979; Auld and O’Connell 1991). Constant incubation
temperatures assessed were 17.5ºC, 25ºC, 30ºC and 40ºC. The germination cabinet set
at 40ºC was found to be defective and therefore germination from this treatment is not
reported. Despite the use of fungicide, fungal attack of seeds occurred and may have
reduced the percentage of seed germination.
No significant differences could be detected between percentage germination across the
three incubation temperatures, using a one-factor ANOVA, for Chamaecrista
mimosoides (F 2,6 = 0.341, P > 0.05); Crotalaria lanceolata (F 2,6 = 1.113, P > 0.05) or
Crotalaria pallida (F 2,6 = 3.23, P > 0.05). The overall percentage germination of two
of the species was low and the mean percentage germination of Chamaecrista
mimosoides and Crotalaria pallida was highest at 25ºC, while 30ºC produced the
highest percentage germination of C. lanceolata (Figure 4.2). This suggested an
incubation temperature between 25ºC and 30ºC would be suitable for use in the
laboratory experiment and is consistent with the results of Andrew and Mott’s (1983)
study that demonstrated incubation temperatures between 25ºC and 35ºC were most
appropriate for germination of Northern Territory grasses.
The laboratory experiment was undertaken on ten herbaceous legume species between
September and December 1999. Three replicates of 30 seeds were used for each
treatment, and seed weights were determined for each species by weighing three
replicates of thirty seeds. Up to 11 different treatments were used to examine seed
dormancy (Table 4.1). A subset of treatments were implemented for several species
where seed availability was limited. The five minute duration for most oven treatments
82
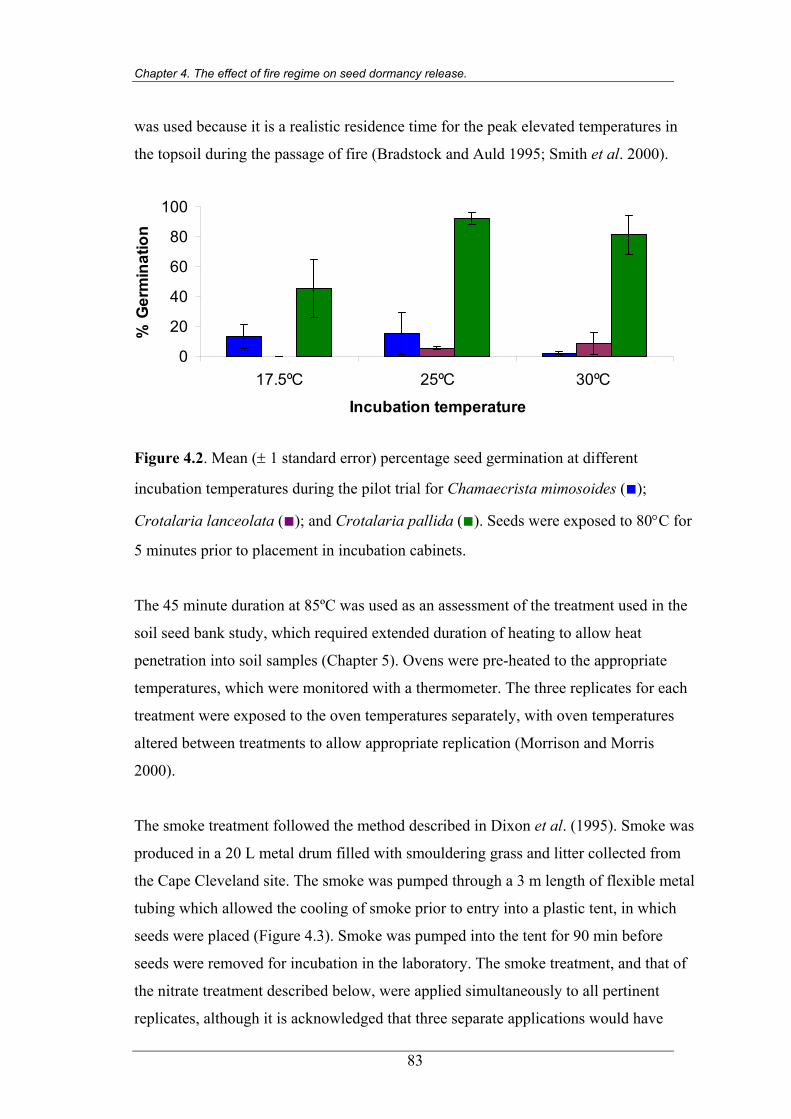
Chapter 4. The effect of fire regime on seed dormancy release.
was used because it is a realistic residence time for the peak elevated temperatures in
the topsoil during the passage of fire (Bradstock and Auld 1995; Smith et al. 2000).
0
20
40
60
80
100
17.5ºC 25ºC 30ºC
Incubation temperature
% G
erm
inat
ion
Figure 4.2. Mean (± 1 standard error) percentage seed germination at different
incubation temperatures during the pilot trial for Chamaecrista mimosoides (■);
Crotalaria lanceolata (■); and Crotalaria pallida (■). Seeds were exposed to 80°C for
5 minutes prior to placement in incubation cabinets.
The 45 minute duration at 85ºC was used as an assessment of the treatment used in the
soil seed bank study, which required extended duration of heating to allow heat
penetration into soil samples (Chapter 5). Ovens were pre-heated to the appropriate
temperatures, which were monitored with a thermometer. The three replicates for each
treatment were exposed to the oven temperatures separately, with oven temperatures
altered between treatments to allow appropriate replication (Morrison and Morris
2000).
The smoke treatment followed the method described in Dixon et al. (1995). Smoke was
produced in a 20 L metal drum filled with smouldering grass and litter collected from
the Cape Cleveland site. The smoke was pumped through a 3 m length of flexible metal
tubing which allowed the cooling of smoke prior to entry into a plastic tent, in which
seeds were placed (Figure 4.3). Smoke was pumped into the tent for 90 min before
seeds were removed for incubation in the laboratory. The smoke treatment, and that of
the nitrate treatment described below, were applied simultaneously to all pertinent
replicates, although it is acknowledged that three separate applications would have
83
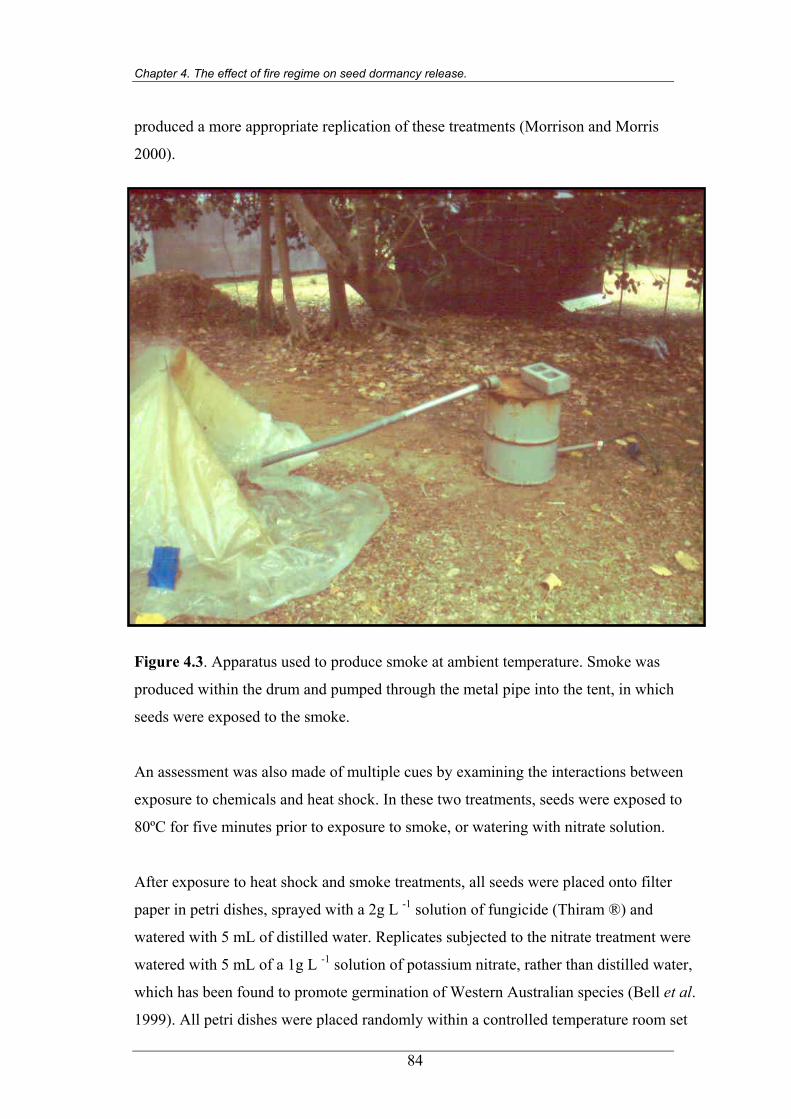
Chapter 4. The effect of fire regime on seed dormancy release.
produced a more appropriate replication of these treatments (Morrison and Morris
2000).
Figure 4.3. Apparatus used to produce smoke at ambient temperature. Smoke was
produced within the drum and pumped through the metal pipe into the tent, in which
seeds were exposed to the smoke.
An assessment was also made of multiple cues by examining the interactions between
exposure to chemicals and heat shock. In these two treatments, seeds were exposed to
80ºC for five minutes prior to exposure to smoke, or watering with nitrate solution.
After exposure to heat shock and smoke treatments, all seeds were placed onto filter
paper in petri dishes, sprayed with a 2g L -1 solution of fungicide (Thiram ®) and
watered with 5 mL of distilled water. Replicates subjected to the nitrate treatment were
watered with 5 mL of a 1g L -1 solution of potassium nitrate, rather than distilled water,
which has been found to promote germination of Western Australian species (Bell et al.
1999). All petri dishes were placed randomly within a controlled temperature room set
84
Chapter 4. The effect of fire regime on seed dormancy release.
at 27.5ºC with a 12 h diurnal light regime. The diurnal light regime was used because
the low germination of Chamaecrista mimisoides and Crotalaria lanceolata in the pilot
trial may have been partially due to incubation in total darkness. A 12 h diurnal light
regime has been shown to significantly enhance germination of many eucalypt
woodland species in south-eastern Australia (Clarke et al. 2000). Germination was
defined by radicle emergence, and germinants were removed. Petri dishes were sprayed
with distilled water as required, and periodically with fungicide.
Germination was assessed daily for 12 weeks. At the end of this period, all
ungerminated seeds in the control treatment were assessed for viability using a
tetrazolium test (Moore 1985). A slit was made in seeds which were subsequently
soaked in a 1% tetrazolium solution in the dark for 48 h. Seeds were then dissected
under a microscope and assessed for the pink colouration that indicates a viable
embryo. The number of viable seeds detected in the tetrazolium test were added to the
number of germinants to give a total number of viable seeds for each replicate of the
control treatment and the means were used as the percentage viability for each species.
A tetrazolium test was also performed on Crotalaria pallida seeds exposed to 120ºC, to
assess whether the absence of germination after exposure to this temperature was due to
seed mortality.
4.2.1b Temperature elevation in the topsoil during the passage of fire
Temperature elevation in the topsoil during the passage of early and late dry season
fires was documented as a comparison with the temperatures found to break seed
dormancy in the laboratory experiment. Topsoil temperatures were measured at ten
locations in each of the three replicate 1 ha blocks burnt during the early and late dry
season fires of 1999 (Chapter 2). To allow ease of re-location, each point was randomly
located adjacent to one of the four corners of the four 100 m2 plots described in Chapter
3. To assess the micro-site variation in temperatures between grass tussocks and gaps,
five of the ten points were located at the base of a grass tussock. The remaining five per
block were located in a gap with at least 30 cm to the nearest grass tussock.
85
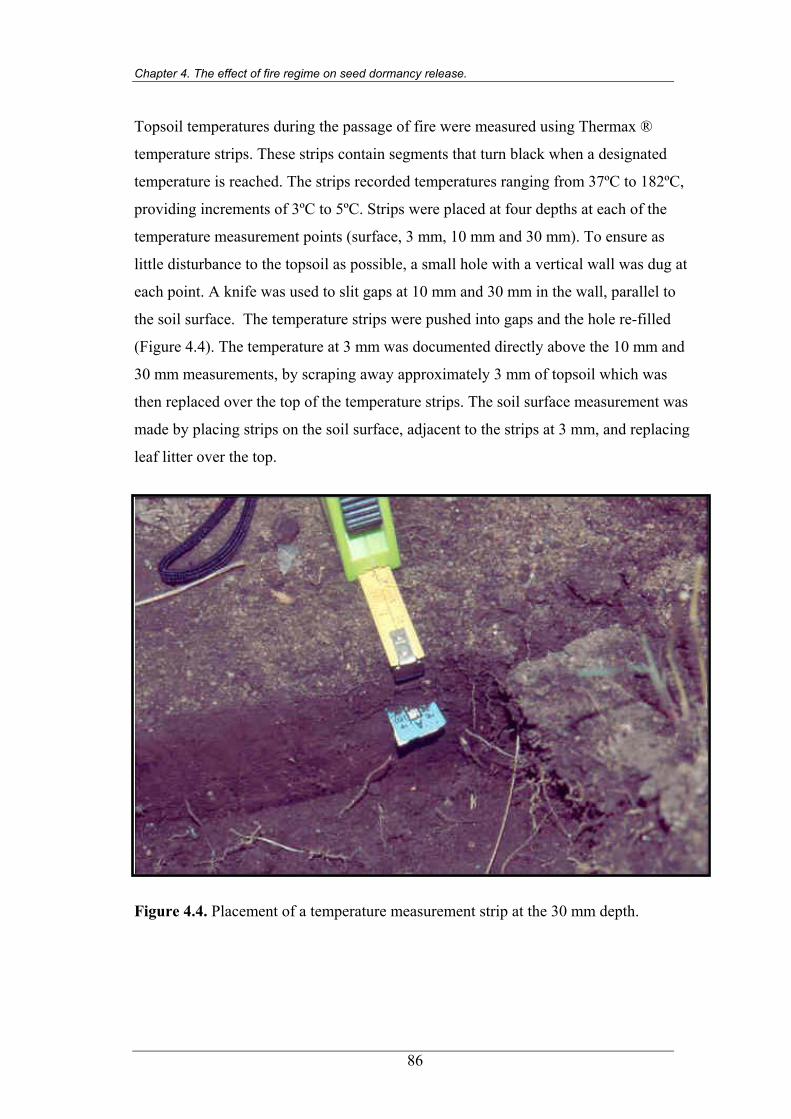
Chapter 4. The effect of fire regime on seed dormancy release.
Topsoil temperatures during the passage of fire were measured using Thermax ®
temperature strips. These strips contain segments that turn black when a designated
temperature is reached. The strips recorded temperatures ranging from 37ºC to 182ºC,
providing increments of 3ºC to 5ºC. Strips were placed at four depths at each of the
temperature measurement points (surface, 3 mm, 10 mm and 30 mm). To ensure as
little disturbance to the topsoil as possible, a small hole with a vertical wall was dug at
each point. A knife was used to slit gaps at 10 mm and 30 mm in the wall, parallel to
the soil surface. The temperature strips were pushed into gaps and the hole re-filled
(Figure 4.4). The temperature at 3 mm was documented directly above the 10 mm and
30 mm measurements, by scraping away approximately 3 mm of topsoil which was
then replaced over the top of the temperature strips. The soil surface measurement was
made by placing strips on the soil surface, adjacent to the strips at 3 mm, and replacing
leaf litter over the top.
Figure 4.4. Placement of a temperature measurement strip at the 30 mm depth.
86
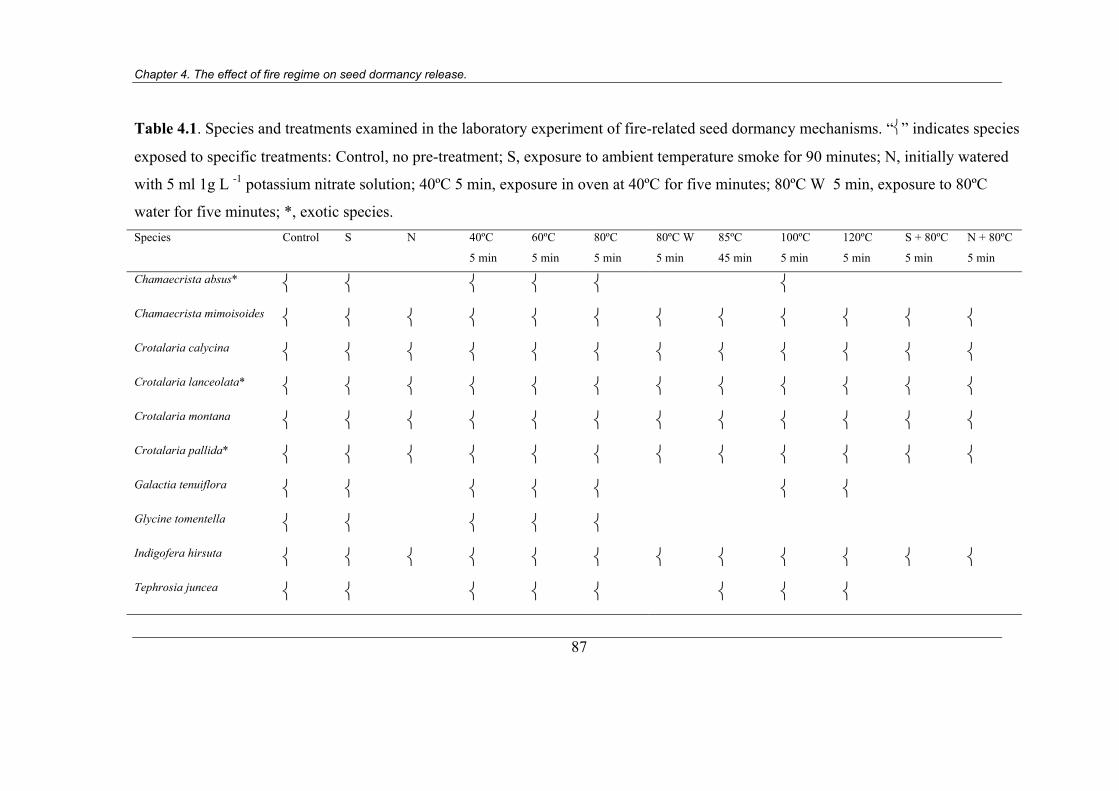
Chapter 4. The effect of fire regime on seed dormancy release.
Table 4.1. Species and treatments examined in the laboratory experiment of fire-related seed dormancy mechanisms. “” indicates species
exposed to specific treatments: Control, no pre-treatment; S, exposure to ambient temperature smoke for 90 minutes; N, initially watered
with 5 ml 1g L -1 potassium nitrate solution; 40ºC 5 min, exposure in oven at 40ºC for five minutes; 80ºC W 5 min, exposure to 80ºC
water for five minutes; *, exotic species. Species Control S N 40ºC
5 min
60ºC
5 min
80ºC
5 min
80ºC W
5 min
85ºC
45 min
100ºC
5 min
120ºC
5 min
S + 80ºC
5 min
N + 80ºC
5 min
Chamaecrista absus* Chamaecrista mimoisoides Crotalaria calycina Crotalaria lanceolata* Crotalaria montana Crotalaria pallida* Galactia tenuiflora
Glycine tomentella Indigofera hirsuta Tephrosia juncea
87
Chapter 4. The effect of fire regime on seed dormancy release.
4.2.1c Depth of seed germination
The depth of seed germination was assessed in relation to the temperatures recorded
during the passage of fires, for two of the species examined in the laboratory
experiment. Galactia tenuiflora and Indigofera hirsuta were examined because they
produced sufficient germination in the vicinity of temperature measurement points. The
depth of germination was measured by digging around recently germinated seedlings,
in early December 1999. The depth of germination was measured to the junction
between radicle and hypocotyl (Bradstock and Auld 1995). The two locations with the
highest, and two with the lowest, temperatures in each of the early and late dry season
fires (i.e. a total of four points in each) were assessed to cover the range of
temperatures experienced during the fires. All seedlings within a 1 m radius of these
points were assessed. There was almost no germination of these species in the unburnt
control blocks, precluding the assessment of seed germination depth in undisturbed
savanna. Therefore seedlings over a 30 m stretch of the 4 m wide unburnt but slashed
fire line between blocks C1 and C2 (Figure 2.4) were measured as a comparison to
germination depth in the early and late burnt blocks, although it is acknowledged that
the removal of the grass layer is likely to have elevated the temperatures of the topsoil
to some degree (Auld and Bradstock 1996).
4.2.2 Statistical analyses
4.2.2a Laboratory experiment
The number of germinants for each treatment was converted to percentage germination
of viable seeds. This was calculated for each replicate by dividing the number of
germinants by the mean number of viable seeds and multiplying by 100. A one-factor
ANOVA was used to assess the effects of differences among all treatments, excluding
those combining exposure to smoke (or nitrate) plus 80ºC. The latter were analysed
with the control, and separate smoke (or nitrate) and 80ºC treatments, in a two-factor
ANOVA, which assessed the factors smoke (or nitrate) and exposure to 80ºC. Scheffe’s
post-hoc test was used to determine significant differences between treatments of the
one-factor ANOVA (Underwood 1997). Cochran’s test was used to assess homogeneity
of variance. Glycine tomentella germination data required arcsine transformation.
Variance heterogeneity for the two-factor ANOVA for Crotalaria montana could not
be resolved by transformations. Therefore separate non-parametric Kruskal-Wallis
88
Chapter 4. The effect of fire regime on seed dormancy release.
ANOVA by ranks were performed for the individual factors nitrate and 80º C (Zar
1999).
The proportion of non-dormant seed, approximated by the percentage germination of
seeds in control treatments, of the three exotic species (identified in Table 4.1) was
contrasted with that of the seven native species. A Mann-Whitney U-test was used to
test the significance of this comparison, as the homogeneity of variance assumptions of
a t-test (Zar 1999) were not met, even after data transformations.
4.2.2b Temperature elevation in the topsoil during the passage of fire
Temperature elevation in the topsoil was compared between early and late dry season
fires. A multivariate analysis of variance (MANOVA) was initially attempted, however
the assumption of homogeneity of variances could not be met, even after data
transformations. Therefore, the comparison in temperatures between early and late dry
season fires were assessed using separate non-parametric Mann-Whitney U-tests at
each of the four soil depths (surface, 3 mm, 10 mm and 30 mm). The Bonferroni
method of adjustment of alpha was made to compensate for the multiple comparisons
by the U-tests (Sokal and Rohlf 1995). Mann-Whitney U-tests, with a Bonferroni
adjustment for multiple comparisons, were also used to compare the elevated
temperatures recorded at the base of grass tussocks with that in gaps, separately for the
early and late burnt sites.
A non-parametric Spearman rank correlation was used to determine the relationship
between temperature and soil depth, for both early and late dry season fires. Where
elevated temperatures were not detected (e.g. at 30 mm depths), the ambient
temperature recorded on the day of each fire (Chapter 2) was used in the analysis.
4.2.2c Depth of seed germination
The relationship between the depth of seed germination of Galactia tenuiflora and
Indigofera hirsuta and temperatures recorded in the topsoil was examined using a
Spearman rank correlation. Ambient temperatures were used where elevated
temperatures were not detected, including along the slashed fire break, although it is
acknowledged that this may underestimate the temperature at the soil surface, which
89
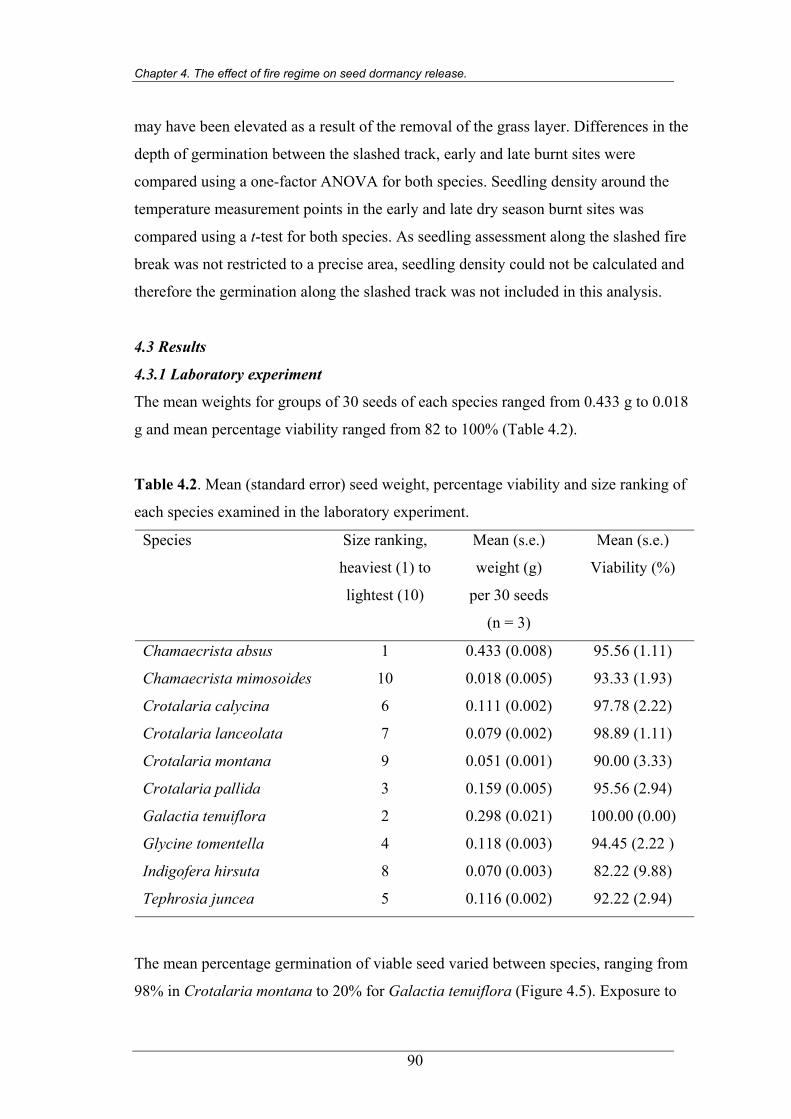
Chapter 4. The effect of fire regime on seed dormancy release.
may have been elevated as a result of the removal of the grass layer. Differences in the
depth of germination between the slashed track, early and late burnt sites were
compared using a one-factor ANOVA for both species. Seedling density around the
temperature measurement points in the early and late dry season burnt sites was
compared using a t-test for both species. As seedling assessment along the slashed fire
break was not restricted to a precise area, seedling density could not be calculated and
therefore the germination along the slashed track was not included in this analysis.
4.3 Results
4.3.1 Laboratory experiment
The mean weights for groups of 30 seeds of each species ranged from 0.433 g to 0.018
g and mean percentage viability ranged from 82 to 100% (Table 4.2).
Table 4.2. Mean (standard error) seed weight, percentage viability and size ranking of
each species examined in the laboratory experiment.
Species
Size ranking,
heaviest (1) to
lightest (10)
Mean (s.e.)
weight (g)
per 30 seeds
(n = 3)
Mean (s.e.)
Viability (%)
Chamaecrista absus 1 0.433 (0.008) 95.56 (1.11)
Chamaecrista mimosoides 10 0.018 (0.005) 93.33 (1.93)
Crotalaria calycina 6 0.111 (0.002) 97.78 (2.22)
Crotalaria lanceolata 7 0.079 (0.002) 98.89 (1.11)
Crotalaria montana 9 0.051 (0.001) 90.00 (3.33)
Crotalaria pallida 3 0.159 (0.005) 95.56 (2.94)
Galactia tenuiflora 2 0.298 (0.021) 100.00 (0.00)
Glycine tomentella 4 0.118 (0.003) 94.45 (2.22 )
Indigofera hirsuta 8 0.070 (0.003) 82.22 (9.88)
Tephrosia juncea 5 0.116 (0.002) 92.22 (2.94)
The mean percentage germination of viable seed varied between species, ranging from
98% in Crotalaria montana to 20% for Galactia tenuiflora (Figure 4.5). Exposure to
90
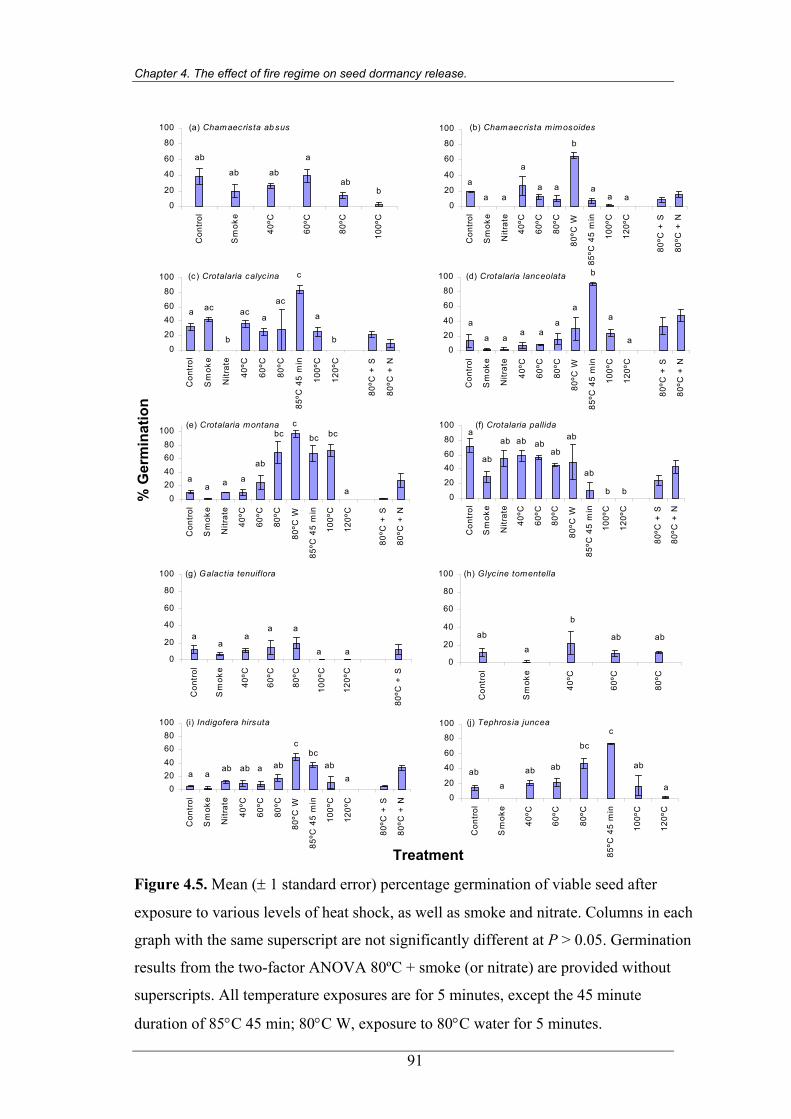
Chapter 4. The effect of fire regime on seed dormancy release.
(a) Chamaecrista ab sus
0
20
40
60
80
100
Con
trol
Sm
oke
40ºC
60ºC
80ºC
100º
C
ab
ab ab
a
ab b
(c) Crotalaria calycina
0
20
4060
80
100
Con
trol
Sm
oke
Nitr
ate
40ºC
60ºC
80ºC
85ºC
45
min
100º
C
120º
C
80ºC
+ S
80ºC
+ N
a
b
a
ac
a
b
ac ac
c
(e) Crotalaria montana
020406080
100
Con
trol
Sm
oke
Nitr
ate
40ºC
60ºC
80ºC
80ºC
W
85ºC
45
min
100º
C
120º
C
80ºC
+ S
80ºC
+ N
aa a a
ab
bc bc bc
a
c (f) Crotalaria pallida
0
20
4060
80
100
Con
trol
Sm
oke
Nitr
ate
40ºC
60ºC
80ºC
80ºC
W
85ºC
45
min
100º
C
120º
C
80ºC
+ S
80ºC
+ N
a
ab
ab ababab
ab
ab
b b
(h) Glycine tomentella
0
20
40
60
80
100
Con
trol
Sm
oke
40ºC
60ºC
80ºC
ab
a
b
ab ab
(i) Indigofera hirsuta
020406080
100
Con
trol
Sm
oke
Nitr
ate
40ºC
60ºC
80ºC
80ºC
W
85ºC
45
min
100º
C
120º
C
80ºC
+ S
80ºC
+ N
a aab ab a ab
c bc
aba
(b) Chamaecrista mimosoides
0
20
40
60
80
100
Con
trol
Sm
oke
Nitr
ate
40ºC
60ºC
80ºC
80ºC
W
85ºC
45
min
100º
C
120º
C
80ºC
+ S
80ºC
+ N
b
a a aa
a
a
a aa
(d) Crotalaria lanceolata
0
20
40
60
80
100
Con
trol
Sm
oke
Nitr
ate
40ºC
60ºC
80ºC
80ºC
W
85ºC
45
min
100º
C
120º
C
80ºC
+ S
80ºC
+ N
a
a a a a
a
a
a
b
a
(g) Galactia tenuiflora
0
20
40
60
80
100
Con
trol
Sm
oke
40ºC
60ºC
80ºC
100º
C
120º
C
80ºC
+ S
a a
aa a
a a
(j) Tephrosia juncea
0
20
40
60
80
100
Con
trol
Sm
oke
40ºC
60ºC
80ºC
85ºC
45
min
100º
C
120º
C
aab ab ab
bc
c
ab
a
% G
erm
inat
ion
Treatment
Figure 4.5. Mean (± 1 standard error) percentage germination of viable seed after
exposure to various levels of heat shock, as well as smoke and nitrate. Columns in each
graph with the same superscript are not significantly different at P > 0.05. Germination
results from the two-factor ANOVA 80ºC + smoke (or nitrate) are provided without
superscripts. All temperature exposures are for 5 minutes, except the 45 minute
duration of 85°C 45 min; 80°C W, exposure to 80°C water for 5 minutes.
91
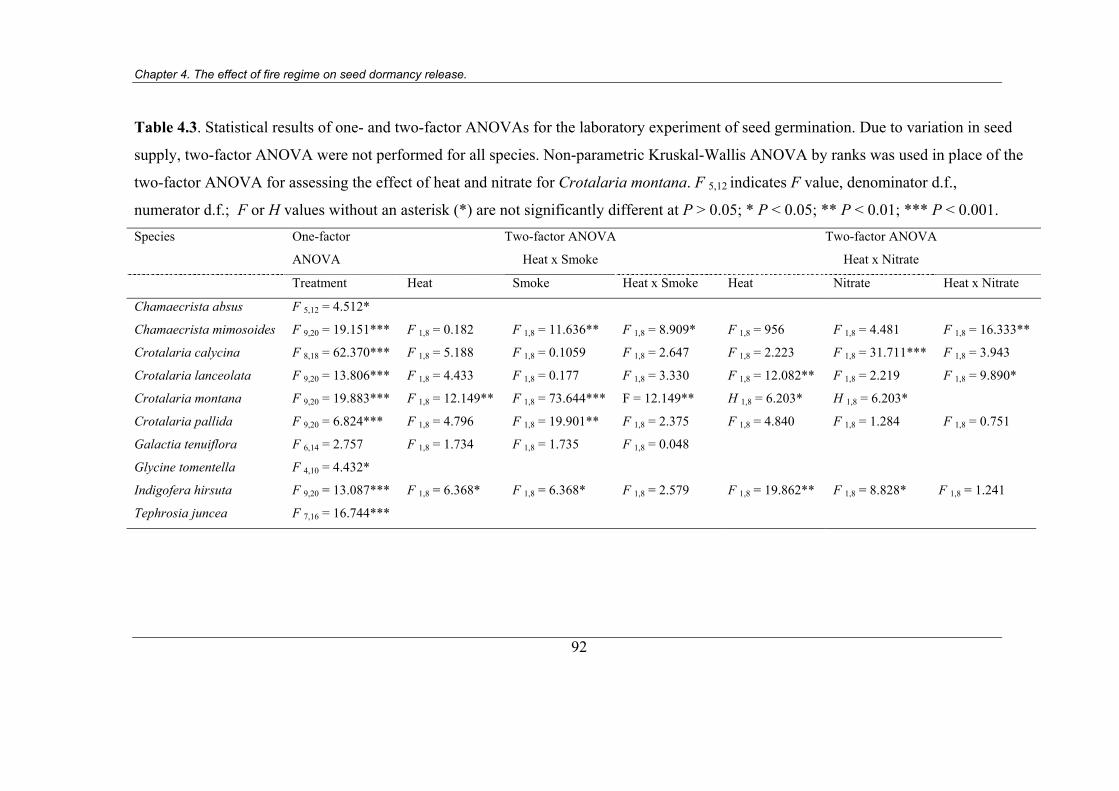
Chapter 4. The effect of fire regime on seed dormancy release.
Table 4.3. Statistical results of one- and two-factor ANOVAs for the laboratory experiment of seed germination. Due to variation in seed
supply, two-factor ANOVA were not performed for all species. Non-parametric Kruskal-Wallis ANOVA by ranks was used in place of the
two-factor ANOVA for assessing the effect of heat and nitrate for Crotalaria montana. F 5,12 indicates F value, denominator d.f.,
numerator d.f.; F or H values without an asterisk (*) are not significantly different at P > 0.05; * P < 0.05; ** P < 0.01; *** P < 0.001. Species One-factor
ANOVA
Two-factor ANOVA
Heat x Smoke
Two-factor ANOVA
Heat x Nitrate
Treatment Heat Smoke Heat x Smoke Heat Nitrate Heat x Nitrate
Chamaecrista absus F 5,12 = 4.512*
Chamaecrista mimosoides F 9,20 = 19.151*** F 1,8 = 0.182 F 1,8 = 11.636** F 1,8 = 8.909* F 1,8 = 956 F 1,8 = 4.481 F 1,8 = 16.333**
Crotalaria calycina F 8,18 = 62.370*** F 1,8 = 5.188 F 1,8 = 0.1059 F 1,8 = 2.647 F 1,8 = 2.223 F 1,8 = 31.711*** F 1,8 = 3.943
Crotalaria lanceolata F 9,20 = 13.806*** F 1,8 = 4.433 F 1,8 = 0.177 F 1,8 = 3.330 F 1,8 = 12.082** F 1,8 = 2.219 F 1,8 = 9.890*
Crotalaria montana F 9,20 = 19.883*** F 1,8 = 12.149** F 1,8 = 73.644*** F = 12.149** H 1,8 = 6.203* H 1,8 = 6.203*
Crotalaria pallida F 9,20 = 6.824*** F 1,8 = 4.796 F 1,8 = 19.901** F 1,8 = 2.375 F 1,8 = 4.840 F 1,8 = 1.284 F 1,8 = 0.751
Galactia tenuiflora F 6,14 = 2.757 F 1,8 = 1.734 F 1,8 = 1.735 F 1,8 = 0.048
Glycine tomentella F 4,10 = 4.432*
Indigofera hirsuta F 9,20 = 13.087*** F 1,8 = 6.368* F 1,8 = 6.368* F 1,8 = 2.579 F 1,8 = 19.862** F 1,8 = 8.828* F 1,8 = 1.241
Tephrosia juncea F 7,16 = 16.744***
92
Chapter 4. The effect of fire on seed dormancy release
elevated temperatures between 80ºC and 100ºC significantly increased the germination
of six of the ten species (Figure 4.5; Table 4.3). The treatments which produced the
most germination were exposure to 80ºC water for five minutes and 85ºC dry heat for
45 minutes. The four species with no enhancement of germination by heat shock were
the four largest seeded species (Tables 4.2 and 4.3).
The percentage germination of viable seeds in the control treatments, (i.e. non-dormant
seeds), averaged 23% across the ten species and ranged from 72% in Crotalaria pallida
to 5% in Indigofera hirsuta. The three exotic species, as a group, had a significantly
higher percentage of non-dormant seeds (mean = 41, s.e. = 10; U = 43.00; P < 0.02)
compared to the seven native species (mean = 15, s.e. = 2).
Seeds of seven out of the eight species exposed to 120ºC did not germinate (Figure
4.5). The only species to germinate after exposure to 120ºC was Tephrosia juncea,
with just 1% germination. A tetrazolium test of the Crotalaria pallida seeds exposed to
120ºC found none were viable, indicating exposure to 120ºC for 5 minutes was lethal.
Exposure to smoke or nitrate in isolation did not significantly enhance germination. In
fact several species showed no germination after these treatments and significant
inhibition by smoke was demonstrated for Chamaechrista mimosoides, Crotalaria
montana, C. pallida and Indigofera hirsuta (Figure 4.5). Exposure to nitrate
significantly inhibited the germination of Crotalaria calycina. However, significant
enhancement of germination resulted from the combination of nitrate and exposure to
80ºC for Crotalaria lanceolata and Indigofera hirsuta (Figure 4.5).
The results for individual species are summarised as follows: Chamaecrista absus
displayed significantly greater germination in the control and after exposure for five
minutes at 60ºC than exposure to 100ºC (Figure 4.5a; Table 4.3).
Chamaecrista mimosoides showed significantly higher germination after exposure to
water at 80ºC for five minutes than in all other treatments (Figure 4.5b; Table 4.3). The
two-factor ANOVA indicated significant inhibition of germination with smoke
93
Chapter 4. The effect of fire regime on seed dormancy release.
exposure, but significant interactions between smoke and heat shock and between
nitrate and heat shock.
Exposure of Crotalaria calycina seed to 85ºC for 45 minutes significantly enhanced
germination over all other treatments except smoke, 40ºC and 80ºC (Figure 4.5c; Table
4.3). Exposure to the nitrate solution and 120ºC produced significantly lower
germination than all other treatments. There were no significant interactions between
heat shock and smoke.
Crotalaria lanceolata showed enhanced germination after exposure to 85ºC for 45
minutes, which was significantly greater than under all other treatments (Figure 4.5d;
Table 4.3). There was a significant interaction between nitrate and heat shock, with
exposure to both treatments resulting in greater germination than the additive effect of
each in isolation. The combination of smoke and heat shock also produced germination
greater than each in isolation, however large variation between replicates inhibited the
detection of a significant interaction.
Percentage germination of Crotalaria montana was significantly enhanced by exposure
to 80ºC and 100ºC for five minutes, 80ºC water for five minutes, and 85ºC for 45
minutes compared to the control treatment and exposure to smoke, nitrate solution,
40ºC and 120ºC for five minutes (Figure 4.5e; Table 4.3). Exposure to 80ºC water also
enhanced germination over 60ºC for five minutes. In the two-factor ANOVA indicated
that exposure to smoke and nitrate significantly inhibited germination.
Crotalaria pallida showed significantly enhanced germination in the control treatments
compared with exposure to 100ºC and 120ºC for five minutes (Figure 4.5f; Table 4.3).
There were no significant interactions between exposure to smoke and heat shock, or
nitrate solution and heat shock. However, the two-factor ANOVA of the combined
smoke with heat shock treatment, indicated an overall significant inhibition of
germination after exposure to smoke.
Galactia tenuiflora showed no significant differences between treatments (Figure 4.5g),
while exposure to 40ºC for five minutes significantly increased the percentage seed
94

Chapter 4. The effect of fire regime on seed dormancy release.
germination of Glycine tomentella compared with the smoke treatment (Figure 4.5h;
Table 4.3).
A significantly higher percentage of Indigofera hirsuta seed germinated after exposure
to 80ºC water for five minutes compared to all other treatments, with the exception of
85ºC for 45 minutes (Figure 4.5i; Table 4.3). The latter produced significantly greater
germination than the control and exposure to smoke, 60ºC and 120ºC for five minutes.
In the two-factor ANOVA, 80ºC produced greater germination than the control, while
the smoke treatment significantly inhibited germination. However, exposure to nitrate
plus 80ºC significantly increased percentage germination.
Tephrosia juncea germinated in significant numbers after exposure to 85ºC for 45
minutes compared to all other treatments, except 80ºC for five minutes (Figure 4.5j;
Table 4.3). The latter produced significantly greater germination than exposure to
smoke and 120ºC for five minutes.
4.3.2 Temperature elevation in the topsoil during the passage of fire
There were no statistical differences between temperatures recorded at the base of grass
clumps and in gaps of at least 30 cm, for any soil depth during either early or late dry
season fires (Table 4.4). A significant negative correlation was detected between soil
temperature and soil depth for both early and late dry season fires, indicating the
decline in temperature with soil depth (Figure 4.6). Temperatures were significantly
higher at all depths during late compared to early dry season fires (Table 4.5) and are
displayed using the mode and upper and lower temperatures (Figure 4.6). Modal values
are presented rather than means due to the use of incremental temperature records, and
as the upper temperature records were capped at 182ºC, precluding the calculation of a
true mean. While temperatures at the surface during the early fires ranged from at least
182ºC to 49º C, all surface measurements during the late fires were at least 182º C as
were most recordings at 3 mm (Figure 4.6). The modes for both early and late dry
season fires indicate that there was usually no elevation of temperature at 30 mm,
although temperatures did reach 65ºC in during the late fire.
95
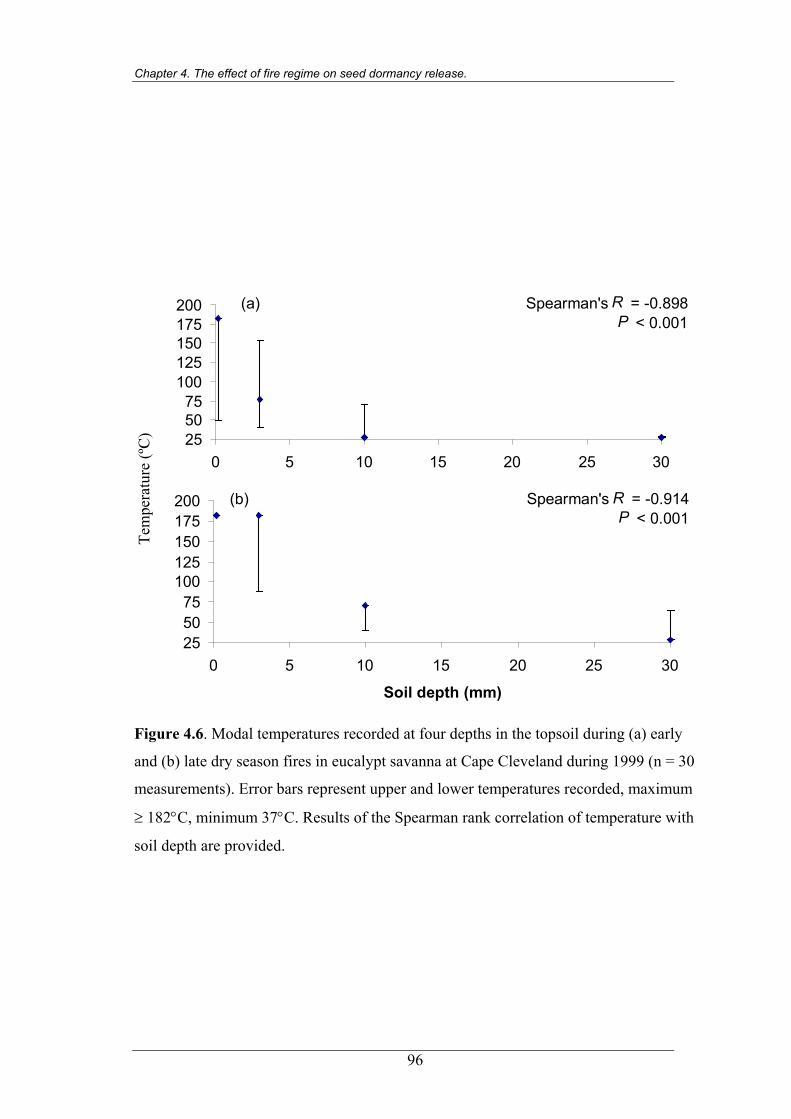
Chapter 4. The effect of fire regime on seed dormancy release.
255075
100125150175200
0 5 10 15 20 25 30
Spearman's R = -0.898P < 0.001
(a)
255075
100125150175200
0 5 10 15 20 25 30
Soil depth (mm)
Spearman's R = -0.914P < 0.001
(b)
Tem
pera
ture
(ºC
)
Figure 4.6. Modal temperatures recorded at four depths in the topsoil during (a) early
and (b) late dry season fires in eucalypt savanna at Cape Cleveland during 1999 (n = 30
measurements). Error bars represent upper and lower temperatures recorded, maximum
≥ 182°C, minimum 37°C. Results of the Spearman rank correlation of temperature with
soil depth are provided.
96
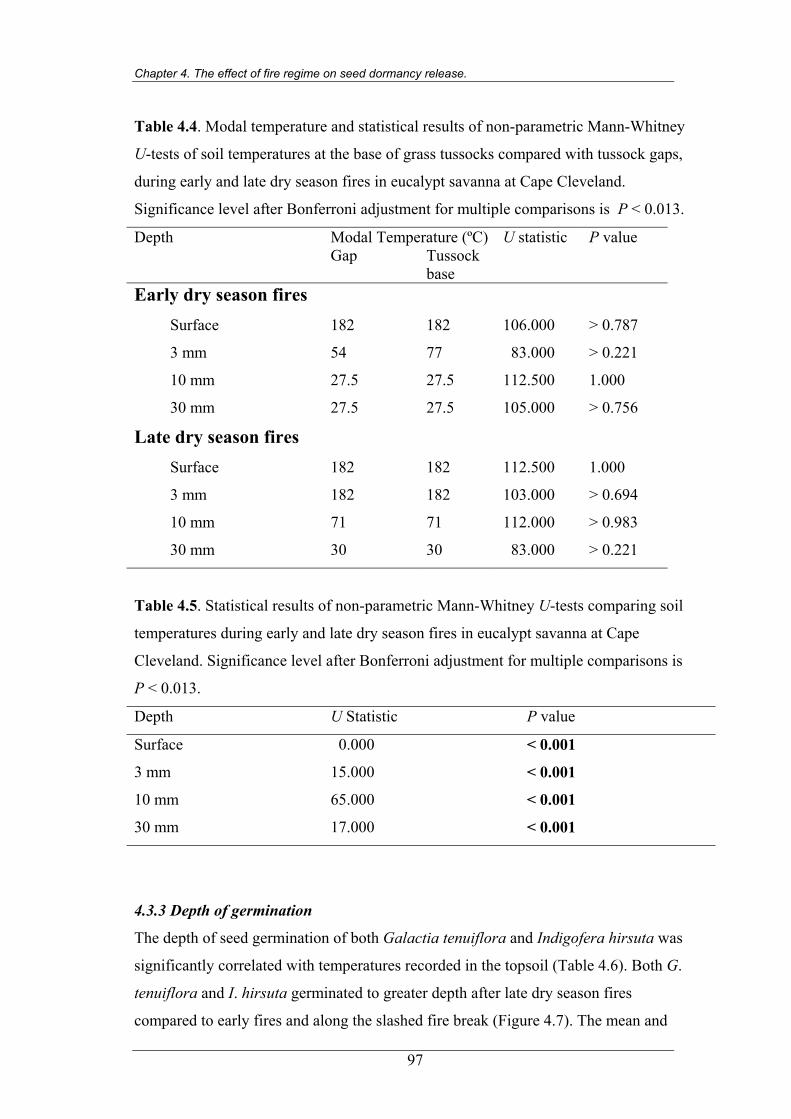
Chapter 4. The effect of fire regime on seed dormancy release.
Table 4.4. Modal temperature and statistical results of non-parametric Mann-Whitney
U-tests of soil temperatures at the base of grass tussocks compared with tussock gaps,
during early and late dry season fires in eucalypt savanna at Cape Cleveland.
Significance level after Bonferroni adjustment for multiple comparisons is P < 0.013.
Depth Modal Temperature (ºC) U statistic P value Gap Tussock
base
Early dry season fires
Surface 182 182 106.000 > 0.787
3 mm 54 77 83.000 > 0.221
10 mm 27.5 27.5 112.500 1.000
30 mm 27.5 27.5 105.000 > 0.756
Late dry season fires
Surface 182 182 112.500 1.000
3 mm 182 182 103.000 > 0.694
10 mm 71 71 112.000 > 0.983
30 mm 30 30 83.000 > 0.221
Table 4.5. Statistical results of non-parametric Mann-Whitney U-tests comparing soil
temperatures during early and late dry season fires in eucalypt savanna at Cape
Cleveland. Significance level after Bonferroni adjustment for multiple comparisons is
P < 0.013.
Depth U Statistic P value
Surface 0.000 < 0.001
3 mm 15.000 < 0.001
10 mm 65.000 < 0.001
30 mm 17.000 < 0.001
4.3.3 Depth of germination
The depth of seed germination of both Galactia tenuiflora and Indigofera hirsuta was
significantly correlated with temperatures recorded in the topsoil (Table 4.6). Both G.
tenuiflora and I. hirsuta germinated to greater depth after late dry season fires
compared to early fires and along the slashed fire break (Figure 4.7). The mean and
97

Chapter 4. The effect of fire regime on seed dormancy release.
deepest germination depths were lower after late dry season fires, suggesting both
greater depth of dormancy release, and greater depth of seed mortality. Indigofera
hirsuta germinated to a depth of 32 mm after late dry season fires, which recorded
elevated temperatures to 65ºC at 30 mm; and to a depth of 17 mm after early fires,
where temperatures of 40ºC at 10 mm and 37ºC at 30 mm were recorded.
0
0
1.2
2.4
3.6
n = 30 n = 10 n = 58
(b)0
0
0
1.2
2.4
3.6
n = 20 n = 4 n = 22
Slashed Early burnt Late burnt
(a)
40
30
20
10
40
30
20
10
Soil
dept
h (m
m)
Figure 4.7. Depth of seed germination in eucalypt savanna that has been slashed, or
burnt early or late in the dry season for (a) Galactia tenuiflora and (b) Indigofera
hirsuta. Dots represent mean depth of germination. Error bars display the upper and
lower germination depths recorded.
98
m)
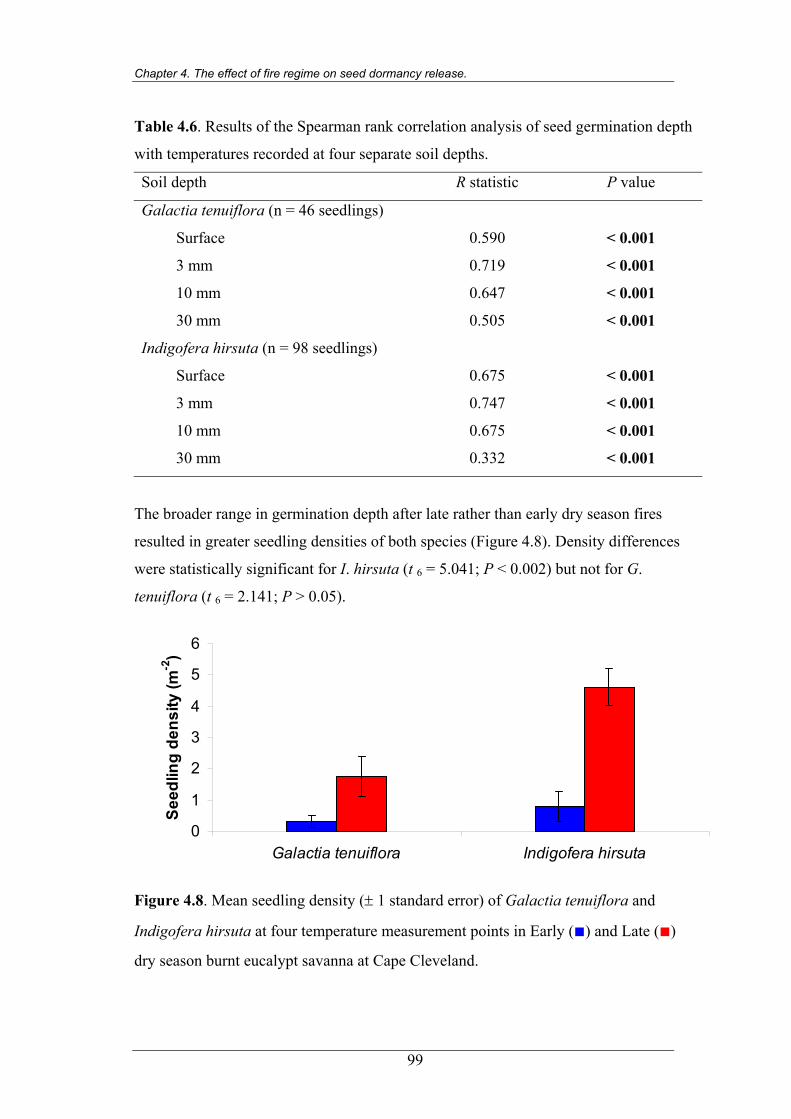
Chapter 4. The effect of fire regime on seed dormancy release.
Table 4.6. Results of the Spearman rank correlation analysis of seed germination depth
with temperatures recorded at four separate soil depths.
Soil depth R statistic P value
Galactia tenuiflora (n = 46 seedlings)
Surface 0.590 < 0.001
3 mm 0.719 < 0.001
10 mm 0.647 < 0.001
30 mm 0.505 < 0.001
Indigofera hirsuta (n = 98 seedlings)
Surface 0.675 < 0.001
3 mm 0.747 < 0.001
10 mm 0.675 < 0.001
30 mm 0.332 < 0.001
The broader range in germination depth after late rather than early dry season fires
resulted in greater seedling densities of both species (Figure 4.8). Density differences
were statistically significant for I. hirsuta (t 6 = 5.041; P < 0.002) but not for G.
tenuiflora (t 6 = 2.141; P > 0.05).
0
1
2
3
4
5
6
Galactia tenuiflora Indigofera hirsuta
Seed
ling
dens
ity (m
-2)
Figure 4.8. Mean seedling density (± 1 standard error) of Galactia tenuiflora and
Indigofera hirsuta at four temperature measurement points in Early (■) and Late (■)
dry season burnt eucalypt savanna at Cape Cleveland.
99
Chapter 4. The effect of fire regime on seed dormancy release.
4.4 Discussion
4.4.1 Laboratory experiment
The influence of fire-related factors in breaking seed dormancy was evident for six of
the ten species examined (Figure 4.5; Table 4.3). Significantly greater germination
occurred after exposure to temperatures between 80ºC to 100ºC which is consistent
with the germination requirements of many legumes of southern Australia (Floyd 1976;
Shea et al. 1979; Auld and O’Connell 1991; Bell et al. 1993; Jhurree et al. 1998).
The 80ºC water treatment produced significantly more germination than the five minute
exposure to 80ºC air temperature for seeds of Chamaecrista mimosoides and Indigofera
hirsuta (Figure 4.5; Table 4.3). Moisture is available in the topsoil, although the
quantity varies with season, soil structure and organic content, and Martin and Cushwa
(1966) and Martin et al. (1975) considered heating seeds in hot water may more
accurately depict conditions in the soil seed bank during fire than oven heating. The
85ºC air temperature for 45 minutes produced significantly greater germination than
80ºC air temperature for five minutes in Crotalaria lanceolata. This may have been due
to the extra 5ºC and/or the longer duration of heating.
Exposures to temperatures as low as 40ºC can significantly enhance germination of
some legumes in south-eastern Australia (Auld and O’Connell 1991). It is possible that
temperatures of 40ºC or 60ºC may have increased the percentage seed germination of
some species in this study, had the seeds been heated in the oven for longer than five
minutes or placed in water or soil at those temperatures.
The four largest seeded species displayed no significant increase in germination with
exposure to elevated temperatures, but were tolerant of exposure to at least 80º C
(Figure 4.5; Table 4.3). This suggests an ability to tolerate the passage of fire, but
provides no evidence of fire-promoted germination. Exposure to 120º C for five
minutes was lethal to most seeds in this experiment, which is consistent with reports
from other studies (e.g. Auld and O’Connell 1991). The second and third largest seeded
species, Galactia tenuiflora and Crotalaria pallida, showed the lowest tolerance to heat
shock, with apparent mortality at 100ºC. This contrasts with African acacias, where
larger seeded species possess a greater tolerance of heat shock than those with smaller
100
Chapter 4. The effect of fire regime on seed dormancy release.
seeds (Midgley and Bond 2001), although no correlation between seed size and thermal
tolerance is apparent for legumes of south-western Australia (Bell and Williams 1998).
The two native species that did not respond significantly to heat shock, Galactia
tenuiflora and Glycine tomentella, were the only perennial species examined, and each
is capable of sprouting after fire (Chapter 8). Sprouting species may be able to maintain
population density with less seedling recruitment than needed by annual or ephemeral
species, and therefore the requirements to break seed dormancy may differ with life
history and fire response (Bell 2001). However the germination of Galactia tenuiflora
and Glycine tomentella was low (< 25%) in all treatments, including the control, and
may have been due to sub-optimal incubation conditions, an after-ripening requirement
not satisfied by the few months of storage, and/or the absence of a heat shock or
chemical treatment that would have produced greater germination. Therefore further
examination of the dormancy requirements of these species is required.
While germination in the laboratory without pre-treatment does not necessarily indicate
the absence of seed dormancy (Whelan 1995), the germination in control treatments
does suggest fire-related stimuli are not obligatory. The mean percentage of “non-
dormant” seeds (i.e. those lacking an innate dormancy related to fire cues) for the seven
native species in this study (15%) is similar to averages reported for legumes of south-
eastern (11 to 15%) and south-western (11 to 18%) Australia (Shea et al. 1979; Auld
and O’Connell 1991; Morrison et al. 1992; Bell et al. 1993; Clarke et al. 2000).
However, the exotic species of this study had a significantly higher mean percentage of
non-dormant seeds (41%) compared with the natives. This suggests some exotic
legumes possess a greater capacity for recruitment in the absence of fire than native
legumes in savannas of north-eastern Australia. Indeed several exotic pasture legumes
used in the region, including Macroptilium atropurpureum and Stylosanthes humilis, do
not require fire for seed germination (McIvor et al. 1993).
Neither smoke nor nitrate in isolation significantly promoted seed germination (Figure
4.5; Table 4.3). In fact smoke significantly inhibited the germination of Chamaecrista
mimosoides, Crotalaria montana, Crotalaria pallida and Indigofera hirsuta. This may
have resulted from the use of the 90 minute exposure to smoke, which increases seed
101
Chapter 4. The effect of fire regime on seed dormancy release.
germination in some species (e.g. Dixon et al. 1995; Keith 1997), however Roche et al.
(1997) demonstrated that a duration of more than 60 minutes can inhibit seed
germination of other species. Exposure to nitrate inhibited Crotalaria calycina and C.
montana germination, which suggests the concentration of nitrate used was toxic to
these species, even though it has been shown to increase germination of Western
Australian plants (Bell et al. 1999).
Significant enhancement of germination was produced by the combination of heat
shock followed by nitrate application for Crotalaria lanceolata and Indigofera hirsuta
(Figure 4.5; Table 4.3). This suggests multiple components of fire operate to promote
germination. The synergistic effect of smoke and heat shock has been recently reported
for several shrubs of fire prone regions in south-eastern Australia (Keith 1997; Gilmour
et al. 2000; Kenny 2000; Morris 2000). Nitrate has been demonstrated to interact with
light regime to increase the germination of several Western Australian species (Bell et
al. 1999), but I am not aware of previous reports of the additive effect of nitrate and
heat shock. The greatest change in soil nitrate levels can occur with the first rains after
fire (Bell 1999). The enhanced response to nitrate and heat shock may therefore be
particularly useful in timing recruitment with the first rain following fire, thus allowing
seedlings of these ephemeral species to take advantage of the full wet season to grow
and produce seeds. Multiple fire cues are also beneficial for ensuring increased
germination after fire when elevation of temperature in the topsoil is inadequate to
break seed dormancy (Kenny 2000).
4.4.2 Temperature elevation in the topsoil during the passage of fire
Early and late dry season fires elevated topsoil temperature, which declined rapidly
with increasing soil depth (Figure 4.6). No differences in temperature were detected
between tussock gaps and the base of grass tussocks, suggesting uniformity in heating
at the scale of tens of centimetres (Table 4.4). Temperature elevation reached at least 30
mm depth during late dry season fires, but did not penetrate as deep during earlier fires.
Temperatures that were demonstrated to significantly increase seed germination (i.e.
80ºC to 100ºC) were documented at the surface and 3 mm depth during early dry
season fires. During late dry season fires, all surface temperatures were lethal to seeds,
while temperatures between 80ºC to 100ºC were only recorded at a depth of 3 mm. The
102

Chapter 4. The effect of fire regime on seed dormancy release.
increased temperature penetration into the topsoil recorded during these fires is
consistent with temperatures recorded during fires in other eucalypt communities (Shea
et al. 1979; Bradstock and Auld 1995; Bebawi and Campbell 2000; Smith et al. 2000).
These data highlight the insulating capacity of soil that protects seeds from lethal
temperatures during fires, while exposing a narrow band of seed bank to temperatures
capable of breaking dormancy. Bradstock and Auld (1995) demonstrated the
importance of fine fuel consumption for influencing soil temperatures during fires. In
this study the greatest temperature elevation was recorded during the late dry season
fires which completely consumed fine fuels, whereas some fuel remained after early
fires (Chapter 3). The seasonal variation is also consistent with the findings of Grant et
al. (1997), who documented higher temperature penetration into the topsoil during
autumn (i.e. late dry season) fires than spring (i.e. early dry season) fires in southern
Western Australia.
4.4.3 Depth of seed germination
The depth of seed germination in both Galactia tenuiflora and Indigofera hirsuta was
positively related to the temperature elevation in the topsoil during fires and was
documented at greater depths after late dry season fires (Figure 4.7; Table 4.6). Mean
germination depths of G. tenuiflora and I. hirsuta are consistent with those recorded for
the New South Wales legume, Acacia suaveolens, although the latter is able to
germinate from greater depths (Bradstock and Auld 1995). Germination of G.
tenuiflora and I. hirsuta was closer to the soil surface along the unburnt slashed track
and after early rather than late dry season fires. This suggests greater seed mortality
occurred in the upper topsoil during late dry season fires, and is consistent with results
from the laboratory experiment that indicated temperatures of at least 100ºC are lethal
to G. tenuiflora and of at least 120ºC are lethal to I. hirsuta seeds.
Larger seeded species may benefit more than smaller seeded species from increased
temperature penetration into the topsoil, because their greater starch reserves may allow
survival of germinants from further depths in the topsoil (Midgley and Bond 2001).
However in this instance, the smaller seeded I. hirsuta germinated from greater depths,
even though the larger seeded G. tenuiflora displayed a greater percentage of non-
dormant seeds in the laboratory experiment.
103
Chapter 4. The effect of fire regime on seed dormancy release.
The depth of seed germination of G. tenuiflora was correlated with temperature
penetration even though no significant heat shock cue was demonstrated in the
laboratory experiment. Indigofera hirsuta germinated from a depth of 32 mm, where
the highest temperature recorded was 65ºC during the late fires; and from 17 mm after
early fires, where maximum temperatures at 10 mm were 40ºC. The field germination
therefore suggests seed dormancy of G. tenuiflora is broken by heat shock and that
germination of I. hirsuta may be promoted by lower temperatures than indicated in the
laboratory experiment. This re-affirms the suggestion that exposure of seeds to 40ºC
and 60ºC using hot water, heated soil, or an extended duration in heated air, may have
produced significantly enhanced germination below 80ºC in the laboratory experiment.
There was a greater density of I. hirsuta seedlings recorded within the 1 m radius of
temperature measurement points after late rather than early dry season fires (Figure
4.8). This reflects the greater range in depth of germination after late fires and therefore
greater proportion of the soil seed bank from which germination was triggered.
4.5 Conclusion
In summary, the ten legume species responded variously to the exposure to heat shock
and chemicals related to the passage of fire. While several species displayed no
significant increase in germination with exposure to fire-related cues, heat shock, by
itself and in combination with nitrate, was found to break the seed dormancy of several
species. The presence of seeds of all species with no apparent innate dormancy
suggests germination can occur in the absence of fire, and for a higher percentage of
seeds of exotic species than natives. Variation in seed dormancy requirements may be
important for maintaining species coexistence (Grubb 1977).
Temperatures that break seed dormancy did occur in the topsoil during the passage of
both early and late dry season fires. Greater penetration of elevated temperatures
occurred during late dry season fires, however this included temperatures lethal to
seeds. The depth of germination of two native legumes confirmed that temperatures
experienced during fires are capable of triggering germination in the topsoil. The data
also suggest temperatures as low as 40ºC may increase germination of these species. A
greater range in germination depth, resulting in higher seedling densities, was recorded
104
Chapter 4. The effect of fire regime on seed dormancy release.
105
after late dry season fires, suggesting more abundant seedling emergence may occur
after late rather than early dry season fires.
The results in this chapter suggest that the post-fire pulse in species abundance
documented in Chapter 3 may in part be due to the release of some seeds from a state
of dormancy by the temperature elevation and enhanced nitrate concentrations in the
topsoil as a result of fire. The pulse of species abundance documented in Chapter 3 was
especially evident after late dry season fires, and this chapter presents evidence that late
fires release seed from dormancy to a greater depth in the topsoil, and hence a greater
volume of the soil seed bank.
This chapter has examined only a small selection of savanna species and further
information is needed on the effect of fire on seed dormancy for a wider range of
species. Chapter 5 broadens the investigation of the effect of fire-related cues on seed
dormancy, to include more species. It also identifies species that store seed in the soil,
and provides details on the distribution of the seed bank in the topsoil, seasonal
fluctuations in the seed bank, and the influence of fire on the soil seed bank dynamics.
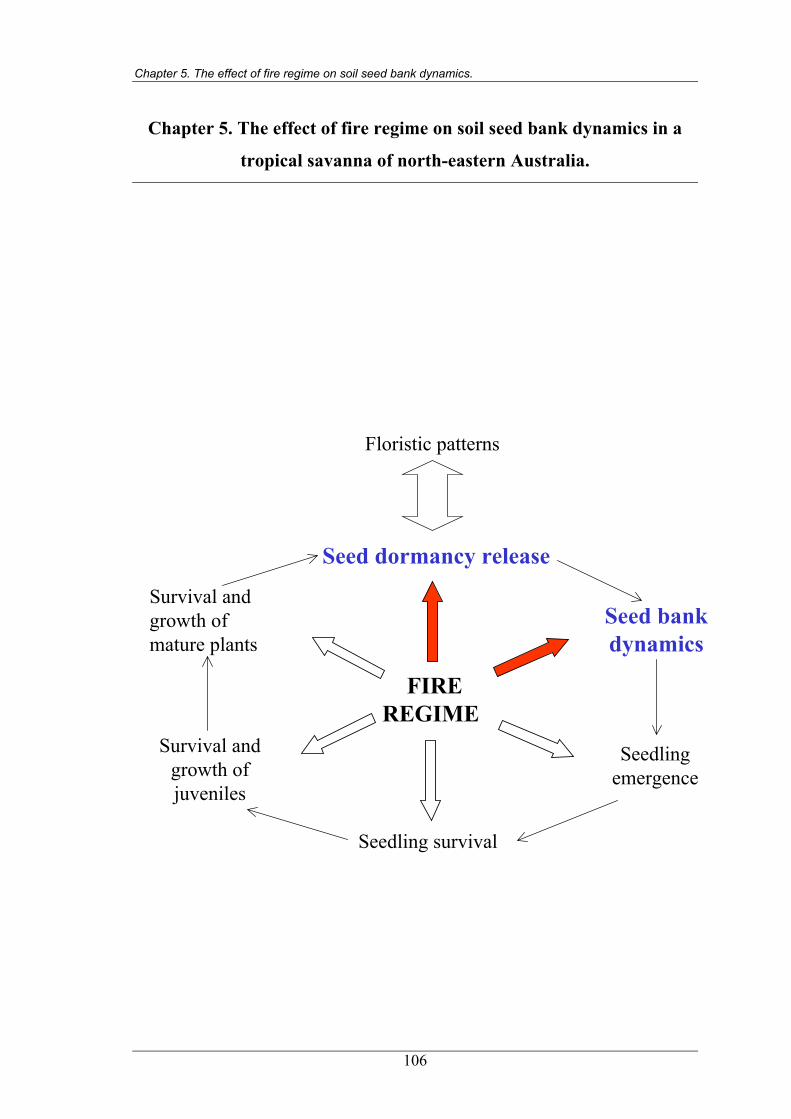
Chapter 5. The effect of fire regime on soil seed bank dynamics.
Chapter 5. The effect of fire regime on soil seed bank dynamics in a
tropical savanna of north-eastern Australia.
FIREREGIME
Seed dormancy release
Floristic patterns
Seed bankdynamics
Seedlingemergence
Survival andgrowth ofjuveniles
Survival andgrowth ofmature plants
Seedling survival
106
Chapter 5. The effect of fire regime on soil seed bank dynamics.
5.1 Introduction
Seed banks bridge the gap between seed production and seed germination. They
provide a mechanism for population persistence through harsh seasons and supply
propagules for re-establishment after disturbance (Lunt 1997; Auld et al. 2000).
Canopy seed storage (bradyspory) is uncommon in northern Australia, with seed of
savanna species primarily stored within the soil (McIvor 1987; Andrew and Mott 1983;
Williams et al. 1999a). Several annual grasses in Australian tropical savannas produce
soil seed banks of high density. For example, initial input into the soil seed bank by
Sorghum intrans can average 2150 seeds m-2 (Andrew 1986). Seed bank densities of
perennial grasses can be considerably lower, for instance up to 150 seeds m-2 for
Themeda triandra and less than 100 seeds m-2 for Heteropogon contortus (Shaw 1957;
Mott et al. 1985; McIvor 1987).
Many Australian tropical savanna species do not produce seed banks that persist longer
than a few weeks, with seeds either germinating or succumbing to predation or disease
soon after seed fall. Examples of this syndrome include several tropical eucalypts and
the perennial grasses Alloteropsis semialata and Dichanthium fecundum (Mott and
Andrew 1985; Setterfield 1997a; Crowley and Garnett 2001).
Many dominant grasses of tropical savannas, including annual Sorghum spp. and
Themeda triandra, produce a transient seed bank, with seed stored through the dry
season and exhausted during the wet season, requiring replenishment for the following
year (Andrew and Mott 1983; McIvor 1987). For many of these grasses, storage
through the dry season is made possible by an after-ripening seed dormancy
mechanism (McIvor and Howden 2000). Persistent seed banks contain seeds that
remain viable for more than one year and can be important mechanisms for population
survival, especially for short-lived or non-sprouter species (Thompson and Grime 1979;
Bond and van Wilgen 1996). Innate and secondary, enforced, seed dormancy
mechanisms are fundamental for allowing seed bank persistence (Bell 1999; Auld et al.
2000). Examples of species with persistent seed banks in tropical Australian savannas
include the native forb Epaltes australis and the exotic pasture legume, Stylosanthes
hamata (McIvor 1987).
107
Chapter 5. The effect of fire regime on soil seed bank dynamics.
In many fire-prone communities, seedlings primarily recruit from the local seed bank
rather than seed dispersed from outside the immediate area, and therefore seed bank
density, distribution and response to fire-related cues are important factors influencing
post-fire seedling emergence (Whelan 1986; Auld et al. 2000). Soil seed banks are
dynamic, fluctuating in composition and abundance in response to seed input, seed
mortality, release of seeds from dormancy and seed germination (Thompson and Grime
1979). All of these processes can be influenced by fire, which can enhance or restrict
seed production, affect seed dispersal agents, cause seed mortality, and break seed
dormancy to allow germination (Keith 1996; Whelan et al. 2002).
As fire can influence seed bank processes, variations in fire regime may be expected to
have a considerable effect on seed bank dynamics. Fire interval may be particularly
important for species with seed input restricted to the early phase of fire intervals, such
as ephemerals with fire-triggered germination, and plants with fire-promoted flowering
and fruiting (Keith 1996). Seed banks of these species receive a pulse of post-fire seed
input, but may gradually decline between fires (Bond and van Wilgen 1996). Seed
banks of some perennial species, or ephemerals with continuous recruitment, may build
up during the years following fire, so that long fire intervals promote dense seed banks
(Keith 1996). However, fire frequency may have less influence on seed banks of
perennial species that rely heavily on annual input, due to high annual seed losses
irrespective of fire (Bond and van Wilgen 1996).
Fire intensity can affect seed bank dynamics through its influence on plant mortality
and subsequent seed input, as well as direct affects on seed mortality and release from
seed dormancy (Whelan 1995). Fire season can influence seed bank dynamics by
interacting with reproductive phenology, and fires that are synchronised with seasonal
peaks in seed bank density will influence the survival and germination of a greater
number of seeds. Post-fire climatic conditions also influence seed germination, and
therefore seed bank dynamics (Whelan 1995).
The scale and patchiness of fire can influence seed bank dynamics, with a patchy fire
producing a fine-scale spatial mosaic in seed mortality and germination. Williams and
Lane (1999) considered the re-establishment of Sorghum brachypodum after initial
108
Chapter 5. The effect of fire regime on soil seed bank dynamics.
declines in density following wet season burning, may have been due to small-scale
seed dispersal from adjacent unburnt areas.
Research into the effect of fire regime on seed production and seed bank dynamics in
Australian tropical savannas has focused on a few dominant species. Setterfield (1997)
demonstrated that the seed production of Eucalyptus miniata and E. tetrodonta can be
reduced by both early and late dry season fires. Most research on seed banks has
concentrated on grasses, many of which produce seed banks lasting from several weeks
to one year (Andrew and Mott 1983; Andrew 1986; McIvor 1987; Crowley and Garnett
2001).
Harper (1977) produced a valuable model for interpreting seed bank dynamics, in
which he described soil seed banks as containing both dormant and “active”
components, the latter requiring only soil moisture and favourable temperatures to
promote germination (Figure 5.1). The dormant component of the seed bank may
contain seeds with an innate dormancy, which in some seeds can be broken by fire-
related factors (Bell 1999; Chapter 4). The dormant seed bank may also contain seeds
lacking innate dormancy, but inhibited from germination by a secondary, enforced
dormancy. Auld et al. (2000) found evidence that seeds of some shrubs in temperate
woodlands may have remained viable within the soil seed bank for two years as the
result of a secondary dormancy mechanism, possibly enforced by the absence of light.
Experimental treatment of soil seed banks (e.g. exposing to heat shock and smoke) can
indirectly assess the effect of fire on seed dormancy, and therefore the balance between
dormant and active seed banks (e.g. Enright et al. 1997; Read et al. 2000). While the
untreated germinable soil seed bank may include seeds that have been released from
dormancy through the process of soil collection and incubation in shadehouse
conditions (Whelan 1995), it provides a useful approximation of seeds that do not
require a fire stimulus prior to germination. Comparisons of untreated germinable soil
seed banks before and after fire, and in burnt and adjacent unburnt savanna, can
provide a direct assessment of the influence of fire on the active fraction of soil seed
banks.
109
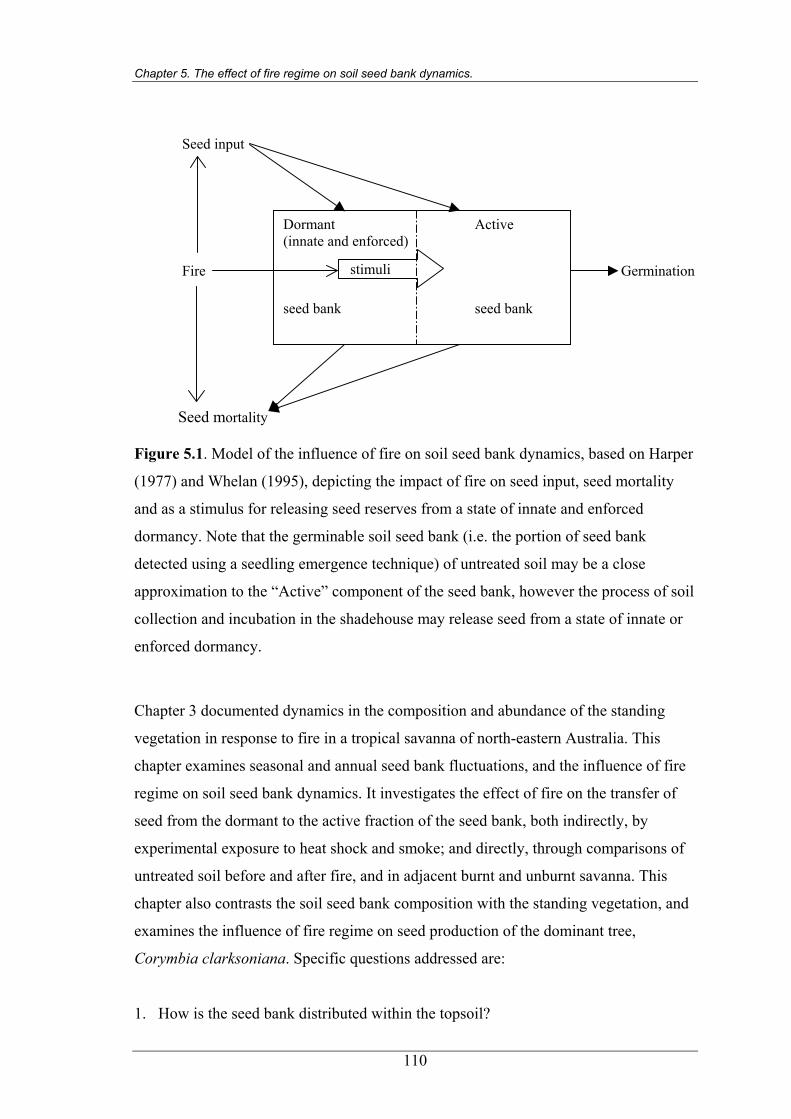
Chapter 5. The effect of fire regime on soil seed bank dynamics.
Seed input
Fire Germination
Seed mortality
Dormant Active (innate and enforced) seed bank
Figure 5.1. Model of the influen
(1977) and Whelan (1995), depic
and as a stimulus for releasing se
dormancy. Note that the germina
detected using a seedling emerge
approximation to the “Active” co
collection and incubation in the s
enforced dormancy.
Chapter 3 documented dynamics
vegetation in response to fire in a
chapter examines seasonal and an
regime on soil seed bank dynami
seed from the dormant to the acti
experimental exposure to heat sh
untreated soil before and after fir
chapter also contrasts the soil see
examines the influence of fire reg
Corymbia clarksoniana. Specific
1. How is the seed bank distribu
stimuli
seed bankce of fire on soil seed bank dynamics, based on Harper
ting the impact of fire on seed input, seed mortality
ed reserves from a state of innate and enforced
ble soil seed bank (i.e. the portion of seed bank
nce technique) of untreated soil may be a close
mponent of the seed bank, however the process of soil
hadehouse may release seed from a state of innate or
in the composition and abundance of the standing
tropical savanna of north-eastern Australia. This
nual seed bank fluctuations, and the influence of fire
cs. It investigates the effect of fire on the transfer of
ve fraction of the seed bank, both indirectly, by
ock and smoke; and directly, through comparisons of
e, and in adjacent burnt and unburnt savanna. This
d bank composition with the standing vegetation, and
ime on seed production of the dominant tree,
questions addressed are:
ted within the topsoil?
110
Chapter 5. The effect of fire regime on soil seed bank dynamics.
2. Does the soil seed bank contain seeds which can be released from dormancy
through exposure to fire-related factors (i.e. heat shock and smoke)?
3. Does fire increase the density of the active seed bank?
4. What annual and seasonal fluctuations occur in the soil seed bank and does fire
affect these patterns?
5. How does the species composition of the germinable soil seed bank compare with
the standing vegetation?
6. What is the phenology of seed production of plants at Cape Cleveland and how
does this relate to seasonal dynamics in the soil seed bank?
7. What is the effect of fire season on seed production in C. clarksoniana, a species
that produces a very short-lived seed bank?
5.2 Methods
5.2.1 Sampling methods
5.2.1a Soil seed bank sampling
Pre- and post- mid dry season fire 1997
Soil seed bank of eucalypt savanna at the Cape Cleveland study site (Figures 2.1 and
2.4) was sampled regularly between July 1997 and October 2000. The initial sampling
in July 1997 was undertaken to investigate the effects of the mid dry season fire of that
year on soil seed bank dynamics, and to examine the distribution of seeds in the topsoil.
It was also useful as a pilot study to refine sampling methodology for the remainder of
the seed bank study.
Soil samples were collected from eight points across each of the 1 ha blocks, several
days prior to the July 1997 fire. The sampling method involved walking through each 1
ha block and stopping approximately every 20 paces. A random direction was then
used to locate a point for soil sampling. At each point, duplicate 125 cm3 sub-samples
were collected from three separate depths: the upper 3 mm; 3 to 20 mm; and 20 to 40
mm. The collection depths were made as accurate as possible by marking depths on the
spade used for soil collection. The upper 3 mm was collected by scraping together the
loose surface soil to the required depth. The lower two depths were collected by
digging, to the appropriate depth, a spadeful of soil with a surface area of 459 cm2. This
provided a bulk sample at each point of approximately 780 cm3 for the 3 to 20 mm
111
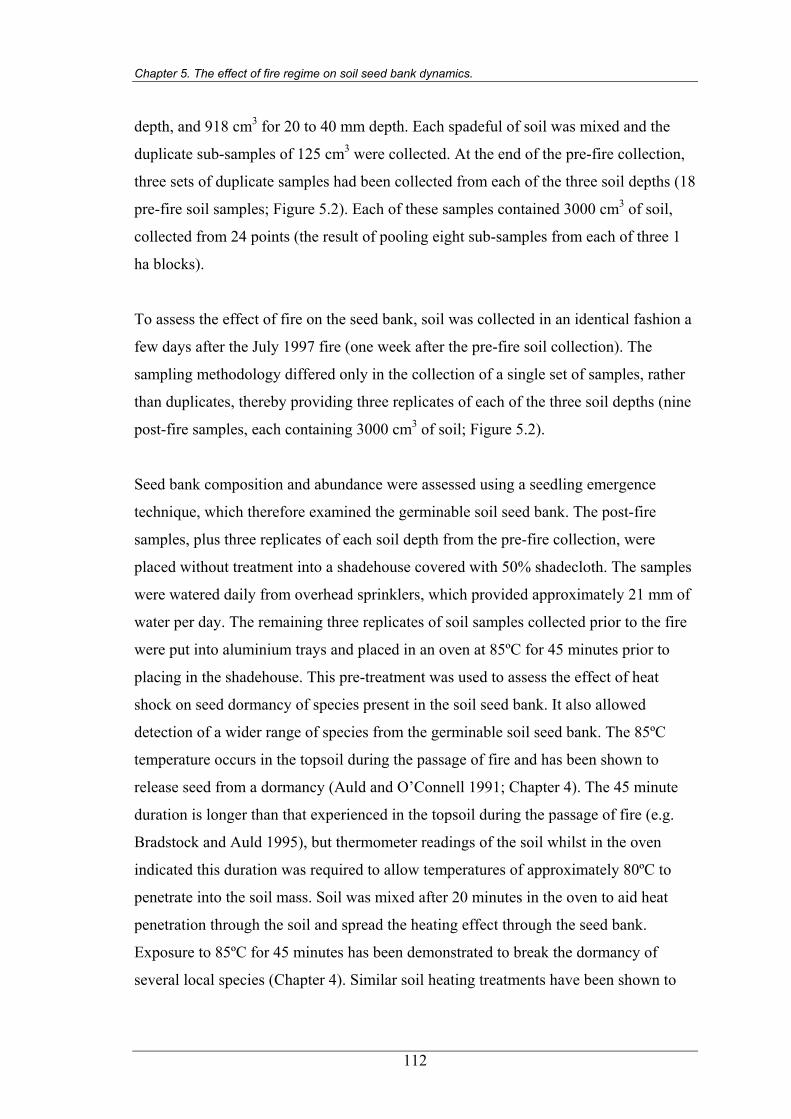
Chapter 5. The effect of fire regime on soil seed bank dynamics.
depth, and 918 cm3 for 20 to 40 mm depth. Each spadeful of soil was mixed and the
duplicate sub-samples of 125 cm3 were collected. At the end of the pre-fire collection,
three sets of duplicate samples had been collected from each of the three soil depths (18
pre-fire soil samples; Figure 5.2). Each of these samples contained 3000 cm3 of soil,
collected from 24 points (the result of pooling eight sub-samples from each of three 1
ha blocks).
To assess the effect of fire on the seed bank, soil was collected in an identical fashion a
few days after the July 1997 fire (one week after the pre-fire soil collection). The
sampling methodology differed only in the collection of a single set of samples, rather
than duplicates, thereby providing three replicates of each of the three soil depths (nine
post-fire samples, each containing 3000 cm3 of soil; Figure 5.2).
Seed bank composition and abundance were assessed using a seedling emergence
technique, which therefore examined the germinable soil seed bank. The post-fire
samples, plus three replicates of each soil depth from the pre-fire collection, were
placed without treatment into a shadehouse covered with 50% shadecloth. The samples
were watered daily from overhead sprinklers, which provided approximately 21 mm of
water per day. The remaining three replicates of soil samples collected prior to the fire
were put into aluminium trays and placed in an oven at 85ºC for 45 minutes prior to
placing in the shadehouse. This pre-treatment was used to assess the effect of heat
shock on seed dormancy of species present in the soil seed bank. It also allowed
detection of a wider range of species from the germinable soil seed bank. The 85ºC
temperature occurs in the topsoil during the passage of fire and has been shown to
release seed from a dormancy (Auld and O’Connell 1991; Chapter 4). The 45 minute
duration is longer than that experienced in the topsoil during the passage of fire (e.g.
Bradstock and Auld 1995), but thermometer readings of the soil whilst in the oven
indicated this duration was required to allow temperatures of approximately 80ºC to
penetrate into the soil mass. Soil was mixed after 20 minutes in the oven to aid heat
penetration through the soil and spread the heating effect through the seed bank.
Exposure to 85ºC for 45 minutes has been demonstrated to break the dormancy of
several local species (Chapter 4). Similar soil heating treatments have been shown to
112

Chapter 5. The effect of fire regime on soil seed bank dynamics.
promote seed germination from soil seed banks in tropical Australia (Hopkins and
Graham 1984; Skull 1992; Williams 2000).
18 pre-fire soil samples 9 post-fire soil samples
0 - 3 U 2
0 - 3 U 2
0 - 3 H 1
0 - 3 H 2
0 - 3 H 3
0 - 3 B 1
0 - 3 B 2
0 - 3 B 3
0 - 3 U 1
3 - 20 U 1
3 - 20U 2
3 - 20 U 3
3 - 20H 1
3 - 20H 2
3 - 20H 3
3 - 20 B 1
3 – 20 B 2
3 – 20B 3
20 - 40 U 1
20 – 40 U 2
20 – 40 U 3
20 – 40H 1
20 – 40 H 2
20 - 40H 3
20 – 40 B 1
20 – 40 B 2
20 – 40B 3
Figure 5.2. Schematic diagram of the sampling design used in the July 1997
germinable soil seed bank study in eucalypt savanna at Cape Cleveland. Each box
represents a soil seed bank sample of 3000 cm3 collected from 24 points. 0 – 3, surface
samples from a depth of 0 to 3 mm; 3 – 20 samples from 3 to 20 mm depth; 20 – 40,
samples from 20 to 40 mm depth; U, soil collected prior to fire and remained untreated;
H, soil collected prior to fire and heated in an oven at 85º C for 45 minutes; B, soil
collected after fire, but otherwise untreated. Numbers 1, 2 and 3 represent the replicate
number, each replicate contains 24 sub-samples collected from three 1 ha blocks.
Soil samples were assessed regularly for seedlings, which were removed once large
enough to be identified. Additional trays of sand were placed adjacent to the soil trays
to detect the presence of weed seeds in the shadehouse. Assessment of soil samples
continued for six months.
Soil seed bank sampling from October 1997 to October 2000
Soil seed bank at the Cape Cleveland experimental site was sampled over three years,
from October 1997 to October 2000, to investigate seasonal and annual fluctuations,
and the influence of fire regime on seed bank dynamics. Soil was collected in four
113
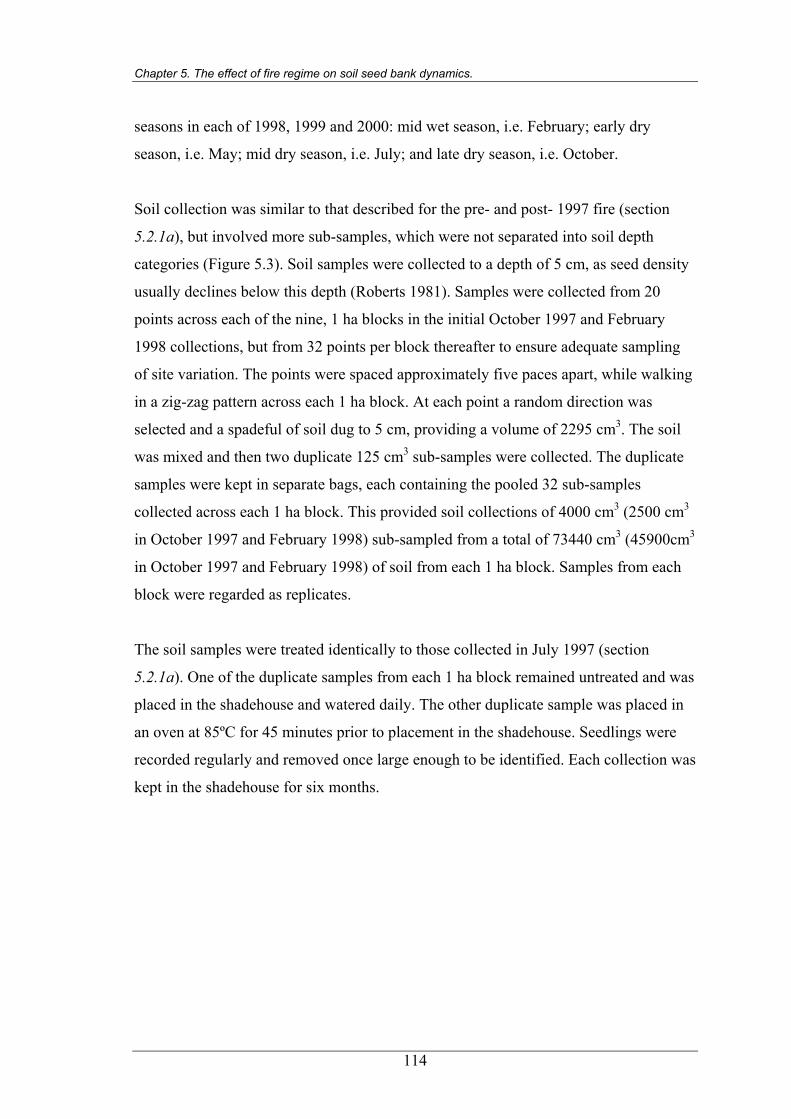
Chapter 5. The effect of fire regime on soil seed bank dynamics.
seasons in each of 1998, 1999 and 2000: mid wet season, i.e. February; early dry
season, i.e. May; mid dry season, i.e. July; and late dry season, i.e. October.
Soil collection was similar to that described for the pre- and post- 1997 fire (section
5.2.1a), but involved more sub-samples, which were not separated into soil depth
categories (Figure 5.3). Soil samples were collected to a depth of 5 cm, as seed density
usually declines below this depth (Roberts 1981). Samples were collected from 20
points across each of the nine, 1 ha blocks in the initial October 1997 and February
1998 collections, but from 32 points per block thereafter to ensure adequate sampling
of site variation. The points were spaced approximately five paces apart, while walking
in a zig-zag pattern across each 1 ha block. At each point a random direction was
selected and a spadeful of soil dug to 5 cm, providing a volume of 2295 cm3. The soil
was mixed and then two duplicate 125 cm3 sub-samples were collected. The duplicate
samples were kept in separate bags, each containing the pooled 32 sub-samples
collected across each 1 ha block. This provided soil collections of 4000 cm3 (2500 cm3
in October 1997 and February 1998) sub-sampled from a total of 73440 cm3 (45900cm3
in October 1997 and February 1998) of soil from each 1 ha block. Samples from each
block were regarded as replicates.
The soil samples were treated identically to those collected in July 1997 (section
5.2.1a). One of the duplicate samples from each 1 ha block remained untreated and was
placed in the shadehouse and watered daily. The other duplicate sample was placed in
an oven at 85ºC for 45 minutes prior to placement in the shadehouse. Seedlings were
recorded regularly and removed once large enough to be identified. Each collection was
kept in the shadehouse for six months.
114
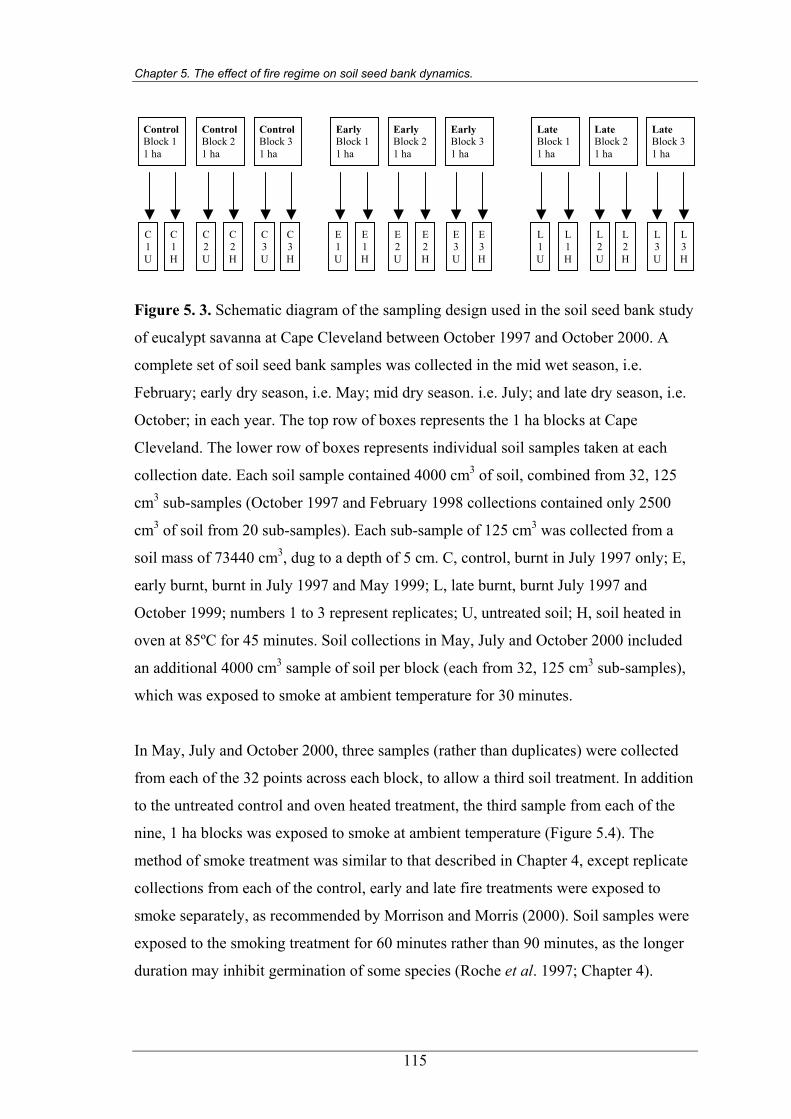
Chapter 5. The effect of fire regime on soil seed bank dynamics.
Control Block 1 1 ha
Control Block 21 ha
Control Block 3 1 ha
Early Block 11 ha
Early Block 21 ha
Early Block 31 ha
Late Block 1 1 ha
Late Block 2 1 ha
Late Block 31 ha
C 1 U
C 1 H
C 2 U
C2H
C 3 U
C 3H
E1U
E1H
E2U
E2H
E3U
E3H
L1U
L 1 H
L2 U
L2H
L3U
L3H
Figure 5. 3. Schematic diagram of the sampling design used in the soil seed bank study
of eucalypt savanna at Cape Cleveland between October 1997 and October 2000. A
complete set of soil seed bank samples was collected in the mid wet season, i.e.
February; early dry season, i.e. May; mid dry season. i.e. July; and late dry season, i.e.
October; in each year. The top row of boxes represents the 1 ha blocks at Cape
Cleveland. The lower row of boxes represents individual soil samples taken at each
collection date. Each soil sample contained 4000 cm3 of soil, combined from 32, 125
cm3 sub-samples (October 1997 and February 1998 collections contained only 2500
cm3 of soil from 20 sub-samples). Each sub-sample of 125 cm3 was collected from a
soil mass of 73440 cm3, dug to a depth of 5 cm. C, control, burnt in July 1997 only; E,
early burnt, burnt in July 1997 and May 1999; L, late burnt, burnt July 1997 and
October 1999; numbers 1 to 3 represent replicates; U, untreated soil; H, soil heated in
oven at 85ºC for 45 minutes. Soil collections in May, July and October 2000 included
an additional 4000 cm3 sample of soil per block (each from 32, 125 cm3 sub-samples),
which was exposed to smoke at ambient temperature for 30 minutes.
In May, July and October 2000, three samples (rather than duplicates) were collected
from each of the 32 points across each block, to allow a third soil treatment. In addition
to the untreated control and oven heated treatment, the third sample from each of the
nine, 1 ha blocks was exposed to smoke at ambient temperature (Figure 5.4). The
method of smoke treatment was similar to that described in Chapter 4, except replicate
collections from each of the control, early and late fire treatments were exposed to
smoke separately, as recommended by Morrison and Morris (2000). Soil samples were
exposed to the smoking treatment for 60 minutes rather than 90 minutes, as the longer
duration may inhibit germination of some species (Roche et al. 1997; Chapter 4).
115
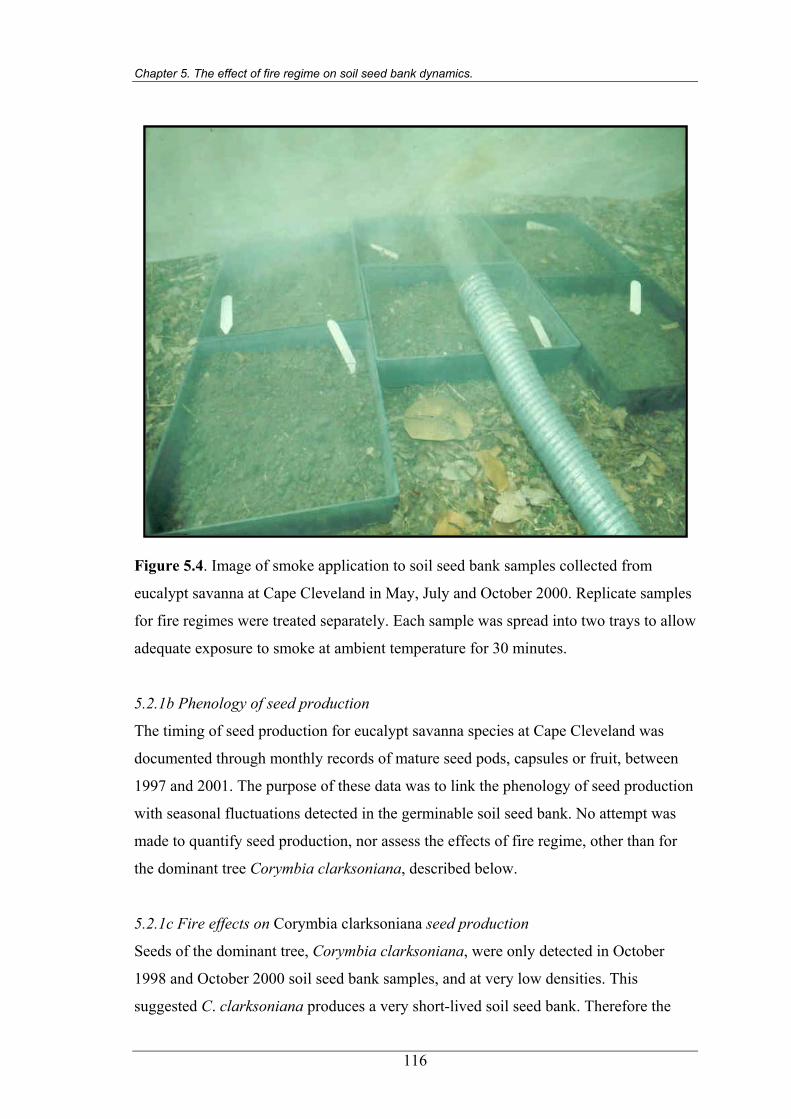
Chapter 5. The effect of fire regime on soil seed bank dynamics.
Figure 5.4. Image of smoke application to soil seed bank samples collected from
eucalypt savanna at Cape Cleveland in May, July and October 2000. Replicate samples
for fire regimes were treated separately. Each sample was spread into two trays to allow
adequate exposure to smoke at ambient temperature for 30 minutes.
5.2.1b Phenology of seed production
The timing of seed production for eucalypt savanna species at Cape Cleveland was
documented through monthly records of mature seed pods, capsules or fruit, between
1997 and 2001. The purpose of these data was to link the phenology of seed production
with seasonal fluctuations detected in the germinable soil seed bank. No attempt was
made to quantify seed production, nor assess the effects of fire regime, other than for
the dominant tree Corymbia clarksoniana, described below.
5.2.1c Fire effects on Corymbia clarksoniana seed production
Seeds of the dominant tree, Corymbia clarksoniana, were only detected in October
1998 and October 2000 soil seed bank samples, and at very low densities. This
suggested C. clarksoniana produces a very short-lived soil seed bank. Therefore the
116
Chapter 5. The effect of fire regime on soil seed bank dynamics.
effect of fire season on seed supply of this dominant species could not be adequately
assessed using the seed bank data, and direct surveys of capsule density were made.
Capsules of C. clarksoniana were observed to fall when mature, in October and
November each year, which is consistent with other tropical eucalypts (Burrows and
Burrows 1992; Setterfield 1997). Seed is shed both prior to and immediately following
capsule fall. The density of fallen C. clarksoniana capsules was counted in December
2000, after the majority of capsules had fallen, to estimate seed production in the year
following fire season treatments. Capsules were counted within 50, 1m2 quadrats in
each of the nine, 1 ha blocks during the annual seedling survey (Chapter 6). The
quadrat was thrown in a random direction at points spaced five paces apart whilst
walking up and back across each 1 ha block. The number of seeds in each of 30
capsules of C. clarksoniana, collected prior to opening, were counted to allow an
estimate of seed density from the capsule density data.
5.2.2 Statistical analyses
5.2.2a Overview of analyses
To evaluate seed bank distribution in the topsoil; seasonal and annual fluctuations; the
effect of fire and fire-related cues (i.e. heat shock and smoke) on the germinable soil
seed bank; and the effect of fire regime on seed production of the dominant eucalypt;
data were analysed in six sections:
1. Pre- and post-mid dry season fire (July 1997 soil seed bank collections).
2. Seasonal and annual fluctuations with time since fire (soil seed bank samples
collected from Control blocks only, between February 1998 to October 2000).
3. Pre- and post-early and late dry season fires (soil seed bank samples collected
between May 1999 and February 2000).
4. Soil seed banks during the dry season following fire season treatments (soil seed
bank samples collected between May and October 2000).
5. A comparison of species composition between soil seed bank and the standing
vegetation described in Chapter 3.
6. The effect of fire season on the seed production of C. clarksoniana.
117
Chapter 5. The effect of fire regime on soil seed bank dynamics.
The phenological records of seed production were qualitative in nature, and therefore
no statistical analyses were undertaken on these data, but they were used for
interpretation of the seasonal variation in the soil seed banks.
5.2.2b Seed bank dynamics pre- and post-mid dry season 1997 fire
The soil seed bank before and after the mid dry season 1997 fire was analysed in a two-
factor ANOVA to examine the effect of soil treatment with three levels (untreated,
heated and burnt) and soil depth with three levels (surface 3 mm; 3 to 20 mm and 21 to
40 mm), with a Scheffe’s post-hoc test to examine where differences between
treatments lay (Underwood 1997). To allow consistency across soil depths, seedling
numbers per sample were converted to density (m-2). The surface 3 mm data required
no conversion, as the 24, 125 cm3 samples per replicate equates to 1 m2 of soil surface
(24 samples * 125 cm3 / 0.3 cm depth = 10000 cm2 = 1 m2). Counts from the 3 to 20
mm samples were multiplied by 5.667, and those from the 20 to 40 mm samples were
multiplied by 6.667 to give seedling density (m-2). In all soil seed bank analyses,
seedling density was interpreted as the germinable soil seed bank density.
Homogeneity of variances was tested using Cochran’s test (Underwood 1997). Where
variance heterogeneity problems violating ANOVA assumptions could not be resolved
with data transformation, a Kruskal-Wallis ANOVA by rank was performed separately
for the two factors, soil treatment and soil depth (Zar 1999). Where the Kruskal-Wallis
ANOVA detected significant differences, Mann-Whitney U-tests were used to detect
differences within treatments, with a Bonferroni adjustment of significance values for
multiple comparisons (Sokal and Rohlf 1995).
Analyses were performed on species richness (per sample), total soil seed bank, native
and exotic species, the growth form groups described in Chapter 3, and the most
abundant individual species detected in the soil seed banks. Analyses of individual
species were only performed on those comprising at least 5% of the total seed density.
This was done because species with lower abundance had large variations within
treatments. Due to the large overall number of analyses undertaken on the soil seed
bank data, the significance value was set at P < 0.01, to reduce the possibility of
118
Chapter 5. The effect of fire regime on soil seed bank dynamics.
inappropriately assigning a significant conclusion (type 1 error; Zar 1999) and therefore
providing confidence in all differences that are identified as significant.
5.2.2c Seasonal and annual fluctuations with time since fire
Seasonal and annual fluctuations in the soil seed bank were assessed over the first three
years after fire using the replicate samples collected from the three control blocks
(Figure 2.4). The effect of soil heating, plus annual and seasonal fluctuations were
analysed for species richness per sample, the total seed bank, native and exotic groups,
growth form groups and the most abundant species. Species comprising at least 5% of
the total seed density recorded for this set of analyses were assessed.
Soil seed bank data from the control blocks were converted to seed density (m-2) to
provide consistency between the February 1998 soil collection of 2500 cm3 and the
subsequent data from soil samples of 4000 cm3. The data were analysed in a repeated
measures ANOVA, with soil treatment as the main factor, with two levels (untreated
and heated). Two repeated measures factors were assessed: year with three levels
(1998, 1999 and 2000), and season with four levels (wet season, early, mid and late dry
seasons). Repeated measures ANOVA was used because the same 1 ha blocks (which
were the unit of comparison) were repeatedly sampled in all four seasons of each year.
ANOVA assumptions of homogeneity were assessed using Cochran’s test (Underwood
1997). Where significant variance heterogeneity could not be resolved with data
transformations for one or two seasons, the repeated measures ANOVA was performed
with the remaining levels of the factor “season”. Where heterogeneity of variances was
significant in more than two seasons, non-parametric analyses were performed
separately on the soil treatment, year and seasonal effects. A Mann-Whitney U-test was
used for analysis of the soil treatment, and Friedman ANOVA by ranks, which is
appropriate for repeated measures analyses, was performed on the seasonal effects (Zar
1999). Where the Friedman ANOVA detected a significant difference, a Wilcoxon’s
matched pair analysis was undertaken as a post-hoc test, with a Bonferroni adjustment
of significance level for multiple comparisons, to determine where differences lay
(Sokal and Rohlf 1995). For the exotic species and grasses groups, significant
heterogeneity of variance in the 1998 data could not be resolved by transformations,
119
Chapter 5. The effect of fire regime on soil seed bank dynamics.
therefore the year fluctuations were analysed from 1998 to 2000 using a Friedman’s
ANOVA by ranks, while the soil treatment and seasonal fluctuations were analysed in a
two-factor ANOVA for 1999 and 2000 data only.
5.2.2d Seed bank dynamics immediately before and after the 1999 fire season
treatments
An examination was made of the soil seed bank before and after the implementation of
fire season treatments in 1999 (described in Chapter 2). Data from untreated and heated
soils for control, early burnt and late burnt blocks between May 1999 and February
2000 were assessed.
A three-factor ANOVA was used to examine differences between fire treatments, with
three levels (unburnt, early and late dry season burnt); soil treatment, with two levels
(untreated and heated); and season of soil collection, which was a repeated measures
factor, with four levels (early, mid and late dry season 1999 and wet season 2000).
Cochran’s test was used to assess homogeneity of variances and all problems were
resolved by either log (x +1) data transformation and/or excluding one of the four
levels of the factor “season” from the analysis.
An assessment was also made of the effect of the 1999 fires on the “active” component
of the seed bank (see Figure 5.1), through comparisons of the untreated soil samples
from control and burnt blocks. An independent t-test was performed on the control and
early burnt untreated soil seed bank collected in July 1999 (the first collection after the
early dry season fire). An independent t-test was also performed on the control and late
burnt untreated soil seed bank collected in October 1999 (the first collection after the
late dry season fire).
Separate analyses were performed for species richness per sample, total seed bank
density, native and exotic species, growth form groups and common species with at
least 5% of total seed bank abundance. Variance heterogeneity was checked using a
Cochran’s test (Underwood 1997). Significant variance heterogeneity could not be
resolved by data transformation for Glycine tomentella and Indigofera hirsuta in the
120
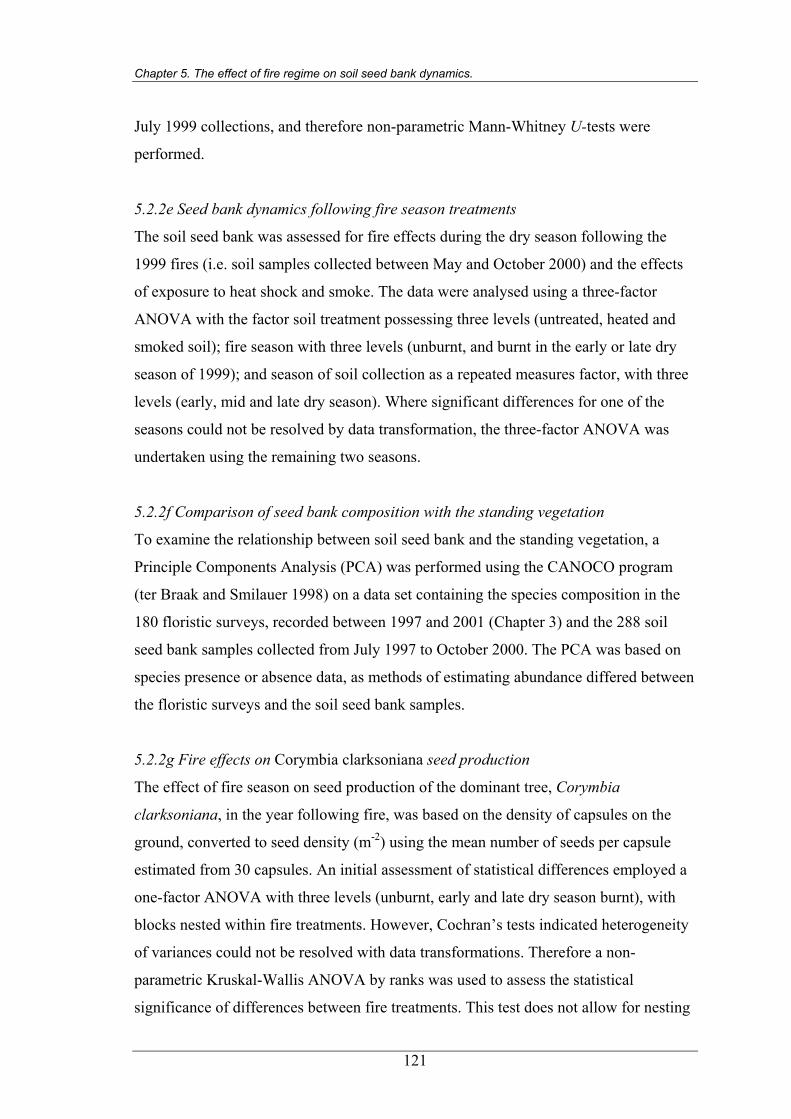
Chapter 5. The effect of fire regime on soil seed bank dynamics.
July 1999 collections, and therefore non-parametric Mann-Whitney U-tests were
performed.
5.2.2e Seed bank dynamics following fire season treatments
The soil seed bank was assessed for fire effects during the dry season following the
1999 fires (i.e. soil samples collected between May and October 2000) and the effects
of exposure to heat shock and smoke. The data were analysed using a three-factor
ANOVA with the factor soil treatment possessing three levels (untreated, heated and
smoked soil); fire season with three levels (unburnt, and burnt in the early or late dry
season of 1999); and season of soil collection as a repeated measures factor, with three
levels (early, mid and late dry season). Where significant differences for one of the
seasons could not be resolved by data transformation, the three-factor ANOVA was
undertaken using the remaining two seasons.
5.2.2f Comparison of seed bank composition with the standing vegetation
To examine the relationship between soil seed bank and the standing vegetation, a
Principle Components Analysis (PCA) was performed using the CANOCO program
(ter Braak and Smilauer 1998) on a data set containing the species composition in the
180 floristic surveys, recorded between 1997 and 2001 (Chapter 3) and the 288 soil
seed bank samples collected from July 1997 to October 2000. The PCA was based on
species presence or absence data, as methods of estimating abundance differed between
the floristic surveys and the soil seed bank samples.
5.2.2g Fire effects on Corymbia clarksoniana seed production
The effect of fire season on seed production of the dominant tree, Corymbia
clarksoniana, in the year following fire, was based on the density of capsules on the
ground, converted to seed density (m-2) using the mean number of seeds per capsule
estimated from 30 capsules. An initial assessment of statistical differences employed a
one-factor ANOVA with three levels (unburnt, early and late dry season burnt), with
blocks nested within fire treatments. However, Cochran’s tests indicated heterogeneity
of variances could not be resolved with data transformations. Therefore a non-
parametric Kruskal-Wallis ANOVA by ranks was used to assess the statistical
significance of differences between fire treatments. This test does not allow for nesting
121
Chapter 5. The effect of fire regime on soil seed bank dynamics.
of block replicates, so the 50 replicates from each 1 ha block were pooled to provide
150 replicates for each fire treatment. A Mann-Whitney U-test was used as a post-hoc
comparison, with a Bonferroni adjustment of significance level for multiple
comparisons (Sokal and Rohlf 1995).
5.3 Results
5.3.1 Seed bank dynamics pre- and post-mid dry season 1997 fire
A total of 26 species were detected in the germinable soil seed bank (henceforth
referred to as “seed bank”) collected in July 1997, and no significant differences in
species richness were detected between soil depths or with soil treatment (Figure 5.5a;
Table 5.1). Total seed bank density was greatest below 3 mm depth and more seeds
germinated from soil collected after the fire than in untreated soil collected prior to the
fire (Figure 5.5b; Table 5.1).
The results of soil treatment and differences between soil depths for species groups and
individual species are displayed in Tables 5.1 and 5.2. More seedlings of upright forbs
germinated from burnt soil than heated soil collected prior to the fire. The density of
seedling emergence of the dominant grass, Heteropogon triticeus, was significantly
higher in burnt soil compared with untreated and heated soil collected prior to the fire.
Soil heating increased the germination of ephemeral forbs as a group and the common
ephemeral Indigofera hirsuta, compared to untreated and burnt soil, but inhibited the
germination of grasses as a group and the common grass, Digitaria breviglumis.
The seed banks of native species and ephemeral forbs were significantly denser below
3 mm, while that of upright perennial forbs and grasses were significantly more
abundant at a depth of 3 to 20 mm than the surface 3 mm and 20 to 40 mm. The seed
bank of the common ephemeral forb, Indigofera hirsuta was more abundant at 20 to 40
mm than in the surface 3 mm. A significant interaction between soil treatment and soil
depth was detected for native species as a group.
122
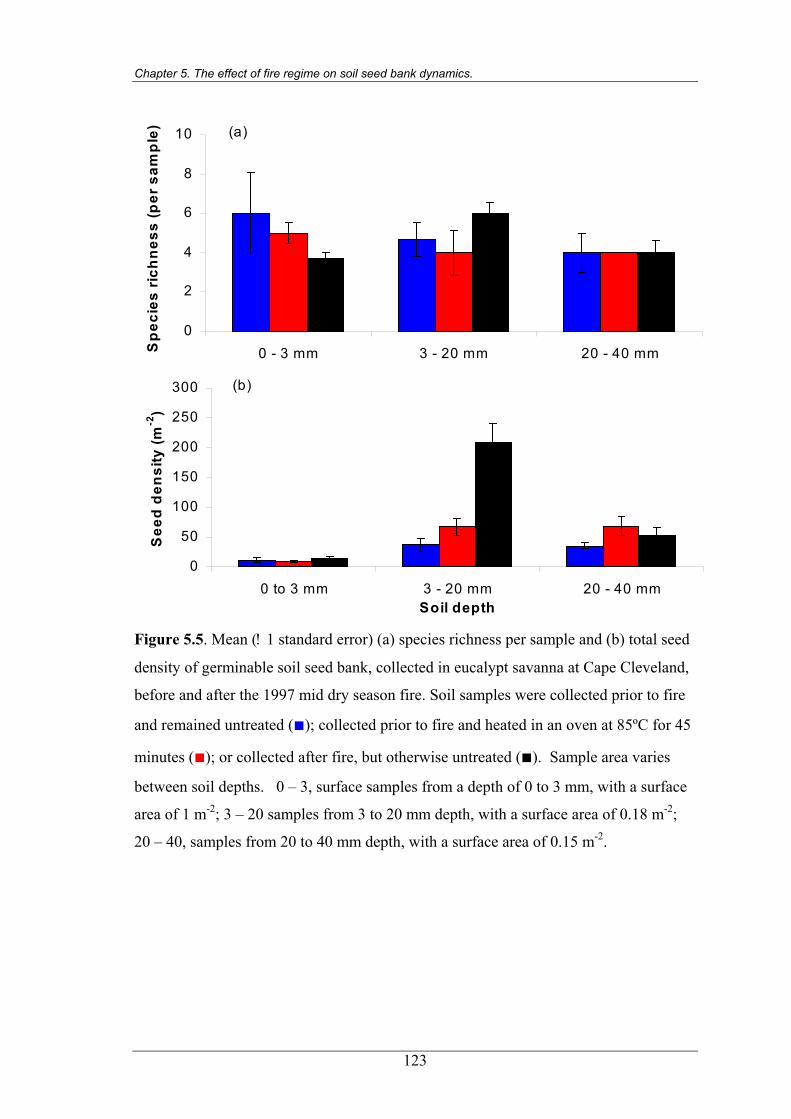
Chapter 5. The effect of fire regime on soil seed bank dynamics.
0
2
4
6
8
10
0 - 3 mm 3 - 20 mm 20 - 40 mmSp
ecie
s ri
chn
ess
(per
sam
ple
) (a)
0
50
100
150
200
250
300
0 to 3 mm 3 - 20 mm 20 - 40 mmSoil depth
See
d d
ensi
ty (m
-2)
(b)
Figure 5.5. Mean (! 1 standard error) (a) species richness per sample and (b) total seed
density of germinable soil seed bank, collected in eucalypt savanna at Cape Cleveland,
before and after the 1997 mid dry season fire. Soil samples were collected prior to fire
and remained untreated (■); collected prior to fire and heated in an oven at 85ºC for 45
minutes (■); or collected after fire, but otherwise untreated (■). Sample area varies
between soil depths. 0 – 3, surface samples from a depth of 0 to 3 mm, with a surface
area of 1 m-2; 3 – 20 samples from 3 to 20 mm depth, with a surface area of 0.18 m-2;
20 – 40, samples from 20 to 40 mm depth, with a surface area of 0.15 m-2.
123
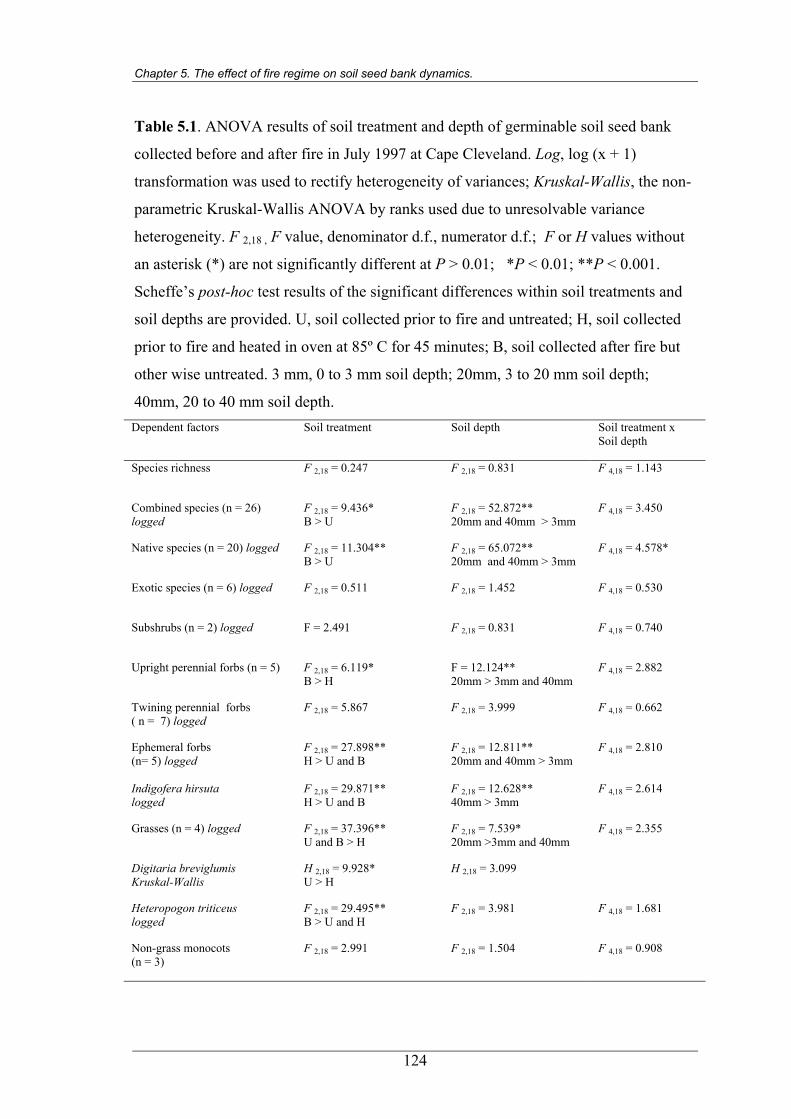
Chapter 5. The effect of fire regime on soil seed bank dynamics.
Table 5.1. ANOVA results of soil treatment and depth of germinable soil seed bank
collected before and after fire in July 1997 at Cape Cleveland. Log, log (x + 1)
transformation was used to rectify heterogeneity of variances; Kruskal-Wallis, the non-
parametric Kruskal-Wallis ANOVA by ranks used due to unresolvable variance
heterogeneity. F 2,18 , F value, denominator d.f., numerator d.f.; F or H values without
an asterisk (*) are not significantly different at P > 0.01; *P < 0.01; **P < 0.001.
Scheffe’s post-hoc test results of the significant differences within soil treatments and
soil depths are provided. U, soil collected prior to fire and untreated; H, soil collected
prior to fire and heated in oven at 85º C for 45 minutes; B, soil collected after fire but
other wise untreated. 3 mm, 0 to 3 mm soil depth; 20mm, 3 to 20 mm soil depth;
40mm, 20 to 40 mm soil depth. Dependent factors Soil treatment Soil depth Soil treatment x
Soil depth
Species richness F 2,18 = 0.247 F 2,18 = 0.831 F 4,18 = 1.143
Combined species (n = 26) logged
F 2,18 = 9.436* B > U
F 2,18 = 52.872** 20mm and 40mm > 3mm
F 4,18 = 3.450
Native species (n = 20) logged F 2,18 = 11.304** B > U
F 2,18 = 65.072** 20mm and 40mm > 3mm
F 4,18 = 4.578*
Exotic species (n = 6) logged F 2,18 = 0.511 F 2,18 = 1.452 F 4,18 = 0.530
Subshrubs (n = 2) logged F = 2.491 F 2,18 = 0.831 F 4,18 = 0.740
Upright perennial forbs (n = 5) F 2,18 = 6.119* B > H
F = 12.124** 20mm > 3mm and 40mm
F 4,18 = 2.882
Twining perennial forbs ( n = 7) logged
F 2,18 = 5.867 F 2,18 = 3.999 F 4,18 = 0.662
Ephemeral forbs (n= 5) logged
F 2,18 = 27.898** H > U and B
F 2,18 = 12.811** 20mm and 40mm > 3mm
F 4,18 = 2.810
Indigofera hirsuta logged
F 2,18 = 29.871** H > U and B
F 2,18 = 12.628** 40mm > 3mm
F 4,18 = 2.614
Grasses (n = 4) logged F 2,18 = 37.396** U and B > H
F 2,18 = 7.539* 20mm >3mm and 40mm
F 4,18 = 2.355
Digitaria breviglumis Kruskal-Wallis
H 2,18 = 9.928* U > H
H 2,18 = 3.099
Heteropogon triticeus logged
F 2,18 = 29.495** B > U and H
F 2,18 = 3.981 F 4,18 = 1.681
Non-grass monocots (n = 3)
F 2,18 = 2.991 F 2,18 = 1.504 F 4,18 = 0.908
124
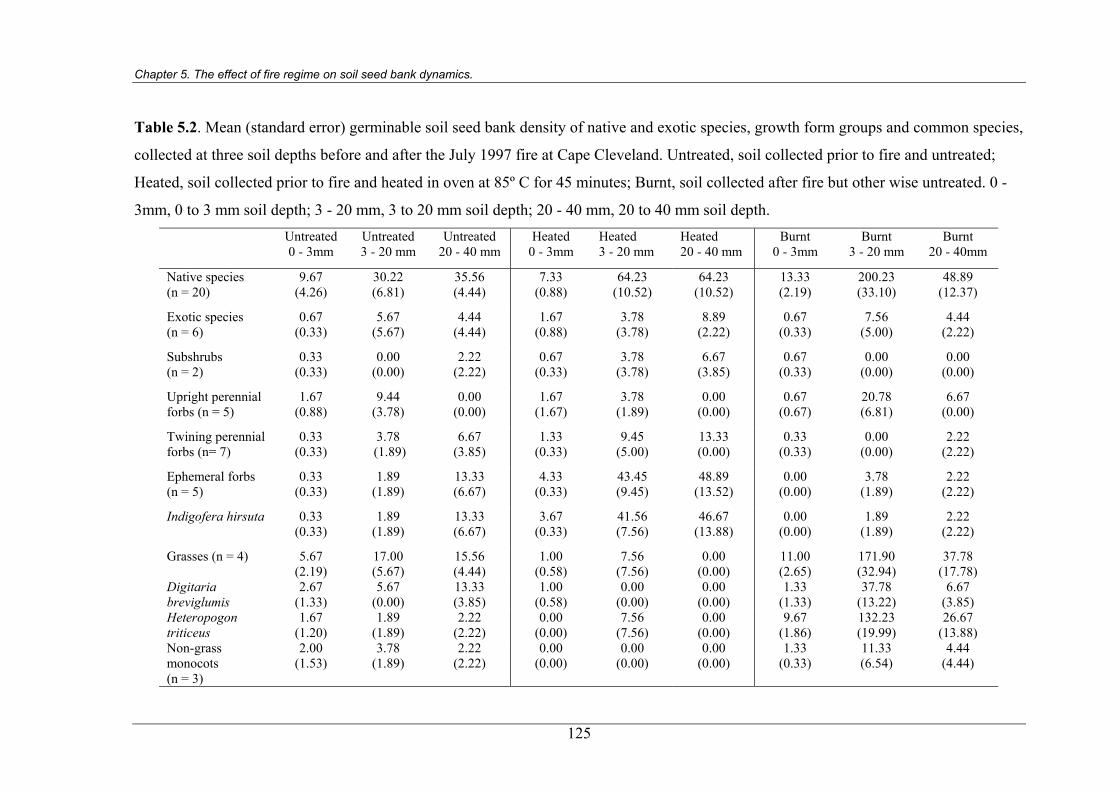
Chapter 5. The effect of fire regime on soil seed bank dynamics.
Table 5.2. Mean (standard error) germinable soil seed bank density of native and exotic species, growth form groups and common species,
collected at three soil depths before and after the July 1997 fire at Cape Cleveland. Untreated, soil collected prior to fire and untreated;
Heated, soil collected prior to fire and heated in oven at 85º C for 45 minutes; Burnt, soil collected after fire but other wise untreated. 0 -
3mm, 0 to 3 mm soil depth; 3 - 20 mm, 3 to 20 mm soil depth; 20 - 40 mm, 20 to 40 mm soil depth. Untreated
0 - 3mm Untreated
3 - 20 mm Untreated
20 - 40 mm Heated
0 - 3mm Heated 3 - 20 mm
Heated 20 - 40 mm
Burnt 0 - 3mm
Burnt 3 - 20 mm
Burnt 20 - 40mm
Native species (n = 20)
9.67 (4.26)
30.22 (6.81)
35.56 (4.44)
7.33 (0.88)
64.23 (10.52)
64.23 (10.52)
13.33 (2.19)
200.23 (33.10)
48.89 (12.37)
Exotic species (n = 6)
0.67 (0.33)
5.67 (5.67)
4.44 (4.44)
1.67 (0.88)
3.78 (3.78)
8.89 (2.22)
0.67 (0.33)
7.56 (5.00)
4.44 (2.22)
Subshrubs (n = 2)
0.33 (0.33)
0.00 (0.00)
2.22 (2.22)
0.67 (0.33)
3.78 (3.78)
6.67 (3.85)
0.67 (0.33)
0.00 (0.00)
0.00 (0.00)
Upright perennial forbs (n = 5)
1.67 (0.88)
9.44 (3.78)
0.00 (0.00)
1.67 (1.67)
3.78 (1.89)
0.00 (0.00)
0.67 (0.67)
20.78 (6.81)
6.67 (0.00)
Twining perennial forbs (n= 7)
0.33 (0.33)
3.78 (1.89)
6.67 (3.85)
1.33 (0.33)
9.45 (5.00)
13.33 (0.00)
0.33 (0.33)
0.00 (0.00)
2.22 (2.22)
Ephemeral forbs (n = 5)
0.33 (0.33)
1.89 (1.89)
13.33 (6.67)
4.33 (0.33)
43.45 (9.45)
48.89 (13.52)
0.00 (0.00)
3.78 (1.89)
2.22 (2.22)
Indigofera hirsuta 0.33 (0.33)
1.89 (1.89)
13.33 (6.67)
3.67 (0.33)
41.56 (7.56)
46.67 (13.88)
0.00 (0.00)
1.89 (1.89)
2.22 (2.22)
Grasses (n = 4) 5.67 (2.19)
17.00 (5.67)
15.56 (4.44)
1.00 (0.58)
7.56 (7.56)
0.00 (0.00)
11.00 (2.65)
171.90 (32.94)
37.78 (17.78)
Digitaria breviglumis
2.67 (1.33)
5.67 (0.00)
13.33 (3.85)
1.00 (0.58)
0.00 (0.00)
0.00 (0.00)
1.33 (1.33)
37.78 (13.22)
6.67 (3.85)
Heteropogon triticeus
1.67 (1.20)
1.89 (1.89)
2.22 (2.22)
0.00 (0.00)
7.56 (7.56)
0.00 (0.00)
9.67 (1.86)
132.23 (19.99)
26.67 (13.88)
Non-grass monocots (n = 3)
2.00 (1.53)
3.78 (1.89)
2.22 (2.22)
0.00 (0.00)
0.00 (0.00)
0.00 (0.00)
1.33 (0.33)
11.33 (6.54)
4.44 (4.44)
125
Chapter 5. The effect of fire regime on soil seed bank dynamics.
5.3.2 Seasonal and annual fluctuations in soil seed bank with time since fire
Seasonal and annual fluctuations were detected in the seed bank in the first three years
following the mid dry season fire of 1997, and soil heating increased the germination of
several species and species groups. Species richness of the germinants from the seed
bank was significantly increased by soil heating and was significantly higher in 1999
and 2000 than 1998 (Figure 5.6a; Table 5.3). Species richness was also higher in the
mid and late dry season compared to the wet season, and in the late dry season than in
the early dry season. Soil heating increased overall seedling numbers, and total seed
bank was higher in 1999 and 2000 than 1998 (Figure 5.6b; Table 5.3). Total seed bank
density was also higher in the mid and late dry season compared to the wet season, and
in the late dry season than in the early dry season.
The annual and seasonal fluctuations in seed bank, and the effect of soil heating on
seed germination, for individual species and species groups are presented in Tables 5.3
and 5.4a-c. The germination of subshrubs as a group, the common subshrubs,
Triumfetta rhomboidea, the common twiner, Pycnospora lutescens, ephemeral forbs as
a group and the common ephemeral forb, Indigofera hirsuta was increased by soil
heating. Soil heating did not significantly inhibit the germination of any species or
species groups.
Seed banks of native and exotic species, grasses and non-grass monocots were denser
in 1999 and 2000 than 1998, and the seed bank of ephemeral forbs was more abundant
in 2000 than 1998.
The seed bank of native species was greater in the mid and late dry seasons compared
to the wet season, and in the late dry season than in the early dry season. Seed banks of
exotic species and grasses were more abundant in the late dry season than the wet
season. Seed bank density of T. rhomboidea was greater in the mid and late dry seasons
than the wet season, and in the late dry season than in the early and mid dry seasons.
Seed banks of twining perennial forbs and the dominant grass, Heteropogon triticeus,
were greater in the mid dry season than the wet season. The non-grass monocot seed
bank was greater in the late dry season than the wet and early dry seasons.
126

Chapter 5. The effect of fire regime on soil seed bank dynamics.
0
5
10
15
20
Wet
Early MidLate
Wet
Early MidLate
Wet
Early MidLateS
pec
ies
rich
nes
s (p
er s
amp
le) (a)
0
200
400
600
800
1000
W et Early Mid Late W et Early Mid Late W et Early Mid Late
Season
See
d d
ensi
ty (m
-2)
1998 1999 2000
(b)
Figure 5.6. Mean (! 1 standard error) (a) species richness per sample and (b) total seed
density of germinable soil seed bank, collected in eucalypt savanna at Cape Cleveland,
between February 1998 and October 2000, in sites last burnt in July 1997. Soil samples remained untreated (■); or were heated in an oven at 85ºC for 45 minutes (■). Sample
area equals 0.05 m-2 in February 1998 and 0.08 m-2 for all other samples. Soil samples
collected in four seasons of each year: Wet, mid wet season, i.e. February; Early, early
dry season, i.e. May; Mid, mid dry season, i.e. July; Late, late dry season, i.e. October.
127
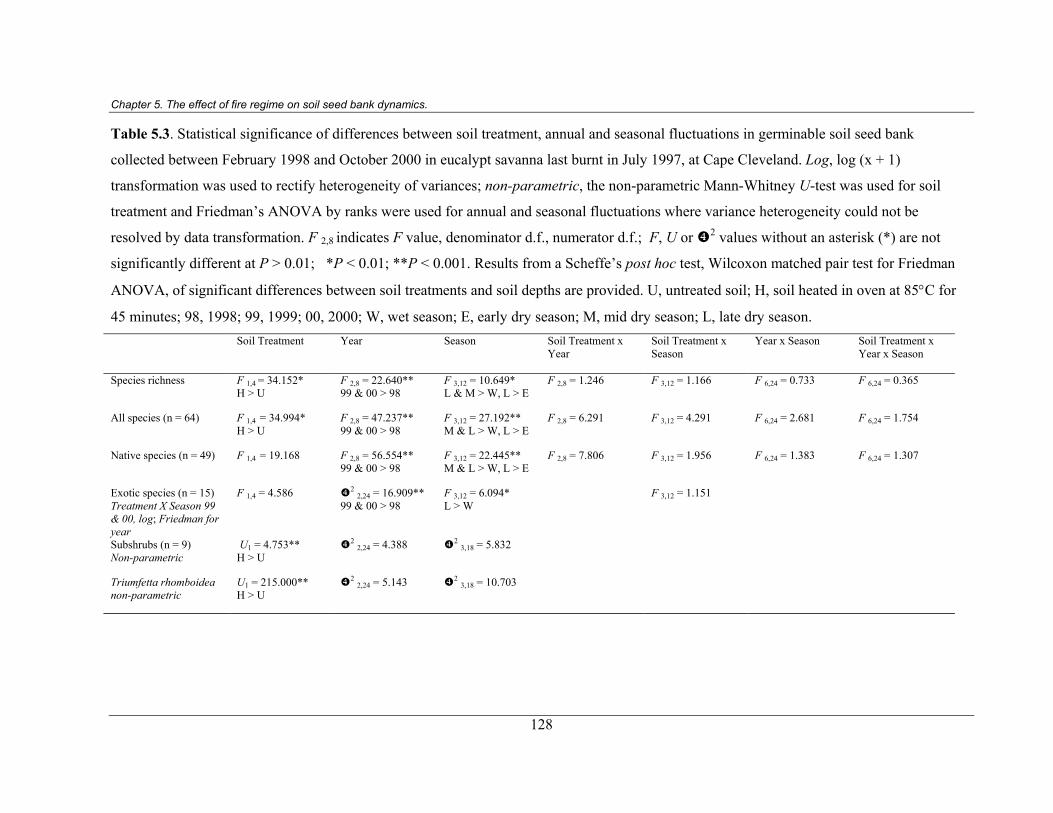
Chapter 5. The effect of fire regime on soil seed bank dynamics.
128
Table 5.3. Statistical significance of differences between soil treatment, annual and seasonal fluctuations in germinable soil seed bank
collected between February 1998 and October 2000 in eucalypt savanna last burnt in July 1997, at Cape Cleveland. Log, log (x + 1)
transformation was used to rectify heterogeneity of variances; non-parametric, the non-parametric Mann-Whitney U-test was used for soil
treatment and Friedman’s ANOVA by ranks were used for annual and seasonal fluctuations where variance heterogeneity could not be
resolved by data transformation. F 2,8 indicates F value, denominator d.f., numerator d.f.; F, U or 2 values without an asterisk (*) are not
significantly different at P > 0.01; *P < 0.01; **P < 0.001. Results from a Scheffe’s post hoc test, Wilcoxon matched pair test for Friedman
ANOVA, of significant differences between soil treatments and soil depths are provided. U, untreated soil; H, soil heated in oven at 85°C for
45 minutes; 98, 1998; 99, 1999; 00, 2000; W, wet season; E, early dry season; M, mid dry season; L, late dry season. Soil Treatment Year
Season
Soil Treatment x Year
Soil Treatment x Season
Year x Season
Soil Treatment x Year x Season
Species richness F 1,4 = 34.152* H > U
F 2,8 = 22.640** 99 & 00 > 98
F 3,12 = 10.649* L & M > W, L > E
F 2,8 = 1.246 F 3,12 = 1.166 F 6,24 = 0.733 F 6,24 = 0.365
All species (n = 64) F 1,4 = 34.994* H > U
F 2,8 = 47.237** 99 & 00 > 98
F 3,12 = 27.192** M & L > W, L > E
F 2,8 = 6.291 F 3,12 = 4.291 F 6,24 = 2.681 F 6,24 = 1.754
Native species (n = 49) F 1,4 = 19.168
F 2,8 = 56.554** 99 & 00 > 98
F 3,12 = 22.445** M & L > W, L > E
F 2,8 = 7.806 F 3,12 = 1.956 F 6,24 = 1.383 F 6,24 = 1.307
Exotic species (n = 15) Treatment X Season 99 & 00, log; Friedman for year
F 1,4 = 4.586 2 2,24 = 16.909** 99 & 00 > 98
F 3,12 = 6.094* L > W
F 3,12 = 1.151
Subshrubs (n = 9) Non-parametric
U1 = 4.753** H > U
2 2,24 = 4.388 2 3,18 = 5.832
Triumfetta rhomboidea non-parametric
U1 = 215.000** H > U
2 2,24 = 5.143 2 3,18 = 10.703
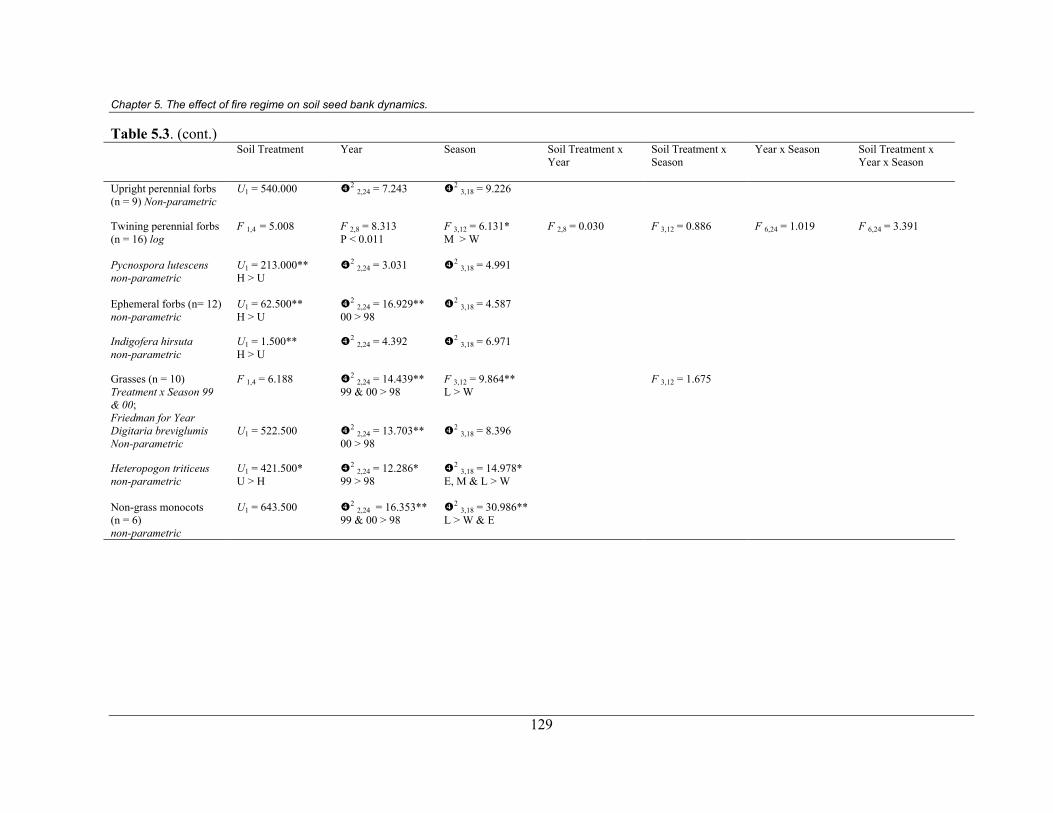
Chapter 5. The effect of fire regime on soil seed bank dynamics.
129
Table 5.3. (cont.) Soil Treatment
Year
Season Soil Treatment x Year
Soil Treatment x Season
Year x Season
Soil Treatment x Year x Season
Upright perennial forbs (n = 9) Non-parametric
U1 = 540.000 2 2,24 = 7.243
2 3,18 = 9.226
Twining perennial forbs (n = 16) log
F 1,4 = 5.008 F 2,8 = 8.313 P < 0.011
F 3,12 = 6.131* M > W
F 2,8 = 0.030 F 3,12 = 0.886 F 6,24 = 1.019 F 6,24 = 3.391
Pycnospora lutescens non-parametric
U1 = 213.000** H > U
2 2,24 = 3.031 2 3,18 = 4.991
Ephemeral forbs (n= 12) non-parametric
U1 = 62.500** H > U
2 2,24 = 16.929** 00 > 98
2 3,18 = 4.587
Indigofera hirsuta non-parametric
U1 = 1.500** H > U
2 2,24 = 4.392 2 3,18 = 6.971
Grasses (n = 10) Treatment x Season 99 & 00; Friedman for Year
F 1,4 = 6.188 2 2,24 = 14.439** 99 & 00 > 98
F 3,12 = 9.864** L > W
F 3,12 = 1.675
Digitaria breviglumis Non-parametric
U1 = 522.500 2 2,24 = 13.703** 00 > 98
2 3,18 = 8.396
Heteropogon triticeus non-parametric
U1 = 421.500* U > H
2 2,24 = 12.286* 99 > 98
2 3,18 = 14.978* E, M & L > W
Non-grass monocots (n = 6) non-parametric
U1 = 643.500 2 2,24 = 16.353** 99 & 00 > 98
2 3,18 = 30.986** L > W & E
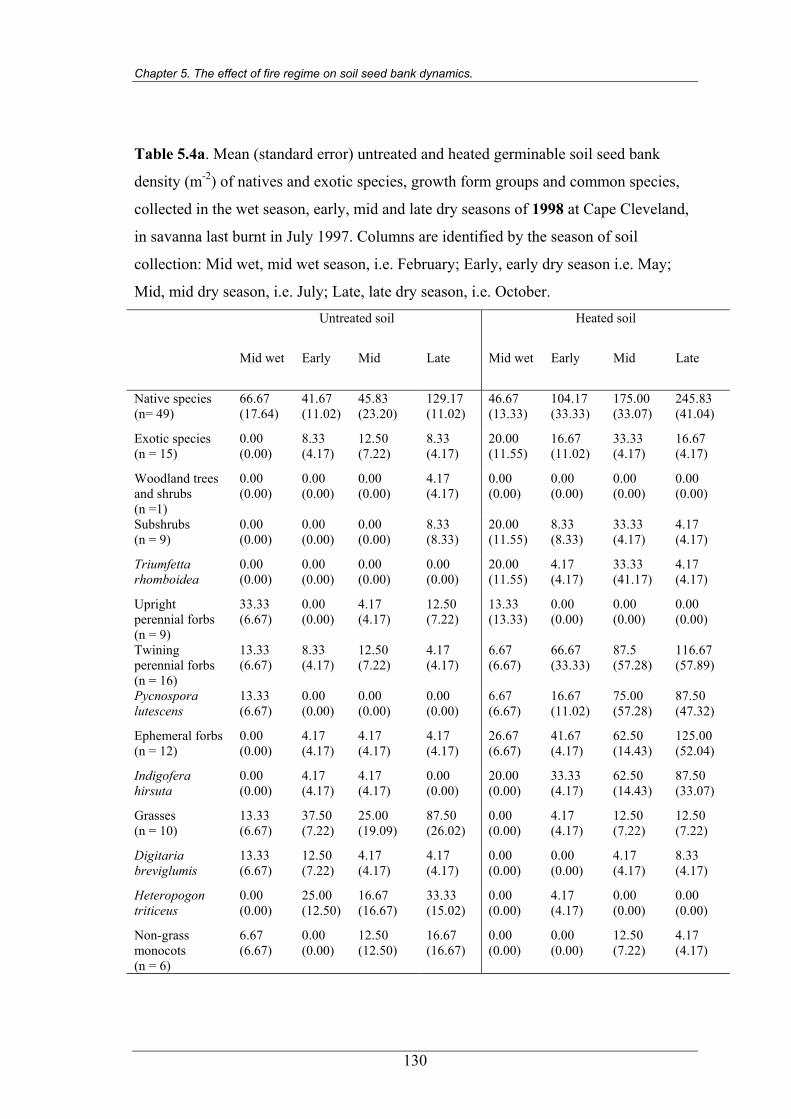
Chapter 5. The effect of fire regime on soil seed bank dynamics.
Table 5.4a. Mean (standard error) untreated and heated germinable soil seed bank
density (m-2) of natives and exotic species, growth form groups and common species,
collected in the wet season, early, mid and late dry seasons of 1998 at Cape Cleveland,
in savanna last burnt in July 1997. Columns are identified by the season of soil
collection: Mid wet, mid wet season, i.e. February; Early, early dry season i.e. May;
Mid, mid dry season, i.e. July; Late, late dry season, i.e. October. Untreated soil Heated soil
Mid wet Early Mid Late Mid wet Early Mid Late
Native species (n= 49)
66.67 (17.64)
41.67 (11.02)
45.83 (23.20)
129.17 (11.02)
46.67 (13.33)
104.17 (33.33)
175.00 (33.07)
245.83 (41.04)
Exotic species (n = 15)
0.00 (0.00)
8.33 (4.17)
12.50 (7.22)
8.33 (4.17)
20.00 (11.55)
16.67 (11.02)
33.33 (4.17)
16.67 (4.17)
Woodland trees and shrubs (n =1)
0.00 (0.00)
0.00 (0.00)
0.00 (0.00)
4.17 (4.17)
0.00 (0.00)
0.00 (0.00)
0.00 (0.00)
0.00 (0.00)
Subshrubs (n = 9)
0.00 (0.00)
0.00 (0.00)
0.00 (0.00)
8.33 (8.33)
20.00 (11.55)
8.33 (8.33)
33.33 (4.17)
4.17 (4.17)
Triumfetta rhomboidea
0.00 (0.00)
0.00 (0.00)
0.00 (0.00)
0.00 (0.00)
20.00 (11.55)
4.17 (4.17)
33.33 (41.17)
4.17 (4.17)
Upright perennial forbs (n = 9)
33.33 (6.67)
0.00 (0.00)
4.17 (4.17)
12.50 (7.22)
13.33 (13.33)
0.00 (0.00)
0.00 (0.00)
0.00 (0.00)
Twining perennial forbs (n = 16)
13.33 (6.67)
8.33 (4.17)
12.50 (7.22)
4.17 (4.17)
6.67 (6.67)
66.67 (33.33)
87.5 (57.28)
116.67 (57.89)
Pycnospora lutescens
13.33 (6.67)
0.00 (0.00)
0.00 (0.00)
0.00 (0.00)
6.67 (6.67)
16.67 (11.02)
75.00 (57.28)
87.50 (47.32)
Ephemeral forbs (n = 12)
0.00 (0.00)
4.17 (4.17)
4.17 (4.17)
4.17 (4.17)
26.67 (6.67)
41.67 (4.17)
62.50 (14.43)
125.00 (52.04)
Indigofera hirsuta
0.00 (0.00)
4.17 (4.17)
4.17 (4.17)
0.00 (0.00)
20.00 (0.00)
33.33 (4.17)
62.50 (14.43)
87.50 (33.07)
Grasses (n = 10)
13.33 (6.67)
37.50 (7.22)
25.00 (19.09)
87.50 (26.02)
0.00 (0.00)
4.17 (4.17)
12.50 (7.22)
12.50 (7.22)
Digitaria breviglumis
13.33 (6.67)
12.50 (7.22)
4.17 (4.17)
4.17 (4.17)
0.00 (0.00)
0.00 (0.00)
4.17 (4.17)
8.33 (4.17)
Heteropogon triticeus
0.00 (0.00)
25.00 (12.50)
16.67 (16.67)
33.33 (15.02)
0.00 (0.00)
4.17 (4.17)
0.00 (0.00)
0.00 (0.00)
Non-grass monocots (n = 6)
6.67 (6.67)
0.00 (0.00)
12.50 (12.50)
16.67 (16.67)
0.00 (0.00)
0.00 (0.00)
12.50 (7.22)
4.17 (4.17)
130
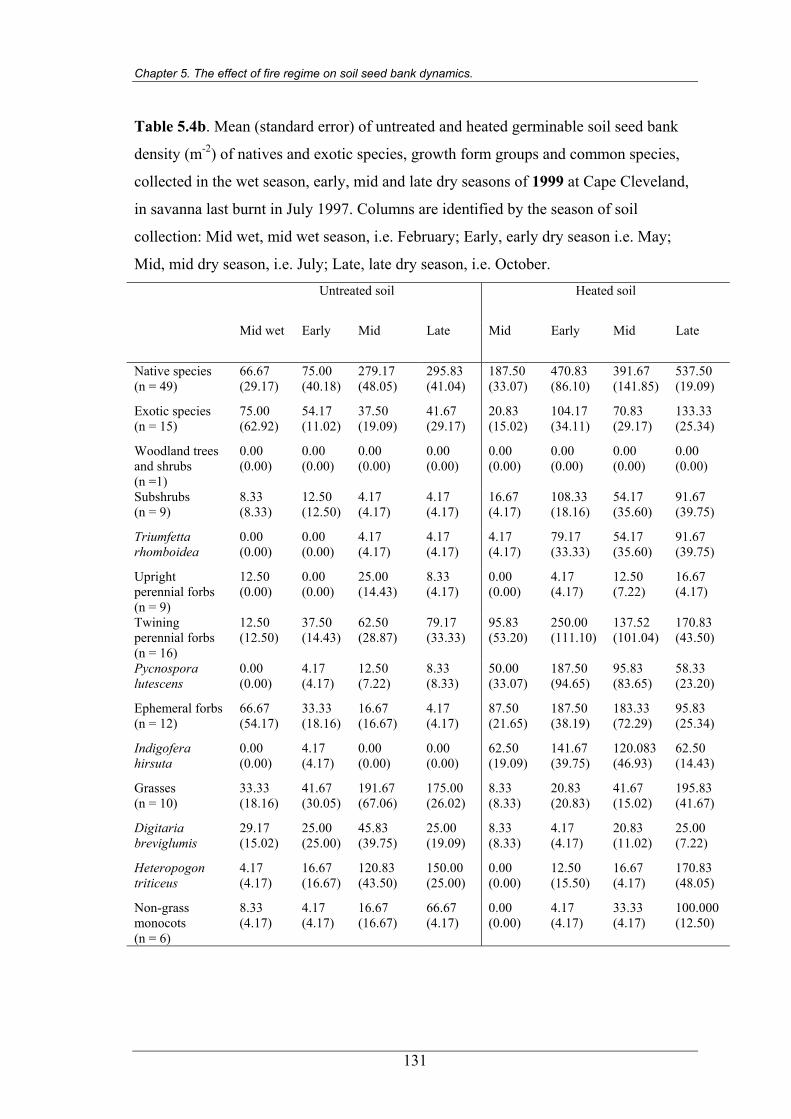
Chapter 5. The effect of fire regime on soil seed bank dynamics.
Table 5.4b. Mean (standard error) of untreated and heated germinable soil seed bank
density (m-2) of natives and exotic species, growth form groups and common species,
collected in the wet season, early, mid and late dry seasons of 1999 at Cape Cleveland,
in savanna last burnt in July 1997. Columns are identified by the season of soil
collection: Mid wet, mid wet season, i.e. February; Early, early dry season i.e. May;
Mid, mid dry season, i.e. July; Late, late dry season, i.e. October. Untreated soil Heated soil
Mid wet Early Mid Late Mid Early Mid Late
Native species (n = 49)
66.67 (29.17)
75.00 (40.18)
279.17 (48.05)
295.83 (41.04)
187.50 (33.07)
470.83 (86.10)
391.67 (141.85)
537.50 (19.09)
Exotic species (n = 15)
75.00 (62.92)
54.17 (11.02)
37.50 (19.09)
41.67 (29.17)
20.83 (15.02)
104.17 (34.11)
70.83 (29.17)
133.33 (25.34)
Woodland trees and shrubs (n =1)
0.00 (0.00)
0.00 (0.00)
0.00 (0.00)
0.00 (0.00)
0.00 (0.00)
0.00 (0.00)
0.00 (0.00)
0.00 (0.00)
Subshrubs (n = 9)
8.33 (8.33)
12.50 (12.50)
4.17 (4.17)
4.17 (4.17)
16.67 (4.17)
108.33 (18.16)
54.17 (35.60)
91.67 (39.75)
Triumfetta rhomboidea
0.00 (0.00)
0.00 (0.00)
4.17 (4.17)
4.17 (4.17)
4.17 (4.17)
79.17 (33.33)
54.17 (35.60)
91.67 (39.75)
Upright perennial forbs (n = 9)
12.50 (0.00)
0.00 (0.00)
25.00 (14.43)
8.33 (4.17)
0.00 (0.00)
4.17 (4.17)
12.50 (7.22)
16.67 (4.17)
Twining perennial forbs (n = 16)
12.50 (12.50)
37.50 (14.43)
62.50 (28.87)
79.17 (33.33)
95.83 (53.20)
250.00 (111.10)
137.52 (101.04)
170.83 (43.50)
Pycnospora lutescens
0.00 (0.00)
4.17 (4.17)
12.50 (7.22)
8.33 (8.33)
50.00 (33.07)
187.50 (94.65)
95.83 (83.65)
58.33 (23.20)
Ephemeral forbs (n = 12)
66.67 (54.17)
33.33 (18.16)
16.67 (16.67)
4.17 (4.17)
87.50 (21.65)
187.50 (38.19)
183.33 (72.29)
95.83 (25.34)
Indigofera hirsuta
0.00 (0.00)
4.17 (4.17)
0.00 (0.00)
0.00 (0.00)
62.50 (19.09)
141.67 (39.75)
120.083 (46.93)
62.50 (14.43)
Grasses (n = 10)
33.33 (18.16)
41.67 (30.05)
191.67 (67.06)
175.00 (26.02)
8.33 (8.33)
20.83 (20.83)
41.67 (15.02)
195.83 (41.67)
Digitaria breviglumis
29.17 (15.02)
25.00 (25.00)
45.83 (39.75)
25.00 (19.09)
8.33 (8.33)
4.17 (4.17)
20.83 (11.02)
25.00 (7.22)
Heteropogon triticeus
4.17 (4.17)
16.67 (16.67)
120.83 (43.50)
150.00 (25.00)
0.00 (0.00)
12.50 (15.50)
16.67 (4.17)
170.83 (48.05)
Non-grass monocots (n = 6)
8.33 (4.17)
4.17 (4.17)
16.67 (16.67)
66.67 (4.17)
0.00 (0.00)
4.17 (4.17)
33.33 (4.17)
100.000 (12.50)
131
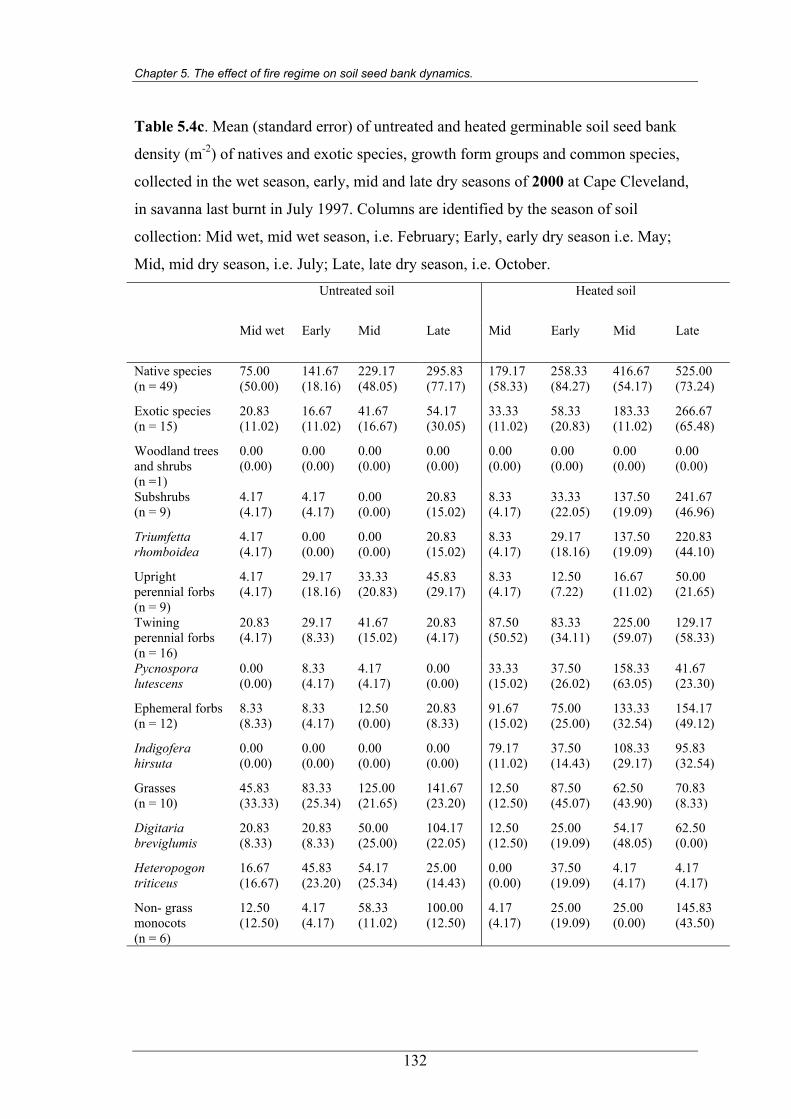
Chapter 5. The effect of fire regime on soil seed bank dynamics.
Table 5.4c. Mean (standard error) of untreated and heated germinable soil seed bank
density (m-2) of natives and exotic species, growth form groups and common species,
collected in the wet season, early, mid and late dry seasons of 2000 at Cape Cleveland,
in savanna last burnt in July 1997. Columns are identified by the season of soil
collection: Mid wet, mid wet season, i.e. February; Early, early dry season i.e. May;
Mid, mid dry season, i.e. July; Late, late dry season, i.e. October. Untreated soil Heated soil
Mid wet Early Mid Late Mid Early Mid Late
Native species (n = 49)
75.00 (50.00)
141.67 (18.16)
229.17 (48.05)
295.83 (77.17)
179.17 (58.33)
258.33 (84.27)
416.67 (54.17)
525.00 (73.24)
Exotic species (n = 15)
20.83 (11.02)
16.67 (11.02)
41.67 (16.67)
54.17 (30.05)
33.33 (11.02)
58.33 (20.83)
183.33 (11.02)
266.67 (65.48)
Woodland trees and shrubs (n =1)
0.00 (0.00)
0.00 (0.00)
0.00 (0.00)
0.00 (0.00)
0.00 (0.00)
0.00 (0.00)
0.00 (0.00)
0.00 (0.00)
Subshrubs (n = 9)
4.17 (4.17)
4.17 (4.17)
0.00 (0.00)
20.83 (15.02)
8.33 (4.17)
33.33 (22.05)
137.50 (19.09)
241.67 (46.96)
Triumfetta rhomboidea
4.17 (4.17)
0.00 (0.00)
0.00 (0.00)
20.83 (15.02)
8.33 (4.17)
29.17 (18.16)
137.50 (19.09)
220.83 (44.10)
Upright perennial forbs (n = 9)
4.17 (4.17)
29.17 (18.16)
33.33 (20.83)
45.83 (29.17)
8.33 (4.17)
12.50 (7.22)
16.67 (11.02)
50.00 (21.65)
Twining perennial forbs (n = 16)
20.83 (4.17)
29.17 (8.33)
41.67 (15.02)
20.83 (4.17)
87.50 (50.52)
83.33 (34.11)
225.00 (59.07)
129.17 (58.33)
Pycnospora lutescens
0.00 (0.00)
8.33 (4.17)
4.17 (4.17)
0.00 (0.00)
33.33 (15.02)
37.50 (26.02)
158.33 (63.05)
41.67 (23.30)
Ephemeral forbs (n = 12)
8.33 (8.33)
8.33 (4.17)
12.50 (0.00)
20.83 (8.33)
91.67 (15.02)
75.00 (25.00)
133.33 (32.54)
154.17 (49.12)
Indigofera hirsuta
0.00 (0.00)
0.00 (0.00)
0.00 (0.00)
0.00 (0.00)
79.17 (11.02)
37.50 (14.43)
108.33 (29.17)
95.83 (32.54)
Grasses (n = 10)
45.83 (33.33)
83.33 (25.34)
125.00 (21.65)
141.67 (23.20)
12.50 (12.50)
87.50 (45.07)
62.50 (43.90)
70.83 (8.33)
Digitaria breviglumis
20.83 (8.33)
20.83 (8.33)
50.00 (25.00)
104.17 (22.05)
12.50 (12.50)
25.00 (19.09)
54.17 (48.05)
62.50 (0.00)
Heteropogon triticeus
16.67 (16.67)
45.83 (23.20)
54.17 (25.34)
25.00 (14.43)
0.00 (0.00)
37.50 (19.09)
4.17 (4.17)
4.17 (4.17)
Non- grass monocots (n = 6)
12.50 (12.50)
4.17 (4.17)
58.33 (11.02)
100.00 (12.50)
4.17 (4.17)
25.00 (19.09)
25.00 (0.00)
145.83 (43.50)
132
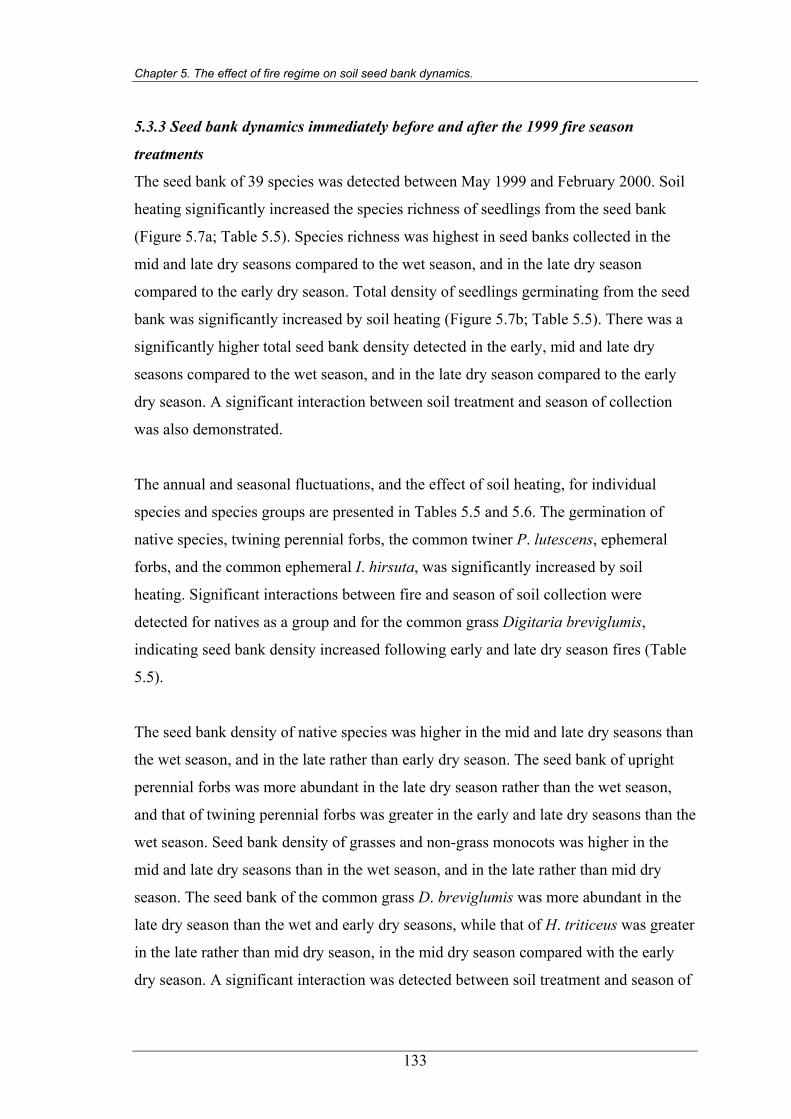
Chapter 5. The effect of fire regime on soil seed bank dynamics.
5.3.3 Seed bank dynamics immediately before and after the 1999 fire season
treatments
The seed bank of 39 species was detected between May 1999 and February 2000. Soil
heating significantly increased the species richness of seedlings from the seed bank
(Figure 5.7a; Table 5.5). Species richness was highest in seed banks collected in the
mid and late dry seasons compared to the wet season, and in the late dry season
compared to the early dry season. Total density of seedlings germinating from the seed
bank was significantly increased by soil heating (Figure 5.7b; Table 5.5). There was a
significantly higher total seed bank density detected in the early, mid and late dry
seasons compared to the wet season, and in the late dry season compared to the early
dry season. A significant interaction between soil treatment and season of collection
was also demonstrated.
The annual and seasonal fluctuations, and the effect of soil heating, for individual
species and species groups are presented in Tables 5.5 and 5.6. The germination of
native species, twining perennial forbs, the common twiner P. lutescens, ephemeral
forbs, and the common ephemeral I. hirsuta, was significantly increased by soil
heating. Significant interactions between fire and season of soil collection were
detected for natives as a group and for the common grass Digitaria breviglumis,
indicating seed bank density increased following early and late dry season fires (Table
5.5).
The seed bank density of native species was higher in the mid and late dry seasons than
the wet season, and in the late rather than early dry season. The seed bank of upright
perennial forbs was more abundant in the late dry season rather than the wet season,
and that of twining perennial forbs was greater in the early and late dry seasons than the
wet season. Seed bank density of grasses and non-grass monocots was higher in the
mid and late dry seasons than in the wet season, and in the late rather than mid dry
season. The seed bank of the common grass D. breviglumis was more abundant in the
late dry season than the wet and early dry seasons, while that of H. triticeus was greater
in the late rather than mid dry season, in the mid dry season compared with the early
dry season. A significant interaction was detected between soil treatment and season of
133
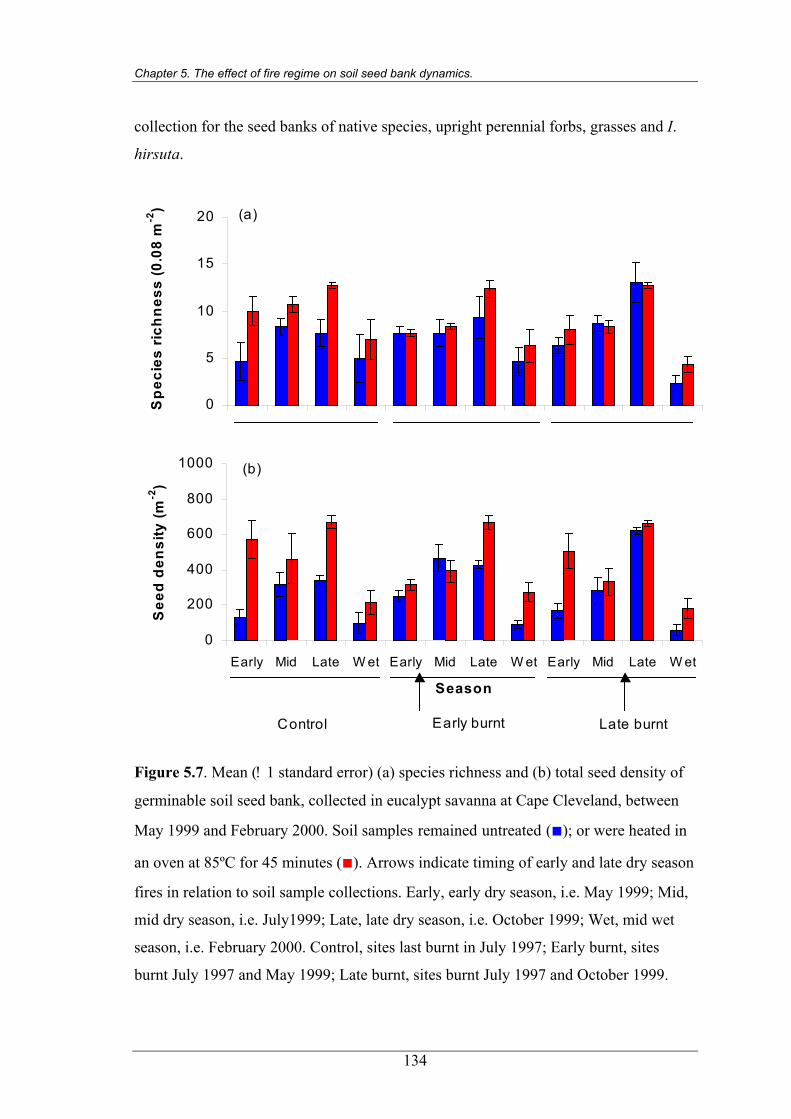
Chapter 5. The effect of fire regime on soil seed bank dynamics.
collection for the seed banks of native species, upright perennial forbs, grasses and I.
hirsuta.
0
5
10
15
20
1 2 3 4 5 6 7 8 9 10 11 12
Sp
ecie
s ri
chn
ess
(0.0
8 m
-2) (a)
0
200
400
600
800
1000
Early Mid Late W et Early Mid Late W et Early Mid Late W et
Season
See
d d
ensi
ty (m
-2)
Control Early burnt Late burnt
(b)
Figure 5.7. Mean (! 1 standard error) (a) species richness and (b) total seed density of
germinable soil seed bank, collected in eucalypt savanna at Cape Cleveland, between
May 1999 and February 2000. Soil samples remained untreated (■); or were heated in
an oven at 85ºC for 45 minutes (■). Arrows indicate timing of early and late dry season
fires in relation to soil sample collections. Early, early dry season, i.e. May 1999; Mid,
mid dry season, i.e. July1999; Late, late dry season, i.e. October 1999; Wet, mid wet
season, i.e. February 2000. Control, sites last burnt in July 1997; Early burnt, sites
burnt July 1997 and May 1999; Late burnt, sites burnt July 1997 and October 1999.
134
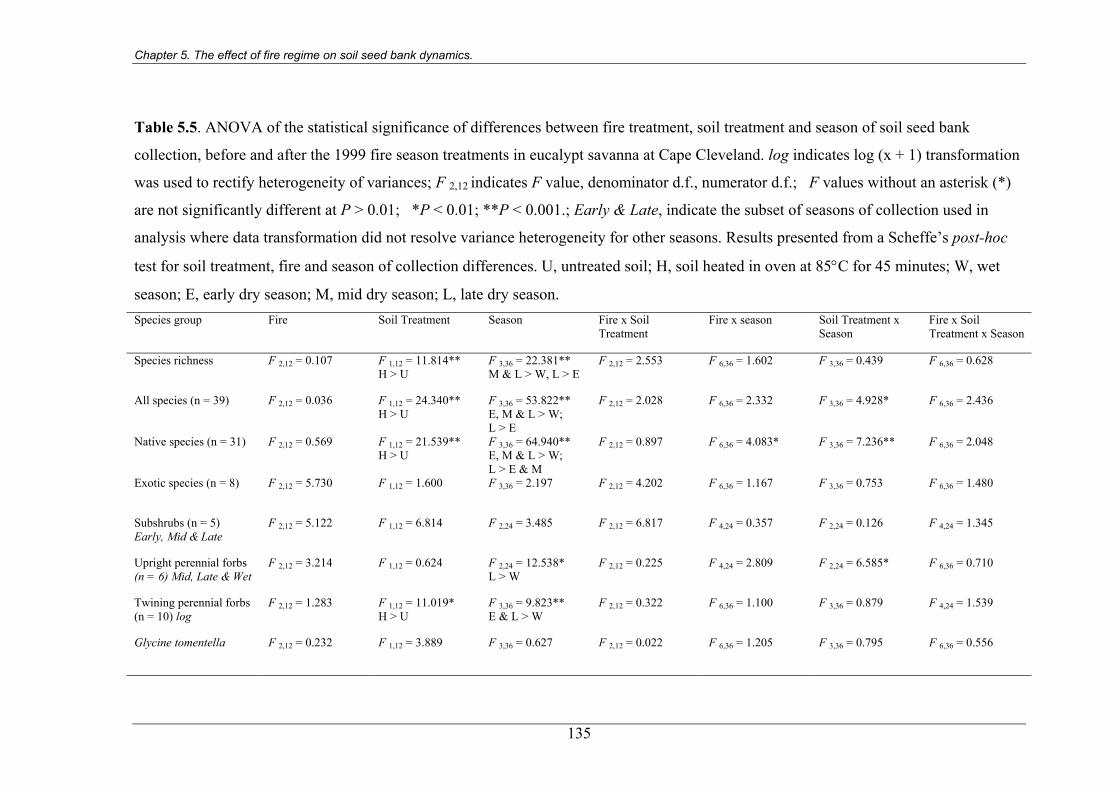
Chapter 5. The effect of fire regime on soil seed bank dynamics.
Table 5.5. ANOVA of the statistical significance of differences between fire treatment, soil treatment and season of soil seed bank
collection, before and after the 1999 fire season treatments in eucalypt savanna at Cape Cleveland. log indicates log (x + 1) transformation
was used to rectify heterogeneity of variances; F 2,12 indicates F value, denominator d.f., numerator d.f.; F values without an asterisk (*)
are not significantly different at P > 0.01; *P < 0.01; **P < 0.001.; Early & Late, indicate the subset of seasons of collection used in
analysis where data transformation did not resolve variance heterogeneity for other seasons. Results presented from a Scheffe’s post-hoc
test for soil treatment, fire and season of collection differences. U, untreated soil; H, soil heated in oven at 85°C for 45 minutes; W, wet
season; E, early dry season; M, mid dry season; L, late dry season. Species group
Fire Soil Treatment Season Fire x Soil Treatment
Fire x season Soil Treatment x Season
Fire x Soil Treatment x Season
Species richness F 2,12 = 0.107 F 1,12 = 11.814** H > U
F 3,36 = 22.381** M & L > W, L > E
F 2,12 = 2.553 F 6,36 = 1.602 F 3,36 = 0.439 F 6,36 = 0.628
All species (n = 39)
F 2,12 = 0.036 F 1,12 = 24.340** H > U
F 3,36 = 53.822** E, M & L > W; L > E
F 2,12 = 2.028
F 6,36 = 2.332 F 3,36 = 4.928* F 6,36 = 2.436
Native species (n = 31) F 2,12 = 0.569 F 1,12 = 21.539** H > U
F 3,36 = 64.940** E, M & L > W; L > E & M
F 2,12 = 0.897 F 6,36 = 4.083* F 3,36 = 7.236** F 6,36 = 2.048
Exotic species (n = 8) F 2,12 = 5.730
F 1,12 = 1.600 F 3,36 = 2.197 F 2,12 = 4.202 F 6,36 = 1.167 F 3,36 = 0.753 F 6,36 = 1.480
Subshrubs (n = 5) Early, Mid & Late
F 2,12 = 5.122
F 1,12 = 6.814
F 2,24 = 3.485 F 2,12 = 6.817 F 4,24 = 0.357 F 2,24 = 0.126 F 4,24 = 1.345
Upright perennial forbs (n = 6) Mid, Late & Wet
F 2,12 = 3.214 F 1,12 = 0.624 F 2,24 = 12.538* L > W
F 2,12 = 0.225 F 4,24 = 2.809 F 2,24 = 6.585* F 6,36 = 0.710
Twining perennial forbs (n = 10) log
F 2,12 = 1.283 F 1,12 = 11.019* H > U
F 3,36 = 9.823** E & L > W
F 2,12 = 0.322 F 6,36 = 1.100 F 3,36 = 0.879 F 4,24 = 1.539
Glycine tomentella F 2,12 = 0.232 F 1,12 = 3.889 F 3,36 = 0.627 F 2,12 = 0.022 F 6,36 = 1.205
F 3,36 = 0.795 F 6,36 = 0.556
135
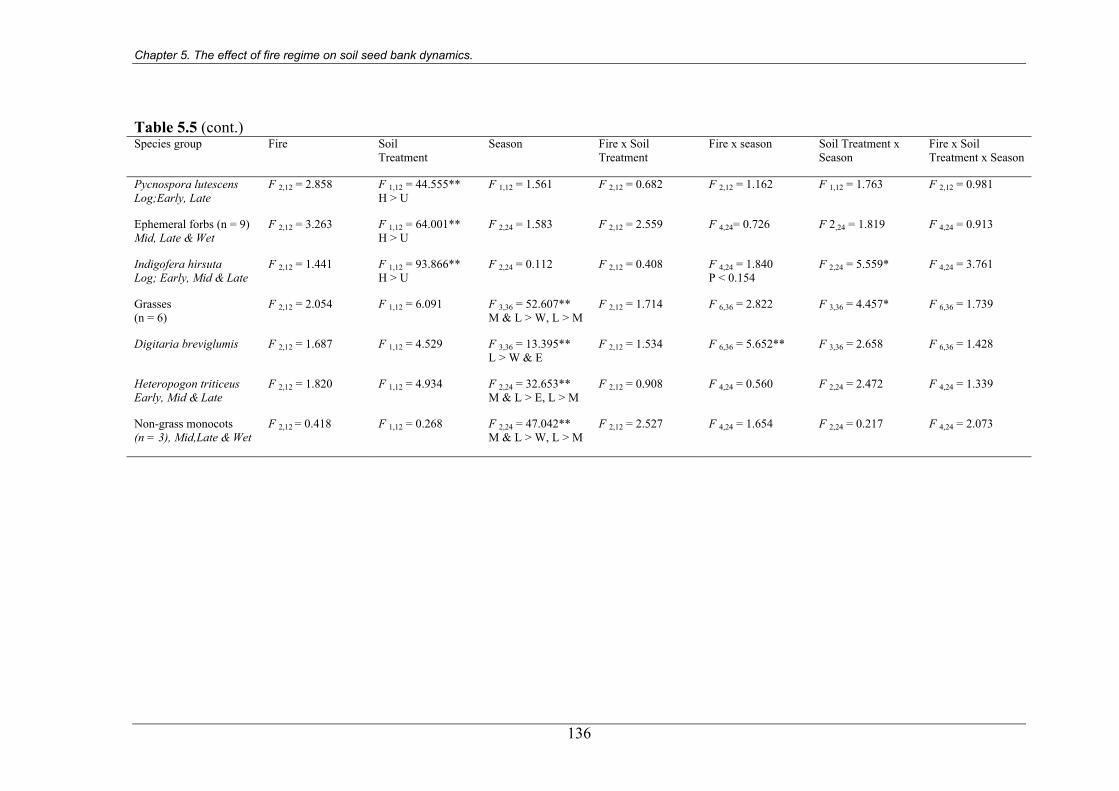
Chapter 5. The effect of fire regime on soil seed bank dynamics.
Table 5.5 (cont.) Species group
Fire Soil Treatment
Season Fire x Soil Treatment
Fire x season Soil Treatment x Season
Fire x Soil Treatment x Season
Pycnospora lutescens Log;Early, Late
F 2,12 = 2.858 F 1,12 = 44.555** H > U
F 1,12 = 1.561
F 2,12 = 0.682 F 2,12 = 1.162 F 1,12 = 1.763 F 2,12 = 0.981
Ephemeral forbs (n = 9) Mid, Late & Wet
F 2,12 = 3.263 F 1,12 = 64.001** H > U
F 2,24 = 1.583 F 2,12 = 2.559 F 4,24= 0.726 F 2,24 = 1.819 F 4,24 = 0.913
Indigofera hirsuta Log; Early, Mid & Late
F 2,12 = 1.441 F 1,12 = 93.866** H > U
F 2,24 = 0.112 F 2,12 = 0.408 F 4,24 = 1.840 P < 0.154
F 2,24 = 5.559* F 4,24 = 3.761
Grasses (n = 6)
F 2,12 = 2.054 F 1,12 = 6.091
F 3,36 = 52.607** M & L > W, L > M
F 2,12 = 1.714 F 6,36 = 2.822 F 3,36 = 4.457* F 6,36 = 1.739
Digitaria breviglumis F 2,12 = 1.687 F 1,12 = 4.529 F 3,36 = 13.395** L > W & E
F 2,12 = 1.534 F 6,36 = 5.652** F 3,36 = 2.658 F 6,36 = 1.428
Heteropogon triticeus Early, Mid & Late
F 2,12 = 1.820 F 1,12 = 4.934
F 2,24 = 32.653** M & L > E, L > M
F 2,12 = 0.908 F 4,24 = 0.560 F 2,24 = 2.472 F 4,24 = 1.339
Non-grass monocots (n = 3), Mid,Late & Wet
F 2,12 = 0.418 F 1,12 = 0.268 F 2,24 = 47.042** M & L > W, L > M
F 2,12 = 2.527 F 4,24 = 1.654 F 2,24 = 0.217 F 4,24 = 2.073
136
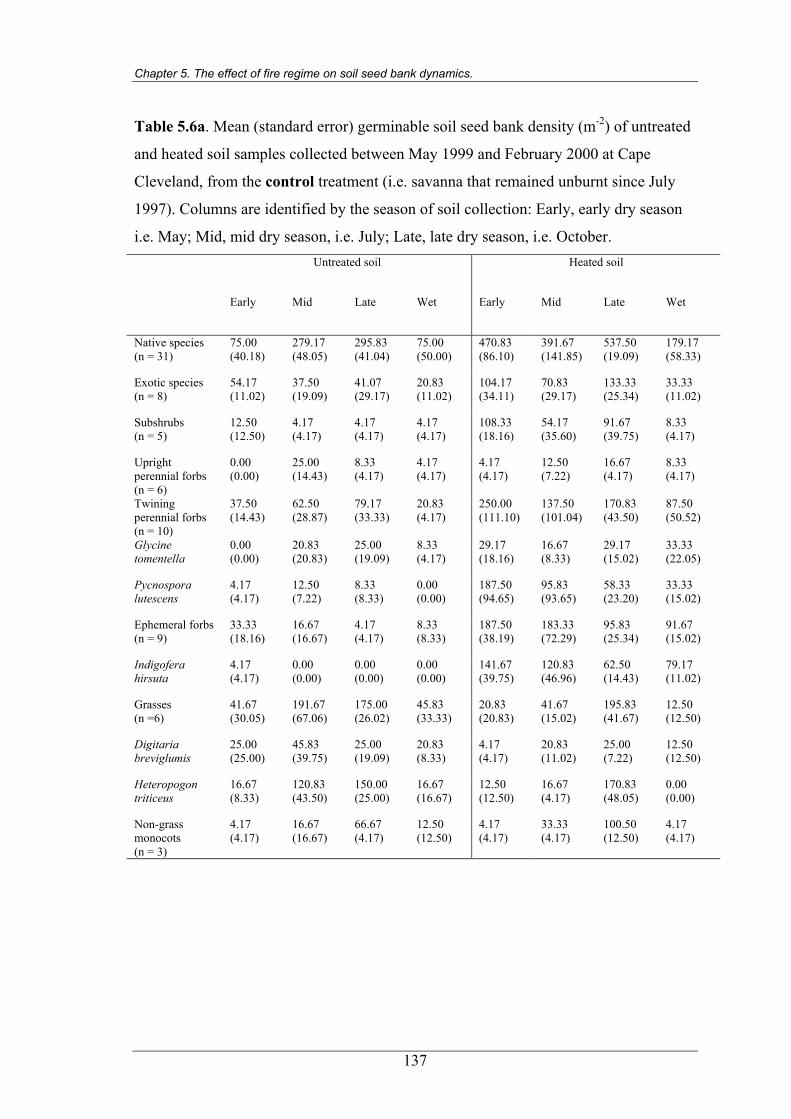
Chapter 5. The effect of fire regime on soil seed bank dynamics.
Table 5.6a. Mean (standard error) germinable soil seed bank density (m-2) of untreated
and heated soil samples collected between May 1999 and February 2000 at Cape
Cleveland, from the control treatment (i.e. savanna that remained unburnt since July
1997). Columns are identified by the season of soil collection: Early, early dry season
i.e. May; Mid, mid dry season, i.e. July; Late, late dry season, i.e. October. Untreated soil Heated soil
Early Mid Late Wet Early Mid Late Wet
Native species (n = 31)
75.00 (40.18)
279.17 (48.05)
295.83 (41.04)
75.00 (50.00)
470.83 (86.10)
391.67 (141.85)
537.50 (19.09)
179.17 (58.33)
Exotic species (n = 8)
54.17 (11.02)
37.50 (19.09)
41.07 (29.17)
20.83 (11.02)
104.17 (34.11)
70.83 (29.17)
133.33 (25.34)
33.33 (11.02)
Subshrubs (n = 5)
12.50 (12.50)
4.17 (4.17)
4.17 (4.17)
4.17 (4.17)
108.33 (18.16)
54.17 (35.60)
91.67 (39.75)
8.33 (4.17)
Upright perennial forbs (n = 6)
0.00 (0.00)
25.00 (14.43)
8.33 (4.17)
4.17 (4.17)
4.17 (4.17)
12.50 (7.22)
16.67 (4.17)
8.33 (4.17)
Twining perennial forbs (n = 10)
37.50 (14.43)
62.50 (28.87)
79.17 (33.33)
20.83 (4.17)
250.00 (111.10)
137.50 (101.04)
170.83 (43.50)
87.50 (50.52)
Glycine tomentella
0.00 (0.00)
20.83 (20.83)
25.00 (19.09)
8.33 (4.17)
29.17 (18.16)
16.67 (8.33)
29.17 (15.02)
33.33 (22.05)
Pycnospora lutescens
4.17 (4.17)
12.50 (7.22)
8.33 (8.33)
0.00 (0.00)
187.50 (94.65)
95.83 (93.65)
58.33 (23.20)
33.33 (15.02)
Ephemeral forbs (n = 9)
33.33 (18.16)
16.67 (16.67)
4.17 (4.17)
8.33 (8.33)
187.50 (38.19)
183.33 (72.29)
95.83 (25.34)
91.67 (15.02)
Indigofera hirsuta
4.17 (4.17)
0.00 (0.00)
0.00 (0.00)
0.00 (0.00)
141.67 (39.75)
120.83 (46.96)
62.50 (14.43)
79.17 (11.02)
Grasses (n =6)
41.67 (30.05)
191.67 (67.06)
175.00 (26.02)
45.83 (33.33)
20.83 (20.83)
41.67 (15.02)
195.83 (41.67)
12.50 (12.50)
Digitaria breviglumis
25.00 (25.00)
45.83 (39.75)
25.00 (19.09)
20.83 (8.33)
4.17 (4.17)
20.83 (11.02)
25.00 (7.22)
12.50 (12.50)
Heteropogon triticeus
16.67 (8.33)
120.83 (43.50)
150.00 (25.00)
16.67 (16.67)
12.50 (12.50)
16.67 (4.17)
170.83 (48.05)
0.00 (0.00)
Non-grass monocots (n = 3)
4.17 (4.17)
16.67 (16.67)
66.67 (4.17)
12.50 (12.50)
4.17 (4.17)
33.33 (4.17)
100.50 (12.50)
4.17 (4.17)
137
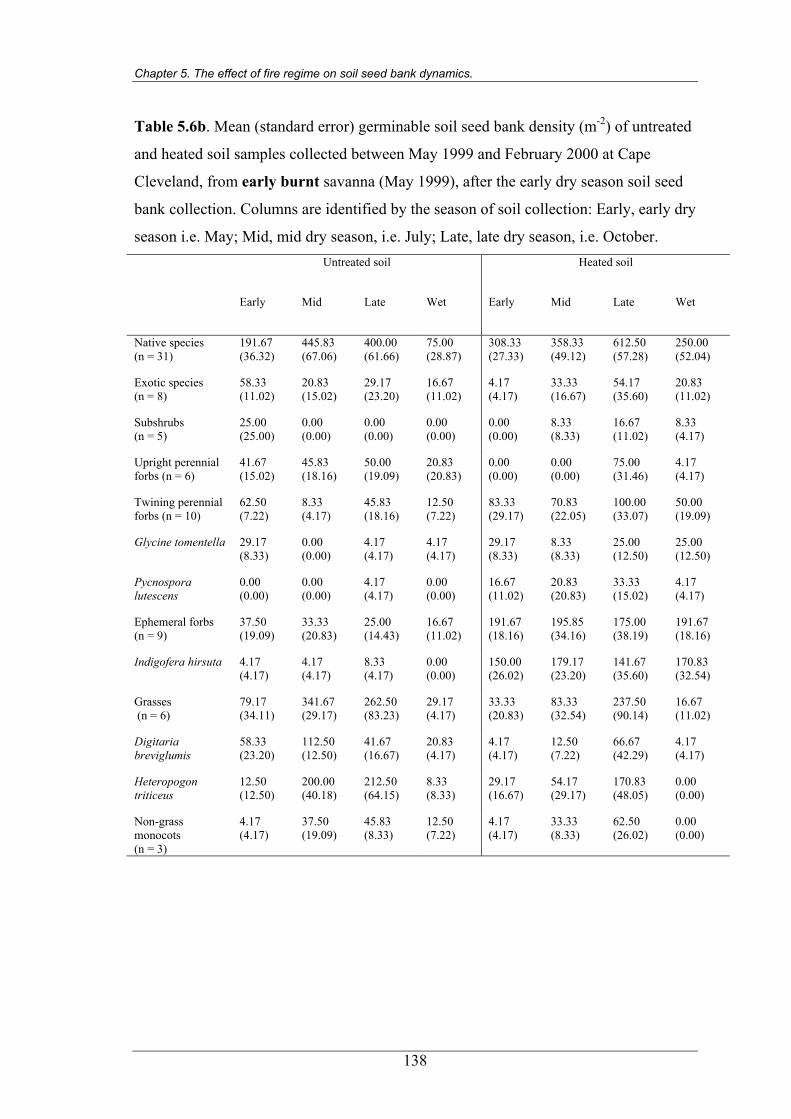
Chapter 5. The effect of fire regime on soil seed bank dynamics.
Table 5.6b. Mean (standard error) germinable soil seed bank density (m-2) of untreated
and heated soil samples collected between May 1999 and February 2000 at Cape
Cleveland, from early burnt savanna (May 1999), after the early dry season soil seed
bank collection. Columns are identified by the season of soil collection: Early, early dry
season i.e. May; Mid, mid dry season, i.e. July; Late, late dry season, i.e. October. Untreated soil Heated soil
Early Mid Late Wet Early Mid Late Wet
Native species (n = 31)
191.67 (36.32)
445.83 (67.06)
400.00 (61.66)
75.00 (28.87)
308.33 (27.33)
358.33 (49.12)
612.50 (57.28)
250.00 (52.04)
Exotic species (n = 8)
58.33 (11.02)
20.83 (15.02)
29.17 (23.20)
16.67 (11.02)
4.17 (4.17)
33.33 (16.67)
54.17 (35.60)
20.83 (11.02)
Subshrubs (n = 5)
25.00 (25.00)
0.00 (0.00)
0.00 (0.00)
0.00 (0.00)
0.00 (0.00)
8.33 (8.33)
16.67 (11.02)
8.33 (4.17)
Upright perennial forbs (n = 6)
41.67 (15.02)
45.83 (18.16)
50.00 (19.09)
20.83 (20.83)
0.00 (0.00)
0.00 (0.00)
75.00 (31.46)
4.17 (4.17)
Twining perennial forbs (n = 10)
62.50 (7.22)
8.33 (4.17)
45.83 (18.16)
12.50 (7.22)
83.33 (29.17)
70.83 (22.05)
100.00 (33.07)
50.00 (19.09)
Glycine tomentella 29.17 (8.33)
0.00 (0.00)
4.17 (4.17)
4.17 (4.17)
29.17 (8.33)
8.33 (8.33)
25.00 (12.50)
25.00 (12.50)
Pycnospora lutescens
0.00 (0.00)
0.00 (0.00)
4.17 (4.17)
0.00 (0.00)
16.67 (11.02)
20.83 (20.83)
33.33 (15.02)
4.17 (4.17)
Ephemeral forbs (n = 9)
37.50 (19.09)
33.33 (20.83)
25.00 (14.43)
16.67 (11.02)
191.67 (18.16)
195.85 (34.16)
175.00 (38.19)
191.67 (18.16)
Indigofera hirsuta 4.17 (4.17)
4.17 (4.17)
8.33 (4.17)
0.00 (0.00)
150.00 (26.02)
179.17 (23.20)
141.67 (35.60)
170.83 (32.54)
Grasses (n = 6)
79.17 (34.11)
341.67 (29.17)
262.50 (83.23)
29.17 (4.17)
33.33 (20.83)
83.33 (32.54)
237.50 (90.14)
16.67 (11.02)
Digitaria breviglumis
58.33 (23.20)
112.50 (12.50)
41.67 (16.67)
20.83 (4.17)
4.17 (4.17)
12.50 (7.22)
66.67 (42.29)
4.17 (4.17)
Heteropogon triticeus
12.50 (12.50)
200.00 (40.18)
212.50 (64.15)
8.33 (8.33)
29.17 (16.67)
54.17 (29.17)
170.83 (48.05)
0.00 (0.00)
Non-grass monocots (n = 3)
4.17 (4.17)
37.50 (19.09)
45.83 (8.33)
12.50 (7.22)
4.17 (4.17)
33.33 (8.33)
62.50 (26.02)
0.00 (0.00)
138
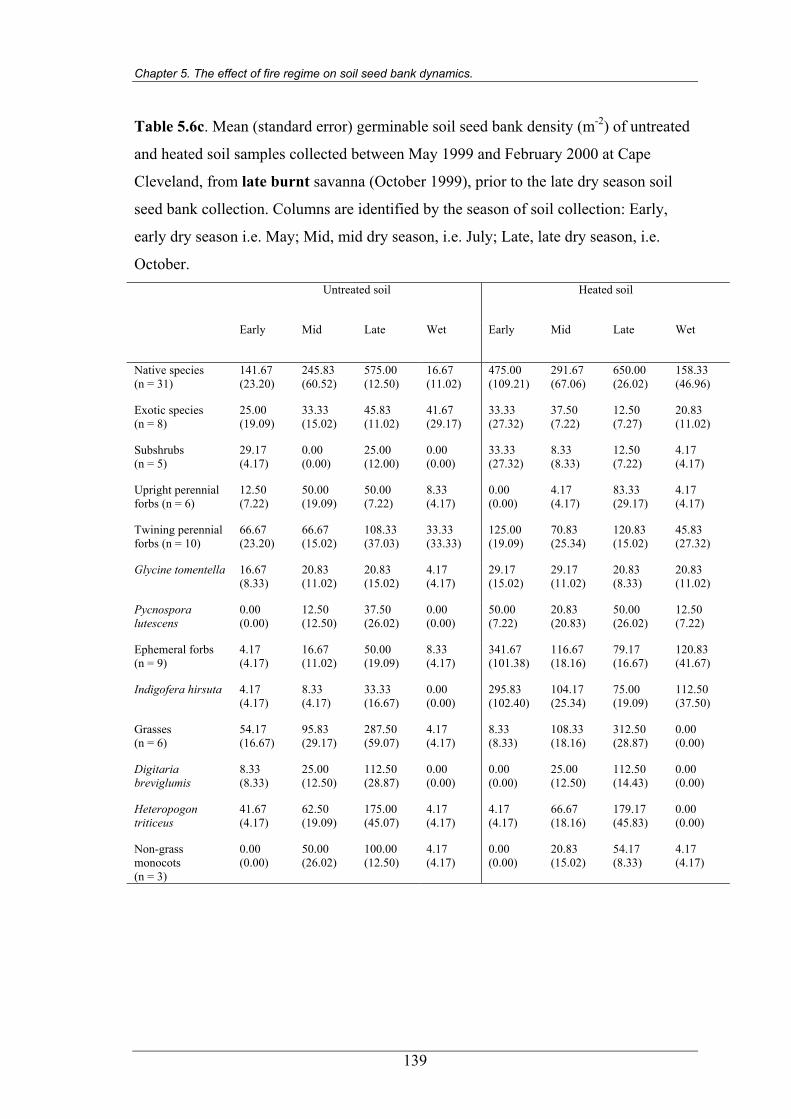
Chapter 5. The effect of fire regime on soil seed bank dynamics.
Table 5.6c. Mean (standard error) germinable soil seed bank density (m-2) of untreated
and heated soil samples collected between May 1999 and February 2000 at Cape
Cleveland, from late burnt savanna (October 1999), prior to the late dry season soil
seed bank collection. Columns are identified by the season of soil collection: Early,
early dry season i.e. May; Mid, mid dry season, i.e. July; Late, late dry season, i.e.
October. Untreated soil Heated soil
Early Mid Late Wet Early Mid Late Wet
Native species (n = 31)
141.67 (23.20)
245.83 (60.52)
575.00 (12.50)
16.67 (11.02)
475.00 (109.21)
291.67 (67.06)
650.00 (26.02)
158.33 (46.96)
Exotic species (n = 8)
25.00 (19.09)
33.33 (15.02)
45.83 (11.02)
41.67 (29.17)
33.33 (27.32)
37.50 (7.22)
12.50 (7.27)
20.83 (11.02)
Subshrubs (n = 5)
29.17 (4.17)
0.00 (0.00)
25.00 (12.00)
0.00 (0.00)
33.33 (27.32)
8.33 (8.33)
12.50 (7.22)
4.17 (4.17)
Upright perennial forbs (n = 6)
12.50 (7.22)
50.00 (19.09)
50.00 (7.22)
8.33 (4.17)
0.00 (0.00)
4.17 (4.17)
83.33 (29.17)
4.17 (4.17)
Twining perennial forbs (n = 10)
66.67 (23.20)
66.67 (15.02)
108.33 (37.03)
33.33 (33.33)
125.00 (19.09)
70.83 (25.34)
120.83 (15.02)
45.83 (27.32)
Glycine tomentella 16.67 (8.33)
20.83 (11.02)
20.83 (15.02)
4.17 (4.17)
29.17 (15.02)
29.17 (11.02)
20.83 (8.33)
20.83 (11.02)
Pycnospora lutescens
0.00 (0.00)
12.50 (12.50)
37.50 (26.02)
0.00 (0.00)
50.00 (7.22)
20.83 (20.83)
50.00 (26.02)
12.50 (7.22)
Ephemeral forbs (n = 9)
4.17 (4.17)
16.67 (11.02)
50.00 (19.09)
8.33 (4.17)
341.67 (101.38)
116.67 (18.16)
79.17 (16.67)
120.83 (41.67)
Indigofera hirsuta 4.17 (4.17)
8.33 (4.17)
33.33 (16.67)
0.00 (0.00)
295.83 (102.40)
104.17 (25.34)
75.00 (19.09)
112.50 (37.50)
Grasses (n = 6)
54.17 (16.67)
95.83 (29.17)
287.50 (59.07)
4.17 (4.17)
8.33 (8.33)
108.33 (18.16)
312.50 (28.87)
0.00 (0.00)
Digitaria breviglumis
8.33 (8.33)
25.00 (12.50)
112.50 (28.87)
0.00 (0.00)
0.00 (0.00)
25.00 (12.50)
112.50 (14.43)
0.00 (0.00)
Heteropogon triticeus
41.67 (4.17)
62.50 (19.09)
175.00 (45.07)
4.17 (4.17)
4.17 (4.17)
66.67 (18.16)
179.17 (45.83)
0.00 (0.00)
Non-grass monocots (n = 3)
0.00 (0.00)
50.00 (26.02)
100.00 (12.50)
4.17 (4.17)
0.00 (0.00)
20.83 (15.02)
54.17 (8.33)
4.17 (4.17)
139
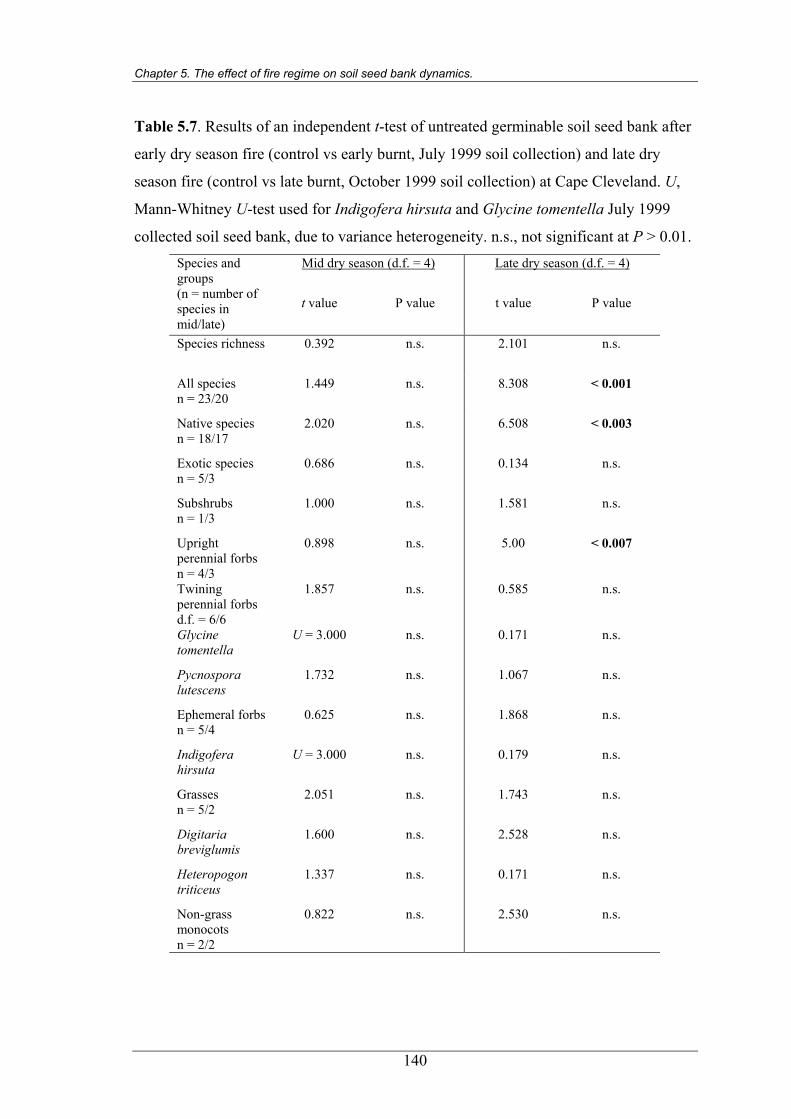
Chapter 5. The effect of fire regime on soil seed bank dynamics.
Table 5.7. Results of an independent t-test of untreated germinable soil seed bank after
early dry season fire (control vs early burnt, July 1999 soil collection) and late dry
season fire (control vs late burnt, October 1999 soil collection) at Cape Cleveland. U,
Mann-Whitney U-test used for Indigofera hirsuta and Glycine tomentella July 1999
collected soil seed bank, due to variance heterogeneity. n.s., not significant at P > 0.01. Species and
groups (n = number of species in mid/late)
Mid dry season (d.f. = 4) Late dry season (d.f. = 4)
t value P value t value P value
Species richness 0.392 n.s. 2.101 n.s.
All species n = 23/20
1.449 n.s. 8.308 < 0.001
Native species n = 18/17
2.020 n.s. 6.508 < 0.003
n = 5/3 0.686 n.s. 0.134 n.s.
Subshrubs n = 1/3
1.000 n.s. 1.581 n.s.
Upright perennial forbs n = 4/3
0.898 n.s. 5.00 < 0.007
Twining perennial forbs d.f. = 6/6
1.857 n.s. 0.585 n.s.
Glycine tomentella
U = 3.000 n.s. 0.171 n.s.
Pycnospora lutescens
1.732 n.s. 1.067 n.s.
Ephemeral forbs n = 5/4
0.625 n.s. 1.868 n.s.
Indigofera hirsuta
U = 3.000 n.s. 0.179 n.s.
Grasses n = 5/2
2.051 n.s. 1.743 n.s.
Digitaria breviglumis
1.600 n.s. 2.528 n.s.
Heteropogon triticeus
1.337 n.s. 0.171 n.s.
Non-grass monocots n = 2/2
0.822 n.s. 2.530 n.s.
Exotic species
140
Chapter 5. The effect of fire regime on soil seed bank dynamics.
Analyses of the untreated seed bank immediately following the early dry season fire
indicated that neither total seed density nor species richness significantly differed
between the unburnt control and early dry season burnt blocks (Table 5.7). However,
the late dry season fire significantly increased the total untreated seed bank and that of
native species and upright perennial forbs (Table 5.7), indicating that the late dry
season fire released seed from dormancy. A considerable increase in germination from
the untreated seed bank samples collected following the late dry season fire was
detected for ephemeral forbs and Indigofera hirsuta (Tables 5.6a - c), however low
germinable seed banks in the second of three late burnt blocks reduced the chance of
detecting a significant effect.
5.3.4 Seed bank dynamics following fire season treatments
A total of 53 species was detected in the seed bank during the dry season in the year
following the 1999 fires. Species richness was not influenced by fire history (Figure
5.8a; Table 5.8). However species richness was significantly increased after soil
heating compared to untreated soil, and was significantly higher in the late dry season
compared to the early dry season.
No significant variation with fire treatment was detected for total seed bank density
(Figure 5.8b; Table 5.8). However, soil heating increased the total number of seedlings
that geminated from the seed bank, which was significantly higher in the late rather
than early dry season. There was a significant interaction between soil treatment and
the season of seed bank collection.
Seed bank densities in the dry season of 2000, and the statistical significance of
differences between treatments, of individual species and species groups are displayed
in Tables 5.8 and 5.9. The seed bank of I. hirsuta was denser in blocks burnt in the
early dry season fires of 1999 than blocks that remained unburnt. Conversely, the seed
bank density of subshrubs was significantly reduced by both early and late dry season
fires of 1999, while that of non-grasss monocots was lower in blocks burnt in late dry
season fires compared with the control blocks that remained unburnt in 1999.
141
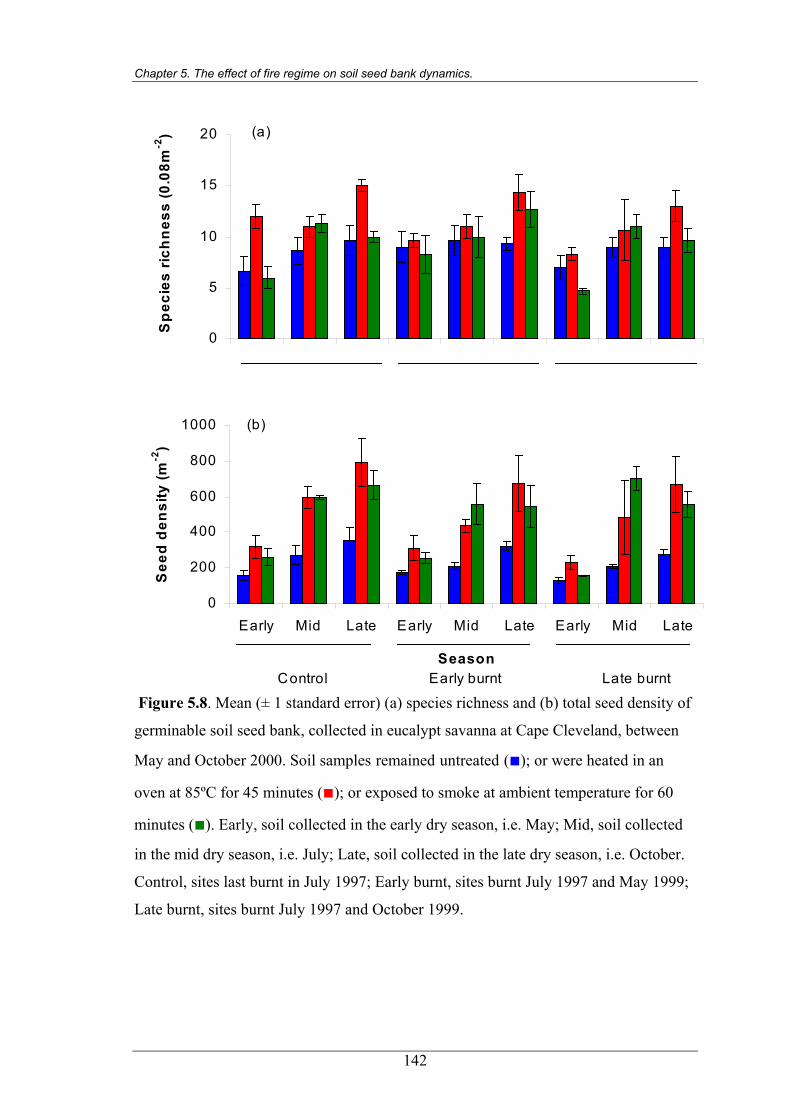
Chapter 5. The effect of fire regime on soil seed bank dynamics.
0
5
10
15
20
Early Mid Late Early Mid Late Early Mid Late
Sp
ecie
s ri
chn
ess
(0.0
8m-2
) (a)
0
200
400
600
800
1000
Early Mid Late Early Mid Late Early Mid Late
Season
See
d d
ensi
ty (m
-2)
Control Early burnt Late burnt
(b)
Figure 5.8. Mean (± 1 standard error) (a) species richness and (b) total seed density of
germinable soil seed bank, collected in eucalypt savanna at Cape Cleveland, between
May and October 2000. Soil samples remained untreated (■); or were heated in an
oven at 85ºC for 45 minutes (■); or exposed to smoke at ambient temperature for 60
minutes (■). Early, soil collected in the early dry season, i.e. May; Mid, soil collected
in the mid dry season, i.e. July; Late, soil collected in the late dry season, i.e. October.
Control, sites last burnt in July 1997; Early burnt, sites burnt July 1997 and May 1999;
Late burnt, sites burnt July 1997 and October 1999.
142
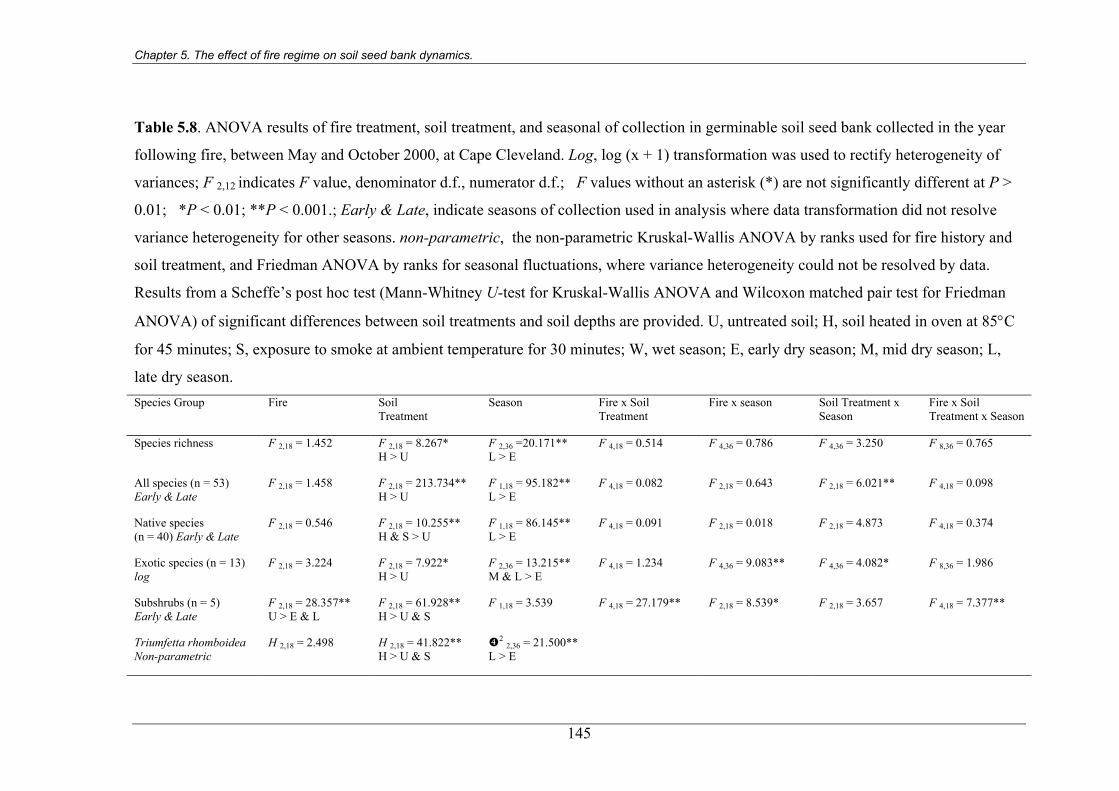
Chapter 5. The effect of fire regime on soil seed bank dynamics.
Table 5.8. ANOVA results of fire treatment, soil treatment, and seasonal of collection in germinable soil seed bank collected in the year
following fire, between May and October 2000, at Cape Cleveland. Log, log (x + 1) transformation was used to rectify heterogeneity of
variances; F 2,12 indicates F value, denominator d.f., numerator d.f.; F values without an asterisk (*) are not significantly different at P >
0.01; *P < 0.01; **P < 0.001.; Early & Late, indicate seasons of collection used in analysis where data transformation did not resolve
variance heterogeneity for other seasons. non-parametric, the non-parametric Kruskal-Wallis ANOVA by ranks used for fire history and
soil treatment, and Friedman ANOVA by ranks for seasonal fluctuations, where variance heterogeneity could not be resolved by data.
Results from a Scheffe’s post hoc test (Mann-Whitney U-test for Kruskal-Wallis ANOVA and Wilcoxon matched pair test for Friedman
ANOVA) of significant differences between soil treatments and soil depths are provided. U, untreated soil; H, soil heated in oven at 85°C
for 45 minutes; S, exposure to smoke at ambient temperature for 30 minutes; W, wet season; E, early dry season; M, mid dry season; L,
late dry season. Species Group
Fire Soil Treatment
Season Fire x Soil Treatment
Fire x season Soil Treatment x Season
Fire x Soil Treatment x Season
Species richness F 2,18 = 1.452 F 2,18 = 8.267* H > U
F 2,36 =20.171** L > E
F 4,18 = 0.514 F 4,36 = 0.786 F 4,36 = 3.250 F 8,36 = 0.765
All species (n = 53) Early & Late
F 2,18 = 1.458 F 2,18 = 213.734** H > U
F 1,18 = 95.182** L > E
F 4,18 = 0.082 F 2,18 = 0.643 F 2,18 = 6.021** F 4,18 = 0.098
Native species (n = 40) Early & Late
F 2,18 = 0.546 F 2,18 = 10.255** H & S > U
F 1,18 = 86.145** L > E
F 4,18 = 0.091 F 2,18 = 0.018 F 2,18 = 4.873 F 4,18 = 0.374
Exotic species (n = 13) log
F 2,18 = 3.224 F 2,18 = 7.922* H > U
F 2,36 = 13.215** M & L > E
F 4,18 = 1.234 F 4,36 = 9.083** F 4,36 = 4.082* F 8,36 = 1.986
Subshrubs (n = 5) Early & Late
F 2,18 = 28.357** U > E & L
F 2,18 = 61.928** H > U & S
F 1,18 = 3.539 F 4,18 = 27.179** F 2,18 = 8.539* F 2,18 = 3.657 F 4,18 = 7.377**
Triumfetta rhomboidea Non-parametric
H 2,18 = 2.498 H 2,18 = 41.822** H > U & S
2 2,36 = 21.500** L > E
145
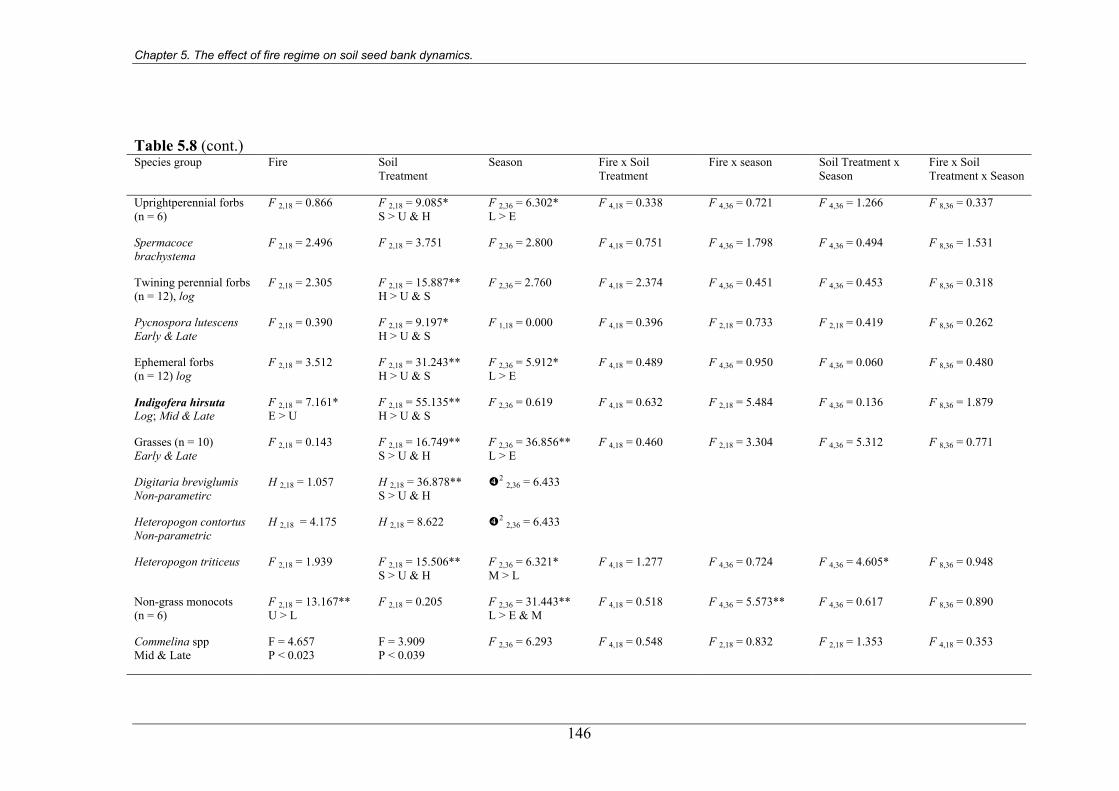
Chapter 5. The effect of fire regime on soil seed bank dynamics.
Table 5.8 (cont.) Species group
Fire Soil Treatment
Season Fire x Soil Treatment
Fire x season Soil Treatment x Season
Fire x Soil Treatment x Season
Uprightperennial forbs (n = 6)
F 2,18 = 0.866 F 2,18 = 9.085* S > U & H
F 2,36 = 6.302* L > E
F 4,18 = 0.338 F 4,36 = 0.721 F 4,36 = 1.266 F 8,36 = 0.337
Spermacoce brachystema
F 2,18 = 2.496 F 2,18 = 3.751
F 2,36 = 2.800 F 4,18 = 0.751 F 4,36 = 1.798 F 4,36 = 0.494 F 8,36 = 1.531
Twining perennial forbs (n = 12), log
F 2,18 = 2.305 F 2,18 = 15.887** H > U & S
F 2,36 = 2.760 F 4,18 = 2.374 F 4,36 = 0.451 F 4,36 = 0.453 F 8,36 = 0.318
Pycnospora lutescens Early & Late
F 2,18 = 0.390 F 2,18 = 9.197* H > U & S
F 1,18 = 0.000 F 4,18 = 0.396 F 2,18 = 0.733 F 2,18 = 0.419 F 8,36 = 0.262
Ephemeral forbs (n = 12) log
F 2,18 = 3.512 F 2,18 = 31.243** H > U & S
F 2,36 = 5.912* L > E
F 4,18 = 0.489 F 4,36 = 0.950
F 4,36 = 0.060 F 8,36 = 0.480
Indigofera hirsuta Log; Mid & Late
F 2,18 = 7.161* E > U
F 2,18 = 55.135** H > U & S
F 2,36 = 0.619 F 4,18 = 0.632 F 2,18 = 5.484 F 4,36 = 0.136 F 8,36 = 1.879
Grasses (n = 10) Early & Late
F 2,18 = 0.143 F 2,18 = 16.749** S > U & H
F 2,36 = 36.856** L > E
F 4,18 = 0.460 F 2,18 = 3.304 F 4,36 = 5.312 F 8,36 = 0.771
Digitaria breviglumis Non-parametirc
H 2,18 = 1.057 H 2,18 = 36.878** S > U & H
2 2,36 = 6.433
Heteropogon contortus Non-parametric
H 2,18 = 4.175 H 2,18 = 8.622
2 2,36 = 6.433
Heteropogon triticeus F 2,18 = 1.939 F 2,18 = 15.506** S > U & H
F 2,36 = 6.321* M > L
F 4,18 = 1.277 F 4,36 = 0.724 F 4,36 = 4.605* F 8,36 = 0.948
Non-grass monocots (n = 6)
F 2,18 = 13.167** U > L
F 2,18 = 0.205 F 2,36 = 31.443** L > E & M
F 4,18 = 0.518 F 4,36 = 5.573** F 4,36 = 0.617 F 8,36 = 0.890
Commelina spp Mid & Late
F = 4.657 P < 0.023
F = 3.909 P < 0.039
F 2,36 = 6.293 F 4,18 = 0.548
F 2,18 = 0.832 F 2,18 = 1.353 F 4,18 = 0.353
146
Chapter 5. The effect of fire regime on soil seed bank dynamics.
The germination of native species was significantly increased by both heating and
smoking treatments. The germination of subshrubs, the common subshrub, Triumfetta
rhomboidea, twining perennial forbs, the common twiner, Pycnospora lutescens,
ephemeral forbs and the common ephemeral I. hirsuta, was significantly increased by
heating compared to untreated soil and exposure to smoke. Exposure to smoke
significantly increased the germination of upright perennial forbs, grasses and the
common grasses, Digitaria breviglumis and H. triticeus, compared with heated and
untreated soil. A significant interaction between fire and soil treatment was
demonstrated for subshrubs, with the highest seed bank density detected in heated
samples collected from control blocks, which remained unburnt since 1997.
The seed bank density of natives, T. rhomboidea, upright perennial forbs, ephemeral
forbs, grasses was significantly greater during the late rather than early dry season. The
seed bank of exotic species was significantly greater in the mid and late, rather than
early dry season. The seed bank of H. triticeus was larger in the mid rather than late dry
season and that of the non-grass monocots was greater during the late dry season rather
than both early and mid dry seasons.
A significant interaction between fire and season of soil collection was demonstrated
for exotic species, subshrubs and non-grass monocots. Exotic species and H. triticeus
displayed a significant interaction between soil treatment and season of collection, with
exotic seed bank density was highest in late dry season samples that were heated, while
H. triticeus seed bank density was highest in mid dry season samples that were smoked.
Significant interactions were also detected between the combinations of all three factors
in the subshrub seed bank.
145
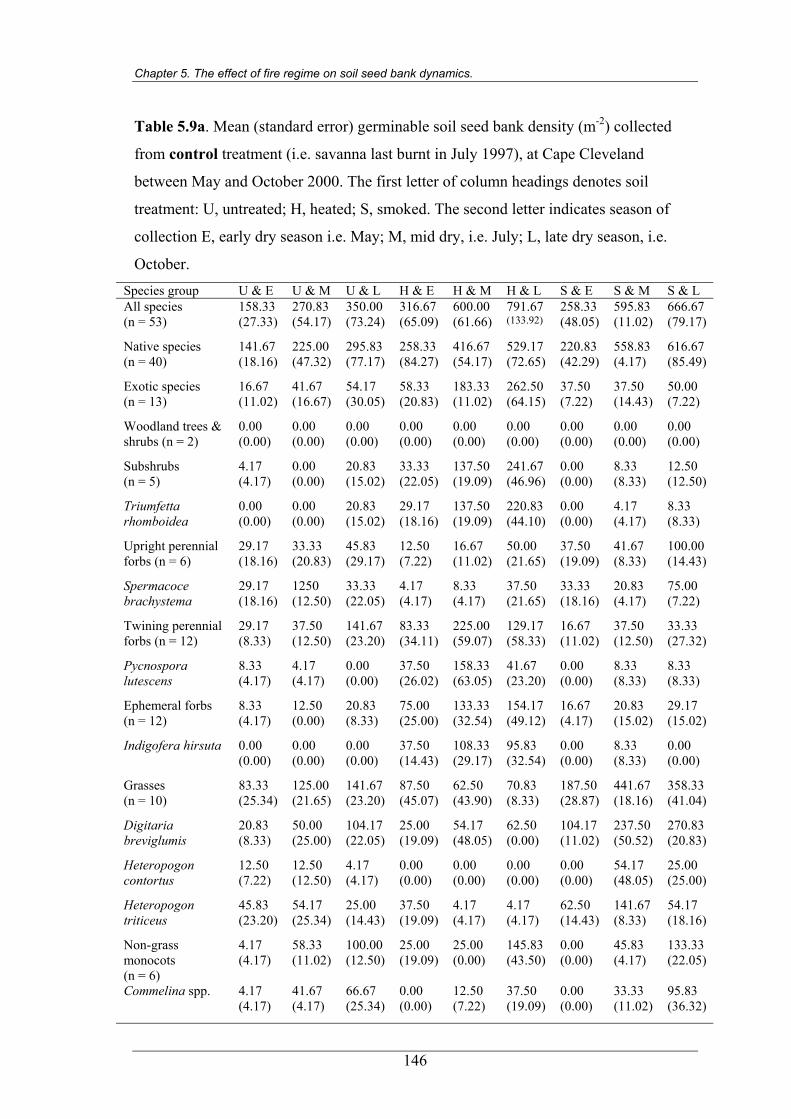
Chapter 5. The effect of fire regime on soil seed bank dynamics.
Table 5.9a. Mean (standard error) germinable soil seed bank density (m-2) collected
from control treatment (i.e. savanna last burnt in July 1997), at Cape Cleveland
between May and October 2000. The first letter of column headings denotes soil
treatment: U, untreated; H, heated; S, smoked. The second letter indicates season of
collection E, early dry season i.e. May; M, mid dry, i.e. July; L, late dry season, i.e.
October. Species group U & E U & M U & L H & E H & M H & L S & E S & M S & L All species (n = 53)
158.33 (27.33)
270.83 (54.17)
350.00 (73.24)
316.67 (65.09)
600.00 (61.66)
791.67 (133.92)
258.33 (48.05)
595.83 (11.02)
666.67 (79.17)
Native species (n = 40)
141.67 (18.16)
225.00 (47.32)
295.83 (77.17)
258.33 (84.27)
416.67 (54.17)
529.17 (72.65)
220.83 (42.29)
558.83 (4.17)
616.67 (85.49)
Exotic species (n = 13)
16.67 (11.02)
41.67 (16.67)
54.17 (30.05)
58.33 (20.83)
183.33 (11.02)
262.50 (64.15)
37.50 (7.22)
37.50 (14.43)
50.00 (7.22)
Woodland trees & shrubs (n = 2)
0.00 (0.00)
0.00 (0.00)
0.00 (0.00)
0.00 (0.00)
0.00 (0.00)
0.00 (0.00)
0.00 (0.00)
0.00 (0.00)
0.00 (0.00)
Subshrubs (n = 5)
4.17 (4.17)
0.00 (0.00)
20.83 (15.02)
33.33 (22.05)
137.50 (19.09)
241.67 (46.96)
0.00 (0.00)
8.33 (8.33)
12.50 (12.50)
Triumfetta rhomboidea
0.00 (0.00)
0.00 (0.00)
20.83 (15.02)
29.17 (18.16)
137.50 (19.09)
220.83 (44.10)
0.00 (0.00)
4.17 (4.17)
8.33 (8.33)
Upright perennial forbs (n = 6)
29.17 (18.16)
33.33 (20.83)
45.83 (29.17)
12.50 (7.22)
16.67 (11.02)
50.00 (21.65)
37.50 (19.09)
41.67 (8.33)
100.00 (14.43)
Spermacoce brachystema
29.17 (18.16)
1250 (12.50)
33.33 (22.05)
4.17 (4.17)
8.33 (4.17)
37.50 (21.65)
33.33 (18.16)
20.83 (4.17)
75.00 (7.22)
Twining perennial forbs (n = 12)
29.17 (8.33)
37.50 (12.50)
141.67 (23.20)
83.33 (34.11)
225.00 (59.07)
129.17 (58.33)
16.67 (11.02)
37.50 (12.50)
33.33 (27.32)
Pycnospora lutescens
8.33 (4.17)
4.17 (4.17)
0.00 (0.00)
37.50 (26.02)
158.33 (63.05)
41.67 (23.20)
0.00 (0.00)
8.33 (8.33)
8.33 (8.33)
Ephemeral forbs (n = 12)
8.33 (4.17)
12.50 (0.00)
20.83 (8.33)
75.00 (25.00)
133.33 (32.54)
154.17 (49.12)
16.67 (4.17)
20.83 (15.02)
29.17 (15.02)
Indigofera hirsuta 0.00 (0.00)
0.00 (0.00)
0.00 (0.00)
37.50 (14.43)
108.33 (29.17)
95.83 (32.54)
0.00 (0.00)
8.33 (8.33)
0.00 (0.00)
Grasses (n = 10)
83.33 (25.34)
125.00 (21.65)
141.67 (23.20)
87.50 (45.07)
62.50 (43.90)
70.83 (8.33)
187.50 (28.87)
441.67 (18.16)
358.33 (41.04)
Digitaria breviglumis
20.83 (8.33)
50.00 (25.00)
104.17 (22.05)
25.00 (19.09)
54.17 (48.05)
62.50 (0.00)
104.17 (11.02)
237.50 (50.52)
270.83 (20.83)
Heteropogon contortus
12.50 (7.22)
12.50 (12.50)
4.17 (4.17)
0.00 (0.00)
0.00 (0.00)
0.00 (0.00)
0.00 (0.00)
54.17 (48.05)
25.00 (25.00)
Heteropogon triticeus
45.83 (23.20)
54.17 (25.34)
25.00 (14.43)
37.50 (19.09)
4.17 (4.17)
4.17 (4.17)
62.50 (14.43)
141.67 (8.33)
54.17 (18.16)
Non-grass monocots (n = 6)
4.17 (4.17)
58.33 (11.02)
100.00 (12.50)
25.00 (19.09)
25.00 (0.00)
145.83 (43.50)
0.00 (0.00)
45.83 (4.17)
133.33 (22.05)
Commelina spp. 4.17 (4.17)
41.67 (4.17)
66.67 (25.34)
0.00 (0.00)
12.50 (7.22)
37.50 (19.09)
0.00 (0.00)
33.33 (11.02)
95.83 (36.32)
146
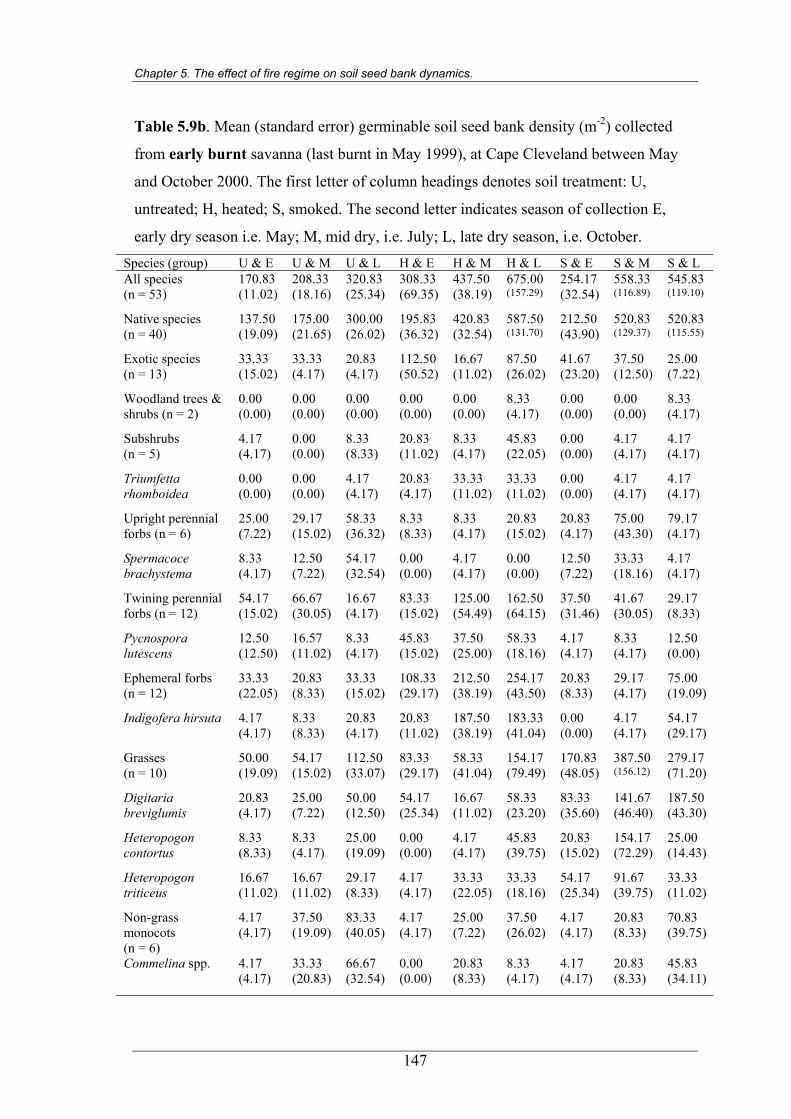
Chapter 5. The effect of fire regime on soil seed bank dynamics.
Table 5.9b. Mean (standard error) germinable soil seed bank density (m-2) collected
from early burnt savanna (last burnt in May 1999), at Cape Cleveland between May
and October 2000. The first letter of column headings denotes soil treatment: U,
untreated; H, heated; S, smoked. The second letter indicates season of collection E,
early dry season i.e. May; M, mid dry, i.e. July; L, late dry season, i.e. October. Species (group) U & E U & M U & L H & E H & M H & L S & E S & M S & L All species (n = 53)
170.83 (11.02)
208.33 (18.16)
320.83 (25.34)
308.33 (69.35)
437.50 (38.19)
675.00 (157.29)
254.17 (32.54)
558.33 (116.89)
545.83 (119.10)
Native species (n = 40)
137.50 (19.09)
175.00 (21.65)
300.00 (26.02)
195.83 (36.32)
420.83 (32.54)
587.50 (131.70)
212.50 (43.90)
520.83 (129.37)
520.83 (115.55)
Exotic species (n = 13)
33.33 (15.02)
33.33 (4.17)
20.83 (4.17)
112.50 (50.52)
16.67 (11.02)
87.50 (26.02)
41.67 (23.20)
37.50 (12.50)
25.00 (7.22)
Woodland trees & shrubs (n = 2)
0.00 (0.00)
0.00 (0.00)
0.00 (0.00)
0.00 (0.00)
0.00 (0.00)
8.33 (4.17)
0.00 (0.00)
0.00 (0.00)
8.33 (4.17)
Subshrubs (n = 5)
4.17 (4.17)
0.00 (0.00)
8.33 (8.33)
20.83 (11.02)
8.33 (4.17)
45.83 (22.05)
0.00 (0.00)
4.17 (4.17)
4.17 (4.17)
Triumfetta rhomboidea
0.00 (0.00)
0.00 (0.00)
4.17 (4.17)
20.83 (4.17)
33.33 (11.02)
33.33 (11.02)
0.00 (0.00)
4.17 (4.17)
4.17 (4.17)
Upright perennial forbs (n = 6)
25.00 (7.22)
29.17 (15.02)
58.33 (36.32)
8.33 (8.33)
8.33 (4.17)
20.83 (15.02)
20.83 (4.17)
75.00 (43.30)
79.17 (4.17)
Spermacoce brachystema
8.33 (4.17)
12.50 (7.22)
54.17 (32.54)
0.00 (0.00)
4.17 (4.17)
0.00 (0.00)
12.50 (7.22)
33.33 (18.16)
4.17 (4.17)
Twining perennial forbs (n = 12)
54.17 (15.02)
66.67 (30.05)
16.67 (4.17)
83.33 (15.02)
125.00 (54.49)
162.50 (64.15)
37.50 (31.46)
41.67 (30.05)
29.17 (8.33)
Pycnospora lutescens
12.50 (12.50)
16.57 (11.02)
8.33 (4.17)
45.83 (15.02)
37.50 (25.00)
58.33 (18.16)
4.17 (4.17)
8.33 (4.17)
12.50 (0.00)
Ephemeral forbs (n = 12)
33.33 (22.05)
20.83 (8.33)
33.33 (15.02)
108.33 (29.17)
212.50 (38.19)
254.17 (43.50)
20.83 (8.33)
29.17 (4.17)
75.00 (19.09)
Indigofera hirsuta 4.17 (4.17)
8.33 (8.33)
20.83 (4.17)
20.83 (11.02)
187.50 (38.19)
183.33 (41.04)
0.00 (0.00)
4.17 (4.17)
54.17 (29.17)
Grasses (n = 10)
50.00 (19.09)
54.17 (15.02)
112.50 (33.07)
83.33 (29.17)
58.33 (41.04)
154.17 (79.49)
170.83 (48.05)
387.50 (156.12)
279.17 (71.20)
Digitaria breviglumis
20.83 (4.17)
25.00 (7.22)
50.00 (12.50)
54.17 (25.34)
16.67 (11.02)
58.33 (23.20)
83.33 (35.60)
141.67 (46.40)
187.50 (43.30)
Heteropogon contortus
8.33 (8.33)
8.33 (4.17)
25.00 (19.09)
0.00 (0.00)
4.17 (4.17)
45.83 (39.75)
20.83 (15.02)
154.17 (72.29)
25.00 (14.43)
Heteropogon triticeus
16.67 (11.02)
16.67 (11.02)
29.17 (8.33)
4.17 (4.17)
33.33 (22.05)
33.33 (18.16)
54.17 (25.34)
91.67 (39.75)
33.33 (11.02)
Non-grass monocots (n = 6)
4.17 (4.17)
37.50 (19.09)
83.33 (40.05)
4.17 (4.17)
25.00 (7.22)
37.50 (26.02)
4.17 (4.17)
20.83 (8.33)
70.83 (39.75)
Commelina spp. 4.17 (4.17)
33.33 (20.83)
66.67 (32.54)
0.00 (0.00)
20.83 (8.33)
8.33 (4.17)
4.17 (4.17)
20.83 (8.33)
45.83 (34.11)
147
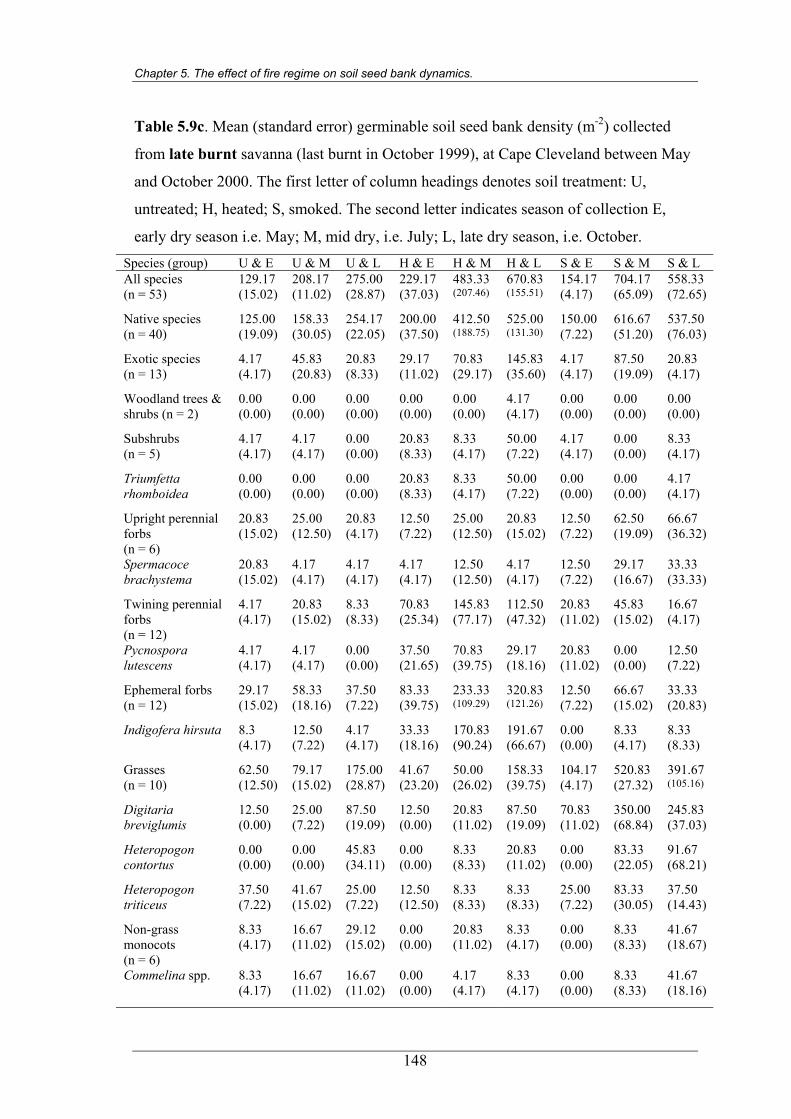
Chapter 5. The effect of fire regime on soil seed bank dynamics.
Table 5.9c. Mean (standard error) germinable soil seed bank density (m-2) collected
from late burnt savanna (last burnt in October 1999), at Cape Cleveland between May
and October 2000. The first letter of column headings denotes soil treatment: U,
untreated; H, heated; S, smoked. The second letter indicates season of collection E,
early dry season i.e. May; M, mid dry, i.e. July; L, late dry season, i.e. October. Species (group) U & E U & M U & L H & E H & M H & L S & E S & M S & L All species (n = 53)
129.17 (15.02)
208.17 (11.02)
275.00 (28.87)
229.17 (37.03)
483.33 (207.46)
670.83 (155.51)
154.17 (4.17)
704.17 (65.09)
558.33 (72.65)
Native species (n = 40)
125.00 (19.09)
158.33 (30.05)
254.17 (22.05)
200.00 (37.50)
412.50(188.75)
525.00 (131.30)
150.00 (7.22)
616.67 (51.20)
537.50 (76.03)
Exotic species (n = 13)
4.17 (4.17)
45.83 (20.83)
20.83 (8.33)
29.17 (11.02)
70.83 (29.17)
145.83 (35.60)
4.17 (4.17)
87.50 (19.09)
20.83 (4.17)
Woodland trees & shrubs (n = 2)
0.00 (0.00)
0.00 (0.00)
0.00 (0.00)
0.00 (0.00)
0.00 (0.00)
4.17 (4.17)
0.00 (0.00)
0.00 (0.00)
0.00 (0.00)
Subshrubs (n = 5)
4.17 (4.17)
4.17 (4.17)
0.00 (0.00)
20.83 (8.33)
8.33 (4.17)
50.00 (7.22)
4.17 (4.17)
0.00 (0.00)
8.33 (4.17)
Triumfetta rhomboidea
0.00 (0.00)
0.00 (0.00)
0.00 (0.00)
20.83 (8.33)
8.33 (4.17)
50.00 (7.22)
0.00 (0.00)
0.00 (0.00)
4.17 (4.17)
Upright perennial forbs (n = 6)
20.83 (15.02)
25.00 (12.50)
20.83 (4.17)
12.50 (7.22)
25.00 (12.50)
20.83 (15.02)
12.50 (7.22)
62.50 (19.09)
66.67 (36.32)
Spermacoce brachystema
20.83 (15.02)
4.17 (4.17)
4.17 (4.17)
4.17 (4.17)
12.50 (12.50)
4.17 (4.17)
12.50 (7.22)
29.17 (16.67)
33.33 (33.33)
Twining perennial forbs (n = 12)
4.17 (4.17)
20.83 (15.02)
8.33 (8.33)
70.83 (25.34)
145.83 (77.17)
112.50 (47.32)
20.83 (11.02)
45.83 (15.02)
16.67 (4.17)
Pycnospora lutescens
4.17 (4.17)
4.17 (4.17)
0.00 (0.00)
37.50 (21.65)
70.83 (39.75)
29.17 (18.16)
20.83 (11.02)
0.00 (0.00)
12.50 (7.22)
Ephemeral forbs (n = 12)
29.17 (15.02)
58.33 (18.16)
37.50 (7.22)
83.33 (39.75)
233.33 (109.29)
320.83 (121.26)
12.50 (7.22)
66.67 (15.02)
33.33 (20.83)
Indigofera hirsuta 8.3 (4.17)
12.50 (7.22)
4.17 (4.17)
33.33 (18.16)
170.83 (90.24)
191.67 (66.67)
0.00 (0.00)
8.33 (4.17)
8.33 (8.33)
Grasses (n = 10)
62.50 (12.50)
79.17 (15.02)
175.00 (28.87)
41.67 (23.20)
50.00 (26.02)
158.33 (39.75)
104.17(4.17)
520.83 (27.32)
391.67 (105.16)
Digitaria breviglumis
12.50 (0.00)
25.00 (7.22)
87.50 (19.09)
12.50 (0.00)
20.83 (11.02)
87.50 (19.09)
70.83 (11.02)
350.00 (68.84)
245.83 (37.03)
Heteropogon contortus
0.00 (0.00)
0.00 (0.00)
45.83 (34.11)
0.00 (0.00)
8.33 (8.33)
20.83 (11.02)
0.00 (0.00)
83.33 (22.05)
91.67 (68.21)
Heteropogon triticeus
37.50 (7.22)
41.67 (15.02)
25.00 (7.22)
12.50 (12.50)
8.33 (8.33)
8.33 (8.33)
25.00 (7.22)
83.33 (30.05)
37.50 (14.43)
Non-grass monocots (n = 6)
8.33 (4.17)
16.67 (11.02)
29.12 (15.02)
0.00 (0.00)
20.83 (11.02)
8.33 (4.17)
0.00 (0.00)
8.33 (8.33)
41.67 (18.67)
Commelina spp. 8.33 (4.17)
16.67 (11.02)
16.67 (11.02)
0.00 (0.00)
4.17 (4.17)
8.33 (4.17)
0.00 (0.00)
8.33 (8.33)
41.67 (18.16)
148
Chapter 5. The effect of fire regime on soil seed bank dynamics.
5.3.5 Phenology of seed production
The phenology of seed production was documented for 86 species at Cape Cleveland
(Table 5.10). Mature seed was produced, with seed subsequently dispersed, by
woodland trees and shrubs generally between the mid dry season to the wet season;
rainforest trees and shrubs, subshrubs and ephemeral forbs throughout the dry season;
and upright and twining perennial forbs, grasses and non-grass monocots throughout
the year. The month with the lowest number of species with mature seed was January,
with only 20 species, and was highest in May, when 52 species were recorded with
mature seeds. Seed production continued through the dry season, with 59% of the
species having begun seed production by the start of May, and 92% by the start of
October. This indicates seed accumulated through the dry season, so that the greatest
quantity of seed had been produced by the late dry season, as documented in the soil
seed bank study.
5.3.6 Comparison of seed bank composition with the standing vegetation
A total of 64 species were detected in the 288 soil seed bank samples, collected during
the wet season, early, mid and late dry seasons between July 1997 and October 2000
(Appendix 1). Fifty nine species (50% of total) detected in the 180 floristic surveys
between 1997 an 2001 (Chapter 3) were detected in the seed bank. An additional five
species were present in the seed bank, but not recorded during the floristic surveys,
although all five were observed in the standing vegetation at the Cape Cleveland site,
adjacent to survey plots. Therefore no additional species were detected in the soil seed
bank that were not present in the standing vegetation, while only half of the species in
the standing vegetation were detected in the seed bank.
The seed bank was dominated by herbaceous species, which represented 83% of the
species number, and 94% of the total seed bank abundance recorded in the 288
samples. No rainforest species, only two woodland trees and shrubs, and nine
subshrubs were detected in the germinable seed bank (Appendix 1). By comparison, in
the floristic surveys, herbaceous species represented 61% of total species number and
84% of the abundance in the floristic surveys (Chapter 3), indicating a greater
proportional representation of herbaceous species in the seed bank than standing
vegetation.
149
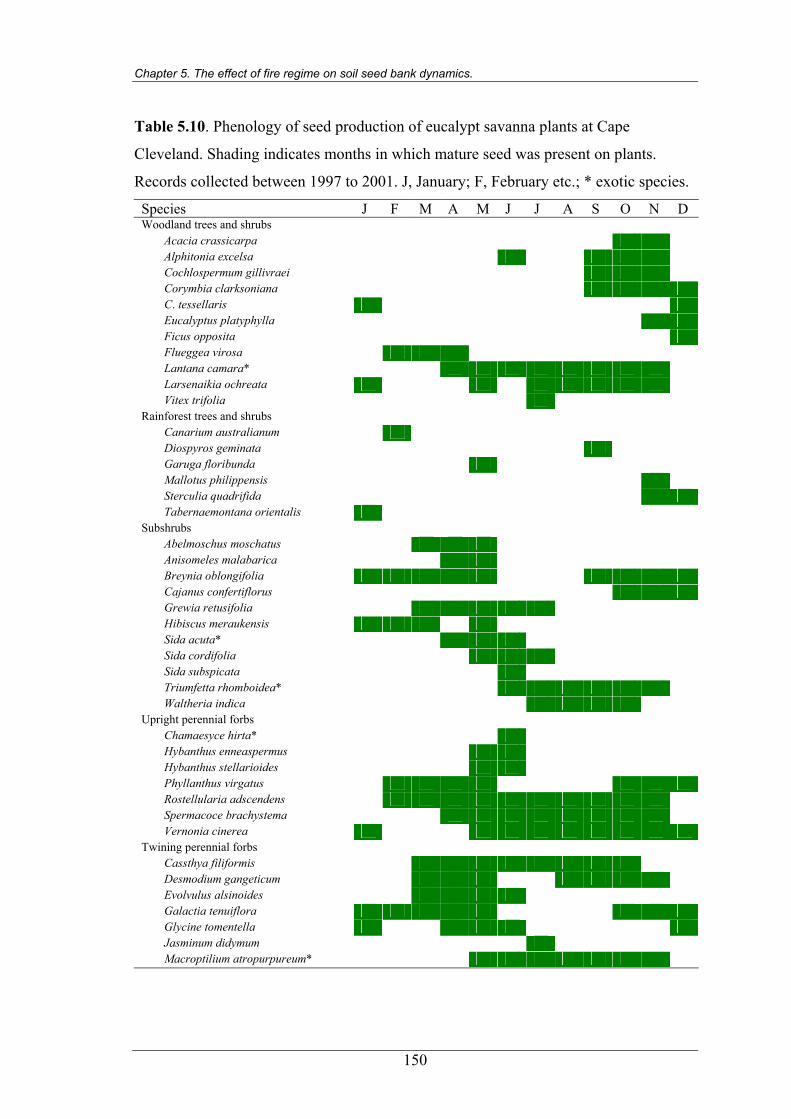
Chapter 5. The effect of fire regime on soil seed bank dynamics.
Table 5.10. Phenology of seed production of eucalypt savanna plants at Cape
Cleveland. Shading indicates months in which mature seed was present on plants.
Records collected between 1997 to 2001. J, January; F, February etc.; * exotic species.
Species J F M A M J J A S O N D Woodland trees and shrubs
Acacia crassicarpa Alphitonia excelsa Cochlospermum gillivraei Corymbia clarksoniana C. tessellaris Eucalyptus platyphylla Ficus opposita Flueggea virosa Lantana camara* Larsenaikia ochreata Vitex trifolia
Rainforest trees and shrubs Canarium australianum Diospyros geminata Garuga floribunda Mallotus philippensis Sterculia quadrifida Tabernaemontana orientalis
Subshrubs Abelmoschus moschatus Anisomeles malabarica Breynia oblongifolia Cajanus confertiflorus Grewia retusifolia Hibiscus meraukensis Sida acuta* Sida cordifolia Sida subspicata Triumfetta rhomboidea* Waltheria indica
Upright perennial forbs Chamaesyce hirta* Hybanthus enneaspermus Hybanthus stellarioides Phyllanthus virgatus Rostellularia adscendens Spermacoce brachystema Vernonia cinerea
Twining perennial forbs Cassthya filiformis Desmodium gangeticum Evolvulus alsinoides Galactia tenuiflora Glycine tomentella Jasminum didymum Macroptilium atropurpureum*
150
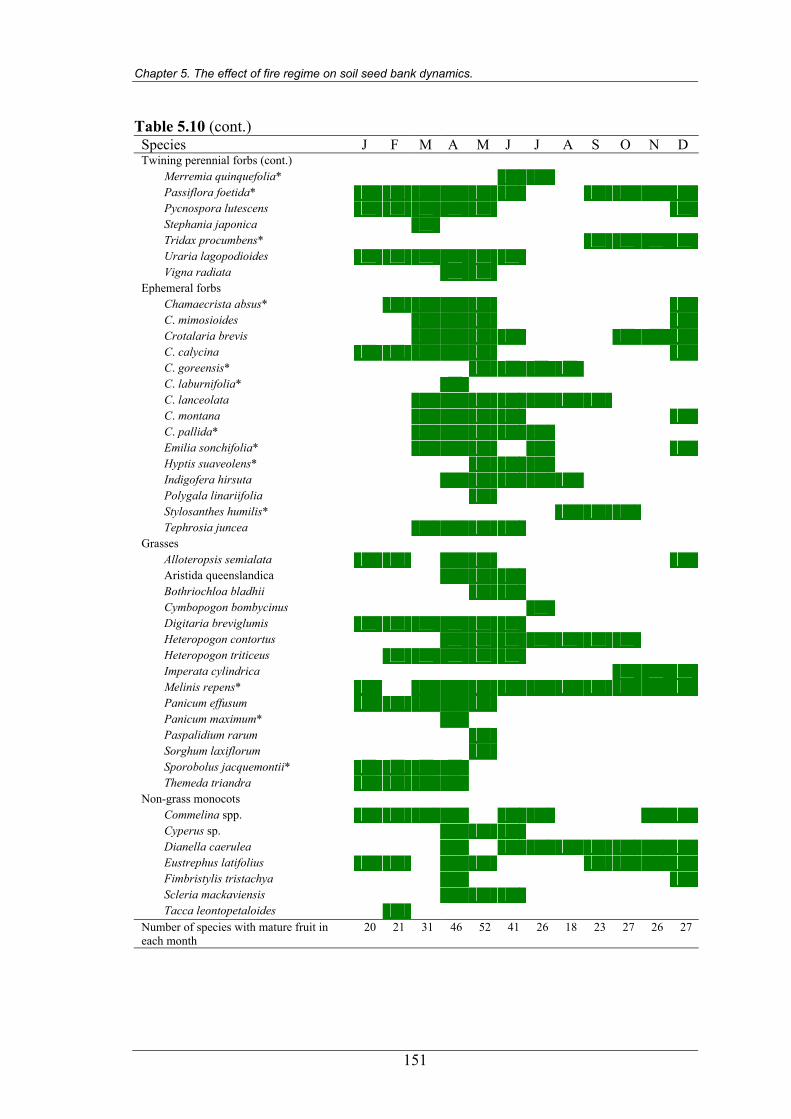
Chapter 5. The effect of fire regime on soil seed bank dynamics.
Table 5.10 (cont.) Species J F M A M J J A S O N D Twining perennial forbs (cont.)
Merremia quinquefolia* Passiflora foetida* Pycnospora lutescens Stephania japonica Tridax procumbens* Uraria lagopodioides Vigna radiata
Ephemeral forbs Chamaecrista absus* C. mimosioides Crotalaria brevis C. calycina C. goreensis* C. laburnifolia* C. lanceolata C. montana C. pallida* Emilia sonchifolia* Hyptis suaveolens* Indigofera hirsuta Polygala linariifolia Stylosanthes humilis* Tephrosia juncea
Grasses Alloteropsis semialata Aristida queenslandica Bothriochloa bladhii Cymbopogon bombycinus Digitaria breviglumis Heteropogon contortus Heteropogon triticeus Imperata cylindrica Melinis repens* Panicum effusum Panicum maximum* Paspalidium rarum Sorghum laxiflorum Sporobolus jacquemontii* Themeda triandra
Non-grass monocots Commelina spp. Cyperus sp. Dianella caerulea Eustrephus latifolius Fimbristylis tristachya Scleria mackaviensis Tacca leontopetaloides
Number of species with mature fruit in each month
20 21 46 52 41 26 18 27 26 27
31 23
151
Chapter 5. The effect of fire regime on soil seed bank dynamics.
The PCA scatter plot indicated that the species composition in seed bank samples was
distinct to the composition in the floristic surveys (Figure 5.9). This distinction reflects
the higher species number per survey, and the greater consistency of species presence,
in the floristic surveys compared with seed bank samples. While 22 species occurred in
more than half of the 180 floristic surveys, only three species were recorded in more
than half of the 288 seed bank samples (Appendix 1). Most (84%) of the 64 species
detected in the seed bank occurred in a lower proportion of the seed bank samples than
floristic surveys. Digitaria breviglumis, which occurred in the greatest number of seed
bank samples (61%) was present in a higher percentage of the floristic surveys (94%).
Heteropogon triticeus, the species present in the most floristic surveys (97%), was
observed in only 58% of the seed banks samples. Ten species occurred in a higher
percentage of seed bank samples than floristic surveys, including the ephemeral forb I.
hirsuta, which was present in 57% of the seed bank samples and 48% of the floristic
surveys.
5.3.7 Fire effects on Corymbia clarksoniana seed production
The mean number of seeds per capsule of Corymbia clarksoniana was 5.0 (n = 30; s.e.
= 0.33). The late dry season fire of 1999 significantly reduced seed production (as
estimated by capsule density on the ground) in the following year, compared to unburnt
controls (H = 11.175; P < 0.004; Figure 5.10). Seed production in savanna burnt
during the early dry season fire was not significantly different from either unburnt or
late burnt sites.
2,447
152
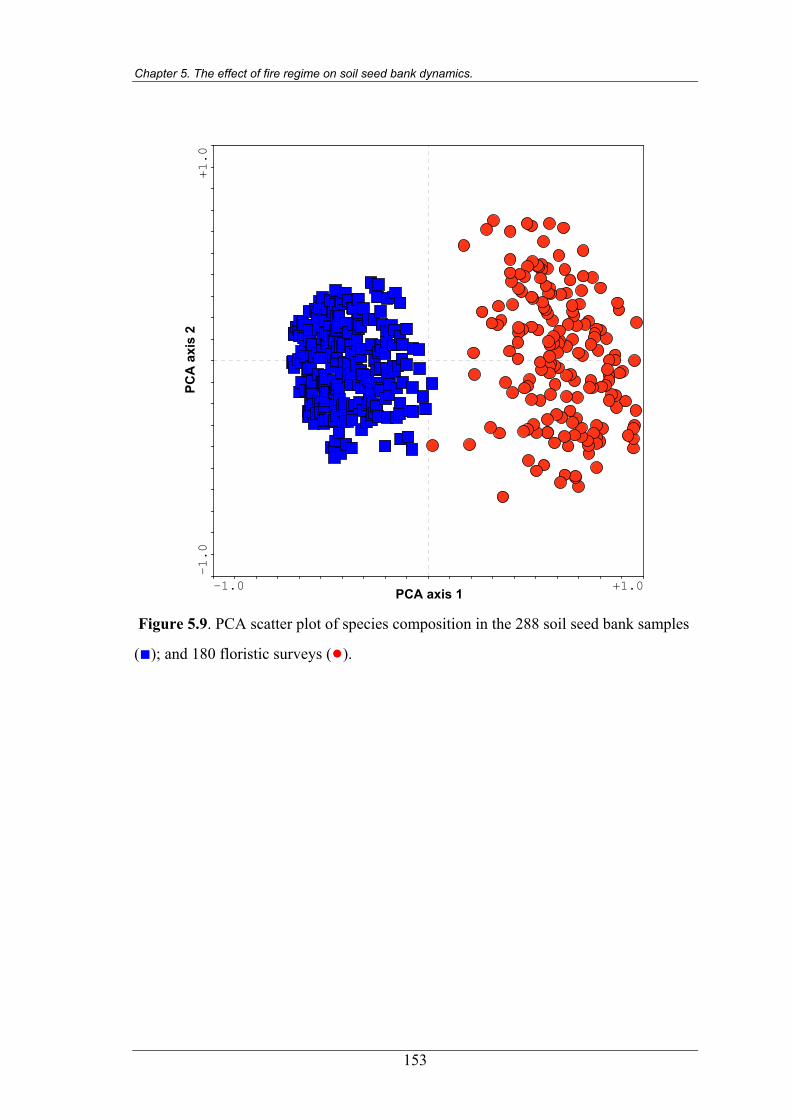
Chapter 5. The effect of fire regime on soil seed bank dynamics.
PCA axis 1
PCA
axi
s 2
-1.0 +1.0
-1.0
+1.0
Figure 5.9. PCA scatter plot of species composition in the 288 soil seed bank samples
(■); and 180 floristic surveys (●).
153
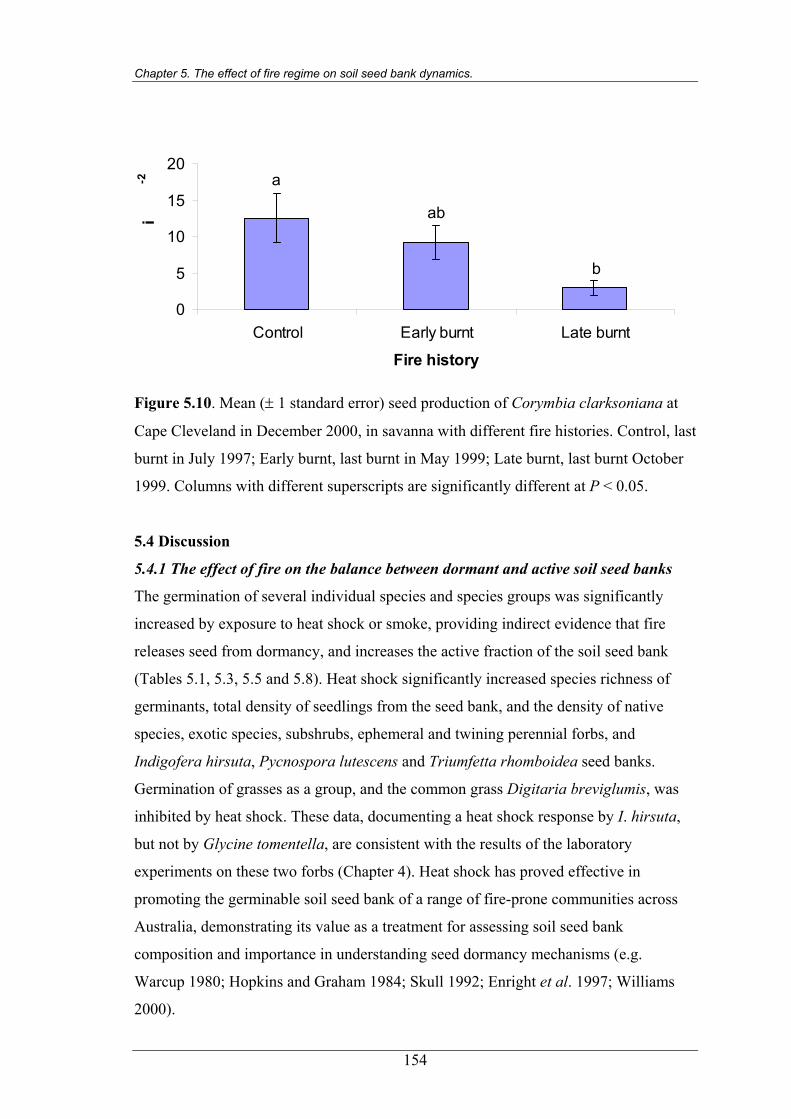
Chapter 5. The effect of fire regime on soil seed bank dynamics.
m)
ty (
ns
d de
See
0
5
10
15
20
Control Early burnt Late burnt
Fire history
i-2 a
ab
b
Figure 5.10. Mean (± 1 standard error) seed production of Corymbia clarksoniana at
Cape Cleveland in December 2000, in savanna with different fire histories. Control, last
burnt in July 1997; Early burnt, last burnt in May 1999; Late burnt, last burnt October
1999. Columns with different superscripts are significantly different at P < 0.05.
5.4 Discussion
5.4.1 The effect of fire on the balance between dormant and active soil seed banks
The germination of several individual species and species groups was significantly
increased by exposure to heat shock or smoke, providing indirect evidence that fire
releases seed from dormancy, and increases the active fraction of the soil seed bank
(Tables 5.1, 5.3, 5.5 and 5.8). Heat shock significantly increased species richness of
germinants, total density of seedlings from the seed bank, and the density of native
species, exotic species, subshrubs, ephemeral and twining perennial forbs, and
Indigofera hirsuta, Pycnospora lutescens and Triumfetta rhomboidea seed banks.
Germination of grasses as a group, and the common grass Digitaria breviglumis, was
inhibited by heat shock. These data, documenting a heat shock response by I. hirsuta,
but not by Glycine tomentella, are consistent with the results of the laboratory
experiments on these two forbs (Chapter 4). Heat shock has proved effective in
promoting the germinable soil seed bank of a range of fire-prone communities across
Australia, demonstrating its value as a treatment for assessing soil seed bank
composition and importance in understanding seed dormancy mechanisms (e.g.
Warcup 1980; Hopkins and Graham 1984; Skull 1992; Enright et al. 1997; Williams
2000).
154
Chapter 5. The effect of fire regime on soil seed bank dynamics.
Exposure to smoke at ambient temperature significantly increased the germination of
native species, upright perennial forbs, grasses as a group and the common grasses D.
breviglumis and Heteropogon triticeus from the seed bank (Table 5.8). Smoke has been
reported to increase germination from the soil seed bank in a range of eucalypt
woodland flora, including grasses and forbs (Enright et al. 1997; Roche et al. 1998;
Lloyd et al. 2000; Read et al. 2000). In accordance with the laboratory experiment, no
evidence was found that smoke plays a role in seed dormancy release for the ten
legumes examined in Chapter 4.
The mid dry season fire of 1997 significantly increased the total density of the
untreated seed bank, as well as the density of natives, upright perennial forbs and the
common grass H. triticeus (Table 5.1). The late dry season fire of 1999 significantly
increased the density of seedlings emerging from the untreated seed bank overall, and
that of combined natives and upright perennial forbs (Table 5.7). Assessment of
seedlings emerging from the untreated seed bank samples documented the active seed
bank (Figure 5.1), plus seed with innate or enforced dormancy that was broken through
the process of soil collection and incubation in the shadehouse. As the soil collection
and incubation process was identical for samples from control, early burnt and late
burnt savanna, the significant increase in seedling density from untreated seed bank
collected after the mid dry season 1997, and late dry season 1999 fires provide direct
evidence that these fires broke seed dormancy of a range of species, thereby increasing
the active fraction of the soil seed bank. Odgers (1996) reported a similar stimulation of
the seed banks of forbs by a fire in a eucalypt woodland of south-eastern Queensland.
The early dry season fires of 1999 at Cape Cleveland did not significantly promote the
active fraction of the total seed bank or the seed bank of any species or groups (Table
5.7).
The germination of the upright perennial forbs and H. triticeus was promoted by smoke
rather than heat shock (Table 5.8) and therefore in addition to producing greater heat
penetration into the topsoil, late dry season fires may also expose a greater proportion
of the soil seed bank to smoke. Overall, these results indicate that several aspects of the
passage of fire including heat shock, smoke and elevated nitrate levels (Chapter 4)
155

Chapter 5. The effect of fire regime on soil seed bank dynamics.
combine to break seed dormancy of a range of savanna species, and that mid to late dry
season fires provide a greater dormancy release stimulus than early dry season fires.
5.4.2 Distribution of seed in the topsoil
The seed bank was more abundant at soil depths of between 3 and 40 mm than in the
surface 3 mm, indicating seed burial and incorporation within the topsoil occurs (Table
5.1). This may occur via a seed-based mechanism, such as the twisting action of
hygroscopic awns, or through the activities of fauna, especially ants (Tothill 1969;
Andrew and Mott 1983). The lower density of surface seed may also indicate greater
levels of mortality of seed exposed to the elements.
5.4.3 Seed bank composition and abundance
The seed bank density of eucalypt savanna at Cape Cleveland ranged from 50 to 792
seeds m-2 (for samples to 5 cm depth; Tables 5.4, 5.6 and 5.9), which is a low to
moderate density in comparison to other eucalypt communities across Australia (Table
5.11) and in comparison with several annual grasses that dominate the ground layer of
some Australian tropical savannas. For instance, seed bank density of the annual
grasses Sorghum intrans and Schizachyrium fragile have been observed at over 2000
seeds m-2 (Andrew 1986; Crowley and Garnett 1999). The seed bank density at Cape
Cleveland is also low in comparison with a tropical savanna located approximately 50
km to the south-west, which was cleared and over-sown with exotic annual grasses and
legumes, (McIvor 1987; Table 5.11). However, the bulk of seed in the tropical pasture
studied by McIvor (1987) was from a few, mainly exotic, species. The Cape Cleveland
seed bank contained 19 species common to McIvor’s (1987) study. He found that all of
these species produced average seed banks of [ 60 seeds m-2 and 14 species averaged
[10 seeds m-2. This suggests that the low to moderate seed bank density documented at
Cape Cleveland is typical of the tropical savannas in the region that have not been over-
sown with exotic pasture species.
156
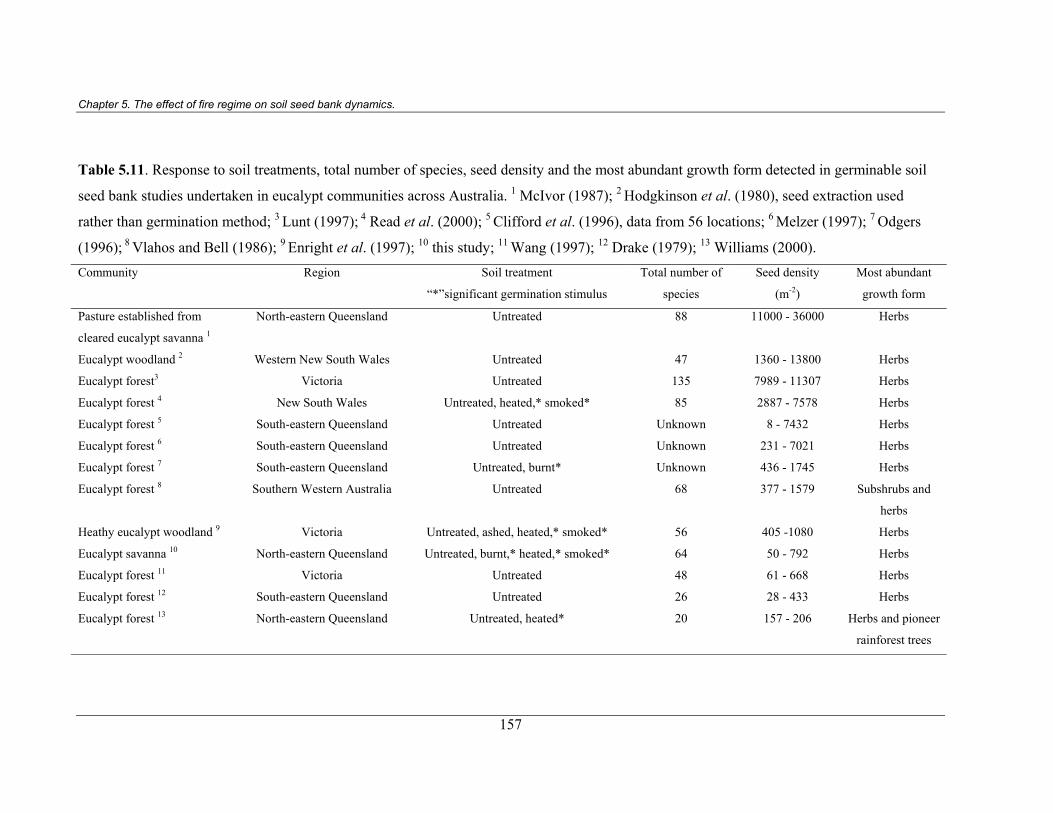
Chapter 5. The effect of fire regime on soil seed bank dynamics.
157
Table 5.11. Response to soil treatments, total number of species, seed density and the most abundant growth form detected in germinable soil
seed bank studies undertaken in eucalypt communities across Australia. 1 McIvor (1987); 2 Hodgkinson et al. (1980), seed extraction used
rather than germination method; 3 Lunt (1997); 4 Read et al. (2000); 5 Clifford et al. (1996), data from 56 locations; 6 Melzer (1997); 7 Odgers
(1996); 8 Vlahos and Bell (1986); 9 Enright et al. (1997); 10 this study; 11 Wang (1997); 12 Drake (1979); 13 Williams (2000). Community Region Soil treatment
“*”significant germination stimulus
Total number of
species
Seed density
(m-2)
Most abundant
growth form
Pasture established from
cleared eucalypt savanna 1
North-eastern Queensland Untreated 88 11000 - 36000 Herbs
Eucalypt woodland 2 Western New South Wales Untreated 47 1360 - 13800 Herbs
Eucalypt forest3 Victoria Untreated 135 7989 - 11307 Herbs
Eucalypt forest 4 New South Wales Untreated, heated,* smoked* 85 2887 - 7578 Herbs
Eucalypt forest 5 South-eastern Queensland Untreated Unknown 8 - 7432 Herbs
Eucalypt forest 6 South-eastern Queensland Untreated Unknown 231 - 7021 Herbs
Eucalypt forest 7 South-eastern Queensland Untreated, burnt* Unknown 436 - 1745 Herbs
Eucalypt forest 8
Southern Western Australia Untreated 68 377 - 1579 Subshrubs and
herbs
Heathy eucalypt woodland 9 Victoria Untreated, ashed, heated,* smoked* 56 405 -1080 Herbs
Eucalypt savanna 10 North-eastern Queensland Untreated, burnt,* heated,* smoked* 64 50 - 792 Herbs
Eucalypt forest 11 Victoria Untreated 48 61 - 668 Herbs
Eucalypt forest 12 South-eastern Queensland Untreated 26 28 - 433 Herbs
Eucalypt forest 13 North-eastern Queensland Untreated, heated* 20 157 - 206 Herbs and pioneer
rainforest trees
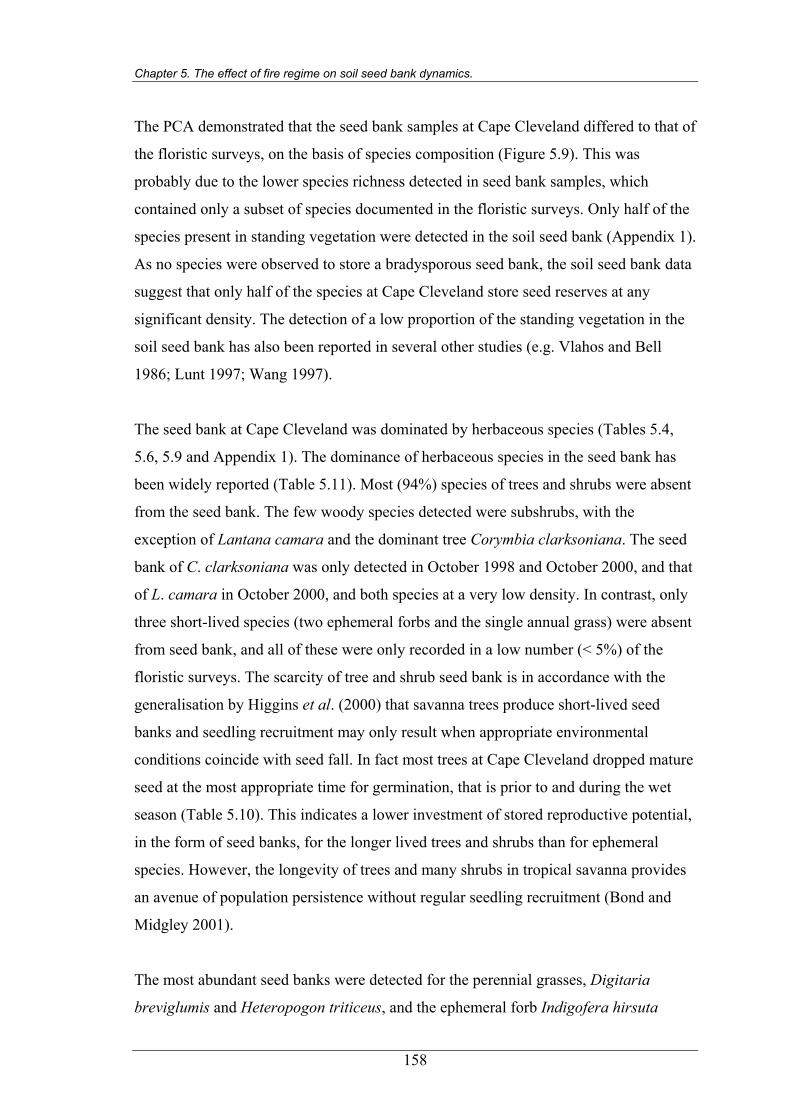
Chapter 5. The effect of fire regime on soil seed bank dynamics.
The PCA demonstrated that the seed bank samples at Cape Cleveland differed to that of
the floristic surveys, on the basis of species composition (Figure 5.9). This was
probably due to the lower species richness detected in seed bank samples, which
contained only a subset of species documented in the floristic surveys. Only half of the
species present in standing vegetation were detected in the soil seed bank (Appendix 1).
As no species were observed to store a bradysporous seed bank, the soil seed bank data
suggest that only half of the species at Cape Cleveland store seed reserves at any
significant density. The detection of a low proportion of the standing vegetation in the
soil seed bank has also been reported in several other studies (e.g. Vlahos and Bell
1986; Lunt 1997; Wang 1997).
The seed bank at Cape Cleveland was dominated by herbaceous species (Tables 5.4,
5.6, 5.9 and Appendix 1). The dominance of herbaceous species in the seed bank has
been widely reported (Table 5.11). Most (94%) species of trees and shrubs were absent
from the seed bank. The few woody species detected were subshrubs, with the
exception of Lantana camara and the dominant tree Corymbia clarksoniana. The seed
bank of C. clarksoniana was only detected in October 1998 and October 2000, and that
of L. camara in October 2000, and both species at a very low density. In contrast, only
three short-lived species (two ephemeral forbs and the single annual grass) were absent
from seed bank, and all of these were only recorded in a low number (< 5%) of the
floristic surveys. The scarcity of tree and shrub seed bank is in accordance with the
generalisation by Higgins et al. (2000) that savanna trees produce short-lived seed
banks and seedling recruitment may only result when appropriate environmental
conditions coincide with seed fall. In fact most trees at Cape Cleveland dropped mature
seed at the most appropriate time for germination, that is prior to and during the wet
season (Table 5.10). This indicates a lower investment of stored reproductive potential,
in the form of seed banks, for the longer lived trees and shrubs than for ephemeral
species. However, the longevity of trees and many shrubs in tropical savanna provides
an avenue of population persistence without regular seedling recruitment (Bond and
Midgley 2001).
The most abundant seed banks were detected for the perennial grasses, Digitaria
breviglumis and Heteropogon triticeus, and the ephemeral forb Indigofera hirsuta
158
Chapter 5. The effect of fire regime on soil seed bank dynamics.
(Tables 5.4, 5.6, 5.9 and Appendix 1). Ephemeral forbs in general, and especially I.
hirsuta, displayed persistence in seed bank during the third year after fire, when there
was limited abundance of standing plants (Chapter 3). This indicates the importance of
soil seed banks for population persistence of these species.
5.4.4 Seasonal and annual dynamics in the soil seed bank
Seasonal fluctuations were detected in the seed bank, increasing through the dry season
to a maximum, for most species, in the late dry season, and declining to a minimum by
the mid wet season (Tables 5.3, 5.5 and 5.8). These results correspond with McIvor’s
(1987) study in a tree-cleared and over-sown pasture, 50 km from Cape Cleveland, who
documented peak seed bank densities in the late dry season and at the start of the wet
season. Soil seed banks of eucalypt forests in south-eastern Queensland display less
distinct seasonal patterns and show strong variation between species (e.g. Drake 1979;
Clifford et al. 1996; Melzer 1996; Odgers 1999). This may result from the reduced
contrast in rainfall between seasons in south-eastern, compared with north-eastern
Queensland.
The seasonal dynamics of seed banks are consistent with the timing of annual seed
production at Cape Cleveland (Table 5.10). Peak seed production occurred during the
early to mid dry season, so that the accumulation of seeds reached a maximum by the
end of the dry season and start of the wet season. A comparison of seed production
times for species that also occur at Kakadu National Park, in the Northern Territory
(Brennan 1996), indicates seed production extends further into the dry season at Cape
Cleveland. This may relate to the more gradual decline in rainfall at the start of the dry
season on the east coast (Figure 2.2).
Soil seed banks of several tropical grasses, both annual and perennial, have been
identified as transient in nature, requiring seed replenishment annually due to losses
during the wet season (Andrew and Mott 1983; Mott and Andrew 1985). The strong
declines recorded during each wet season in seed bank density of H. triticeus, and
grasses as a group, indicate reliance on annual seed input to maintain seed bank
density. This contrasts with the persistence of viable seeds of ephemeral forbs,
159
Chapter 5. The effect of fire regime on soil seed bank dynamics.
including I. hirsuta and the common grass D. breviglumis which did not display a
significant decline over the wet season but a persistence of seed bank.
A lower seed density and species richness were detected in the seed bank in 1998 than
in 1999 and 2000 (Table 5.3). The increase in seed bank density in 1999 and 2000,
which included both native and exotic species, corresponds with the overall increase in
abundance of native and exotic species after the 1997 fire (Chapter 3). Thus the seed
bank was reflecting the general increase in species abundance during the study, which
may have been aided by the above average rainfall in 1997 and 1998 (Table 2.1).
Fire had limited influence on the seasonal and annual dynamics of the seed bank
overall (Tables 5.3, 5.5 and 5.8). However, significant interactions were demonstrated
between fire and season for natives as a whole, and D. breviglumis, possibly due to the
increase in the active component of the seed bank in savanna burnt in the late dry
season. Subshrubs and non-grass monocots displayed higher seed bank density in
unburnt savanna, suggesting fire depleted the seed bank through either seed mortality
and/or germination. The seed bank density of the ephemeral forb, I. hirsuta, was
highest in savanna burnt in the early dry season, which may have been enhanced by
recruitment and subsequent seed production following fire.
5.4.5 Fire effects on Corymbia clarksoniana
The late dry season fires reduced seed production by the dominant tree, C. clarksoniana
(Figure 5.10). This probably resulted from mortality of flower buds from the high
scorch height produced by the late fires, which tended to singe the entire canopy.
Setterfield (1997b) found both early and late dry season annual fires reduced seed
production by the tropical eucalypts, Eucalyptus miniata and E. tetrodonta. She
considered the primary cause of seed reduction from late dry season fires was the high
canopy scorch produced by fires of the previous year, which killed developing flower
buds. The early dry season fires caused flower abortion, thereby inhibiting seed
production in the same year as the fire. She considered this was due to some canopy
scorching, plus some unknown additional effect of fire, as the early dry season fires did
not cause enough canopy scorch to completely destroy flower buds. Setterfield’s
(1997b) study therefore supports the conclusion that extensive canopy scorch produced
by late dry season fires reduced seed production by C. clarksoniana in the year
160
Chapter 5. The effect of fire regime on soil seed bank dynamics.
following burning. Her results also suggest that seed production of tropical eucalypts
can be reduced by early dry season fires, and therefore seed production of C.
clarksoniana may have been reduced by early dry season fires in 1999.
5.5 Conclusion
The use of soil treatments in this study (i.e. heat shock and smoke) were useful for
enhancing the detection of germinable soil seed banks, although it is possible that direct
seed extraction may have detected additional species. Seed extraction methods can be
particularly useful for detecting large seeded species, although are likely to be
inadequate for small seeded species and therefore both seed extraction and germination
methods have advantages and disadvantages for detecting community-level seed bank
dynamics (Pierce and Cowling 1991).
Fire, and the fire-related cues heat shock and smoke, have been demonstrated to break
seed dormancy for a range of tropical savanna species. However early dry season fires,
after a two year fire-free interval, are less effective at breaking seed dormancy than late
dry season fires of the same interval, or mid dry season fires following a three year
interval.
Only half of the species present in the standing vegetation were detected in the soil seed
bank. The seed bank was dominated by herbaceous species and contained few seeds of
trees and shrubs. This suggests the longer-lived woody species invest fewer resources
in maintaining a store of reproductive potential (i.e. seeds). Seedling recruitment of
these woody species would be more likely to occur when appropriate germination
conditions coincided with seed fall, which is timed to occur prior to, or during the wet
season. In contrast, ephemeral species displayed a persistent seed bank that maintains
their populations on-site, even in the absence of standing plants.
Strong and consistent seasonal fluctuations, and some differences between years, were
documented in the seed bank. Seed banks peaked in the late dry season as a
culmination of seed input throughout the year. Declines in seed banks over the wet
season indicate considerable annual input is required for the maintenance of seed bank
density. Seed banks were lowest in 1998, the year following the 1997 fire, however a
161
Chapter 5. The effect of fire regime on soil seed bank dynamics.
162
decline after the 1999 fires was only apparent for a few species, and therefore the
higher seed density in 1999 and 2000 may relate to other factors such as rainfall, rather
than fire.
While fire affected the balance between the proportion of dormant and active
components of the seed bank, it had only limited influence on the overall seasonal and
annual dynamics in soil seed banks. However, late dry season fires significantly
reduced seed production of the dominant tree, Corymbia clarksoniana, possibly as a
result of mortality of young flower buds from high canopy scorch.
Chapter 3 documented a pulse of species abundance after fire, especially those of the
late dry season, in the tropical savanna at Cape Cleveland. The results from this chapter
and Chapter 4 indicate fire plays a crucial role in breaking seed dormancy in a range of
savanna species and that late dry season fires provide a greater stimulus than early dry
season fires for releasing seed from dormancy. There are also more seeds available
during the late dry season that can be affected by fire. The next chapter examines
seedling emergence and assesses the relative importance of seed bank size and the
capacity of fires to break seed dormancy, on patterns of seedling recruitment.
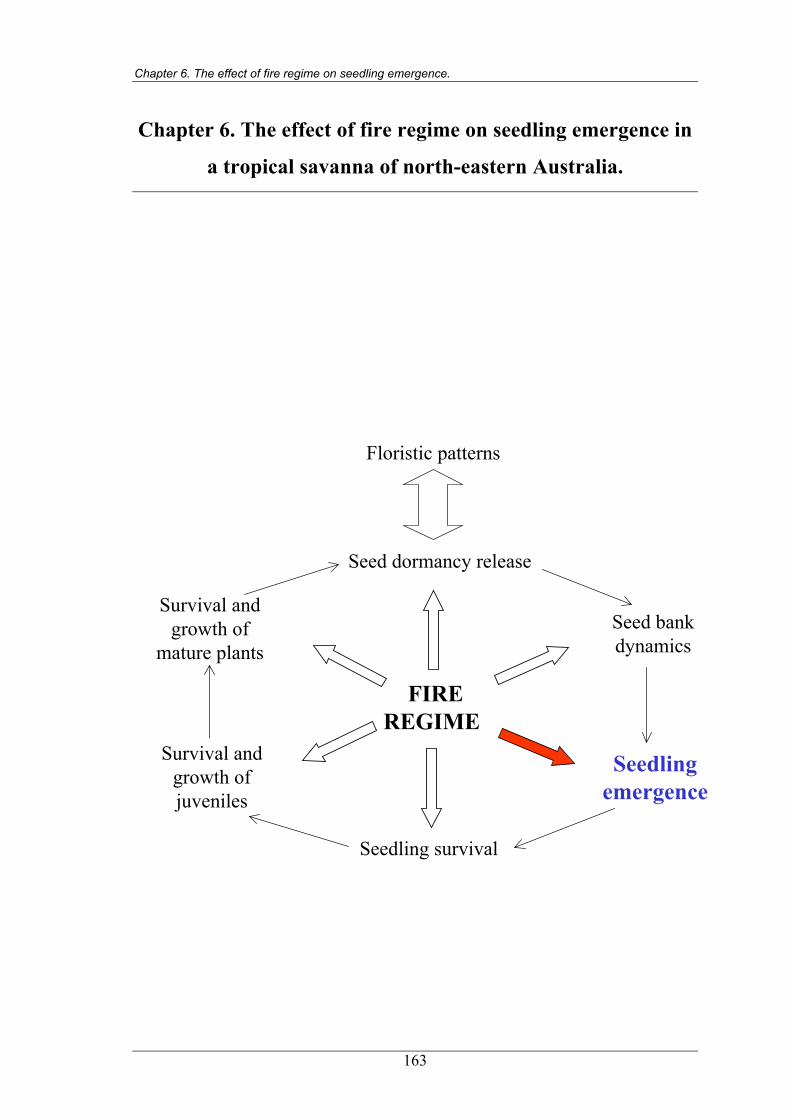
Chapter 6. The effect of fire regime on seedling emergence.
Chapter 6. The effect of fire regime on seedling emergence in
a tropical savanna of north-eastern Australia.
FIREREGIME
Seed dormancy release
Floristic patterns
Seed bankdynamics
Seedlingemergence
Survival andgrowth ofjuveniles
Survival andgrowth of
mature plants
Seedling survival
163
Chapter 6. The effect of fire regime on seedling emergence.
6.1. Introduction
Seedling emergence is subject to the availability of seeds and safe sites, which provide
a moisture, light and temperature regime appropriate for germination (Harper 1977). In
Australian tropical savannas, seedling emergence of many annual grasses, such as
Schizachyrium spp. and Sorghum spp., is linked to seasonal cycles in rainfall, with
abundant recruitment occurring at the start of each wet season (Andrew and Mott 1983;
Crowley and Garnett 1999). Seedling emergence of tropical savanna trees, such as
eucalypts and Melaleuca viridiflora, is irregular and may primarily occur in years with
above average rainfall (Lacey 1974; Gill et al. 1990; Fensham 1992; Crowley and
Garnett 1998). Hence the consistency of wet season rainfall, and the quantity of rain,
play a critical role in seedling emergence of many Australian tropical savanna species.
Seedling emergence in many fire-prone communities occurs primarily in the first wet
season following fire. This has been documented for species of Californian chaparral
(Keeley and Bond 1997), South African fynbos (Pierce and Cowling 1991), heaths of
south-eastern (Bradstock 1991) and south-western Australia (Bell et al. 1987b), and
temperate eucalypt forests (Ashton 1979) and woodlands (Purdie and Slatyer 1976). In
tropical savannas, fire is known to enhance seedling emergence of some perennial
grasses, such as Heteropogon contortus (Shaw 1957; Tothill 1969). Fire stimulates the
release seed from dormancy, or from canopy storage, removes competitive inhibition
from overstorey and grass layers, and often enhances soil nutrient availability (Whelan
1995; Bond and van Wilgen 1996).
Some tropical savanna trees recruit seedlings during intervals between fires, rather than
in the immediate post-fire environment (Puyravaud et al. 1995; Hoffman 1996).
Eucalyptus miniata, which co-dominates many tropical savannas across the Northern
Territory and Western Australia, recruits seedlings in greater numbers in unburnt rather
than recently burnt savanna (Setterfield 1997b).
The duration of fire intervals can influence seedling recruitment by affecting seed bank
size and fire intensity (Whelan 1995). Fire intensity influences seed mortality and the
proportion of seeds that are released from dormancy (Keith 1996). Fire season can
affect seedling recruitment through the coincidence of fire with seasonal fluctuations in
164
Chapter 6. The effect of fire regime on seedling emergence.
seed bank size and post-fire rainfall, and its influence on fire intensity (Whelan 1995;
Bond and van Wilgen 1996).
An increase in plant abundance occurs in the year following fire in eucalypt savanna
near Townsville (Chapter 3). This may result from increased vegetative growth and/or
seedling emergence. In this savanna, fire breaks seed dormancy of many species, with a
greater proportion of seeds released from dormancy by late rather than early dry season
fires (Chapters 4 and 5). Seed bank size, and hence the density of seed available to be
influenced by fire, is larger in the late dry season than the early dry season (Chapter 5).
This chapter examines the patterns of seedling emergence in eucalypt savannas near
Townsville. It assesses seedling emergence after several fires, and in the absence of
fire. The experimental removal of the grass layer in unburnt savanna is also examined
to help understand the effect of fire on seedling emergence. Specific questions are:
1. Does seedling emergence occur primarily in the first year after fire or at similar
densities throughout fire intervals?
2. Are seedling emergence patterns consistent across eucalypt savannas of the
Townsville region?
3. What are the effects of fire season on seedling emergence?
4. What is the total density of seedlings that emerge over a year?
5. What level of seedling emergence is promoted by the removal of herbaceous cover?
6. What proportion of the soil seed bank germinates after fires of different seasons?
7. What is the relationship between the species composition of the seedling
community, the standing vegetation and the soil seed bank?
165
Chapter 6. The effect of fire regime on seedling emergence.
6.2 Methods
6.2.1 Sampling methods
6.2.1a Seedling emergence surveys in the Townsville region
Seedling emergence was measured in recently burnt savanna and adjacent savanna that
had not been burnt for several years, in each of three locations in the Townsville
region: Mt Elliot, Castle Hill and Many Peaks Range (Figure 2.1). The aim of the
surveys was to compare seedling emergence in recently burnt and longer unburnt
savanna to examine whether a pulse of germination occurs after fire. The three
locations were used in addition to surveys at the Cape Cleveland study site to determine
whether seedling emergence patterns were consistent across the Townsville region. All
locations are incorporated within a Protected Area, or local council reserve, and have
been excluded from stock grazing for at least 20 years. All sites are located along the
coastal floodplain at less than 150 m altitude. All sites are based on granite derived
soils, with the exception of Many Peaks Range, which is based on a mixture of
metamorphosed acid volcanic parent material (Paine and Smith 1972).
Mt Elliot
A fire burnt through parts of the Mt Elliot section of Bowling Green Bay National Park
during September 2000. Seedling emergence surveys were undertaken at Mt Elliot in
eucalypt savanna surrounding Alligator Creek (Figure 2.1). The surveys compared
seedling emergence in the recently burnt savanna on the western side of Alligator
Creek with that of savanna that had remained unburnt for four years on the eastern side.
On the western side of the creek, burnt in September 2000, three separate sites were
located between minor creek systems, which were approximately 700 m to 2000 m
apart. In each of these three sites, seedlings were surveyed across an area of
approximately 1 ha. The exact location of each site was determined using a random
number, between one and 100, which determined the number of paces before the corner
of the survey site. The three unburnt sites were roughly opposite the burnt sites on the
opposite side of Alligator Creek. Again a random number from one to 100 was used to
locate the corner of each site.
166
Chapter 6. The effect of fire regime on seedling emergence.
The seedling surveys at Mt Elliot were carried out on the 6th December 2000, after the
start of the wet season. This meant the survey was undertaken after abundant seedling
emergence and whilst plants remained small enough to be easily distinguished as
seedlings. Sprouting plants, and established plants in unburnt savanna, were
distinguished from seedlings on the basis of swollen stem bases from which shoots
emerge. Seedlings typically retained cotyledons and their identification was aided by
the experience gained during the soil seed bank study (Chapter 5). Seedling counts
were made within a 1m2 quadrat, which was thrown 50 times whilst traversing up and
back through each of the 1 ha sites. The quadrat was thrown in a random direction at
each of the 50 points, which were five paces apart.
Many Peaks Range
On the 7th December 2000, seedling emergence surveys were undertaken in eucalypt
savanna at Many Peaks Range (Figure 2.1) that was burnt in September 2000 and
adjacent savanna that had remained unburnt for four years. Three 1 ha sites were
assessed in each of recently burnt and longer unburnt savanna, all of which were
located on the eastern side on the lower foothills (below 100 m altitude). Sites were
spaced approximately 200 m apart and the starting corner of each site was determined
by a random number between one and 100. The entire hillside typically burns as one
unit, however active fire-protection was used for the first time in September 2000 to
provide a mosaic of burnt and unburnt savanna for general habitat management.
Seedling emergence surveys in 50, 1m2 quadrats in each of the 1 ha sites was
undertaken as described for the Mt Elliot seedling surveys.
Castle Hill
A fire burnt through most of the eucalypt savanna on Castle Hill (Figure 2.1) in August
1999. Seedling surveys were undertaken on relatively level ground at approximately
120 m altitude on 26th January 2000. Seedling emergence in recently burnt savanna
was surveyed in 1 ha sites located on either side of the Castle Hill road. The history of
recent fires on the northern side of the road is unknown, although it is likely to have
received regular fires, as sections of the hill are burnt in most years. The southern side
was burnt in September 1997 and again in August 1999. The corner location of both
sites was determined by a random number between one and 100. Seedling counts in 50,
167
Chapter 6. The effect of fire regime on seedling emergence.
1m2 quadrats in both of the 1 ha sites were performed as described for the Mt Elliot
seedling surveys. Surveys were also undertaken in four small patches of unburnt
savanna that had been protected from fire by walking tracks. These unburnt areas
totalled approximately 0.15 hectares and probably had a similar fire history to the
surrounding savanna and were burnt with the surrounding area in a fire on 2001 (pers.
obs.). Therefore, 100 burnt and 50 unburnt 1m2 quadrats were sampled at Castle Hill,
while 150, 1m2 quadrats were sampled in each of the burnt and unburnt savannas at Mt
Elliot and Many Peaks Range.
6.2.1b Seedling emergence surveys at Cape Cleveland
Annual seedling emergence surveys were undertaken across the nine, 1 ha blocks at the
Cape Cleveland study site (Figure 2.1) each December, from 1997 to 2000. Each
annual seedling survey involved seedling counts in 50, 1m2 quadrats. As described for
Mt Elliot, the 1m2 quadrat was thrown 50 times whilst walking up and back through
each of the nine, 1 ha blocks. The quadrat was thrown in a random direction at each of
the 50 points, which were five paces apart. Therefore a total of 36 seedling surveys
(four annual surveys in each of the nine 1 ha blocks) were undertaken, each involving
seedling counts in 50, 1m2 quadrats.
Mass seedling emergence of the dominant tree Corymbia clarksoniana occurred across
the Cape Cleveland site immediately prior to the December 1998 seedling survey. It
was noticed that considerable germination also occurred within the annually burnt fire
break block, which is located adjacent to the nine, 1 ha trial blocks (Figure 2.4). The
density of C. clarksoniana seedlings along the fire break block, burnt three months
prior to the December 1998 seedling survey, was compared with that documented
within the nine 1 ha blocks, which at that stage had remained unburnt for 16 months.
The density of C. clarksoniana seedlings was also measured along the 4 m wide
slashed fire line, that separates the fire break block with the nine 1 ha blocks, which
was cut four months prior to the December 1998 survey. Seedlings of C. clarksoniana
were counted within 50, 1m2 quadrats along both the fire break block and the adjacent
slashed fire line, using the method described above, except that the 50 quadrats were
spaced 10 m apart to cover the length of these narrow blocks with a single transect.
168
Chapter 6. The effect of fire regime on seedling emergence.
The opportunity to document seedling emergence of C. clarksoniana in recently burnt
and slashed savanna was taken because the recruitment of this dominant species had
not been observed in previous years, and seedling emergence of tropical eucalypts is
considered episodic (Fensham 1992; Setterfield 1997b). However, replication of
recently burnt and slashed treatments was not available in December 1998, so results
should be interpreted within this design constraint.
6.2.1c Safe sites for Corymbia clarksoniana
The one-off mass recruitment of C. clarksoniana in 1998 raised questions regarding the
safe-site requirements of this dominant species. The effects of fire and grass layer
removal on the seedling emergence of C. clarksoniana were experimentally tested to
assess whether the absence of grass cover, or some aspect of the ash bed, significantly
increased seedling emergence. Seeds were extracted from fallen capsules collected at
Cape Cleveland in October 2000, and pooled. An experiment was established to test the
effect of micro-site disturbance on seedling emergence. Five replicates of 100 seeds
were placed on the soil surface, within a 20 cm x 20 cm plot, in each of three micro-site
disturbance treatments:
Undisturbed; seeds placed in undisturbed savanna.
Burnt; seeds placed on recently burnt ground. Each of the replicate fires was
implemented across a 2 m x 3 m area on 19th October 2000, one hour prior to seed
sowing.
Cut; seeds were placed in an area that had the herbaceous layer cut and removed across
a circular area of 1.5 m radius.
The treatments were established along the edge of a control block, which had remained
unburnt for three years. One of the edges of the three unburnt control blocks was
randomly selected. Twenty-one possible plot locations were available along the 130 m
length of the control block, allowing the separation distance of 6 m required for burnt
treatments. Replicates of the three treatments were randomly allocated to the 21
available plot locations. Seeds were placed on the soil surface within plots on the 19th
October 2000. Seedling emergence was defined by cotyledon emergence and was
assessed weekly.
169
Chapter 6. The effect of fire regime on seedling emergence.
Seed viability was assessed by placing three replicates of 100 seeds onto moist filter
paper in a petri dish, sprayed with a 2g L-1 solution of fungicide (Thiram ®) and
incubated in a controlled temperature room at 27.5°C with a 12 h diurnal light regime.
After a fortnight, ungerminated seeds were assessed for viability using a tetrazolium
test (Moore 1985). A slit was made in seeds, which were then soaked in a 1%
tetrazolium solution in the dark for 48 h. Seeds were then dissected under a
microscope and assessed for the pink colouration that indicates a viable embryo. The
number of viable seeds detected in the tetrazolium test was added to the number of
seeds that germinated in the laboratory to produce a total number of viable seeds for
each replicate of the control treatment.
Despite rain falling within a fortnight of establishing the experiment (Table 2.1), very
limited seed germination was detected by the end of six weeks. A second experiment
was established on 4th December 2000 to investigate whether shallow burial of seed,
which has been documented to increase the germination of several temperate forest and
woodland species (Free 1951; Clarke and Davison 2001), would promote the
germination of C. clarksoniana. The experiment used the same micro-site disturbance
treatments described above (undisturbed, burnt and cut) for both surface sown seed and
buried seed. Seed burial involved covering the seed with approximately 5 mm of soil.
Each treatment was replicated three times using 25 seeds and each replicate was
randomly allocated to the previously established plots in the first C. clarksoniana field
experiment. There had been limited regrowth in the plots burnt or cut in October, so
that these treatments remained useful. Seeds were placed within 20 cm x 20 cm plots
which were established within the treated areas, adjacent to but not in the identical
positions of the 20 cm x 20 cm plots of the initial field experiment.
6.2.1d Total seedling emergence surveys at Cape Cleveland
The seedling surveys at Cape Cleveland, Castle Hill, Many Peaks Range and Mt Elliot
provided a snapshot of seedling density at the start of the wet season. However, they do
not provide information on the seedling emergence that occurs over the course of a
year. Therefore permanent 1m2 sites were established at Cape Cleveland to document
170
Chapter 6. The effect of fire regime on seedling emergence.
the full emergence of seedlings for one year, prior to and following the 1999 fire season
treatments (Chapter 2).
The effect of removal of the herbaceous layer on seedling emergence was examined to
help understand fire effects, by isolating the release from competition from the
herbaceous cover from the heat and chemical attributes of fire. The treatments were:
1. Undisturbed; savanna that was last burnt in July 1997 and remained undisturbed
(with the exception of some minor native herbivore grazing).
2. Early burnt; savanna burnt in early dry season fires (May 1999).
3. Late burnt; savanna burnt in late dry season fires (October 1999).
4. Early cut; herbaceous layer cut and removed from unburnt plots at the time of early
dry season fires, in savanna that was last burnt in July 1997.
5. Late cut; herbaceous layer cut and removed from unburnt plots at the time of late
dry season fires, in savanna that was last burnt in July 1997.
The undisturbed, early cut and late cut treatments were established in the three, 1 ha
control blocks, which were last burnt in July 1997 (Figure 2.4). The early burnt and late
burnt treatments were established in the respective early and late burnt 1 ha blocks,
which were all burnt in July 1997 and in either May 1999 (early burnt) or October 1999
(late burnt; Figure 2.4). Each treatment was represented by ten 1m2 plots in each of
three relevant 1 ha blocks at Cape Cleveland, providing a total of 30, 1m2 plots for each
of the five treatments. To facilitate re-location, each 1m2 plot was randomly allocated
to a corner of one of the four 100 m2 plots used in the floristic surveys (Chapter 3).
Plots for the cut treatment were established outside the allotted corner and the
herbaceous layer was removed from an area of 1.5 m radius, to reduce shading effects
on the 1m2 plots.
6.2.2 Statistical analyses
6.2.2a Seedling emergence surveys in the Townsville region
When considered individually, the seedling emergence surveys at Mt Elliot, Many
Peaks Range and Castle Hill are technically pseudo-replications of surveys of a single
burnt and adjacent unburnt area at each location (Underwood 1997). Therefore, all
surveys from the three locations (Mt Elliot, Many Peaks Range and Castle Hill) were
171
Chapter 6. The effect of fire regime on seedling emergence.
pooled and analysed together, providing samples from three separate fires and adjacent
longer unburnt savanna.
The intention was to compare seedling emergence in recently burnt and unburnt sites
using a one-factor ANOVA, which allowed samples to be nested into the Mt Elliot,
Many Peaks Range and Castle Hill sites. However, due to the many zeros in the data,
the variance heterogeneity was not solved by data transformations, so the statistical
significance of differences between burnt and unburnt savanna was assessed using a
non-parametric Mann-Whitney U-test (Zar 1999). This test does not allow for nesting
so seedling density within all 400 burnt 1m2 replicate quadrats were compared with all
350 unburnt 1m2 replicate quadrats.
Assessments were made for native and exotic species, growth form groups described in
Chapter 3 and common species that comprised at least 1% of the total seedling
emergence. Six taxa could not be identified and were excluded from the species group
analyses, so that the combined species category contained six more species than the
totals of the growth form groups, and natives and exotic species.
6.2.2b Seedling emergence surveys at Cape Cleveland
The difference between fire treatments was initially assessed using a repeated measures
ANOVA with the main factor, fire treatment, containing three levels (control, early and
late dry season burnt) and a repeated measures factor, years, with four levels (1997,
1998, 1999 and 2000). Homogeneity of variance was assessed using Cochran’s test
(Underwood 1997) and significant heterogeneity of variances could not be resolved
with data transformations. Therefore the non-parametric Friedman ANOVA by ranks
was used to test the significance of differences in seedling emergence in the four years
between 1997 and 2000, separately for the three replicate blocks for each of the control,
early and late burnt treatments (Figure 2.4). Where a significant difference was
detected between years, a Wilcoxon’s matched pair test was used as a post-hoc test,
with a Bonferroni adjustment of the significance level for multiple comparisons (Sokal
and Rohlf 1995). A Kruskal-Wallis ANOVA by ranks was used to examine differences
in seedling emergence between control, early and late burnt blocks in December 1999,
after the fire treatments implemented in that year. Where significant differences were
172
Chapter 6. The effect of fire regime on seedling emergence.
detected, a Mann-Whitney U-test was used as a post-hoc test, with a Bonferroni
adjustment for multiple comparisons (Sokal and Rohlf 1995). Due to the large number
of analyses of the same data set, a conservative significance level (P < 0.01) was set to
provide confidence in allocating significant fire effects.
6.2.2c Species composition of seedling emergence, soil seed bank and floristic surveys
The species composition in the seedling emergence surveys at Cape Cleveland was
compared with that of the soil seed bank samples (Chapter 5) and floristic surveys
(Chapter 3). The seedling composition from each set of 50, 1m2 quadrat surveys across
each 1 ha block was pooled to provide the species composition of seedlings in each
annual survey of each 1 ha block, providing 36 seedling surveys (four annual surveys
of the nine blocks). A Principle Components Analysis (PCA) was carried out, using the
CANOCO program (ter Braak and Smilauer 1998), on a data set containing the species
composition in the floristic surveys from 1997 to 2001 (Chapter 3), the soil seed bank
samples collected from July 1997 to October 2000, and the seedling surveys undertaken
at Cape Cleveland between 1997 and 2000. The PCA was based on species presence or
absence data, as methods of estimating abundance differed between floristic surveys,
soil seed bank samples and seedling surveys. The PCA analysis in CANOCO can only
analyse 500 samples, and as the entire floristic surveys, soil seed bank samples and
seedling surveys total 504 samples, four of the 27 soil seed bank samples that
underwent the smoke treatment in 2000 were randomly selected and removed from the
analyses. Restricting the elimination to the smoked treatments ensured all untreated and
heated samples, which were the consistent seed bank treatments between 1997 and
2000, would remain in the PCA.
6.2.2d Safe sites for Corymbia clarksoniana
The first field germination experiment of Corymbia clarksoniana was initially assessed
for statistically significant differences between surface sown seeds in undisturbed,
burnt and cut plots using a one-factor ANOVA. Homogeneity of variances was
assessed using a Cochran’s test (Underwood 1997). Variance heterogeneity could not
be resolved using data transformations, so treatment differences were assessed for
statistical significance using a non-parametric Kruskal-Wallis ANOVA by ranks.
173
Chapter 6. The effect of fire regime on seedling emergence.
The second C. clarksoniana field germination experiment was examined using a two-
factor ANOVA assessing micro-site disturbance with three levels (undisturbed, burnt
and cut) and the factor seed burial (surface sown and buried seed). Data for both
experiments were expressed as percentage of viable seed, as determined from the
results of germination in the laboratory and the tetrazolium test.
6.2.2e Total seedling emergence surveys at Cape Cleveland
The statistical significance of differences in total seedling emergence between
undisturbed, early and late burnt and early and late cut savanna were assessed using a
one-factor ANOVA. Homogeneity of variance was assessed using Cochran’s test
(Underwood 1997). All variance heterogeneity was resolved using log (x +1) data
transformations.
The data on total density of seedling emergence were used to assess the proportion of
the untreated soil seed bank that emerged as seedlings. This was based on the untreated
seed bank samples because they provided a closer approximation to the active seed
bank than seed bank samples exposed to oven-heating and smoke, which documented
many seeds that contained innate dormancy (Chapter 5). The seedlings that emerged
over the dry season, between 31st July and 23rd October 1999, in the undisturbed, early
burnt and early cut plots were expressed as a percentage of the untreated germinable
soil seed bank collected on the 31st July 1999, the first seed bank collection after the
early dry season fire (Chapter 5). The seedlings that emerged over the wet season,
between 23rd October 1999 and 29th February 2000, in the undisturbed, early and late
burnt and early and late cut plots were expressed as a percentage of the untreated seed
bank collected on the 23rd October 1999, the first seed bank collection after the late dry
season fire (Chapter 5). The seedlings that emerged over the wet season in all plots,
between 23rd October 1999 and 29th February 2000, were also expressed as a
percentage of the decline in untreated seed bank over that period.
A one-factor ANOVA was used to assess the statistical significance of differences
between treatments for the percentage mid dry season seed bank that emerged over the
dry season, the percentage late dry season seed bank that emerged over the wet season,
and the wet season seedling emergence as a percentage of the decline in seed bank over
174
Chapter 6. The effect of fire regime on seedling emergence.
the wet season (i.e. the difference between the October 1999 and February 2000 seed
bank densities).
6.3 Results
6.3.1 Seedling emergence surveys around Townsville
A total of 84 species were detected within the seedling emergence surveys undertaken
at Mt Elliot, Many Peaks Range and Castle Hill (Table 6.1). Seventy-six percent of
these species were common to the Cape Cleveland study site, indicating that these
savanna sites around Townsville were similar in composition. Herbaceous species
dominated the seedling surveys, representing 81% of species and 94% of total seedling
density.
Species richness and total seedling density were significantly higher in recently burnt
than in longer unburnt sites, with more than six times the average number of species
and 15 times the seedling density in recently burnt than longer unburnt savanna (Table
6.1). Most species and species groups were significantly more abundant in recently
burnt savanna and no species or groups were more abundant in longer unburnt sites.
Woodland and rainforest trees and shrubs were the only growth form groups that did
not have significantly increased seedling emergence in burnt sites. The rainforest group
was represented by only one Canthium attenuatum seedling which emerged in a
recently burnt site on Castle Hill. Seedling emergence was not significantly different
between recently burnt and longer unburnt sites for the common exotic subshrubs
Stachytarpheta jamaicensis and Triumfetta rhomboidea, the exotic ephemeral forbs
Crotalaria goreensis and Hyptis suaveolens, the native twiner Rhynchosia minima and
an undetermined species of Fimbristylis.
175
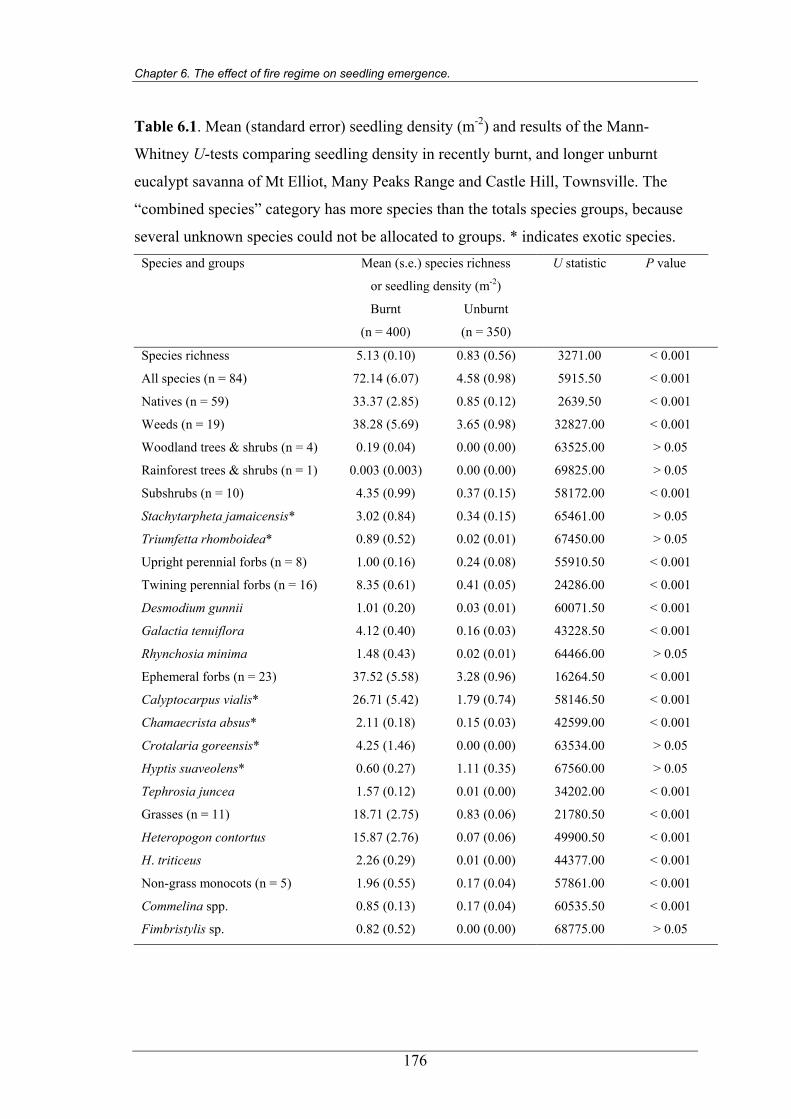
Chapter 6. The effect of fire regime on seedling emergence.
Table 6.1. Mean (standard error) seedling density (m-2) and results of the Mann-
Whitney U-tests comparing seedling density in recently burnt, and longer unburnt
eucalypt savanna of Mt Elliot, Many Peaks Range and Castle Hill, Townsville. The
“combined species” category has more species than the totals species groups, because
several unknown species could not be allocated to groups. * indicates exotic species. Species and groups Mean (s.e.) species richness
or seedling density (m-2)
U statistic P value
Burnt
(n = 400)
Unburnt
(n = 350)
Species richness 5.13 (0.10) 0.83 (0.56) 3271.00 < 0.001
All species (n = 84) 72.14 (6.07) 4.58 (0.98) 5915.50 < 0.001
Natives (n = 59) 33.37 (2.85) 0.85 (0.12) 2639.50 < 0.001
Weeds (n = 19) 38.28 (5.69) 3.65 (0.98) 32827.00 < 0.001
Woodland trees & shrubs (n = 4) 0.19 (0.04) 0.00 (0.00) 63525.00 > 0.05
Rainforest trees & shrubs (n = 1) 0.003 (0.003) 0.00 (0.00) 69825.00 > 0.05
Subshrubs (n = 10) 4.35 (0.99) 0.37 (0.15) 58172.00 < 0.001
Stachytarpheta jamaicensis* 3.02 (0.84) 0.34 (0.15) 65461.00 > 0.05
Triumfetta rhomboidea* 0.89 (0.52) 0.02 (0.01) 67450.00 > 0.05
Upright perennial forbs (n = 8) 1.00 (0.16) 0.24 (0.08) 55910.50 < 0.001
Twining perennial forbs (n = 16) 8.35 (0.61) 0.41 (0.05) 24286.00 < 0.001
Desmodium gunnii 1.01 (0.20) 0.03 (0.01) 60071.50 < 0.001
Galactia tenuiflora 4.12 (0.40) 0.16 (0.03) 43228.50 < 0.001
Rhynchosia minima 1.48 (0.43) 0.02 (0.01) 64466.00 > 0.05
Ephemeral forbs (n = 23) 37.52 (5.58) 3.28 (0.96) 16264.50 < 0.001
Calyptocarpus vialis* 26.71 (5.42) 1.79 (0.74) 58146.50 < 0.001
Chamaecrista absus* 2.11 (0.18) 0.15 (0.03) 42599.00 < 0.001
Crotalaria goreensis* 4.25 (1.46) 0.00 (0.00) 63534.00 > 0.05
Hyptis suaveolens* 0.60 (0.27) 1.11 (0.35) 67560.00 > 0.05
Tephrosia juncea 1.57 (0.12) 0.01 (0.00) 34202.00 < 0.001
Grasses (n = 11) 18.71 (2.75) 0.83 (0.06) 21780.50 < 0.001
Heteropogon contortus 15.87 (2.76) 0.07 (0.06) 49900.50 < 0.001
H. triticeus 2.26 (0.29) 0.01 (0.00) 44377.00 < 0.001
Non-grass monocots (n = 5) 1.96 (0.55) 0.17 (0.04) 57861.00 < 0.001
Commelina spp. 0.85 (0.13) 0.17 (0.04) 60535.50 < 0.001
Fimbristylis sp. 0.82 (0.52) 0.00 (0.00) 68775.00 > 0.05
176
Chapter 6. The effect of fire regime on seedling emergence.
6.3.2 Seedling emergence surveys at Cape Cleveland
A total of 67 species were documented in the annual seedling emergence surveys
between 1997 and 2000 at Cape Cleveland (Table 6.2; Appendix 1). Species richness
and total seedling density were significantly higher in recently burnt blocks, being most
abundant in control blocks after the 1997 fire, and in early and late burnt blocks after
both the 1997 and 1999 fires (Table 6.2). In December 1999, following the
implementation of the early and late dry season fires, species richness and total
seedling density were significantly higher in late burnt than early burnt blocks, and
early burnt than in unburnt control blocks.
The mean seedling density and statistical significance of differences between recently
burnt and longer unburnt savanna, for the species groups and common species at Cape
Cleveland are presented in Table 5.2. Seedling density of native species was highest in
recently burnt savanna, that is in 1997 in control blocks, and both 1997 and 1999 in
early and late burnt blocks. Seedling numbers of both native and exotic species in 1999
were significantly higher in late burnt than early burnt sites, which were higher again
than in unburnt control sites. There was no significant difference in exotic seedling
density between surveys within the control blocks. The seedling density of exotic
species in both early and late burnt blocks was significantly higher following the 1999
fires than all other years, including 1997.
Densities of seedlings of woodland trees and shrubs, and that of the dominant tree
Corymbia clarksoniana, were significantly higher in 1998 than in any other years and
there was no difference between fire treatments in 1999. The additional surveys in 1998
of C. clarksoniana seedlings within the fire break block, burnt three months prior to the
seedling survey, and fire line slashed four months prior to the survey, indicated the
recently burnt and slashed savanna contained significantly higher densities of C.
clarksoniana seedlings than in the nine 1 ha blocks, which had not been burnt for 16
months at that stage (Figure 6.1).
177
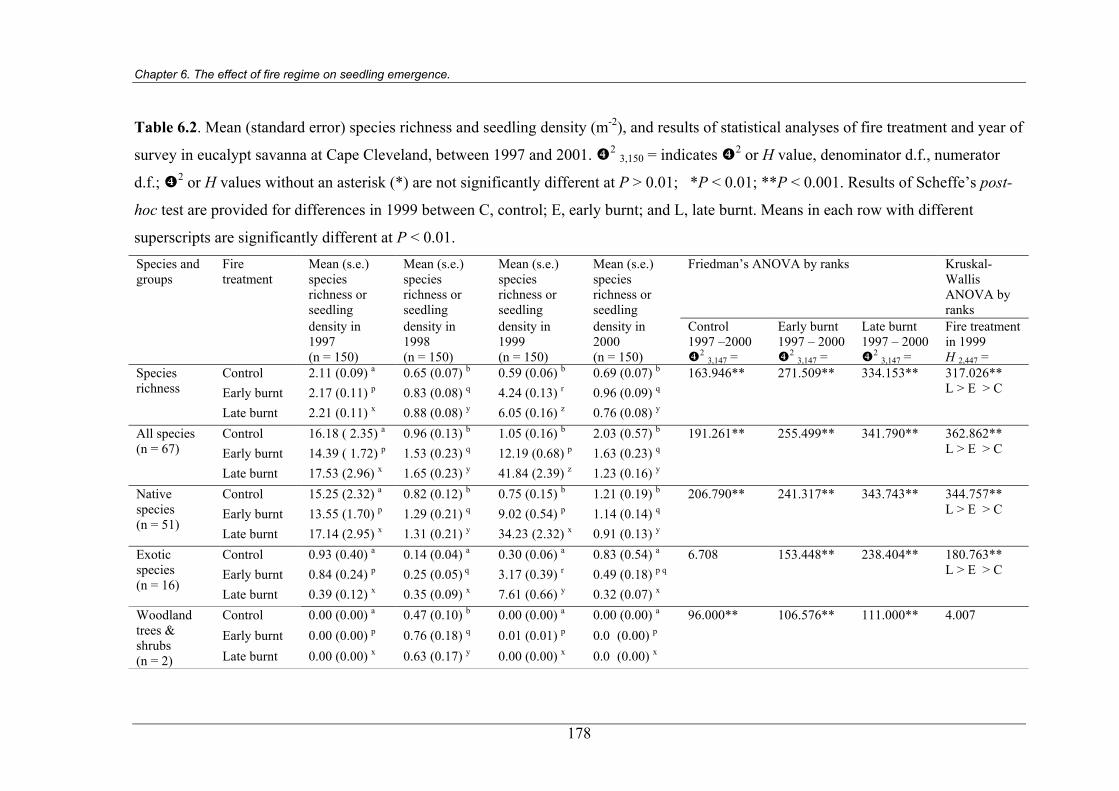
Chapter 6. The effect of fire regime on seedling emergence.
Table 6.2. Mean (standard error) species richness and seedling density (m-2), and results of statistical analyses of fire treatment and year of
survey in eucalypt savanna at Cape Cleveland, between 1997 and 2001. 2 3,150 = indicates 2 or H value, denominator d.f., numerator
d.f.; 2 or H values without an asterisk (*) are not significantly different at P > 0.01; *P < 0.01; **P < 0.001. Results of Scheffe’s post-
hoc test are provided for differences in 1999 between C, control; E, early burnt; and L, late burnt. Means in each row with different
superscripts are significantly different at P < 0.01. Species and groups
Fire treatment
Mean (s.e.) species richness or seedling
Mean (s.e.) species richness or seedling
Mean (s.e.) species richness or seedling
Mean (s.e.) species richness or seedling
Friedman’s ANOVA by ranks Kruskal-Wallis ANOVA by ranks
density in1997
density in 1998
(n = 150) (n = 150)
density in 1999 (n = 150)
density in 2000 (n = 150)
Control 1997 –2000
2 3,147 =
Early burnt 1997 – 2000
2 3,147 =
Late burnt 1997 – 2000
2 3,147 =
Fire treatment in 1999 H 2,447 =
Control 2.11 (0.09) a 0.65 (0.07) b 0.59 (0.06) b 0.69 (0.07) b Early burnt 2.17 (0.11) p
0.83 (0.08) q 4.24 (0.13) r 0.96 (0.09) q Species richness
Late burnt 2.21 (0.11) x 0.88 (0.08) y 6.05 (0.16) z 0.76 (0.08) y
163.946** 271.509** 334.153** 317.026**L > E > C
Control 16.18 ( 2.35) a 0.96 (0.13) b 1.05 (0.16) b 2.03 (0.57) b Early burnt 14.39 ( 1.72) p
1.53 (0.23) q 12.19 (0.68) p 1.63 (0.23) q All species (n = 67)
Late burnt 17.53 (2.96) x 1.65 (0.23) y 41.84 (2.39) z 1.23 (0.16) y
191.261**
255.499**
341.790**
362.862** L > E > C
Control 15.25 (2.32) a 0.82 (0.12) b 0.75 (0.15) b 1.21 (0.19) b Early burnt 13.55 (1.70) p
1.29 (0.21) q 9.02 (0.54) p 1.14 (0.14) q Native species (n = 51)
Late burnt 17.14 (2.95) x 1.31 (0.21) y 34.23 (2.32) x 0.91 (0.13) y
206.790**
241.317**
343.743**
344.757** L > E > C
Control 0.93 (0.40) a 0.14 (0.04) a 0.30 (0.06) a 0.83 (0.54) a Early burnt 0.84 (0.24) p
0.25 (0.05) q 3.17 (0.39) r 0.49 (0.18) p q Exotic species (n = 16)
Late burnt 0.39 (0.12) x 0.35 (0.09) x 7.61 (0.66) y 0.32 (0.07) x
6.708
153.448**
238.404**
180.763** L > E > C
Control 0.00 (0.00) a 0.47 (0.10) b 0.00 (0.00) a 0.00 (0.00) a Early burnt 0.00 (0.00) p
0.76 (0.18) q 0.01 (0.01) p 0.0 (0.00) p
Woodland trees & shrubs (n = 2) Late burnt 0.00 (0.00) x 0.63 (0.17) y 0.00 (0.00) x 0.0 (0.00) x
96.000**
106.576**
111.000**
4.007
178
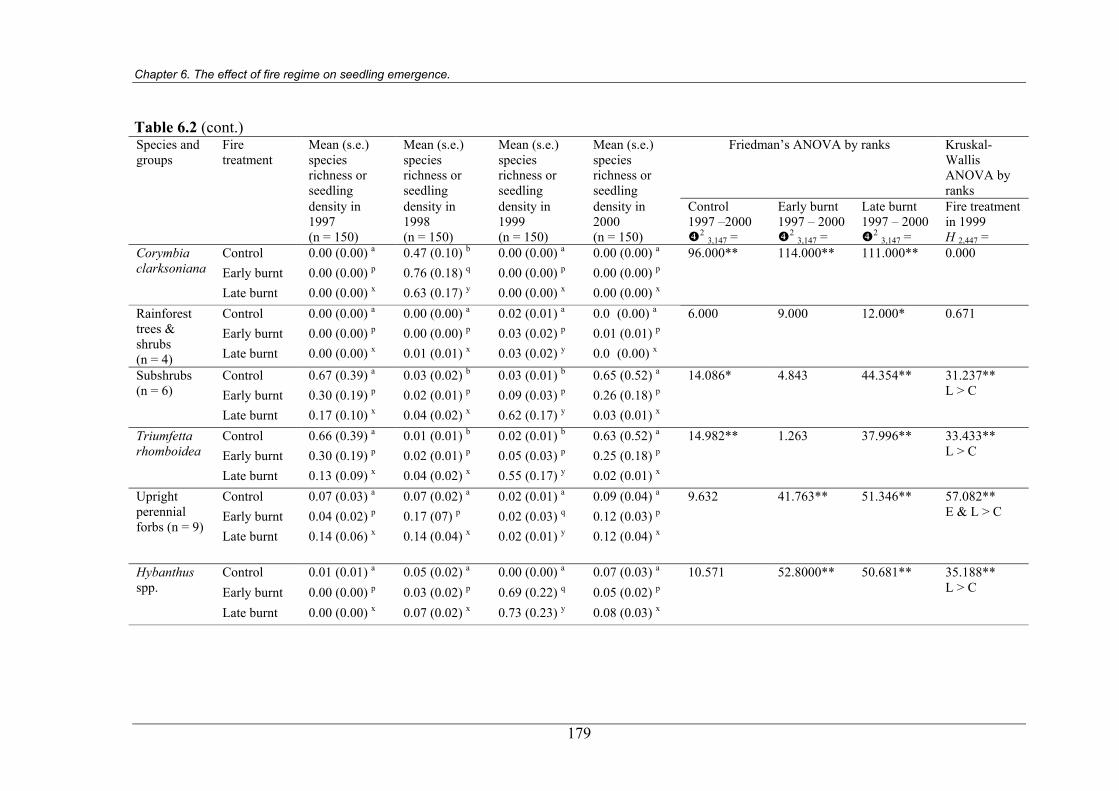
Chapter 6. The effect of fire regime on seedling emergence.
Table 6.2 (cont.) Species and groups
Fire treatment
Mean (s.e.) species richness or seedling
Mean (s.e.) species richness or seedling
Mean (s.e.) species richness or seedling
Mean (s.e.) species richness or seedling
Friedman’s ANOVA by ranks Kruskal-Wallis ANOVA by ranks
density in1997
density in 1998
(n = 150) (n = 150)
density in 1999 (n = 150)
density in 2000 (n = 150)
Control 1997 –2000
2 3,147 =
Early burnt 1997 – 2000
2 3,147 =
Late burnt 1997 – 2000
2 3,147 =
Fire treatment in 1999 H 2,447 =
Control 0.00 (0.00) a 0.47 (0.10) b 0.00 (0.00) a 0.00 (0.00) a 96.000** 114.000** 111.000** 0.000 Corymbia clarksoniana Early burnt 0.00 (0.00) p
0.76 (0.18) q 0.00 (0.00) p 0.00 (0.00) p
Late burnt 0.00 (0.00) x 0.63 (0.17) y 0.00 (0.00) x 0.00 (0.00) x
Control 0.00 (0.00) a 0.00 (0.00) a 0.02 (0.01) a 0.0 (0.00) a Early burnt 0.00 (0.00) p
0.00 (0.00) p 0.03 (0.02) p 0.01 (0.01) p Rainforest trees & shrubs (n = 4) Late burnt 0.00 (0.00) x 0.01 (0.01) x 0.03 (0.02) y 0.0 (0.00) x
6.000
9.000
12.000*
0.671
Control 0.67 (0.39) a 0.03 (0.02) b 0.03 (0.01) b 0.65 (0.52) a Early burnt 0.30 (0.19) p
0.02 (0.01) p 0.09 (0.03) p 0.26 (0.18) p Subshrubs (n = 6)
Late burnt 0.17 (0.10) x 0.04 (0.02) x 0.62 (0.17) y 0.03 (0.01) x
14.086*
4.843 44.354**
31.237** L > C
Control 0.66 (0.39) a 0.01 (0.01) b 0.02 (0.01) b 0.63 (0.52) a Early burnt 0.30 (0.19) p
0.02 (0.01) p 0.05 (0.03) p 0.25 (0.18) p Triumfetta rhomboidea
Late burnt 0.13 (0.09) x 0.04 (0.02) x 0.55 (0.17) y 0.02 (0.01) x
14.982** 1.263 37.996** 33.433** L > C
Control 0.07 (0.03) a 0.07 (0.02) a 0.02 (0.01) a 0.09 (0.04) a Early burnt 0.04 (0.02) p
0.17 (07) p 0.02 (0.03) q 0.12 (0.03) p Upright perennial forbs (n = 9)
Late burnt 0.14 (0.06) x 0.14 (0.04) x 0.02 (0.01) y 0.12 (0.04) x
9.632
41.763**
51.346**
57.082** E & L > C
Control 0.01 (0.01) a 0.05 (0.02) a 0.00 (0.00) a 0.07 (0.03) a Early burnt 0.00 (0.00) p
0.03 (0.02) p 0.69 (0.22) q 0.05 (0.02) p
Hybanthus spp.
Late burnt 0.00 (0.00) x 0.07 (0.02) x 0.73 (0.23) y 0.08 (0.03) x
10.571
52.8000**
50.681**
35.188** L > C
179
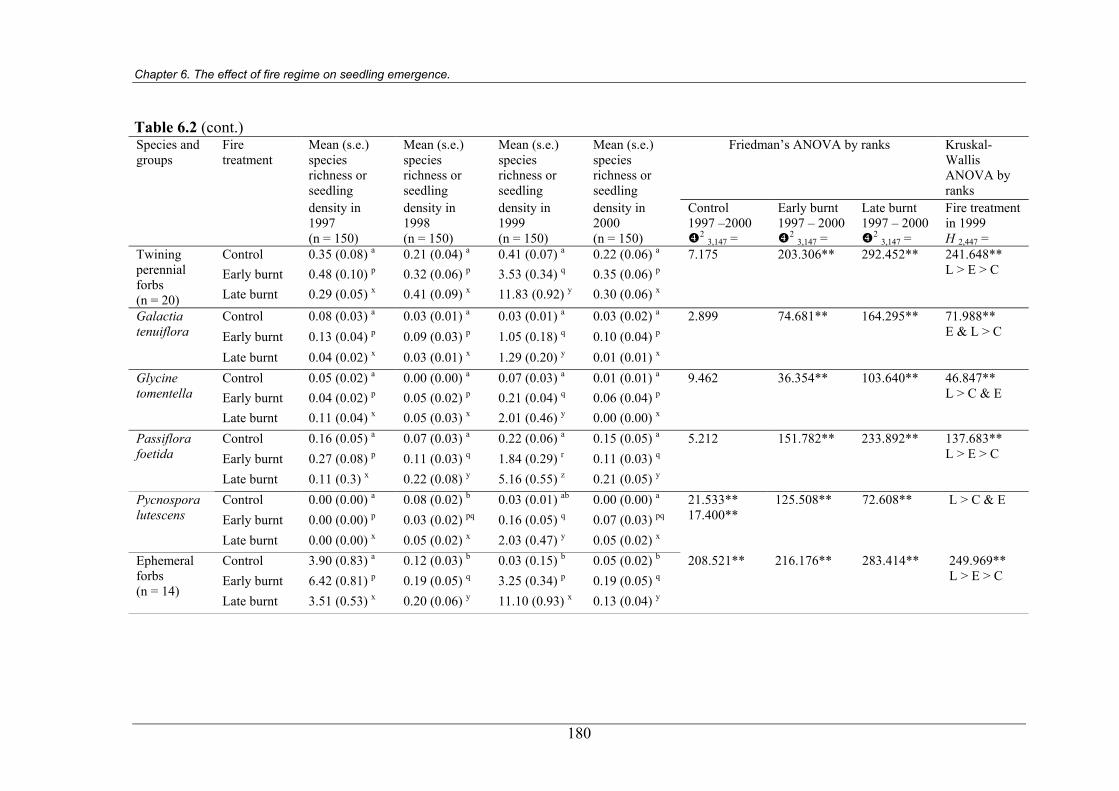
Chapter 6. The effect of fire regime on seedling emergence.
Table 6.2 (cont.) Species and groups
Fire treatment
Mean (s.e.) species richness or seedling
Mean (s.e.) species richness or seedling
Mean (s.e.) species richness or seedling
Mean (s.e.) species richness or seedling
Friedman’s ANOVA by ranks Kruskal-Wallis ANOVA by ranks
density in1997
density in 1998
(n = 150) (n = 150)
density in 1999 (n = 150)
density in 2000 (n = 150)
Control 1997 –2000
2 3,147 =
Early burnt 1997 – 2000
2 3,147 =
Late burnt 1997 – 2000
2 3,147 =
Fire treatment in 1999 H 2,447 =
Control 0.35 (0.08) a 0.21 (0.04) a 0.41 (0.07) a 0.22 (0.06) a 7.175 203.306** 292.452** Early burnt 0.48 (0.10) p
0.32 (0.06) p 3.53 (0.34) q 0.35 (0.06) pTwining perennial forbs (n = 20) Late burnt 0.29 (0.05) x 0.41 (0.09) x 11.83 (0.92) y 0.30 (0.06) x
241.648** L > E > C
Control 0.08 (0.03) a 0.03 (0.01) a 0.03 (0.01) a 0.03 (0.02) a Early burnt 0.13 (0.04) p
0.09 (0.03) p 1.05 (0.18) q 0.10 (0.04) p Galactia tenuiflora
Late burnt 0.04 (0.02) x 0.03 (0.01) x 1.29 (0.20) y 0.01 (0.01) x
2.899
74.681** 164.295** 71.988** E & L > C
Control 0.05 (0.02) a 0.00 (0.00) a 0.07 (0.03) a 0.01 (0.01) a Early burnt 0.04 (0.02) p
0.05 (0.02) p 0.21 (0.04) q 0.06 (0.04) p Glycine tomentella
Late burnt 0.11 (0.04) x 0.05 (0.03) x 2.01 (0.46) y 0.00 (0.00) x
9.462
36.354** 103.640** 46.847** L > C & E
Control 0.16 (0.05) a 0.07 (0.03) a 0.22 (0.06) a 0.15 (0.05) a Early burnt 0.27 (0.08) p
0.11 (0.03) q 1.84 (0.29) r 0.11 (0.03) q Passiflora foetida
Late burnt 0.11 (0.3) x 0.22 (0.08) y 5.16 (0.55) z 0.21 (0.05) y
5.212
151.782** 233.892** 137.683** L > E > C
Control 0.00 (0.00) a 0.08 (0.02) b 0.03 (0.01) ab 0.00 (0.00) a Early burnt 0.00 (0.00) p
0.03 (0.02) pq 0.16 (0.05) q 0.07 (0.03) pq Pycnospora lutescens
Late burnt 0.00 (0.00) x 0.05 (0.02) x 2.03 (0.47) y 0.05 (0.02) x
21.533** 17.400**
125.508** 72.608** L > C & E
Control 3.90 (0.83) a 0.12 (0.03) b 0.03 (0.15) b 0.05 (0.02) b Early burnt 6.42 (0.81) p
0.19 (0.05) q 3.25 (0.34) p 0.19 (0.05) q
Ephemeral forbs (n = 14)
Late burnt 3.51 (0.53) x 0.20 (0.06) y 11.10 (0.93) x 0.13 (0.04) y
208.521**
216.176**
283.414**
249.969** L > E > C
180
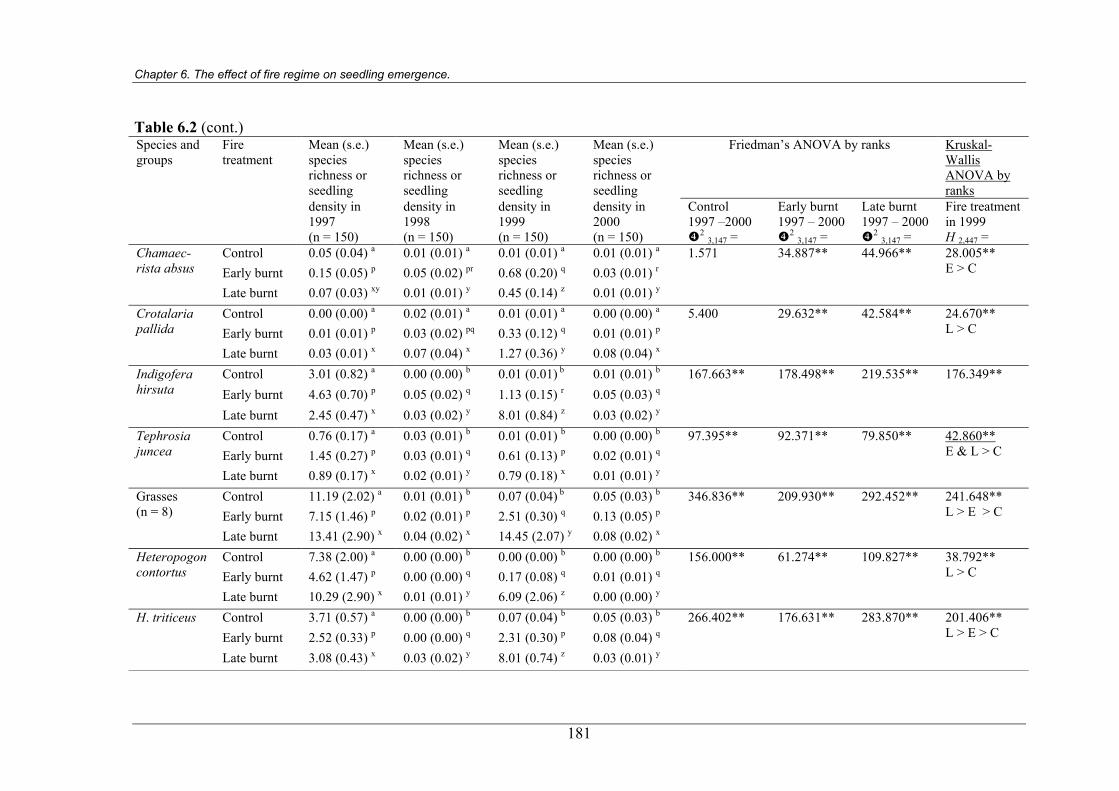
Chapter 6. The effect of fire regime on seedling emergence.
Table 6.2 (cont.) Species and groups
Fire treatment
Mean (s.e.) species richness or seedling
Mean (s.e.) species richness or seedling
Mean (s.e.) species richness or seedling
Mean (s.e.) species richness or seedling
Friedman’s ANOVA by ranks
Kruskal-Wallis ANOVA by ranks
density in1997
density in 1998
(n = 150) (n = 150)
density in 1999 (n = 150)
density in 2000 (n = 150)
Control 1997 –2000
2 3,147 =
Early burnt 1997 – 2000
2 3,147 =
Late burnt 1997 – 2000
2 3,147 =
Fire treatment in 1999 H 2,447 =
Control 0.05 (0.04) a 0.01 (0.01) a 0.01 (0.01) a 0.01 (0.01) a Early burnt 0.15 (0.05) p
0.05 (0.02) pr 0.68 (0.20) q 0.03 (0.01) r Chamaec-rista absus
Late burnt 0.07 (0.03) xy 0.01 (0.01) y 0.45 (0.14) z 0.01 (0.01) y
1.571
34.887** 44.966** 28.005** E > C
Control 0.00 (0.00) a 0.02 (0.01) a 0.01 (0.01) a 0.00 (0.00) a Early burnt 0.01 (0.01) p
0.03 (0.02) pq 0.33 (0.12) q 0.01 (0.01) p Crotalaria pallida
Late burnt 0.03 (0.01) x 0.07 (0.04) x 1.27 (0.36) y 0.08 (0.04) x
5.400 29.632** 42.584** 24.670** L > C
Control 3.01 (0.82) a 0.00 (0.00) b 0.01 (0.01) b 0.01 (0.01) b Early burnt 4.63 (0.70) p
0.05 (0.02) q 1.13 (0.15) r 0.05 (0.03) q Indigofera hirsuta
Late burnt 2.45 (0.47) x 0.03 (0.02) y 8.01 (0.84) z 0.03 (0.02) y
167.663** 178.498** 219.535** 176.349**
Control 0.76 (0.17) a 0.03 (0.01) b 0.01 (0.01) b 0.00 (0.00) b Early burnt 1.45 (0.27) p
0.03 (0.01) q 0.61 (0.13) p 0.02 (0.01) q
Tephrosia juncea
Late burnt 0.89 (0.17) x 0.02 (0.01) y 0.79 (0.18) x 0.01 (0.01) y
97.395** 92.371** 79.850** 42.860** E & L > C
Control 11.19 (2.02) a 0.01 (0.01) b 0.07 (0.04) b 0.05 (0.03) b Early burnt 7.15 (1.46) p
0.02 (0.01) p 2.51 (0.30) q 0.13 (0.05) p Grasses (n = 8)
Late burnt 13.41 (2.90) x 0.04 (0.02) x 14.45 (2.07) y 0.08 (0.02) x
346.836**
209.930**
292.452**
241.648** L > E > C
Control 7.38 (2.00) a 0.00 (0.00) b 0.00 (0.00) b 0.00 (0.00) b Early burnt 4.62 (1.47) p
0.00 (0.00) q 0.17 (0.08) q 0.01 (0.01) q Heteropogon contortus
Late burnt 10.29 (2.90) x 0.01 (0.01) y 6.09 (2.06) z 0.00 (0.00) y
156.000**
61.274** 109.827** 38.792** L > C
Control 3.71 (0.57) a 0.00 (0.00) b 0.07 (0.04) b 0.05 (0.03) b Early burnt 2.52 (0.33) p
0.00 (0.00) q 2.31 (0.30) p 0.08 (0.04) q
H. triticeus
Late burnt 3.08 (0.43) x 0.03 (0.02) y 8.01 (0.74) z 0.03 (0.01) y
266.402**
176.631** 283.870** 201.406** L > E > C
181
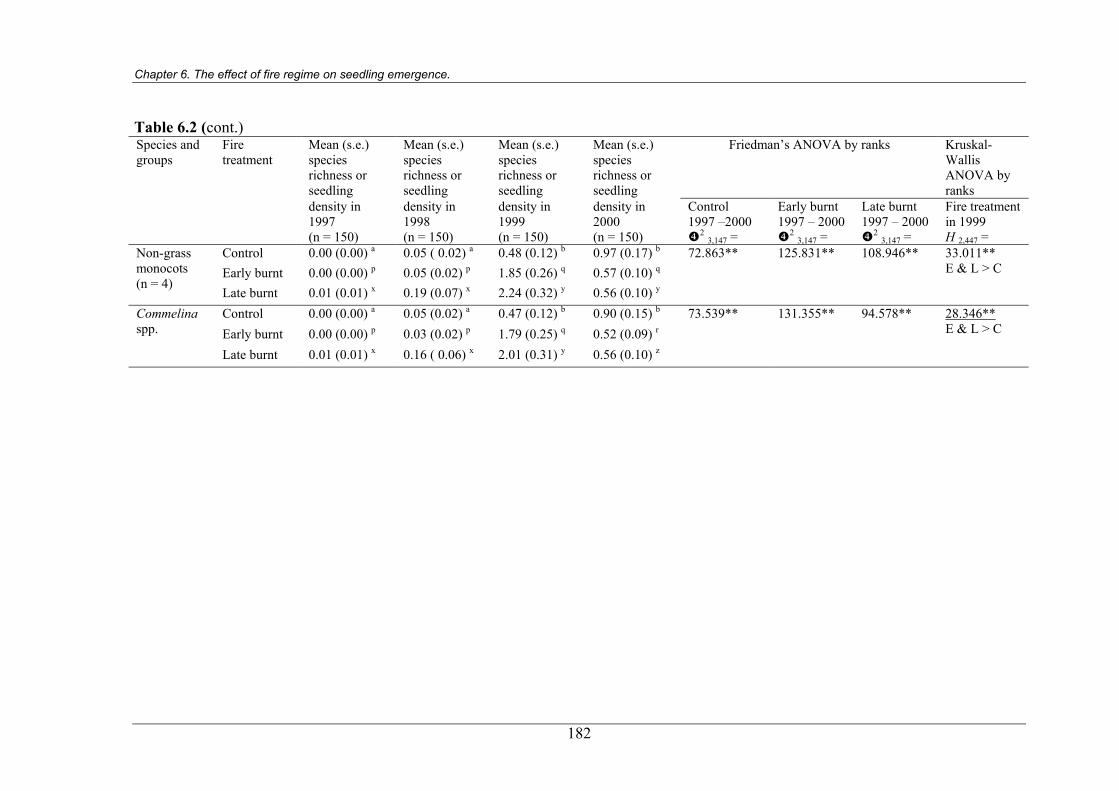
Chapter 6. The effect of fire regime on seedling emergence.
Table 6.2 (cont.) Species and groups
Fire treatment
Mean (s.e.) species richness or seedling
Mean (s.e.) species richness or seedling
Mean (s.e.) species richness or seedling
Mean (s.e.) species richness or seedling
Friedman’s ANOVA by ranks Kruskal-Wallis ANOVA by ranks
density in1997
density in 1998
(n = 150) (n = 150)
density in 1999 (n = 150)
density in 2000 (n = 150)
Control 1997 –2000
2 3,147 =
Early burnt 1997 – 2000
2 3,147 =
Late burnt 1997 – 2000
2 3,147 =
Fire treatment in 1999 H 2,447 =
Control 0.00 (0.00) a 0.05 ( 0.02) a 0.48 (0.12) b 0.97 (0.17) b Early burnt 0.00 (0.00) p
0.05 (0.02) p 1.85 (0.26) q 0.57 (0.10) q Non-grass monocots (n = 4)
Late burnt 0.01 (0.01) x 0.19 (0.07) x 2.24 (0.32) y 0.56 (0.10) y
72.863**
125.831**
108.946**
33.011** E & L > C
Control 0.00 (0.00) a 0.05 (0.02) a 0.47 (0.12) b 0.90 (0.15) b Early burnt 0.00 (0.00) p
0.03 (0.02) p 1.79 (0.25) q 0.52 (0.09) r
Commelina spp.
Late burnt 0.01 (0.01) x 0.16 ( 0.06) x 2.01 (0.31) y 0.56 (0.10) z
73.539** 131.355** 94.578**
28.346** E & L > C
182
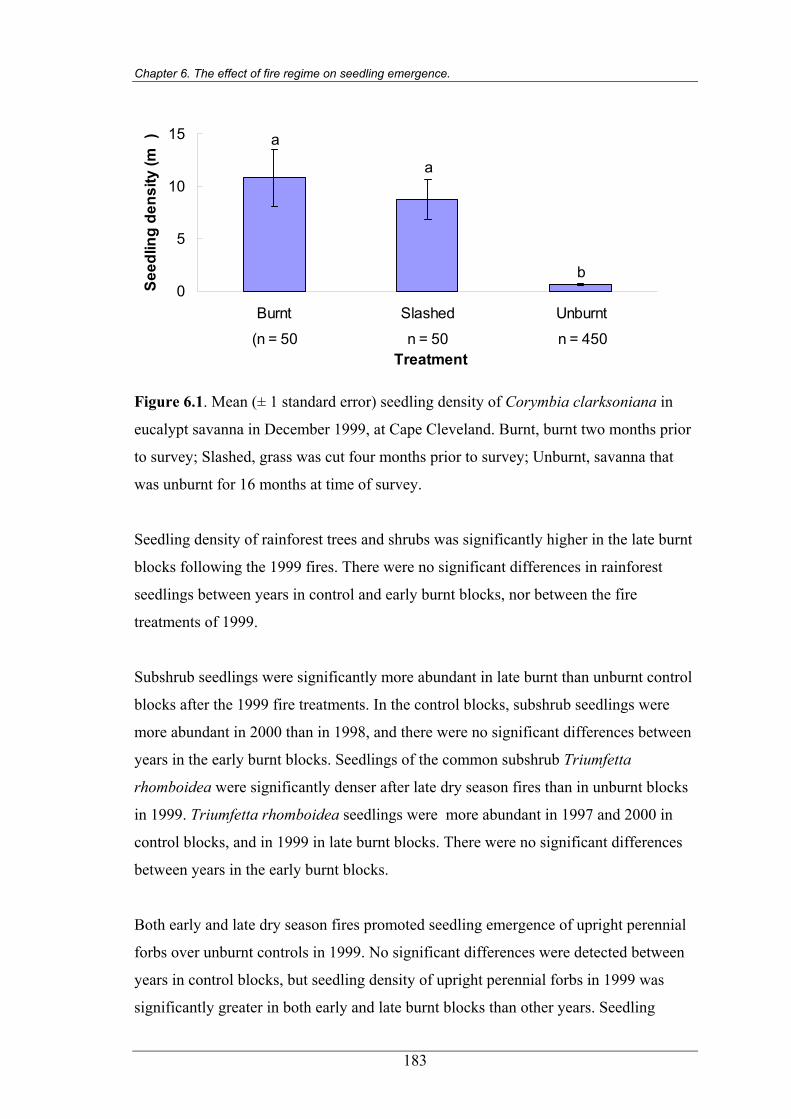
Chapter 6. The effect of fire regime on seedling emergence.
-2
0
5
10
15
Burnt Slashed Unburnt
Treatment
Seed
ling
dens
ity (m
)
b
a
a
(n = 50 n = 50 n = 450
Figure 6.1. Mean (± 1 standard error) seedling density of Corymbia clarksoniana in
eucalypt savanna in December 1999, at Cape Cleveland. Burnt, burnt two months prior
to survey; Slashed, grass was cut four months prior to survey; Unburnt, savanna that
was unburnt for 16 months at time of survey.
Seedling density of rainforest trees and shrubs was significantly higher in the late burnt
blocks following the 1999 fires. There were no significant differences in rainforest
seedlings between years in control and early burnt blocks, nor between the fire
treatments of 1999.
Subshrub seedlings were significantly more abundant in late burnt than unburnt control
blocks after the 1999 fire treatments. In the control blocks, subshrub seedlings were
more abundant in 2000 than in 1998, and there were no significant differences between
years in the early burnt blocks. Seedlings of the common subshrub Triumfetta
rhomboidea were significantly denser after late dry season fires than in unburnt blocks
in 1999. Triumfetta rhomboidea seedlings were more abundant in 1997 and 2000 in
control blocks, and in 1999 in late burnt blocks. There were no significant differences
between years in the early burnt blocks.
Both early and late dry season fires promoted seedling emergence of upright perennial
forbs over unburnt controls in 1999. No significant differences were detected between
years in control blocks, but seedling density of upright perennial forbs in 1999 was
significantly greater in both early and late burnt blocks than other years. Seedling
183
Chapter 6. The effect of fire regime on seedling emergence.
density of Hybanthus spp. (combined H. enneaspermus and H. stellarioides, which
were indistinguishable at the seedling stage) were not significantly different between
years in the control blocks, but seedling density in the early and late burnt blocks was
significantly higher after the 1999 fires than all other years. In 1999 the late dry season
fires promoted greater seedling density than occurred in the unburnt control blocks.
In 1999, the seedling density of twining perennial forbs was significantly greater in late
rather than early dry season burnt savanna, which in turn was significantly greater than
in unburnt savanna. No significant differences were detectable in seedling density
between years in control burnt blocks. However, a significantly higher seedling density
occurred in both early and late burnt blocks in 1999 than all other years, indicating the
1999 fires produced denser seedling emergence than the July 1997 fire. The seedling
density of the common twiner, Galactia tenuiflora, was significantly higher in 1999
than in other years in both the early and late dry season burnt blocks, but not
significantly different between years in control blocks, and a greater seedling density
was recorded after both early and late dry season fires than in unburnt savanna in 1999.
Seedlings of the common twiners Glycine tomentella, Passiflora foetida and
Pycnospora lutescens emerged at significantly higher density in 1999 in late burnt
savanna than in early burnt and unburnt savanna. Seedling density of G. tomentella was
not significantly different between years in control blocks, but in both early and late
burnt blocks, was highest following the 1999 fires. Seedlings of the exotic twiner
Passiflora foetida were significantly more abundant in 1999 than other years in both
early and late burnt blocks. Seedling density of Pycnospora lutescens was significantly
higher in 1998 than in 1997 in control blocks and in 1999 than 1997 in early burnt
blocks. In late burnt blocks, P. lutescens seedlings were significantly denser in 1999
than other years and in 1998 and 2000 compared to 1997, indicating poor recruitment
after the July 1997 fire.
Seedling density in 1999 of ephemeral forbs, and the common forb Indigofera hirsuta,
was significantly higher after late rather than early dry season fires, which produced
significantly greater recruitment than in unburnt savanna. For ephemeral forbs, and I.
hirsuta, significantly higher seedling density in control blocks was documented
following the 1997 fire than in other years. In early burnt blocks, a significantly higher
184
Chapter 6. The effect of fire regime on seedling emergence.
seedling density was recorded in after the 1997 fire than the 1999 fire, and more
seedlings were documented in both 1997 and 1999 than 1998 and 2000. In the late
burnt blocks, significantly more seedlings were detected in 1999 than 1997, and both
years contained significantly higher seedling densities than 1998 and 2000.
The common ephemeral forb Chamaecrista absus produced significantly more
seedlings in 1999 than 1998 in early burnt blocks, and in 1999 than other years in late
burnt blocks. Crotalaria pallida produced significantly more seedlings in late burnt
than unburnt blocks in 1999, and the 1999 fire produced significantly more seedlings
than the 1997 fire in late burnt blocks. Crotalaria pallida seedlings were more
abundant in 1999 than 1997 and 2000 in early burnt blocks. Seedling density of
Tephrosia juncea was significantly higher after early and late dry season fires than in
unburnt savanna in 1999. More seedling recruitment of T. juncea were recorded after
the 1997 fire than during other years in control blocks, and seedling emergence was
higher in 1997 and 1999 than 1998 and 2000 in both early and late burnt blocks.
Seedling density of grasses in 1999 was significantly greater in late than early dry
season burnt savanna, which in turn was greater than unburnt savanna. In control
blocks, significantly higher seedling density was recorded following the 1997 fire than
in other years. In early burnt blocks, significantly more grass seedlings emerged in
1997 than 1999, and greater numbers in 1999 than in 1998 and 2000. In late burnt
blocks, significantly more grass seedlings emerged following the 1999 fires than the
1997 fire, and greater densities were recorded in 1997 than in 1998 and 2000.
Seedlings of the common grass Heteropogon contortus were more abundant after late
dry season fires than those in the early dry season and in unburnt savanna in 1999. In
control and early burnt blocks, a significantly higher seedling density was recorded
following the 1997 fire than in other years. Significantly more seedlings of H. contortus
were detected in 1997 than in 1999, which in turn yielded more seedlings than 1998
and 2000, in both early and late burnt blocks.
Heteropogon triticeus produced significantly more seedlings in 1999 after late rather
than early dry season fires, and in early burnt than in unburnt savanna. In control
185
Chapter 6. The effect of fire regime on seedling emergence.
blocks, significantly more H. triticeus seedlings were documented following the 1997
fire than in other years. In early burnt blocks, significantly more seedlings were
recorded following the 1997 fire than the 1999 fires, with less again in 1998 and 2000.
In late burnt blocks, significantly more seedlings were recorded following the 1999
fires than the 1997 fire, and more in 1997 than in 1998 and 2000.
Seedling density of non-grass monocots in 1999 was significantly increased by both
early and late dry season fires over unburnt savanna. In control blocks, 1999 and 2000
contained significantly greater seedling density than 1997 and 1998. In both early and
late burnt blocks, significantly more seedlings were recorded in 1999 than in other
years. The seedling density of the common monocot Commelina spp. (combined C.
diffusa and C. ensifolia which were indistinguishable at the seedling stage) in 1999 was
more abundant after early and late dry season fires than in unburnt savanna.
Significantly more seedlings of Commelina spp. emerged in 1999 and 2000 than 1997
and 1998 in control blocks. In both early and late burnt blocks, significantly greater
numbers of seedlings were recorded in 1999 than 2000, and more in 2000 than in 1997
and 1998.
6.3.3 Species composition of seedling emergence surveys, soil seed bank samples and
floristic surveys
The four annual seedling surveys of the nine 1 ha blocks at Cape Cleveland, between
1997 and 2000 documented a total of 67 species, 12 of which were present in at least
half of the surveys (Appendix 1). Seventy six percent of the species documented in the
seedling surveys were common to the soil seed bank samples (Appendix 1). These
included all eight grasses, while none of the four rainforest seedling species were
detected in the soil seed bank. Eleven species that were documented within the soil
seed bank were absent from the seedling surveys, although all were uncommon,
producing < 0.5 % of the total seed bank density. Five seedling species were not
recorded within the floristic surveys but mature plants of each were observed at the
Cape Cleveland site, adjacent to floristic survey plots. This suggests germination
originated from seed produced on site and, for approximately one quarter of the
seedling species, germination originated from fresh, rather than stored seed.
186
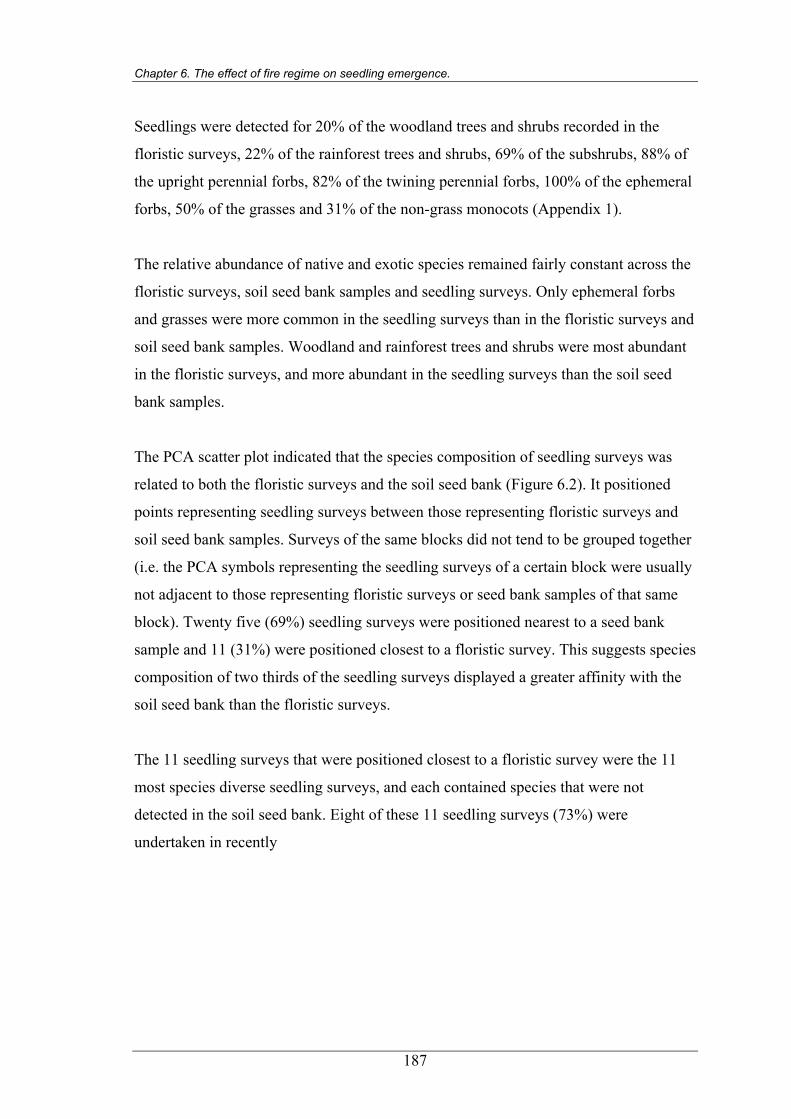
Chapter 6. The effect of fire regime on seedling emergence.
Seedlings were detected for 20% of the woodland trees and shrubs recorded in the
floristic surveys, 22% of the rainforest trees and shrubs, 69% of the subshrubs, 88% of
the upright perennial forbs, 82% of the twining perennial forbs, 100% of the ephemeral
forbs, 50% of the grasses and 31% of the non-grass monocots (Appendix 1).
The relative abundance of native and exotic species remained fairly constant across the
floristic surveys, soil seed bank samples and seedling surveys. Only ephemeral forbs
and grasses were more common in the seedling surveys than in the floristic surveys and
soil seed bank samples. Woodland and rainforest trees and shrubs were most abundant
in the floristic surveys, and more abundant in the seedling surveys than the soil seed
bank samples.
The PCA scatter plot indicated that the species composition of seedling surveys was
related to both the floristic surveys and the soil seed bank (Figure 6.2). It positioned
points representing seedling surveys between those representing floristic surveys and
soil seed bank samples. Surveys of the same blocks did not tend to be grouped together
(i.e. the PCA symbols representing the seedling surveys of a certain block were usually
not adjacent to those representing floristic surveys or seed bank samples of that same
block). Twenty five (69%) seedling surveys were positioned nearest to a seed bank
sample and 11 (31%) were positioned closest to a floristic survey. This suggests species
composition of two thirds of the seedling surveys displayed a greater affinity with the
soil seed bank than the floristic surveys.
The 11 seedling surveys that were positioned closest to a floristic survey were the 11
most species diverse seedling surveys, and each contained species that were not
detected in the soil seed bank. Eight of these 11 seedling surveys (73%) were
undertaken in recently
187
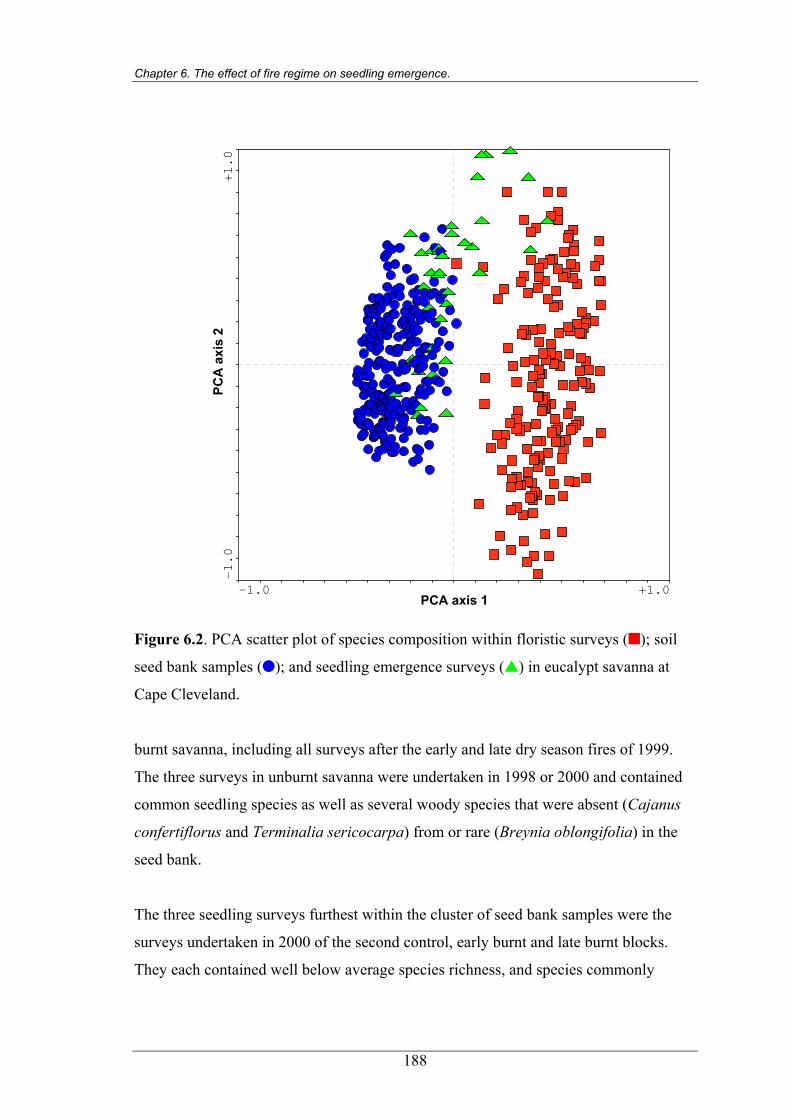
Chapter 6. The effect of fire regime on seedling emergence.
PCA axis 1
PCA
axi
s 2
-1.0 +1.0
-1.0
+1.0
Figure 6.2. PCA scatter plot of species composition within floristic surveys ( ); soil
seed bank samples ( ); and seedling emergence surveys ( ) in eucalypt savanna at
Cape Cleveland.
burnt savanna, including all surveys after the early and late dry season fires of 1999.
The three surveys in unburnt savanna were undertaken in 1998 or 2000 and contained
common seedling species as well as several woody species that were absent (Cajanus
confertiflorus and Terminalia sericocarpa) from or rare (Breynia oblongifolia) in the
seed bank.
The three seedling surveys furthest within the cluster of seed bank samples were the
surveys undertaken in 2000 of the second control, early burnt and late burnt blocks.
They each contained well below average species richness, and species commonly
188
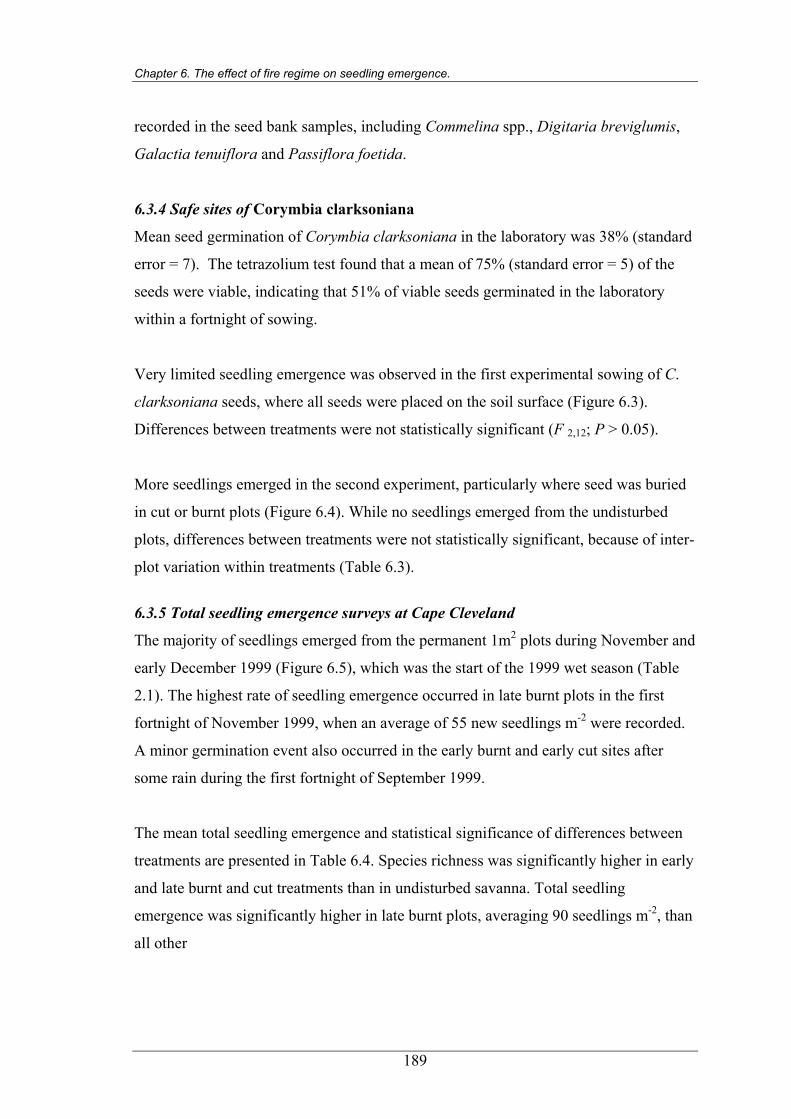
Chapter 6. The effect of fire regime on seedling emergence.
recorded in the seed bank samples, including Commelina spp., Digitaria breviglumis,
Galactia tenuiflora and Passiflora foetida.
6.3.4 Safe sites of Corymbia clarksoniana
Mean seed germination of Corymbia clarksoniana in the laboratory was 38% (standard
error = 7). The tetrazolium test found that a mean of 75% (standard error = 5) of the
seeds were viable, indicating that 51% of viable seeds germinated in the laboratory
within a fortnight of sowing.
Very limited seedling emergence was observed in the first experimental sowing of C.
clarksoniana seeds, where all seeds were placed on the soil surface (Figure 6.3).
Differences between treatments were not statistically significant (F 2,12; P > 0.05).
More seedlings emerged in the second experiment, particularly where seed was buried
in cut or burnt plots (Figure 6.4). While no seedlings emerged from the undisturbed
plots, differences between treatments were not statistically significant, because of inter-
plot variation within treatments (Table 6.3).
6.3.5 Total seedling emergence surveys at Cape Cleveland
The majority of seedlings emerged from the permanent 1m2 plots during November and
early December 1999 (Figure 6.5), which was the start of the 1999 wet season (Table
2.1). The highest rate of seedling emergence occurred in late burnt plots in the first
fortnight of November 1999, when an average of 55 new seedlings m-2 were recorded.
A minor germination event also occurred in the early burnt and early cut sites after
some rain during the first fortnight of September 1999.
The mean total seedling emergence and statistical significance of differences between
treatments are presented in Table 6.4. Species richness was significantly higher in early
and late burnt and cut treatments than in undisturbed savanna. Total seedling
emergence was significantly higher in late burnt plots, averaging 90 seedlings m-2, than
all other
189
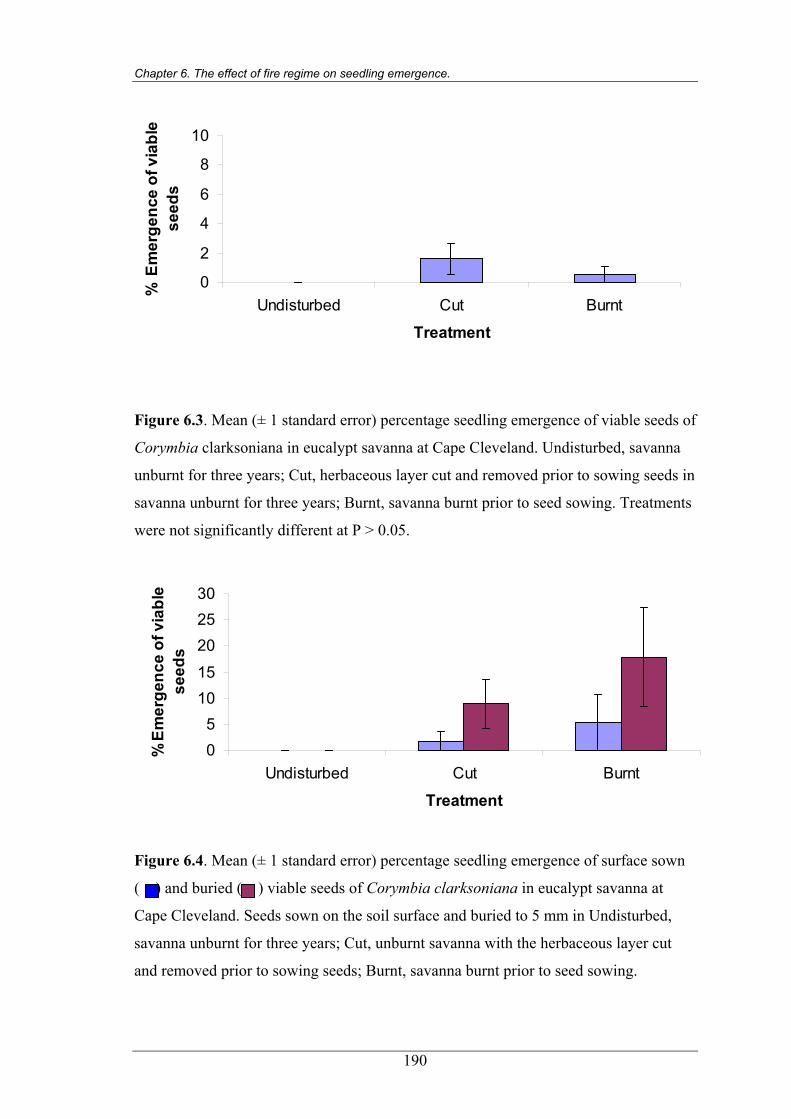
Chapter 6. The effect of fire regime on seedling emergence.
0
2
4
6
8
10
Undisturbed Cut Burnt
Treatment
% E
mer
genc
e of
via
ble
seed
s
Figure 6.3. Mean (± 1 standard error) percentage seedling emergence of viable seeds of
Corymbia clarksoniana in eucalypt savanna at Cape Cleveland. Undisturbed, savanna
unburnt for three years; Cut, herbaceous layer cut and removed prior to sowing seeds in
savanna unburnt for three years; Burnt, savanna burnt prior to seed sowing. Treatments
were not significantly different at P > 0.05.
05
1015
202530
Undisturbed Cut Burnt
Treatment
%Em
erge
nce
of v
iabl
e se
eds
Figure 6.4. Mean (± 1 standard error) percentage seedling emergence of surface sown
( ) and buried ( ) viable seeds of Corymbia clarksoniana in eucalypt savanna at
Cape Cleveland. Seeds sown on the soil surface and buried to 5 mm in Undisturbed,
savanna unburnt for three years; Cut, unburnt savanna with the herbaceous layer cut
and removed prior to sowing seeds; Burnt, savanna burnt prior to seed sowing.
190
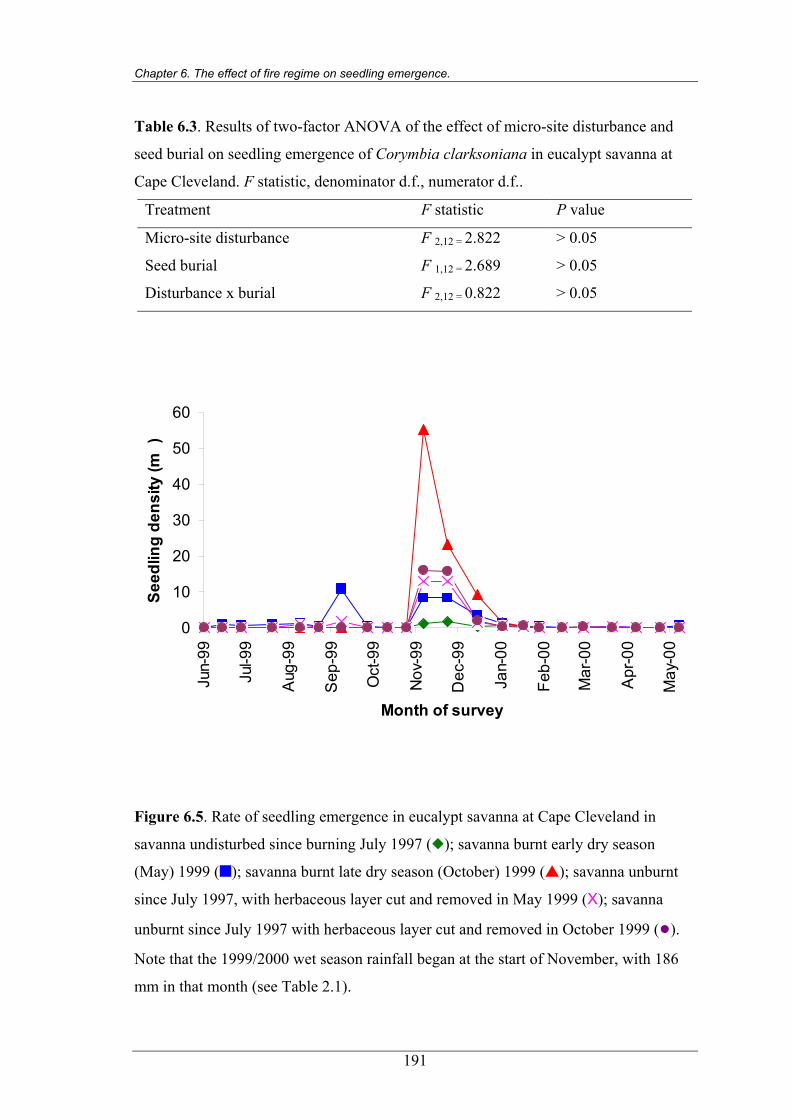
Chapter 6. The effect of fire regime on seedling emergence.
Table 6.3. Results of two-factor ANOVA of the effect of micro-site disturbance and
seed burial on seedling emergence of Corymbia clarksoniana in eucalypt savanna at
Cape Cleveland. F statistic, denominator d.f., numerator d.f..
Treatment F statistic P value
Micro-site disturbance F 2,12 = 2.822 > 0.05
Seed burial F 1,12 = 2.689 > 0.05
Disturbance x burial F 2,12 = 0.822 > 0.05
-2
0
10
20
30
40
50
60
Jun-
99
Jul-9
9
Aug
-99
Sep
-99
Oct
-99
Nov
-99
Dec
-99
Jan-
00
Feb-
00
Mar
-00
Apr
-00
May
-00
Month of survey
Seed
ling
dens
ity (m
)
Figure 6.5. Rate of seedling emergence in eucalypt savanna at Cape Cleveland in
savanna undisturbed since burning July 1997 ( ); savanna burnt early dry season
(May) 1999 ( ); savanna burnt late dry season (October) 1999 ( ); savanna unburnt
since July 1997, with herbaceous layer cut and removed in May 1999 (X); savanna
unburnt since July 1997 with herbaceous layer cut and removed in October 1999 (●).
Note that the 1999/2000 wet season rainfall began at the start of November, with 186
mm in that month (see Table 2.1).
191
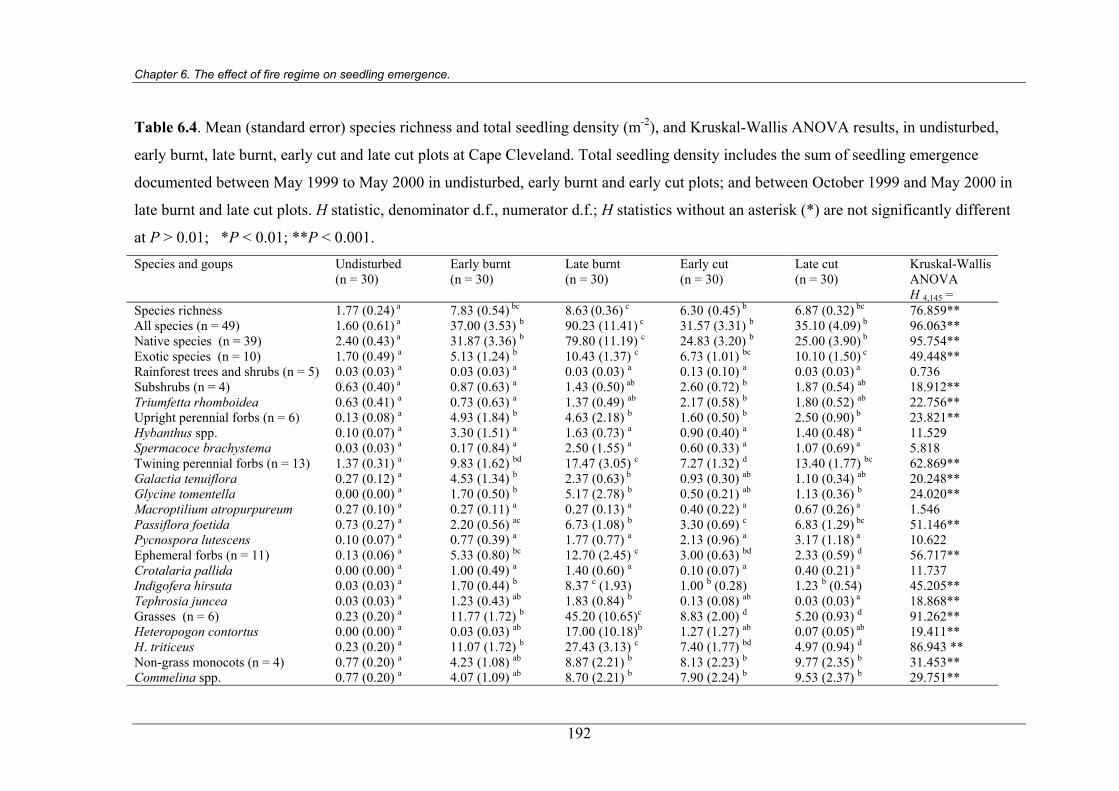
Chapter 6. The effect of fire regime on seedling emergence.
Table 6.4. Mean (standard error) species richness and total seedling density (m-2), and Kruskal-Wallis ANOVA results, in undisturbed,
early burnt, late burnt, early cut and late cut plots at Cape Cleveland. Total seedling density includes the sum of seedling emergence
documented between May 1999 to May 2000 in undisturbed, early burnt and early cut plots; and between October 1999 and May 2000 in
late burnt and late cut plots. H statistic, denominator d.f., numerator d.f.; H statistics without an asterisk (*) are not significantly different
at P > 0.01; *P < 0.01; **P < 0.001. Species and goups Undisturbed
(n = 30) Early burnt (n = 30)
Late burnt (n = 30)
Early cut (n = 30)
Late cut (n = 30)
Kruskal-Wallis ANOVA H 4,145 =
Species richness 1.77 (0.24) a 7.83 (0.54) bc 8.63 (0.36) c 6.30 (0.45) b 6.87 (0.32) bc 76.859**All species (n = 49) 1.60 (0.61) a
37.00 (3.53) b 90.23 (11.41) c 31.57 (3.31) b 35.10 (4.09) b 96.063**Native species (n = 39) 2.40 (0.43) a 31.87 (3.36) b 79.80 (11.19) c 24.83 (3.20) b 25.00 (3.90) b 95.754**Exotic species (n = 10) 1.70 (0.49) a 5.13 (1.24) b 10.43 (1.37) c 6.73 (1.01) bc 10.10 (1.50) c 49.448**Rainforest trees and shrubs (n = 5) 0.03 (0.03) a 0.03 (0.03) a 0.03 (0.03) a 0.13 (0.10) a 0.03 (0.03) a 0.736Subshrubs (n = 4) 0.63 (0.40) a 0.87 (0.63) a 1.43 (0.50) ab 2.60 (0.72) b 1.87 (0.54) ab 18.912**Triumfetta rhomboidea 0.63 (0.41) a 0.73 (0.63) a 1.37 (0.49) ab 2.17 (0.58) b 1.80 (0.52) ab 22.756**Upright perennial forbs (n = 6) 0.13 (0.08) a 4.93 (1.84) b 4.63 (2.18) b 1.60 (0.50) b 2.50 (0.90) b 23.821**Hybanthus spp. 0.10 (0.07) a 3.30 (1.51) a 1.63 (0.73) a 0.90 (0.40) a 1.40 (0.48) a 11.529Spermacoce brachystema 0.03 (0.03) a 0.17 (0.84) a 2.50 (1.55) a 0.60 (0.33) a 1.07 (0.69) a 5.818Twining perennial forbs (n = 13) 1.37 (0.31) a 9.83 (1.62) bd 17.47 (3.05) c 7.27 (1.32) d 13.40 (1.77) bc 62.869**Galactia tenuiflora 0.27 (0.12) a 4.53 (1.34) b 2.37 (0.63) b 0.93 (0.30) ab 1.10 (0.34) ab 20.248**Glycine tomentella 0.00 (0.00) a 1.70 (0.50) b 5.17 (2.78) b 0.50 (0.21) ab 1.13 (0.36) b 24.020**Macroptilium atropurpureum 0.27 (0.10) a 0.27 (0.11) a 0.27 (0.13) a 0.40 (0.22) a 0.67 (0.26) a 1.546Passiflora foetida 0.73 (0.27) a 2.20 (0.56) ac 6.73 (1.08) b 3.30 (0.69) c 6.83 (1.29) bc 51.146**Pycnospora lutescens 0.10 (0.07) a 0.77 (0.39) a 1.77 (0.77) a 2.13 (0.96) a 3.17 (1.18) a 10.622Ephemeral forbs (n = 11) 0.13 (0.06) a 5.33 (0.80) bc 12.70 (2.45) c 3.00 (0.63) bd 2.33 (0.59) d 56.717**Crotalaria pallida 0.00 (0.00) a 1.00 (0.49) a 1.40 (0.60) a 0.10 (0.07) a 0.40 (0.21) a 11.737Indigofera hirsuta 0.03 (0.03) a 1.70 (0.44) b 8.37 c (1.93) 1.00 b (0.28) 1.23 b (0.54) 45.205** Tephrosia juncea 0.03 (0.03) a 1.23 (0.43) ab 1.83 (0.84) b 0.13 (0.08) ab 0.03 (0.03) a 18.868**Grasses (n = 6) 0.23 (0.20) a 11.77 (1.72) b 45.20 (10.65)c 8.83 (2.00) d 5.20 (0.93) d 91.262**Heteropogon contortus 0.00 (0.00) a 0.03 (0.03) ab 17.00 (10.18)b 1.27 (1.27) ab 0.07 (0.05) ab 19.411**H. triticeus 0.23 (0.20) a 11.07 (1.72) b 27.43 (3.13) c 7.40 (1.77) bd 4.97 (0.94) d 86.943 **Non-grass monocots (n = 4) 0.77 (0.20) a 4.23 (1.08) ab 8.87 (2.21) b 8.13 (2.23) b 9.77 (2.35) b 31.453**Commelina spp. 0.77 (0.20) a 4.07 (1.09) ab 8.70 (2.21) b 7.90 (2.24) b 9.53 (2.37) b 29.751**
192
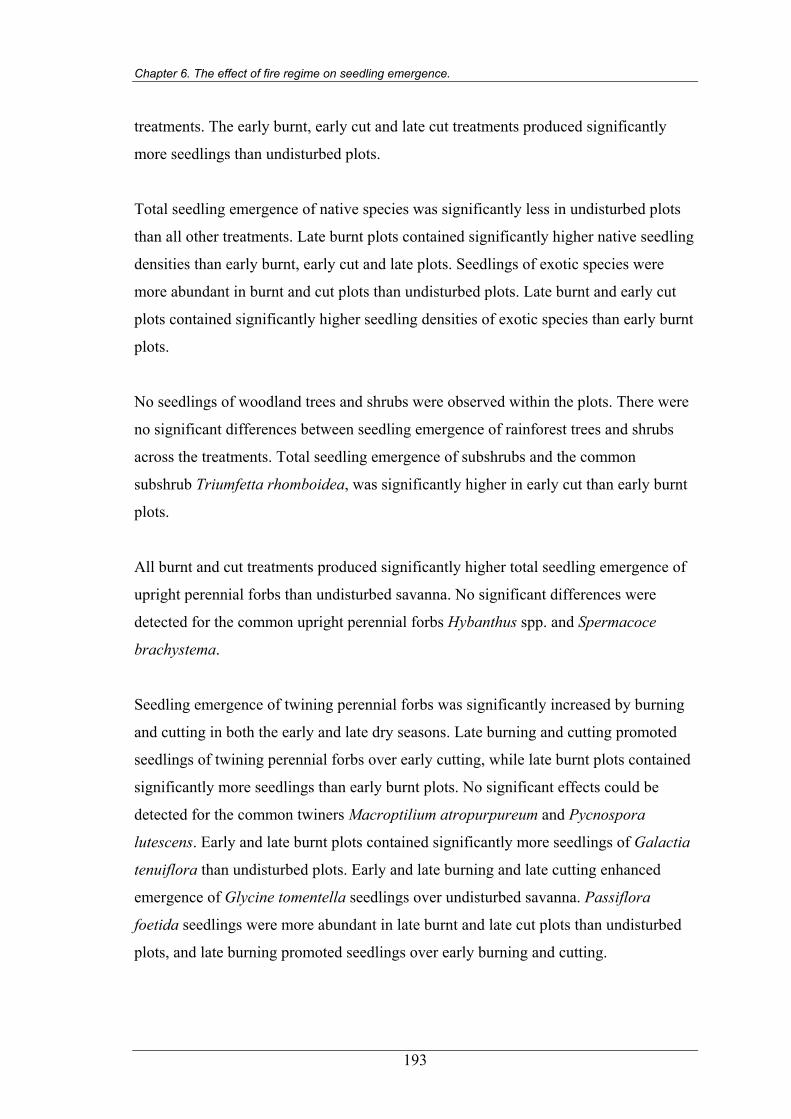
Chapter 6. The effect of fire regime on seedling emergence.
treatments. The early burnt, early cut and late cut treatments produced significantly
more seedlings than undisturbed plots.
Total seedling emergence of native species was significantly less in undisturbed plots
than all other treatments. Late burnt plots contained significantly higher native seedling
densities than early burnt, early cut and late plots. Seedlings of exotic species were
more abundant in burnt and cut plots than undisturbed plots. Late burnt and early cut
plots contained significantly higher seedling densities of exotic species than early burnt
plots.
No seedlings of woodland trees and shrubs were observed within the plots. There were
no significant differences between seedling emergence of rainforest trees and shrubs
across the treatments. Total seedling emergence of subshrubs and the common
subshrub Triumfetta rhomboidea, was significantly higher in early cut than early burnt
plots.
All burnt and cut treatments produced significantly higher total seedling emergence of
upright perennial forbs than undisturbed savanna. No significant differences were
detected for the common upright perennial forbs Hybanthus spp. and Spermacoce
brachystema.
Seedling emergence of twining perennial forbs was significantly increased by burning
and cutting in both the early and late dry seasons. Late burning and cutting promoted
seedlings of twining perennial forbs over early cutting, while late burnt plots contained
significantly more seedlings than early burnt plots. No significant effects could be
detected for the common twiners Macroptilium atropurpureum and Pycnospora
lutescens. Early and late burnt plots contained significantly more seedlings of Galactia
tenuiflora than undisturbed plots. Early and late burning and late cutting enhanced
emergence of Glycine tomentella seedlings over undisturbed savanna. Passiflora
foetida seedlings were more abundant in late burnt and late cut plots than undisturbed
plots, and late burning promoted seedlings over early burning and cutting.
193
Chapter 6. The effect of fire regime on seedling emergence.
Total seedling emergence of ephemeral forbs was significantly lower in undisturbed
savanna than all other treatments. Burning during both the early and late dry seasons
promoted the emergence of ephemeral forb seedlings relative to late cutting, and late
burnt plots contained more seedlings than early cut plots. No significant differences
could be detected for the common ephemeral forb Crotalaria pallida. Indigofera
hirsuta seedlings were significantly more abundant after burning and cutting than in
undisturbed savanna, and late burnt plots contained more seedlings than early burnt,
and early and late cut plots. Tephrosia juncea seedlings were significantly more
abundant in late burnt than early burnt and early cut plots.
Total grass seedling emergence was significantly lower in undisturbed plots than all
other treatments. Early and late burning increased seedling emergence more than early
and late cutting. The common grass Heteropogon contortus produced significantly
more seedlings after late dry season fires than in undisturbed savanna. Significantly
more H. triticeus seedlings emerged from savanna burnt and cut in the early and late
dry seasons than in undisturbed savanna. Early and late burnt plots contained
significantly more seedlings than late cut, and late burnt more than early burnt and
early cut plots.
Seedling emergence of non-grass monocots, including Commelina spp., was
significantly greater in late burnt, and early and late cut plots than in undisturbed
savanna.
6.3.6 Total seedling emergence as a proportion of the soil seed bank
Up to 3% of the untreated soil seed bank collected in the mid dry season (July) of 1999,
emerged as seedlings between July and October 1999. A significantly higher proportion
of the seed bank emerged in the early burnt plots than in early cut plots, and in early cut
plots than in undisturbed plots (Figure 6.6a; H 4,10 = 7.261; P < 0.027).
Up to 14% of the untreated soil seed bank collected in the late dry season (October) of
1999, emerged as seedlings over the wet season (23rd October 1999 to 29th February
2000; Figure 6.6b). The percentage seedling emergence was significantly higher in late
burnt, early cut and late cut plots than undisturbed plots (Figure 6.6b; F 4,10 = 13.238;
194
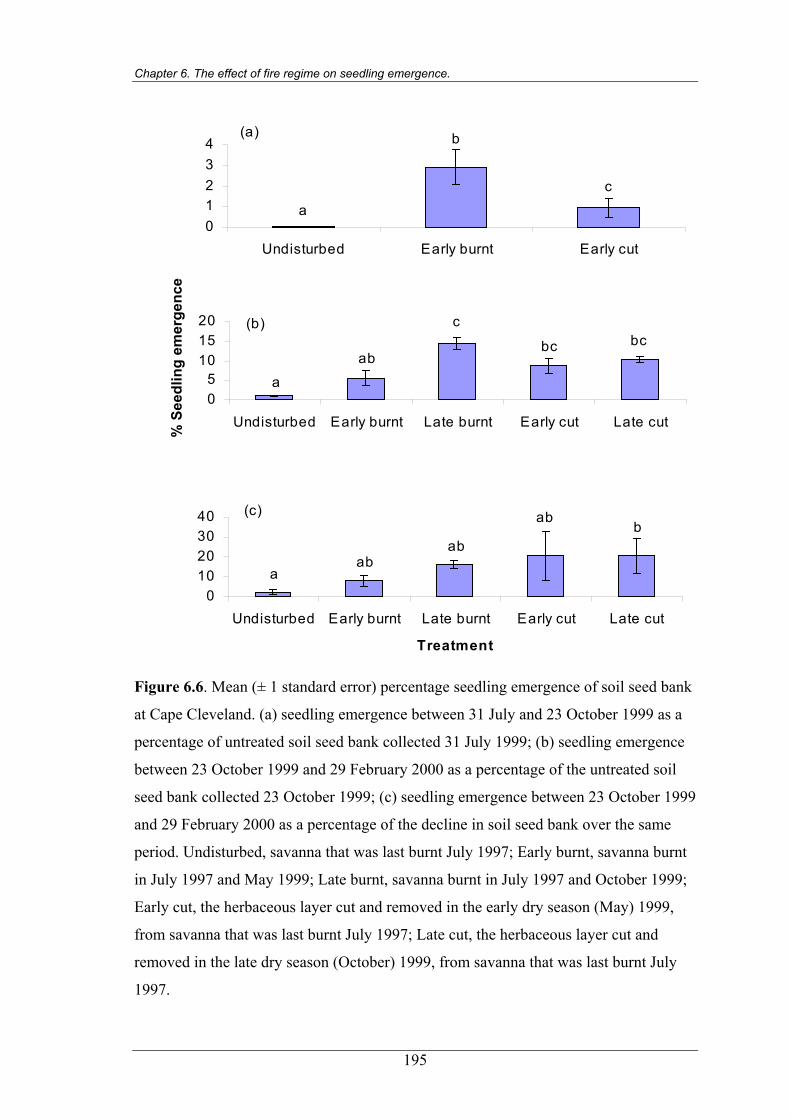
Chapter 6. The effect of fire regime on seedling emergence.
01234
Undisturbed Early burnt Early cut
a
c
(a) b
05
101520
Undisturbed Early burnt Late burnt Early cut Late cut
a
ab
c bcbc
(b)
010203040
Undisturbed Early burnt Late burnt Early cut Late cut
Treatment
a
ab
ab b
ab
(c)
% S
eedl
ing
emer
genc
e
Figure 6.6. Mean (± 1 standard error) percentage seedling emergence of soil seed bank
at Cape Cleveland. (a) seedling emergence between 31 July and 23 October 1999 as a
percentage of untreated soil seed bank collected 31 July 1999; (b) seedling emergence
between 23 October 1999 and 29 February 2000 as a percentage of the untreated soil
seed bank collected 23 October 1999; (c) seedling emergence between 23 October 1999
and 29 February 2000 as a percentage of the decline in soil seed bank over the same
period. Undisturbed, savanna that was last burnt July 1997; Early burnt, savanna burnt
in July 1997 and May 1999; Late burnt, savanna burnt in July 1997 and October 1999;
Early cut, the herbaceous layer cut and removed in the early dry season (May) 1999,
from savanna that was last burnt July 1997; Late cut, the herbaceous layer cut and
removed in the late dry season (October) 1999, from savanna that was last burnt July
1997.
195
Chapter 6. The effect of fire regime on seedling emergence.
P < 0.001). Late burnt plots also had a higher percentage emergence than early burnt
plots.
Seedling emergence, as a percentage of the decline in the untreated soil seed bank over
the wet season (23rd October 1999 to 29th February 2000), was up to 20% (Figure
6.6c). It was significantly higher in the late cut than the undisturbed plots (F 4,10 =
4.112; P < 0.032).
6.4 Discussion
6.4.1 Seedling emergence surveys
Surveys of eucalypt savanna at four sites across the Townsville region indicated that
seedling emergence occurs primarily in the first year after fire (Tables 6.1 and 6.2). At
Mt Elliot, Castle Hill and Many Peaks Range, species richness of seedlings, total
seedling density and seedling density of native and exotic species, most growth form
groups and common species, were significantly higher in recently burnt than unburnt
savanna (Table 6.1). Woodland and rainforest trees and shrubs were the only growth
form groups that did not show not significantly enhanced seedling emergence following
fire, being observed at low densities in both burnt and unburnt sites. Four exotic
species, Crotalaria goreensis, Hyptis suaveolens, Stachytarpheta jamaicensis and
Triumfetta rhomboidea, the native twiner Rhynchosia minima and an unidentified
species of Fimbristylis, were the only common species that did not show a significant
response to fire. Seedling emergence of these species in unburnt savanna was high in
areas disturbed by feral pigs at one of the sites (Many Peaks Range). In this study, no
species or species groups produced seedlings in significantly higher densities in
unburnt compared to burnt savanna. This contrasts with patterns of seedling emergence
of some other tropical savanna species, including Eucalyptus miniata which recruits
seedlings at highest density in unburnt savanna (Setterfield 1997b). Annual grasses that
dominate many tropical eucalypt savannas, such as Schizachyrium spp. and Sorghum
spp., germinate in high densities in both burnt and unburnt savanna (Andrew and Mott
1983; Crowley and Garnett 1999).
Fire, especially late dry season fire, significantly increased the richness of seedling
species and the density of seedlings of most groups and common species at Cape
196
Chapter 6. The effect of fire regime on seedling emergence.
Cleveland (Table 6.2). A significant increase in seedling density by late dry season fires
over unburnt savanna was documented for native and exotic species, subshrubs, the
common subshrub Triumfetta rhomboidea, all herbaceous growth form groups, and the
common herbaceous species Crotalaria pallida, Galactia tenuiflora, Glycine
tomentella, Indigofera hirsuta, Heteropogon contortus, H. triticeus, Passiflora foetida,
Pycnospora lutescens and Tephrosia juncea. The late dry season fires also increased
seedling emergence compared with early dry season fires for native and exotic species,
twining perennial forbs, the common twiners Galactia tenuiflora, Glycine tomentella,
Passiflora foetida and Pycnospora lutescens, ephemeral forbs and the common
ephemeral Indigofera hirsuta, grasses, and the dominant grass Heteropogon triticeus.
The late dry season fires of 1999 produced significantly higher species richness and
higher seedling emergence than the 1997 mid dry season fire for native and exotic
species, subshrubs, Triumfetta rhomboidea, all herbaceous species groups, and the
common herbs Chamaecrista absus, Crotalaria pallida, Galactia tenuiflora, Glycine
tomentella, Indigofera hirsuta, Heteropogon triticeus, Passiflora foetida, Pycnospora
lutescens and Tephrosia juncea (Table 6.2). The 1997 mid dry season fire promoted
significantly greater seedling density than the 1999 early dry season fires for
ephemerals, I. hirsuta and H. contortus.
The increased seedling density of Chamaecrista absus, Crotalaria pallida, Galactia
tenuiflora and Glycine tomentella following late dry season fires, compared with
unburnt savanna, indicates that burning plays a role in releasing seeds of these species
from a state of dormancy, despite the inability of laboratory and shadehouse
experiments to detect significant effects of heat shock and smoke (Chapters 4 and 5).
Further assessment of the seed germination ecology of these species is therefore
required.
Differences in seedling density with fire season are often reported where rainfall is
strongly seasonal. Late dry season (i.e. autumn) fires tend to produce greatest
recruitment in some fire-prone communities of Mediterranean climates, such as
shrubby forests and woodlands of south-western Australia (Bell et al. 1987b; Hobbs
and Atkins 1990). However, Noble (1989) found that annual forbs in mallee vegetation
197
Chapter 6. The effect of fire regime on seedling emergence.
of New South Wales emerged at greatest density after early dry season (i.e. spring)
fires. Roche et al. (1998) demonstrated that smoke application in unburnt Banksia
woodland of south-western Australia in the late dry season (i.e. autumn) also produced
greatest seedling recruitment compared with other seasons. Seedling density of H.
contortus has been reported at highest densities after late dry season fires in south-
eastern Queensland (Tothill 1969). Regions with lower seasonal differences in rainfall
or less consistency in seasonal variation, such as the Sydney region, may display less
variation in recruitment with fire season (Bradstock and Bedward 1992). However in
these areas, low intensity fires, regardless of season, tend to produce fewer seedlings
than higher intensity fires (Clark 1988; Bradstock and Auld 1995). The use of repeated
low intensity fires may reduce populations of species that rely on fire-triggered
germination (Keith 1996).
Bond and van Wilgen (1996) argued that differences in seedling recruitment with fire
season may be due to the size of seed banks at the time of fire, or variation in soil
heating, which affects seed mortality and dormancy release. It has been demonstrated
that heat penetrates to a greater depth, and therefore affects a larger proportion of the
soil seed bank, during late rather than early dry season fires in savanna at Cape
Cleveland (Chapter 4). The large number of seeds released from seed dormancy
compensated for the higher seed mortality produced by elevated soil temperatures,
resulting in significantly denser seedling emergence of Indigofera hirsuta after late
rather than early dry season fires (Chapter 4). It has also been demonstrated that the soil
seed bank is significantly larger in the late rather than early dry season, so that a greater
density of seed is available to be influenced by late dry season fires (Chapter 5).
Therefore the more abundant seedling recruitment after late, rather than early, dry
season fire appears to be the result of both greater heat penetration into the topsoil and
the larger seed bank present during that season.
Bond and van Wilgen’s (1996) discussion on variation in seedling density with
variation in the heat penetration of the topsoil during fires, may be expanded to include
other fire cues. The significantly denser seedling recruitment after late dry season fires
of species released from seed dormancy by smoke, i.e. upright perennial forbs, grasses
and the dominant grass Heteropogon triticeus, indicates that greater numbers of seed
198
Chapter 6. The effect of fire regime on seedling emergence.
were exposed to smoke. While seed banks were larger in the late dry season (Chapter
5), it may be that, in the same way that heat shock penetrates a greater volume of soil
during late dry season fires, the chemical stimulant present in smoke may also penetrate
to a greater depth in the topsoil. This may result from the greater percentage
combustion of fine fuels (Chapter 3) and the proximity of rainfall that follows within
weeks of the late dry season fires. Further research is needed to examine whether
chemical stimulants in smoke penetrate to the greatest depth during late dry season
fires.
Seedling emergence of trees and shrubs differed from that of herbaceous species. While
seedling emergence of herbs was concentrated during the first wet season after fire, the
recruitment of several trees and shrubs was linked to particular years. For instance
seedling emergence of rainforest trees and shrubs was higher in 1999 than any other
year (Table 6.2). The limited recruitment of rainforest species in Townsville savannas
contrasts with that recorded in some savanna studies, such as in South America
(Hoffman 1996), and wet sclerophyll forests of north-eastern Australia (Harrington and
Sanderson 1994; Williams 2000), but is consistent with many Australian tropical
savanna studies (e.g. Bowman et al. 1988; Bowman and Panton 1993; Russell-Smith et
al. in press).
Seedling emergence of the dominant tree, Corymbia clarksoniana, was observed
exclusively in 1998, indicating irregular recruitment events (Table 6.2). The density of
C. clarksoniana germination resulted in the seedling density of woodland trees and
shrubs as a group also being significantly higher in 1998 than other years. Gill et al.
(1990) suggested long-term episodic establishment events of tropical eucalypts may
result from a combination of particularly abundant seed set and an extended wet
season. This may explain the emergence of C. clarksoniana seedling exclusively in
1998, which had above average annual rainfall, with unusually high rain in August to
October, coinciding with seed fall and seedling emergence of C. clarksoniana (Table
2.1). This pattern of episodic seedling emergence resembles that of many tropical
rainforest trees. For instance Connell and Green (2000) documented six episodes of
dense seedling emergence over 32 years, in tropical rainforest on the Atherton
Tableland in north-eastern Australia.
199
Chapter 6. The effect of fire regime on seedling emergence.
Seedling surveys of C. clarksoniana in 1998 indicated that while this species does
germinate in savanna that has remained unburnt for 16 months, seedlings emerged in
recently burnt and slashed savanna at 14 to 17 times the density of unburnt savanna
(Figure 6.1). These results should be considered in the light of the fact that the data
were collected from only a single slashed and recently burnt block, and differences may
have resulted from a separate factor linked with the recently burnt and slashed areas.
However, given the proximity of these areas to the unburnt 1 ha blocks, the results
provide evidence that seedling emergence of C. clarksoniana is enhanced in burnt
savanna, and sites with low herbaceous cover.
6.4.2 Safe sites for Corymbia clarksoniana
Due to low and variable germination, experimental manipulation of micro-site did not
provide conclusive proof that seedling emergence of C. clarksoniana is increased in
recently burnt savanna or where the ground cover is removed. No seedlings emerged
from seed sown in undisturbed savanna, while slightly higher recruitment occurred
from buried rather than surface sown seeds in burnt or cut savanna (Figure 6.4). The
absence of seedlings from at least one replicate of each treatment can be linked with the
failure to detect significant differences between treatments. However, the increased
seedling emergence documented in the seedling surveys in recently burnt and slashed
savanna, coupled with the absence of recruitment from seeds experimentally sown onto
undisturbed plots, combine to provide good evidence that C. clarksoniana seedling
emergence is enhanced where the herbaceous cover is thin, and particularly when seeds
fall onto recently burnt ground.
Late dry season fires reduce seed production in C. clarksoniana (Chapter 5). The low
proportion of viable C. clarksoniana seed that germinated in the experimental plots
indicates that the reduction in seed fall produced by late fires may have a significant
effect on seedling emergence.
Further examination is warranted to assess the possibility that shallow seed burial,
which may be provided by ants or animal digging, also enhances seedling emergence.
Seed burial has been demonstrated to enhance seedling emergence in temperate
eucalypt forests and woodlands in south-eastern Australia (Free 1951; Clarke and
200
Chapter 6. The effect of fire regime on seedling emergence.
Davison 2001). Ant removal of experimentally sown tropical eucalypt seeds can be
considerable (Setterfield 1997b) and this may have affected the emergence of seedlings
in this experiment. The fact that only 51% of the viable seeds germinated in the
laboratory suggests further experimentation is needed to understand the germination
requirements of C. clarksoniana.
Seedling recruitment of eucalypts has been reported in both recently burnt and longer
unburnt sites (Bowman and Kirkpatrick 1986; Gill 1997). Eucalyptus marginata of
south-western Australia can germinate in both burnt and unburnt forest, however
seedlings have been documented at more than twice the density in burnt forest (Whelan
and Main 1979). Germination of E. regnans has also been documented in the absence
of fire, although seedling survival is poor in unburnt forest (Ashton and Chinner 1999).
The possibility that C. clarksoniana germination is higher in recently burnt savanna
contrasts with E. miniata in the Northern Territory, which recruits seedlings at greater
density in unburnt savanna (Setterfield 1997b). These differences may reflect different
micro-site environments in the savanna investigated by Setterfield (1997b), which
experiences an annual dry season senescence of much of the herbaceous layer, in
contrast to the savanna at Cape Cleveland, which is dominated by a perennial
herbaceous layer.
6.4.3 Comparative species composition of seedling emergence surveys, soil seed bank
samples and floristic surveys
No species that were absent from the standing vegetation, emerged as seedlings at Cape
Cleveland (Appendix 1). This suggests that seedlings germinated from seed that was
produced on-site, which is typical of many species of fire-prone communities (Whelan
1986). Three quarters of the seedling species recorded in the surveys were also detected
in the soil seed bank, suggesting most seedlings originated from stored seed and
highlighting the value of soil seed banks in this community. The remaining quarter of
the species observed as seedlings probably originated from freshly fallen seed or very
short-lived seed banks, although it is possible that some may have produced a persistent
but undetected soil seed bank. No species produced a bradysporous seed bank.
201
Chapter 6. The effect of fire regime on seedling emergence.
6.4.4 Total seedling emergence
Total seedling emergence between May 1999 and May 2000 was significantly
enhanced by fire, particularly late dry season fires (Table 6.4). Most seedlings emerged
within the first six weeks of the initial rain of the post-fire wet season, between
November and December 1999 (Figure 6.5; Table 2.1).
The seedling density documented during surveys in December 1999 (Table 6.2) was
approximately one third to one half of the total seedlings that emerged from the early
and late burnt blocks (Table 6.4). Differences between total seedling density and the
snapshot provided by the seedling surveys at the start of December, would most likely
be due to additional seedlings emerging after the surveys and seedling mortality prior to
the surveys (Chapter 7). This indicates that the estimate of seedling density provided by
the seedling surveys was a moderate proportion of the total seedlings that emerged over
the year, and that the surveys displayed the same overall trends in regards to fire-
enhanced seedling emergence.
Burning and cutting in both the early and late dry seasons significantly promoted the
number of seedling species, total seedling density, and seedling emergence of native
and exotic species, upright and twining perennial forbs, ephemeral forbs, the common
ephemeral I. hirsuta, grasses and the dominant grass H. triticeus (Table 6.4).
Early and late dry season fires both promoted seedling density of grasses over cutting
in both seasons. Late burnt plots contained significantly more seedlings overall, and
more seedlings of natives, grasses and Indigofera hirsuta, than plots burnt early in the
dry season and cut in either season.
The removal of the grass layer in both the early and late dry season promoted seedling
emergence that was not significantly different from that of burning in the early dry
season, for total seedling density and seedlings of rainforest trees and shrubs, upright
perennial forbs, including Hybanthus spp. and Spermacoce brachystema, twining
perennial forbs, and the common twiners Galactia tenuiflora, Glycine tomentella,
Passiflora foetida and Pycnospora lutescens, the common ephemeral forbs Crotalaria
pallida, I. hirsuta and Tephrosia juncea, the common grass H., non-grass monocots and
202
Chapter 6. The effect of fire regime on seedling emergence.
Commelina spp. Of these species, upright forbs, P. lutescens, ephemeral forbs, I.
hirsuta, and T. juncea showed significant fire-related dormancy release (Chapters 4 and
5). This suggests that early dry season fires did not promote the full potential
recruitment of several species and species groups.
Cutting in each season produced seedling emergence that was not significantly different
from that under late dry season fires for exotic species, rainforest trees and shrubs,
upright forbs, Hybanthus spp., Spermacoce brachystema, Galactia tenuiflora, Glycine
tomentella, Pycnospora lutescens, Crotalaria pallida, Heteropogon contortus, non-
grass monocots and Commelina spp. Of these, only upright perennial forbs, whose
seed germination is enhanced by exposure to smoke, and P. lutescens, which is
promoted by heat shock (Chapter 5), have displayed significant fire-related heat or
chemical cues for dormancy release. This indicates that most species with seed
dormancy broken by heat shock or smoke, germinated at greater density after late fires
than cutting treatments. It also confirms that late dry season fires release a larger
number of species from a state of seed dormancy than early dry season fires.
These data indicate that part of the role of fire in enhancing seedling emergence
operates through removing the competitive inhibition provided by the dense herbaceous
cover. Shaw (1957) also found that cutting and removing the grass layer produced a
seedling density of Heteropogon contortus that was intermediate between that of burnt
and undisturbed treatments. This inhibition may be due to competition for light, or be
linked to soil temperatures, which can increase after the removal of grass cover (Shaw
1957; Tothill 1969).
Total seedling emergence, with a maximum mean density in one year of 90 seedlings
m-2 (Table 6.4), is higher than that recorded by Purdie and Slatyer (1976) in a temperate
eucalypt woodland in south-eastern Australia, where total seedling emergence levels
ranged from 7.5 to 25 m-2. However, it is lower than that recorded in some fire-prone
communities. For instance, the fire-killed shrub Beaufortia elegans in south-western
Australia, can produce an average of 235 seedlings m-2 after autumn fires (Bell et al.
1987b). Annual grasses of tropical savannas can also recruit seedlings at higher
densities than recorded in this study. For example, the annual grass Schizachyrium
203
Chapter 6. The effect of fire regime on seedling emergence.
fragile can produce 2560 seedlings m-2 (Crowley and Garnett 1999), and Sorghum
intrans 253 m-2 (Andrew and Mott 1985).
6.4.5 Total seedling emergence as a proportion of untreated soil seed bank
Seedling emergence between July and October 1999, accounted for up to 3% of the
untreated soil seed bank collected in the mid dry season, and was significantly higher in
early burnt than in undisturbed and early cut plots (Figure 6.6a). Seedling emergence
over the wet season, between October 1999 and February 2000, accounted for up to
14% of the untreated soil seed bank collected in the late dry season, and was
significantly higher in late burnt, early and late cut plots than in undisturbed plots, and
in late burnt than early burnt plots (Figure 6.6b). While this is a larger proportion of the
seed bank than recruited during the dry season, it remains only a small fraction of the
seed bank that was available for germination. These data suggest that a proportion of
the untreated seed bank that germinates in the shadehouse, may possess an enforced
dormancy (Chapter 5). Auld et al. (2000) suggested enforced seed dormancy produced
by darkness and inappropriate temperatures may be responsible for the seed bank
persistence of viable seed that lacked an innate dormancy. There is evidence that
darkness may have enforced dormancy onto a proportion of the seed bank at Cape
Cleveland, as the removal of shading from the herbaceous layer significantly enhanced
the percentage germination from the seed bank (Figure 6.6).
The low percentage germination of the seed bank indicates that while late dry season
fires promote greater recruitment than early dry season fires, the potential for further
seedling emergence remains. However, the density of seeds that germinate but fail to
emerge above the soil surface may be considerable and Murray (1998) demonstrated
seed germination can be density-dependent, which suggests an upper threshold exists
for potential density of emerging seedlings.
Seedling emergence accounted for up to 20% of the decline in untreated soil seed bank
over the wet season, and was significantly higher in late cut than undisturbed plots
(Figure 6.6c). This indicates that only a low proportion of the seeds that are lost from
the seed bank during the wet season reach the emerged seedling stage, the majority
presumably either rot or are eaten.
204
Chapter 6. The effect of fire regime on seedling emergence.
Several recruitment studies have documented a low proportion of the seed bank
emerging as seedlings (e.g. Keeley 1977; Grice and Westoby 1987; Moreno and Oechel
1991; Pierce and Cowling 1991). While seedling recruitment in eucalypt savanna at
Cape Cleveland was primarily limited by the occurrence of fire required to break seed
dormancy (Chapters 4 and 5), it may be concluded that the low to moderate density of
the soil seed bank (Chapter 5) was a contributing factor that limited seedling
emergence.
The limited or episodic seedling emergence of woody species in savannas around
Townsville is consistent with other trees and shrubs of tropical savannas (e.g. Lacey
1974; Burrows and Burrows 1992). The low seedling emergence of trees and shrubs
may represent a trade-off for the resources. Sprouting species tend to put greater
resources into vegetative growth and maintenance of meristematic tissue than seed
production, resulting in lower seedling densities than associated fire-killed species
(Pate et al. 1990; Kruger 1997; Bell 2001; Bond and Midgley 2001). Allocating
resources to ensure the longevity of individual plants is a successful strategy that can
buffer against the effects of frequent burning and provide population persistence (Bond
and Midgley 2001). This is reflected in the stability in composition and abundance of
woody species documented over five years in the floristic surveys at Cape Cleveland
(Chapter 3).
Climatic conditions, and their effects on other factors such as fire frequency and
intensity, may be influential in the development of life history strategies. For example,
van Rensberg et al. (1999) found that populations of Themeda triandra from regions
with high and predictable rainfall relied less on seedling recruitment and more on
vegetative reproduction, than populations in regions with lower and less predictable
rainfall. This reflects the low seedling emergence of T. triandra, which was < 1% of the
total seedling density, in the high rainfall region of Townsville. It also supports Bond
and Midgley’s (2001) hypothesis that regular burning promotes persistent species with
less seedling recruitment, as fires tend to be more frequent in regions with higher and
predictable rainfall (Higgins et al. 2000).
205
Chapter 6. The effect of fire regime on seedling emergence.
6.5 Conclusion
Seedling emergence in the eucalypt savannas around Townsville, in north-eastern
Australia, is dominated by herbaceous species, reflecting the dominance of herbs in the
soil seed bank (Chapter 5). Seedling recruitment of these species occurs primarily at the
start of the first wet season following fire. The removal of the herbaceous layer has
been demonstrated to significantly increase seedling emergence. This indicates that
there are multiple fire-related cues that promote germination in this savanna, including
exposure to heat shock, smoke, enhanced nitrate levels (Chapters 4 and 5), and the
removal of competition from the herbaceous layer.
Late dry season fires promote a greater density of seedling emergence than early dry
season fires. This is consistent with reports from other fire-prone communities that high
intensity, late dry season fires promote the emergence of more seedlings than early dry
season fires, or low intensity fires in general for regions with a poor distinction between
wet and dry seasons. It contrasts with the seedling recruitment of annual grasses that
dominate some tropical savannas of northern Australia, which can recruit seedlings at
high densities in the absence of fire (Andrew 1986; Crowley and Garnett 1999). The
greater seedling density after late, rather than early, dry season fires at Cape Cleveland
accounts for the larger increase in species abundance after late dry season fires,
documented in the floristic surveys (Chapter 3).
Bond and van Wilgen (1996) proposed that differences in seedling recruitment after
fires of different seasons may be due to variation in either the size of the seed bank, or
the heat of fire in causing seed mortality and dormancy release. Chapters 4 and 5 have
demonstrated that late dry season fires produce greater heat penetration and release
from seed dormancy than early dry season fires. Soil seed banks are also larger during
the late rather than early dry season, so that a greater density of seeds is available to be
affected by fire in the late dry season. It appears from these data that both the greater
dormancy-release stimuli of late dry season fires, and the higher seed bank density in
the late dry season, combine to promote the greatest seedling emergence. Further
experimental work involving the manipulation of seed bank density and fire stimuli is
required to elucidate the relative contributions of each factor.
206
Chapter 6. The effect of fire regime on seedling emergence.
207
Seedling emergence of some trees and shrubs is episodic. Rainforest trees and shrubs
recruited a low density of seedlings, primarily in 1999, in both unburnt and recently
burnt savanna. The dominant eucalypt, C. clarksoniana, was observed to recruit
seedlings only in 1998, which may have been the result of the high rainfall and early
start to the wet season in that year. Seedling emergence of C. clarksoniana was
documented in both recently burnt and longer unburnt savanna. However, there is
evidence that the density of seedling emergence of this tree may be increased when
seeds fall onto recently burnt ground, or at least in areas with low herbaceous cover.
Seedling emergence is therefore a critical life event that mainly occurs in brief pulses,
either at the start of the first wet season following fire for most herbs and subshrubs, or
more irregularly for the dominant eucalypt and other trees. The survival of seedlings is
another critical stage in a plant’s life cycle and ultimately determines the success of
recruitment events. The next chapter examines the survival of seedlings that emerged
after different fire treatments and the fire-tolerance of seedlings of common species.
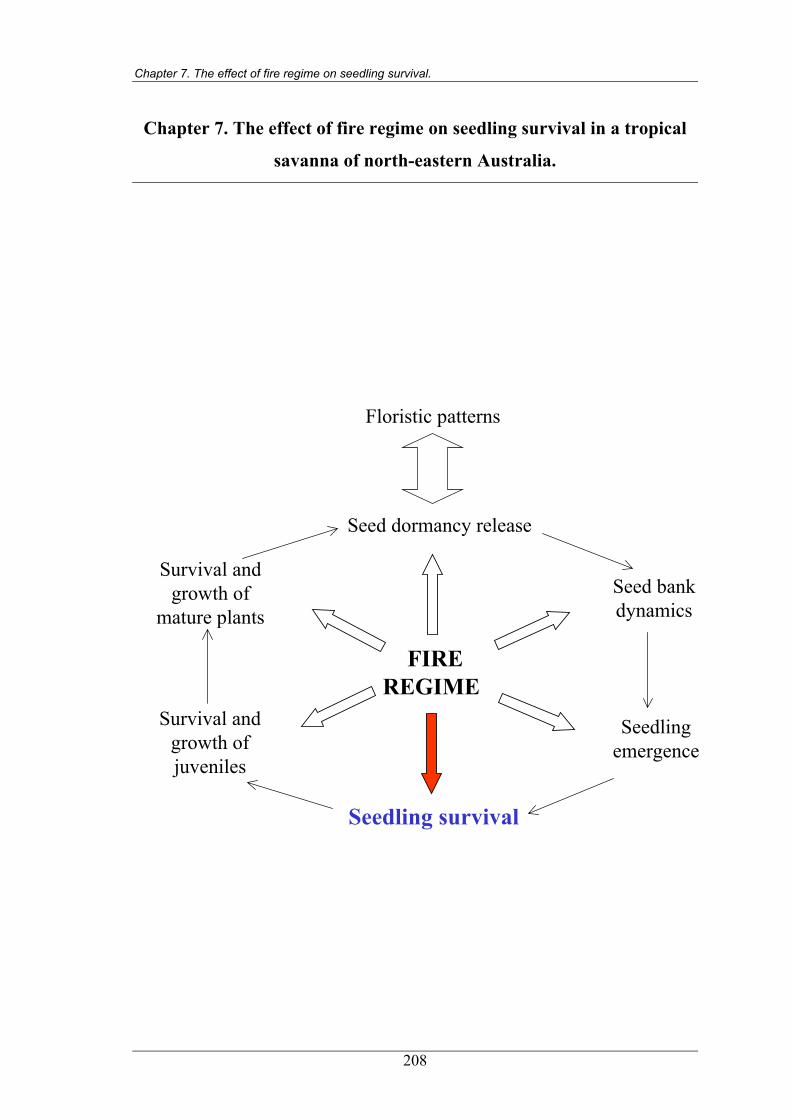
Chapter 7. The effect of fire regime on seedling survival.
Chapter 7. The effect of fire regime on seedling survival in a tropical
savanna of north-eastern Australia.
FIREREGIME
Seed dormancy release
Floristic patterns
Seed bankdynamics
Seedlingemergence
Survival andgrowth ofjuveniles
Survival andgrowth of
mature plants
Seedling survival
208
Chapter 7. The effect of fire regime on seedling survival.
7.1 Introduction
Seedling survival is as critical to the recruitment of new plants as the density of
seedling emergence (Keith 1996), and the conditions that produce dense seedling
emergence can differ from those resulting in highest seedling survival (Lamont et al.
1993; Mustart and Cowling 1993; Stoneman and Dell 1994).
There is considerable variation in seedling survival between species. For instance,
Vaughton (1998) documented very high seedling survival (91%) two years after
germination for Grevillea barklyana, a shrub of coastal heath and woodland in New
South Wales; whereas in semi-arid woodland of western New South Wales, survival of
Acacia victoriae and Senna spp. (synonym Cassia) seedlings can be very low one year
after germination (< 1% and 2.1% survival respectively; Grice and Westoby 1987). The
low seedling survival of Acacia victoriae and Senna spp. lead Grice and Westoby
(1987) to consider seedling survival the critical life event that limits population growth
in those species.
Seedling survival can be a critical life event that limits the distribution of a species to
certain habitats. For example, seedlings of the rainforest tree, Sterculia quadrifida,
showed greater survival one year after transplanting within rainforest than after
transplanting within adjacent savanna (Bowman and Panton 1993); although three and
a half years after transplanting, the rainforest trees Aglaia rufa and Diospyros maritima
displayed similar seedling survival in rainforest and savanna (Bowman 1993).
Seedling survival can also vary significantly within habitats, at the micro-site scale. For
instance, the Tasmanian shrub Epacris stuartii displays greater survival of seedlings
growing in soil rather than on rocks, although the converse is true for seedling
emergence (Keith 2002). Lamont et al. (1993) found survival of Banksia and Hakea
seedlings in south-western Australia was higher in bare sand than amongst leaf litter,
whereas seedling survival of Eucalyptus obliqua in south-eastern Australia can be
enhanced by leaf litter (Facelli et al. 1999).
Seedling mortality can be caused by competition for resources, especially competition
for moisture, nutrients and light; and includes both inter- and intra-specific interactions
209
Chapter 7. The effect of fire regime on seedling survival.
(Harper 1977). Other mechanisms of seedling mortality include herbivory, disease, and
disturbance, and different mortality processes may operate during different seasons
(Whelan 1995). Herbivory, disease and competition for resources can be density-
dependent processes (Bond and van Wilgen 1996), that is, the proportion of seedlings
affected varies with seedling density. Evidence for density-dependent seedling
mortality has been documented for seedlings of the semi-arid shrub Senna
artemisioides (synonym Cassia eremophila; Hodgkinson 1991). Experimental thinning
of seedlings of the annual grass, Sorghum intrans, has provided evidence of significant
density-dependent effects on seedling growth and seed production, but not seedling
survival (Andrew 1986).
Established plants may compete with, or facilitate, seedling establishment. Survival of
Eucalyptus marginata seedlings is limited by competition with canopy trees (Stoneman
et al. 1994). Seedling survival of herbs in Victorian grassland is higher in gaps than
underneath Themeda triandra tussocks (Morgan 1998). Establishment of rainforest
seedlings in tropical savannas may be facilitated by established trees and shrubs
(Kellman 1985; Bowman and Fensham 1991). Noble (1980) documented both
competitive and facilitative interactions between tussock grasses and Eucalyptus
pauciflora seedlings. Competition from grass tussocks (Poa spp.) prevented the
survival of E. pauciflora seedlings within 4 cm of a tussock. However, grasses
provided some benefits to nearby seedlings, as the tallest E. pauciflora seedlings were
those closest to tussocks, but outside the 4 cm zone.
Seedling survival is often higher on burnt rather than unburnt ground (Pate et al. 1985;
Bradstock 1991). This may result from various factors, including enhanced nutrient and
light availability (Ashton and Chinner 1999) and reduced competition (Bond and van
Wilgen 1996). Herbivory from invertebrates can be reduced in recently burnt
communities (Whelan and Main 1979; Tozer and Bradstock 1997), while herbivory by
vertebrates can increase after burning, especially after small scale fires (Whelan 1995).
Seedling survival is affected by various aspects of fire. Fire interval is important
because seedlings of fire-killed species need to produce seed, and seedlings of
resprouting species need to develop the ability to survive the next fire. Variation in fire
210
Chapter 7. The effect of fire regime on seedling survival.
intensity may affect the ability of a seedling to survive the passage of fire and patchy
low intensity fires can enable the survival of seedlings in unburnt areas. Fire intensity
can influence the survival of seedlings that emerge following the fire, through its effect
on ground layer combustion and therefore micro-site environment (Keith 1996).
Fire season affects seedling survival through its relationship with fire intensity, and the
timing of fires with seasonal phases in plant resource allocation, seed abundance and
the post-fire climate (Whelan 1995). Early to mid wet season fires in tropical savannas
kill seedlings of annual Sorghum spp. before they set seed, causing population declines
(Stocker and Sturtz 1966; Lonsdale et al. 1998; Williams and Lane 1999). Baird (1977)
concluded that the greater seedling survival in eucalypt woodland after mid dry season
(i.e. summer) fires than early dry season fires (i.e. spring) in south-western Australia
was due to the limited rain following early dry season fires. In contrast, higher
mortality of Banksia seedlings was documented after late dry season fires (i.e. autumn)
than early dry season fires (i.e. spring) in Banksia woodland of south-western Australia
(Enright and Lamont 1989). They considered this was due to more safe sites provided
by early dry season fires, with the unconsumed leaf litter protecting seedlings from
desiccation.
Seedlings of obligate seeders often show higher percentage survival than seedlings of
associated sprouters (Pate et al. 1990; Benwell 1998). For sprouting species, the period
required to develop the capacity to tolerate fire is of equivalent functional importance
to the time required for seedlings of obligate seeders species to set seed (i.e. primary
juvenile period, Gill 1975; Keith 1996).
Fires, particularly those in the late dry season, promote seedling emergence in tropical
savannas of Townsville (Chapter 6). This chapter examines the effect of fire on
seedling survival. It assesses the survival of seedlings that emerged after early and late
dry season fires, as well as the survival of seedlings that recruited prior to burning.
Specific questions addressed are:
1. Is percentage survival higher for seedlings that emerged from recently burnt than
longer unburnt savanna?
211
Chapter 7. The effect of fire regime on seedling survival.
2. Is seedling survival enhanced by the removal of herbaceous cover?
3. Does the season of burning, or removal of herbaceous cover, influence the survival
of post-disturbance seedlings?
4. Can seedlings develop the capacity to survive fire within a year?
5. What is the effect of fire season on pre-fire seedlings?
6. Is there evidence of density-dependent seedling survival in this savanna?
7.2 Methods
7.2.1 Sampling methods
7.2.1a Survival of seedlings emerging from burnt, cut and undisturbed savanna
The 1m2 permanently marked plots that were established at Cape Cleveland in 1999 to
examine seedling emergence (Chapter 6), were used to assess the effects of burning,
and the removal of the herbaceous layer from unburnt savanna, in both the early and
late dry seasons, on the survival of seedlings. The treatments were:
1. Undisturbed; savanna that was last burnt in July 1997, and remained undisturbed.
2. Early burnt; savanna burnt in early dry season fires (May 1999).
3. Late burnt; savanna burnt in late dry season fires (October 1999).
4. Early cut; herbaceous layer cut and removed from unburnt plots in the early dry
season (May 1999), in savanna that was last burnt in July 1997.
5. Late cut; herbaceous layer cut and removed from unburnt plots in the late dry
season (October 1999), in savanna that was last burnt in July 1997.
Each treatment was represented by ten 1m2 plots in each of three 1 ha blocks at Cape
Cleveland, providing a total of 30, 1m2 plots for each of the five treatments (Chapter 6).
Seedlings that emerged between May 1999 (October 1999 for late burnt and late cut)
and May 2000, were tagged by placing fencing wire, that was twisted into various
shapes to distinguish common species, into the soil two or three centimetres from the
base of the seedlings (Chapter 6). The survival of tagged seedlings was examined for
survival in October 2001, two years after the late dry season fires. This provided data
on seedling survival for at least 18 months following germination of all seedlings and,
as most emerged in November and early December 1999 (Figure 6.5), it represents 23
months since the germination of most seedlings.
212
Chapter 7. The effect of fire regime on seedling survival.
7.2.1b Ability of seedlings to survive fire within one year of germination
Prior to burning along the fire break block (Figure 2.4) in September 1998, ten 1m2
plots were established to examine seedling emergence and survival in annually burnt
savanna. These plots document the ability of post-fire seedlings to tolerate a follow up
fire within one year of germination.
Random numbers were used to determine the distance of the 1m2 plots along the 700 m
length of the fire break block. Seedling emergence was assessed every month after the
September 1998 fire, and seedlings were tagged by placing fencing wire in the soil, two
or three centimetres from the base of the seedlings. The number of tagged seedlings
that sprouted after the May 1999 fire was assessed in August 1999, three months
following fire. No seedlings were simultaneously tagged in unburnt savanna, and
therefore no direct comparison can be drawn between survival in burnt and unburnt
savanna between September 1998 and August 1999. Conclusions from these data are
also limited by the assessment of only one burnt area, and it is possible that seedlings
which were alive three months after fire subsequently died before the onset of the wet
season in November. Nevertheless, the data are useful for documenting sprouting
capabilities of seedlings.
7.2.1c The effect of fire season on the survival of Corymbia clarksoniana seedlings that
emerged prior to fire
In November 1998, within one month of the mass seedling emergence of Corymbia
clarksoniana at Cape Cleveland, 50 seedlings were tagged in each of the nine, 1 ha
blocks (Figure 2.4). Seedlings were easily distinguished from established plants by the
presence of broad cotyledons. The seedlings examined were those that emerged along
the edges of the 100m2 plots used in the floristic surveys (Chapter 3) to allow ease of
relocation. In each of the nine, 1ha blocks, one of the four edges was randomly selected
from each of the four 100m2 plots for the examination of seedlings. Additional plot
edges were selected where needed. Seedlings were tagged by placing fencing wire in
the soil, two or three centimetres from the base of the seedlings and twisting the top of
the wire into a Z shape to identify as the location of a C. clarksoniana seedling in the
event of seedling mortality. The seedlings were assessed for survival, and heights
213
Chapter 7. The effect of fire regime on seedling survival.
measured, seven months (prior to the May 1999 fire), 19 months (May 2000) and 36
months (October 2001) after germination.
7.2.2 Statistical analyses
7.2.2a Survival of seedlings emerging from burnt, cut and undisturbed savanna
The influence of disturbance treatments on seedling survival was assessed using
percentage survival figures, as final seedling numbers varied with the density of
seedling emergence. The percentage survival of seedlings of each species was
calculated for each replicate 1m2 plot, by dividing the total number of seedlings that
emerged between May 1999 and May 2000 (Chapter 6), by the number surviving in
October 2001 and multiplying by 100. As the life span of the ephemeral species is less
than the period for which survival was assessed, the seedling emergence of ephemeral
species was not included in the calculation of overall percentage seedling survival. The
statistical significance of differences in percentage seedling survival between
undisturbed, early and late burnt and early and late cut savanna was assessed using a
one-factor ANOVA. Analyses were performed for total seedling survival, and that of
native and exotic species, the growth form groups defined in Chapter 3, and common
species with at least 5% of the surviving seedlings. As the overall seedling survival was
low, species with less than 5% of surviving seedlings were highly variable within
treatments and were not analysed.
The ten, 1m2 plots from each of the three replicate 1 ha blocks used in each treatment
were considered nested within the disturbance treatments (undisturbed, early or late
burnt, early or late cut). The nested plots were treated as random factors, with treatment
as a fixed factor. Where the variation between treatment replicates of separate blocks
was low
(P > 0.25) the plot replicates were pooled to increase the power of the ANOVA
(Underwood 1997).
Homogeneity of variance was assessed using Cochran’s test (Underwood 1997).
Variance heterogeneity was resolved for most species and species groups using arcsine
data transformation (Underwood 1997). Due to the large number of analyses, a
significance level of P < 0.01 was used to reduce the probability of incorrectly
214
Chapter 7. The effect of fire regime on seedling survival.
attributing a significant difference (i.e. alpha; Zar 1999). Where significant differences
were detected, a Scheffe’s post-hoc test was used to determine where differences lay
(Underwood 1997). Where data transformation did not resolve significant variance
heterogeneity, the non-parametric Kruskal-Wallis ANOVA by ranks was used, and a
Mann-Whitney U-test used as a post-hoc test with a Bonferroni adjustment of the
significance level for multiple comparisons (Sokal and Rohlf 1995).
The presence of density-dependent mortality was assessed using the total seedling
survival data. As variances were strongly heterogeneous, the non-parametric
Spearman’s rank correlation was used to assess a relationship between the density of
seedling emergence and the percentage seedling survival in each of undisturbed, early
burnt, late burnt, early cut and late cut plots (Sokal and Rohlf 1995). Seedling
emergence data for ephemeral species were not included in the calculation of
percentage seedling survival, as their life span is less than the period for which survival
was assessed. However, the seedling emergence density used in the correlation with
seedling survival did include ephemeral species, due to the role of all seedlings in
influencing density-dependent processes.
7.2.2b Ability of seedlings to survive fire within one year of germination
Seedling survival following the early dry season fire along the fire break block was
calculated for the four most common sprouter species that emerged between September
1998 and May 1999. In each of the 1m2 plots, percentage seedling survival was
calculated for the total numbers of seedlings that emerged between the September 1998
fire and the May 1999 fire. Percentage survival was also calculated for the number of
seedlings that were alive one week prior to the May 1999 fire. No comparative data
were collected for survival of these seedlings in unburnt savanna and therefore no
analyses of survival in burnt and unburnt were performed. Inter-species differences
were not analysed as the seedlings were tagged within the same plots and were not
independent of each other (Underwood 1997).
215
Chapter 7. The effect of fire regime on seedling survival.
7.2.2c The effect of fire season on the survival of pre-fire Corymbia clarksoniana
seedlings
The statistical significance of differences between seedling survival of Corymbia
clarksoniana in control, early and late dry season burnt blocks was compared using a
one-factor ANOVA. The intention was to perform a repeated measures ANOVA on the
percentage seedling survival at seven months (prior to the May 1999 fires), 19 and 36
months folowing germination. A Cochran’s test (Underwood 1997) indicated variance
heterogeneity for the 36 month survival data could not be resolved with data
transformations. Therefore a repeated measures ANOVA was performed on the
survival data at seven and 19 months, with a separate non-parametric Kruskal-Wallis
ANOVA by ranks used to assess significance of differences between fire treatments at
36 months after germination (Sokal and Rohlf 1995; Zar 1999).
To examine the statistical significance of differences in seedling heights between fire
treatments, an independent t-test was performed on the heights of seedlings surviving at
36 months in the control and early burnt blocks, as no seedlings remained in the late
burnt blocks (Zar 1999).
7.3 Results
7.3.1 Survival of seedlings emerging from burnt, cut and undisturbed savanna
The rainfall during the period of assessment was above average during the first year
(i.e. 2000) but below average during the second year following seedling emergence (i.e.
2001; Figure 2.2 and Table 2.1). Seedling emergence between May 1999 and May
2000 ranged from 1.6 seedlings m-2 in the undisturbed savanna to 90.2 seedlings m-2 in
the late burnt savanna (Table 6.4). An average of approximately four seedlings m-2
survived in late burnt and two seedlings m-2 in early dry season burnt savanna by
October 2001. Negligible seedlings survived in undisturbed (0.1m-2), early cut (0.8m-2)
and late dry season cut savanna (0.4m-2).
The percentage of species that survived until October 2001 in the 1m2 plots was
significantly higher in early and late dry season burnt savanna than in undisturbed and
late dry season cut savanna (F 4,145 = 218.13; P < 0.001; Figure 7.1a). Percentage
survival of species was also significantly higher in late dry season burnt than early dry
216
Chapter 7. The effect of fire regime on seedling survival.
season cut savanna. The percentage survival of all seedlings combined was
significantly higher in early and late dry season burnt savanna than in undisturbed and
early and late dry season cut savanna (F 4,10 = 8.26; P < 0.003; Figure 7.1b).
The mean percentage survival and statistical significance of species groups and
common species is presented in Table 7.1. The percentage survival of native seedlings
was significantly higher in early and late dry season burnt savanna than in undisturbed
and early and late dry season cut savanna. There were no significant differences
between treatments for exotic seedlings.
No seedlings of trees and shrubs, ephemerals or non-grass monocots were alive by
October 2001, at least 18 months after seedling emergence. A higher percentage of
subshrub seedlings survived in late dry season burnt savanna than undisturbed savanna.
There were no significant differences between treatments for the common subshrub
Triumfetta rhomboidea, which possessed the highest percentage seedling survival of
any individual species, at 19%.
There were no significant differences in percentage seedling survival between
treatments for the upright perennial forbs, grasses or the common grasses Heteropogon
contortus and H. triticeus; although there was significant variation in the survival of H.
triticeus seedlings between blocks, which suggests edaphic factors were influencing
survival.
217
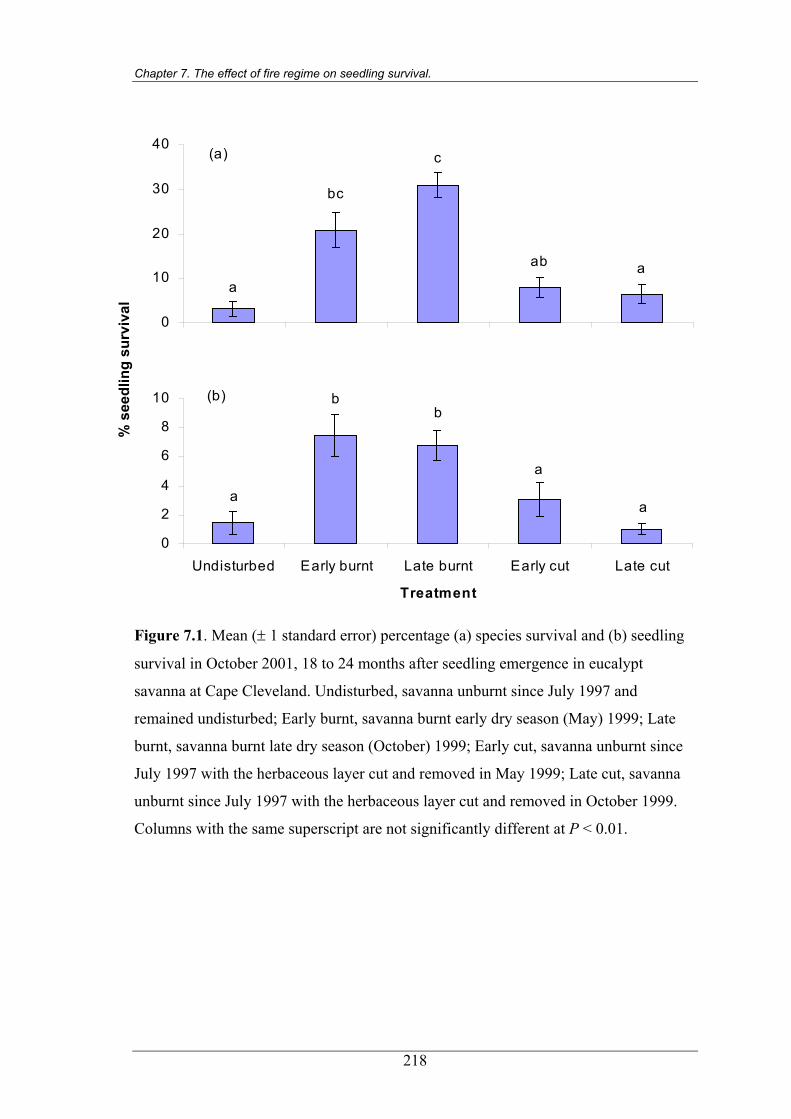
Chapter 7. The effect of fire regime on seedling survival.
0
10
20
30
40
Undisturbed Early burnt Late burnt Early cut Late cut
a
c
bc
ab a
(a)
0
2
4
6
8
10
Undisturbed Early burnt Late burnt Early cut Late cut
Treatment
bb
a
a
a
(b)
% s
eedl
ing
surv
ival
Figure 7.1. Mean (± 1 standard error) percentage (a) species survival and (b) seedling
survival in October 2001, 18 to 24 months after seedling emergence in eucalypt
savanna at Cape Cleveland. Undisturbed, savanna unburnt since July 1997 and
remained undisturbed; Early burnt, savanna burnt early dry season (May) 1999; Late
burnt, savanna burnt late dry season (October) 1999; Early cut, savanna unburnt since
July 1997 with the herbaceous layer cut and removed in May 1999; Late cut, savanna
unburnt since July 1997 with the herbaceous layer cut and removed in October 1999.
Columns with the same superscript are not significantly different at P < 0.01.
218
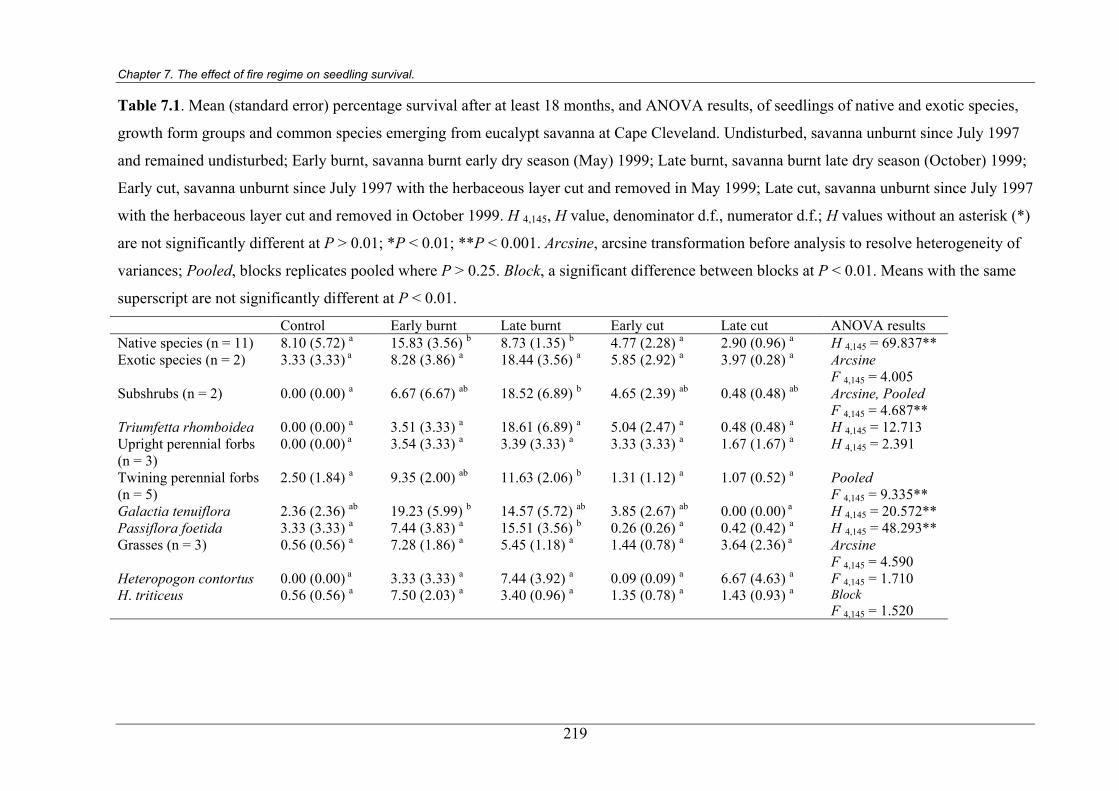
Chapter 7. The effect of fire regime on seedling survival.
Table 7.1. Mean (standard error) percentage survival after at least 18 months, and ANOVA results, of seedlings of native and exotic species,
growth form groups and common species emerging from eucalypt savanna at Cape Cleveland. Undisturbed, savanna unburnt since July 1997
and remained undisturbed; Early burnt, savanna burnt early dry season (May) 1999; Late burnt, savanna burnt late dry season (October) 1999;
Early cut, savanna unburnt since July 1997 with the herbaceous layer cut and removed in May 1999; Late cut, savanna unburnt since July 1997
with the herbaceous layer cut and removed in October 1999. H 4,145, H value, denominator d.f., numerator d.f.; H values without an asterisk (*)
are not significantly different at P > 0.01; *P < 0.01; **P < 0.001. Arcsine, arcsine transformation before analysis to resolve heterogeneity of
variances; Pooled, blocks replicates pooled where P > 0.25. Block, a significant difference between blocks at P < 0.01. Means with the same
superscript are not significantly different at P < 0.01.
Control Early burnt Late burnt Early cut Late cut ANOVA results Native species (n = 11) 8.10 (5.72) a 15.83 (3.56) b 8.73 (1.35) b 4.77 (2.28) a 2.90 (0.96) a H 4,145 = 69.837** Exotic species (n = 2) 3.33 (3.33) a
8.28 (3.86) a 18.44 (3.56) a 5.85 (2.92) a 3.97 (0.28) a Arcsine F 4,145 = 4.005
Subshrubs (n = 2) 0.00 (0.00) a 6.67 (6.67) ab 18.52 (6.89) b 4.65 (2.39) ab 0.48 (0.48) ab Arcsine, Pooled F 4,145 = 4.687**
Triumfetta rhomboidea 0.00 (0.00) a 3.51 (3.33) a 18.61 (6.89) a 5.04 (2.47) a 0.48 (0.48) a H 4,145 = 12.713 Upright perennial forbs (n = 3)
0.00 (0.00) a 3.54 (3.33) a 3.39 (3.33) a 3.33 (3.33) a 1.67 (1.67) a H 4,145 = 2.391
Twining perennial forbs (n = 5)
2.50 (1.84) a 9.35 (2.00) ab 11.63 (2.06) b 1.31 (1.12) a 1.07 (0.52) a Pooled F 4,145 = 9.335**
Galactia tenuiflora 2.36 (2.36) ab 19.23 (5.99) b 14.57 (5.72) ab 3.85 (2.67) ab 0.00 (0.00) a H 4,145 = 20.572** Passiflora foetida 3.33 (3.33) a 7.44 (3.83) a 15.51 (3.56) b 0.26 (0.26) a 0.42 (0.42) a H 4,145 = 48.293** Grasses (n = 3) 0.56 (0.56) a 7.28 (1.86) a 5.45 (1.18) a 1.44 (0.78) a 3.64 (2.36) a Arcsine
F 4,145 = 4.590 Heteropogon contortus 0.00 (0.00) a 3.33 (3.33) a 7.44 (3.92) a 0.09 (0.09) a 6.67 (4.63) a F 4,145 = 1.710 H. triticeus 0.56 (0.56) a 7.50 (2.03) a 3.40 (0.96) a 1.35 (0.78) a 1.43 (0.93) a Block
F 4,145 = 1.520
219
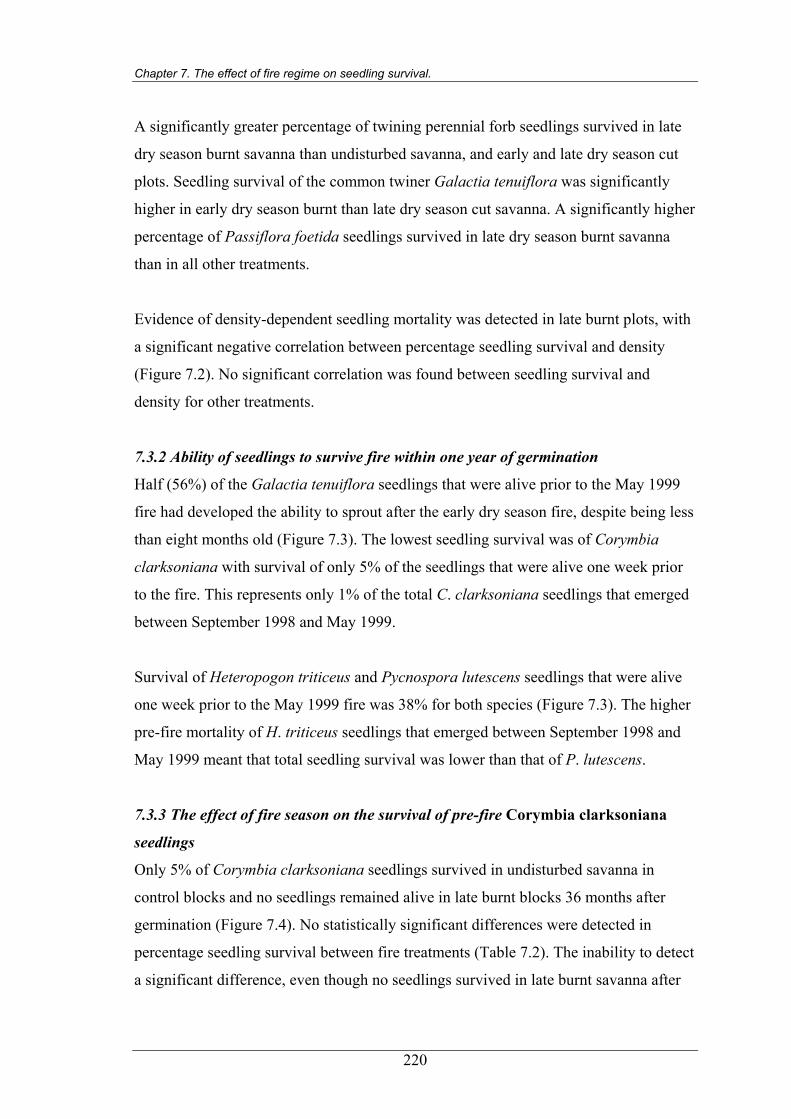
Chapter 7. The effect of fire regime on seedling survival.
A significantly greater percentage of twining perennial forb seedlings survived in late
dry season burnt savanna than undisturbed savanna, and early and late dry season cut
plots. Seedling survival of the common twiner Galactia tenuiflora was significantly
higher in early dry season burnt than late dry season cut savanna. A significantly higher
percentage of Passiflora foetida seedlings survived in late dry season burnt savanna
than in all other treatments.
Evidence of density-dependent seedling mortality was detected in late burnt plots, with
a significant negative correlation between percentage seedling survival and density
(Figure 7.2). No significant correlation was found between seedling survival and
density for other treatments.
7.3.2 Ability of seedlings to survive fire within one year of germination
Half (56%) of the Galactia tenuiflora seedlings that were alive prior to the May 1999
fire had developed the ability to sprout after the early dry season fire, despite being less
than eight months old (Figure 7.3). The lowest seedling survival was of Corymbia
clarksoniana with survival of only 5% of the seedlings that were alive one week prior
to the fire. This represents only 1% of the total C. clarksoniana seedlings that emerged
between September 1998 and May 1999.
Survival of Heteropogon triticeus and Pycnospora lutescens seedlings that were alive
one week prior to the May 1999 fire was 38% for both species (Figure 7.3). The higher
pre-fire mortality of H. triticeus seedlings that emerged between September 1998 and
May 1999 meant that total seedling survival was lower than that of P. lutescens.
7.3.3 The effect of fire season on the survival of pre-fire Corymbia clarksoniana
seedlings
Only 5% of Corymbia clarksoniana seedlings survived in undisturbed savanna in
control blocks and no seedlings remained alive in late burnt blocks 36 months after
germination (Figure 7.4). No statistically significant differences were detected in
percentage seedling survival between fire treatments (Table 7.2). The inability to detect
a significant difference, even though no seedlings survived in late burnt savanna after
220
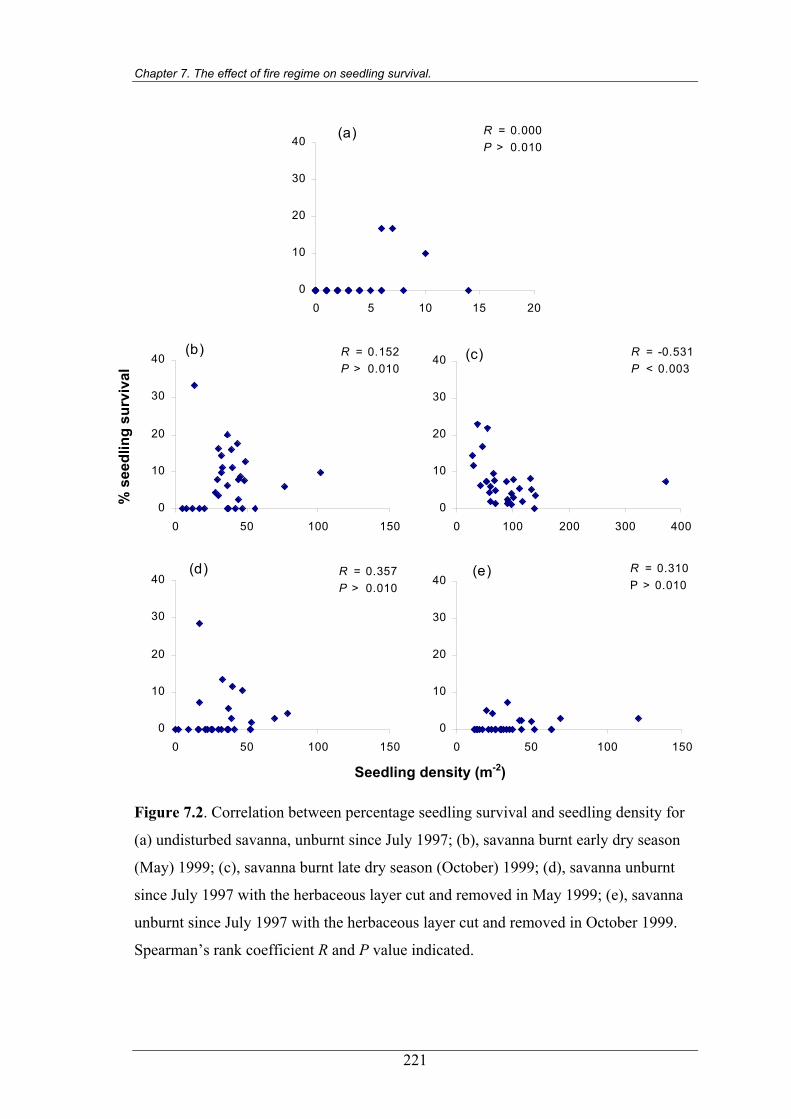
Chapter 7. The effect of fire regime on seedling survival.
0
10
20
30
40
0 5 10 15 20
R = 0.000 P > 0.010
(a)
0
10
20
30
40
0 50 100 150
R = 0.152 P > 0.010
(b)
0
10
20
30
40
0 100 200 300 400
R = -0.531 P < 0.003
(c)
0
10
20
30
40
0 50 100 150
R = 0.357P > 0.010
(d)
0
10
20
30
40
0 50 100 150
R = 0.310 P > 0.010
(e)
% s
eedl
ing
surv
ival
Seedling density (m-2)
Figure 7.2. Correlation between percentage seedling survival and seedling density for
(a) undisturbed savanna, unburnt since July 1997; (b), savanna burnt early dry season
(May) 1999; (c), savanna burnt late dry season (October) 1999; (d), savanna unburnt
since July 1997 with the herbaceous layer cut and removed in May 1999; (e), savanna
unburnt since July 1997 with the herbaceous layer cut and removed in October 1999.
Spearman’s rank coefficient R and P value indicated.
221
Chapter 7. The effect of fire regime on seedling survival.
0
20
40
60
80
Corymbiaclarksoniana
Galactiatenuiflora
Heteropogontriticeus
Pycnosporalutescens
Species
% s
eedl
ing
surv
ival
Figure 7.3. Mean (± 1 standard error) percentage survival of seedlings, less than eight
months old, following an early dry season fire (May 1999) in eucalypt savanna at Cape
Cleveland. Percentage survival calculated from the number of seedlings alive one week
prior to fire (■); percentage survival calculated from the total number of seedlings that
emerged between the September 1998 and May 1999 fires (■).
36 months, was probably a result of the variation in survival in unburnt savanna, where
one of the three replicate blocks possessed no seedling survival after 36 months.
However, a significant age effect was detected in the repeated measures ANOVA for
seven and 19 months since germination, indicating a significant decline in seedling
survival with time since establishment of cohort (Table 7.2). Eight percent of C.
clarksoniana seedlings that were alive in early burnt blocks prior to the May 1999 fires
sprouted following those burns, which is a similar percentage to that recorded for
seedlings tagged along the fire break block (Figure 7.3).
Growth of C. clarksoniana seedlings levelled off after 19 months, with no additional
height recorded by 36 months. The mean height of C. clarksoniana seedlings after 36
months was not significantly different between control and early burnt blocks (t 9 =
0.995; P > 0.05).
222
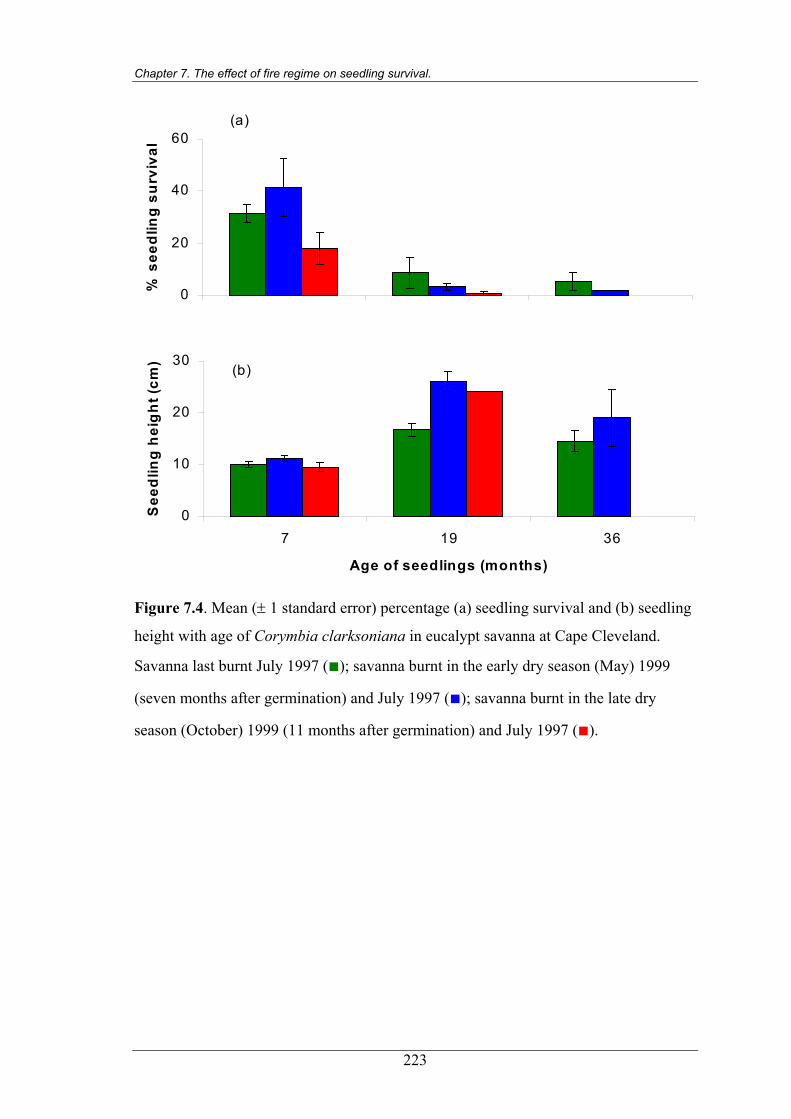
Chapter 7. The effect of fire regime on seedling survival.
0
20
40
60
7 19 36
% s
eed
ling
su
rviv
al
(a)
0
10
20
30
7 19 36
Age of seedlings (months)
See
dlin
g h
eig
ht (
cm) (b)
Figure 7.4. Mean (± 1 standard error) percentage (a) seedling survival and (b) seedling
height with age of Corymbia clarksoniana in eucalypt savanna at Cape Cleveland.
Savanna last burnt July 1997 (■); savanna burnt in the early dry season (May) 1999
(seven months after germination) and July 1997 (■); savanna burnt in the late dry
season (October) 1999 (11 months after germination) and July 1997 (■).
223
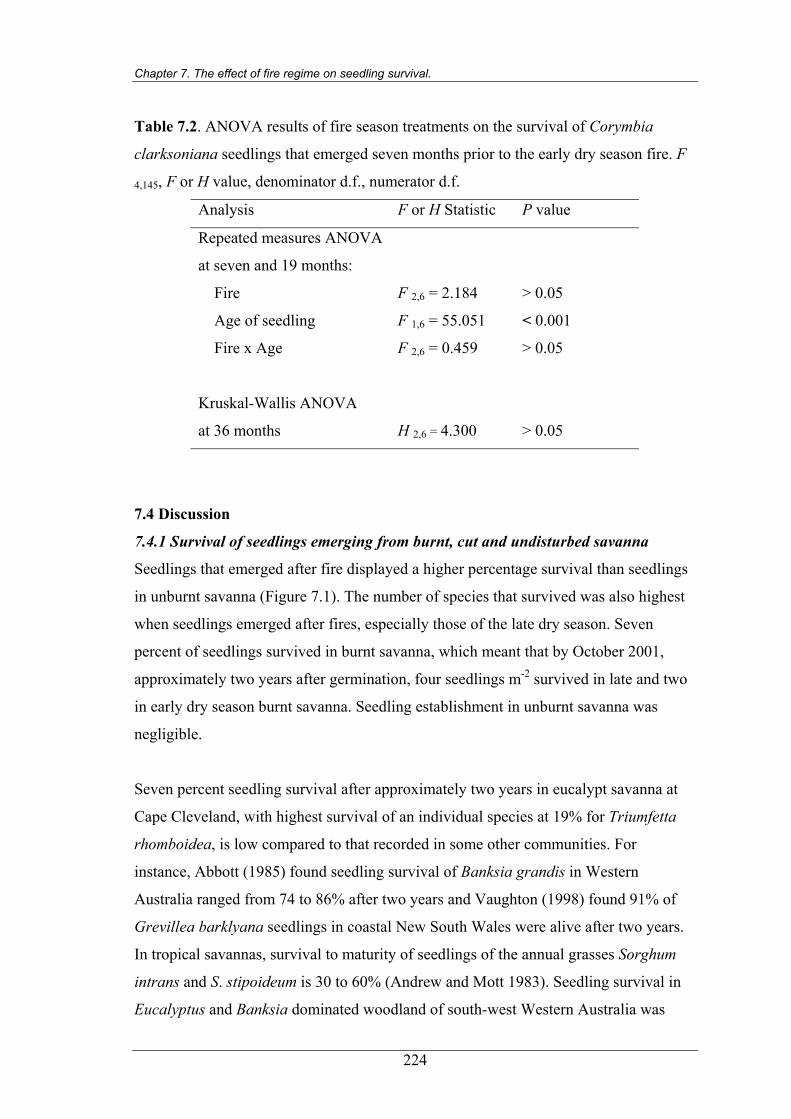
Chapter 7. The effect of fire regime on seedling survival.
Table 7.2. ANOVA results of fire season treatments on the survival of Corymbia
clarksoniana seedlings that emerged seven months prior to the early dry season fire. F
4,145, F or H value, denominator d.f., numerator d.f.
Analysis F or H Statistic P value
Repeated measures ANOVA
at seven and 19 months:
Fire F 2,6 = 2.184 > 0.05
Age of seedling F 1,6 = 55.051 < 0.001
Fire x Age F 2,6 = 0.459
> 0.05
Kruskal-Wallis ANOVA
at 36 months
H 2,6 = 4.300
> 0.05
7.4 Discussion
7.4.1 Survival of seedlings emerging from burnt, cut and undisturbed savanna
Seedlings that emerged after fire displayed a higher percentage survival than seedlings
in unburnt savanna (Figure 7.1). The number of species that survived was also highest
when seedlings emerged after fires, especially those of the late dry season. Seven
percent of seedlings survived in burnt savanna, which meant that by October 2001,
approximately two years after germination, four seedlings m-2 survived in late and two
in early dry season burnt savanna. Seedling establishment in unburnt savanna was
negligible.
Seven percent seedling survival after approximately two years in eucalypt savanna at
Cape Cleveland, with highest survival of an individual species at 19% for Triumfetta
rhomboidea, is low compared to that recorded in some other communities. For
instance, Abbott (1985) found seedling survival of Banksia grandis in Western
Australia ranged from 74 to 86% after two years and Vaughton (1998) found 91% of
Grevillea barklyana seedlings in coastal New South Wales were alive after two years.
In tropical savannas, survival to maturity of seedlings of the annual grasses Sorghum
intrans and S. stipoideum is 30 to 60% (Andrew and Mott 1983). Seedling survival in
Eucalyptus and Banksia dominated woodland of south-west Western Australia was
224
Chapter 7. The effect of fire regime on seedling survival.
15% in woodland, 2.5 years following fire (Whelan and Main 1979). Purdie and Slatyer
(1976) documented between three and 88%, and Clarke (in press) recorded between 0
and 25%, seedling survival after one year in temperate eucalypt woodlands in south-
eastern Australia.
Enhanced seedling survival after fire has been reported in shrubby and open eucalypt
woodlands and forests of south-eastern Australia (Purdie 1977; Bradstock 1991;
Ashton and Chinner 1999) and south-west Western Australia (Whelan and Main 1979;
Pate et al. 1985). The greater survival after fire may be a result of higher nutrient and
light availability, lower competition for resources and reduced herbivory (Whelan and
Main 1979; Noble 1980; Stoneman et al. 1994; Ashton and Chinner 1999). The similar
levels of seedling survival documented in undisturbed and cut savanna (Figure 7.1),
indicates competition for light soon after seedling emergence is probably not the
primary factor limiting seedling survival in the tropical savanna at Cape Cleveland, and
seedling herbivory, disease and competition for nutrients and moisture require
assessment. The mechanisms causing seedling mortality may differ between burnt and
unburnt areas. For instance, Tozer and Bradstock (1997) found herbivory was the
primary cause of seedling mortality in the absence of fire, and desiccation in burnt
sites.
Late dry season fires enhanced seedling survival over all other treatments for twining
perennial forbs and the common twiner, Passiflora foetida, while subshrubs displayed
significantly greater percentage survival in late burnt over undisturbed savanna, and
Galactia tenuiflora in early burnt over late cut savanna (Table 7.1). Seasonal
differences in seedling survival may result from variation in the post-fire climate (Baird
1977; Whelan 1995). All seedling emergence following late dry season fires occurred
during the wet season (Chapter 6), and therefore those seedlings received substantially
greater rain following emergence than the seedlings that emerged during the dry season
following early fires. Variation in seedling survival following different fire season may
also result from different micro-site environments. While late dry season fires produced
complete combustion of the herbaceous layer, some unconsumed grass stalks remained
after early dry season fires (Chapter 3), and this variation in herbaceous cover may
have influenced seedling survival, including the greater survival of G. tenuiflora in
225
Chapter 7. The effect of fire regime on seedling survival.
early burnt savanna. Leaf litter remaining unconsumed after fire can enhance seedling
survival of Banksia spp. of Western Australia (Enright and Lamont 1989) and
Eucalyptus obliqua in forests of south-eastern Australia (Facelli et al. 1999).
Evidence of density-dependent seedling mortality was found in late dry season burnt
savanna, which contained the highest density of seedling emergence (Figure 7.2). This
data suggests competition, herbivory and/or disease, may have a proportionately greater
influence on seedling mortality at the higher seedling densities that are only recorded
after late dry season fires. However, experimental manipulation of seedling density is
required to gain a better understanding of density-dependent processes operating in this
savanna.
Many seedlings, across all treatments, were observed to be in an advanced state of
wilting prior to death. This suggests competition for soil moisture was the primary
mechanism of seedling mortality, as identified in other communities (e.g. Baird 1977;
Lamont et al. 1993). However, disease and invertebrate damage to roots and stems may
also have caused wilting and therefore the cause of seedling mortality remains
unconfirmed.
7.4.2 Ability of seedlings to survive fire within one year of germination
Some seedlings of all four species examined along the fire break block survived the
early dry season fire in May 1999, although survival varied between 5% for Corymbia
clarksoniana and 56% for Galactia tenuiflora (Figure 7.3). While the extrapolation of
these data is limited because it documents only a single burnt area, the results indicate
seedlings of these common sprouting species are capable of surviving fire within a year
of germination. The ability of seedlings to rapidly develop a tolerance of fire is critical
for population persistence in frequently burnt communities (Keith 1996). The higher
survival in herbaceous species may reflect the differences between the dominating tree
C. clarksoniana and the herbs in plant longevity, with greater seedling survival, and
hence recruitment success, of shorter-lived herbaceous species that require more
regular replacement of individuals to maintain populations.
226
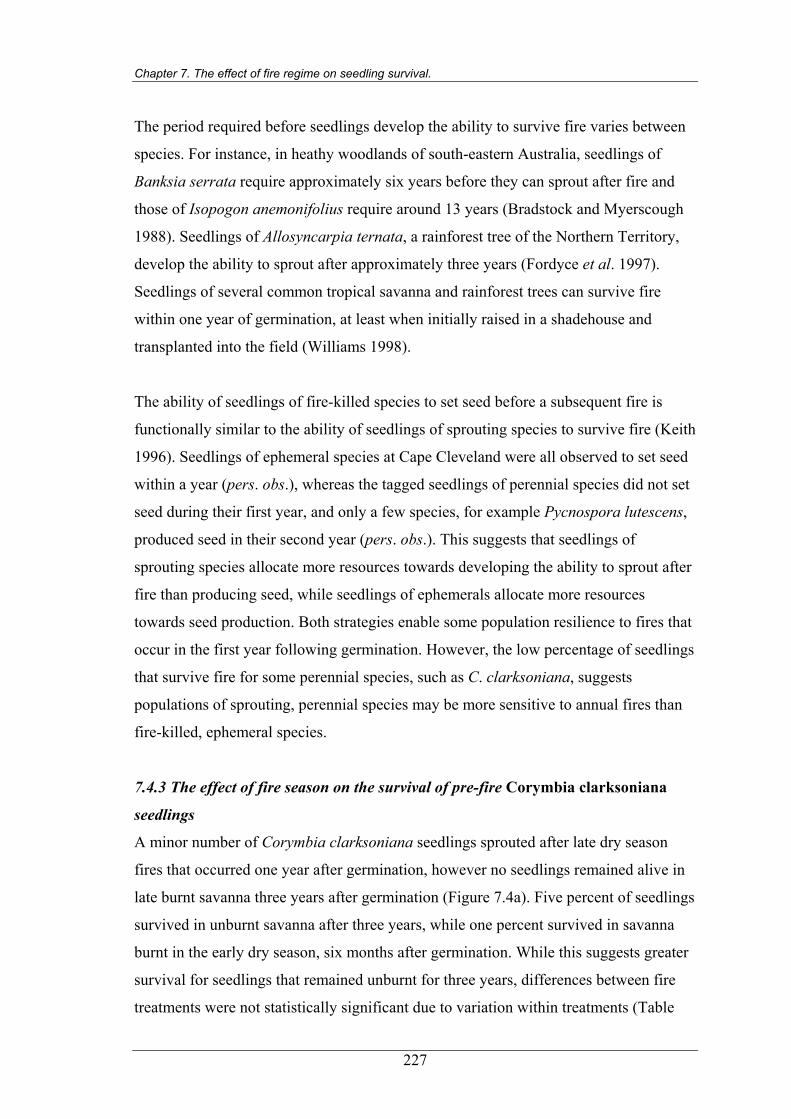
Chapter 7. The effect of fire regime on seedling survival.
The period required before seedlings develop the ability to survive fire varies between
species. For instance, in heathy woodlands of south-eastern Australia, seedlings of
Banksia serrata require approximately six years before they can sprout after fire and
those of Isopogon anemonifolius require around 13 years (Bradstock and Myerscough
1988). Seedlings of Allosyncarpia ternata, a rainforest tree of the Northern Territory,
develop the ability to sprout after approximately three years (Fordyce et al. 1997).
Seedlings of several common tropical savanna and rainforest trees can survive fire
within one year of germination, at least when initially raised in a shadehouse and
transplanted into the field (Williams 1998).
The ability of seedlings of fire-killed species to set seed before a subsequent fire is
functionally similar to the ability of seedlings of sprouting species to survive fire (Keith
1996). Seedlings of ephemeral species at Cape Cleveland were all observed to set seed
within a year (pers. obs.), whereas the tagged seedlings of perennial species did not set
seed during their first year, and only a few species, for example Pycnospora lutescens,
produced seed in their second year (pers. obs.). This suggests that seedlings of
sprouting species allocate more resources towards developing the ability to sprout after
fire than producing seed, while seedlings of ephemerals allocate more resources
towards seed production. Both strategies enable some population resilience to fires that
occur in the first year following germination. However, the low percentage of seedlings
that survive fire for some perennial species, such as C. clarksoniana, suggests
populations of sprouting, perennial species may be more sensitive to annual fires than
fire-killed, ephemeral species.
7.4.3 The effect of fire season on the survival of pre-fire Corymbia clarksoniana
seedlings
A minor number of Corymbia clarksoniana seedlings sprouted after late dry season
fires that occurred one year after germination, however no seedlings remained alive in
late burnt savanna three years after germination (Figure 7.4a). Five percent of seedlings
survived in unburnt savanna after three years, while one percent survived in savanna
burnt in the early dry season, six months after germination. While this suggests greater
survival for seedlings that remained unburnt for three years, differences between fire
treatments were not statistically significant due to variation within treatments (Table
227
Chapter 7. The effect of fire regime on seedling survival.
7.2). The variation in seedling survival within unburnt savanna suggests differences
with micro-site and further experimentation is required to examine the effect of fire on
seedling survival of C. clarksoniana. While the results of this study are not conclusive,
they provide some evidence that fire may enhance the number of safe sites, thus
increasing seedling density (Chapter 6), and that fire in the year following germination
reduces seedling survival.
The fire-sensitivity of C. clarksoniana corresponds with results of a study of
Eucalyptus miniata seedlings in tropical savanna of the Northern Territory by
Setterfield (1997b). She found seedling survival of E. miniata was significantly greater
in unburnt savanna, with 11% of seedlings alive after 1.5 years. No E. miniata
seedlings survived a late dry season fire within a year of germination. Three percent of
E. miniata seedlings initially sprouted after early dry season fires, but all subsequently
died the following month (Setterfield 1997b).
Low levels of seedling survival may be common among eucalypts. Fensham (1992)
found very low (< 5%) seedling survival of E. miniata and E. tetradonata seedlings in
unburnt tropical savanna. Seedling survival of eucalypts in southern Australia is also
typically low (i.e. < 10%) after two or three years (e.g. Withers 1978; Bowman and
Kirkpatrick 1986).
7.5 Conclusion
Seedling survival was higher for those seedlings that emerged in recently burnt rather
than unburnt savanna. The removal of the herbaceous cover in unburnt savanna did not
significantly increase seedling survival, suggesting aspects of fire other than the
removal of shade, such as enhanced nutrients or reduced invertebrate herbivory or
disease, are the primary factors promoting seedling survival. Some species displayed
variation in seedling survival between early and late dry season fires, which may have
resulted from differences in post-fire climate and micro-site environments. Only late
dry season fires promoted sufficient seedlings for density-dependent mortality to be
detected.
228
Chapter 7. The effect of fire regime on seedling survival.
229
Only four seedlings m-2 (of all species pooled) survived in late burnt, two seedlings m-2
survived in early burnt, and negligible numbers of seedlings survived in unburnt
savanna, approximately two years following germination. Further work is required to
determine the survival until maturity of ephemeral species. Data is also needed on the
density of established seedlings, and the frequency of recruitment, required to maintain
stable populations of savanna species. Details of the longevity of species, the primary
juvenile periods and how long it takes for seedlings of each species to develop the
capacity to sprout after fire are also required.
The density of soil seed banks in the eucalypt savanna at Cape Cleveland is low to
moderate and seedling emergence is correspondingly low to moderate compared with
other communities (Chapter 5 and 6). This chapter has demonstrated that seedling
survival is low compared with other species and communities. While 14% of the soil
seed bank emerged as seedlings after late dry season fires (Chapter 5) only 7% of
perennial seedlings were alive two years later. Together these data indicate that seed
supply, seedling emergence and seedling survival are all critical life events that limit
the recruitment of new plants.
Chapter 8 examines the effect of fire on the survival and growth of juveniles and
mature plants in eucalypt savanna at Cape Cleveland. It documents the fire response of
each species and assesses the influence of fire season on plant survival.
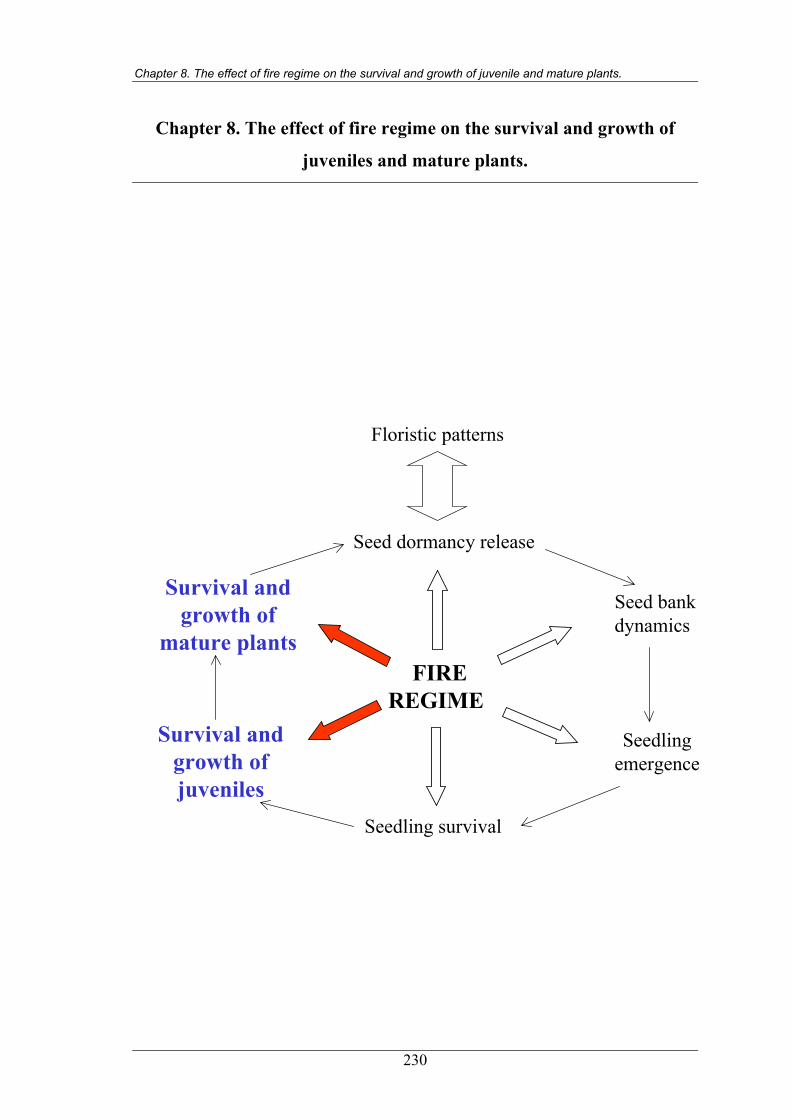
Chapter 8. The effect of fire regime on the survival and growth of juvenile and mature plants.
Chapter 8. The effect of fire regime on the survival and growth of
juveniles and mature plants.
FIREREGIME
Seed dormancy release
Floristic patterns
Seed bankdynamics
Seedlingemergence
Survival andgrowth ofjuveniles
Survival andgrowth of
mature plants
Seedling survival
230
Chapter 8. The effect of fire regime on the survival and growth of juvenile and mature plants.
8.1 Introduction Plant growth in Australian tropical savannas is linked with the seasonal patterns in
rainfall (Mott et al. 1985). Trees typically produce a flush of new leaves during the
transition between the end of the dry season and start of the wet season (Williams et al.
1997). The growth of tree girths occurs primarily during the wet season (Mucha 1979),
as does the growth of grasses and forbs (Andrew and Mott 1983; Mott et al. 1985).
Plant growth is limited by climate, competition for resources, disease, herbivory and
disturbance (Harper 1977). Soils of many Australian tropical savannas are low in
nutrients (Morgan et al. 2000; Jackson and Ash 2001). Competition for soil nutrients
limits the growth of the annual grasses Sorghum intrans and S. stipoideum that
dominate some savannas of northern Australia (Cook and Andrew 1991). Competition
for soil moisture during the annual dry season may also limit plant growth in tropical
savannas (Bowman 1988).
Herbaceous and woody species differ in life span. Through an assessment of seasonal
growth rings, Mucha (1979) suggested eucalypts of the Darwin region in the Northern
Territory occasionally reach 100 years in age. Fensham and Bowman (1992) pointed
out that this calculation did not include the years spent as stunted saplings, less than 2
m in height, which are described hereafter as “juveniles,” that may remain stunted for
decades. Perennial grasses of tropical savannas may live for approximately eight years,
or more, under low stock grazing pressure (Mott 1978; Mott et al. 1985). Species that
complete their life cycle in one or two years (ephemeral herbs) are also common in
Australian tropical savannas (Crowley and Garnett 1999; Russell-Smith et al. in press;
Chapter 3).
Fire is a frequent disturbance in tropical savannas (Walker 1985; Higgins et al. 2000).
The majority of woody species of tropical savannas are capable of sprouting after full
canopy scorch (Walker 1985; Williams et al. 1999b; Midgley and Bond 2001; Russell-
Smith et al. in press). Many perennial herbs of tropical savannas are also capable of
sprouting after fire (Shaw 1957; Mott and Andrew 1985). Sprouting can originate from
buds located below the soil at the base of the stem and along roots and rhizomes, and
for woody species, also epicormically from buds on branches and trunks (Gill 1981).
231

Chapter 8. The effect of fire regime on the survival and growth of juvenile and mature plants.
Re-growth from roots and rhizomes can provide stem multiplication and is common to
a range of herbs and woody species (e.g. Lacey 1974; Russell-Smith et al. in press).
The ability to sprout after fire can vary with life stage, or plant size, and the type of fire.
In tropical savannas, medium sized trees (20 to 30 cm diameter at breast height) show
greater survival through fires than larger and smaller trees (Williams et al. 1999b). For
many woody species, the ability to epicormically sprout from stems and branches is
only apparent in plants taller than approximately 1.5 to 2 m, with plants below this
height being reduced to sprouting from basal buds below the soil surface (Trollope
1996; Williams et al. 1999b). Frequent fires may therefore keep juvenile trees below 2
m in height, holding them within a “fire-trap” and maintaining an open savanna
structure (Midgley and Bond 2001). Suppression below 2 m in height of juveniles of
non-eucalypt trees has been documented in tropical savannas of northern Australia. Fire
intervals of at least two years are required to allow the growth of stunted juveniles of
some Acacia and broadleaf species, such as Gardenia megasperma (Bowman et al.
1988), and at least three years for the release of Melaleuca viridiflora juveniles from
the fire-trap (Crowley and Garnett 1998). Eucalypt juveniles do not always grow
rapidly beyond 2 m in height in the absence of fire, and a proportion may die-back to
ground level during the dry season (Prior et al. 1997). While stunted juveniles of
Eucalyptus tetrodonta have been documented to grow above the fire-trap in the absence
of fire, E. miniata juveniles can remain stunted with fire exclusion for two decades
(Fensham 1990; Bowman and Panton 1995; Russell-Smith et al. in press). Insect attack
on eucalypt juveniles can be severe, however, Fensham (1994) demonstrated herbivory
by insects is not the primary process that suppresses juveniles. Evidence has been
found that competition for resources with canopy trees is an important process
suppressing the growth of E. miniata juveniles (Fensham and Bowman 1992).
Frequent fires may exhaust a plant’s capacity to sprout, and the intensity and season of
fire may also affect survival (Keith 1996). High intensity, late dry season fires
significantly reduce the survival of trees in tropical savannas of the Northern Territory
(Williams et al. 1999b). Noble (1989) also reported higher survival of mallee eucalypts
after repeated early dry season (i.e. spring) rather than late dry season (i.e. autumn)
fires in New South Wales.
232
Chapter 8. The effect of fire regime on the survival and growth of juvenile and mature plants.
Variation in survival after fires of different intensities and seasons may be due to
differences in the survival of regenerative buds and/or the quantity of stored carbon
reserves (Bond and van Wilgen 1996). Bud survival depends on the location and
protection of buds, heat from the fire and residence time of flames (Whelan 1995).
Carbon reserves fluctuate seasonally and percentage survival is likely to be greatest
when stored reserves are high and while plants are dormant, or when there is sufficient
growing season following fire to allow replacement of reserves (Bond and van Wilgen
1996). The effect of fire season on plant recovery has been demonstrated on perennial
grasses, with poorest recovery after burning grasses during the growing season, while
culms are elongating (Tainton 1981, cited in Bond and van Wilgen 1996).
Vegetative survival through fire provides plant persistence and therefore stability of
populations in frequently burnt communities (Bond and Midgley 2001). The ability to
sprout after fire requires a trade-off in resource allocation, with sprouters allocating
fewer resources to seed production than non-sprouters (Bellingham and Sparrow 2000;
Bell 2001).
Fire may affect plant growth through its impact on soil nutrient dynamics, damage to
buds and depletion of plant reserves (Whelan 1995). The basal area of trees at the
Kapalga research station in the Northern Territory remained stable over five years with
fire exclusion and annual early dry season burning, but declined with annual late dry
season fires, primarily as a result of stem mortality (Williams et al. in press). Overall
basal area of trees at nearby Munmarlary increased over 21 years in annually and
biennially burnt savanna, and particularly in unburnt savanna (Russell-Smith et al. in
press). The greatest increase in basal area of Eucalyptus miniata trees at Munmarlary
occurred in savanna burnt annually in the early dry season, while no change in basal
area was recorded for E. tetrodonta (Russell-Smith et al. in press).
In dry sclerophyll forest of south-eastern Queensland, annual burning in the mid dry
season for 44 years produced no effect on the growth rates of Eucalyptus acmenoides
and E. drepanophylla, but enhanced the growth of E. tereticornis in comparison to
unburnt forest (Guinto et al. 1999). In an associated wet sclerophyll forest, fire
intervals of two to three years, with low fire intensities (< 500 kWm-1) enhanced the
233
Chapter 8. The effect of fire regime on the survival and growth of juvenile and mature plants.
growth of Lophostemon confertus but inhibited growth of Syncarpia glomulifera,
compared to unburnt forest (Guinto et al. 1999).
Chapter 3 documented community resilience to a series of fires in eucalypt savanna at
Cape Cleveland. Population persistence in a frequently burnt savanna can be provided
by vegetative survival and/or seedling recruitment. Chapters 4 to 7 examined seedling
recruitment, which was most abundant for herbaceous rather than woody species, and
occurred primarily after fire. This chapter examines vegetative survival and growth to
complete the assessment of mechanisms that can provide resilience to species
composition in a frequently burnt savanna. The ability of species to survive fire is
documented, and a quantitative assessment of survival during fire is made for juvenile
and mature individuals of common species.
Specific questions addressed are:
1. Which species are capable of sprouting after fire and is fire response consistent
across eucalypt savanna sites of the Townsville region?
2. What is the effect of fire season and time since fire on the survival and growth of
juveniles and mature individuals of common tree species?
3. Does the density of sprouting stems differ after burning and cutting, and with
season of disturbance?
4. Does the percentage survival of common herbs vary with burning and cutting in the
early and late dry seasons?
8.2 Methods
8.2.1 Sampling
8.2.1a Regenerative capacity of savanna species
The ability of plants to sprout after fire was documented following burns at Cape
Cleveland, Mt Elliot, Many Peaks Range and Castle Hill (Figure 2.1). Sprouting stems
originating from below the soil surface were distinguished from seedlings by the
attachment of shoots to a burnt stem, thickened bases or roots. Documentation of plant
regeneration followed Gill and Bradstock’s (1992) classification, and only species that
were fully scorched in fires were included in the assessment.
234
Chapter 8. The effect of fire regime on the survival and growth of juvenile and mature plants.
8.2.1b Survival and growth of trees
To assess the effect of fire on tree survival, the number of trees > 2m in height was
counted in each of the 36, permanently marked 100m2 plots at Cape Cleveland
(Chapter 3) in March to May, in each of 1997 to 2001. The circumference at breast
height of trees was recorded in each annual survey from 1998 to 2001, to assess the
influence of fire on tree basal area.
8.2.1c Survival and growth of Corymbia clarksoniana juveniles
Survival and growth of Corymbia clarksoniana juveniles (defined as individuals < 2m
in height) were compared between unburnt, early (May 1999) and late dry season
(October 1999) burnt savanna. Heights were recorded for all C. clarksoniana juveniles
within the 36, 100m2 plots at Cape Cleveland in March to May 1999, prior to the
implementation of the early dry season fires. The juveniles were tagged and re-
measured at the same time of year in 2000 and 2001.
8.2.1d Stem regeneration after burning and cutting in the early and late dry seasons
An assessment was made of the effect of different disturbances (burning and cutting)
and the season of disturbance (early and late dry seasons), on the number of sprouting
stems of the common subshrub, Breynia oblongifolia. This shrub was assessed because
of its capacity to regenerate from root-suckers, hence its value for assessing the effect
of fire on vegetative regeneration. The permanent 1m2 plots used to document total
seedling emergence (Chapter 6) were used to assess the effects of disturbance type and
season of disturbance on stem survival and growth. The experiment assessed the
impacts of a single set of fires or cutting treatments. These were:
1. Undisturbed; savanna that was last burnt in July 1997 and remained undisturbed.
2. Early burnt; savanna burnt in early dry season fires (May 1999).
3. Late burnt; savanna burnt in late dry season fires (October 1999).
4. Early cut; herbaceous layer cut and removed from unburnt plots at the time of early
dry season fires, in savanna that was last burnt in July 1997.
5. Late cut; herbaceous layer cut and removed from unburnt plots at the time of late
dry season fires, in savanna that was last burnt in July 1997.
235
Chapter 8. The effect of fire regime on the survival and growth of juvenile and mature plants.
Prior to the implementation of burning and cutting treatments in May 1999 and October
1999, the number of B. oblongifolia stems was recorded within the permanent 1m2
plots. The number of surviving stems were recorded in May 2000.
8.2.1e Survival of mature herbs
An assessment was made of the effect of burning and cutting, in the early and late dry
seasons, on the percentage survival of common grasses and forbs. The permanent 1m2
plots established to document total seedling emergence (Chapter 6) were used to assess
the effects of disturbance type and season of disturbance on stem survival and growth.
The five treatments are outlined above in section 8.2.1d. Assessments were made when
the plots were established in May and October 1999, and survival was re-surveyed one
month after the early and late dry season fires.
Density counts of common grasses and forbs were attempted when the 1m2 plots were
established. However, the density of plants could not be calculated accurately due to
the multiple stems of many common forbs, and the clumping nature of grasses. Post-
disturbance assessments indicated that pre-fire counts were inaccurate (i.e. two or three
distinct clumps sprouted where a pre-treatment count documented a single clump). In
the case of Heteropogon triticeus, not only were pre-fire clumps difficult to count, but
post-fire re-growth emerged from several distinct sections of individual clumps,
making distinction and therefore estimating post-fire density inaccurate.
As a result of the inaccuracies of density measurements, the assessment of plant
survival was based on the presence or absence of a species within a 1m2 plot, pre- and
post-treatment. A percentage survival figure was calculated for each of the three
replicate 1 ha blocks, based on the percentage of 1m2 plots in which a species remained
present. This is less sensitive to changes in plant density than counts of individual
plants and, depending on the number of plants per plot, may lead to an over- or
underestimate of percentage survival.
236
Chapter 8. The effect of fire regime on the survival and growth of juvenile and mature plants.
8.2.2 Statistical analyses
8.2.2a Regenerative capacity of savanna species
Records of post-fire regeneration of all species encountered were tabulated.
Observations from the four savanna sites across Townsville were listed separately to
provide confirmation of regenerative capabilities across the region. No quantitative data
were collected and therefore no statistical analyses were performed.
8.2.2b Survival and growth of trees
The influence of fire treatments on the density and basal area of trees (> 2m in height)
was analysed for combined tree species and the four most abundant species, as other
species were present at very low densities. A repeated measures ANOVA was
performed for fire treatment, with three levels (control, early burnt and late burnt) and
year of survey as the repeated measure. The repeated measure factor “year” contained
five levels (1997 to 2001) for the tree density analyses and four levels (1998 to 2001)
for basal area analyses, as circumference measurements were only available from 1998
to 2001. Due to the small number of trees within each of the 100m2 plots, data from the
four 100m2 plots were pooled for each replicate 1 ha per block to reduce variance.
8.2.2c Survival and growth of Corymbia clarksoniana juveniles
The influence of fire regime on the growth and survival of C. clarksoniana juveniles
was assessed using a one-factor ANOVA to test the statistical significance of
differences in survival and heights of juveniles with time since last fire. The differences
in survival and heights of juveniles between fire treatments (control, early and late
burnt) was assessed using a repeated measures ANOVA, with the repeated measure
factor “year” containing three levels (1999 to 2001). Individuals that were < 2 m in
height during the initial 1999 survey that grew > 2 m by 2001 remained in the analyses
to ensure accuracy in assessment of the changes in survival and height.
8.2.2d Stem regeneration after burning and cutting in the early and late dry seasons
The statistical significance of differences in the number of B. oblongifolia stems
between treatments (undisturbed, early and late burnt, early and late cut) was assessed
using a one-factor analysis of co-variance (ANCOVA) of the final survey data
237
Chapter 8. The effect of fire regime on the survival and growth of juvenile and mature plants.
collected in May 2000, using the initial stem density data collected in 1999 as a
covariate.
8.2.2e Survival of mature herbs
A one-factor ANOVA was initially used for determining the statistical significance of
differences in percentage survival following treatments (undisturbed, early and late
burnt, early and late cut) for each of the five most common herbs. However a
Cochran’s test (Underwood 1997) indicated significant variance heterogeneity could
not be resolved with data transformations. Therefore a non-parametric Kruskal-Wallis
ANOVA by ranks was used to test the statistical significance of differences between
treatments for each species.
8.3 Results
8.3.1 Regenerative capacity of savanna species
Post-fire regeneration observations were documented for a total of 160 species
(Appendix 2). Eighty one percent (130 species) were observed to sprout after fires in
Townsville eucalypt savannas and fire response for individual species was consistent
between sites.
While nearly all trees and shrubs were consistently able to sprout after fire (Table 8.1;
Appendix 2), the ability to sprout from epicormic rather than basal buds was restricted
to the eucalypts, Canarium australianum and Planchonia careya. The ability to
epicormically sprout was size-dependent, with epicormic sprouting of eucalypts and
Planchonia careya only observed for plants greater than 1.5 m to 2 m in height. The
tallest Canarium australianum tree, of 8 m in height, was also able to epicormically
sprout after full canopy scorch during both the July 1997 and October 1999 fires, while
all other C. australianum plants sprouted from the stem base.
Obligate seeders were primarily ephemeral forbs that were observed to produce seed
within one year of germination (Table 8.1; Appendix 2). Obligate seeder perennials
were the shrubs Acacia holosericea and A. umbellata, the twining forb Cassytha
filiformis and the subshrubs Triumfetta rhomboidea and Urena lobata. A single Vitex
trifolia shrub present at Cape Cleveland was killed by the 1997 fire and until further
observations are made, it must be assumed to be an obligate seeder. Acacia umbellata,
238
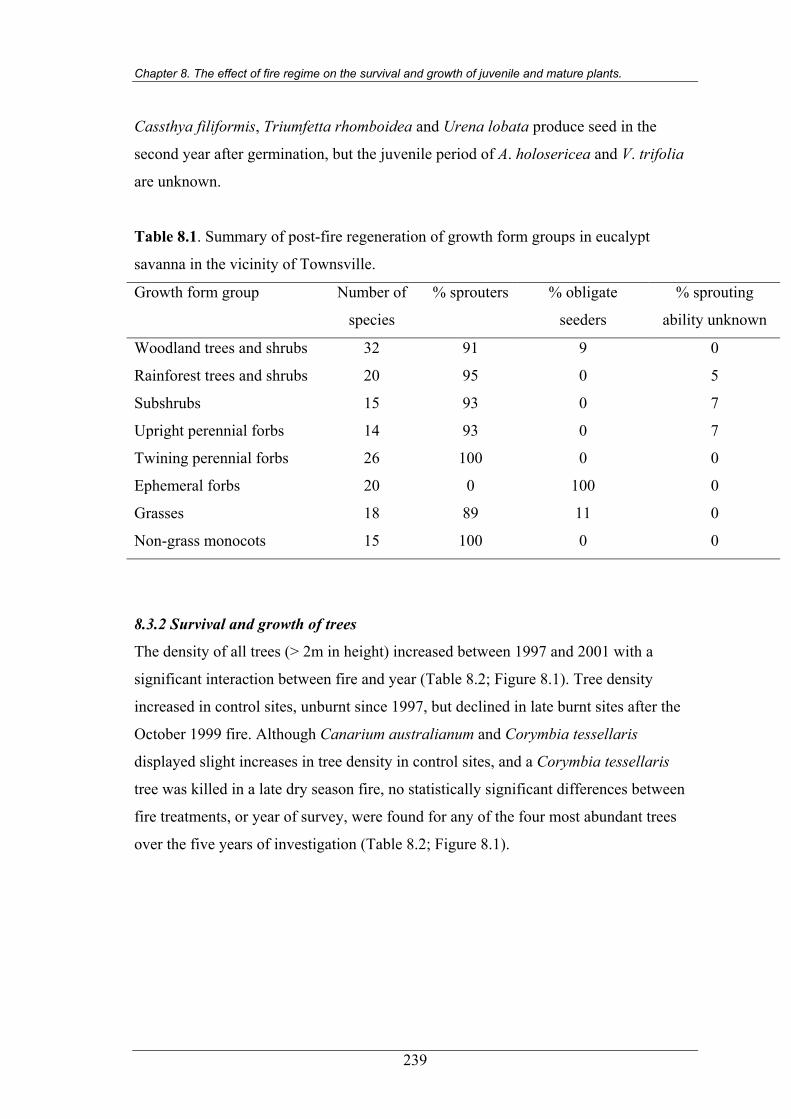
Chapter 8. The effect of fire regime on the survival and growth of juvenile and mature plants.
Cassthya filiformis, Triumfetta rhomboidea and Urena lobata produce seed in the
second year after germination, but the juvenile period of A. holosericea and V. trifolia
are unknown.
Table 8.1. Summary of post-fire regeneration of growth form groups in eucalypt
savanna in the vicinity of Townsville.
Growth form group Number of
species
% sprouters % obligate
seeders
% sprouting
ability unknown
Woodland trees and shrubs 32 91 9 0
Rainforest trees and shrubs 20 95 0 5
Subshrubs 15 93 0 7
Upright perennial forbs 14 93 0 7
Twining perennial forbs 26 100 0 0
Ephemeral forbs 20 0 100 0
Grasses 18 89 11 0
Non-grass monocots 15 100 0 0
8.3.2 Survival and growth of trees
The density of all trees (> 2m in height) increased between 1997 and 2001 with a
significant interaction between fire and year (Table 8.2; Figure 8.1). Tree density
increased in control sites, unburnt since 1997, but declined in late burnt sites after the
October 1999 fire. Although Canarium australianum and Corymbia tessellaris
displayed slight increases in tree density in control sites, and a Corymbia tessellaris
tree was killed in a late dry season fire, no statistically significant differences between
fire treatments, or year of survey, were found for any of the four most abundant trees
over the five years of investigation (Table 8.2; Figure 8.1).
239
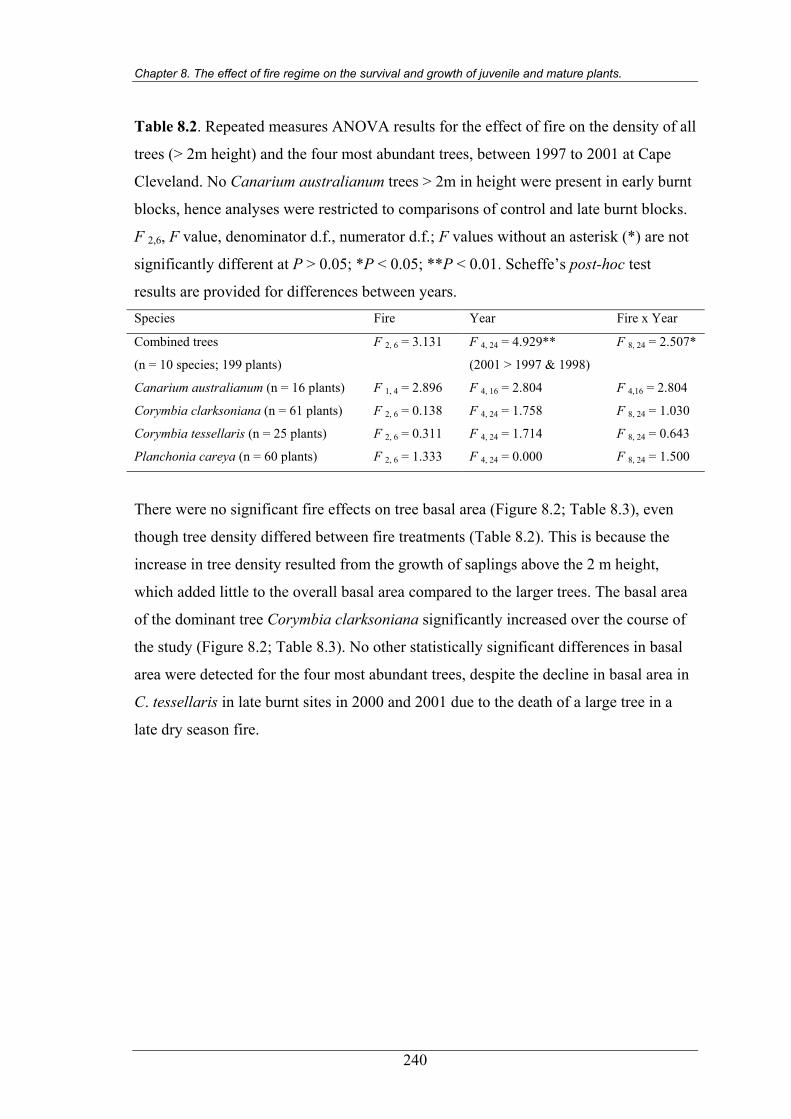
Chapter 8. The effect of fire regime on the survival and growth of juvenile and mature plants.
Table 8.2. Repeated measures ANOVA results for the effect of fire on the density of all
trees (> 2m height) and the four most abundant trees, between 1997 to 2001 at Cape
Cleveland. No Canarium australianum trees > 2m in height were present in early burnt
blocks, hence analyses were restricted to comparisons of control and late burnt blocks.
F 2,6, F value, denominator d.f., numerator d.f.; F values without an asterisk (*) are not
significantly different at P > 0.05; *P < 0.05; **P < 0.01. Scheffe’s post-hoc test
results are provided for differences between years. Species Fire Year Fire x Year
Combined trees
(n = 10 species; 199 plants)
F 2, 6 = 3.131 F 4, 24 = 4.929**
(2001 > 1997 & 1998)
F 8, 24 = 2.507*
Canarium australianum (n = 16 plants) F 1, 4 = 2.896 F 4, 16 = 2.804 F 4,16 = 2.804
Corymbia clarksoniana (n = 61 plants) F 2, 6 = 0.138 F 4, 24 = 1.758 F 8, 24 = 1.030
Corymbia tessellaris (n = 25 plants) F 2, 6 = 0.311 F 4, 24 = 1.714 F 8, 24 = 0.643
Planchonia careya (n = 60 plants) F 2, 6 = 1.333 F 4, 24 = 0.000 F 8, 24 = 1.500
There were no significant fire effects on tree basal area (Figure 8.2; Table 8.3), even
though tree density differed between fire treatments (Table 8.2). This is because the
increase in tree density resulted from the growth of saplings above the 2 m height,
which added little to the overall basal area compared to the larger trees. The basal area
of the dominant tree Corymbia clarksoniana significantly increased over the course of
the study (Figure 8.2; Table 8.3). No other statistically significant differences in basal
area were detected for the four most abundant trees, despite the decline in basal area in
C. tessellaris in late burnt sites in 2000 and 2001 due to the death of a large tree in a
late dry season fire.
240
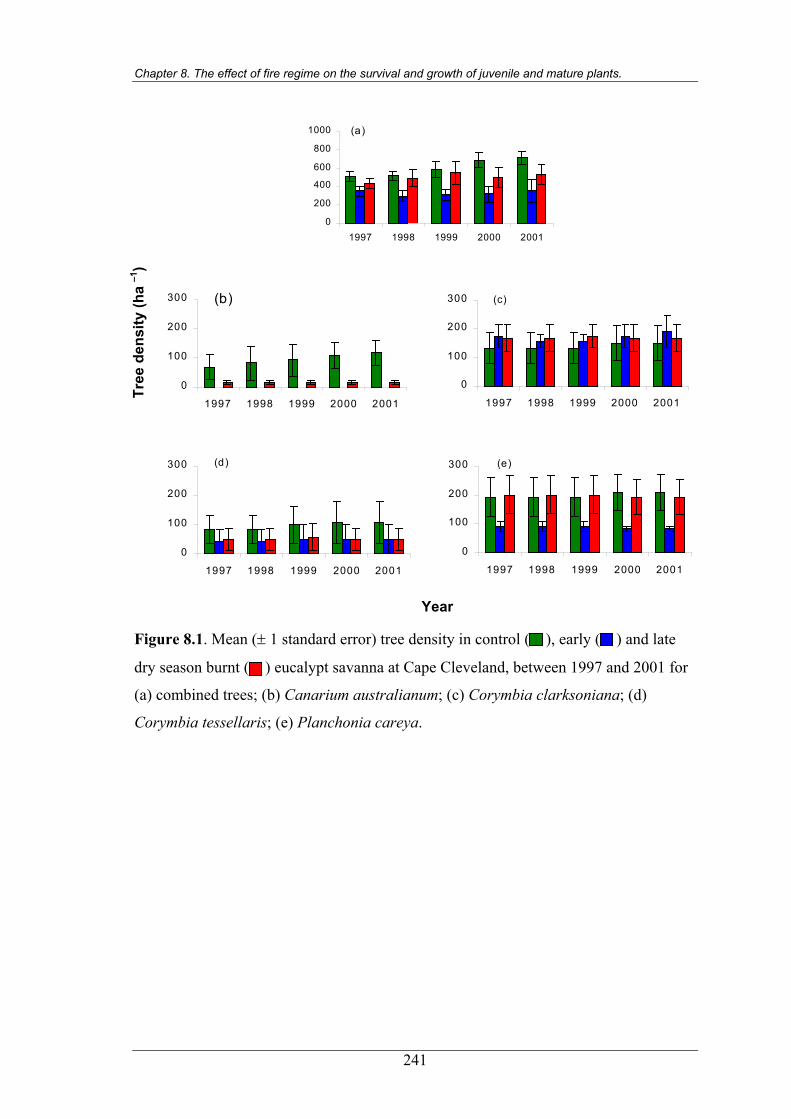
Chapter 8. The effect of fire regime on the survival and growth of juvenile and mature plants.
0
100
200
300
1997 1998 1999 2000 2001
(b)
0
100
200
300
1997 1998 1999 2000 2001
(c)
0
100
200
300
1997 1998 1999 2000 2001
(d)
0
100
200
300
1997 1998 1999 2000 2001
(e)
0
200
400
600
800
1000
1997 1998 1999 2000 2001
(a)
Tree
den
sity
(ha
–1)
Figure 8.1. Mean (± 1 standard error) tree density in control ( ), early ( ) and late
dry season burnt ( ) eucalypt savanna at Cape Cleveland, between 1997 and 2001 for
(a) combined trees; (b) Canarium australianum; (c) Corymbia clarksoniana; (d)
Corymbia tessellaris; (e) Planchonia careya.
Year
241
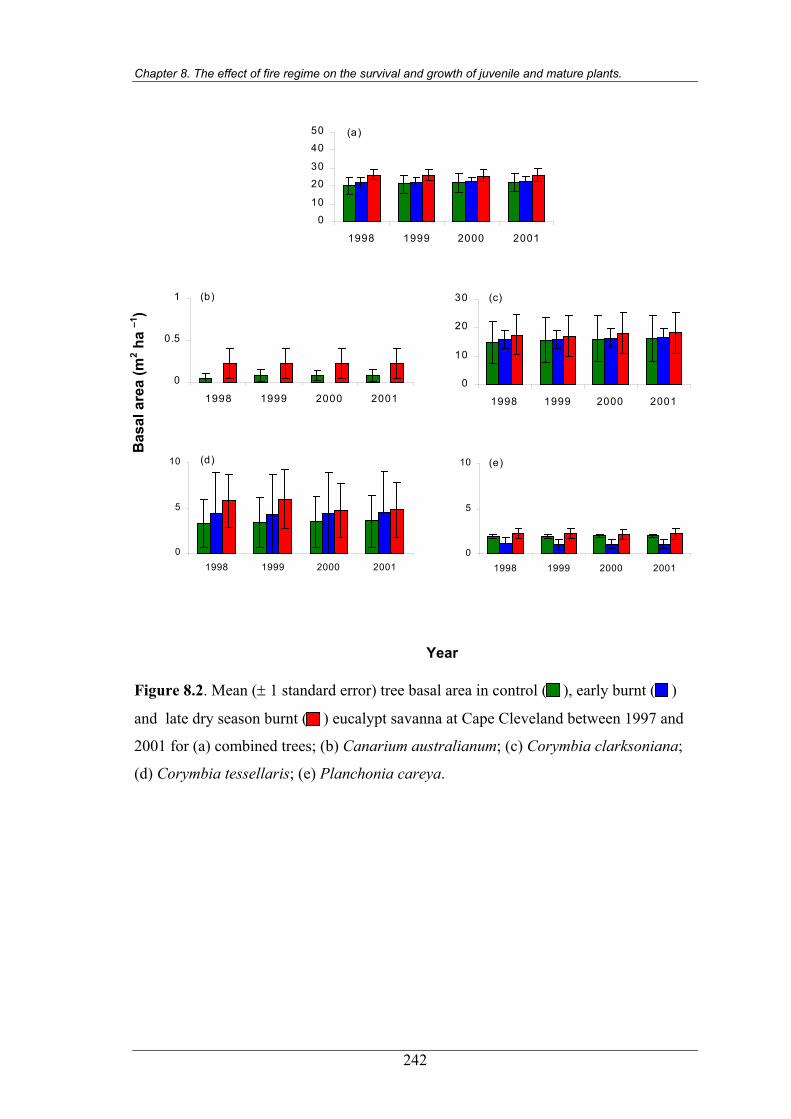
Chapter 8. The effect of fire regime on the survival and growth of juvenile and mature plants.
0
10
20
30
40
50
1998 1999 2000 2001
(a)
0
0.5
1
1998 1999 2000 2001
(b)
0
10
20
30
1998 1999 2000 2001
(c)
0
5
10
1998 1999 2000 2001
(d)
0
5
10
1998 1999 2000 2001
(e)
Bas
al a
rea
(m2 h
a –1
)
Year
Figure 8.2. Mean (± 1 standard error) tree basal area in control ( ), early burnt ( )
and late dry season burnt ( ) eucalypt savanna at Cape Cleveland between 1997 and
2001 for (a) combined trees; (b) Canarium australianum; (c) Corymbia clarksoniana;
(d) Corymbia tessellaris; (e) Planchonia careya.
242
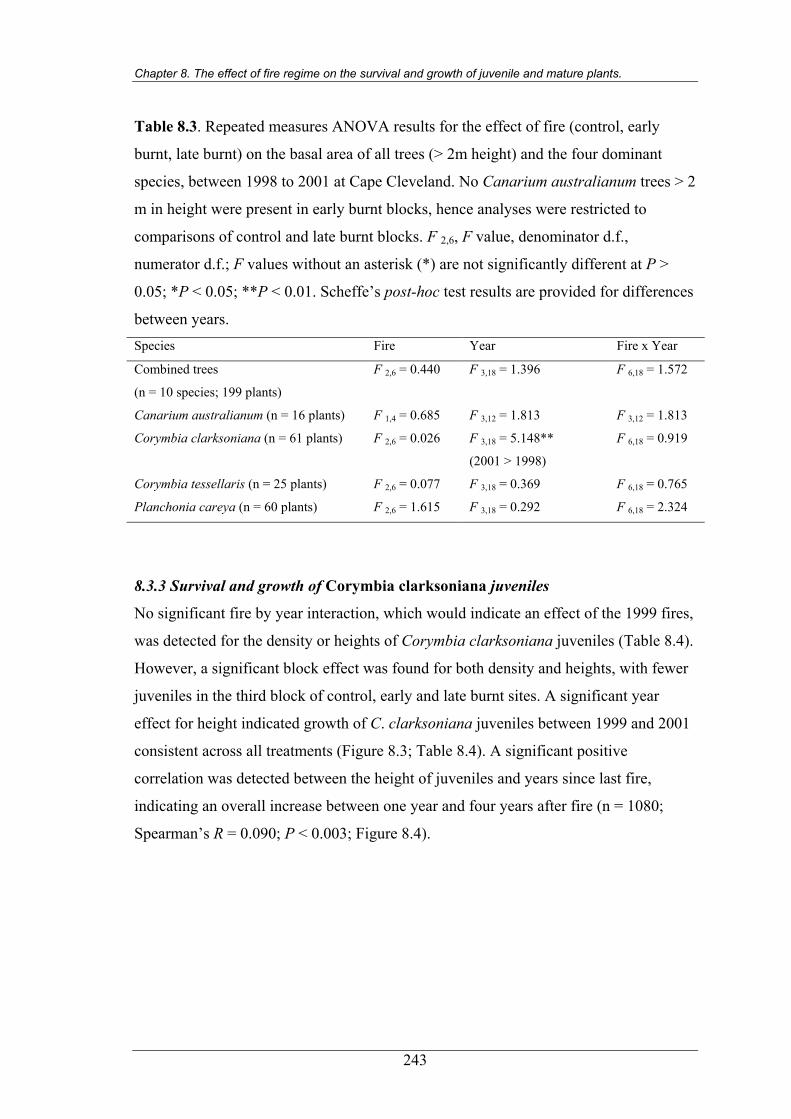
Chapter 8. The effect of fire regime on the survival and growth of juvenile and mature plants.
Table 8.3. Repeated measures ANOVA results for the effect of fire (control, early
burnt, late burnt) on the basal area of all trees (> 2m height) and the four dominant
species, between 1998 to 2001 at Cape Cleveland. No Canarium australianum trees > 2
m in height were present in early burnt blocks, hence analyses were restricted to
comparisons of control and late burnt blocks. F 2,6, F value, denominator d.f.,
numerator d.f.; F values without an asterisk (*) are not significantly different at P >
0.05; *P < 0.05; **P < 0.01. Scheffe’s post-hoc test results are provided for differences
between years. Species Fire Year Fire x Year
Combined trees
(n = 10 species; 199 plants)
F 2,6 = 0.440 F 3,18 = 1.396 F 6,18 = 1.572
Canarium australianum (n = 16 plants) F 1,4 = 0.685 F 3,12 = 1.813 F 3,12 = 1.813
Corymbia clarksoniana (n = 61 plants) F 2,6 = 0.026 F 3,18 = 5.148**
(2001 > 1998)
F 6,18 = 0.919
Corymbia tessellaris (n = 25 plants) F 2,6 = 0.077 F 3,18 = 0.369 F 6,18 = 0.765
Planchonia careya (n = 60 plants) F 2,6 = 1.615 F 3,18 = 0.292 F 6,18 = 2.324
8.3.3 Survival and growth of Corymbia clarksoniana juveniles
No significant fire by year interaction, which would indicate an effect of the 1999 fires,
was detected for the density or heights of Corymbia clarksoniana juveniles (Table 8.4).
However, a significant block effect was found for both density and heights, with fewer
juveniles in the third block of control, early and late burnt sites. A significant year
effect for height indicated growth of C. clarksoniana juveniles between 1999 and 2001
consistent across all treatments (Figure 8.3; Table 8.4). A significant positive
correlation was detected between the height of juveniles and years since last fire,
indicating an overall increase between one year and four years after fire (n = 1080;
Spearman’s R = 0.090; P < 0.003; Figure 8.4).
243
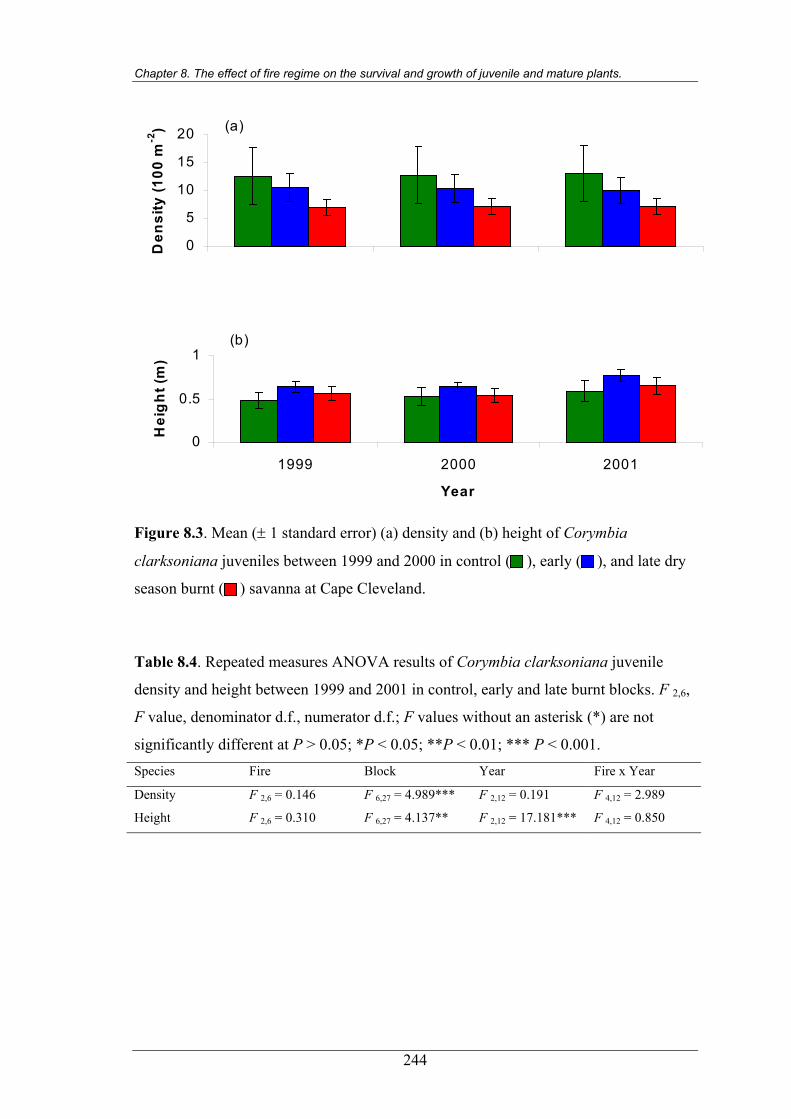
Chapter 8. The effect of fire regime on the survival and growth of juvenile and mature plants.
0
0.5
1
1999 2000 2001
Year
Hei
gh
t (m
)
(b)
0
5
10
15
20
1999 2000 2001
Den
sity
(100
m-2
) (a)
Figure 8.3. Mean (± 1 standard error) (a) density and (b) height of Corymbia
clarksoniana juveniles between 1999 and 2000 in control ( ), early ( ), and late dry
season burnt ( ) savanna at Cape Cleveland. Table 8.4. Repeated measures ANOVA results of Corymbia clarksoniana juvenile
density and height between 1999 and 2001 in control, early and late burnt blocks. F 2,6,
F value, denominator d.f., numerator d.f.; F values without an asterisk (*) are not
significantly different at P > 0.05; *P < 0.05; **P < 0.01; *** P < 0.001. Species Fire Block Year Fire x Year
Density F 2,6 = 0.146 F 6,27 = 4.989*** F 2,12 = 0.191 F 4,12 = 2.989
Height F 2,6 = 0.310 F 6,27 = 4.137** F 2,12 = 17.181*** F 4,12 = 0.850
244
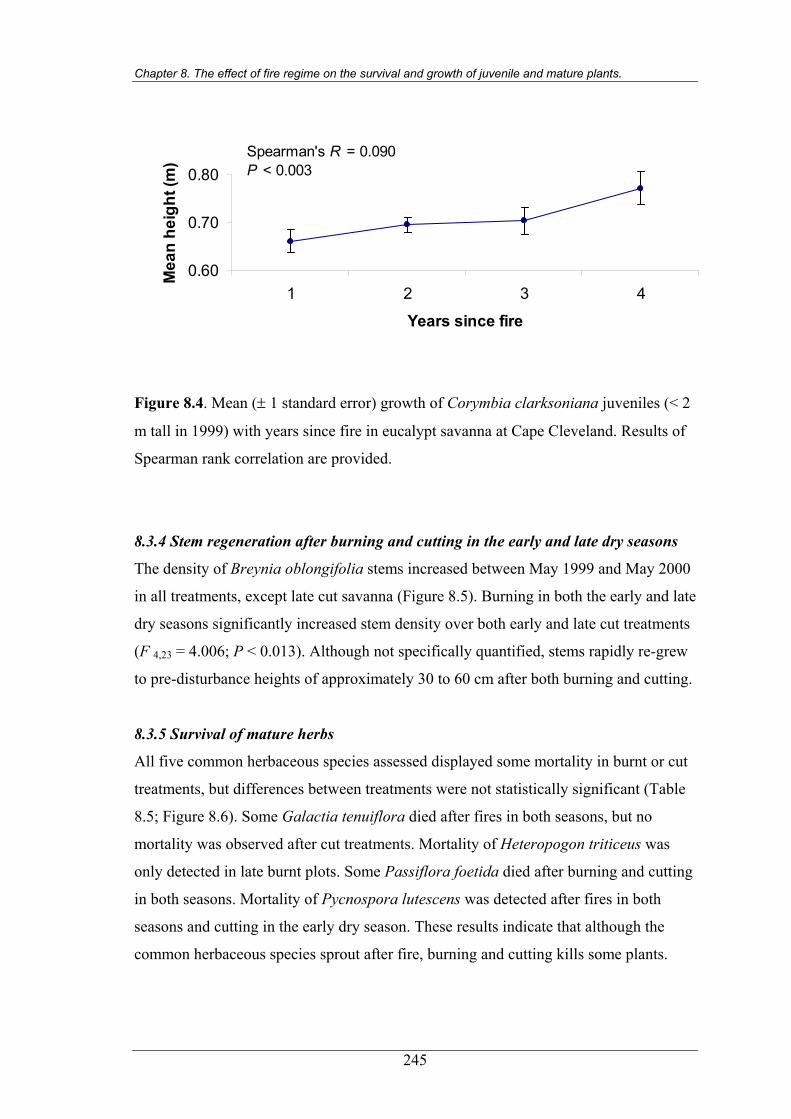
Chapter 8. The effect of fire regime on the survival and growth of juvenile and mature plants.
0.60
0.70
0.80
1 2 3 4
Years since fire
Mea
n he
ight
(m)
Spearman's R = 0.090P < 0.003
Figure 8.4. Mean (± 1 standard error) growth of Corymbia clarksoniana juveniles (< 2
m tall in 1999) with years since fire in eucalypt savanna at Cape Cleveland. Results of
Spearman rank correlation are provided.
8.3.4 Stem regeneration after burning and cutting in the early and late dry seasons
The density of Breynia oblongifolia stems increased between May 1999 and May 2000
in all treatments, except late cut savanna (Figure 8.5). Burning in both the early and late
dry seasons significantly increased stem density over both early and late cut treatments
(F 4,23 = 4.006; P < 0.013). Although not specifically quantified, stems rapidly re-grew
to pre-disturbance heights of approximately 30 to 60 cm after both burning and cutting.
8.3.5 Survival of mature herbs
All five common herbaceous species assessed displayed some mortality in burnt or cut
treatments, but differences between treatments were not statistically significant (Table
8.5; Figure 8.6). Some Galactia tenuiflora died after fires in both seasons, but no
mortality was observed after cut treatments. Mortality of Heteropogon triticeus was
only detected in late burnt plots. Some Passiflora foetida died after burning and cutting
in both seasons. Mortality of Pycnospora lutescens was detected after fires in both
seasons and cutting in the early dry season. These results indicate that although the
common herbaceous species sprout after fire, burning and cutting kills some plants.
245
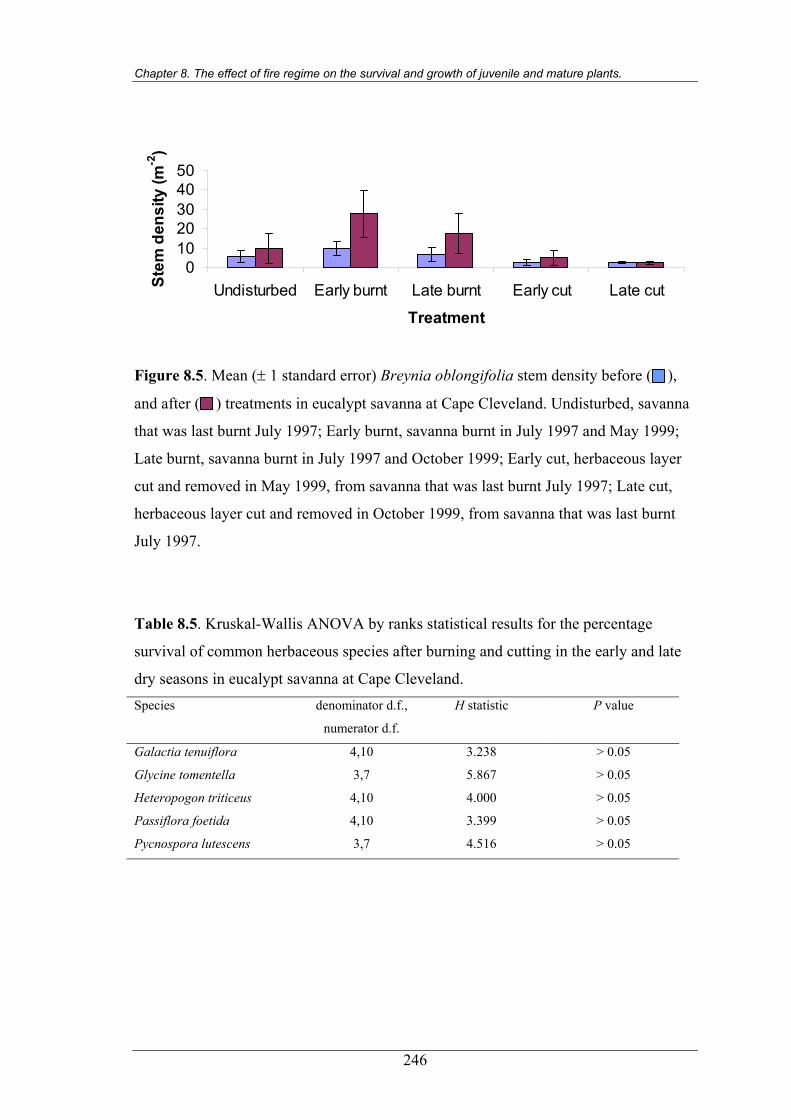
Chapter 8. The effect of fire regime on the survival and growth of juvenile and mature plants.
01020304050
Undisturbed Early burnt Late burnt Early cut Late cut
Treatment
Stem
den
sity
(m-2
)
Figure 8.5. Mean (± 1 standard error) Breynia oblongifolia stem density before ( ),
and after ( ) treatments in eucalypt savanna at Cape Cleveland. Undisturbed, savanna
that was last burnt July 1997; Early burnt, savanna burnt in July 1997 and May 1999;
Late burnt, savanna burnt in July 1997 and October 1999; Early cut, herbaceous layer
cut and removed in May 1999, from savanna that was last burnt July 1997; Late cut,
herbaceous layer cut and removed in October 1999, from savanna that was last burnt
July 1997.
Table 8.5. Kruskal-Wallis ANOVA by ranks statistical results for the percentage
survival of common herbaceous species after burning and cutting in the early and late
dry seasons in eucalypt savanna at Cape Cleveland. Species denominator d.f.,
numerator d.f.
H statistic P value
Galactia tenuiflora 4,10 3.238 > 0.05
Glycine tomentella 3,7 5.867 > 0.05
Heteropogon triticeus 4,10 4.000 > 0.05
Passiflora foetida 4,10 3.399 > 0.05
Pycnospora lutescens 3,7 4.516 > 0.05
246
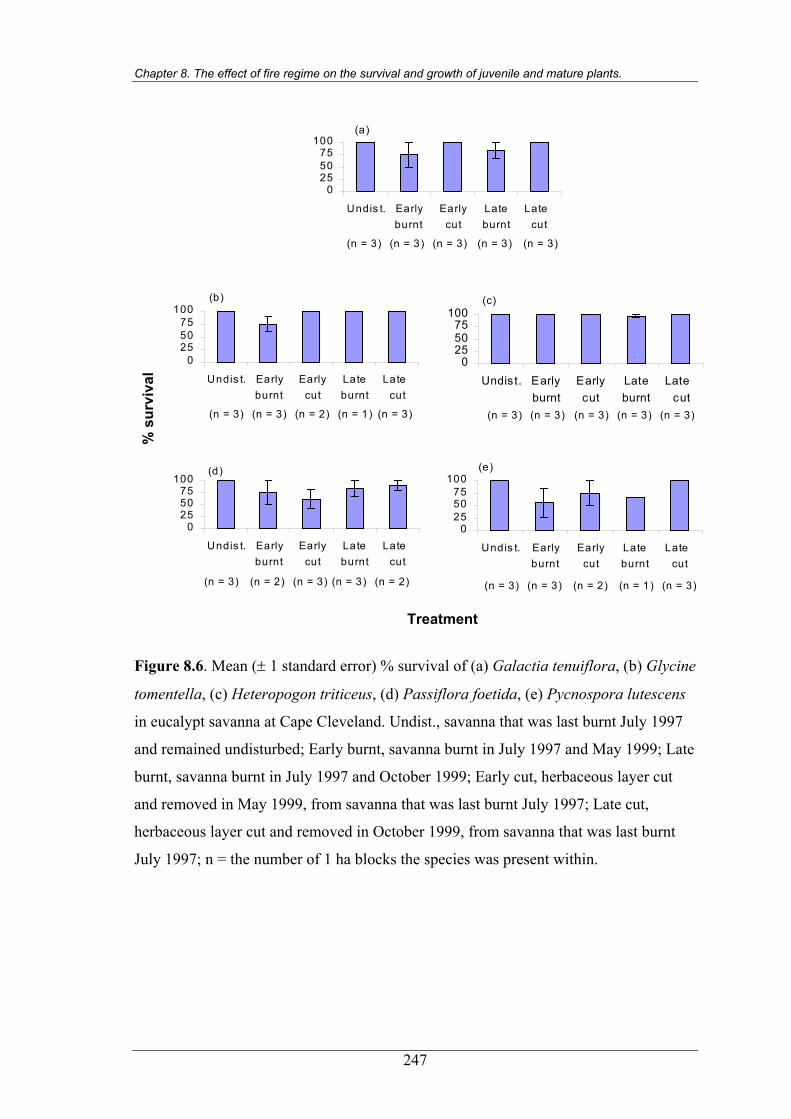
Chapter 8. The effect of fire regime on the survival and growth of juvenile and mature plants.
0255075
100
Undis t. Earlyburnt
Earlycut
Lateburnt
Late cut
(a)
(n = 3) (n = 3) (n = 3) (n = 3)(n = 3)
0255075
100
Undis t. Earlyburnt
Earlycut
Lateburnt
Late cut
(b)
(n = 3) (n = 2) (n = 1) (n = 3)(n = 3)
0255075
100
Undist. Earlyburnt
Earlycut
Lateburnt
Late cut
(c)
(n = 3) (n = 3) (n = 3) (n = 3)(n = 3)
0255075
100
Undis t. Earlyburnt
Earlycut
Lateburnt
Late cut
(d)
(n = 2) (n = 3) (n = 3) (n = 2)(n = 3)
0255075
100
Undis t. Earlyburnt
Earlycut
Lateburnt
Late cut
(e)
(n = 3) (n = 2) (n = 1) (n = 3)(n = 3)
% s
urvi
val
Treatment
Figure 8.6. Mean (± 1 standard error) % survival of (a) Galactia tenuiflora, (b) Glycine
tomentella, (c) Heteropogon triticeus, (d) Passiflora foetida, (e) Pycnospora lutescens
in eucalypt savanna at Cape Cleveland. Undist., savanna that was last burnt July 1997
and remained undisturbed; Early burnt, savanna burnt in July 1997 and May 1999; Late
burnt, savanna burnt in July 1997 and October 1999; Early cut, herbaceous layer cut
and removed in May 1999, from savanna that was last burnt July 1997; Late cut,
herbaceous layer cut and removed in October 1999, from savanna that was last burnt
July 1997; n = the number of 1 ha blocks the species was present within.
247
Chapter 8. The effect of fire regime on the survival and growth of juvenile and mature plants.
8.4 Discussion
8.4.1 Regenerative capacity of savanna species
Eighty one percent of species in eucalypt savannas around Townsville were observed to
be capable of sprouting after fire (Appendix 2). The proportion of sprouting species in
Townsville savannas is high compared to many Australian heath, woodland and forest
communities (Table 8.6). The higher proportion of sprouters in tropical forests and
savannas than in most temperate heaths, woodlands and forests (Table 8.6) agrees with
Bond and Midgley’s (2001) generalisation that sprouters are more abundant in the
tropical communities. Although the high percentage of sprouters in alpine woodland
may appear to be an anomaly to this conclusion, this community is subjected to
frequent insect attack and frost damage (Wahren et al. 1999). Hence the post-fire
sprouting ability of many species may be in response to frequent disturbances rather
than frequent fire (Wahren et al. 1999).
The capacity of individuals to live through several fires reduces plant turn over,
providing population stability (Bond and Midgley 2001). The abundance of sprouting
species in the eucalypt savannas of Townsville provides resilience to community
composition with regular burning. This explains the stability of species composition
documented in annual floristic surveys at Cape Cleveland, and the greater importance
of intrinsic plot differences than fire regimes in explaining the variation in species
composition and abundance (Chapter 3). The persistence provided by sprouting after
fire is therefore a critical mechanism maintaining the composition of eucalypt savannas
in northern Australia.
Sprouting species in Townsville savannas displayed variation in their mode of re-
growth, with many species re-shooting from buds located below the soil surface at the
base of the plant, while some woody species were able to epicormically sprout from the
trunk and branches (Appendix 2). For species that were capable of epicormic sprouting,
this ability was size dependent, with epicormic sprouting apparent only for plants
greater than 1.5 m to 2 m in height (and > 8 m for Canarium australianum). Size-
dependent variation in sprouting is common in tropical savanna trees (e.g. Lonsdale
and Braithwaite 1991; Trollope 1996; Williams et al. 1999b), and is probably due to
the
248
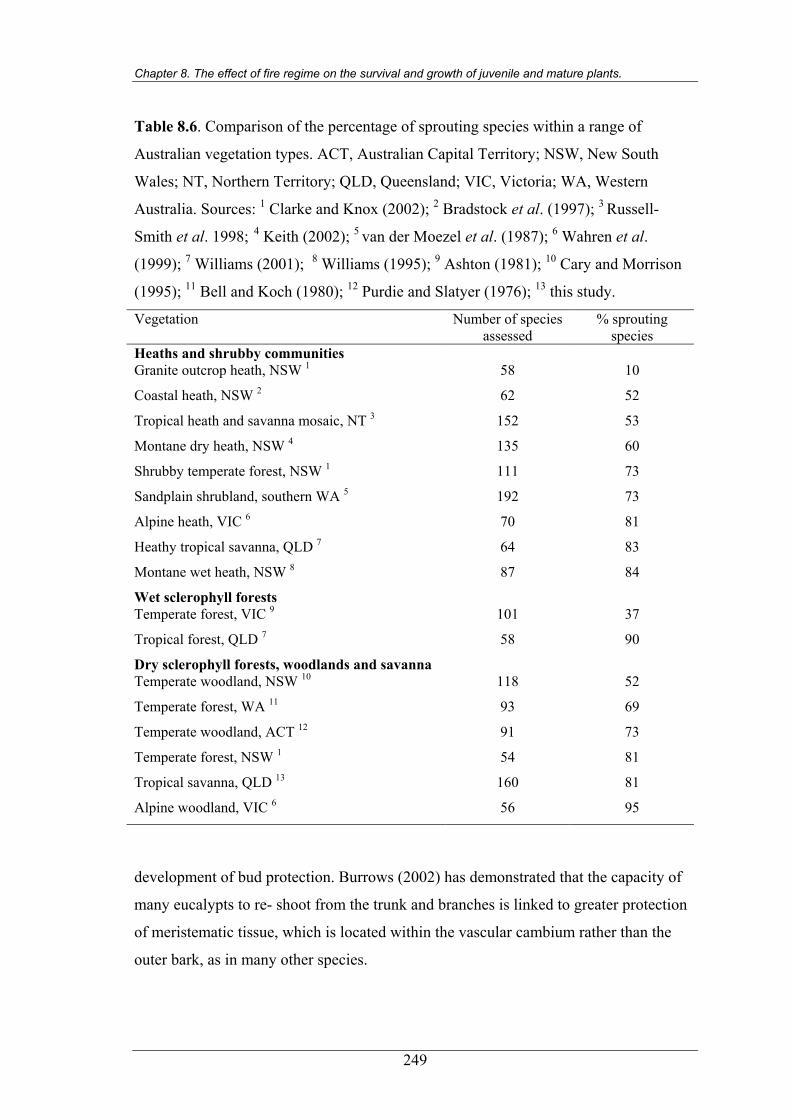
Chapter 8. The effect of fire regime on the survival and growth of juvenile and mature plants.
Table 8.6. Comparison of the percentage of sprouting species within a range of
Australian vegetation types. ACT, Australian Capital Territory; NSW, New South
Wales; NT, Northern Territory; QLD, Queensland; VIC, Victoria; WA, Western
Australia. Sources: 1 Clarke and Knox (2002); 2 Bradstock et al. (1997); 3 Russell-
Smith et al. 1998; 4 Keith (2002); 5 van der Moezel et al. (1987); 6 Wahren et al.
(1999); 7 Williams (2001); 8 Williams (1995); 9 Ashton (1981); 10 Cary and Morrison
(1995); 11 Bell and Koch (1980); 12 Purdie and Slatyer (1976); 13 this study.
Vegetation Number of species assessed
% sprouting species
Heaths and shrubby communities Granite outcrop heath, NSW 1 58 10
Coastal heath, NSW 2 62 52
Tropical heath and savanna mosaic, NT 3 152 53
Montane dry heath, NSW 4 135 60
Shrubby temperate forest, NSW 1 111 73
Sandplain shrubland, southern WA 5 192 73
Alpine heath, VIC 6 70 81
Heathy tropical savanna, QLD 7 64 83
Montane wet heath, NSW 8 87 84
Wet sclerophyll forests Temperate forest, VIC 9 101 37
Tropical forest, QLD 7 58 90
Dry sclerophyll forests, woodlands and savanna Temperate woodland, NSW 10 118 52
Temperate forest, WA 11 93 69
Temperate woodland, ACT 12 91 73
Temperate forest, NSW 1 54 81
Tropical savanna, QLD 13 160 81
Alpine woodland, VIC 6 56 95
development of bud protection. Burrows (2002) has demonstrated that the capacity of
many eucalypts to re- shoot from the trunk and branches is linked to greater protection
of meristematic tissue, which is located within the vascular cambium rather than the
outer bark, as in many other species.
249
Chapter 8. The effect of fire regime on the survival and growth of juvenile and mature plants.
Bellingham and Sparrow (2000) predicted basal sprouting should be more common
than epicormic sprouting with severe and frequent disturbance. This concept may be
applied to the contrast between canopy trees, which are capable of epicormic sprouting,
and juvenile trees and shrubs, which are reduced to basal sprouting. Mature trees in
Townsville savannas do not experience full canopy scorch during every fire, only
partial scorching during many low intensity early to mid dry season fires (pers. obs.).
The lower height of shrubs and tree juveniles ensures full canopy scorch during most
fires, and therefore shrubs and tree juveniles receive more frequent full canopy
disturbance than taller trees of the same community.
Several woody species in Townsville savannas sprouted from the roots after fire
(Appendix 2). Vegetative spread of woody species via root and rhizome suckering has
been reported for a range of tropical species and may be a significant source of stem
replacement and multiplication (Lacey 1974; Lacey and Whelan 1976; Hoffman 1998;
Williams 2000; Russell-Smith et al. in press).
The “persistence niche” (Bond and Midgley 2001), provided by sprouting and plant
longevity, is important for maintaining population stability and species co-existence.
Various modes of post-fire sprouting may also allow species co-existence. For instance,
root-suckering species of Townsville savannas are primarily subshrubs and herbs, and
regeneration from roots tends to promote horizontal spread, whereas epicormic
sprouting allows continued vertical growth, and has been observed only in canopy
species. Root regeneration is therefore a mechanism that allows species to efficiently
exploit a spatial niche near the soil surface and to co-exist with taller, epicormic
sprouting species.
Obligate seeders in Townsville savannas are primarily ephemeral species that produce
seed within one year of germination. Four of the six perennial obligate seeders require
only two years after germination to produce seed. The rapid seed production of obligate
seeders is a mechanism that allows population persistence with frequent fires. This
contrasts with the many obligate seeder shrubs of heaths and heathy savannas in the
Northern Territory and western Queensland which require more than five years to
produce seed and whose populations may decline with fire intervals of less than five
250
Chapter 8. The effect of fire regime on the survival and growth of juvenile and mature plants.
years (Russell-Smith et al. 1998; Williams et al. 2002b). It is possible that fire regimes
of less than five years in Townsville savannas may have removed obligate seeders that
require more than five years to mature.
8.4.2 Survival and growth of trees
The total density of trees taller than 2 m significantly increased with a four year
absence of fire at Cape Cleveland, although this was not significant for any individual
species (Table 8.2). The increase in tree density resulted from the growth of saplings
above 2 m in height. Burning during the early and late dry seasons inhibited an increase
in tree density over the course of the study. However, the increase in tree density in the
absence of fire was not associated with a significant increase in basal area, because the
growth of saplings above the 2 m height category added little to the overall basal area
(Figure 8.2; Table 8.3).
Fire season can affect sprouting ability, with poor recovery often reported after burning
during rapid growth periods (Whelan 1995). Noble (1989) found that fire season
affected survival of mallee eucalypts, with greater survival after annual spring (i.e.
early dry season) fires, which coincide with the start of the growing season, than annual
autumn (i.e. late dry season) fires. Fire intensity can also affect stem survival, as high
intensity, late dry season fires produce the highest mortality in tropical savanna trees of
the Northern Territory (Williams et al. 1999b). No significant fire season effect was
detected at Cape Cleveland, although the late dry season fires did cause the mortality of
one Corymbia tessellaris tree. The absence of distinct fire season differences in
survival may be because all Cape Cleveland fires were of a lower intensity than the late
dry season fires that caused significant mortality in the study by Williams et al.
(1999b).
Higgins et al. (2000) suggested variation in fire intensity is a key factor governing tree
density in savannas, with the escape of stunted juveniles from the “flame zone”
depending on fire frequency and intensity. Data from Cape Cleveland provide evidence
that fire frequency influences the release of stunted juveniles. However no evidence
was found that fire intensity affected juvenile release, as juveniles of various tree
species were reduced to sprouting from the base after both high intensity late dry
251
Chapter 8. The effect of fire regime on the survival and growth of juvenile and mature plants.
season fires and low intensity early and mid dry season fires. As a result, tree density
did not increase in early burnt sites that experienced only low intensity fires during the
study.
8.4.3 Survival and growth of Corymbia clarksoniana juveniles
The density of Corymbia clarksoniana juveniles remained stable in all fire regimes
between 1999 and 2001. Corymbia clarksoniana juveniles were not killed by fire and
rapidly re-grew after both early and late dry season fires to return to their pre-fire
heights within one year of burning (Figure 8.3). While no significant interaction
between fire treatment and year could be detected, a significant block effect indicated
variation between plots prior to the implementation of this study, and which may be
caused by species interactions or edaphic factors (Table 8.4). A significant year effect
resulted from growth of C. clarksoniana juveniles between 1999 and 2001, which was
consistent across all fire regimes. While the interaction between fire and year was not
significant in the repeated measures ANOVA, a significant correlation between
juvenile height and time since fire was detected, with a steady increase in height with
time after fire. This apparent inconsistency in statistical results can be explained by the
fact that the comparisons between burnt and unburnt plots in the repeated measures
analyses did not compare juvenile heights at the extreme range in time since fire,
namely one and four years post-fire, as the 2000 comparison assessed one and three
years after fire, and the 2001 data compared two and four years post-fire. The data
suggest that the absence of fire does lead to the growth of C. clarksoniana juveniles,
although the growth is slow and it may take many years before many juveniles grow
beyond 1.5 to 2 m in height, and become capable of epicormic sprouting and can
therefore continue vertical growth.
The escape of stunted juvenile savanna trees from the flame zone has been repeatedly
documented in tropical savannas experiencing infrequent fires (Higgins et al. 2000).
This includes many non-eucalypt trees of northern Australia, with intervals greater than
two or three years allowing the release of stunted juveniles (Bowman et al. 1988;
Crowley and Garnett 1998; Russell-Smith et al. in press). The growth of tropical
eucalypt juveniles beyond the flame zone may require longer fire intervals than many
non-eucalypt species. While the growth of Eucalyptus tetrodonta juveniles can occur
252
Chapter 8. The effect of fire regime on the survival and growth of juvenile and mature plants.
with several years without fire, E. miniata remain stunted after the absence of fire for
21 years, and may require release from competitive suppression by canopy trees
(Fensham and Bowman 1992; Russell-Smith et al. in press).
8.4.4 Stem regeneration after burning and cutting in the early and late dry seasons
Burning in both the early and late dry seasons significantly increased the density of
stems originating from root suckers in the subshrub Breynia oblongifolia, compared
with cutting back to ground level in unburnt savanna (Figure 8.5). This vegetative stem
reproduction explains the increase in the abundance of B. oblongifolia following fire,
documented in the annual floristic surveys (Chapter 3). The data provide evidence that
vegetative regeneration is affected by the type of disturbance but not the season of
disturbance. Bond and van Wilgen (1996) suggested that increased stem mortality after
burning, rather than cutting, indicated the fate of regenerative buds, rather than carbon
reserve size, is the primary mechanism controlling regeneration. In this instance,
cutting led to the regeneration of stem density similar to pre-disturbance numbers,
while burning increased the density of stems. Following Bond and van Wilgen’s (1996)
argument, these data suggest that the fate of regenerative buds, or meristematic tissue
within the roots, control the density of regenerating stems to a greater extent than
carbon reserve size, with fire triggering an increase in stem re-growth. This may result
from a stimulus to the roots from heat penetration into the topsoil during fire. While
late dry season fires produced greater heat penetration into the topsoil than early dry
season fires (Chapter 4), no significant differences between early and late fires were
detected in B. oblongifolia stem density.
Asexual reproduction is a common and important strategy in frequently burnt savannas,
and stems arising from root suckers show greater survival, growth and earlier
production of seeds than seedlings of the same species (Hoffman 1998). The strength of
the conclusion, that the density of regenerating stems of B. oblongifolia is governed to
a greater extent by the fate of buds than carbon reserves, is limited by the low number
of B. oblongifolia plants assessed, and by the indirect means of assessment. Further
research is required to directly examine the carbon reserve size and the influence of fire
on bud regeneration in a larger number of plants of B. oblongifolia and co-existing
root-suckering species, such as Grewia retusifolia, and Cajanus confertiflorus.
253
Chapter 8. The effect of fire regime on the survival and growth of juvenile and mature plants.
8.4.5 Survival of mature herbs
Burning and cutting produced some mortality in the five common herbaceous species
assessed, although differences between undisturbed, burnt and cut treatments were not
significant (Figure 8.6; Table 8.5). This indicates that, while these species may be
classified as sprouters, burning can kill plants. In Galactia tenuiflora and Heteropogon
triticeus, mortality was only detected after burning and not after cutting unburnt plants.
This suggests that, similar to B. oblongifolia, the fate of regenerative buds may be more
important than reserve size for controlling vegetative regeneration of these herbs (Bond
and van Wilgen 1996).
Further research is required to accurately examine the effect of fire on the level of
mortality of herbaceous species in Townsville savannas. The method used in this study
does not detect the survival of individual plants and can either over- or underestimate
the percentage survival, depending on the number of individuals present in the plots.
An improved method for use in further studies of survival of adult grass and forbs
could involve tagging plants with a wire ring that encircles the plants, as described by
Crowley and Garnett (2001).
8.5 Conclusion
The ability to sprout after fire is an important mechanism that promotes population
resilience in regularly burnt communities (Bond and Midgley 2001). The high
proportion of sprouting species in Townsville eucalypt savannas enables the persistence
of individual plants and explains the stability of species composition detected in this
savanna after two fires over five years (Chapter 3). However, some trees and common
herbs were killed by fire, indicating that burning does affect the number of standing
plants through mortality, as well as germination (Chapter 6).
There is evidence that frequent fires are responsible for suppressing juvenile trees from
growing beyond 2 m in height. However, the growth of juveniles of C. clarksoniana
may require many years of fire exclusion before a significant number of juveniles reach
2 m in height and are thus released from the fire trap. The release of some juvenile trees
with fire-free intervals of four years is consistent with Higgins’ et al. (2000, p. 226)
254
Chapter 8. The effect of fire regime on the survival and growth of juvenile and mature plants.
255
hypothesis that “grass-tree coexistence is driven by the limited opportunities for tree
seedlings to escape both drought and the flame zone into the adult stage.” Midgley and
Bond (2001) suggested, for high rainfall areas, that the growth of tall grasses allows
fires to inhibit juvenile tree release to the canopy. This is supported by data from Cape
Cleveland, where the increase in tree density coincided with the decline in abundance
of the dominant tall grass Heteropogon triticeus after four years (Chapter 3).
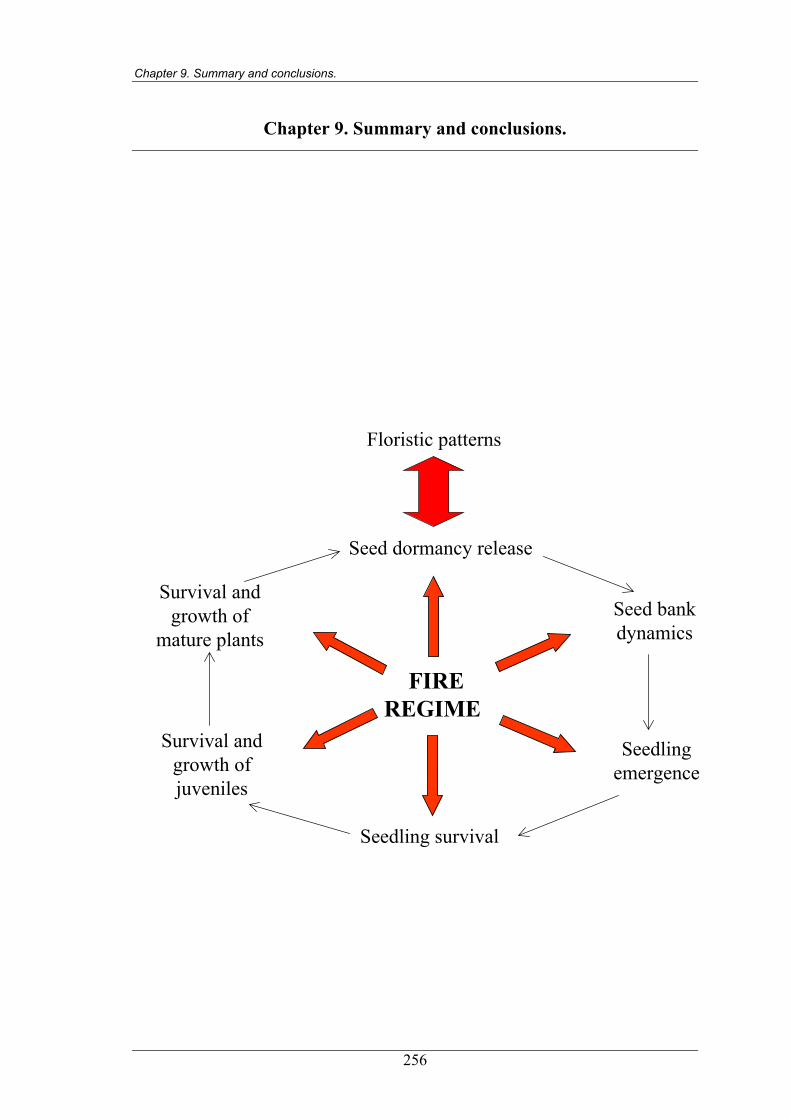
Chapter 9. Summary and conclusions.
Chapter 9. Summary and conclusions.
FIREREGIME
Seed dormancy release
Floristic patterns
Seed bankdynamics
Seedlingemergence
Survival andgrowth ofjuveniles
Survival andgrowth of
mature plants
Seedling survival
256
Chapter 9. Summary and conclusions.
9.1 Thesis objectives
The influence of fire on Australian tropical savannas has been the subject of debate
(e.g. Bowman et al. 1988; Lonsdale and Braithwaite 1991). It has been argued that the
long history of fire in tropical savannas has produced communities that are well
adapted to regular fire and that current fire regimes have little influence on species
composition and abundance, which are primarily governed by edaphic factors (Wilson
and Bowman 1987; Bowman et al. 1988). Yet research has provided evidence that
variation in fire regime can significantly affect species abundance within tropical
savannas (e.g. Lonsdale and Braithwaite 1991; Williams and Lane 1999). Fire may also
play a critical role in maintaining savanna structure (Bowman and Panton 1995), and
ultimately the co-existence of trees and grasses (Higgins et al. 2000).
The purpose of this research was to examine the influence of fire regime on species
composition and abundance, i.e. floristic patterns, within a tropical savanna of north-
eastern Australia. Floristic patterns respond to a complex interaction of biotic, climatic,
edaphic and fire variables, so that the ability to predict the effect of a specific fire
regime requires analysis of the processes that determine patterns (Whelan et al. 2002).
Therefore, a further objective of this research was to provide an understanding of the
mechanisms determining floristic patterns through an investigation into the effects of
fire on critical events in a plant’s life cycle, i.e. critical life events. Fire may
differentially affect critical life events (Gill 1975), and the effect of fire on one or more
life events may limit population growth. For instance, Higgins et al. (2000) and
Midgley and Bond (2001) proposed that seedling emergence, governed by rainfall, and
the release of stunted juvenile trees to the canopy, controlled by fire, may be critical
events limiting tree density in savannas. Population stability in frequently burnt
savannas may rely on the persistence of established plants (Bond and Midgley 2001).
To examine the effect of fire on tropical savannas of north-eastern Australia, an
assessment was made of a series of fires in eucalypt savannas in the vicinity of
Townsville. To focus directly on the impacts of fires and reduce the confounding
effects of landscape and climatic variation between locations, this study was primarily
based on a manipulative experiment within a 10 ha eucalypt savanna site at Cape
Cleveland, 25 km east of Townsville (Figures 2.1 and 2.4). Annual surveys of
257
Chapter 9. Summary and conclusions.
permanent plots were used to document the effect of fire on changes in species
composition and abundance over time. The influence of fire on critical life events was
assessed using further surveys of seedlings and plant survival, as well as field and
laboratory experiments. Seedling emergence and vegetative regeneration after fire were
also assessed at three additional sites in the vicinity of Townsville, at Castle Hill, Many
Peaks Range and Mt Elliot (Figure 2.1), to examine the consistency in fire-response in
the eucalypt savannas around Townsville.
The experimental fire regimes implemented at Cape Cleveland were:
1. Control; after the initial floristic survey, the savanna was burnt in the mid dry
season (July) 1997, and remained unburnt for the rest of the study.
2. Early burnt; savanna burnt in both the mid dry season 1997 and early dry season
(May) 1999.
3. Late burnt; savanna burnt in both the mid dry season 1997 and late dry season
(October) 1999.
9.2 Summary of results
9.2.1 The effect of fire regime on floristic patterns
Fuel loads in eucalypt savanna at Cape Cleveland rapidly re-establish after fire,
reaching approximately ten tonnes per hectare two years after fire, with no further gains
in biomass in the third and fourth years following fire. It is probable that fuel loads
remain static at approximately ten tonnes per hectare for many years, as documented in
eucalypt savannas unburnt for several decades on adjacent Magnetic Island (Sandercoe
1989) and in the Northern Territory (Russell-Smith et al. in press). Fire intensity, after
a two year interval, was higher during the late rather than early dry season, which is
consistent with that recorded in other tropical eucalypt savannas (e.g. Williams et al.
1999b). As fuel loads reach a maximum after two years in Townsville savannas, the
season of burning will have a greater influence on fire intensity than the number of
years since last fire in all but annually burnt savanna.
Multivariate analyses of survey data documented a high level of resilience in floristic
composition and abundance in response to fire regimes, however significant floristic
patterns were detected over the five year period. Cluster analyses of species
258
Chapter 9. Summary and conclusions.
composition alone, and species composition and abundance data, grouped many of the
annual surveys of the same plots. This suggests that many of the pre-existing floristic
differences between plots were not greatly altered by fire regimes between 1997 and
2001, but that some floristic dynamics did occur in response to fire.
Redundancy analyses also indicated that while distinct changes in community
composition and abundance were attributable to fire regime and interactions between
fire, year and plot, the intrinsic differences between plots were of more value in
explaining species variation amongst surveys than fire regimes. That is, pre-existing
plot differences, and small changes within each plot that were irrespective of fire
treatment, accounted for species variation to a greater extent than the fire regime over
five years. The stability of species composition through various fire regimes has been
repeatedly documented in Australian tropical savannas (e.g. Bowman et al. 1988;
Lonsdale and Braithwaite 1991; Russell-Smith et al. in press; Williams et al. in press).
This highlights the value of repeated surveys of permanently marked plots to document
floristic changes over time and thus reduce the confounding effects of edaphic and
climatic factors that would confuse the interpretation of floristic patterns from one-off
surveys of savannas that differ in recent fire history.
Subtle floristic changes after fires were detected using principle components analyses,
which displayed a consistency in floristic patterns across plots prior to the 1999 fire
treatments. The early and late dry season burnt savanna then responded differently from
savanna that remained unburnt.
Species richness at the 1 m2 scale significantly increased in the year following late dry
season fires. This reflects an increase in plant density, rather than in the number of
species in the savanna, as no corresponding effect was detected at the 100 m2 scale
(Whelan 1995).
A significant pulse in plant abundance was detected in the first year after fire,
particularly following late dry season fires, for several species and growth form groups.
The influence of fire on floristic patterns was most evident in the herbaceous layer,
particularly in promoting ephemeral forbs and the two most abundant growth form
259
Chapter 9. Summary and conclusions.
groups, twining perennial forbs and grasses. The dominant grass Heteropogon triticeus
declined after a fire interval of four years.
The promotion of herbaceous species’ abundance by fire is consistent with results for
other tropical savanna studies. Regular fires promote many tropical grasses, such as the
annuals Schizachyrium fragile (Bowman et al. 1988) and Sorghum intrans (Russell-
Smith et al. in press); and perennials Heteropogon contortus (Shaw 1957; Walker et al.
1989), H. triticeus (Sandercoe 1989; Fensham 1990; Russell-Smith et al. in press) and
Themeda triandra (Trollope 1996). Fire also promotes the abundance of many
perennial forbs, including Glycine spp. and Kennedia spp. (Lamb et al. 1989) and
ephemeral forbs, such as Crotalaria spp. (Fensham 1990) and Hyptis suaveolens
(Sandercoe 1989).
9.2.2 The effect of fire regime on seed dormancy release
Exposure to temperatures between 80°C and 100°C breaks seed dormancy in a range of
forbs, particularly legumes, while exposure to 120º C for five minutes proved lethal.
These temperatures were documented in a narrow band of topsoil during the passage of
early and late dry season fires, with greater heat penetration during late fires. The depth
of germination of two common forbs, Galactia tenuiflora and Indigofera hirsuta, was
correlated with heat penetration into the topsoil and these data suggested that exposure
to 60°C may also increase seed germination of these species. Late dry season fires were
found to provide greater release from heat-related seed dormancy than early dry season
fires.
While no evidence was found that exposure to smoke at ambient temperature enhanced
seed germination of legumes, the combined effects of exposure to 80°C and a nitrate
solution increased the germination of two species, Crotalaria lanceolata and Indigofera
hirsuta. Smoke significantly increased the germination of upright perennial forbs,
grasses as a group and the common grasses Digitaria breviglumis and Heteropogon
triticeus.
260
Chapter 9. Summary and conclusions.
9.2.3 The effect of fire regime on soil seed bank dynamics
The germinable soil seed bank at Cape Cleveland was dominated by grasses and forbs.
No species produced a bradysporous seed bank, and the soil seed banks of woody
species were scarce and short-lived, which is consistent with many other communities
(e.g. Drake 1979; Vlahos and Bell 1986; Melzer 1996; Clark et al. 1999). There were
more seeds between 3 and 40 mm soil depth than in the surface 3 mm, indicating that
burial mechanisms, such as the twisting action of hygroscopic awns, or the activities of
fauna, possibly ants, may incorporate seed within the topsoil.
The germinable soil seed bank displayed strong and consistent seasonal fluctuations,
increasing through the dry season to a maximum in the late dry season, and declining to
a minimum by the mid wet season. While many species showed reliance on annual seed
input to maintain seed bank density, the common grass Digitaria breviglumis and the
common ephemeral forb Indigofera hirsuta had a persistent soil seed bank, with
densities remaining high through the wet season. The seasonal dynamics of the
germinable soil seed bank were consistent with annual seed production, which is
greatest during the early to mid dry season, so that seeds accumulate in the soil through
the dry season.
Total seed density and species richness of the seed bank were lower in 1998 than 1999
and 2000. The increase in seed bank in 1999 and 2000 corresponds with a general
increase in plant abundance over that period and may be linked with the above average
rainfall of 1998 and 2000.
Late dry season fires reduced seed production of the dominant tree Corymbia
clarksoniana in the year following burning, probably as a result of high canopy scorch
causing mortality of flower buds. However, fire had less influence on the seasonal and
annual dynamics of the soil seed bank, enhancing the seed bank of the ephemeral forb
Indigofera hirsuta, and decreasing the overall seed bank of subshrubs and non-grass
monocots. Late dry season fires increased the germinable seed bank density of
untreated soil, confirming the importance of fire on seed dormancy release. The limited
impact of fire on soil seed banks was probably due to the shallow heat penetration into
the topsoil and the heavy decline in seed bank density over each wet season, so that
261
Chapter 9. Summary and conclusions.
seed banks were at a low density towards the end of the wet season, irrespective of
burning. Total seed bank density was lower than in many other fire-prone communities
(e.g. Clark et al. 1999; Read et al. 2000). Thus the data suggest seed bank density limits
population growth of savanna species.
9.2.4 The effect of fire regime on seedling emergence
Seedling emergence in eucalypt savanna near Townsville is dominated by herbaceous
species, reflecting the dominance of herbs in the soil seed bank. Data from four
locations in eucalypt savannas around Townsville, at Mt Elliot, Castle Hill, Many
Peaks Range and Cape Cleveland, indicated seedling emergence of herbaceous species
occurred primarily at the onset of the post-fire wet season. Laboratory and shadehouse
experiments indicated multiple fire-related factors were responsible for the pulse of
seedling emergence, including heat, nitrate and smoke. The removal of the dense
herbaceous cover also increased seedling emergence.
Seedling density was highest following late dry season fires. This resulted from both a
greater dormancy-breaking stimulus, particularly heat penetration into the topsoil, and
the greater seed reserves available to be influenced by fire in the late dry season. The
increased germination of smoke-triggered species, Digitaria breviglumis and
Heteropogon triticeus, after late dry season fires suggests greater soil penetration of
chemicals found in smoke during late rather than early dry season fires. This is
probable as greatest combustion of ground fuels occurred during late dry season fires.
Seedling emergence of trees and shrubs differed to that of herbaceous species, with the
limited seedling recruitment of woody species linked to a particular year. The most
abundant woody species amongst emerging seedlings was the dominant tree, Corymbia
clarksoniana, which emerged on mass after high rainfall in 1998, suggesting seedling
emergence of trees may be restricted to years of above average rainfall, and/or with an
early start to the wet season (Higgins et al. 2000). While considerable numbers of C.
clarksoniana seedlings emerged in savanna that was unburnt for one year, seedling
emergence in a single recently burnt site was 17 times the density of unburnt savanna.
Evidence that seedling emergence of C. clarksoniana is enhanced in recently burnt
savanna or where the ground cover is removed was not conclusive. However, the
262
Chapter 9. Summary and conclusions.
combined data of increased germination in a single burnt site, coupled with the lack of
seedling emergence from undisturbed experimental plots, provides a strong case that
the density of seedling emergence of C. clarksoniana is increased where seed falls onto
recently burnt or bare ground. This contrasts with the germination ecology of
Eucalyptus miniata in tropical Australia (Setterfield 1997b) but is consistent with a
range of eucalypts from southern Australia (Gill 1997).
The density of seedling emergence of Cape Cleveland species was low compared with
that of species of other communities (e.g. Bell et al. 1987; Crowley and Garnett 1999).
Total seedling emergence accounted for a low proportion of the soil seed bank
available in the late dry season (< 15%), and of the seed bank decline over the wet
season (< 21%), indicating that seedling emergence is an event that limits population
growth in Townsville savannas.
Seedlings appeared to germinate from seed that was produced on-site, rather than seed
dispersed from adjacent areas. Three quarters of the species recorded in the seedling
surveys were also detected in the soil seed bank, suggesting most seedlings originated
from stored seed. The remaining quarter of seedling species probably originated from
freshly fallen seed or very short-lived seed banks. This highlights the value of soil seed
banks in the ecology of tropical eucalypt savannas.
9.2.5 The effect of fire regime on seedling survival
Seedling survival was a life event that limited population growth. Only 7%, or less, of
seedlings of perennial species that emerged after the 1999 dry season survived until
October 2001. Seedlings that emerged from recently burnt savanna displayed
significantly greater survival than those emerging from undisturbed savanna, and
unburnt savanna with the herbaceous layer removed. Some aspect other than the
removal of the herbaceous layer is therefore responsible for the enhanced survival in
burnt savanna. This requires further research but may be linked to an increased
availability of nutrients after fire, or reduced herbivory or disease.
These data indicate that little seedling recruitment occurs in the absence of fire, as
seedling emergence is low in unburnt savanna and very few of the seedlings that do
263
Chapter 9. Summary and conclusions.
emerge survive to maturity. That is, seedling recruitment, at least of herbaceous
species, is primarily limited to the post-fire environment, and is greatest after late dry
season fires.
Seedlings of common sprouter species developed the capacity to survive fire within one
year of germination, although survival varied between 5% for Corymbia clarksoniana
and 56% for Galactia tenuiflora. The ability to rapidly acquire the capacity to survive
fire provides stability to populations in frequently burnt communities, although the
moderate to low level of survival indicates annual fires may limit seedling
establishment.
Only 5% of C. clarksoniana seedlings survived three years in unburnt savanna, while
1% survived in savanna burnt in the early dry season, and none survived in late burnt
savanna. Population growth of this dominant tree is therefore limited by seedling
recruitment, which may be rainfall driven. Late dry season fire may reduce seed
production in the year following burning, while fire immediately prior to seed fall may
improve seed bed conditions to increase seedling recruitment in the same year as
burning. Burning after seedling emergence may reduce seedling survival.
9.2.6 The effect of fire regime on the survival and growth of juveniles and mature
plants
Townsville eucalypt savannas contain a large proportion of sprouting species. This
enables the persistence of individual plants and therefore provides stability to
populations in a frequently burnt environment. Some mortality of both trees and
common herbs was documented after fires, indicating that fire can affect the number of
standing plants through mortality as well as germination.
Evidence was found that frequent fires may suppress the growth of juvenile trees
towards the canopy, limiting tree density (Higgins et al. 2000). However, many years
of fire exclusion may be required before a significant number of C. clarksoniana
juveniles grow to 2 m in height and thus escape the fire trap.
264
Chapter 9. Summary and conclusions.
Vegetative regeneration of the root-sprouting subshrub Breynia oblongifolia was
affected by the type of disturbance, with burning, rather than cutting, promoting stem
multiplication. These data suggest that burning stimulates the stem production from
meristematic tissue along the roots, and that the fate of regenerative buds may control
the density of regenerating stems to a greater extent than carbon reserve size, although
a more direct assessment of carbon reserves is required to confirm this hypothesis.
9.3 Functional ecology of Townsville eucalypt savannas
This research has demonstrated that fire regime does influence floristic patterns in
eucalypt savannas of north-eastern Australia. The investigation of critical life events
has provided an understanding of the processes causing floristic patterns. The pulse of
seedling emergence following fire, triggered by seed dormancy release from heat,
smoke, nitrate and the removal of the herbaceous cover, and the increase in stem
density of root-sprouting subshrubs, explains the pulse of plant abundance in the first
year after fire, especially following late dry season fires. Late rather than early dry
season fires increased seedling emergence because late fires provided a greater
dormancy release stimulus, and there were more seed reserves available in the late dry
season to be affected by fire. The short lifespan of ephemeral forbs and the high
seedling mortality of perennial species explains the decline in plant abundance in the
second year following fire. The growth of juvenile trees beyond 2 m in height in the
absence of fire accounts for the increase in tree density in savanna unburnt for four
years. The capacity of the majority of species to sprout after fire, with rapid seed
production by fire-killed species, explains the stability in species composition
documented in the annual floristic surveys.
Total seed bank density, seedling emergence and seedling survival in Townsville
savannas are low compared to those of many other communities. The opportunities for
seed dormancy release are primarily restricted to fire events. Together these processes
govern seedling recruitment and limit population growth (Figure 9.1).
265
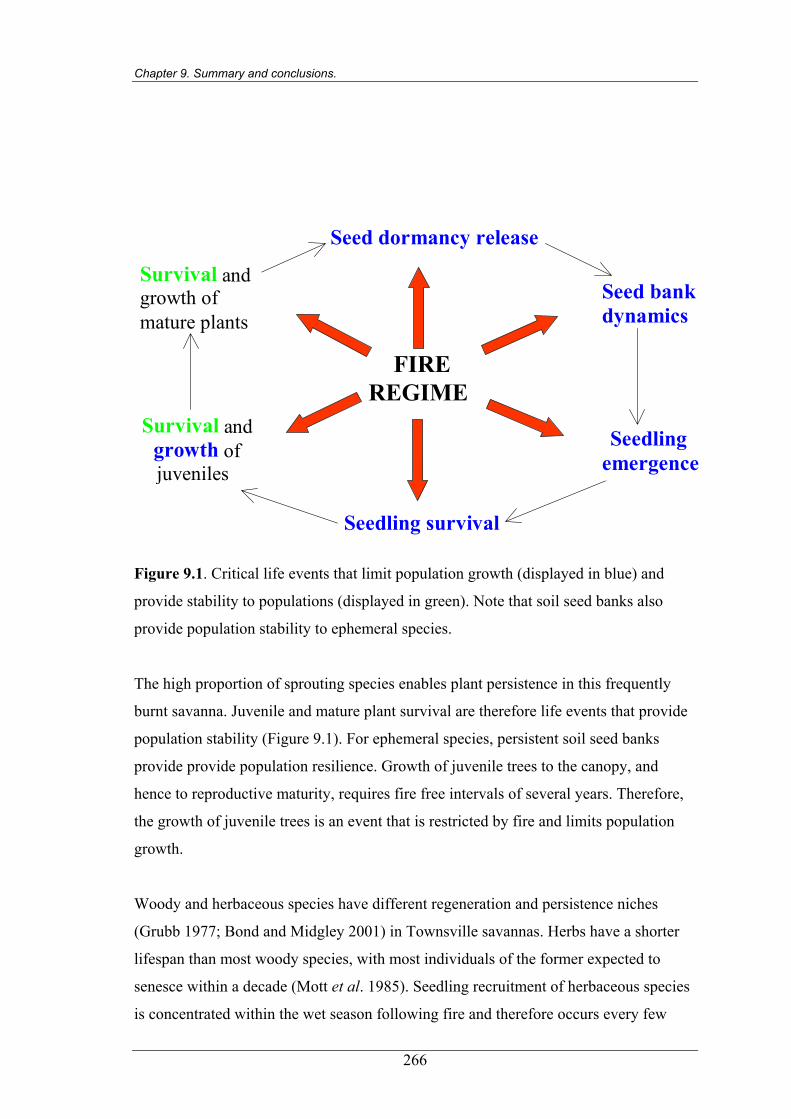
Chapter 9. Summary and conclusions.
FIREREGIME
Seed dormancy release
Seed bankdynamics
Seedlingemergence
Survival andgrowth ofjuveniles
Survival andgrowth ofmature plants
Seedling survival
Figure 9.1. Critical life events that limit population growth (displayed in blue) and
provide stability to populations (displayed in green). Note that soil seed banks also
provide population stability to ephemeral species.
The high proportion of sprouting species enables plant persistence in this frequently
burnt savanna. Juvenile and mature plant survival are therefore life events that provide
population stability (Figure 9.1). For ephemeral species, persistent soil seed banks
provide provide population resilience. Growth of juvenile trees to the canopy, and
hence to reproductive maturity, requires fire free intervals of several years. Therefore,
the growth of juvenile trees is an event that is restricted by fire and limits population
growth.
Woody and herbaceous species have different regeneration and persistence niches
(Grubb 1977; Bond and Midgley 2001) in Townsville savannas. Herbs have a shorter
lifespan than most woody species, with most individuals of the former expected to
senesce within a decade (Mott et al. 1985). Seedling recruitment of herbaceous species
is concentrated within the wet season following fire and therefore occurs every few
266
Chapter 9. Summary and conclusions.
years in frequently burnt savanna. Fire intervals of more than four years could be
associated with a population decline in many grasses and forbs. Short-lived ephemerals
and the dominant perennial grass Heteropogon triticeus tend to produce the most
abundant seedling recruitment. The declines in abundance of H. triticeus with the
absence of fire for four years, indicates that individual clumps may have a fairly short
lifespan in the absence of disturbance. The longevity of seed banks of ephemeral
species is unknown, but both ephemeral forbs and H. triticeus may rely on regular
seedling recruitment events to maintain population density.
Woody species can live for many decades and therefore the required rate of
replacement of individuals is low in comparison with herbaceous species. Recruitment
of woody species in Townsville savannas is sparse and episodic, a pattern that has been
reported for many long-lived sprouters of frequently burnt communities (e.g. Lacey
1974; Midgley and Cowling 1993; Bond and Midgley 2001). The recruitment of some
woody species in Townsville savannas may be enhanced by fire but is not restricted to
the post-fire environment, nor does it occur after each fire, and appears to be primarily
linked to years of above average rainfall and with early wet season rain. Asexual
reproduction of stems may be important for several species, including the subshrub
Breynia oblongifolia, and appears to be promoted by fire.
This study contributes to our understanding of the influence of fire regime on the
maintenance of savanna structure and the balance between woody and herbaceous
species. It suggests that fire intervals of four or more years may affect the balance
between grasses and trees. This may result from the growth of saplings into the canopy
layer, given release from overstorey competition (Fensham and Bowman 1992), and a
decline in the abundance of the dominant grass, Heteropogon triticeus. The current
regime of frequent fires may also preclude the presence of obligate seeders that require
greater than two or three years to mature, and a fire regime with late dry season fires
following a fire-free period of two years may be particularly beneficial to many of the
ephemeral forbs of this community.
267
Chapter 9. Summary and conclusions.
Issues that have emerged from this study that require further research include:
1. What is the longevity of soil seed banks, particularly of ephemeral species?
2. What is the longevity of individual plants of perennial herbs and wood species, and
what density and frequency of seedling recruitment is required to maintain
populations?
3. Does fire increase the density of safe sites for seedling recruitment of eucalypts?
4. Do late dry season fires provide a greater penetration of smoke into the soil seed
bank than early dry season fires?
5. Is the density of the seed bank more important than the dormancy-release stimuli
provided by fire, in determining the density of seedling emergence?
6. What is the influence of scale and patchy fires on plant recruitment?
7. What is the percentage survival of herbaceous species during various fires?
8. Is the fate of regenerative buds of greater importance in determining sprouting
success than the availability of carbon reserves?
9. How do variations in fire intervals, with a constant fire season and intensity,
influence floristic patterns and plant processes?
10. What are the soil nutrient dynamics in relation to fire in eucalypt savannas around
Townsville, and what is the contribution of ephemeral legumes in the maintenance
of nitrogen levels?
11. What is the effect of predicted climate change on the coexistence of trees and
herbs?
12. How appropriate is the recommended fire regime to maintaining populations of
local fauna?
9.4 Management implications and further research
This research has examined several fire regimes over five years, during a period when
both above and below average annual rainfall were experienced. While five years is a
brief period of time, most of the floristic responses detected over 21 years of research in
eucalypt savanna at Munmarlary, Northern Territory, were evident within the first five
years of the study (Russell-Smith et al. in press). The assessment of critical life events
has identified the causes of floristic dynamics, and therefore allows some predictions
regarding the floristic response to fire regimes that were not specifically addressed.
268
Chapter 9. Summary and conclusions.
The results of this research have broad applicability across northern Australia, as many
of the common species, such as the tree Planchonia careya, the shrub Ficus opposita,
the grasses Heteropogon contortus, H. triticeus, and Themeda triandra, and forbs
Crotalaria calycina, C. montana, Galactia tenuiflora, Glycine tomentella and
Indigofera hirsuta, have a wide distribution across northern Queensland, the Northern
Territory and several extend into northern Western Australia (Fensham 1990; Bowman
et al. 1991; Craig 1997; Henderson 1997; Crowley and Garnett 1998). Much of the
research into the fire ecology of tropical eucalypt savannas in Australia to date has
focused on savannas dominated by annual grasses, such as Schizachyrium spp. and
Sorghum spp. (e.g. Crowley and Garnett 1998; Russell-Smith et al. in press; Williams
et al. in press), which do not rely on fire for seedling recruitment (Andrew and Mott
1983; Crowley and Garnett 1998). This thesis therefore provides much needed data for
eucalypt savannas of northern Australian that are dominated by perennial grasses.
The season of fire is implicitly linked to fire intensity and these two elements of the fire
regime affect floristic patterns in eucalypt savanna at Cape Cleveland. High intensity,
late dry season fires promote greater seedling recruitment of herbaceous species than do
fires in the early dry season. However, late dry season fires reduce seed production in
the dominant tree Corymbia clarksoniana, and can kill established trees.
While fire frequency was not specifically examined within the manipulative experiment
at Cape Cleveland, an understanding of processes allows some predictions regarding
fire intervals. The rapid fuel accumulation allows frequent fires with intervals of one to
two years. Seedlings of common perennials can develop the capacity to survive fire
within a year of germination, although annual fires are expected to reduce the already
low seedling survival rate. There is some evidence that the absence of fire for three
years after germination can increase seedling survival of Corymbia clarksoniana. Fire
intervals of four years can allow the growth of stunted juvenile trees beyond the fire
trap to recruit to the canopy. The dominant grass Heteropogon triticeus declines in
abundance with fire intervals of four years. Information on the persistence of seed
banks of ephemeral forbs will be required to predict the decline in abundance of these
short-lived species with increasing fire intervals.
269
Chapter 9. Summary and conclusions.
270
Management of these savannas should take into account the contrasting effects of
different fire regimes. For instance, while repeated late dry season fires every two or
three years may promote seedling recruitment of many herbaceous species, it may lead
to a reduced abundance of woody species, and stunt the growth of juvenile trees.
Regular early dry season fires may not impact on woody species to the same degree,
although probably stunt juvenile trees. Late dry season fires also burn more extensive
areas of savanna and are harder to control than earlier fires (Gill et al. 1996). Early dry
season fires will promote seedling recruitment of grasses and forbs, but not to the same
density as late dry season fires, and repeated early fires may not promote enough
seedling recruitment to maintain populations of some species. Fire intervals of four or
more years may lead to increased tree densities, through sapling growth, but also to
declines in herbaceous species, especially the dominant grass H. triticeus, and possibly
some ephemeral species depending on the longevity of their seed banks.
Clearly, variation in fire regime is required to maintain species diversity and structure,
and no single fire regime will suit all sites (Williams et al. 2002a). While the fire
treatments assessed in this study cover regimes that are realistic to the local area,
further research and monitoring will be necessary to determine the effects of different
combinations of elements of the fire regime. The most appropriate fire regime to
maintain plant diversity may involve primarily early to mid dry season fires, creating a
patchily burnt landscape that allows the implementation of occasional late dry season
fires for maximum herbaceous regeneration. As this study assessed only two fires over
five years, longer-term assessments will further our understanding of the ecology and
hence management of this widespread system. However, the most suitable fire regime
to maintain the diversity of both woody and herbaceous species would appear to
involve the fluctuation of most fire intervals between two and five years, with the
occasional use of longer intervals to allow the growth of stunted juvenile trees. Fire
exclusion for several years following germination of eucalypt seedlings may allow the
replenishment of the sapling bank, which may aid population resilience at sites with a
low density of eucalypt juveniles. Further research into the fire ecology of native fauna
is required to test whether this regime would be appropriate for fauna of north-eastern
Australia. A similar regime is recommended for fauna and flora management in tropical
savannas of the Northern Territory (Andersen 2000).
References.
References.
Abbott I. (1985) Recruitment and mortality in populations of Banksia grandis Willd. in
Western Australian forest. Australian Journal of Botany 33, 261-270.
Andersen A. N. (1991) Responses of ground-foraging ant communities to three
experimental fire regimes in a savanna forest of tropical Australia. Biotropica 23,
575-585.
Andersen A. N. (2000) Synthesis and management implications. In: Fire and
Biodiversity. CSIRO's Kapalga Fire experiment, Kakadu National Park. pp. 13-
13. CSIRO, Darwin.
Andrew M. H. and Mott J. J. (1983) Annuals with transient seed banks: the population
biology of indigenous Sorghum species of tropical north-west Australia.
Australian Journal of Ecology 8, 265-276.
Andrew M. H. (1986) Population dynamics of the tropical annual grass Sorghum
intrans in relation to local patchiness in its abundance. Australian Journal of
Ecology 11, 209-217.
Andrew M. H. (1986) Selection of plant species by cattle grazing native monsoon
tallgrass pasture at Katherine, N. T. Tropical Grasslands 20, 120-127.
Ashton D. H. (1979) Seed harvesting by ants in forests of Eucalyptus regnans F. Muell.
in central Victoria. Australian Journal of Ecology 4, 265-277.
Ashton D. H. (1981) Fire in tall open forests (wet sclerophyll forests). In: Fire and the
Australian Biota. (eds A. M. Gill, R. H. Groves, and I. R. Noble) pp. 339-366.
Australian Academy of Science, Canberra.
Ashton D. H. and Chinner J. H. (1999) Problems of regeneration of the mature
Eucalyptus regnans F. Muell. (The Big Ash) forest, in the absence of fire at
Wallaby Creek, Victoria, Australia. Australian Forestry 62, 265-280.
271
References.
Auld T. D. and O'Connell M. A. (1991) Predicting patterns of post-fire germination in
35 eastern Australian Fabaceae. Australian Journal of Ecology 16, 53-70.
Auld T. D. and Bradstock R. A. (1996) Soil temperatures after the passage of fire: Do
they influence the germination of buried seeds? Australian Journal of Ecology 21,
106-109.
Auld T. D. (1996) Ecology of the Fabaceae in the Sydney region: fire, ants and the soil
seedbank. Cunninghamia 4, 531-756.
Auld T. D. and Tozer M. G. (1999) How well do post-fire indicators provide insights
into the degree of soil heating during the passage of fires? In: Bushfire 1999.
Proceedings of the Australian Bushfire Conference. (eds B. Lord, M. Gill and R.
Bradstock) pp. 25-32. Charles Sturt University, Albury.
Auld T. D., Keith D. A. and Bradstock R. A. (2000) Patterns in longevity of soil
seedbanks in fire-prone communities of south-eastern Australia. Australian
Journal of Botany 48, 539-548.
Baird A. M. (1977) Regeneration after fire in King's Park, Perth, Western Australia.
Journal of the Royal Society of Western Australia 60, 1-22.
Barbour M. G., Burk J. H., and Pitts W. D. (1987) Terrestrial Plant Ecology.
Benjamin/Cummings, California.
Battaglia M. (1996) Effects of seed dormancy and emergence time on the survival and
early growth of Eucalyptus delegatensis and E. amygdalina. Australian Journal of
Botany 44, 123-137.
Baxter B. J. M., van Staden J., Granger J. E. and Brown N. A. C. (1994) Plant-derived
smoke and smoke extracts stimulate seed germination of the fire-climax grass
Themeda triandra. Environmental and Experimental Botany 34, 217-223.
Beardsell D. and Mullett J. (1984) Seed germination of Eucalyptus pauciflora Sieb. ex
Spreng. from low and high altitude populations in Victoria. Australian Journal of
Botany 32, 475-480.
272
References.
Bebawi F. F. and Campbell S. D. (2000) Effects of fire on germination and viability of
rubber vine (Cryptostegia grandiflora) seeds. Australian Journal of Experimental
Agriculture 40, 949-957.
Belbin L. (1995) Technical Reference: PATN Pattern Analysis Package. CSIRO,
Canberra.
Bell D. T. (1999) Turner review no. 1. The process of germination in Australian
species. Australian Journal of Botany 47, 475-517.
Bell D. T. (2001) Ecological syndromes in the flora of southwestern Western Australia:
Fire resprouters versus reseeders. The Botanical Review 67, 417-440.
Bell D. T., King L. A. and Plummer J. A. (1999) Ecophysiological effects of light
quality and nitrate on seed germination in species from Western Australia.
Australian Journal of Ecology 24, 2-10.
Bell D. T. and Koch J. M. (1980) Post-fire succession in the northern jarrah forest of
Western Australia. Australian Journal of Ecology 5, 9-14.
Bell D. T., Plummer J. A. and Taylor S. K. (1993) Seed germination ecology in
southwestern Western Australia. The Botanical Review 59, 24-69.
Bell D. T., van der Moezel P. G., Delfs J. C. and Loneragan W. A. (1987b) Northern
sandplain kwongan: effect of fire on Hakea obliqua and Beaufortia elegans
population structure. Journal of the Royal Society of Western Australia 69, 139-
143.
Bell D. T., Vlahos S. and Watson L. E. (1987a) Stimulation of seed germination of
understorey species of the northern Jarrah forest of Western Australia. Australian
Journal of Botany 35, 593-599.
Bell D. T. and Williams D. S. (1998) Tolerance of thermal shock in seeds. Australian
Journal of Botany 46, 221-233.
Bellingham P. J. and Sparrow A. D. (2000) Resprouting as a life strategy in woody
plant communities. Oikos 89, 409-416.
273
References.
Benwell A. S. (1998) Post-fire seedling recruitment in coastal heathland in relation to
regeneration strategy and habitat. Australian Journal of Botany 46, 75-101.
Bond W. J. and Midgley J. J. (2001) Ecology of sprouting in woody plants: the
persistence niche. Trends in Ecology and Evolution 16, 45-51.
Bond W. J. and van Wilgen B. W. (1996) Fire and Plants. Chapman and Hall, London.
Bowman D.M.J.S. (1988) Stability amid turmoil?: towards an ecology of north
Australian eucalypt forests. Proceedings of the Ecological Society of Australia 15,
149-158.
Bowman D.M.J.S. (1993) Establishment of two dry monsoon forest tree species on a
fire-protected monsoon forest-savanna boundary, Cobourg Peninsula, north
Australia. Australian Journal of Ecology 18, 235-237.
Bowman D.M.J.S. (1994) Why the skillful use of fire is critical for the management of
biodiversity in northern Australia. In: Country in Flames: Proceedings of the
1994 Symposium on Biodiversity and Fire in Northern Australia. (ed. D. B.
Rose). pp. 103-109. Department of Sport and Territories, Canberra.
Bowman D.M.J.S. (2000) Australian Rainforests. Islands of green in a land of fire.
Cambridge University Press, Cambridge.
Bowman D.M.J.S. and Fensham R. J. (1991) Response of a monsoon forest-savanna
boundary to fire protection, Weipa, northern Australia. Australian Journal of
Ecology 16, 111-18.
Bowman D.M.J.S. and Kirkpatrick J. B. (1986) Establishment, suppression and growth
of Eucalyptus delegatensis R. T. Baker in multiaged forests. I. The effects of fire
on mortality and seedling establishment. Australian Journal of Botany 34, 63-72.
Bowman D.M.J.S. and Panton W. J. (1993) Factors that control monsoon-rainforest
seedling establishment and growth in north Australian Eucalyptus savanna.
Journal of Ecology 81, 297-304.
274
References.
Bowman D.M.J.S. and Panton W. J. (1995) Munmarlary revisited: Response of a north
Australian Eucalyptus tetradonta savanna protected from fire for 20 years.
Australian Journal of Ecology 20, 526-531.
Bowman D.M.J.S., Wilson B. A. and Woinarski J. C. Z. (1991) Floristic and
phenological variation in a northern Australian rocky Eucalyptus savanna.
Proceedings of the Royal Society of Queensland 101, 79-90.
Bowman D.M.J.S., Wilson B. A. and Hooper R. J. (1988) Response of Eucalyptus
forest and woodland to four fire regimes at Munmarlary, Northern Teritory,
Australia. Journal of Ecology 76, 215-232.
Bradstock R. A. (1991) The role of fire in establishment of seedlings of serotinous
species from the Sydney region. Australian Journal of Botany 39, 347-356.
Bradstock R. A. and Auld T. D. (1995) Soil temperatures during experimental bushfires
in relation to fire intensity: consequences for legume germination and fire
management in south-eastern Australia. Journal of Applied Ecology 32, 76-84.
Bradstock R. A. and Bedward M. (1992) Simulation of the effect of season of fire on
post-fire seedling emergence of two Banksia species based on long-term rainfall
records. Australian Journal of Botany 40, 75-88.
Bradstock R. A. and Myerscough P. J. (1988) The survival and population response to
frequent fires of two woody resprouters Banksia serrata and Isopogon
anemonifolius. Australian Journal of Botany 36, 415-431.
Bradstock R. A., Tozer M. G. and Keith D. A. (1997) Effects of high frequency fire on
floristic composition and abundance in a fire-prone heathland near Sydney.
Australian Journal of Botany 45, 641-655.
Brennan K. (1996) Flowering and fruiting phenology of native plants in the Alligator
Rivers Region with particular reference to the Ranger uranium mine lease area.
Supervising Scientist, Canberra.
275
References.
Burrows D. M. and Burrows W. H. (1992) Seed production and litter fall in some
eucalypt communities in Central Queensland. Australian Journal of Botany 40,
389-403.
Burrows G. E. (2002) Epicormic strand structure in Angophora, Eucalyptus and
Lophostemon (Myrtaceae) - implications for fire resistance and recovery. New
Phytologist 153, 111-131.
Byram G. M. (1959) Combustion of forest fuels. In: Forest Fire: Control and Use. (ed.
K. P. Davis) pp. 61-89. McGraw-Hill, New York.
Campbell S. D., Bahnisch L. M. and Orr D. M. (1996) Fire directly promotes the
germination of dormant speargrass (Heteropogon contortus) seed. Tropical
Grasslands 30, 162.
Cary G. J. and Morrison D. A. (1995) Effects of fire frequency on plant species
composition of sandstone communities in the Sydney region: combinations of
inter-fire intervals. Australian Journal of Ecology 20, 418-426.
Cheney, P., Gould, J., and McCaw, L. (2001). The dead-man zone - a neglected area of
firefighter safety. Australian Forestry 64, 45-50.
Clark J. S., Beckage B., Camill P., Cleveland B., HilleRisLambers J., Lichter J.,
McLachlan J., Mohan J. and Wyckoff P. (1999) Interpreting recruitment
limitation in forests. American Journal of Botany 86, 1-16.
Clark S. S. (1988) Effects of hazard-reduction burning on populations of understorey
plant species on Hawkesbury sandstone. Australian Journal of Ecology 13, 473-
484.
Clarke P. J. (in press) Experiments on tree and shrub establishment in temperate grassy
woodlands: seedling survival. Austral Ecology 27, in press.
Clarke P. J. and Davison E. A. (2001) Experiments on the mechanism of tree and shrub
establishment in temperate grassy woodlands: Seedling emergence. Austral
Ecology 26, 400-412.
276
References.
Clarke P. J., Davison E. A. and Fullon L. (2000) Germination and dormancy of grassy
woodland and forest species: effects of smoke, heat, darkness and cold.
Australian Journal of Botany 48, 687-700.
Clarke P. J. and Knox K. J. E. (2002) Post-fire response of shrubs in the tablelands of
eastern Australia: do existing models explain habitat differences? Australian
Journal of Botany 50, 53-62.
Clifford H. T., Rogers R. W. and Kahler C. (1996) Seasonal variation in the germinable
seed banks of southern Queensland eucalypt forests. Proceedings of the Royal
Society of Queensland 105, 1-5.
Cook G. D. (1994) The fate of nutrients during fires in a tropical savanna. Australian
Journal of Ecology 19, 359-356.
Cook G. D. and Andrew M. H. (1991) The nutrient capital of indigenous Sorghum
species and other understorey components of savannas in north-western Australia.
Australian Journal of Ecology 16, 375-384.
Craig A. B. (1997) A review of information on the effects of fire in relation to the
managment of rangelands in the Kimberley high-rainfall zone. Tropical
Grasslands 31, 161-187.
Crowley G. M. (1995) Fire on Cape York Peninsula. Office of the Co-ordinator
General of Queensland and Department of Environment, Sport and Territories,
Canberra.
Crowley G. M. and Garnett S. T. (1998) Vegetation change in the grasslands and grassy
woodlands of east-central Cape York Peninsula, Australia. Pacific Conservation
Biology 4, 132-148.
Crowley G. M. and Garnett S. T. (1999) Seeds of the annual grasses Schizachyrium
spp. as a food resource for tropical granivorous birds. Australian Journal of
Ecology 24, 208-220.
277
References.
Crowley G. M. and Garnett S. T. (2000) Changing fire management in the pastoral
lands of Cape York Peninsula of northeast Australia, 1623 to 1996. Australian
Geographical Studies 38, 10-26.
Crowley G. M. and Garnett S. T. (2001) Growth, seed production and effect of
defoliation in an early flowering perennial grass, Alloteropsis semialata
(Poaceae), on Cape York Peninsula, Australia. Australian Journal of Botany 49 ,
735-743.
Dixon K. W., Roche S. and Pate J. S. (1995) The promotive effect of smoke derived
from burnt native vegetation on seed germination of Western Australian plants.
Oecologia 101, 185-192.
Drake W. E. (1979) Seed populations and regeneration potential of coastal Eucalyptus
forest of south-east Queensland. PhD thesis, University of Queensland, Brisbane.
Duff G. A. and Braithwaite R. W. (1989) Fire and top end forests - past, present and
future research. In: Fire Research in Rural Queensland. Selected papers from the
Queensland fire research workshop series 1980 – 1989. (ed. B. R. Roberts) pp.
84-97. University of Southern Queensland, Toowoomba.
Enright N. J., Goldblim D., Ata, P. and Ashton D. H. (1997) The independent effects of
heat, smoke and ash on emergence of seedlings from the soil seed bank of a
heathy Eucalyptus woodland in Grampians (Gariwerd) National Park, western
Victoria. Australian Journal of Ecology 22, 81-88.
Enright N. J. and Lamont B. B. (1989) Seed banks, fire season, safe sites and seedling
recruitment in five co-occurring Banksia species. Journal of Ecology 77, 1111-
1122.
Facelli J. M., Williams R., Fricker S., and Ladd B. (1999) Establishment and growth of
seedlings of Eucalyptus obliqua: interactive effects of litter, water, and pathogens.
Australian Journal of Ecology 24, 484-494.
278
References.
Faith D. P., Minchin P. R. and Belbin L. (1987) Compositional dissimilarity as a robust
measure of ecological distance: a theoretical model and computer simulations.
Vegetatio 69, 57-68.
Fensham R. J. (1990) Interactive effects of fire frequency and site factors in tropical
Eucalyptus forest. Australian Journal of Ecology 15, 255-266.
Fensham R. J. (1992) The establishment of Eucalypt seedlings in tropical savanna
forest. Northern Territory Naturalist 13, 30-36.
Fensham R. J. (1994) Phytophagous insect-woody sprout interactions in tropical
eucalypt forest. I. Insect herbivory. Australian Journal of Ecology 19, 178-188.
Fensham R. J. and Bowman D.M.J.S. (1992) Stand structure and the influence of
overwood on regeneration in tropical eucalypt forest on Melville Island.
Australian Journal of Botany 40, 335-352.
Fensham R. J. and Holman J. E. (1999) Temporal and spatial patterns in drought-
related tree dieback in Australian savanna. Journal of Applied Ecology 36, 1035-
1050.
Floyd A. G. (1976) Effect of burning on regeneration from seeds in wet sclerophyll
forest. Australian Forestry 39, 210-220.
Fordyce I. R., Eamus D., Duff G. A. and Williams R. J. (1997) The role of seedling age
and size in the recovery of Allosyncarpia ternata following fire. Australian
Journal of Ecology 22, 262-269.
Franklin D. C. and Noske R. A. (2000) Nectar sources used by birds in monsoonal
north-western Australia: a regional survey. Australian Journal of Botany 48, 461-
474.
Free R. A. (1951) Germination and emergence of eucalypt seed when sown at depth.
Australian Forestry 15, 115-119.
Gill A. M. (1975) Fire and the Australian flora: a review. Australian Forestry 38, 4-25.
279
References.
Gill A. M. (1981) Adaptive responses of Australian vascular plant species to fires. In:
Fire and the Australian Biota. (eds A. M. Gill, R. H. Groves and I. R. Noble) pp.
243-272. Australian Academy of Science, Canberra.
Gill A. M. (1997) Eucalypts and fires: interdependent or independent? In: Eucalypt
ecology: individuals to ecosystems. (eds J. E. Williams and J. C. Z. Woinarski)
pp. 151-167. Cambridge University Press, Cambridge.
Gill A. M. and Bradstock R. A. (1992) A national register for the fire responses of plant
species. Cunninghamia 2, 653-660.
Gill A. M., Hoare J. R. L. and Cheney N. P. (1990) Fires and their effects in the Wet-
Dry Tropics of Australia. In: Fire in the Tropical Biota: Ecosystems, Processes
and Global Changes. (ed. J. G. Goldammer) pp. 159-178. Springer – Verlag,
Berlin.
Gill A. M. and Knight I. K. (1991) Fire measurements. In: Proceedings of the
Conference on Bushfire Modelling and Fire Danger Ratings Systems. (eds N. P.
Cheney and A. M. Gill) pp.137-146. CSIRO, Canberra.
Gill A. M., Moore P. H. R. and Williams R. J. (1996) Fire weather in the wet-dry
tropics of the World Heritage Kakadu National Park, Australia. Australian
Journal of Ecology 21, 302-308.
Gill A. M., Ryan P. G., Moore P. H. R. and Gibson M. (2000) Fire regimes of World
Heritage Kakadu National Park, Australia. Austral Ecology 25, 616-625.
Gilmour C. A., Crowden R. K. and Koutoulis A. (2000) Heat shock, smoke and
darkness: partner cues in promoting seed germination in Epacris tasmanica
(Epacridaceae). Australian Journal of Botany 48, 603-609.
Grant C. D., Loneragan W. A., Koch J. M. and Bell D. T. (1997) Fuel characteristics,
vegetation structure and fire behaviour of 11 - 15 year-old rehabilitated bauxite
mines in Western Australia. Australian Forestry 60, 147-157.
Green R. H. (1993) Application of repeated measures designs in environmental impact
and monitoring studies. Australian Journal of Ecology 18, 81-98.
280
References.
Grice A. C. (1996) Seed production, dispersal and germination in Cryptostegia
grandiflora and Ziziphus mauritiana, two invasive shrubs in tropical woodlands
of northern Australia. Australian Journal of Ecology 21, 324-331.
Grice A. C. and Westoby M. (1987) Aspects of the dynamics of the seed-banks and
seedling populations of Acacia victoriae and Cassia spp. in arid western New
South Wales. Australian Journal of Ecology 12, 209-215.
Grubb P. J. (1977) The maintenance of species-richness in plant communities: the
importance of the regeneration niche. Biological Review 52, 107-145.
Guinto D. F., House A. P. N., Xu Z. H. and Saffigna P. G. (1999) Impacts of repeated
fuel reduction burning on tree growth, mortality and recruitment in mixed species
eucalypt forests of southeast Queensland, Australia. Forest Ecology and
Management 115, 13-27.
Hansman D. J. (2001) Floral biology of dry rainforest in north Queensland and a
comparison with adjacent savanna woodland. Australian Journal of Botany 137,
137-153.
Harden G. J. (ed.) (1990) Flora of New South Wales. Vol. 1. New South Wales
University Press, Sydney.
Harper J. L. (1977) Population Biology of Plants. Academic Press, London.
Harrington G. N. and Sanderson K. D. (1994) Recent contraction of wet sclerophyll
forest in the Wet Tropics of Queensland due to invasion by rainforest. Pacific
Conservation Biology 1, 319-327.
Henderson R. J. F. (ed.) (1997) Queensland Plants. Names and Distribution.
Queensland Herbarium, Department of Environment, Brisbane.
Higgins S. I., Bond W. J. and Trollope W. S. W. (2000) Fire, resprouting and
variability: a recipe for grass-tree coexistence in savanna. Journal of Ecology 88,
213-229.
281
References.
Hoare J. R. L., Hooper R. J., Cheney N. P. and Jacobsen K. L. S. (1980) A report on the
effects of fire in tall open forest and woodland with particular reference to fire
management in Kakadu National Park in the Northern Territory. Australian
National Parks and Wildlife Service, Canberra.
Hobbs R. J. and Atkins L. (1990) Fire-related dynamics of a Banksia woodland in
south-western Western Australia. Australian Journal of Botany 38, 97-110.
Hodgkinson K. C. (1991) Shrub recruitment response to intensity and season of fire in a
semi-arid woodland. Journal of Applied Ecology 28, 60-70.
Hodgkinson K. C. and Oxley R. E. (1990) Influence of fire and edaphic factors on
germination of the arid zone shrubs Acacia aneura, Cassia nemophila and
Dodonaea viscosa. Australian Journal of Botany 38, 269-279.
Hoffman W. A. (1996) The effects of fire and cover on seedling establishment in a
neotropical savanna. Journal of Ecology 84, 383-393.
Hoffman W. A. (1998) Post-burn reproduction of woody plants in a neotropical
savanna: the relative importance of sexual and vegetative reproduction. Journal of
Applied Ecology 35, 422-433.
Hopkins M. S., Ash A. J., Graham A. W., Head J., and Hewett R. H. (1993) Charcoal
evidence of the spatial extent of the Eucalyptus woodland expansions and
rainforest contractions in north Queensland during the Pleistocene. Journal of
Biogeography 20, 357-372.
Hopkins M. S. and Graham A. W. (1984) Viable soil seed banks in disturbed lowland
tropical rainforest sites in North Queensland. Australian Journal of Ecology 9, 71-
79.
House S. M. (1997) Reproductive biology of eucalypts. In: Eucalypt ecology:
individuals to ecosystems. (eds J. E. Williams and J. C. Z. Woinarski) pp. 30-55.
Cambridge University Press, Cambridge.
282
References.
Jackson J. and Ash A. J. (1998) Tree-grass relationships in open eucalypt woodlands of
northeastern Australia: influence of trees on pasture productivity, forage quality
and species distribution. Agroforestry Systems 40, 159-176.
Jackson J. and Ash A. J. (2001) The role of trees in enhancing soil nutrient availability
for native perennial grasses in open eucalypt woodlands of north-east Queensland.
Australian Journal of Agricultural Research 52, 377-386.
Jhurree B., Bellairs S. M. and Hetherington S. E. (1998) Germination and dormancy
release of seeds of Australian native understorey species used for mine site
rehabilitation. Seed Science and Technology 26, 587-601.
Keeley J. E. (1977) Seed production, seed populations in soil, and seedling production
after fire for two congeneric pairs of sprouting and nonsprouting chaparral shrubs.
Ecology 58, 820-829.
Keeley J. E. and Bond W. J. (1997) Convergent seed germination in South African
fynbos and Californian chaparral. Plant Ecology 133, 153-167.
Keith D. A. (1996) Fire-driven extinction of plant populations: a synthesis of theory
and review of evidence from Australian vegetation. Proceedings of the Linnean
Society of New South Wales 116, 37-78.
Keith D. A. (1997) Combined effects of heat shock, smoke and darkness on
germination of Epacris stuartii Stapf., an endangered fire-prone Australian shrub.
Oecologia 112, 340-344.
Keith D. A. (2002) Population dynamics of an endangered heathland shrub, Epacris
stuartii (Epacridaceae): Recruitment, establishment and survival. Austral Ecology
27, 67-76.
Keith D. A., McCaw W.L. and Whelan R. J. (2002) Fire regimes in Australian
heathlands and their effects on plants and animals. In: Flammable Australia: the
Fire Regimes and Biodiversity of a Continent. (eds R. A. Bradstock, J. Williams,
and A. M. Gill) pp. 199-237. Cambridge University Press, Cambridge.
283
References.
Kellman M. (1985) Forest seedling establishment in Neotropical savannas: transplant
experiments with Xylopia frutescens and Calophyllum brasiliense. Journal of
Biogeography 12, 373-379.
Kenny B. J. (2000) Influence of multiple fire-related germination cues on three Sydney
Grevillea (Proteaceae) species. Austral Ecology 25, 664-669.
Kershaw A. P., Baird J. G., D'Costa D. M., Edney P. A., Peterson J. A. and Strickland
K. M. (1991) A comparison of the long Quaternary pollen records from the
Atherton and Western Plains volcanic provinces, Australia. In: The Cainozoic in
Australia. A Reappraisal of the Evidence. (eds M. A. J. Williams, P. De Decker,
and A. P. Kershaw) pp. 288-301. Geographical Society of Australia, Sydney.
Kruger L. M., Midgley J. J., and Cowling R. M. (1997) Resprouters vs reseeders in
South African forest trees; a model based on forest canopy height. Functional
Ecology 11, 101-105.
Lacey C. J. (1974) Rhizomes in tropical Eucalypts and their role in recovery from fire
damage. Australian Journal of Botany 22, 29-38.
Lacey C. J. and Whelan P. I. (1976) Observations on the ecological significance of
vegetative reproduction in the Katherine-Darwin region of the Northern Territory.
Australian Forestry 39, 131-139.
Lamb D., Landsberg J. and Foot P. (1989) Effect of prescribed burning on nutrient
cycling in Eucalyptus maculata forest. In: Fire Research in Rural Queensland.
Selected papers from the Queensland fire research workshop series 1980 – 1989.
(ed. B. R. Roberts) pp. 502-506. University of Southern Queensland,
Toowoomba.
Lamont B. B., Le Maitre D. C., Cowling R. M. and Enright N. J. (1991) Canopy
storage in woody plants. The Botanical Review 57, 277-317.
Lamont B. B., Witkowski E. T. F. and Enright N. J. (1993) Post-fire litter microsites:
safe for seeds, unsafe for seedlings. Ecology 74, 501-512.
284
References.
Lloyd M. V., Dixon K. W. and Sivasithamparam K. (2000) Comparative effects of
different smoke treatments on germination of Australian native plants. Austral
Ecology 25, 610-615.
Lonsdale W. M. and Braithwaite R. W. (1991) Assessing the effects of fire on
vegetation in tropical savannas. Australian Journal of Ecology 16, 363-374.
Lonsdale W. M., Braithwaite R. W., Lane A. M. and Farmer J. (1998) Modelling the
recovery of an annual savanna grass following a fire-induced crash. Australian
Journal of Ecology 23, 509-513.
Lunt I. D. (1997) Germinable soil seed banks of anthropogenic native grasslands and
grassy forest remnants in temperate south-eastern Australia. Plant Ecology 130,
21-34.
Martin R. E. and Cushwa C. T. (1966) Effects of heat and moisture on leguminous
seed. Proceedings of the Annual Tall Timbers Fire Ecology Conference 5, 159-
175.
Martin R. E., Miller R. L. and Cushwa C. T. (1975) Germination response of legume
seeds subjected to moist and dry heat. Ecology 56, 1441-1445.
McArdle B. (2001) Multivariate Analysis: a Practical Guide for Biologists. University
of Auckland, Auckland.
McIvor J. G. (1987) Changes in germinable seed levels in soil beneath pastures near
Townsville, North Queensland. Australian Journal of Experimental Agriculture
27, 282-289.
McIvor J. G. and Gardener C. J. (1985) Germination of introduced pasture species in
the semi-arid tropics. In: Ecology and Management of the World's Savannas. (eds
J. C. Tothill and J. J. Mott) pp. 277-279. Australian Academy of Science,
Canberra.
McIvor J. G. and Howden S. M. (2000) Dormancy and germination characteristics of
herbaceous species in the seasonally dry tropics of northern Australia. Austral
Ecology 25, 213-222.
285
References.
McIvor J. G., Jones R. M. and Taylor J. A. (1993) Tropical pasture establishment. 4.
Population dynamics of sown species in developing pastures. Tropical
Grasslands 27, 302-313.
Melzer R. (1996) The influence of canopy cover and grazing on soil seed-banks in
savanna communities in subtropical south-east Queensland. PhD thesis,
University of Queensland, Brisbane.
Midgley J. J. and Bond W. J. (2001) A synthesis of the demography of African acacias.
Journal of Tropical Ecology 17, 871-886.
Midgley J. J. and Cowling R. M. (1993) Regeneration patterns in Cape subtropical
transitional thicket - where are all the seedlings? South African Journal of Botany
59, 496-499.
Moore R. P. (1985) Handbook on Tetrazolium Testing. The International Seed Testing
Association, Zurich.
Mordelet P., Cook G., Abbadie L., Grably M. and Mariotti A. (2002) Natural 15N
abundance of vegetation and soil in the Kapalga savanna, Australia. Australian
Journal of Ecology 21, 336-340.
Moreno J. M. and Oechel W. C. (1991) Fire intensity effects on germination of shrubs
and herbs in southern California chaparral. Ecology 72, 193-2004.
Morgan G., Lorimer M., Morrison A. and Dahl T. (2000) The Desert Uplands draft
bioregional conservation strategy. Environmental Protection Agency, Townsville.
Morgan J. W. (1998) Importance of canopy gaps for recruitment of some forbs in
Themeda triandra-dominated grasslands in south-eastern Australia. Australian
Journal of Botany 46, 609-627.
Morgan J. W. and Lunt I. D. (1999) Effects of time-since-fire on the tussock dynamics
of a dominant grass (Themeda triandra) in a temperate Australian grassland.
Biological Conservation 88, 379-386.
286
References.
Morris E. C. (2000) Germination response of seven east Australian Grevillea species
(Proteaceae) to smoke, heat exposure and scarification. Australian Journal of
Botany 48, 179-189.
Morrison D. A., Auld T. D., Rish S., Porter C. and McClay K. (1992) Patterns of testa-
imposed seed dormancy in native Australian legumes. Annals of Botany 70, 157-
163.
Morrison D. A., Cary G. J., Pengelly S. M., Ross D. G., Mullins B. J., Thomas C. R.
and Anderson T. S. (1995) Effects of fire frequency on plant species composition
of sandstone communities in the Sydney region: Inter-fire interval and time-since-
fire. Australian Journal of Ecology 20, 239-247.
Morrison D. A. and Morris E. C. (2000) Pseudoreplication in experimental designs for
the manipulation of seed germination treatments. Austral Ecology 25, 292-296.
Mott J. J. (1978) Dormancy and germination in five native grass species from savannah
woodland communities of the Northern Territory. Australian Journal of Botany
26, 621-631.
Mott J. J. and Andrew M. H. (1985) The effect of fire on the population dynamics of
native grasses in tropical savannas of north-west Australia. Proceedings of the
Ecological Society of Australia 13, 231-239.
Mott J. J., Williams J. and Andrew M. H. (1985) Australian savanna ecosystems. In:
Ecology and Management of the World's Savannas. (eds J. C. Tothill and J. J.
Mott) pp. 56-82. Australian Academy of Science, Canberra.
Mucha S. B. (1979) Estimation of tree ages from growth rings of eucalypts in northern
Australia. Australian Forestry 42, 13-16.
Murray B. R. (1998) Density-dependent germination and the role of seed leachate.
Australian Journal of Ecology 23, 411-418.
Mustart P. J. and Cowling R. M. (1993) The role of regeneration strategies in the
distribution of edaphically restricted fynbos Proteaceae. Ecology 74, 1490-1499.
287
References.
Noble I. R. (1980) Interactions between tussock grass (Poa spp.) and Eucalyptus
pauciflora seedlings near the tree line in south-eastern Australia. Oecologia 45,
350-353.
Noble I. R. and Slatyer R. O. (1980) The use of vital attributes to predict successional
changes in plant communities subject to recurrent disturbances. Vegetatio 43, 5-
21.
Noble J. C. (1989) Fire regimes and their influence on herbage and mallee coppice
dynamics. In: Mediterranean Landscapes in Australia. Mallee ecosystems and
their management. (eds J. C. Noble and R. A. Bradstock) pp. 168-180. CSIRO,
Melbourne.
Norman M. J. T. (1963) The short term effects of time and frequency of burning on
native pastures at Katherine, N. T. Australian Journal of Experimental
Agriculture and Animal Husbandry 3, 26-29.
Odgers B. M. (1996) Fire, buried germinable seed banks and grass species
establishment in an urban eucalypt forest reserve. Australian Journal of Botany
44, 413-419.
Odgers B. M. (1999) Seasonal variation in buried germinable seed banks of grass
species in an urban Eucalypt forest reserve. Australian Journal of Botany 47, 623-
638.
Orr D. M., McKeon G. M. and Day K. A. (1991) Burning and exclosure can
rehabilitate degraded black speargrass (Heteropogon contortus) pastures. Tropical
Grasslands 25, 333-336.
Paine A. G. L. and Smith J. (1972) Geology and Minerals of the Burdekin-Townsville
Region. Geographic section, Department of Development, Canberra.
Pannell J. R. and Myerscough P. J. (1993) Canopy-stored seed banks of Allocasuarina
distyla and A. nana in relation to time since fire. Australian Journal of Botany 41,
1-9.
288
References.
Pate J. S., Casson N. E., Rullo J. and Kuo J. (1985) Biology of fire ephemerals of the
sandplains of the Kwongan of south-western Australia. Australian Journal of
Plant Physiology 12, 641-655.
Pate J. S., Froend R. H., Bowen B. J., Hansen A. and Kuo J. (1990) Seedling growth
and storage characteristics of seeder and resprouter species of mediterranean-type
ecosystems of S. W. Australia. Annals of Botany 65, 585-601.
Pettit N. E. and Froend R. H. (2001) Availability of seed for recruitment of riparian
vegetation: a comparison of a tropical and a temperate river ecosystem in
Australia. Australian Journal of Botany 49, 515-528.
Phelps D. (2001) Burning to control feathertop wiregrass. In: Savanna burning.
Understanding and using fire in northern Australia. (eds R. Dyer, P. Jacklyn, I.
Partridge, J. Russell-Smith, and R. Williams) p. 55. Tropical Savannas CRC,
Darwin.
Pierce S. M. and Cowling R. M. (1991) Dynamics of soil-stored seed banks of six
shrubs in fire-prone dune fynbos. Journal of Ecology 79, 731-747.
Pressland A. J., Scanlan J. C. and McLennan S. (1989) The role of fire in the grazing
lands of Queensland. In: Fire Research in Rural Queensland. Selected papers
from the Queensland fire research workshop series 1980 – 1989. (ed. B. R.
Roberts) pp. 237-250. University of Southern Queensland, Toowoomba.
Price O. and Bowman D.M.J.S. (1994) Fire-stick forestry: a matrix model in support of
skilful fire management of Callitris intratropica R. T. Baker by north Australian
Aborigines. Journal of Biogeography 21, 573-580.
Pryor L. D., Eamus D. and Duff G. A. (1997) Seasonal and diurnal patterns of carbon
assimilation, stomatal conductance and leaf water potential in Eucalyptus
tetradonta saplings in a wet-dry savanna in northern Australia. Australian Journal
of Botany 45, 241-258.
289
References.
Purdie R. W. (1977) Early stages of regeneration after burning in dry sclerophyll
vegetation. II. Regeneration by seed germination. Australian Journal of Botany
25, 35-46.
Purdie R. W. and Slatyer R. O. (1976) Vegetation succession after fire in sclerophyll
woodland communities in south-eastrn Australia. Australian Journal of Ecology
1, 223-236.
Puyravaud J. P., Shridhar D., Gaulier A., Aravajy S. and Ramalingam S. (1995) Impact
of fire on a dry deciduous forest in the Bandipur National Park, southern India:
Preliminary assessment and the implications for management. Current Science
68, 745-751.
Read T. R., Bellairs S. M., Mulligan D. R. and Lamb D. (2000) Smoke and heat effects
on soil seed bank germination for the re-establishment of a native forest
community in New South Wales. Austral Ecology 25, 48-57.
Roberts H. A. (1981) Seed banks in soils. Advances in Applied Biology 6, 1-55.
Roche S., Dixon K. W. and Pate J. S. (1997) Seed aging and smoke: partner cues in the
amelioration of seed dormancy in selected Australian native species. Australian
Journal of Botany 45, 783-815.
Roche S., Dixon K. W. and Pate J. S. (1998) For everything a season: Smoke-induced
seed germination and seedling recruitment in a Western Australian Banksia
woodland. Australian Journal of Ecology 23, 111-120.
Rogers R. W. (2000) Weeds in the germinable seed populations from the Heron Island
National Park, Great Barrier Reef. Proceedings of the Royal Society of
Queensland 109, 131-134.
Russell-Smith J., Hoare J. R. L., Whitehead P. J., Cook G. D. and Brooks K. (in press)
Response of Eucalyptus open-forest and woodland savanna to four experimental
fire regimes, 1973-1996, at Munmarlary, Monsoonal Northern Australia. in press.
290
References.
Russell-Smith J., Ryan P. G. and Cheal D. C. (2002) Fire regimes and the conservation
of sandstone heath in monsoonal northern Australia: frequency, interval,
patchiness. Biological Conservation 104, 91-106.
Russell-Smith J., Ryan P. G. and Durieu R. (1997) A LANDSAT MSS-derived fire
history of Kakadu National Park, monsoonal northern Australia, 1980-94:
seasonal extent, frequency and patchiness. Journal of Applied Ecology 34, 748-
766.
Russell-Smith J., Ryan P. G., Klessa D., Waight G., and Harwood R. (1998) Fire
regimes, fire-sensitive vegetation and fire management of the sandstone Arnhem
Plateau, monsoonal northern Australia. Journal of Applied Ecology 35, 829-846.
Russell-Smith J. and Stanton P. (2002) Fire regimes and fire management of rainforest
communities across northern Australia. In: Flammable Australia: the Fire
Regimes and Biodiversity of a Continent. (eds R. A. Bradstock, J. Williams and
A. M. Gill) pp. 329-350. Cambridge University Press, Cambridge.
Sandercoe C. S. (1988) An aerial photographic study of the long-term effect of
wildfires on Magnetic Island. Proceedings of the Ecological Society of Australia
15, 161-165.
Sandercoe C. S. (1989) Towards a fire management strategy for Magnetic Island. In:
Fire Research in Rural Queensland. Selected papers from the Queensland fire
research workshop series 1980 – 1989. (ed. B. R. Roberts) pp. 439-453.
University of Southern Queensland, Toowoomba.
Scholes R. J. and Archer S. R. (1997) Tree-grass interactions in savannas. Annual
Review of Ecology and Systematics 28, 517-544.
Setterfield S. A. and Williams R. J. (1996) Patterns of flowering and seed production in
Eucalyptus miniata and E. tetradonta in a tropical savanna woodland, northern
Australia. Australian Journal of Botany 44, 107-122.
291
References.
Setterfield S. A. (1997a) The impact of experimental fire regimes on seed production in
two tropical eucalypt species in northern Australia. Australian Journal of Ecology
22, 279-287.
Setterfield S. A. (1997b) Factors affecting seedling regeneration of woody species in a
northern Australian tropical savanna. PhD thesis, Northern Territory University,
Darwin.
Shaw N. H. (1957) Bunch spear grass dominance in burnt pastures in south-eastern
Queensland. Australian Journal of Agricultural Research 8, 325-334.
Shea S. R., McCormick J. and Portlock C. C. (1979) The effect of fires on the
regeneration of leguminous species in the northern jarrah (Eucalyptus marginata
Sm.) forest of Western Australia. Australian Journal of Ecology 4, 195-205.
Skowno A. L., Midgley J. J., Bond W. J. and Balfour D. (1999) Secondary succession
in Acacia nilotica (L.) savanna in the Hluhluwe Game Reserve, South Africa.
Plant Ecology 145, 1-9.
Skull S. D. (1992) Fire-related aspects of succession in tropical lowland forests. In:
Fifth Queensland Fire Research Workshop. (eds B. R. Roberts and M. Schulz) pp.
87-101. University of Southern Queensland, Toowoomba.
Smith M. A., Loneragan W. A., Grant C. D. and Koch J. M. (2000) Effect of fire on the
topsoil seed banks of rehabilitated bauxite mine sites in the jarrah forest of
Western Australia. Ecological Management and Restoration 1, 50-60.
Sokal R. R. and Rohlf F. J. (1995) Biometry: the Principles and Practice of Statistics in
Biological Research. W. H. Freeman and Company, New York.
Stanton P. and Roeger L. (2001) Monitoring vegetation change. In: Savanna Burning.
Understanding and using fire in northern Australia. (eds R. Dyer, P. Jacklyn, I.
Partridge, J. Russell-Smith, and R. Williams) p. 106. Tropical Savannas CRC,
Darwin.
StatSoft (1999) STATISTICA for windows. StatSoft, Tulsa.
292
References.
Stocker G. C. and Sturtz J. D. (1966) The use of fire to establish Townsville lucerne in
the Northern Territory. Australian Journal of Experimental Agriculture and
Animal Husbandry 3, 277-279.
Stoneman G. L. and Dell B. (1994) Emergence of Eucalyptus marginata (jarrah) from
seed in Mediterranean-climate forest in response to overstorey, site, seedbed and
seed harvesting. Australian Journal of Ecology 19, 96-102.
Stoneman G. L., Dell B. and Turner N. C. (1994) Mortality of Eucalyptus marginata
(jarrah) seedlings in Mediterranean-climate forest in response to overstorey, site,
seedbad, fertilizer appilication and grazing. Australian Journal of Ecology 19,
103-109.
Tainton N. M. (ed.) (1981) Veld and Pasture Management in South Africa. Shuter and
Shooter, Natal.
Ter Braak C. J. F. and Prentice I. C. (1988) A theory of gradient analysis. Advances in
Ecological Research 18, 93-138.
Ter Braak C. J. F. and Smilauer P. (1998) CANOCO Reference Manual and User's
Guide to Canoco for Windows: Software for Canonical Community Ordination
(version 4). Microcomputer Power, New York.
Ter Braak C. J. F. and Wiertz J. (1994) On the statistical analysis of vegetation change:
a wetland affected by water extraction and soil acidification. Journal of
Vegetation Science 5, 361-372.
Thanos C. A. and Rundel P. W. (1995) Fire-followers in chaparral: nitrogenous
compounds trigger seed germination. Journal of Ecology 83, 207-216.
Thompson K. and Grime J. P. (1979) Seasonal variation in the seed banks of
herbaceous species in ten contrasting habitats. Journal of Ecology 67, 893-921.
Tothill J. C. (1969) Soil temperatures and seed burial in relation to the performance of
Heteropogon contortus and Themeda australis in burnt native woodland pastures
in eastern Queensland. Australian Journal of Botany 17, 269-275.
293
References.
Tothill J. C. (1977) Flowering phenology of some native perennial tropical grasses
from north-eastern Australia. Australian Journal of Ecology 2, 199-205.
Tozer M. G. and Bradstock R. A. (1997) Factors influencing the establishment of
seedlings of the mallee, Eucalyptus luehmanniana (Myrtaceae). Australian
Journal of Botany 45, 997-1008.
Trapnell C. G. (1959) Ecological results of woodland burning experiments in northern
Rhodesia. Journal of Ecology 47, 129-165.
Trollope W. S. W. (1982) Ecological effects of fire in South African savannas. In:
Ecology of Tropical Savannas. (eds B. J. Huntley and B. H. Walker) pp. 292-306.
Springer-Verlag, Berlin.
Trollope W. S. W. (1996) Behaviour, effect and use of fire in the savanna areas of
southern Africa. In: Fire in the management of northern Australian pastoral
lands. (eds A. C. Grice and S. M. Slatter). Tropical Grasslands Society,
Townsville.
Underwood A. J. (1997) Experiments in ecology: their logical design and
interpretation using analysis of variance. Cambridge University Press,
Cambridge.
van der Moezel P. G., Loneragan W. A. and Bell D. T. (1987) Northern sandplain
kwongan: regeneration following fire, juvenile period and flowering phenology.
Journal of the Royal Society of Western Australia 69, 123-132.
Van Rensberg S. J., Stock, W. D. and Bond W. J. (1999) Ecological significance of
ecotypic variation in Themeda triandra Forssk. In: People and Rangelands
Building the Future. Proceedings of the VI International Rangelands Congress.
Vol. 2. (eds D. Eldridge and D. Freudenberger) pp. 938-939. VI International
Rangelands Congress, Townsville.
Vaughton G. (1998) Soil seed bank dynamics in the rare obligate seeding shrub,
Grevillea barklyana (Proteaceae). Australian Journal of Ecology 23, 375-384.
294
References.
Vlahos S. and Bell D. T. (1986) Soil seed-bank components of the northern jarrah
forest of Western Australia. Australian Journal of Ecology 11, 171-179.
Wahren C-H. A., Papst W. A. and Williams R. J. (1999) Post-fire regeneration in
Victorian alpine and sub-alpine vegetation. In: Bushfire 1999. Proceedings of the
Australian Bushfire Conference. (eds B. Lord, M. Gill and R. Bradstock) pp. 425-
430. Charles Sturt University, Albury.
Walker B. H. (1985) Structure and function of savannas: an overview. In: Ecology and
Management of the World's Savannas. (eds J. C. Tothill and J. J. Mott) pp. 83-91.
Australian Academy of Science, Canberra.
Walker J. (1981) Fuel dynamics in Australian vegetation. In: Fire and the Australian
Biota. (eds A. M. Gill, R. H. Groves, and I. R. Noble) pp. 101-127. Australian
Academy of Science, Canberra.
Walker J., Malafant K. and Edwards J. (1989) The effects of fire on a Themeda-
Heteropogon grassland near Rockhampton. In: Fire Research in Rural
Queensland. Selected papers from the Queensland fire research workshop series
1980 – 1989. (ed. B. R. Roberts) pp. 280-287. University of Southern
Queensland, Toowoomba.
Wang L. (1997) The soil seed bank and understorey regeneration in Eucalyptus
regnans forest, Victoria. Australian Journal of Ecology 22, 404-411.
Warcup J. H. (1980) Effect of heat treatment of forest soil on germination of buried
seed. Australian Journal of Botany 28, 567-571.
Watkinson A. R., Lonsdale W. M. and Andrew M. H. (1989) Modelling the population
dynamics of an annual plant Sorghum intrans in the wet-dry tropics. Journal of
Ecology 77, 162-181.
Wellington A. B. (1989) Seedling regeneration and the population dynamics of
eucalypts. In: Mediterranean Landscapes in Australia. Mallee ecosystems and
their management. (eds J. C. Noble and R. A. Bradstock) pp. 155-167. CSIRO,
Melbourne.
295
References.
Whelan R. J. (1986) Seed dispersal in relation to fire. In: Seed Dispersal. (ed. D. R.
Murray) pp. 237-271. Academic Press, Sydney.
Whelan R. J. (1995) The Ecology of Fire. Cambridge University Press, Cambridge.
Whelan R. J. and Main A. R. (1979) Insect grazing and post-fire plant succession in
south-west Australian woodland. Australian Journal of Ecology 4, 387-398.
Whelan R. J., Rogers R. W., Dickman C. R. and Sutherland E. F. (2002) Critical life
cycles of plants and animals: developing a process-based understanding of
population changes in fire-prone landscapes. In: Flammable Australia: the Fire
Regimes and Biodiversity of a Continent. (eds R. A. Bradstock, J. Williams, and
A. M. Gill) pp. 94-124. Cambridge University Press, Cambridge.
Williams P. R. (1995) Floristic patterns within and between sedge-heath swamps of
Gibraltar Range National Park, New South Wales. BSc (Hons) thesis, University
of New England, Armidale.
Williams P. R. (1998) Post fire regeneration of tree seedlings in a revegetation site at
Townsville, north Queensland. Proceedings of the Royal Society of Queensland
107, 89-92.
Williams P. R. (2000) Fire-stimulated rainforest seedling recruitment and vegetative
regeneration in a densely grassed wet sclerophyll forest of north-eastern Australia.
Australian Journal of Botany 48, 651-658.
Williams P. R. (2001) Contrasts in post-fire regeneration and management of three
eucalypt habitats in tropical Queensland, north-eastern Australia. In: Bushfire
2001 Proceedings. (eds G. Pearce and L. Lester) pp. 280-284. 2001. New Zealand
Forest Research Institute, Christchurch.
Williams P. R., Cumming R. J. and Ball D. (2002b) Post-fire regeneration of eucalypt
savanna flora at Lawn Hill National Park, north western Queensland. Ecological
Management and Restoration 3, 61-63.
296
References.
Williams R. J., Cook G. D., Gill A. M. and Moore P. H. R. (1999b) Fire regime, fire
intensity and tree survival in a tropical savanna in northern Australia. Australian
Journal of Ecology 24, 50-59.
Williams R. J., Griffiths A. D. and Allan G. E. (2002a) Fire regimes and biodiversity in
the savannas of northern Australia. In: Flammable Australia: the Fire Regimes
and Biodiversity of a Continent. (eds R. A. Bradstock, J. Williams, and A. M.
Gill) pp. 281-304. Cambridge University Press, Cambridge.
Williams R. J. and Lane A. M. (1999) Wet season burning as a fuel management tool in
wet-dry tropical savannas: applications at Ranger Mine, Northern Territory,
Australia. In: People and Rangelands Building the Future. Proceedings of the VI
International Rangelands Congress. Vol. 2. (eds D. Eldridge and D.
Freudenberger) pp. 972-977. VI International Rangelands Congress, Townsville.
Williams R. J., Myers B. A., Muller W. J., Duff G. A. and Eamus D. (1997) Leaf
phenology of woody species in a north Australian tropical savanna. Ecology 78,
2542-2558.
Williams R. J., Myers B. A., Eamus D. and Duff G. A. (1999a) Reproductive
phenology of woody species in a north Australian tropical savanna. Biotropica 31,
626-636.
Williams R. J., Muller W. J., Wahren C.-H. and Setterfield S. A. (in press) Vegetation.
In: Kapalga. in press.
Wilson B. A. and Bowman D.M.J.S. (1987) Fire, storm, flood and drought: The
vegetation ecology of Howards Peninsula. Northern Territory, Australia.
Australian Journal of Ecology 12, 165-174.
Withers J. R. (1978) Studies on the status of unburnt Eucalyptus woodland at Ocean
Grove, Victoria. II. The differential seedling establishment of Eucalyptus ovata
Labill. and Casuarina littoralis Salisb. Australian Journal of Botany 26, 465-483.
Witkowski E. T. F., Lamont, B. B. and Connell S. J. (1991) Seed bank dynamics of
three co-occurring Banksias in south coastal Western Australia: the role of plant
297
References.
298
age, cockatoos, senescence and interfire establishment. Australian Journal of
Botany 39, 385-397.
Woinarski J. C. Z. (1990) Effects of fire on the bird communities of tropical woodlands
and open forests in northern Australia. Australian Journal of Ecology 15, 1-22.
Woinarski J. C. Z. (1999) Prognosis and framework for the conservation of biodiversity
in rangelands: building on the north Australian experience. In: People and
Rangelands Building the Future. Proceedings of the VI International Rangelands
Congress. Vol. 2. (eds D. Eldridge and D. Freudenberger) pp. 639-645. VI
International Rangelands Congress, Townsville.
Woinarski J. C. Z. and Fisher A. (1995) Wildlife of lancewood (Acacia shirleyi)
thickets and woodlands in northern Australia. 1. Variation in vertebrate species
composition across the environmental range occupied by lancewood vegetation in
the northern Territory. Wildlife Research 22, 379-411.
Zammit C. A. and Zedler P. H. (1988) The influence of dominant shrubs, fire, and time
since fire on soil seed banks in mixed chaparral. Vegetatio 75, 175-187.
Zar J. H. (1999) Biostatistical Analysis. Prentice-Hall, Englewood Cliffs, N. J.
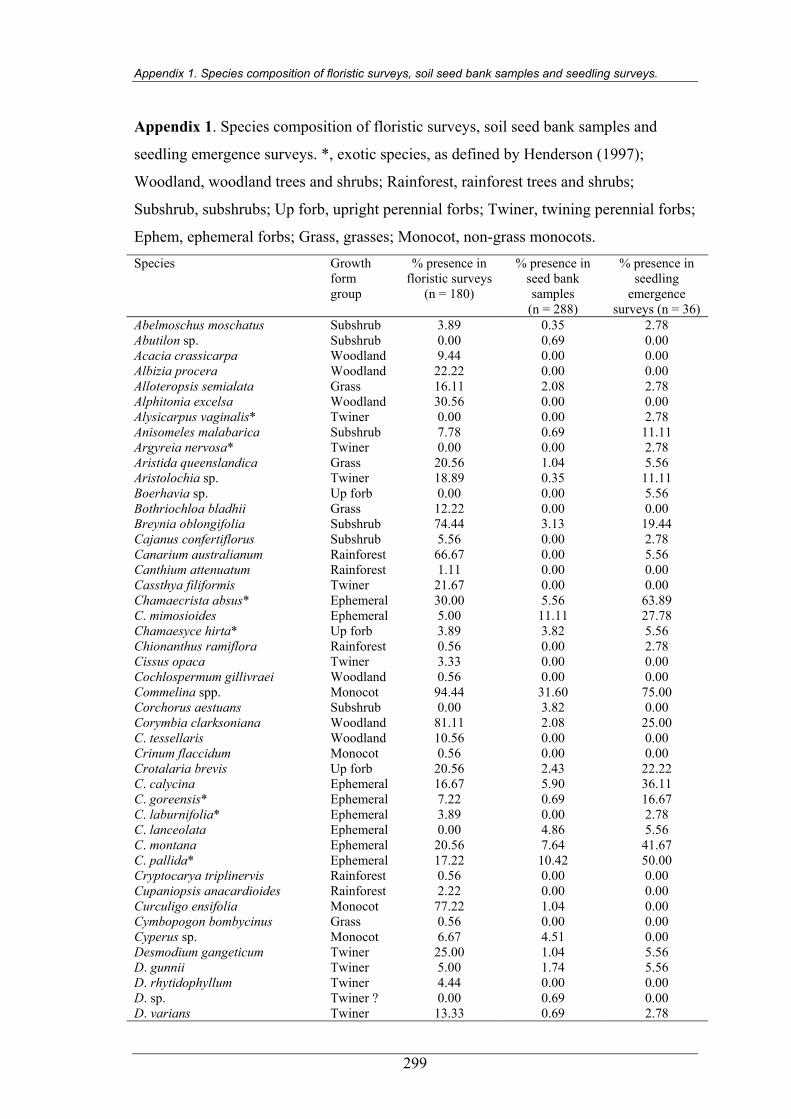
Appendix 1. Species composition of floristic surveys, soil seed bank samples and seedling surveys.
Appendix 1. Species composition of floristic surveys, soil seed bank samples and
seedling emergence surveys. *, exotic species, as defined by Henderson (1997);
Woodland, woodland trees and shrubs; Rainforest, rainforest trees and shrubs;
Subshrub, subshrubs; Up forb, upright perennial forbs; Twiner, twining perennial forbs;
Ephem, ephemeral forbs; Grass, grasses; Monocot, non-grass monocots. Species Growth
form group
% presence in floristic surveys
(n = 180)
% presence in seed bank samples
(n = 288)
% presence in seedling
emergence surveys (n = 36)
Abelmoschus moschatus Subshrub 3.89 0.35 2.78 Abutilon sp. Subshrub 0.00 0.69 0.00 Acacia crassicarpa Woodland 9.44 0.00 0.00 Albizia procera Woodland 22.22 0.00 0.00 Alloteropsis semialata Grass 16.11 2.08 2.78 Alphitonia excelsa Woodland 30.56 0.00 0.00 Alysicarpus vaginalis* Twiner 0.00 0.00 2.78 Anisomeles malabarica Subshrub 7.78 0.69 11.11 Argyreia nervosa* Twiner 0.00 0.00 2.78 Aristida queenslandica Grass 20.56 1.04 5.56 Aristolochia sp. Twiner 18.89 0.35 11.11 Boerhavia sp. Up forb 0.00 0.00 5.56 Bothriochloa bladhii Grass 12.22 0.00 0.00 Breynia oblongifolia Subshrub 74.44 3.13 19.44 Cajanus confertiflorus Subshrub 5.56 0.00 2.78 Canarium australianum Rainforest 66.67 0.00 5.56 Canthium attenuatum Rainforest 1.11 0.00 0.00 Cassthya filiformis Twiner 21.67 0.00 0.00 Chamaecrista absus* Ephemeral 30.00 5.56 63.89 C. mimosioides Ephemeral 5.00 11.11 27.78 Chamaesyce hirta* Up forb 3.89 3.82 5.56 Chionanthus ramiflora Rainforest 0.56 0.00 2.78 Cissus opaca Twiner 3.33 0.00 0.00 Cochlospermum gillivraei Woodland 0.56 0.00 0.00 Commelina spp. Monocot 94.44 31.60 75.00 Corchorus aestuans Subshrub 0.00 3.82 0.00 Corymbia clarksoniana Woodland 81.11 2.08 25.00 C. tessellaris Woodland 10.56 0.00 0.00 Crinum flaccidum Monocot 0.56 0.00 0.00 Crotalaria brevis Up forb 20.56 2.43 22.22 C. calycina Ephemeral 16.67 5.90 36.11 C. goreensis* Ephemeral 7.22 0.69 16.67 C. laburnifolia* Ephemeral 3.89 0.00 2.78 C. lanceolata Ephemeral 0.00 4.86 5.56 C. montana Ephemeral 20.56 7.64 41.67 C. pallida* Ephemeral 17.22 10.42 50.00 Cryptocarya triplinervis Rainforest 0.56 0.00 0.00 Cupaniopsis anacardioides Rainforest 2.22 0.00 0.00 Curculigo ensifolia Monocot 77.22 1.04 0.00 Cymbopogon bombycinus Grass 0.56 0.00 0.00 Cyperus sp. Monocot 6.67 4.51 0.00 Desmodium gangeticum Twiner 25.00 1.04 5.56 D. gunnii Twiner 5.00 1.74 5.56 D. rhytidophyllum Twiner 4.44 0.00 0.00 D. sp. Twiner ? 0.00 0.69 0.00 D. varians Twiner 13.33 0.69 2.78
299
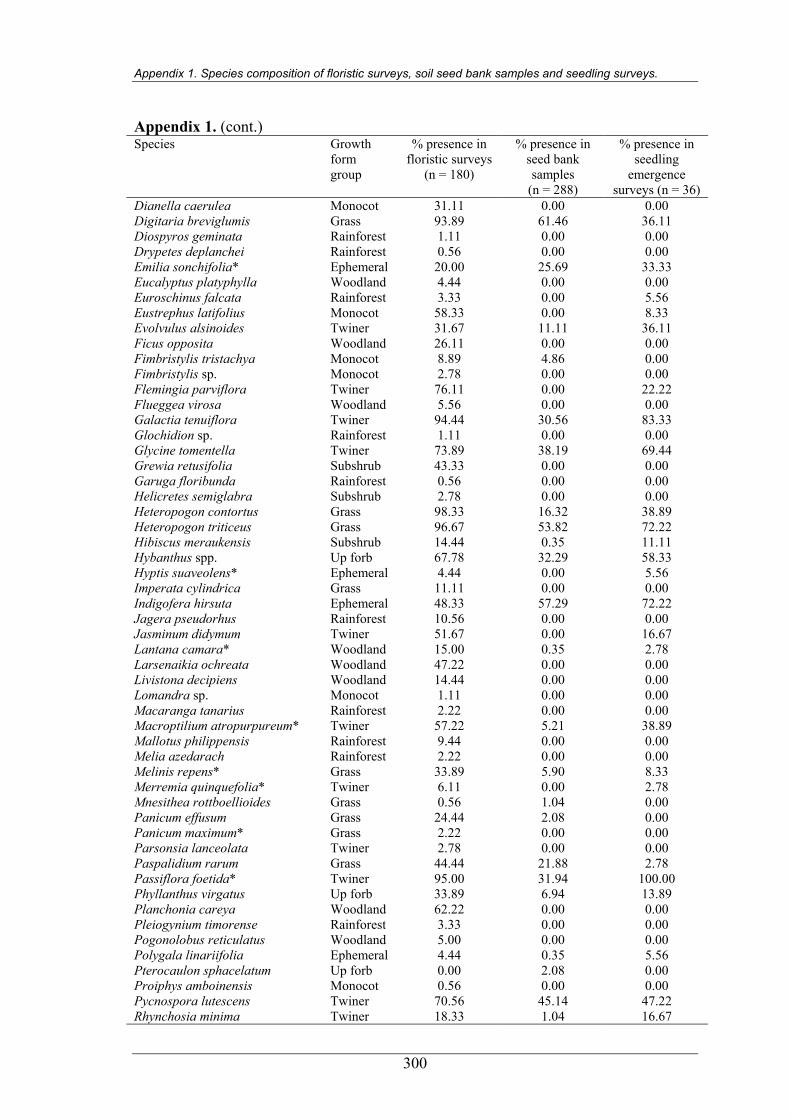
Appendix 1. Species composition of floristic surveys, soil seed bank samples and seedling surveys.
Appendix 1. (cont.) Species Growth
form group
% presence in floristic surveys
(n = 180)
% presence in seed bank samples
(n = 288)
% presence in seedling
emergence surveys (n = 36)
Dianella caerulea Monocot 31.11 0.00 0.00 Digitaria breviglumis Grass 93.89 61.46 36.11 Diospyros geminata Rainforest 1.11 0.00 0.00 Drypetes deplanchei Rainforest 0.56 0.00 0.00 Emilia sonchifolia* Ephemeral 20.00 25.69 33.33 Eucalyptus platyphylla Woodland 4.44 0.00 0.00 Euroschinus falcata Rainforest 3.33 0.00 5.56 Eustrephus latifolius Monocot 58.33 0.00 8.33 Evolvulus alsinoides Twiner 31.67 11.11 36.11 Ficus opposita Woodland 26.11 0.00 0.00 Fimbristylis tristachya Monocot 8.89 4.86 0.00 Fimbristylis sp. Monocot 2.78 0.00 0.00 Flemingia parviflora Twiner 76.11 0.00 22.22 Flueggea virosa Woodland 5.56 0.00 0.00 Galactia tenuiflora Twiner 94.44 30.56 83.33 Glochidion sp. Rainforest 1.11 0.00 0.00 Glycine tomentella Twiner 73.89 38.19 69.44 Grewia retusifolia Subshrub 43.33 0.00 0.00 Garuga floribunda Rainforest 0.56 0.00 0.00 Helicretes semiglabra Subshrub 2.78 0.00 0.00 Heteropogon contortus Grass 98.33 16.32 38.89 Heteropogon triticeus Grass 96.67 53.82 72.22 Hibiscus meraukensis Subshrub 14.44 0.35 11.11 Hybanthus spp. Up forb 67.78 32.29 58.33 Hyptis suaveolens* Ephemeral 4.44 0.00 5.56 Imperata cylindrica Grass 11.11 0.00 0.00 Indigofera hirsuta Ephemeral 48.33 57.29 72.22 Jagera pseudorhus Rainforest 10.56 0.00 0.00 Jasminum didymum Twiner 51.67 0.00 16.67 Lantana camara* Woodland 15.00 0.35 2.78 Larsenaikia ochreata Woodland 47.22 0.00 0.00 Livistona decipiens Woodland 14.44 0.00 0.00 Lomandra sp. Monocot 1.11 0.00 0.00 Macaranga tanarius Rainforest 2.22 0.00 0.00 Macroptilium atropurpureum* Twiner 57.22 5.21 38.89 Mallotus philippensis Rainforest 9.44 0.00 0.00 Melia azedarach Rainforest 2.22 0.00 0.00 Melinis repens* Grass 33.89 5.90 8.33 Merremia quinquefolia* Twiner 6.11 0.00 2.78 Mnesithea rottboellioides Grass 0.56 1.04 0.00 Panicum effusum Grass 24.44 2.08 0.00 Panicum maximum* Grass 2.22 0.00 0.00 Parsonsia lanceolata Twiner 2.78 0.00 0.00 Paspalidium rarum Grass 44.44 21.88 2.78 Passiflora foetida* Twiner 95.00 31.94 100.00 Phyllanthus virgatus Up forb 33.89 6.94 13.89 Planchonia careya Woodland 62.22 0.00 0.00 Pleiogynium timorense Rainforest 3.33 0.00 0.00 Pogonolobus reticulatus Woodland 5.00 0.00 0.00 Polygala linariifolia Ephemeral 4.44 0.35 5.56 Pterocaulon sphacelatum Up forb 0.00 2.08 0.00 Proiphys amboinensis Monocot 0.56 0.00 0.00 Pycnospora lutescens Twiner 70.56 45.14 47.22 Rhynchosia minima Twiner 18.33 1.04 16.67
300
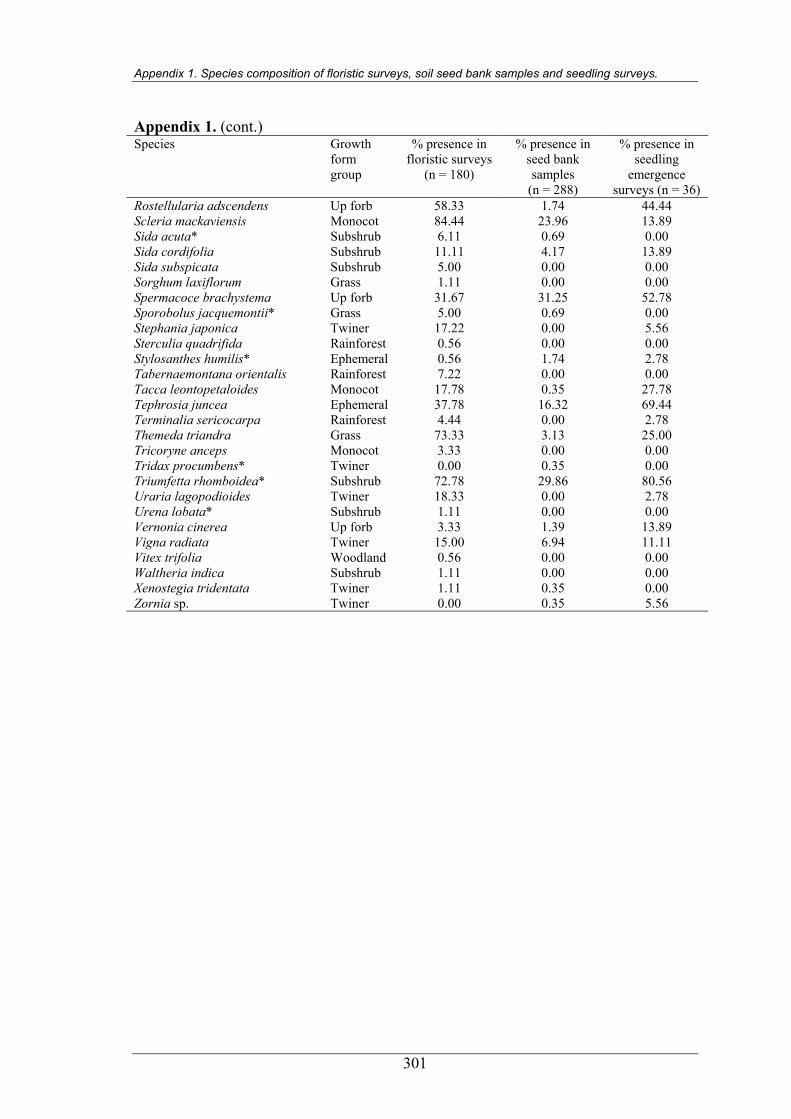
Appendix 1. Species composition of floristic surveys, soil seed bank samples and seedling surveys.
301
Appendix 1. (cont.) Species Growth
form group
% presence in floristic surveys
(n = 180)
% presence in seed bank samples
(n = 288)
% presence in seedling
emergence surveys (n = 36)
Rostellularia adscendens Up forb 58.33 1.74 44.44 Scleria mackaviensis Monocot 84.44 23.96 13.89 Sida acuta* Subshrub 6.11 0.69 0.00 Sida cordifolia Subshrub 11.11 4.17 13.89 Sida subspicata Subshrub 5.00 0.00 0.00 Sorghum laxiflorum Grass 1.11 0.00 0.00 Spermacoce brachystema Up forb 31.67 31.25 52.78 Sporobolus jacquemontii* Grass 5.00 0.69 0.00 Stephania japonica Twiner 17.22 0.00 5.56 Sterculia quadrifida Rainforest 0.56 0.00 0.00 Stylosanthes humilis* Ephemeral 0.56 1.74 2.78 Tabernaemontana orientalis Rainforest 7.22 0.00 0.00 Tacca leontopetaloides Monocot 17.78 0.35 27.78 Tephrosia juncea Ephemeral 37.78 16.32 69.44 Terminalia sericocarpa Rainforest 4.44 0.00 2.78 Themeda triandra Grass 73.33 3.13 25.00 Tricoryne anceps Monocot 3.33 0.00 0.00 Tridax procumbens* Twiner 0.00 0.35 0.00 Triumfetta rhomboidea* Subshrub 72.78 29.86 80.56 Uraria lagopodioides Twiner 18.33 0.00 2.78 Urena lobata* Subshrub 1.11 0.00 0.00 Vernonia cinerea Up forb 3.33 1.39 13.89 Vigna radiata Twiner 15.00 6.94 11.11 Vitex trifolia Woodland 0.56 0.00 0.00 Waltheria indica Subshrub 1.11 0.00 0.00 Xenostegia tridentata Twiner 1.11 0.35 0.00 Zornia sp. Twiner 0.00 0.35 5.56
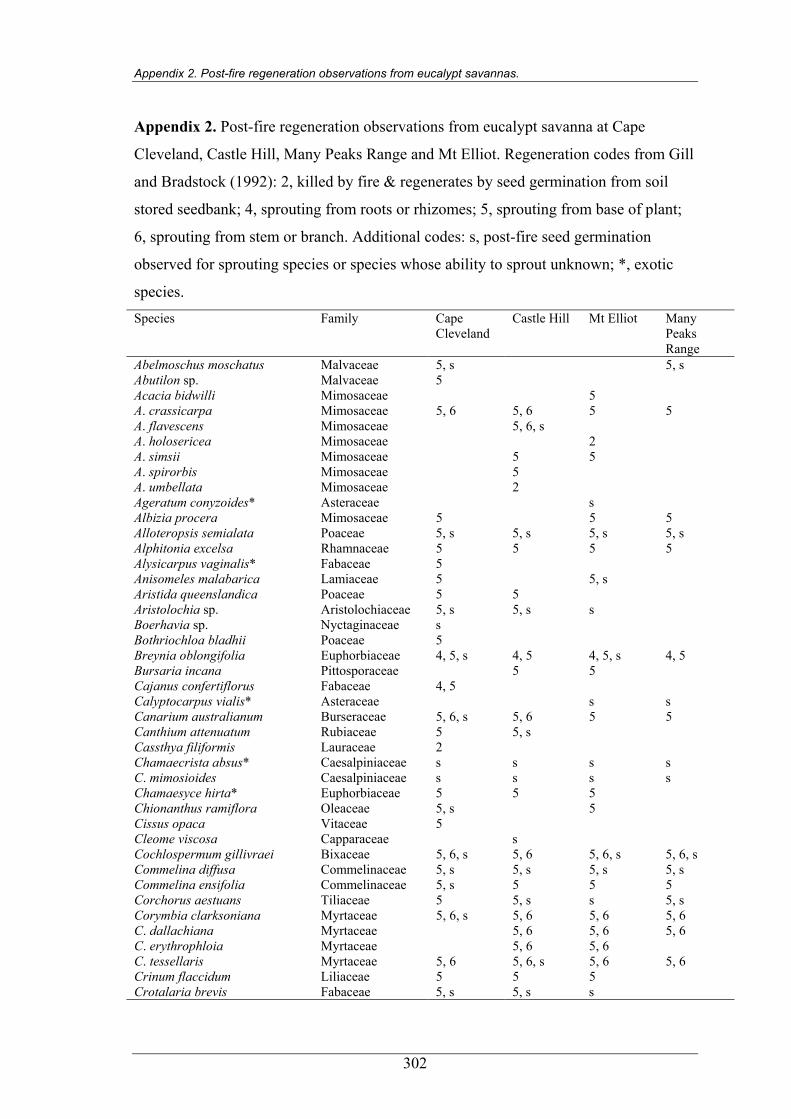
Appendix 2. Post-fire regeneration observations from eucalypt savannas.
Appendix 2. Post-fire regeneration observations from eucalypt savanna at Cape
Cleveland, Castle Hill, Many Peaks Range and Mt Elliot. Regeneration codes from Gill
and Bradstock (1992): 2, killed by fire & regenerates by seed germination from soil
stored seedbank; 4, sprouting from roots or rhizomes; 5, sprouting from base of plant;
6, sprouting from stem or branch. Additional codes: s, post-fire seed germination
observed for sprouting species or species whose ability to sprout unknown; *, exotic
species. Species Family Cape
Cleveland Castle Hill Mt Elliot Many
Peaks Range
Abelmoschus moschatus Malvaceae 5, s 5, s Abutilon sp. Malvaceae 5 Acacia bidwilli Mimosaceae 5 A. crassicarpa Mimosaceae 5, 6 5, 6 5 5 A. flavescens Mimosaceae 5, 6, s A. holosericea Mimosaceae 2 A. simsii Mimosaceae 5 5 A. spirorbis Mimosaceae 5 A. umbellata Mimosaceae 2 Ageratum conyzoides* Asteraceae s Albizia procera Mimosaceae 5 5 5 Alloteropsis semialata Poaceae 5, s 5, s 5, s 5, s Alphitonia excelsa Rhamnaceae 5 5 5 5 Alysicarpus vaginalis* Fabaceae 5 Anisomeles malabarica Lamiaceae 5 5, s Aristida queenslandica Poaceae 5 5 Aristolochia sp. Aristolochiaceae 5, s 5, s s Boerhavia sp. Nyctaginaceae s Bothriochloa bladhii Poaceae 5 Breynia oblongifolia Euphorbiaceae 4, 5, s 4, 5 4, 5, s 4, 5 Bursaria incana Pittosporaceae 5 5 Cajanus confertiflorus Fabaceae 4, 5 Calyptocarpus vialis* Asteraceae s s Canarium australianum Burseraceae 5, 6, s 5, 6 5 5 Canthium attenuatum Rubiaceae 5 5, s Cassthya filiformis Lauraceae 2 Chamaecrista absus* Caesalpiniaceae s s s s C. mimosioides Caesalpiniaceae s s s s Chamaesyce hirta* Euphorbiaceae 5 5 5 Chionanthus ramiflora Oleaceae 5, s 5 Cissus opaca Vitaceae 5 Cleome viscosa Capparaceae s Cochlospermum gillivraei Bixaceae 5, 6, s 5, 6 5, 6, s 5, 6, s Commelina diffusa Commelinaceae 5, s 5, s 5, s 5, s Commelina ensifolia Commelinaceae 5, s 5 5 5 Corchorus aestuans Tiliaceae 5 5, s s 5, s Corymbia clarksoniana Myrtaceae 5, 6, s 5, 6 5, 6 5, 6 C. dallachiana Myrtaceae 5, 6 5, 6 5, 6 C. erythrophloia Myrtaceae 5, 6 5, 6 C. tessellaris Myrtaceae 5, 6 5, 6, s 5, 6 5, 6 Crinum flaccidum Liliaceae 5 5 5 Crotalaria brevis Fabaceae 5, s 5, s s
302
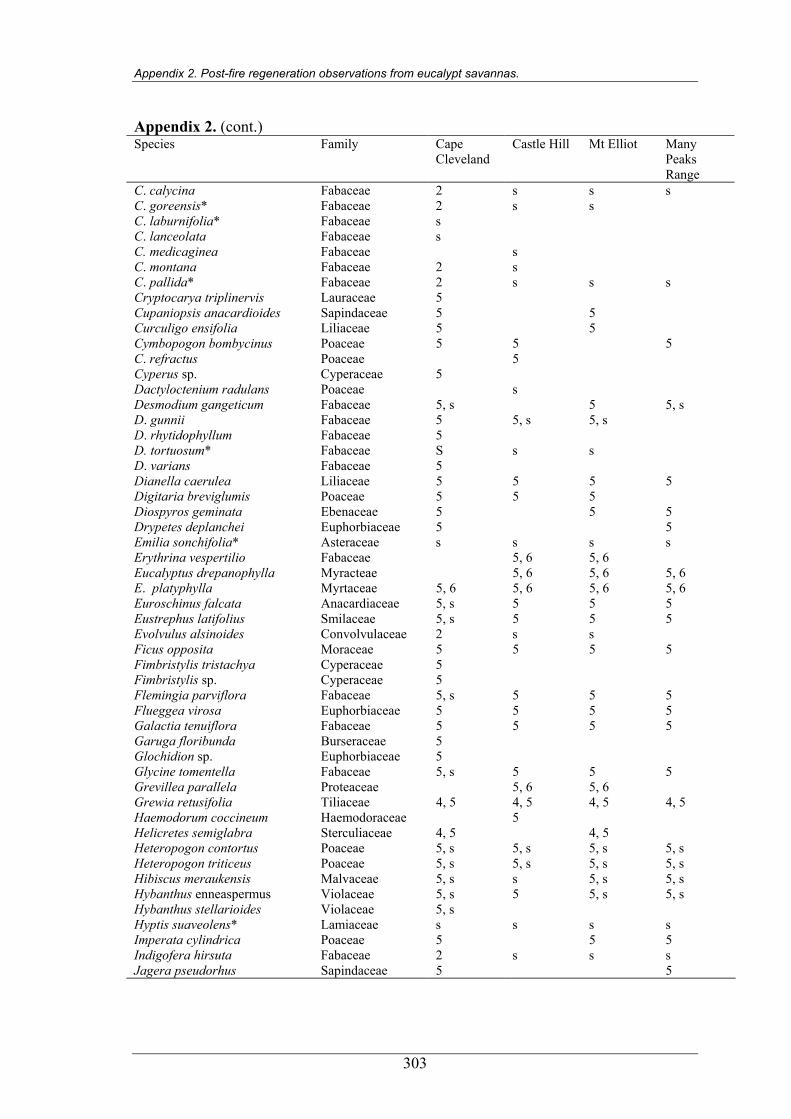
Appendix 2. Post-fire regeneration observations from eucalypt savannas.
Appendix 2. (cont.) Species Family Cape
Cleveland Castle Hill Mt Elliot Many
Peaks Range
C. calycina Fabaceae 2 s s s C. goreensis* Fabaceae 2 s s C. laburnifolia* Fabaceae s C. lanceolata Fabaceae s C. medicaginea Fabaceae s C. montana Fabaceae 2 s C. pallida* Fabaceae 2 s s s Cryptocarya triplinervis Lauraceae 5 Cupaniopsis anacardioides Sapindaceae 5 5 Curculigo ensifolia Liliaceae 5 5 Cymbopogon bombycinus Poaceae 5 5 5 C. refractus Poaceae 5 Cyperus sp. Cyperaceae 5 Dactyloctenium radulans Poaceae s Desmodium gangeticum Fabaceae 5, s 5 5, s D. gunnii Fabaceae 5 5, s 5, s D. rhytidophyllum Fabaceae 5 D. tortuosum* Fabaceae S s s D. varians Fabaceae 5 Dianella caerulea Liliaceae 5 5 5 5 Digitaria breviglumis Poaceae 5 5 5 Diospyros geminata Ebenaceae 5 5 5 Drypetes deplanchei Euphorbiaceae 5 5 Emilia sonchifolia* Asteraceae s s s s Erythrina vespertilio Fabaceae 5, 6 5, 6 Eucalyptus drepanophylla Myracteae 5, 6 5, 6 5, 6 E. platyphylla Myrtaceae 5, 6 5, 6 5, 6 5, 6 Euroschinus falcata Anacardiaceae 5, s 5 5 5 Eustrephus latifolius Smilaceae 5, s 5 5 5 Evolvulus alsinoides Convolvulaceae 2 s s Ficus opposita Moraceae 5 5 5 5 Fimbristylis tristachya Cyperaceae 5 Fimbristylis sp. Cyperaceae 5 Flemingia parviflora Fabaceae 5, s 5 5 5 Flueggea virosa Euphorbiaceae 5 5 5 5 Galactia tenuiflora Fabaceae 5 5 5 5 Garuga floribunda Burseraceae 5 Glochidion sp. Euphorbiaceae 5 Glycine tomentella Fabaceae 5, s 5 5 5 Grevillea parallela Proteaceae 5, 6 5, 6 Grewia retusifolia Tiliaceae 4, 5 4, 5 4, 5 4, 5 Haemodorum coccineum Haemodoraceae 5 Helicretes semiglabra Sterculiaceae 4, 5 4, 5 Heteropogon contortus Poaceae 5, s 5, s 5, s 5, s Heteropogon triticeus Poaceae 5, s 5, s 5, s 5, s Hibiscus meraukensis Malvaceae 5, s s 5, s 5, s Hybanthus enneaspermus Violaceae 5, s 5 5, s 5, s Hybanthus stellarioides Violaceae 5, s Hyptis suaveolens* Lamiaceae s s s s Imperata cylindrica Poaceae 5 5 5 Indigofera hirsuta Fabaceae 2 s s s Jagera pseudorhus Sapindaceae 5 5
303
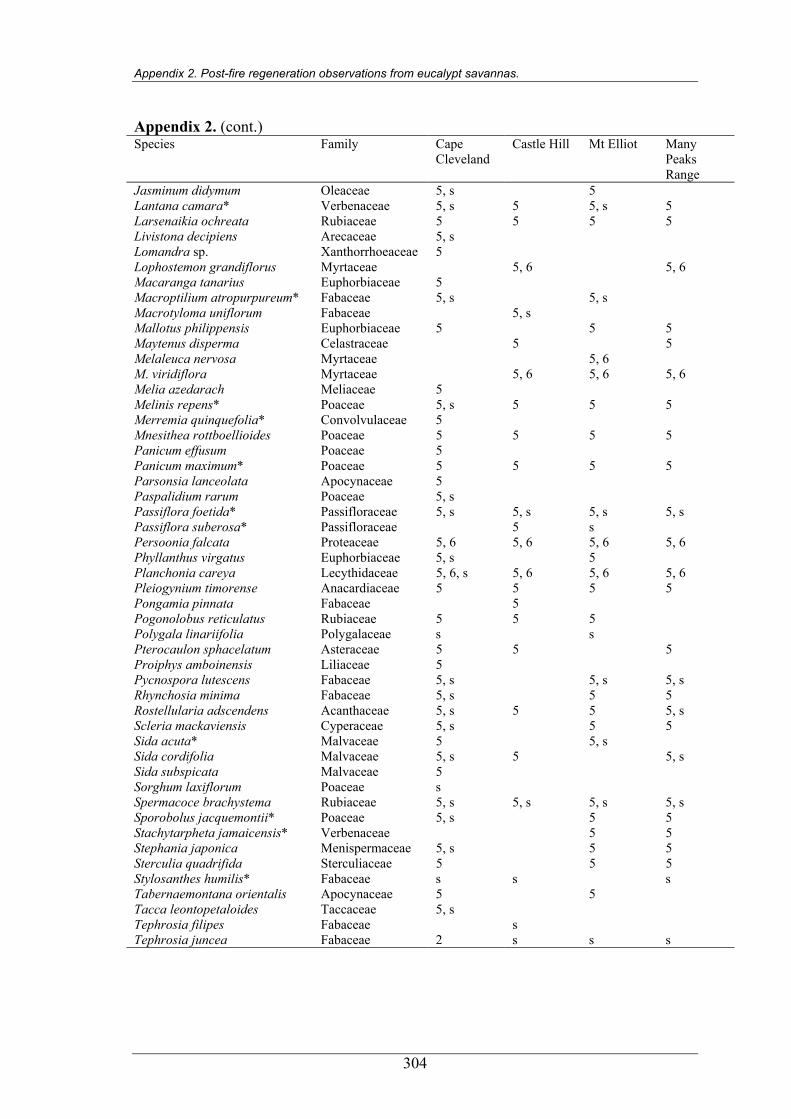
Appendix 2. Post-fire regeneration observations from eucalypt savannas.
Appendix 2. (cont.) Species Family Cape
Cleveland Castle Hill Mt Elliot Many
Peaks Range
Jasminum didymum Oleaceae 5, s 5 Lantana camara* Verbenaceae 5, s 5 5, s 5 Larsenaikia ochreata Rubiaceae 5 5 5 5 Livistona decipiens Arecaceae 5, s Lomandra sp. Xanthorrhoeaceae 5 Lophostemon grandiflorus Myrtaceae 5, 6 5, 6 Macaranga tanarius Euphorbiaceae 5 Macroptilium atropurpureum* Fabaceae 5, s 5, s Macrotyloma uniflorum Fabaceae 5, s Mallotus philippensis Euphorbiaceae 5 5 5 Maytenus disperma Celastraceae 5 5 Melaleuca nervosa Myrtaceae 5, 6 M. viridiflora Myrtaceae 5, 6 5, 6 5, 6 Melia azedarach Meliaceae 5 Melinis repens* Poaceae 5, s 5 5 5 Merremia quinquefolia* Convolvulaceae 5 Mnesithea rottboellioides Poaceae 5 5 5 5 Panicum effusum Poaceae 5 Panicum maximum* Poaceae 5 5 5 5 Parsonsia lanceolata Apocynaceae 5 Paspalidium rarum Poaceae 5, s Passiflora foetida* Passifloraceae 5, s 5, s 5, s 5, s Passiflora suberosa* Passifloraceae 5 s Persoonia falcata Proteaceae 5, 6 5, 6 5, 6 5, 6 Phyllanthus virgatus Euphorbiaceae 5, s 5 Planchonia careya Lecythidaceae 5, 6, s 5, 6 5, 6 5, 6 Pleiogynium timorense Anacardiaceae 5 5 5 5 Pongamia pinnata Fabaceae 5 Pogonolobus reticulatus Rubiaceae 5 5 5 Polygala linariifolia Polygalaceae s s Pterocaulon sphacelatum Asteraceae 5 5 5 Proiphys amboinensis Liliaceae 5 Pycnospora lutescens Fabaceae 5, s 5, s 5, s Rhynchosia minima Fabaceae 5, s 5 5 Rostellularia adscendens Acanthaceae 5, s 5 5 5, s Scleria mackaviensis Cyperaceae 5, s 5 5 Sida acuta* Malvaceae 5 5, s Sida cordifolia Malvaceae 5, s 5 5, s Sida subspicata Malvaceae 5 Sorghum laxiflorum Poaceae s Spermacoce brachystema Rubiaceae 5, s 5, s 5, s 5, s Sporobolus jacquemontii* Poaceae 5, s 5 5 Stachytarpheta jamaicensis* Verbenaceae 5 5 Stephania japonica Menispermaceae 5, s 5 5 Sterculia quadrifida Sterculiaceae 5 5 5 Stylosanthes humilis* Fabaceae s s s Tabernaemontana orientalis Apocynaceae 5 5 Tacca leontopetaloides Taccaceae 5, s Tephrosia filipes Fabaceae s Tephrosia juncea Fabaceae 2 s s s
304
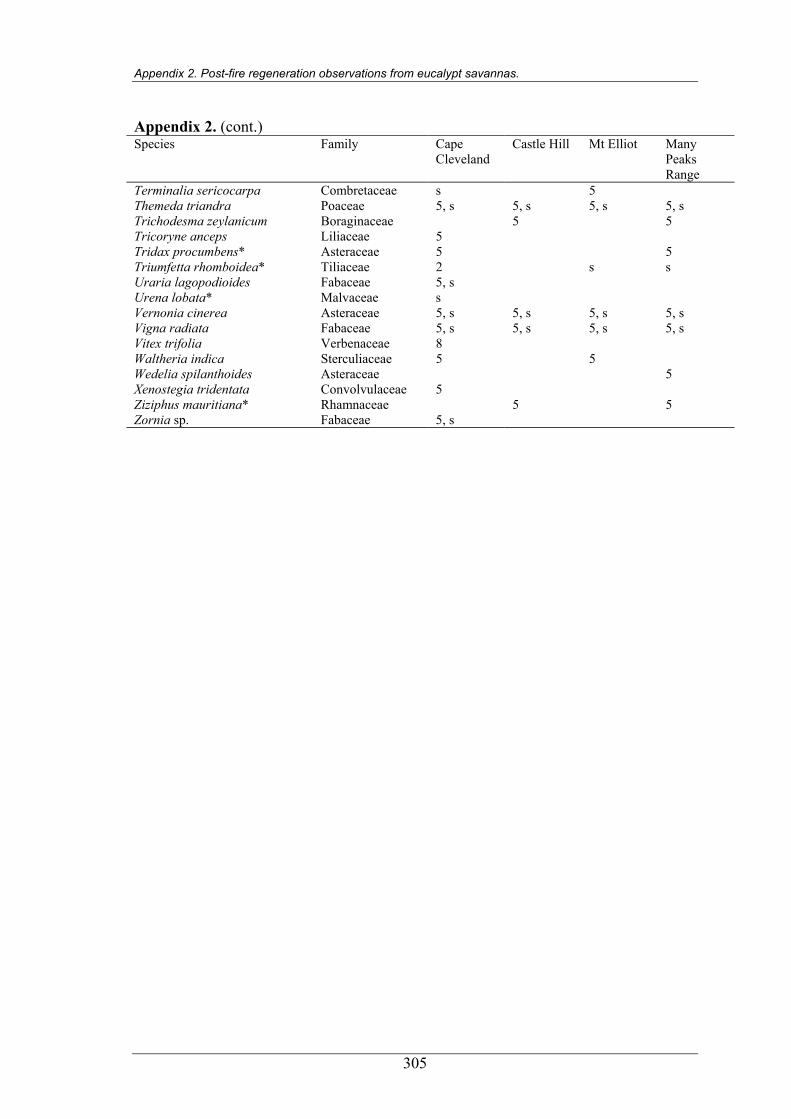
Appendix 2. Post-fire regeneration observations from eucalypt savannas.
305
Appendix 2. (cont.) Species Family Cape
Cleveland Castle Hill Mt Elliot Many
Peaks Range
Terminalia sericocarpa Combretaceae s 5 Themeda triandra Poaceae 5, s 5, s 5, s 5, s Trichodesma zeylanicum Boraginaceae 5 5 Tricoryne anceps Liliaceae 5 Tridax procumbens* Asteraceae 5 5 Triumfetta rhomboidea* Tiliaceae 2 s s Uraria lagopodioides Fabaceae 5, s Urena lobata* Malvaceae s Vernonia cinerea Asteraceae 5, s 5, s 5, s 5, s Vigna radiata Fabaceae 5, s 5, s 5, s 5, s Vitex trifolia Verbenaceae 8 Waltheria indica Sterculiaceae 5 5 Wedelia spilanthoides Asteraceae 5 Xenostegia tridentata Convolvulaceae 5 Ziziphus mauritiana* Rhamnaceae 5 5 Zornia sp. Fabaceae 5, s