Embed Size (px)
Citation preview
The Effect of Education on Nationalism and EthnicExclusionism: An International Comparison
Marcel Coenders and Peer ScheepersDepartment of Sociology/ICS, University of Nijmegen
In most studies on ethnic attitudes, a rather strong negative relationship has been foundbetween educational attainment and positive ingroup attitudes (or negative outgroup atti-tudes). However, it is not well known to what extent this educational effect varies acrossdifferent national contexts. This study investigated the effect of education on differentdimensions of nationalism and ethnic exclusionism with the use of 1995 survey data gathered in 22 countries. Notions from socialization theory were used to test whether theeducational effect varies according to the length of liberal-democratic tradition and thedegree of religious heterogeneity within a country. Results indicate that educational attainment is strongly related to ethnic exclusionism as well as chauvinism, but not to patriotism. Moreover, the effect of education on ethnic exclusionism is smaller in recentlyestablished democracies. The hypothesis regarding stronger educational effects in societies with more religious heterogeneity was not supported.
KEY WORDS: nationalism, ethnic exclusionism, attitudes, education, international comparison
One of the most consistent findings in social research on ethnic attitudes isthe negative association between educational attainment and ethnic prejudice:People with higher education are less prejudiced toward ethnic outgroups than arethose with lower education. This relationship has been established in empiricalresearch across time as well as in different countries (Fuchs, Gerhards, & Roller,1993; Schuman, Steeh, Bobo, & Krysan, 1997; Smith, 1981, 1985; Taylor, Sheat-sley, & Greeley, 1978; Vogt, 1997). Although most studies focus solely on atti-tudes toward ethnic outgroups, there is also empirical evidence that people withhigher education are less prone to ingroup favoritism than are people with lowereducation (Billiet, Carton, & Huys, 1990; Eisinga & Scheepers, 1989). In short,ethnocentrism—the combination of a favorable attitude toward the ethnic ingroupand an unfavorable attitude toward ethnic outgroups (Adorno, Frenkel-Brunswik,
Political Psychology, Vol. 24, No. 2, 2003
0162-895X © 2003 International Society of Political PsychologyPublished by Blackwell Publishing. Inc., 350 Main Street, Malden, MA 02148, USA, and 9600 Garsington Road, Oxford, OX4 2DQ
313
Levinson, & Sanford, 1950; LeVine & Campbell, 1972; Sumner, 1906/1959)—ismore commonly found among lower-educated strata.
Because of the relative scarcity of cross-nationally comparable survey data,it is not well known whether this effect of education is universal, or whether andto what extent it varies across countries. According to Weil (1985), the effect ofeducation may vary systematically across countries. However, Weil’s four-countrystudy had severe shortcomings due to incomplete comparability in the applieddata. In this study, we set out to improve on previous research—in particularWeil’s study—by applying cross-nationally comparable measurements of ingroupand outgroup attitudes of the ethnic majority population in 22 countries. We labelpositive attitudes toward one’s ingroup and country as nationalism, and negativeattitudes toward ethnic minorities and immigrants as ethnic exclusionism.1
We investigated whether the effect of educational attainment on nationalismand ethnic exclusionism varies systematically across types of countries. In par-ticular, we tested hypotheses that the educational effect varies across countrieswith the length of time a country has had a liberal-democratic regime form or thedegree of religious heterogeneity within a country.
Previous Empirical Research on the Effect of Education
The negative relationship between educational attainment and (various measures of) ethnic intolerance has been established time and again, especially instudies of the white American population (Schuman et al., 1997; Vogt, 1997). Ina series of articles, applying continuous survey research from 1942 onward, Sheat-sley and various co-authors showed that white Americans with higher educationare more supportive of racial integration (Greeley & Sheatsley, 1971; Hyman &Sheatsley, 1956, 1964; Taylor et al., 1978). Selznick and Steinberg (1969) andMartire and Clark (1982) found less anti-Semitism among people with higher education. Research in Western European countries also indicated that negativestereotypes toward ethnic minorities are less common among the higher educated(Billiet et al., 1990; Eisinga & Scheepers, 1989; Wagner & Zick, 1995; Winkler,1999). Furthermore, support for disadvantageous treatment of ethnic minoritiesin the housing and labor market was found to be particularly present among peoplewith lower education (Coenders & Scheepers, 1998). Empirical studies have alsoshown effects of educational attainment in other realms (for an overview, seeHyman & Wright, 1979) such as moral attitudes (Walzer, 1994; Wilcox, 1992)and political tolerance or support for civil liberties (Bobo & Licari, 1989; Lipset,1981; Stouffer, 1955).
314 Coenders and Scheepers
1 This conceptualization of nationalism does not incorporate political-ideological striving for an independent nation-state. Moreover, because we focus on the attitudes of members of the ethnicmajority within each country, we do not distinguish between a positive attitude toward one’s ethnicingroup and a positive attitude toward one’s country.
Our study investigates the relationship between education and negative atti-tudes toward ethnic minorities and immigrants as well as positive attitudes towardthe ethnic ingroup. The interrelation between unfavorable attitudes toward out-groups and favorable attitudes toward the ingroup is called ethnocentrism.Although the concept of ethnocentrism was introduced nearly a century ago byWilliam Sumner (1906/1959) and adopted by Adorno et al. (1950) and others,most contemporary research focuses solely on attitudes toward ethnic outgroups,neglecting attitudes toward the ingroup. However, some studies have shown anegative relationship between education and positive attitudes toward the ethnicingroup; that is, chauvinistic nationalistic feelings are less widespread amongpersons with higher education (Billiet et al., 1990; Eisinga & Scheepers, 1989).In short, the dominant research finding has been that educational attainment is associated with increasing tolerance toward ethnic outgroups and decreasingfeelings of ingroup superiority.
However, this effect of education is not universal. That is, the effect of education on interethnic attitudes and tolerance varies across contexts. First, theeducational effect depends on the applied measure of ethnic tolerance. Second,there are some indications that the effect of education varies across countries.
With respect to the applied measurement, Hyman and Sheatsley (1956) foundstrong effects of education on approval of school integration and approval of inte-gration of public transportation, but they found no differences between educa-tional groups with respect to the approval of residential integration.2 Smith (1981)compared approval of the principle of school desegregation with willingness tosend one’s children to a school where a few, half, or most of the children areblacks. The liberalizing effect of education varied negatively with the proportionof blacks in the school. The same findings are reported by Schuman et al. (1997)in an overview study of trends in racial attitudes in the United States between the1940s and the 1990s. In addition, they found similar effects with respect to resi-dential integration.3 They concluded that when the degree of integration proposedwould make whites into a minority, highly educated respondents are no longer inthe vanguard. Moreover, Schuman et al. reported that educational attainment isgenerally associated with stronger adherence to principles of non-discriminationand desegregation, but that this association tends to decrease or even disappearwhen implementation of these principles is involved (see Jackman, 1978; Jackman& Muha, 1984).
Not only does the effect of education depend on the measure of ethnic intolerance, there is some evidence that the effect of education may vary across
Effect of Education on Nationalism and Ethnic Exclusionism 315
2 According to Hyman and Sheatsley, the lack of a bivariate relation between education and approvalof neighborhood integration may be due to the effect of social and financial status, which illustratesthe need for a multivariate analysis.
3 There are (at least in the northern United States) small educational differences in the willingness tomove when some blacks reside in one’s neighborhood, but the effect of education disappears whenthe survey question refers to a large proportion of black residents.
countries. On the basis of a study of anti-Semitism in four countries, Weil (1985)concluded that, in general, education had the largest effect in the United States,smaller effects in West Germany and France, and the smallest effect in Austria.
A major drawback of Weil’s study is the incomplete comparability of his data.Because of the lack of cross-nationally comparable data, he was forced to applyitems that had different item formulations and answer categories across countries,and were gathered in different years in different countries. Therefore, as Weilacknowledged, his results are more suggestive than conclusive.
With the cross-national survey data gathered by the International SocialSurvey Program (ISSP), it is now possible to investigate the effect of educationon interethnic attitudes more thoroughly and systematically. The 1995 ISSP dataset “Aspects of National Identity” has several advantages. First, equivalent ques-tion wordings and answer categories are applied in each country. Second, data aregathered in a large heterogeneous set of countries—covering Western Europeancountries, former socialist countries in Eastern Europe and Russia, and traditionalimmigration countries such as the United States and Australia—allowing a sys-tematic investigation of the liberalizing effects of education.
Theoretical Interpretations of the Educational Effect
Although numerous studies report an overall negative effect of education oningroup favoritism and/or outgroup prejudice, it is much less clear why educationhas such an effect. Various interpretations have been offered, but few investiga-tions have empirically tested the factors causing the negative effect of educationon ethnocentrism.
In this study, we focus on socialization theory as a possible explanation ofthe educational effect. Central to socialization theory is the thesis that educationalinstitutions transmit norms, values, and models of behavior deemed to be appro-priate in a given society. The negative association between education and nation-alism or ethnic exclusionism is particularly due to the dissemination of democraticvalue orientations in the educational system (Selznick & Steinberg, 1969).
In contemporary research, most theoretical interpretations regarding the rela-tion between education and interethnic attitudes stress the cognitive componentof these attitudes. In this cognitive approach, it is emphasized that prejudicedbeliefs are intellectually unenlightened beliefs (Selznick & Steinberg, 1969; Weil,1985). Ethnic stereotypes—whether positive stereotypes toward the ingroup ornegative stereotypes toward outgroups—are simplifications of social reality; theyare generalizations that are improperly applied to all members of an ethnic group.Likewise, xenophobic beliefs in which immigrants and foreigners are viewed asthe (primary) cause of societal problems reflect a simplified view of social reality.Individuals with a primitive cognitive style assign blame to ethnic outgroups andsearch for scapegoats because they fail to comprehend impersonal and abstractcauses (Selznick & Steinberg, 1969). Nevertheless, although many stereotype
316 Coenders and Scheepers
attributions are crude and simple, they are to a certain extent inevitable in orderto deal with the complexities of daily social life. The question then becomes whyhighly educated people reject such prejudiced beliefs and antagonistic attitudesthat arise from these beliefs. According to the cognitive approach, the differencesin prejudice between educational groups can be interpreted in terms of centralprocesses within the educational system: the transfer of knowledge and informa-tion; the development of cognitive capacities; and, finally, the transfer of norms,values, and modes of behavior, which is the central thesis in the above-mentionedsocialization theory (see de Witte, 1999).
Regarding the first of these central processes, education is characterized as a learning process through which people acquire knowledge and information.Basically, this relates to the well-known “ignorance causes prejudice” thesis(Stephan & Stephan, 1984). A higher level of education increases insight into thecomplexity and multicausality of society and of individual behavior, refuting simplifications inherent in ethnic stereotypes. In addition, education broadensone’s social perspective: It increases the knowledge and understanding of differ-ent norms and values other than those common in one’s own social group. Edu-cation therefore raises awareness of the subjective and particularistic character ofindividual beliefs (Gabennesch, 1972; Roof, 1974). Hyman, Wright, and Reed(1975), in their comprehensive review of American data, concluded that educa-tion indeed increases knowledge, deepens receptivity to further knowledge, andstimulates active seeking for new information long after people finish their formalschooling. Furthermore, Stephan and Stephan (1984) showed that cultural knowl-edge (knowledge of the roles, norms, and values) of an ethnic outgroup is stronglycorrelated with positive attitudes toward that outgroup.
Second, the relation between educational attainment and interethnic attitudesis interpreted in term of cognitive capacities and/or habits. That is, education mayincrease the cognitive abilities necessary for a sophisticated analysis of problemsin order to counterbalance the rigid simplifications inherent in most positiveingroup and negative outgroup attitudes. Although this interpretation is wide-spread, only a small number of studies have used direct measures of cognitiveabilities. For instance, Wagner and Schönbach (1984) found that their measure of cognitive complexity was an important mediator in the link between edu-cational status and ethnic prejudice. In a study on the related topic of political tolerance, Bobo and Licari (1989) found a strong effect of their measure of cognitive sophistication.4
Whereas the aforementioned theoretical approaches stress the cognitive component of prejudice, other theories focus on personality needs as the cause ofprejudice. The best known example of this personality development approach is
Effect of Education on Nationalism and Ethnic Exclusionism 317
4 Studies show a wide variety of conceptualizations and measurements of cognitive capacities—forexample, associative flexibility, cognitive complexity or flexibility (Wagner & Schönbach, 1984),and cognitive sophistication (Bobo & Licari, 1989).
the theory of the authoritarian personality (Adorno et al., 1950). Previous studieshave shown strong empirical interrelations between ethnic prejudice and author-itarianism, as well as between lower educational attainment and higher levels ofauthoritarianism (Adorno et al., 1950; Scheepers, Felling, & Peters, 1990). Inaddition, the interrelation between education and prejudice has been interpretedin terms of self-esteem (Wagner & Schönbach, 1984). It is assumed that personswith higher education, and in general higher social strata, have higher self-esteemand are therefore less inclined to enhance their social identity by perceiving theiringroup as superior to outgroups (Tajfel, 1981, 1982).
Next to the cognitive approach and the personality development approach,the relationship between educational attainment and nationalism or ethnic exclu-sionism can also be interpreted by realistic group conflict theory (LeVine &Campbell, 1972). Central in this theory is the proposition that competition forscarce resources between social groups (e.g., ethnic groups) is the catalyst ofantagonistic attitudes: Intergroup competition leads to more ingroup solidarity andto more outgroup hostility (Bobo, 1988; Olzak & Nagel, 1986; Sherif & Sherif,1979). In this view, ethnic groups are mutual competitors, because they have con-flicting claims over status, power, privilege, and other scarce resources, along withexpectations and subjective judgments about the “proper” distribution of suchscarce resources (Blumer, 1958; Coser, 1956). According to Blalock (1967), actualcompetition is reflected in perceptions of competition—that is, the subjectivelyperceived socioeconomic threat that ethnic minorities pose to the social positionof the dominant ethnic group. However, the extent to which dominant ethnic groupmembers experience threat from ethnic minorities may depend on their personalsituation. In particular, those social categories that hold social positions similar tothose of the ethnic minorities will have to make extra effort to compete with ethnicminorities in the labor and housing markets. Because ethnic immigrants andminorities are in general overrepresented in the lower strata of society (Kiehl &Werner, 1998), it is to be expected that nationalism and ethnic exclusionism arestrongly prevalent among people of lower education levels, lower social classes,and lower income groups. Because education, social class, and income arestrongly interrelated, as shown by status-attainment models, it is necessary to estimate the effect of educational attainment in a multivariate analysis, controllingfor the effects of social class position and income level.
Some authors doubt whether there really is a true effect of education, orwhether the effect is (to some extent) an empirical artifact. For instance, the effectof education may be overestimated because respondents with lower education tendto answer in the affirmative to the (ethnocentric) items offered (Jackman, 1973).Schönbach, Gollwitzer, Stiepel, and Wagner (1981), however, found no supportfor this “acquiescent response bias.” Moreover, the effect of education may beoverestimated because respondents with higher education are more predisposedto give socially desirable answers. To test this latter proposition, Wagner and Zick
318 Coenders and Scheepers
(1995) conducted an experiment with a bogus-pipeline measurement procedure,in which responses are relatively free of response tendencies and strategies of positive self-presentation. As expected, respondents expressed more negative outgroup attitudes when their attitudes were measured by the bogus-pipeline pro-cedure than by a paper-and-pencil method. However, contrary to expectations, thedifference between respondents with higher and lower education was evenstronger in the bogus-pipeline experimental group. This finding indicates thatunder conditions in which the tendency to give socially desirable answers isreduced, the differences between educational groups may actually increase.
We now return to the question of whether the effect of education on nation-alism and ethnic exclusionism varies across countries. Most of the aforementionedtheories on the relation between education and ethnic attitudes do not incorporateany explanations of varying effects of educational attainment across countries. Ina strict sense, psychodynamic theories that focus on personality needs, such asthe theory of the authoritarian personality (Adorno et al., 1950), pose no cross-cultural variation (see Weil, 1985). Other theoretical propositions are difficult totest by means of cross-sectional survey data. For instance, testing the notions thateducational systems transfer knowledge and information or support the develop-ment of cognitive abilities would ideally require a detailed examination of thecontent of educational curricula and teaching practices across countries. Alterna-tively, socialization theory can be applied to derive testable hypotheses regardingcross-national variations in the educational effect. The aforementioned notions ofrealistic group conflict theory point out that such hypotheses should be tested inmultivariate analyses, controlling for the effects of social class position andincome level.
Socialization Theory
Central to socialization theory is the thesis that students are exposed to values,norms, and modes of behavior transmitted by the educational system. That is, edu-cation brings people into contact with the official norms and values of the society.According to Selznick and Steinberg (1969), the formal educational system is themain social institution for the transmission and elaboration of what they desig-nate as the “official” culture. This official or ideal culture, which contains society’sideal norms, is distinguished from the “unofficial” or “common” culture. Selznickand Steinberg viewed the official culture of the United States as an enlightenedand unprejudiced culture organized around scientific and democratic values. Con-versely, they viewed the historically more archaic common culture in the UnitedStates as a prejudiced culture, characterized by pre-scientific, pre-democratic, andpre-humanitarian values. Thus, the longer individuals attend the educationalsystem, the more they are exposed to scientific and democratic values. Becausemost prejudiced beliefs are, as Selznick and Steinberg argued, incongruent with
Effect of Education on Nationalism and Ethnic Exclusionism 319
these values, adherence to scientific and democratic values and ideals can coun-tervail the (cognitively unenlightened) prejudiced beliefs.5
Selznick and Steinberg’s analysis of the relation between education and (anti-Semitic) prejudice was confined to the United States. They argued that in such asociety, with its democratic political order and its technologically based economy,the ideal norms of the official culture are derived from democratic and scientificvalues. Weil (1985) generalized their thesis by stating that the values that are trans-mitted by a country’s educational system reflect the official or political culture ofthat country, which in turn is determined by the existing regime form. That is, incountries with a liberal, democratic regime, the official or political culture encom-passes democratic values and ideals, which are promulgated by the educationalsystem. Accordingly, the negative association between education and nationalismor ethnic exclusionism is due to the dissemination of democratic value orienta-tions in educational institutions. However, the values transmitted by the educa-tional system reflect the dominant political culture; hence, one would expect thatthe effect of education is smaller in countries with a less democratic regime or aless longstanding democratic tradition.
The ISSP data set offers a unique opportunity to test these propositions. Theinhabitants of Eastern Europe and Russia have only recently witnessed the trans-formation from a socialist one-party political power to a democratic politicalregime form. Most of the adult population in Eastern Europe and Russia attendededucational institutions in times of a non-democratic government. Therefore, we expect that the differences between educational groups in nationalism and ethnic exclusionism are smaller in these former socialist countries. Our first hypothesis therefore asserts that the effect of education on nationalism andethnic exclusionism depends on the political regime form of the country: The effect of education is smaller in recently established democracies (Hypothesis 1a).
Weil furthermore assumed a time lag between a change in political regimeform and the ability of the educational system to socialize students into the newofficial political culture. Therefore, the length of time a country has had a liberal-democratic regime form determines the extent to which the population is social-ized in democratic ideals and values. Consequently, we expect that the effect ofeducation is stronger in prolonged democracies than in countries where the liberal-democratic tradition has been interrupted, such as Italy, Germany, Austria, Spain,and Japan, which had non-democratic regime forms during the 1940s or (in thecase of Spain) for many years thereafter. Thus, the effect of education on nation-alism and ethnic exclusionism depends on the length of time a country has had a
320 Coenders and Scheepers
5 According to Selznick and Steinberg, prejudiced beliefs are cognitively simplistic beliefs and thusincongruent with the scientific rules of evidence and inference as promulgated by the educationalinstitutions. This notion corresponds with the view that educational differences in prejudice are dueto differences in cognitive abilities and habits between educational groups.
liberal-democratic regime form: The effect of education is the strongest in pro-longed democracies, less strong in interrupted democracies, and the smallest inrecently established democracies (Hypothesis 1b).
In addition, Weil hypothesized that the political culture, as transmitted by theeducational system, is also affected by the degree of cultural pluralism. On thebasis of studies of conflict resolution in plural societies (e.g., Lijphart, 1977), Weilstated that in a plural society, in order to avoid overt conflict between populationsegments, the political elites must take the lead in promoting peaceful accommo-dation among the different groups. Because the political culture is transmittedthrough the educational system, it is assumed that in a more plural society, edu-cational institutions are more likely to attempt to teach and promulgate tolerantvalues and attitudes. We test this notion by investigating to what extent the effectof education varies with the degree of religious heterogeneity of a country. Ourhypothesis therefore asserts that the effect of education depends on the degree of religious heterogeneity of a country: The effect of education is stronger in societies with more religious heterogeneity (Hypothesis 2).
Data and Measurements
Data were derived from the 1995 module of the ISSP. The ISSP, founded in1983 with the goal of achieving more cross-national comparability in attitudinalresearch, conducts annual cross-national survey research in a growing number ofcountries. The 1995 Aspects of National Identity survey was conducted amongprobability-based nationwide samples of adults in 23 countries. The questionnairemodule was jointly developed by the ISSP members, with each question formu-lated to be as culturally neutral as possible, and the module was pretested invarious countries.
In our analyses we apply data from 22 countries, excluding the Philippines(the sole non-industrial country in the data set) for reasons of comparability. Datafor Germany are analyzed separately for the territories of the (old) Federal Re-public of Germany (BRD) and the former German Democratic Republic (DDR)because of the immense differences in political and economic developments sincethe Second World War. Among the 22 countries there is wide variety with respectto region, ethnic and religious heterogeneity, and immigration history, as well asthe length of time a country has had a liberal-democratic regime form. With regardto the latter characteristic, we distinguished three groups of countries: countrieswith a longstanding tradition of democratic government, countries where theliberal-democratic tradition has been interrupted by a non-democratic regimebefore or (as in Spain) after 1945, and the former socialist countries in Europeand Russia that only recently transformed toward political democracy. Further-more, we grouped the countries by degree of religious heterogeneity. On the basisof the religious denomination of all respondents within each country sample, we
Effect of Education on Nationalism and Ethnic Exclusionism 321
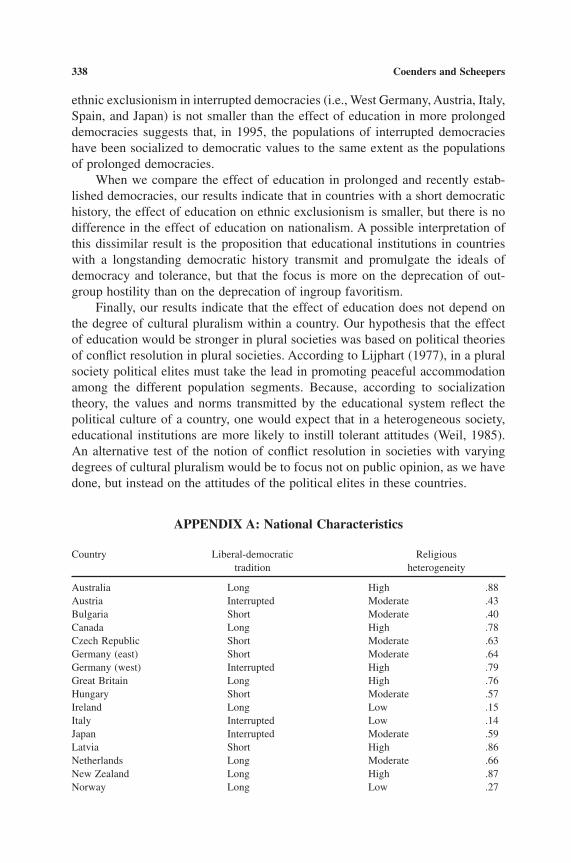
calculated an index of religious diversity6 (Agresti & Agresti, 1977). In thismanner, we distinguished between relatively homogeneous countries, moderatelyheterogeneous countries, and relatively heterogeneous countries. Appendix Ashows the length of liberal-democratic tradition and the degree of religious heterogeneity for each country.
When studying attitudes toward ethnic minorities and immigrants, one shoulddistinguish between attitudes of the ethnic majority group and those of ethnicminority groups. Here, we restrict our analyses to the attitudes of the ethnic major-ity group in each country.7 In Appendix B, the selection of respondents from theethnic majority group is explicated, along with the sample sizes for each country.To avoid a small effective sample size, we applied missing mean substitution(within each country) for the indicators of nationalism and ethnic exclusionism.
Dependent Variables: Dimensions of Nationalism and Ethnic Exclusionism
In a previous article (Coenders & Scheepers, 1999), we applied the ISSP 1995data to investigate whether there are several dimensions of nationalism and ethnicexclusionism. In accordance with previous research on the multidimensionalityof attitudes toward one’s own people and country (Bar-Tal & Staub, 1997; Blank& Schmidt, 1993; Kosterman & Feshbach, 1989), our results indicated that two dimensions of nationalism can be distinguished: chauvinism and patriotism.Chauvinism can be described as the view that one’s own ethnic ingroup andcountry are unique and superior. This downward comparison of other ethnicgroups and countries is combined with a blind, uncritical attachment to one’s owngroup and country. Patriotism, the love for and pride in one’s people and country,refers to an attachment based on critical understanding.
The distinction between chauvinism and patriotism is in line with the notionsof Adorno et al. (1950). They labelled the combination of feelings of superiorityand a blind attachment to the country and the national group as “pseudopatrio-tism” (as opposed to “genuine patriotism”), defined as a “blind attachment tocertain national cultural values, uncritical conformity with the prevailing groupways, and rejection of other nations as out-groups” (p. 107). More recently, Staub
322 Coenders and Scheepers
6 The index of diversity was calculated as:
with N = total frequency; fj = frequency of category j; Nj = number of categories. The index wasadjusted for the total number of denominations that were distinguished in the questionnaire, as isdisplayed by the denominator of the equation.
7 We do not elaborate on the attitudes of ethnic minority groups because of the overall small numberof respondents from these ethnic groups in national representative samples.
heterogeneity
f
N
N
j
j
N
j
j
=- ( )
-
=Â1
11
2
1
(1997) and Schatz, Staub, and Lavine (1999) suggested a more refined distinctionbetween nationalism, blind patriotism, and constructive patriotism. Nationalismwas defined as feelings of national superiority and support for national dominance.Blind patriotism was defined as a rigid and inflexible attachment to the countrycharacterized by unquestioning positive evaluation, staunch allegiance, and intol-erance of criticism. Constructive patriotism, on the other hand, was defined as anattachment to the country characterized by support for questioning and criticismof current group practices that are intended to result in positive change (Staub,1997). Both blind and constructive patriotism are considered distinct from nation-alism, since in their conceptualisation, nationalism refers to an intergroup com-parison, whereas both blind and constructive patriotism do not. However,nationalism and blind patriotism were strongly interrelated (r = .65) (Schatz et al.,1999). In our study, we applied previously gathered secondary data, that did not exactly match the distinction between nationalism, blind and constructivepatriotism as proposed by Staub and Schatz et al. Our conceptualisation and measurement of chauvinism relates more to the aforementioned concepts ofnationalism and blind patriotism, whereas our concept of patriotism more closelyrelates to the concept of constructive patriotism.
Next, various types of ethnic exclusionism could be distinguished, reflectingattitudes toward different types of ethnic outgroups: resident ethnic outgroupmembers (ethnic minorities), immigrants, and political refugees.8 Ethnic majoritymembers’ attitudes toward ethnic minorities depend on their subjective definitionsof the ingroup and outgroups, and on their subjective perceptions of the typicalcharacteristics of “true” ingroup members. When individuals from the ethnicmajority group hold a strong view that certain characteristics (such as being anative-born or long-term resident in their country) are very important require-ments for being a “true” member of their ingroup, they are more likely to berestrictive in their notion of the ingroup and are more likely to exclude membersfrom ethnic minorities. Attitudes toward immigrants and political refugees are afunction of the willingness of the ethnic majority to close the national borders toethnic newcomers.
Eleven items, as shown in Table 1, were selected from a larger pool of itemsas indicators for the aforementioned dimensions of nationalism and ethnic exclu-sionism.9 First, chauvinism is measured by items referring to the superiority ofone’s own country and its residents, as well as an item that refers to a blind,uncritical attachment to one’s own country. Next, items referring to patriotismmeasure pride in collective goods of the country—its democracy, political influ-ence, and economic achievements. Another set of items refers to exclusion of
Effect of Education on Nationalism and Ethnic Exclusionism 323
8 Structural equations modeling applying the LISREL program showed that items referring to exclu-sion of immigrants and to exclusion of political refugees did not refer to the same latent variable,because parameter estimates of such a model showed anomalies (Coenders & Scheepers, 1999).
9 On the basis of the results of preliminary analyses, these items were judged to be the most appro-priate ones for the construction of an internationally comparable measurement instrument.
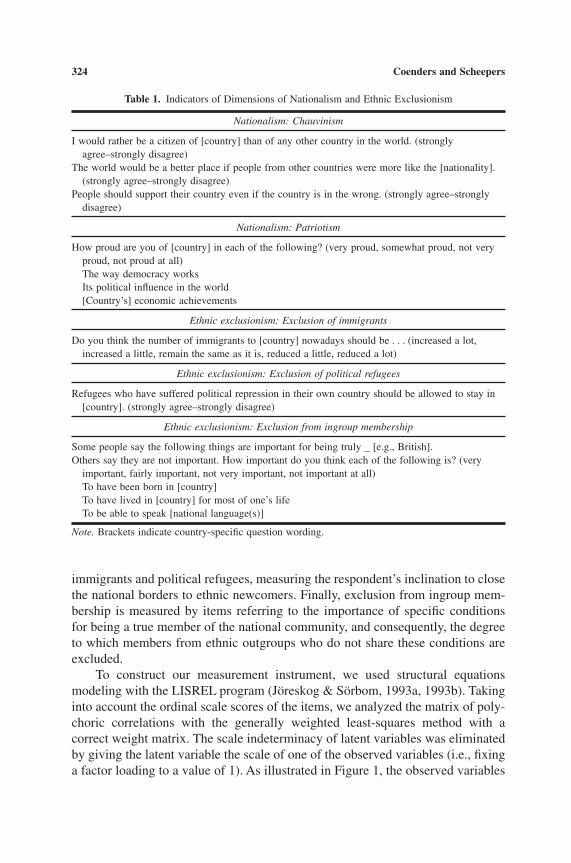
immigrants and political refugees, measuring the respondent’s inclination to closethe national borders to ethnic newcomers. Finally, exclusion from ingroup mem-bership is measured by items referring to the importance of specific conditionsfor being a true member of the national community, and consequently, the degreeto which members from ethnic outgroups who do not share these conditions areexcluded.
To construct our measurement instrument, we used structural equations modeling with the LISREL program (Jöreskog & Sörbom, 1993a, 1993b). Takinginto account the ordinal scale scores of the items, we analyzed the matrix of poly-choric correlations with the generally weighted least-squares method with acorrect weight matrix. The scale indeterminacy of latent variables was eliminatedby giving the latent variable the scale of one of the observed variables (i.e., fixinga factor loading to a value of 1). As illustrated in Figure 1, the observed variables
324 Coenders and Scheepers
Table 1. Indicators of Dimensions of Nationalism and Ethnic Exclusionism
Nationalism: Chauvinism
I would rather be a citizen of [country] than of any other country in the world. (strongly agree–strongly disagree)
The world would be a better place if people from other countries were more like the [nationality]. (strongly agree–strongly disagree)
People should support their country even if the country is in the wrong. (strongly agree–strongly disagree)
Nationalism: Patriotism
How proud are you of [country] in each of the following? (very proud, somewhat proud, not very proud, not proud at all)The way democracy worksIts political influence in the world[Country’s] economic achievements
Ethnic exclusionism: Exclusion of immigrants
Do you think the number of immigrants to [country] nowadays should be . . . (increased a lot, increased a little, remain the same as it is, reduced a little, reduced a lot)
Ethnic exclusionism: Exclusion of political refugees
Refugees who have suffered political repression in their own country should be allowed to stay in [country]. (strongly agree–strongly disagree)
Ethnic exclusionism: Exclusion from ingroup membership
Some people say the following things are important for being truly _ [e.g., British]. Others say they are not important. How important do you think each of the following is? (very
important, fairly important, not very important, not important at all)To have been born in [country]To have lived in [country] for most of one’s lifeTo be able to speak [national language(s)]
Note. Brackets indicate country-specific question wording.
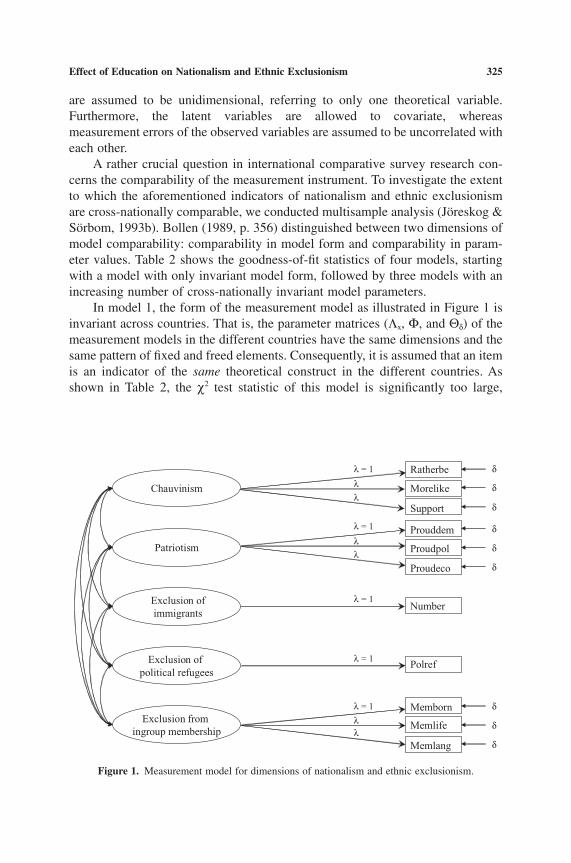
are assumed to be unidimensional, referring to only one theoretical variable. Furthermore, the latent variables are allowed to covariate, whereas measurement errors of the observed variables are assumed to be uncorrelated witheach other.
A rather crucial question in international comparative survey research con-cerns the comparability of the measurement instrument. To investigate the extentto which the aforementioned indicators of nationalism and ethnic exclusionismare cross-nationally comparable, we conducted multisample analysis (Jöreskog &Sörbom, 1993b). Bollen (1989, p. 356) distinguished between two dimensions ofmodel comparability: comparability in model form and comparability in param-eter values. Table 2 shows the goodness-of-fit statistics of four models, startingwith a model with only invariant model form, followed by three models with anincreasing number of cross-nationally invariant model parameters.
In model 1, the form of the measurement model as illustrated in Figure 1 isinvariant across countries. That is, the parameter matrices (Lx, F, and Qd) of themeasurement models in the different countries have the same dimensions and thesame pattern of fixed and freed elements. Consequently, it is assumed that an itemis an indicator of the same theoretical construct in the different countries. Asshown in Table 2, the c2 test statistic of this model is significantly too large,
Effect of Education on Nationalism and Ethnic Exclusionism 325
Chauvinism
Patriotism
Exclusion ofimmigrants
Exclusion of political refugees
Exclusion from ingroup membership
Ratherbe
Morelike
Support
Prouddem
Proudpol
Proudeco
Number
Polref
Memborn
Memlife
Memlang
d
d
d
d
d
d
d
d
d
l = 1
l = 1
l = 1
l = 1
l = 1
l
ll
ll
l
Figure 1. Measurement model for dimensions of nationalism and ethnic exclusionism.
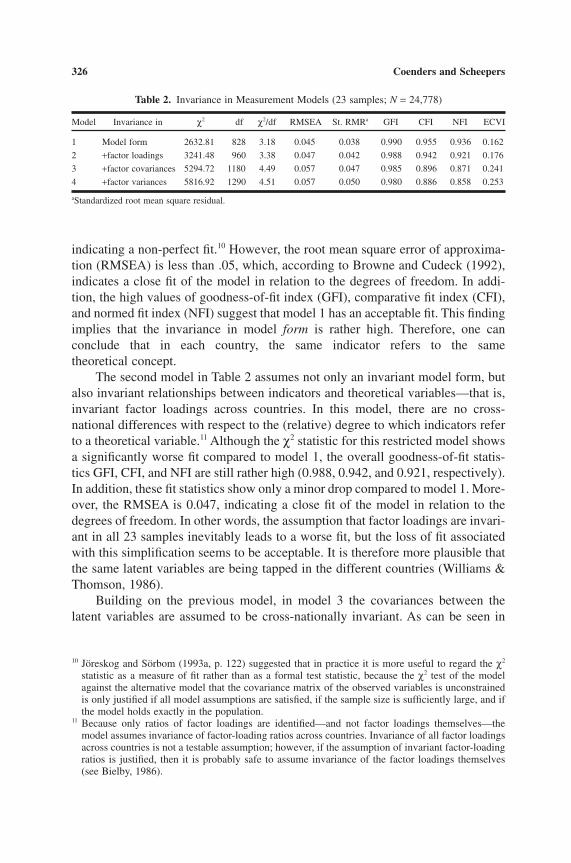
indicating a non-perfect fit.10 However, the root mean square error of approxima-tion (RMSEA) is less than .05, which, according to Browne and Cudeck (1992),indicates a close fit of the model in relation to the degrees of freedom. In addi-tion, the high values of goodness-of-fit index (GFI), comparative fit index (CFI),and normed fit index (NFI) suggest that model 1 has an acceptable fit. This findingimplies that the invariance in model form is rather high. Therefore, one can conclude that in each country, the same indicator refers to the same theoretical concept.
The second model in Table 2 assumes not only an invariant model form, butalso invariant relationships between indicators and theoretical variables—that is,invariant factor loadings across countries. In this model, there are no cross-national differences with respect to the (relative) degree to which indicators referto a theoretical variable.11 Although the c2 statistic for this restricted model showsa significantly worse fit compared to model 1, the overall goodness-of-fit statis-tics GFI, CFI, and NFI are still rather high (0.988, 0.942, and 0.921, respectively).In addition, these fit statistics show only a minor drop compared to model 1. More-over, the RMSEA is 0.047, indicating a close fit of the model in relation to thedegrees of freedom. In other words, the assumption that factor loadings are invari-ant in all 23 samples inevitably leads to a worse fit, but the loss of fit associatedwith this simplification seems to be acceptable. It is therefore more plausible thatthe same latent variables are being tapped in the different countries (Williams &Thomson, 1986).
Building on the previous model, in model 3 the covariances between thelatent variables are assumed to be cross-nationally invariant. As can be seen in
326 Coenders and Scheepers
Table 2. Invariance in Measurement Models (23 samples; N = 24,778)
Model Invariance in c2 df c2/df RMSEA St. RMRa GFI CFI NFI ECVI
1 Model form 2632.81 828 3.18 0.045 0.038 0.990 0.955 0.936 0.162
2 +factor loadings 3241.48 960 3.38 0.047 0.042 0.988 0.942 0.921 0.176
3 +factor covariances 5294.72 1180 4.49 0.057 0.047 0.985 0.896 0.871 0.241
4 +factor variances 5816.92 1290 4.51 0.057 0.050 0.980 0.886 0.858 0.253
aStandardized root mean square residual.
10 Jöreskog and Sörbom (1993a, p. 122) suggested that in practice it is more useful to regard the c2
statistic as a measure of fit rather than as a formal test statistic, because the c2 test of the modelagainst the alternative model that the covariance matrix of the observed variables is unconstrainedis only justified if all model assumptions are satisfied, if the sample size is sufficiently large, and ifthe model holds exactly in the population.
11 Because only ratios of factor loadings are identified—and not factor loadings themselves—themodel assumes invariance of factor-loading ratios across countries. Invariance of all factor loadingsacross countries is not a testable assumption; however, if the assumption of invariant factor-loadingratios is justified, then it is probably safe to assume invariance of the factor loadings themselves(see Bielby, 1986).
Table 2, the loss of fit associated with this even more simplified assumption islarge: CFI and NFI drop from 0.942 and 0.921 to 0.896 and 0.871, respectively.Likewise, the values of RMSEA and the expected value of the cross-validationindex (ECVI) indicate a much smaller goodness of fit compared to model 2. Totake the test of invariance of model parameters one step further, model 4 in Table2 assumes not only invariant factor loadings and factor covariances, but alsoinvariant factor variances. Not surprisingly, the fit of this most restrictive modelis even less acceptable compared to model 3. In sum, whereas the first two modelsshow a high and acceptable goodness of fit—indicating that the assumptions ofinvariance in model form and factor loadings can be justified—the considerablyworse fit of models 3 and 4 shows that there are cross-national differences in asso-ciations between the latent variables. In other words, the applied items togetherform a cross-nationally comparable measurement instrument (i.e., with invariantfactor loadings) for the dimensions of nationalism and ethnic exclusionism.
Applying the model with invariant factor loadings, the polychoric correla-tions between the dimensions of nationalism and ethnic exclusionism were esti-mated for each country. For a detailed discussion of these nationally specificassociations between (dimensions of) nationalism and ethnic exclusionism, werefer to our previous study (Coenders & Scheepers, 1999). Here we only mentionsome of the most striking results. First, in general, chauvinism is positively relatedto ethnic exclusionism. (Only in a few samples, for some of the dimensions ofethnic exclusionism, is the relationship not significant.) Second, chauvinism ismore strongly related to ethnic exclusionism than is patriotism. This applies foreach country and each dimension of ethnic exclusionism. This consistent findingcorresponds to the conceptual distinction between chauvinism as a blind, uncriti-cal national attachment combined with feelings of national superiority, and patri-otism as a less extreme national attachment. Third, in most countries, patriotismis not significantly related to exclusion of immigrants or political refugees. More-over, in five countries, patriotism is associated with less exclusion of immigrants(i.e., in Sweden, Hungary, Italy, the Czech Republic, and Canada) and with lessexclusion of political refugees (i.e., in Norway, and again in Sweden, Hungary,Italy, and the Czech Republic). This finding illustrates that the notion of ethno-centrism (the combination of positive ingroup attitudes and negative outgroup atti-tudes) is too simplified. That is, a positive ingroup attitude—as expressed by ahigh degree of patriotism—does not necessarily imply outgroup hostility. Finally,in only three samples did we find a positive relation between patriotism and exclu-sion of immigrants or refugees: West Germany, East Germany, and Japan.12 Pre-sumably, this striking finding is related to the special historical context in thesenations, in which debates about national identity, pride, and patriotism may be
Effect of Education on Nationalism and Ethnic Exclusionism 327
12 Patriotism was also positively related to exclusion of political refugees in Bulgaria, but the relationship between patriotism and exclusion of immigrants was not significantly negative, so thatthe results for Bulgaria are ambiguous in this respect.
strongly affected by national experiences before and during the Second WorldWar. The troublesome relation of the nations with their collective past may haveaffected the connotation of patriotism in these countries.
Independent Variables
Educational attainment was measured by means of the international edu-cational classification scheme of the ISSP. We collapsed the original seven categories into four categories: lower educational level, incomplete secondaryeducational level, completed secondary educational level, and higher educationallevel.13
To indicate respondents’ social position, we combined several variables. First,we used a variable that indicates whether respondents are currently employed.Those who were not employed were further categorized as unemployed, students,retired persons, persons working in the household, and a miscellaneous categoryof other social positions (also including employees whose occupation could notbe classified). Second, for those respondents currently employed, we recoded theavailable occupational classification codes into the nominal class typology ofErikson, Goldthorpe, and Portocarero (1979). Most ISSP members have appliedthe International Standard Classification of Occupations (ISCO) of the Interna-tional Labor Office of the United Nations, either the 1968 revision or the 1988revision (International Labor Office, 1969, 1990).14 To derive the EGP categoriesfrom ISCO68 and ISCO88, we followed the procedures of and standard modulesgenerated by Ganzeboom, Luijkx, and Treiman (1989) and Ganzeboom andTreiman (1996).15 For five countries—Italy, the Netherlands, Japan, Great Britain,and Sweden—only a nationally specific occupational classification was available.We recoded these classifications into EGP classifications by hand, following the
328 Coenders and Scheepers
13 The lowest category of the seven-category ISSP classification refers to respondents with no educa-tional qualifications as well as those still at school. Another variable indicates whether respondentsare students. To achieve a better ordinal measure of educational level, we excluded respondentsfrom our analyses if they were students and fell into the lowest category of the ISSP educationalclassification (n = 50).
14 The 1995 ISSP data set (version May 1988) contains some errors concerning the variable with theISCO-codes. That is, in contrast to the variable label, the specific variable does not contain the ISCOclassification in the Czech and Slovak republics. We contacted the original investigators and foundthat for these countries the variable refers to a country-specific occupational classification. There-fore, the original investigators in the Czech and Slovak republics supplied us with, respectively, anew data file containing the ISCO-1988 variable and a recode scheme to recode the country-spe-cific codes into ISCO-1988. Both files may be obtained from the first author.
15 To construct more appropriate EGP categories, we enhanced the occupational classification byadding information on employment status and supervisory status. That is, we applied three addi-tional variables of the ISSP data set: a variable that indicates whether respondents are self-employed(available for each country); a variable that indicates the number of employees of self-employedpersons (available for 15 countries), and a variable that indicates whether respondents superviseothers at work (not available for the United States).
aforementioned procedures.16 To avoid small class frequencies, we combinedseveral class categories, resulting in a six-category nominal class classification:higher controllers, lower controllers, routine non-manual workers, self-employed(with or without employees), manual supervisors and skilled manual workers, andsemi-unskilled manual workers.17
As a measure of economic position, we used household income. To achievea cross-nationally comparable measure, we standardized this variable within eachcountry.18 Furthermore, to avoid a small effective sample size, we substitutedmissing data by the country mean.
Finally, we included sex, age, religious denomination, and church attendanceas control variables in the analysis. Because the various samples contained dif-ferent age limits, we applied a common age limit for all samples, including onlyrespondents between 18 and 75 years of age in the analyses. We distinguished 12birth cohorts in order to explore possible nonlinear age effects. For the construc-tion of the religious denomination variable, we subsumed small or country-spe-cific denominations into broader denominational categories. We distinguishedbetween Catholic, Orthodox, and Protestant denominations; non-religiouspersons; and finally, a category consisting of non-Christian denominations andnon-valid answers (such as non-classifiable denominations, refusals, and othermissing answers). Church attendance was measured by four categories, rangingfrom never going to church to attending nearly once a week or more.19
Method
To investigate the relationship between the aforementioned individual char-acteristics and nationalism and ethnic exclusionism, we applied multiple regres-sion analyses. In these analyses, we computed the score for each dimension ofnationalism and ethnic exclusionism by applying the average sum of scores of thespecific indicators. Data were weighted to correct for nationally specific samplecharacteristics (Zentralarchiv, 1998). The total number of valid responses in the23 national samples—from 22 countries, with East and West Germany treated as separate samples—is 24,247. To achieve equal sample size for each sample,we reweighted the data to sample sizes of 1,000 (total N = 23,000).
Effect of Education on Nationalism and Ethnic Exclusionism 329
16 The EGP classifications for Italy, the Netherlands, Japan, and Great Britain should be regarded withsome caution because the original occupational categories were not very specific.
17 In Italy, no distinction could be made between skilled and semi-unskilled manual workers.18 To distinguish between single-person households and other households with the same household
income, we divided the household income by 2 for married or cohabiting respondents. In Russia,the variable refers to income per family member, and therefore we corrected the Russian data forhousehold size.
19 In three countries, a category “not applicable: no (Christian) religion” was applied. We subsumedthese respondents into the category of non-churchgoers.
All nominal variables as well as educational attainment and age were dum-mified. That is, the original variable was broken down into as many variables asit contained categories, minus one that served as a reference category.
To correct for country-specific effects, we included country as a dummy vari-able in the analyses, with one country as reference category. In this manner, weachieved more accurate estimates of the effects of individual characteristics.20 Totest whether the educational effect differs across countries according to liberal-democratic tradition or degree of religious heterogeneity, we included interactionsfor education and liberal-democratic tradition, as well as for education and reli-gious heterogeneity.
Results
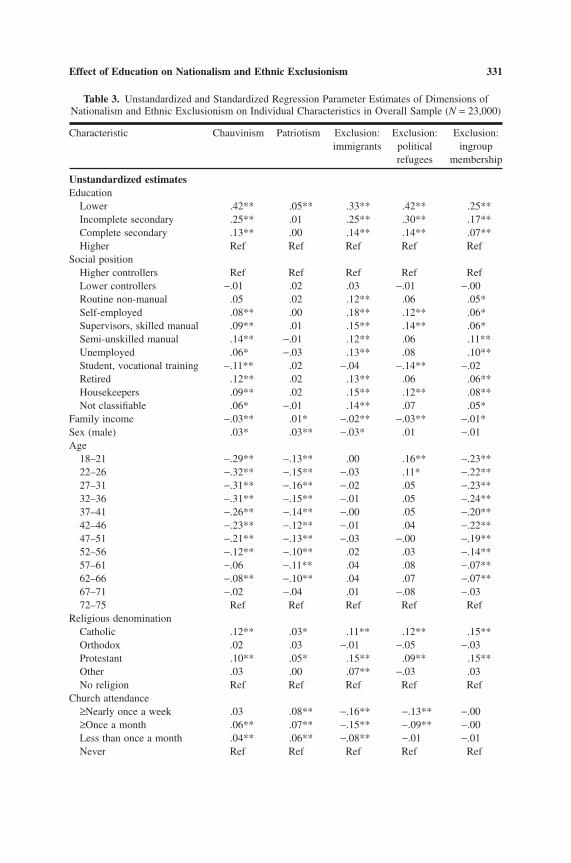
Table 3 shows the results of a multivariate regression analysis in all coun-tries simultaneously. For each of the five dependent variables, the unstandardizedregression parameters are displayed. There are considerable differences betweeneducational groups for four of the five dependent variables. When all the vari-ables displayed in Table 3 are controlled for, respondents with lower educationare more chauvinistic than those with higher education. Those with lower educa-tion are also more likely to exclude ethnic outgroups on all dimensions of ethnicexclusionism, although the sizes of the differences vary. Clearly, educationalattainment is strongly related to chauvinism and ethnic exclusionism. In contrast,there are only minor differences between educational groups regarding the degreeof patriotism. Only respondents with the lowest educational attainment level aresignificantly more patriotic than those with the highest education. Again, this con-firms our previous finding that there is a substantial difference between a positiveorientation toward the ingroup and one’s own country, characterized by feelingsof superiority and a blind, uncritical ingroup attachment (i.e., chauvinism), andfeelings of pride in specific achievements of one’s own country (i.e., patriotism).
There are also considerable differences in chauvinism and ethnic exclusion-ism between respondents with different social positions. In general, relative to thehighest social class, lower social classes display a higher degree of chauvinismand ethnic exclusionism. This finding supports the notions of realistic group con-flict theory. Relative to the reference category of higher controllers, the self-employed workers and the manual supervisors/skilled manual workers scoresignificantly higher on chauvinism and ethnic exclusionism. This is also the casefor semi-unskilled manual workers as well as for those who are unemployed, withthe exception that the difference between these groups and higher controllers isnot significant for the degree of exclusion of political refugees. Furthermore, theroutine non-manual workers score somewhat higher than the higher controllers,
330 Coenders and Scheepers
20 There are considerable cross-national differences in the variation of individual characteristics aswell as in the mean score of the dependent variables. Consequently, estimated parameters of individual characteristics obtained by an analysis without country dummies are distorted.
Effect of Education on Nationalism and Ethnic Exclusionism 331
Table 3. Unstandardized and Standardized Regression Parameter Estimates of Dimensions ofNationalism and Ethnic Exclusionism on Individual Characteristics in Overall Sample (N = 23,000)
Characteristic Chauvinism Patriotism Exclusion: Exclusion: Exclusion:immigrants political ingroup
refugees membership
Unstandardized estimatesEducation
Lower .42** .05** .33** .42** .25**Incomplete secondary .25** .01 .25** .30** .17**Complete secondary .13** .00 .14** .14** .07**Higher Ref Ref Ref Ref Ref
Social positionHigher controllers Ref Ref Ref Ref RefLower controllers -.01 .02 .03 -.01 -.00Routine non-manual .05 .02 .12** .06 .05*Self-employed .08** .00 .18** .12** .06*Supervisors, skilled manual .09** .01 .15** .14** .06*Semi-unskilled manual .14** -.01 .12** .06 .11**Unemployed .06* -.03 .13** .08 .10**Student, vocational training -.11** .02 -.04 -.14** -.02Retired .12** .02 .13** .06 .06**Housekeepers .09** .02 .15** .12** .08**Not classifiable .06* -.01 .14** .07 .05*
Family income -.03** .01* -.02** -.03** -.01*Sex (male) .03* .03** -.03* .01 -.01Age
18–21 -.29** -.13** .00 .16** -.23**22–26 -.32** -.15** -.03 .11* -.22**27–31 -.31** -.16** -.02 .05 -.23**32–36 -.31** -.15** -.01 .05 -.24**37–41 -.26** -.14** -.00 .05 -.20**42–46 -.23** -.12** -.01 .04 -.22**47–51 -.21** -.13** -.03 -.00 -.19**52–56 -.12** -.10** .02 .03 -.14**57–61 -.06 -.11** .04 .08 -.07**62–66 -.08** -.10** .04 .07 -.07**67–71 -.02 -.04 .01 -.08 -.0372–75 Ref Ref Ref Ref Ref
Religious denominationCatholic .12** .03* .11** .12** .15**Orthodox .02 .03 -.01 -.05 -.03Protestant .10** .05* .15** .09** .15**Other .03 .00 .07** -.03 .03No religion Ref Ref Ref Ref Ref
Church attendance≥Nearly once a week .03 .08** -.16** -.13** -.00≥Once a month .06** .07** -.15** -.09** -.00Less than once a month .04** .06** -.08** -.01 -.01Never Ref Ref Ref Ref Ref
but the difference is only significant for two dimensions of ethnic exclusionism.With regard to social categories outside the labor force, we find that chauvinismis lower among students but higher among retired persons and people working inthe household. For ethnic exclusionism we find the same pattern, although not alldifferences from the reference category are significant.
Controlled for educational level and social position, the effect of familyincome is rather small. The higher the income, the lower the degree of chauvin-ism and ethnic exclusionism. This finding is again in accordance with the notionsof realistic group conflict theory. Patriotism, on the other hand, is slightly posi-tively related to income level.
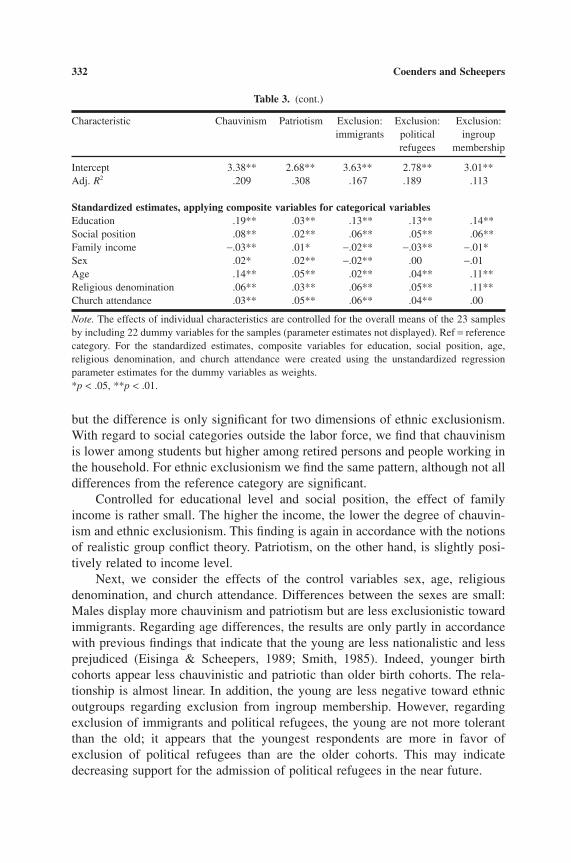
Next, we consider the effects of the control variables sex, age, religiousdenomination, and church attendance. Differences between the sexes are small:Males display more chauvinism and patriotism but are less exclusionistic towardimmigrants. Regarding age differences, the results are only partly in accordancewith previous findings that indicate that the young are less nationalistic and lessprejudiced (Eisinga & Scheepers, 1989; Smith, 1985). Indeed, younger birthcohorts appear less chauvinistic and patriotic than older birth cohorts. The rela-tionship is almost linear. In addition, the young are less negative toward ethnicoutgroups regarding exclusion from ingroup membership. However, regardingexclusion of immigrants and political refugees, the young are not more tolerantthan the old; it appears that the youngest respondents are more in favor of exclusion of political refugees than are the older cohorts. This may indicatedecreasing support for the admission of political refugees in the near future.
332 Coenders and Scheepers
Table 3. (cont.)
Characteristic Chauvinism Patriotism Exclusion: Exclusion: Exclusion:immigrants political ingroup
refugees membership
Intercept 3.38** 2.68** 3.63** 2.78** 3.01**Adj. R2 .209 .308 .167 .189 .113
Standardized estimates, applying composite variables for categorical variablesEducation .19** .03** .13** .13** .14**Social position .08** .02** .06** .05** .06**Family income -.03** .01* -.02** -.03** -.01*Sex .02* .02** -.02** .00 -.01Age .14** .05** .02** .04** .11**Religious denomination .06** .03** .06** .05** .11**Church attendance .03** .05** .06** .04** .00
Note. The effects of individual characteristics are controlled for the overall means of the 23 samplesby including 22 dummy variables for the samples (parameter estimates not displayed). Ref = referencecategory. For the standardized estimates, composite variables for education, social position, age,religious denomination, and church attendance were created using the unstandardized regressionparameter estimates for the dummy variables as weights.*p < .05, **p < .01.
In general, religious respondents are more nationalistic and exclusionisticthan non-religious respondents. Orthodox religious respondents—predominantlyinhabitants of Bulgaria, the Slovak Republic, and Russia—do not deviate fromnon-religious respondents. The results for church attendance are mixed and some-what puzzling. Whereas churchgoers are more nationalistic than non-churchgoers, they appear to be relatively less exclusionistic toward immigrantsand political refugees.
Our results indicate that educational attainment is strongly related to chau-vinism and ethnic exclusionism, even after controlling for a number of individ-ual characteristics interrelated with educational level, such as social class position,income, age, religious affiliation, and church attendance. To investigate the rela-tive importance of educational attainment for the explanation of our dependentvariables, we created composite variables for all categorical variables. A com-posite or compound variable for each categorical variable was created by usingthe estimated unstandardized regression coefficients for the dummified categories,as displayed in Table 3, as weights (Eisinga, Scheepers, & van Snippenburg,1991). Next, we conducted a second regression analysis in which each categori-cal variable was replaced by its composite variable. The standardized regressioncoefficient for the composite variable (also referred to as the Sheaf coefficient)reveals the overall effect of the categorical variable, and can be compared withthe effect of non-categorical variables such as income. The standardized regres-sion coefficients are displayed in Table 3.21 This table shows that, controlled for all other individual variables, education has the strongest overall effect onchauvinism and ethnic exclusionism. Compared to education, the effects of socialposition and income are considerably smaller. In sum, in multivariate analyses,education turns out to be the most important indicator for the explanation of indi-vidual differences in chauvinism and ethnic exclusionism. Patriotism, however, is hardly affected by educational attainment and is more strongly related to ageand church attendance.
Next, we investigated whether the effect of education varies systematicallyacross countries according to the length of liberal-democratic regime history orthe degree of religious heterogeneity of the country. For a formal test of thevarying effects of education, we computed interaction variables between educa-tion and liberal democratic tradition, and between education and religious heterogeneity. For convenience and clarity, educational attainment was treated asan interval variable in these analyses.
First, we tested whether the effect of education depends on the length of timea country has had a liberal-democratic regime form. Table 4 summarizes the
Effect of Education on Nationalism and Ethnic Exclusionism 333
21 The Sheaf coefficients for education, social position, age, religious denomination, and church atten-dance are displayed along with the standardized coefficient for sex and the unstandardized coeffi-cient for income, because the latter variable was standardized in advance within each country. Notethat the positive sign of the Sheaf coefficients is a technical artifice (Eisinga et al., 1991) and istherefore not related to the sign of the relationship between independent and dependent variable.
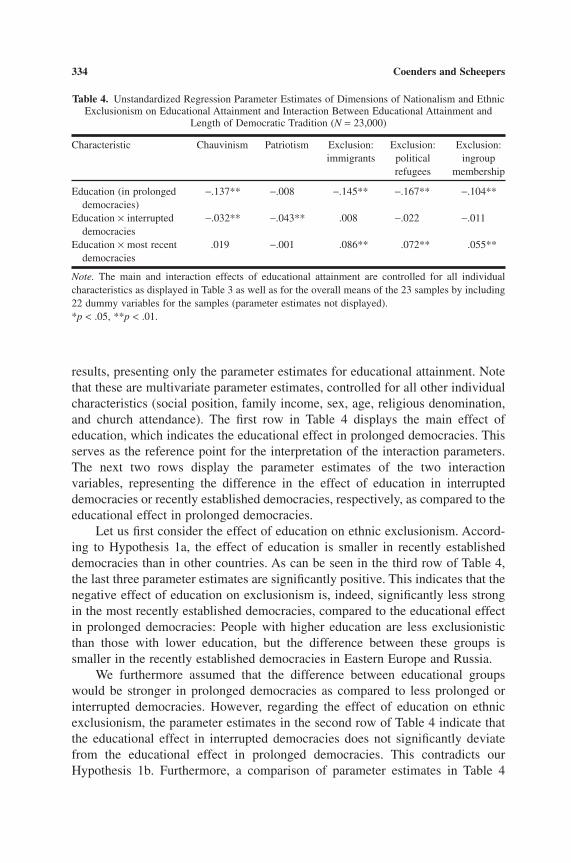
results, presenting only the parameter estimates for educational attainment. Notethat these are multivariate parameter estimates, controlled for all other individualcharacteristics (social position, family income, sex, age, religious denomination,and church attendance). The first row in Table 4 displays the main effect of education, which indicates the educational effect in prolonged democracies. Thisserves as the reference point for the interpretation of the interaction parameters.The next two rows display the parameter estimates of the two interaction variables, representing the difference in the effect of education in interrupteddemocracies or recently established democracies, respectively, as compared to theeducational effect in prolonged democracies.
Let us first consider the effect of education on ethnic exclusionism. Accord-ing to Hypothesis 1a, the effect of education is smaller in recently establisheddemocracies than in other countries. As can be seen in the third row of Table 4,the last three parameter estimates are significantly positive. This indicates that thenegative effect of education on exclusionism is, indeed, significantly less strongin the most recently established democracies, compared to the educational effectin prolonged democracies: People with higher education are less exclusionisticthan those with lower education, but the difference between these groups issmaller in the recently established democracies in Eastern Europe and Russia.
We furthermore assumed that the difference between educational groupswould be stronger in prolonged democracies as compared to less prolonged orinterrupted democracies. However, regarding the effect of education on ethnicexclusionism, the parameter estimates in the second row of Table 4 indicate thatthe educational effect in interrupted democracies does not significantly deviatefrom the educational effect in prolonged democracies. This contradicts ourHypothesis 1b. Furthermore, a comparison of parameter estimates in Table 4
334 Coenders and Scheepers
Table 4. Unstandardized Regression Parameter Estimates of Dimensions of Nationalism and EthnicExclusionism on Educational Attainment and Interaction Between Educational Attainment and
Length of Democratic Tradition (N = 23,000)
Characteristic Chauvinism Patriotism Exclusion: Exclusion: Exclusion:immigrants political ingroup
refugees membership
Education (in prolonged -.137** -.008 -.145** -.167** -.104**democracies)
Education ¥ interrupted -.032** -.043** .008 -.022 -.011democracies
Education ¥ most recent .019 -.001 .086** .072** .055**democracies
Note. The main and interaction effects of educational attainment are controlled for all individualcharacteristics as displayed in Table 3 as well as for the overall means of the 23 samples by including22 dummy variables for the samples (parameter estimates not displayed).*p < .05, **p < .01.
reveals that the effect of education on ethnic exclusionism in interrupted democracies is stronger than in recently established democracies. A replication ofthe analysis, with the educational effect in recently established democracies asreference, showed that this difference is indeed significant.
In sum, the effect of education on ethnic exclusionism is significantly lessstrong in recently established democracies than in either prolonged democraciesor interrupted democracies, confirming Hypothesis 1a. However, the educationaleffect in prolonged democracies does not significantly deviate from the educa-tional effect in interrupted democracies, refuting Hypothesis 1b.
Let us now turn to the effect of education on chauvinism and patriotism. Asshown in Table 4, there is no significant difference in the effect of education inrecently established democracies as compared to the effect of education in pro-longed democracies. Furthermore, the parameters in the second row of Table 4indicate that the negative effect of education in interrupted democracies is—contrary to our expectation—significantly stronger than in prolonged democra-cies. These findings refute Hypotheses 1a and 1b regarding the varying effect ofeducation on nationalism.
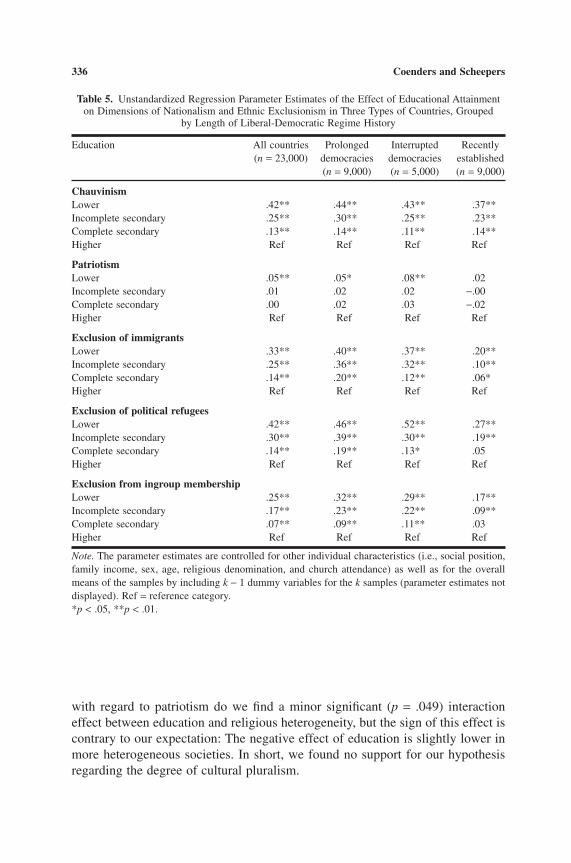
To formally test the differential effects of education in prolonged, interrupted,and newly established democracies, we had treated education as an interval vari-able for matters of convenience and clarity. Now that we have established that theeducational effect does vary to some extent between these types of countries, wepresent the parameter estimates for all educational categories. Table 5 shows theresults of separate multivariate regression analyses for prolonged, interrupted, andrecently established democracies. Note once again that the parameter estimatesfor educational attainment are controlled for all other individual characteristics.
As already established in a formal manner, we see in Table 5 that, regardingethnic exclusionism, the differences between educational groups are considerablysmaller in recently established democracies compared to prolonged or interrupteddemocracies. The differences in educational effects between the latter two typesof countries are minor. Regarding chauvinism and patriotism, we find relativelysmall differences in the effect of education in the three types of countries.
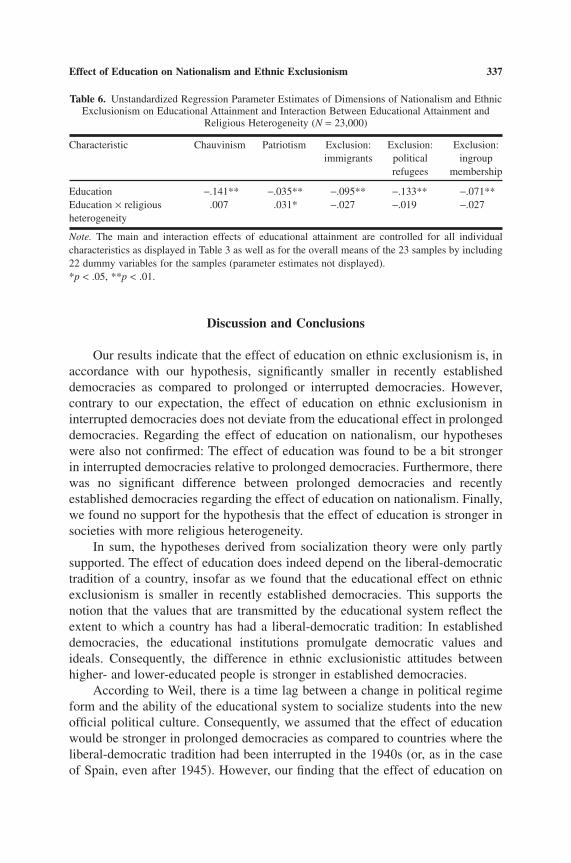
Next, we tested whether the effect of education varies according to the degreeof religious heterogeneity. The results are summarized in Table 6, in which theparameter estimates of educational attainment (as an interval variable) and theinteraction between educational attainment and degree of religious heterogeneityof a country are displayed. Note once again that these are multivariate parameterestimates, controlled for all other individual characteristics as displayed in Table 3.
According to Hypothesis 2, the effect of education on nationalism and ethnicexclusionism is stronger in more heterogeneous societies. However, as shown inthe second row of Table 6, for four of the dependent variables, we found no sig-nificant interaction between the size of the (linear) educational effect and thedegree of religious heterogeneity of a country. This refutes our hypothesis. Only
Effect of Education on Nationalism and Ethnic Exclusionism 335
with regard to patriotism do we find a minor significant (p = .049) interactioneffect between education and religious heterogeneity, but the sign of this effect iscontrary to our expectation: The negative effect of education is slightly lower inmore heterogeneous societies. In short, we found no support for our hypothesisregarding the degree of cultural pluralism.
336 Coenders and Scheepers
Table 5. Unstandardized Regression Parameter Estimates of the Effect of Educational Attainmenton Dimensions of Nationalism and Ethnic Exclusionism in Three Types of Countries, Grouped
by Length of Liberal-Democratic Regime History
Education All countries Prolonged Interrupted Recently(n = 23,000) democracies democracies established
(n = 9,000) (n = 5,000) (n = 9,000)
ChauvinismLower .42** .44** .43** .37**Incomplete secondary .25** .30** .25** .23**Complete secondary .13** .14** .11** .14**Higher Ref Ref Ref Ref
PatriotismLower .05** .05* .08** .02Incomplete secondary .01 .02 .02 -.00Complete secondary .00 .02 .03 -.02Higher Ref Ref Ref Ref
Exclusion of immigrantsLower .33** .40** .37** .20**Incomplete secondary .25** .36** .32** .10**Complete secondary .14** .20** .12** .06*Higher Ref Ref Ref Ref
Exclusion of political refugeesLower .42** .46** .52** .27**Incomplete secondary .30** .39** .30** .19**Complete secondary .14** .19** .13* .05Higher Ref Ref Ref Ref
Exclusion from ingroup membershipLower .25** .32** .29** .17**Incomplete secondary .17** .23** .22** .09**Complete secondary .07** .09** .11** .03Higher Ref Ref Ref Ref
Note. The parameter estimates are controlled for other individual characteristics (i.e., social position,family income, sex, age, religious denomination, and church attendance) as well as for the overallmeans of the samples by including k - 1 dummy variables for the k samples (parameter estimates notdisplayed). Ref = reference category.*p < .05, **p < .01.
Discussion and Conclusions
Our results indicate that the effect of education on ethnic exclusionism is, inaccordance with our hypothesis, significantly smaller in recently establisheddemocracies as compared to prolonged or interrupted democracies. However, contrary to our expectation, the effect of education on ethnic exclusionism in interrupted democracies does not deviate from the educational effect in prolongeddemocracies. Regarding the effect of education on nationalism, our hypotheseswere also not confirmed: The effect of education was found to be a bit strongerin interrupted democracies relative to prolonged democracies. Furthermore, therewas no significant difference between prolonged democracies and recently established democracies regarding the effect of education on nationalism. Finally,we found no support for the hypothesis that the effect of education is stronger insocieties with more religious heterogeneity.
In sum, the hypotheses derived from socialization theory were only partlysupported. The effect of education does indeed depend on the liberal-democratictradition of a country, insofar as we found that the educational effect on ethnicexclusionism is smaller in recently established democracies. This supports thenotion that the values that are transmitted by the educational system reflect theextent to which a country has had a liberal-democratic tradition: In establisheddemocracies, the educational institutions promulgate democratic values andideals. Consequently, the difference in ethnic exclusionistic attitudes betweenhigher- and lower-educated people is stronger in established democracies.
According to Weil, there is a time lag between a change in political regimeform and the ability of the educational system to socialize students into the newofficial political culture. Consequently, we assumed that the effect of educationwould be stronger in prolonged democracies as compared to countries where theliberal-democratic tradition had been interrupted in the 1940s (or, as in the caseof Spain, even after 1945). However, our finding that the effect of education on
Effect of Education on Nationalism and Ethnic Exclusionism 337
Table 6. Unstandardized Regression Parameter Estimates of Dimensions of Nationalism and EthnicExclusionism on Educational Attainment and Interaction Between Educational Attainment and
Religious Heterogeneity (N = 23,000)
Characteristic Chauvinism Patriotism Exclusion: Exclusion: Exclusion:immigrants political ingroup
refugees membership
Education -.141** -.035** -.095** -.133** -.071**Education ¥ religious .007 .031* -.027 -.019 -.027heterogeneity
Note. The main and interaction effects of educational attainment are controlled for all individualcharacteristics as displayed in Table 3 as well as for the overall means of the 23 samples by including22 dummy variables for the samples (parameter estimates not displayed).*p < .05, **p < .01.
ethnic exclusionism in interrupted democracies (i.e., West Germany, Austria, Italy,Spain, and Japan) is not smaller than the effect of education in more prolongeddemocracies suggests that, in 1995, the populations of interrupted democracieshave been socialized to democratic values to the same extent as the populationsof prolonged democracies.
When we compare the effect of education in prolonged and recently estab-lished democracies, our results indicate that in countries with a short democratichistory, the effect of education on ethnic exclusionism is smaller, but there is nodifference in the effect of education on nationalism. A possible interpretation ofthis dissimilar result is the proposition that educational institutions in countrieswith a longstanding democratic history transmit and promulgate the ideals ofdemocracy and tolerance, but that the focus is more on the deprecation of out-group hostility than on the deprecation of ingroup favoritism.
Finally, our results indicate that the effect of education does not depend onthe degree of cultural pluralism within a country. Our hypothesis that the effectof education would be stronger in plural societies was based on political theoriesof conflict resolution in plural societies. According to Lijphart (1977), in a pluralsociety political elites must take the lead in promoting peaceful accommodationamong the different population segments. Because, according to socializationtheory, the values and norms transmitted by the educational system reflect thepolitical culture of a country, one would expect that in a heterogeneous society,educational institutions are more likely to instill tolerant attitudes (Weil, 1985).An alternative test of the notion of conflict resolution in societies with varyingdegrees of cultural pluralism would be to focus not on public opinion, as we havedone, but instead on the attitudes of the political elites in these countries.
APPENDIX A: National Characteristics
Country Liberal-democratic Religious tradition heterogeneity
Australia Long High .88Austria Interrupted Moderate .43Bulgaria Short Moderate .40Canada Long High .78Czech Republic Short Moderate .63Germany (east) Short Moderate .64Germany (west) Interrupted High .79Great Britain Long High .76Hungary Short Moderate .57Ireland Long Low .15Italy Interrupted Low .14Japan Interrupted Moderate .59Latvia Short High .86Netherlands Long Moderate .66New Zealand Long High .87Norway Long Low .27
338 Coenders and Scheepers
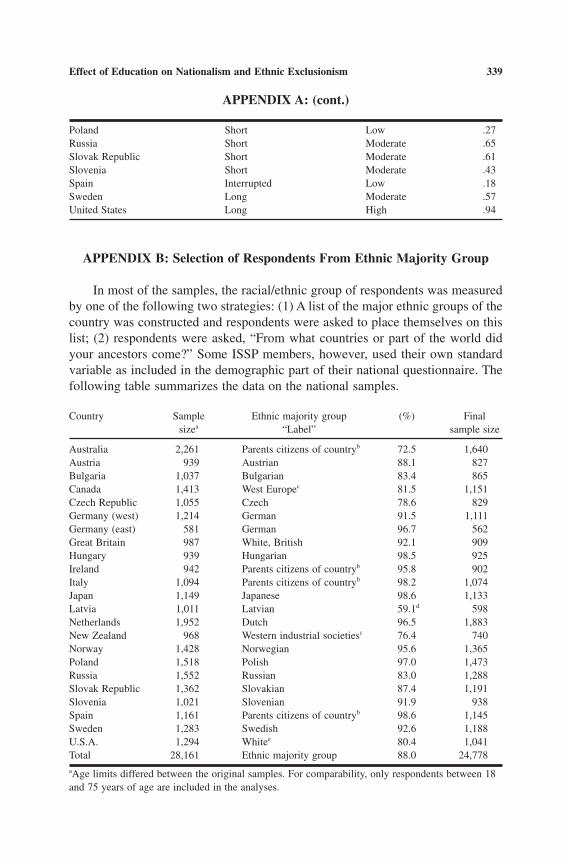
APPENDIX A: (cont.)
Poland Short Low .27Russia Short Moderate .65Slovak Republic Short Moderate .61Slovenia Short Moderate .43Spain Interrupted Low .18Sweden Long Moderate .57United States Long High .94
APPENDIX B: Selection of Respondents From Ethnic Majority Group
In most of the samples, the racial/ethnic group of respondents was measuredby one of the following two strategies: (1) A list of the major ethnic groups of thecountry was constructed and respondents were asked to place themselves on thislist; (2) respondents were asked, “From what countries or part of the world didyour ancestors come?” Some ISSP members, however, used their own standardvariable as included in the demographic part of their national questionnaire. Thefollowing table summarizes the data on the national samples.
Country Sample Ethnic majority group (%) Finalsizea “Label” sample size
Australia 2,261 Parents citizens of countryb 72.5 1,640Austria 939 Austrian 88.1 827Bulgaria 1,037 Bulgarian 83.4 865Canada 1,413 West Europec 81.5 1,151Czech Republic 1,055 Czech 78.6 829Germany (west) 1,214 German 91.5 1,111Germany (east) 581 German 96.7 562Great Britain 987 White, British 92.1 909Hungary 939 Hungarian 98.5 925Ireland 942 Parents citizens of countryb 95.8 902Italy 1,094 Parents citizens of countryb 98.2 1,074Japan 1,149 Japanese 98.6 1,133Latvia 1,011 Latvian 59.1d 598Netherlands 1,952 Dutch 96.5 1,883New Zealand 968 Western industrial societiesc 76.4 740Norway 1,428 Norwegian 95.6 1,365Poland 1,518 Polish 97.0 1,473Russia 1,552 Russian 83.0 1,288Slovak Republic 1,362 Slovakian 87.4 1,191Slovenia 1,021 Slovenian 91.9 938Spain 1,161 Parents citizens of countryb 98.6 1,145Sweden 1,283 Swedish 92.6 1,188U.S.A. 1,294 Whitee 80.4 1,041Total 28,161 Ethnic majority group 88.0 24,778aAge limits differed between the original samples. For comparability, only respondents between 18and 75 years of age are included in the analyses.
Effect of Education on Nationalism and Ethnic Exclusionism 339
bBecause the variable “racial/ethnic group” was not available in this sample, respondents wereselected if both parents were citizens of the specific country at the time the respondent was born.cMultiple categories.d30.2% of the respondents in the Latvian sample are Russians.eFor the U.S. sample, the number of missings on the variable “racial/ethnic group” is very high(21.2%). Fortunately, the original U.S. data set—which consists of a much larger set of items thanthose available in the ISSP 1995 data set—contains an additional variable “racial-ethnic group ofrespondent” with the categories “black / white / other.” We matched this item to the ISSP 1995 dataset and applied this item to select respondents who defined themselves as “whites.”
ACKNOWLEDGMENTS
This research was supported by the Netherlands Organization for ScientificResearch (NWO) and is part of a larger research project by Dutch sociologistsand social psychologists entitled “Cross-National Comparisons of National Iden-tifications and Exclusionistic Reactions.” Correspondence concerning this articleshould be sent to Marcel Coenders, Department of Research Methodology/ICS,University of Nijmegen, P.O. Box 9104, 6500 HE Nijmegen, Netherlands. E-mail:[email protected]
REFERENCES
Adorno, T. W., Frenkel-Brunswik, E., Levinson, D. J., & Sanford, R. N. (1950). The authoritarianpersonality. New York: Harper.
Agresti, A., & Agresti, B. F. (1977). Statistical analysis of qualitative variation. In K. F. Schuessler(Ed.), Sociological methodology 1978 (pp. 204–237). San Francisco: Jossey-Bass.
Bar-Tal, D., & Staub, E. (Eds.). (1997). Patriotism in the lives of individuals and nations. Chicago:Nelson-Hall.
Bielby, W. T. (1986). Arbitrary metrics in multiple-indicator models of latent variables. SociologicalMethods & Research, 15, 3–23.
Billiet, J., Carton, A., & Huys, R. (1990). Onbekend of onbemind? Een sociologisch onderzoek naar de houding van de belgen tegenover migranten. Leuven, Belgium: Sociologisch Onderzoeksinstituut.
Blalock, H. M. (1967). Toward a theory of minority-group relations. New York: Wiley.
Blank, T., & Schmidt, P. (1993). Verletzte oder verletzende Nation? Empirische Befunde zum Stolzauf Deutschland. Journal für Sozialforschung, 33, 391–415.
Blumer, H. (1958). Race prejudice as a sense of group position. Pacific Sociological Review, 1(1),3–7.
Bobo, L. (1988). Group conflict, prejudice, and the paradox of contemporary racial attitudes. In P. A.Katz & D. A. Taylor (Eds.), Eliminating racism. Profiles in controversy (pp. 85–114). New York:Plenum.
Bobo, L., & Licari, F. C. (1989). Education and political tolerance. Testing the effects of cognitivesophistication and target group affect. Public Opinion Quarterly, 53, 285–308.
Bollen, K. A. (1989). Structural equations with latent variables. New York: Wiley.
Browne, M. W., & Cudeck, R. (1992). Alternative ways of assessing model fit. Sociological Methods& Research, 21, 230–258.
340 Coenders and Scheepers
Coenders, M., & Scheepers, P. (1998). Support for ethnic discrimination in the Netherlands1979–1993: Effects of period, cohort, and individual characteristics. European SociologicalReview, 14, 405–422.
Coenders, M., & Scheepers, P. (1999). Een internationale vergelijking van nationalisme en etnischexclusionisme. In W. A. R. Shadid & P. S. Koningsveld (Eds.), Beeldvorming en IntercultureleCommunicatie (pp. 15–40). Tilburg, Netherlands: Tilburg University Press.
Coser, L. A. (1956). The functions of social conflict. Glencoe, IL: Free Press.
de Witte, H. (1999). “Everyday” racism in Belgium: An overview of the research and an interpreta-tion of its link with education. In L. Hagendoorn & S. Nekuee (Eds.), Education and racism: Across-national inventory of positive effects of education on ethnic tolerance (pp. 47–74). Utrecht,Netherlands: ERCOMER/Utrecht University.
Eisinga, R., & Scheepers, P. (1989). Etnocentrisme in Nederland. Theoretische en empirische mod-ellen. Nijmegen, Netherlands: ITS.
Eisinga, R., Scheepers, P., & van Snippenburg, L. (1991). The standardized effect of a compound ofdummy variables or polynomial terms. Quality & Quantity, 25, 103–114.
Erikson, R., Goldthorpe, J. H., & Portocarero, L. (1979). International class mobility in three WesternEuropean countries. British Journal of Sociology, 30, 415–441.
Fuchs, D., Gerhards, J., & Roller, E. (1993). Wir und die Anderen. Ethnozentrismus in den zwölfLändern der europäischen Gemeinschaft. Kölner Zeitschrift für Soziologie und Sozialpsycholo-gie, 45, 238–253.
Gabennesch, H. (1972). Authoritarianism as world view. American Journal of Sociology, 77, 857–875.
Ganzeboom, H. B. G., Luijkx, R., & Treiman, D. J. (1989). Intergenerational class mobility in com-parative perspective. Research in Social Stratification and Mobility, 8, 3–84.
Ganzeboom, H. B. G., & Treiman, D. J. (1996). Internationally comparable measures of occupationalstatus for the 1988 International Standard Classification of Occupations. Social ScienceResearch, 25, 201–239.
Greeley, A. M., & Sheatsley, P. B. (1971). Attitudes toward racial integration. Scientific American,225(6), 13–19.
Hyman, H. H., & Sheatsley, P. B. (1956). Attitudes toward desegregation. Scientific American, 195(6),35–39.
Hyman, H. H., & Sheatsley, P. B. (1964). Attitudes toward desegregation. Scientific American, 211(1),16–23.
Hyman, H. H., & Wright, C. R. (1979). Education’s lasting influence on values. Chicago: The University of Chicago Press.
Hyman, H. H., Wright, C. R., & Reed, J. S. (1975). The enduring effects of education. Chicago: University of Chicago Press.
International Labor Office (1969). International standard classification of occupations: ISCO68.Geneva: Author.
International Labor Office (1990). International standard classification of occupations: ISCO88.Geneva: Author.
Jackman, M. (1973). Education and prejudice or education and response-set? American SociologicalReview, 38, 327–339.
Jackman, M. (1978). General and applied tolerance: Does education increase commitment to racialintegration? American Journal of Political Science, 22, 302–324.
Jackman, M., & Muha, M. (1984). Education and intergroup attitudes. Moral enlightenment, superficial democratic commitment, or ideological refinement? American Sociological Review,49, 751–769.
Jöreskog, K. G., & Sörbom, D. (1993a). LISREL 8: Structural equation modeling with the SIMPLIScommand language. Chicago: Scientific Software International.
Effect of Education on Nationalism and Ethnic Exclusionism 341
Jöreskog, K. G., & Sörbom, D. (1993b). LISREL 8 user’s reference guide. Chicago: Scientific Software International.
Kiehl, M., & Werner, H. (1998). The labour market situation of EU and of third country nationals in the European Union. Labour market topics no. 32. Nürnberg, Germany: Institut für Arbeitsmarkt- und Berufsforschung der Bundesanstalt für Arbeit.
Kosterman, R., & Feshbach, S. (1989). Toward a measure of patriotic and nationalistic attitudes. Political Psychology, 10, 257–274.
LeVine, R. A., & Campbell, D. T. (1972). Ethnocentrism: Theories of conflict, ethnic attitudes, andgroup behavior. New York: Wiley.
Lijphart, A. (1977). Democracy in plural societies. A comparative exploration. New Haven, CT: YaleUniversity Press.
Lipset, S. M. (1981). Political man. The social bases of politics (Expanded and updated ed.). Baltimore: Johns Hopkins University Press.
Martire, G., & Clark, R. (1982). Anti-Semitism in the United States. A study of prejudice in the 1980s.New York: Praeger.
Olzak, S., & Nagel, J. (1986). Competitive ethnic relations. Orlando, FL: Academic Press.
Roof, W. C. (1974). Religious orthodoxy and minority prejudice: Causal relationship or reflection oflocalistic world view. American Journal of Sociology, 80, 630–644.
Schatz, R., Staub, E. & Lavine, H. (1999). On the varieties of national attachment: Blind versus con-structive patriotism. Political Psychology, 20, 151–174.
Scheepers, P., Felling, A., & Peters, J. (1990). Social conditions, authoritarianism and ethnocentrism:A theoretical model of the early Frankfurt School updated and tested. European SociologicalReview, 6, 15–29.
Schönbach, P., Gollwitzer, P., Stiepel, G., & Wagner, U. (1981). Education and intergroup attitudes.London: Academic Press.
Schuman, H., Steeh, C., Bobo, L., & Krysan, M. (1997). Racial attitudes in America. Trends and inter-pretations (rev. ed.). Cambridge, MA: Harvard University Press.
Selznick, G. J., & Steinberg, S. (1969). The tenacity of prejudice. Anti-Semitism in contemporaryAmerica. New York: Harper and Row.
Sherif, M., & Sherif, C. W. (1979). Research on intergroup relations. In W. G. Austin & S. Worchel(Eds.), The social psychology of intergroup relations (pp. 7–18). Monterey, CA: Brooks/Cole.
Smith, A. W. (1981). Racial tolerance as a function of group position. American Sociological Review,46, 558–573.
Smith, A. W. (1985). Cohorts, education, and the evolution of tolerance. Social Science Research, 14,205–225.
Staub, E. (1997). Blind versus constructive patriotism: Moving from embeddedness in the group tocritical loyalty and action. In D. Bar-Tal & E. Staub (Eds.), Patriotism in the lives of individu-als and nations (pp. 213–228). Chicago: Nelson-Hall.
Stephan, W. G., & Stephan, C. W. (1984). The role of ignorance in intergroup relations. In N. Miller& M. B. Brewer (Eds.), Groups in contact: The psychology of desegregation (pp. 229–255).Orlando, FL: Academic Press.
Stouffer, S. A. (1955). Communism, conformity, and civil liberties. New York: Wiley.
Sumner, W. G. (1959). Folkways. New York: Dover. (Original work published 1906)
Tajfel, H. (1981). Human groups and social categories: Studies in social psychology. Cambridge:Cambridge University Press.
Tajfel, H. (1982). Social identity and intergroup relations. Cambridge: Cambridge University Press.
Taylor, D. G., Sheatsley, P. B., & Greeley, A. M. (1978). Attitudes toward racial integration. ScientificAmerican, 238(6), 30–37.
342 Coenders and Scheepers
Vogt, P. W. (1997). Tolerance and education. Learning to live with diversity and difference. ThousandOaks, CA: Sage.
Wagner, U., & Schönbach, P. (1984). Links between educational status and prejudice: Ethnic attitudesin West Germany. In N. Miller & M. B. Brewer (Eds.), Groups in contact: The psychology ofdesegregation (pp. 29–52). Orlando, FL: Academic Press.
Wagner, U., & Zick, A. (1995). The relation of formal education to ethnic prejudice: Its reliability,validity and explanation. European Journal of Social Psychology, 25, 41–56.
Walzer, S. (1994). The role of gender in determining abortion attitudes. Social Science Quarterly, 89,963–966.
Weil, F. D. (1985). The variable effects of education on liberal attitudes: A comparative-historicalanalysis of anti-Semitism using public opinion survey data. American Sociological Review, 50,458–474.
Wilcox, C. (1992). Race, religion and abortion attitudes. Sociological Analysis, 53, 97–105.
Williams, R., & Thomson, E. (1986). Normalization issues in latent variable modeling. SociologicalMethods & Research, 15, 24–43.
Winkler, J. (1999). Explaining individual racial prejudice in contemporary Germany. In L. Hagendoorn & S. Nekuee (Eds.), Education and racism: A cross-national inventory of positive effects of education on ethnic tolerance (pp. 93–136). Utrecht, Netherlands: ERCOMER/Utrecht University.
Zentralarchiv für Empirische Sozialforschung (1998). Codebook ZA Study 2880: ISSP 1995 NationalIdentity (2nd ed., May 1998). Köln: Author.
Effect of Education on Nationalism and Ethnic Exclusionism 343