Embed Size (px)
Citation preview
THE EFFECT OF CRATOXYLUM COCHINCHINENSE LOUR (CCL) ON GLOBAL mRNA GENE EXPRESSION
IN HepG2 LIVER CANCER CELLS
NG YUN KWAN
MASTER OF MEDICAL SCIENCES
FACULTY OF MEDICINE AND HEALTH SCIENCES UNIVERSITI TUNKU ABDUL RAHMAN
MAY 2017
THE EFFECT OF CRATOXYLUM COCHINCHINENSE LOUR (CCL)
ON GLOBAL mRNA GENE EXPRESSION IN HepG2 LIVER CANCER
CELLS
BY
NG YUN KWAN
A dissertation submitted to the Department of Pre-Clinical Sciences,
Faculty of Medicine and Health Sciences,
Universiti Tunku Abdul Rahman,
in partial fulfillment of the requirements for the degree of
Master of Medical Sciences
MAY 2017
ii
ABSTRACT
THE EFFECT OF CRATOXYLUM COCHINCHINENSE LOUR (CCL)
ON GLOBAL mRNA GENE EXPRESSION IN HepG2 LIVER CANCER
CELL
Ng Yun Kwan
Cratoxylum cochinchinense Lour (CCL) has been widely used in many Asian
countries over the years for curing various diseases, including cancer. Many
studies have been done regarding the phytochemical characteristics isolated
from the leaves, stems, roots, barks, and twigs of this plant. However, no details
have yet been reported regarding the regulatory effect of these phytochemicals
on the cancer signalling pathways so as to support its use as an anticancer agent.
Hence, this study was carried out to determine the regulatory effects of CCL on
the global gene expression in HepG2 liver cells. A sequential solvent extraction
method was used to extract the crude extracts from the barks, stems and exudate
of CCL, which were further tested for their cytotoxicity on the HepG2 cancer
cells by tetrazolium-based MTT assay. The solvents used in the sequential
extraction method included petroleum ether (PE), ethyl acetate (EA) and
methanol (MeOH). Results indicated that the bark-PE extract exhibited the most
cytotoxic effect towards the cells and was chosen for the microarray gene
expression analysis. The gene expression data were not only compared between
the bark-PE extract-treated samples and untreated samples, but also compared
among different time-points, ranging from 0, 6, 12, 18, 24, to 48 hours. The
microarray data summarized that the bark-PE extract showed a significant
regulatory effect on focal adhesion, adherens junction, natural killer cell
iii
cytotoxicity, cytokine- cytokine receptor interaction, chemokine signalling, B-
cell receptor, apoptosis, WNT signalling, Notch, JAK-STAT and mTOR
pathways. Its inhibitory effect was also observed in ErbB, TGF-, cell cycle,
Toll-like, RIG-like, Nod-like signalling, T-cell receptor, VEGF, MAPK, P53,
Hedgehog pathway. Genes highly expressed in hepatocellular carcinoma (HCC)
that were observed to be down-regulated in this study include IL8, IL11, IL6R,
CCL20, LIF, ACVR1, SOS1, BCAR1, VASP, ZYX, CD22, SLUG, IRAK2, FOSL1,
WNT11, PIM1, JAG1, WEE1, HES1, AREG, EREG, DDIT4, IDI, FST, JUND,
LCK, RICTOR, PI3KCA, EGFR, PARD3 and JUN, while genes expressed low
in HCC that were observed to be up-regulated significantly, include MKK6,
RBL1, TRAIL, and TNSRSF19. These preliminary results suggest that the Bark-
PE extract of CCL possess a significant potential in regulating the multiple
dysfunctional signalling pathways in HCC. However, downregulated P38 of
MAPK pathway and upregulated SKP2 of cell cycle may have crosstalk-effect
and hold back their inhibitory effects. The finding of this study is significant
since it indicates CCL has the inhibitory effect on the HepG2 cancer cells. This
provides the scientific proof for interested communities to exploit further on its
potential application clinically. The richness of diterpenes and sesquiterpenes
was noted in bark-PE extract. This indicates that they are likely the potent
inhibitors of liver cancer. The study also paves the way for future studies in CCL,
including, but not limited to, identification of active compounds of CCL as
potent anti-HCC agent, expansion of the experiment with a broader range of
cancer cell lines and clinical study using CCL on HCC subjects.

iv
ACKNOWLEDGEMENT
My gratitude goes to the people who have shown me much support in
various ways throughout my study and research. I would like to give my first
note of appreciation to Associate Prof Dr Thaw Zin for his supervisory effort to
oversee the successful end of this study.
I am incredibly fortunate to have had Prof Dr Lim Yang Mooi as one of
the advisors and mentors too. It is her expertise and guidance, without which this
research would not come through or be finished in this orderly manner. My
gratitude also goes to Associate Prof Dr Yang Zao for his selfless guidance in
using TCM for cancer treatment.
I am also deeply indebted to many friends and acquaintances who have
lent their unreserved assistance and expertise to this work. Among those who
must be singled out are Ms. Le Tian Xin, who guided me through the rudiments
of herb extraction, cell culture, DNA & RNA& protein extraction; and my many
laboratory friends, with special thanks to the Dr. Wong Teck Yew, Ms. Tan Ping
Wey, Ms. Nurul Amira bt Buslima, Dr Lim Kian Lam, Ms. Erica Choong, Mr.
Kaliswaran a/l Pannirselvam, Ms. Esther Ho, Mr. Ho Yu Siong, Ms. Lee Mei
Wei, Ms. Wong Tze Hann, without whom I may not be able to finish this study
in this smooth pace.
I must also extend my appreciation to all my suppliers, especially so to
Mr Lai Jiun Yee of Qiagen Malaysia for his selfless sharing in PCR assay and to

v
Ms Teng Loong Hung of Research Instrument Sdn Bhd for her patient guidance
in microarray assays.
vi
APPROVAL SHEET
This dissertation entitled “THE EFFECT OF CRATOXYLUM
COCHINCHINENSE LOUR (CCL) ON GLOBAL mRNA GENE
EXPRESSION IN HepG2 LIVER CANCER CELLS” was prepared by NG
YUN KWAN and submitted as partial fulfillment of the requirements for the
degree of Master of Medical Sciences at Universiti Tunku Abdul Rahman.
Approved by:
___________________________
(Associate Prof. Dr. Thaw Zin)
Date:…………………..
Supervisor
Department of Pre-clinical Sciences
Faculty of Medicine and Health Sciences
Universiti Tunku Abdul Rahman
________________________
(Prof. Dr. LIM YANG MOOI)
Date:…………………..
Co-supervisor
Department of Pre-clinical Sciences
Faculty of Medicine and Health Sciences
Universiti Tunku Abdul Rahman
_________________________
(Associate Prof. Dr. Yang Zao)
Date:…………………..
Co-supervisor
Department of Pre-clinical Sciences
Faculty of Medicine and Health Sciences
Universiti Tunku Abdul Rahman
vii
FACULTY OF MEDICINE AND HEATLH SCIENCES
UNIVERSITI TUNKU ABDUL RAHMAN
Date: __________________
SUBMISSION OF DISSERTATION
It is hereby certified that NG YUN KWAN (ID No: 13UMM08526 ) has
completed this dissertation entitled “THE EFFECT OF CRATOXYLUM
COCHINCHINENSE LOUR (CCL) ON GLOBAL mRNA GENE
EXPRESSION IN HepG2 LIVER CANCER CELLS” under the
supervision of Associate Prof Dr Thaw Zin (Supervisor) from the Department
of Pre-clinical Sciences, Faculty of Medicine and Health Sciences, and Prof
Dr Lim Yang Mooi (Co-Supervisor) from the Department of Pre-clinical
Sciences, Faculty of Medicine and Health Sciences, and Associate Prof Dr
Yang Zao (Co-Supervisor) from the Department of Chinese Medicine, Faculty
of Medicine and Health Sciences.
I understand that University will upload softcopy of my dissertation in pdf
format into UTAR Institutional Repository, which may be made accessible to
UTAR community and public.
Yours truly,
____________________
(NG YUN KWAN)
viii
DECLARATION
I hereby declare that the dissertation is based on my original work except for
quotations and citations which have been duly acknowledged. I also declare that
it has not been previously or concurrently submitted for any other degree at
UTAR or other institutions.
Name: ____________________________
(NG YUN KWAN)
Date: _____________________________
ix
TABLE OF CONTENTS
Page
ABSTRACT ii ACKNOWLEDGEMENT iv
APPROVAL SHEET vi SUBMISSION OF DISSERTATION vii DECLARATION viii LIST OF TABLES xiii LIST OF FIGURES xvi
LIST OF PLATES xix LIST OF ABBREVIATIONS xx
CHAPTER
1.0 INTRODUCTION 1
2.0 LITERATURE REVIEW 6 2.1 Cancer 6
2.1.1 Burden of Cancer 6
2.1.2 Risk Factors of Cancers 7
2.2 Liver Cancer 8
2.2.1 Burden of Liver Cancer 8 2.2.2 Risk Factors of Liver Cancer 9
2.2.3 Conventional Treatment Methods for Liver Cancer 11 2.3 Targeted Therapy 12 2.3.1 Targeted Therapy for Liver Cancer - Sorafenib 14
2.4 In vitro model of the human liver cancer - HepG2 Cell Line 15
2.5 Potential of Plant as a Source of Alternative Medicine for
Cancer Treatment 16 2.5.1 Plant - Cratoxylum cochinchinense (CCL) Lour 20 2.5.2 Metabolic Fingerprinting of Plant 26 2.6 Overview of Gene Expression Technology 29
3.0 MATERIAL AND METHODS 32 3.1 Extraction of Crytoxylum Cochinchinense Lour. (CCL) 32
3.1.1 Collection and Drying of Plant Sample 32 3.1.2 Extraction and Fractionation of the Crude Extract of
CCL 32
3.2 Cell Culture 35 3.2.1 Medium Preparation 35 3.2.2 Cell Culture Maintenance 36 3.2.3 Cryopreservation of Cell Culture 36 3.2.4 Thawing of Cell Line 36
x
3.3 Cell Viability Assay 37
3.3.1 Cell Count Assay 37 3.3.2 Determination of Optimal Cell Concentration 37
3.3.3 Evaluation of Cytotoxicity 38 3.4 Microarray Gene Expression Analysis 40
3.4.1 Total RNA Extraction 40 3.4.2 Target Preparation and Hybridization 41 3.4.3 Microarray Data Analysis 42
3.4.3.1 Quality Control of Arrays 43 3.4.3.2 Grouping of Sample Arrays 43 3.4.3.3 Statistical Analysis among Sample Arrays 44 3.4.4 Gene Selection Guideline for the KEGG Pathway
Analysis 45
3.5 Data Validation and Correlation 45 3.5.1 Relative Real-time PCR 45
3.5.2 Western Blot Assay 47 3.6 Metabolite Analysis 52
3.6.1 GC-MS Analysis 52
4.0 RESULTS 53
4.1 Plant of Interest- Cratoxylum Cochinchinense Lour. (CCL) 53 4.2 Extraction of Crude Extract 53 4.3 Evaluation of Cytotoxicity 54
4.3.1 Determination of Optimal Cell Concentration for
Bioassay 54
4.3.2 Determination of Half Maximal Inhibitory (IC50)
Concentration of CCL Extracts against HepG2 55
4.3.3 Selection of the CCL Extracts for the Microarray
Gene Expression Assay 58 4.4 Microarray Gene Expression Assays 58
4.4.1 Observations of Gene Expression among Sample
Arrays 58 4.4.2 Pathway Analysis from Statistics among Sample
Arrays 60 4.5 Data Validation 103
4.5.1 Data Validation with Relative Real-time PCR
Methodology 103 4.5.2 Data Validation with Western Blot Approach 109
4.6 Metabolite Identification 111 4.6.1 GC-MS Analysis 111
5.0 DISCUSSION 114
5.1 Properties of Cancer Cells 114 5.2 Cytotoxic effects of CCL on HepG2 and its Regulation on
Cancer Pathways 117 5.2.1 p53 Signalling Pathway 118 5.2.2 Cell Cycle Signalling Pathway 120
5.2.3 Hedgehog Signalling Pathway 125
xi
5.2.4 MAPK Signalling Pathway 127
5.2.5 mTOR Signalling Pathway 130 5.2.6 TGF-β Signalling Pathway 131
5.2.7 ErbB Signalling Pathway 134 5.2.8 Notch Signalling Pathway 136 5.2.9 VEGF Signalling Pathway 137 5.2.10 JAK-STAT Signalling Pathway 138 5.2.11 WNT Signalling Pathway 141
5.2.12 Toll-like Receptor Signalling Pathway 143 5.2.13 NOD-like Receptor Signalling Pathway 146 5.2.14 RIG-I-like Receptor Signalling Pathway 147 5.2.15 Chemokine Signalling Pathway 148 5.2.16 Cytokine-Cytokine Receptor Interaction Signalling
Pathway 150 5.2.17 B-cell Receptor Signalling Pathway 153
5.2.18 Apoptosis Signalling Pathway 154 5.2.19 Adherens Junction Signalling Pathway 156 5.2.20 Focal Adhesion Signalling Pathway 158 5.2.21 Natural Killer Cells Mediated Cytotoxicity Signalling
Pathway 160 5.3 Cytotoxic effects of CCL on HepG2 and its Regulation on
Selective Genes 161 5.4 Properties of metabolites and their anti-tumour activities 166
6.0 CONCLUSION 170
REFERENCES 174 APPENDICES 193
Appendix A-1: The Quality Assessment of Samples Running Microarray
Assays 193
Appendix A-2: The Correlation Plot for Samples Running Microarray
Assays 194
Appendix B: Preparation of Western Blot Buffer/Reagents 195
Appendix C: KEGG Pathways
C-1 P53 Signalling Pathway 198 C-2 Cell cycle Signalling Pathway 199 C-3 Hedgehog Signalling Pathway 200
C-4 MAPK Signalling Pathway 201 C-5 mTOR Signalling Pathway 202
C-6 TGF-β Signalling Pathway 203 C-7 ErbB Signalling Pathway 204 C-8 Notch Signalling Pathway 205 C-9 VEGF Signalling Pathway 206 C-10 JAK-STAT Signalling Pathway 207
C-11 WNT Signalling Pathway 208 C-12 Toll-like Receptor Signalling Pathway 209 C-13 Nod-like Receptor Signalling Pathway 210 C-14 RIG-I-like Receptor Signalling Pathway 211 C-15 Chemokine Signalling Pathway 212
xii
C-16 Cytokine-Cytokine Receptor Interation Signalling
Pathway 213 C-17 T-Cell Receptor Cancer Signalling Pathway 214
C-18 B-cell Receptor Signalling Pathway 215 C-19 Apoptosis Signalling Pathway 216 C-20 Adherens Junction Signalling Pathway 217 C-21 Focal Adhesion Signalling Pathway 218 C-22 Natural Killer Cells Mediated Cytotoxicity in
Signalling Pathway 219
Appendix D: The Western Blot Assay for Verification of Proteins of
Seven Genes at Various Time Points. The Drug Treated
Sample at time points of 12 hours, 24 hours and 48 hours
Versus Control 0 hour 220
Appendix E: List of genes with Expression Fold-changes >2 and P-Value
< 0.05 at Any Single Time-point Generated from DAVID
Bioinformatics 224
xiii
LIST OF TABLES
Table
2.1
Summary of various reported chemical compounds
detected from different plant parts of CCL
Page
23
4.1 The weight of raw materials and their yields
54
4.2 IC50 of standard drug Sorafenib, and the extracts of
bark, stem, and exudates of CCL against HepG2
cancer cell line
56
4.3 Differential gene analysis between samples at
different time-point versus control at 0 hour (C0)
64
4.4 Gene differentially regulated versus control 0 hours
after treated with bark-PE for 6 hours, 12 hours,
18hours, 24 hours, and 48 hours, respectively
65
4.5 The list of genes which are significantly expressed
(>2-fold change) or relatively significantly
expressed* (timepoints vs timepoint 0) in p53
signalling pathway
66
4.6
The list of genes which are significantly expressed
(>2-fold change) or relatively significantly
expressed* (timepoints vs timepoint 0) in cell cycle
67
4.7 The list of genes which are significantly expressed
(>2-fold change) or relatively significantly
expressed* (timepoints vs timepoint 0) in Hedgehog
signalling pathway
68
4.8 The list of genes which are significantly expressed
(>2-fold change) or relatively significantly
expressed* (timepoints vs timepoint 0) in MAPK
signalling pathway
69
4.9 The list of genes which are significantly expressed
(>2-fold change) or relatively significantly
expressed* (timepoints vs timepoint 0) in mTOR
signalling pathway
70
4.10 The list of genes which are significantly expressed
(>2-fold change) or relatively significantly
expressed* (timepoints vs timepoint 0) in TGF-β
signalling pathway
71
xiv
4.11 The list of genes which are significantly expressed
(>2-fold change) or relatively significantly
expressed* (timepoints vs timepoint 0) in ERBB
signalling pathway
72
4.12 The list of genes which are significantly expressed
(>2-fold change) or relatively significantly
expressed* (timepoints vs timepoint 0) in Notch
signalling pathway
73
4.13 The list of genes which are significantly expressed
(>2-fold change) or relatively significantly
expressed* (timepoints vs timepoint 0) in VEGF
signalling pathway
74
4.14 The list of genes which are significantly expressed
(>2-fold change) or relatively significantly
expressed* (timepoints vs timepoint 0) in JAK-
STAT signalling pathway
75
4.15 The list of genes which are significantly expressed
(>2-fold change) or relatively significantly
expressed* (timepoints vs timepoint 0) in WNT
signalling pathway
76
4.16 The list of genes which are significantly expressed
(>2-fold change) or relatively significantly
expressed* (timepoints vs timepoint 0) in Toll-like
receptor signalling pathway
77
4.17 The list of genes which are significantly expressed
(>2-fold change) or relatively significantly
expressed* (timepoints vs timepoint 0) in NOD-like
signalling pathway
78
4.18 The list of genes which are significantly expressed
(>2-fold change) or relatively significantly
expressed* (timepoints vs timepoint 0) in RIG-like
receptor pathway
79
4.19 The list of genes which are significantly expressed
(>2-fold change) or relatively significantly
expressed* (timepoints vs timepoint 0) in chemokine
signalling pathway
80
4.20 The list of genes which are significantly expressed
(>2-fold change) or relatively significantly
expressed* (timepoints vs timepoint 0) in cytokine-
cytokine receptor interaction
81
xv
4.21 The list of genes which are significantly expressed
(>2-fold change) or relatively significantly
expressed* (timepoints vs timepoint 0) in T cell
receptor signalling pathway
82
4.22 The list of genes which are significantly expressed
(>2-fold change) or relatively significantly
expressed* (timepoints vs timepoint 0) in B cell
signalling pathway
83
4.23 The list of genes which are significantly expressed
(>2-fold change) or relatively significantly
expressed* (timepoints vs timepoint 0) in apoptosis
signalling pathway
84
4.24 The list of genes which are significantly expressed
(>2-fold change) or relatively significantly
expressed* (timepoints vs timepoint 0) in adherens
junction signalling pathway
85
4.25 The list of genes which are significantly expressed
(>2-fold change) or relatively significantly
expressed* (timepoints vs timepoint 0) in focal
adhesion
86
4.26 The list of genes which are significantly expressed
(>2-fold change) or relatively significantly
expressed* (timepoints vs timepoint 0) in natural
killer cells mediated cytotoxicity signalling pathway
87
4.27 Six genes selected for relative real-time PCR
validation. Intensity level of gene expression is the
criteria for selection
102
4.28 The relative fold change of the (A) upregulated
genes and (B) downregulated genes for real-time
PCR versus microarray assay
103
4.29 Metabolite profiling of bark-PE extract by GC-MS
analysis
110
xvi
LIST OF FIGURES
Figures
2.1
2.2
Macroscopic morphology of Cratoxylum
cochinchinense (Soepadmo and Wong, 1995)
Molecular structure of xanthone (C13H8O2)
Page
20
25
4.1 Standard curve of HepG2 for optimal cell seeding
density in MTT cytotoxicity assay
54
4.2 Dose response curve of HepG2 cancer cell line
treated with(A) bark extracts & exudates, (B) stem
extracts, and (C) Sorafenib
57
4.3 Genes identified in p53 signalling pathway with >2-
fold-change or with relative significance compared
with untreated samples at various time-points
88
4.4 Genes identified in cell cycle with >2-fold-change
or with relative significance compared with
untreated samples with various time-points
89
4.5 Genes identified in Hedgehog signalling pathway
with >2-fold-change or with relative significance
compared with untreated samples with various
time-points
90
4.6 Genes identified in MAPK signalling pathway with
>2-fold-change or with relative significance
compared with untreated samples with various
time-points
91
4.7 Genes identified in mTOR signalling pathway with
>2-fold-change or with relative significance
compared with untreated samples with various
time-points
92
4.8 Genes identified in TGF-β signalling pathway with
>2-fold-change or with relative significance
compared with untreated samples with various
time-points
92
4.9 Genes identified in ERBB signalling pathway with
>2-fold-change or with relative significance
compared with untreated samples with various
time-points
93
xvii
4.10
Genes identified in Notch signalling pathway with
>2-fold-change or with relative significance
compared with untreated samples with various
time-points
94
4.11 Genes identified in VEGF signalling pathway with
>2-fold-change or with relative significance
compared with untreated samples with various
time-points
94
4.12 Genes identified in JAK-STAT signalling pathway
with >2-fold-change or with relative significance
compared with untreated samples with various
time-points
95
4.13 Genes identified in WNT signalling pathway with
>2-fold-change or with relative significance
compared with untreated samples with various
time-points
96
4.14 Genes identified in Toll-like receptor pathway with
>2-fold-change or with relative significance
compared with untreated samples with various
time-points
96
4.15 Genes identified in Nod-like signalling pathway
with >2-fold-change or with relative significance
compared with untreated samples at various time-
points
97
4.16 Genes identified in RIG-like receptor signalling
pathway with >2-fold-change or with relative
significance compared with untreated samples at
various time-points
97
4.17 Genes identified in Chemokine signalling pathway
with >2-fold-change or with relative significance
compared with untreated samples under various
time-points
98
4.18 Genes identified in cytokine-cytokine receptor
interaction with >2-fold-change or with relative
significance compared with untreated samples
under various time-points
99
4.19
Genes identified in T cell signalling pathway with
>2-fold-change or with relative significance
compared with untreated samples under various
time-points
100
xviii
4.20 Genes identified in B cell signalling pathway with
>2-fold-change or with relative significance
compared with untreated samples under various
time-points
100
4.21 Genes identified in Apoptosis signalling pathway
with >2-fold-change or with relative significance
compared with untreated samples under various
time-points
101
4.22 Genes identified in Adherens Junction signalling
pathway with >2-fold-change or with relative
significance compared with untreated samples
under various time-points
101
4.23 Genes identified in Focal adhesion signalling
pathway with >2-fold-change or with relative
significance compared with untreated samples
under various time-points
102
4.24 Genes identified in Natural killer cell cytotoxicity
with >2-fold-change or with relative significance
compared with untreated samples under various
time-points
102
4.25 The correlation of real-time PCR result versus
microarray result on six genes, namely (A)
MAP2K, (B) SLC2A2, (C) SKP2, (D) PCYT1B,
(E) SLC16A6 and (F) MMP3
104
4.26 Western blot analysis of (A) MAP2K6, (B) SKP2,
(C) PCYT1B, (D) SLC2A2, (E) MMP3 and (F)
SLC16A6 proteins
107
4.27 Typical total ion chromatograms from GC-MS
analysis in EI-mode
109
xix
LIST OF PLATES
Plates
2.1
Photo of full-grown (left) and young (right)
Cratoxylum cochinchinense Lour
Page
21
3.1 Preparation of bark samples for serial exhaustive
extraction
33
3.2 Soaking of bark samples in solvent
33
3.3 Rotary evaporation of solvent
34
3.4 Extracts collected: Bark-PE (left), Bark-EA
(center), Bark-MeOH (right)
34
3.5 Close-up of Bark-PE extract
35
xx
LIST OF ABBREVIATIONS
AFB1 Aflatoxin B1
AJ Adherens junction
AML Acute myeloid leukaemia
APS Ammonium Persulfate
AP1 Activator Protein 1
ASEAN Association of South-East Asia Nations
BCR B cell receptor
BSA Bovine Serum Albumin
CCL Cratoxylum cochinchinense Lour.
CDC25 Cell division cycle 25
DAVID the Database for Annotation, Visualization and
Integrated Discovery
DC dendritic cells
DDIT4 DNA-damage-inducible transcript 4
DMSO Dimethyl sulfoxide
EA Ethyl acetate
EC Expression Console
ECM Extracellular Matrix
EGFR Epidermal Growth Factor Receptor
EMT Epithelial-to-mesenchymal transition
ErbB Erythroblastic Leukaemia Viral Oncogene Homolog
ERK Extracellular Signal-Regulated Kinases
FA Focal adhesion
FASL Fas ligand
xxi
GADD45 DNA damage-inducible gene 45
GC Gas Chromatography
GLI Glioma-associated oncogene homologue
GO Gene ontology
GPCR G protein-coupled receptors
GSP Gene-Specific Primers
HBV Hepatitis B virus
HCC Hepatocellular carcinoma
HCV Hepatitis C virus
HPV Human papillomaviruses
HRP Horseradish Peroxidase
HTA Human transcriptome array
IL-6 Interleukin 6
IFN-α Interferon-α
JAK-STAT Janus associated kinase-signal transducer and activator
of transcription
JNK c-Jun NH2-terminal kinases
KEGG Kyoto Encyclopaedia of Genes and Genomes
LC Liquid Chromatography
LPS lipopolysaccharide
MAPK Mitogen Activated Protein Kinase
MeOH Methanol
MGF Mangiferin
MHC major histocompatibility complex
MM Mismatch
xxii
MS Mass spectrum
MTT (3-(4, 5-dimethylthiazolyl-2)-2, 5-diphenyltetrazolium
bromide
NF-B nuclear factor kappaB
NLR NOD-like receptors
NK Natural killer
NMR Nuclear Magnetic Resonance
NO Nitric oxide
NSCLC Non–small cell lung carcinoma
PAI-1 Plasminogen activator inhibitor type-1
PAMP Pathogen-Associated Molecular Pattern
PBS Phosphate buffer saline
PE Petroleum Ether
PI3K Phosphatidylinositol 3-kinase
PDGF Platelet-Derived Growth Factor
PDGFR Platelet-Derived Growth Factor Receptor
PGN Peptidoglycan
PM Perfect Match
PRL Prolactin
PRR Pattern Recognition Receptors
PTEN Phosphatase and Tensin Homolog
PVDF Poly-Vinylidene-Difluoride
qRT-PCR Quantitative real-time PCR
RLR RIG-I like receptor
RNA Ribonucleic Acid
xxiii
ROS Reactive OxygenSpecies
RPMI Roswell Park Memorial Institute Media
RTK Receptor Tyrosine Kinase
SCF Stem cell factor
SDS Sodium Dodecyl Sulphate
Smo Smoothened
TAC Transcriptome Analysis Console
T-ALL T-cell acute lymphoblastic leukaemia
TCM Traditional Chinese Medicine
TNFα Tumour Necrosis Factor α
TNM TNM Classification of Malignant Tumours
TGF-β Transforming growth factor-
TIC Tumour-Initiating Cell
TLR Toll-like receptors
TRAIL TNF-related apoptosis inducing ligand
µPA Urokinase Plasminogen Activator
µPAR Urokinase Plasminogen Activator Receptor
VEGF Vascular Endothelial Growth Factor
VEGFR Vascular Endothelial Growth Factor Receptor
WHO World Health Organisation
1
CHAPTER 1
INTRODUCTION
Based on the GLOBACON 2008 for Southeast Asia, the fatality (overall
ratio of mortality/incidence) of liver cancer at the level of 0.93 reflects the low
survival rate of the liver cancer patients. It also indicates the complexity and
limited treatment options for liver cancer patients(Kimman et al.,
2012).Moreover, majority of patients with HCC are complicated with other
advanced diseases, including liver cirrhosis, hepatic dysfunction. These
complications limit the treatment options available to them and cut them off from
treatments such as liver transplantation, surgical resection, or regional therapy
(Thomas and Abbruzzese, 2005).
However, most of the anti-neoplastic drugs used in chemotherapy in
conventional treatment nowadays have exhibited different level of cell toxicity
to not just neoplastic cells, but also to normal healthy cells. Their adverse effects
are observed in a lot of organs, especially lung, liver, kidney, and nervous
system. Abnormal liver functions are noted during the treatment (Ramadori and
Cameron, 2010). These side effects limit the use of chemotherapeutic agents.
Patient survival or quality of life is not significantly improved despite the high
efficacy in treating specific or target malignant cells (Cheng et al., 2009).
2
Like other cancers, growth of liver cancer cell is a complicated multi-
step process in which cells experience profound metabolic and behavioural
changes (Barrett, 1993). This carcinogenesis is induced by a lot of genetic and
epigenetic changes that disrupt various pathways, which control biological
function of cells, including proliferation, apoptosis, differentiation, and
senescence. This results in excessive proliferation of cancer cells and subsequent
evasion from surveillance by the immune system, and ultimate invasion of
distant tissues (Hanahan and Weinberg, 2011).
With the poor overall efficacy and abundance of side effects of the
existing medicines, pharmaceutical industries have been aggressively looking
for alternative medicines for better prognosis. A better and affordable drug is
needed to replace or complement the current cancer treatment. Naturally,
medicinal plants in Asia, such as China and India, have become the choice of
preference due to its long history of being used as folk medicine as well as in the
hospitals. Its beneficial values and effects have been proven for more than 2000
years. In search for better medicines for cancer treatment, effort has been put
into screen through tremendous amount of plant extracts against human cancer
cell lines over the last thirty years. This results in successful commercialized
drugs for cancer treatment. They are obtained from these natural sources and
further modified structurally or synthesized as new compounds (Dhiman and
Chawla, 2005).
3
Cratoxylum cochinchinense Lour (CCL) is one of the plants widely
available in Southeast Asia and various parts of this plant have been broadly
studied. Its xanthones and derivatives isolated from barks, stems, twigs, fruits,
roots, and resins are anti-cancer and anti-oxidant (Ho et al., 2002; Tang et al.,
2004a; Akao et al., 2008; Ren et al., 2011). It has been widely used as folk
medicine in South East Asia for curing various diseases, including fever, cough,
diarrhoea, eczema, ulcer, itches, etc. while Chinese physicians have used it for
the treatment of liver diseases, including liver cancer. However, this claim is
not scientifically proven.
Medical communities have been putting effort to isolate lead compounds
out of these natural sources and generate structural analogues with greater
pharmacological effects and less adverse effects. However, this effort needs to
complement with other disciplines in order to produce the potential drug in a
more effective approach. The successful sequencing of the entire human genome
has made the identification of genetic mutations causing cancers possible. With
the wide application of microarray technology and the advent of next-generation
sequencing technologies or RNA sequencing techniques have transformed the
landscape of transcriptomics study in samples, especially cancer. Hundreds of
oncogenes and tumour suppressor genes on various pathways have been
identified. With the strong computational bioinformatics technology, such as
DAVID Bioinformatics Resources 6.7 of National Institute of Allergy and
Infectious Diseases (NIAID) (https://david.ncifcrf.gov/), more oncogenes and
tumour suppressor genes could be identified and their roles could be better
understood.
4
With this advent of genomics, transcriptomics, proteomics and
metabonomics, the discovery and production of potent compounds for cancer
treatment can be viewed from the perspective of system biology. However, this
new perspective needs multi-disciplinary approach, combining knowledge from
biology, chemistry, and bio-informatics as well as other disciplines so that
interpretation of its multivariate statistics derived is more integrative as a whole.
With this perspective in mind, the design of this study lines up various assays,
including cytotoxicity assay, metabonomic analysis, microarray, PCR, western
blot and bio-informatics. This approach is also in line with the philosophy of
traditional Chinese medicine (TCM) that considers human body as a system with
which drug system interacts (Luo et al., 2011).
To evaluate of cytotoxicity of extracts of CCL against HepG2 cells, this
study used MTT method and subsequently, metabonomic analysis to find out the
possible metabolites present in the extract of CCL. It is also the first attempt
using microarray technology to elucidate the possible inhibitory effect of CCL
on various cancer pathways and identify the genes that are regulated by CCL.
Further verification of the result of the microarray experiment using RT-PCR
and western blot was also included for this study.
It is expected that this study is able to ascertain the inhibitory effect of
CCL on cancer pathways, including focal adhesion, adherens junction, natural
killer cell cytotoxicity, cytokine-cytokine receptor interaction, chemokine
signalling, B-cell receptor, apoptosis, WNT signalling, Notch signalling, JAK-
STAT signalling , mTOR signalling, ErbB signalling, TGF-signalling, cell
5
cycle, Toll-like signalling, RIG-like signalling, Nod-like signalling, T-cell
receptor, VEGF signalling, MAPK signalling, P53signalling, Hedgehog
signalling pathway. These pathways have been widely implicated in various
cancers. Through this study, highly regulated oncogenes, tumour suppressor
genes and metabolites of CCL are identified. The findings will substantiate the
claimed effect of CCL on liver cancer and be used for future study, including
isolation of active compounds potentially used for molecular target-based
therapeutic treatment for liver cancer.
6
CHAPTER 2
LITERATURE REVIEW
2.1 Cancer
2.1.1 Burden of Cancer
Cancer has become major public health problem worldwide. It has
become primary cause of deaths. Statistics show that the number of deaths
caused by cancer is going to surpass the number of death caused by heart-related
diseases. It contributes 7.018 million of deaths or 6.53% of total deaths
worldwide. However, the low and middle-income countries contribute higher
number of total deaths at 4.952 million deaths or constitute lower percentage of
total deaths at 5.37%, while higher income countries have contributed 2.066
million deaths or constitute higher percentage of the total death at 17.35%. It is
not just a burden on the more developed countries in term of percentage, but also
great pressure in less developed countries in term of number. Over the years, the
burden has shifted more to less developed countries, which currently account for
about 57% of cases and 65% of cancer deaths worldwide (Torre et al., 2015).
According to GLOBOCAN 2012, 14.1 million new cancer cases and 8.2
million cancer-related deaths were occurred in 2012, compared with 12.7 million
and 7.6 million, respectively, in 2008. Statistics also reported that 32.6 million
people (over the age of 15 years) worldwide live with cancer diagnosed in the
previous five years. The most common organs diagnosed with cancers were lung
(1.8 million, 13.0% of the total), breast (1.7 million, 11.9%), and colorectum (1.4
7
million, 9.7%). However, the most common causes of cancer death were lung
cancer (1.6 million, 19.4% of the total), liver cancer (0.8 million, 9.1%), and
stomach cancer (0.7 million, 8.8%). Projections predict that there would have
19.3 million new cancer cases per year by 2025(Ferlay et al., 2013).
Based on the analysis from GLOBOCAN 2008 for Southeast Asia
region, there were 724,699 new cancer cases and 500,439 deaths in the region.
Of all new cases, 46% were in males and 54% in females. The three most
common cancers among men were lung cancer, liver cancer, and colorectal
cancer while breast cancer, cervical cancer and colorectal cancer were for
woman. The most common fatal cancer in Southeast Asia for males and females
in combination was lung cancer (98,143 cases and 85,772 deaths). The second
most common was liver cancer (74,777 cases and 69,115 deaths), followed by
colorectal cancer (68,811 cases and 44,280 deaths) (Kimman et al., 2012).
2.1.2 Risk Factors of Cancers
It is difficult to know exactly why one person develops cancer and
another does not. Research has identified numerous factors that increase an
individual’s risk for developing cancer. However, not all factors have the same
impact on cancer risk.
The important human carcinogens include alcohol, asbestos, aflatoxins
and ultraviolet light. Chronic infections associated with viruses, including
hepatitis viruses (HBV, HCV), human papilloma viruses (HPV) and
Helicobacter pylori play significant roles in the development of cancer. Lifestyle
8
factors, including diet, physical activity, and alcohol consumption, also play
their roles in the development of cancer. Among all the risk factors, tobacco use
is the risk factor with the biggest impact (30-35%), followed by obesity and
overweight (20%), infection with one of several microorganisms (close to 20%),
poor dietary habits (5%) and lack of physical activity (5%) (American
Association for Cancer Research, 2015).
2.2 Liver Cancer
2.2.1 Burden of Liver Cancer
Hepatocellular carcinoma (HCC) is the most common liver malignancy
in adults worldwide. Approximately 90% of primary liver cancer is HCC and it
is much more common in men than in women. Statistically, it is the second
leading cause of cancer death for men worldwide and in less developed
countries, while the sixth leading cause of cancer death among men in more
developed countries. According to GLOBOCAN 2012, 782,500 liver cancer
cases and 745,500 deaths occurred worldwide in 2012, with China alone taking
up half of the total number of cases and deaths. High liver cancer rates were also
observed in South-East Asia as well as Northern and Western Africa.
Liver cancer is the second most common cancer in Southeast Asia and
the second leading cause of cancer death. The highest incidence and mortality
rates per 100,000 were found in Laos (33.8 and 32.3), Thailand (29.7 and 25.4)
and Vietnam (29.3 and 29.2), and the lowest in Brunei (5.2 and 5.4), Malaysia
(5.7 and 5.4) and Indonesia (6.7 and 6.6). Their incidence and mortality rates
9
are more than 2 times higher in males than in females with a poor survival rate,
as reflected by almost equal mortality and incidence rates (Kimman et al., 2012).
2.2.2 Risk Factors of Liver Cancer
The global prevalence and mortality resulting from HCC is directly
related to underlying risk factors for primary liver cancer. HBV and HCV
statistically are the most commonly implicated risk factors for HCC, with HBV
responsible for the 54 % of new HCC cases worldwide while HCV take up 31
% of the HCC case. Statistics also show that hepatitis B virus (HBV) and
hepatitis C virus (HCV) account for an estimated 32% of infection-related cancer
cases, mostly liver cancer, in less developed countries and 19% in more
developed countries. The continual inflammations caused by HBV and HCV-
associated infection lead to chronic hepatitis and cirrhosis, which are regarded
as pre-neoplastic conditions before the formation of HCC(Berasain et al., 2011).
Epidemiological studies show that HBV infection is more prevalent in
East Asian and sub-Saharan African populations which are due to unavailability
of vaccination, sanitary medical practices, and proper environmental
management strategies. Transmission of HBV among these populations is
mainly going through vertical transmission (maternal to fetal approach) while
the transmission of HCV is mainly through the horizontal approach due to a later
exposure to infected body fluids (Hiotis et al., 2012).
Consumption of food contaminated with aflatoxins is another risk factor
for the development of HCC. There are approximately 20 related fungal
10
metabolites in aflatoxins. Among all, aflatoxins B1, B2, G1, and G2 are well
studied. Aflatoxin B1 (AFB1) is the most potent chemical liver carcinogen
known. Aflatoxins B2 and G2 are the dihydro derivatives of the parent
compounds B1 and G1. AFB1 is easily found in agricultural products, including
rice, peanuts, cereals, dried fruits, oil seeds and barley. These are the important
crops in developing countries, including Southeast Asia and Sub-Saharan Africa.
AFB1 is mainly produced by Aspergillus flavus and Aspergillus parasiticus,
which normally grow in humid and dry climates. Crops are exposed to these
fungi, during the harvesting and storage, which in turn leads to their
proliferation. Cytochrome-P450 enzymes of liver cell metabolize AFB1 to
reactive intermediate AFB1-8, 9-epoxide (AFBO) which, in turn, binds to liver
cell and causes DNA adducts which subsequently interact with the guanine bases
of liver cell DNA and lead to genetic mutation of P53tumour suppressor gene.
This mutation causes DNA strand breakage, DNA base damage and oxidative
damage leading to cancer. AFB1 induces typical G:C to T:A transversions at the
third base in codon 249 of P53 (Staib et al., 2003; Hamid et al., 2013).
However, studies show that the risk from the synergistic effect of having
chronic HBV infection and aflatoxin is up to 30 times greater than the risk in
individuals exposed to aflatoxin only (Williams et al., 2004). It is believed that
increased hepatocyte necrosis caused by chronic HBV infection and AFB1-
induced mutations increases the likelihood of the subsequent proliferation of
cells with these mutations (Kew, 2003). Aflatoxin also appears to have a
synergistic effect on HCV-associated HCC (Liu and Wu, 2010).
11
Chronic alcohol consumption and smoking are also the risk factors for
the development of HCC. Studies show that heavy drinkers have 10-35% chance
of developing alcoholic steatohepatitis, 10-20% chance of developing cirrhosis,
in which close to 10% of them will progress to HCC. Liver is a major organ for
the metabolism and more than 40 tobacco-related active compounds, including
known carcinogens such as polycyclic aromatic hydrocarbons, nitrosamines, and
aromatic amines are processed in the liver. Nicotine upregulates the CYP2E1
activity, which leads to ROS generation and lipid peroxidation and contributes
to the development of HCC (Purohit et al., 2013).
2.2.3 Conventional Treatment Methods for Liver Cancer
The current available conventional treatment options for HCC patients
include resection, liver transplant, ablation, embolization, radiotherapy, and
chemotherapy. The possible side effects of each treatment option are taken into
consideration, along with overall health of patients. Different treatment options
offer different chances of curing the disease, extending life, or relieving
symptoms. Resection or liver transplant provides better prognosis. When
surgery is not available, due to poor health or reduced liver functions, ablation
and embolization approaches are used to destroy liver tumours without removing
them. However, for most of the patients who are in advanced stage of diseases,
these treatment options are not viable. Systemic treatment is deemed as
necessary, although chemotherapy being considered ineffective in the treatment
of liver cancer (Bruix et al., 2001).
12
2.3 Targeted Therapy
The chemical agents used in the traditional cancer chemotherapy were
designed to block cell division in cancer cells. However, this kind of broad
spectrum cytotoxic agents affects the healthy cells too. The low specificity of
agents has caused a lot of intolerable side-effects to the patients. Researches have
shifted towards targeting specific metabolic pathways, which regulate
tumourigenesis to stop cancer growth while inducing less toxic to the normal
cells. With the advance of bioinformatic technology with higher computational
capability, the anti-cancer drug development has shifted to more pragmatic and
rational target-based approach. The strategy has brought clinical benefits to
patients with certain tumour types, including leukaemia, breast, colorectal and
lung cancers (Weinstein and Joe, 2006; Robert and Der, 2007).
Tumour formation and progression is a complicated process. It involves
the malfunction or alteration of certain genes, which cause the deviation of
normal pathways which involve various biological functions, including
proliferation, transcription, growth, migration, differentiation and death. Among
these pathways, most are implicated by the interaction between growth factors
and their receptors. Anticancer drugs have been developed to target specific
pathways, disrupt their interaction between receptor and ligand, and inhibit these
signalling pathways.
Researches have also shown that any change in the microenvironment
around cancer cells helps the spread or metastasis of the cancer cells. Cancer
forms a complicate linked structure among cancer cells, including endothelial
13
cells, stromal cells, immune cells and its ever-changing surrounding
environment. With its angiogenesis capability, it develops vasculature in new
environment (Barrett, 1993, Hawkins, 1995, Hanahan and Folkman, 1996).
Changes in immune response in the surrounding stroma allow the tumour
form new blood vessels and spread to other organs. The prevalence of vascular
endothelial growth factors (VEGFs) and its receptors (VEGFRs) on the
endothelial cells of the tumour vessels as well as the strong presence of platelet-
derived growth factor (PDGF) and its receptors (PDGFRs) on the pericytes that
support blood vessel growth may suggest their roles in regulating vasculogenesis
and angiogenesis which form blood vessels from pre-existing vessels (Shibuya,
2011). Receptor tyrosine kinase (RTK) binds its ligand and activates the
downstream phosphorylation before triggering its subsequent signalling for
tumour growth or metastasis. RTK inhibitors are developed to disrupt these
pathways and slow the growth of the tumour.
Many cancer pathways have been implicated in HCC, including
VEGF/RAS pathway, PI3K/AKT/ mTOR pathway as well as WNT/-catenin
Pathway (Wu and Li, 2012a). By altering the genes in these pathways, cancer
cells evade apoptosis and stimulate transcription of genes that promote cell-cycle
progression, survival and migration. Overexpression of RAS was observed in
HCC, leading to the down-regulation of its downstream tumour suppressor
SLUG. Aberrant activation of phosphatidylinositol-3-kinase (PI3K) has a
cascade effect on the downstream effector AKT, which is associated with HCC
progression and poor HCC prognosis. Phosphorylation of β-catenin and
14
inhibition of β-catenin degradation manage to stimulate its downstream target
genes in HCC (Liu et al., 2015). Many agents have been designed to disrupt these
pathways in order to block proliferation of cancer cell. Sorafenib is one of them.
2.3.1 Targeted Therapy for Liver Cancer - Sorafenib
Sorafenib (BAY43-9006; Nexavar) is a multi-kinase inhibitor drug
initially used in the treatment of advanced renal cell carcinoma before approved
for the treatment of other cancer, including HCC, non-small cell lung cancer and
radioactive iodine resistant advanced thyroid carcinoma (Liu et al., 2015). It is
the first multi-kinase inhibitor that functioning as a molecular target drug for
HCC treatment. It acts by inhibiting the serine–threonine kinases Raf-1, B-RAF,
VEGFR, PDGFR, the cytokine receptor c-KIT oncogene and the receptor
tyrosine kinases FLT-3 oncogene (Llovet et al., 2008).
Study has shown that Sorafenib inhibited cell growth in HepG2. Genes
implicated in angiogenesis, apoptosis, transcription regulation, signal
transduction, protein biosynthesis were significantly upregulated while genes
involved in cell cycle control, DNA replication recombination and repair, cell
adhesion, metabolism and transport were downregulated after the treatment with
Sorafenib (Cervello et al., 2012). However, it comes with side-effects, including
diarrhoea, skin eruption, and bone marrow dysfunction (Kaseb, 2013). In a study
carried out in Asia Pacific, including China, South Korea and Taiwan in 2009,
the overall survival period of Sorafenib-treated group has only improved
marginally (6.5 months) compared with placebo’s (4.2 months) (Cheng et al.,
15
2009). These suggest that safer and more integrative approach should be
explored for the treatment of HCC patients.
2.4 In vitro model of the human liver cancer - HepG2 Cell Line
Human cell lines are broadly used to assess the toxic properties and
activities of both novel and well known chemical entities. Cell line based assays
are a more affordable or effective way of evaluating the properties, compared
with the animal models.
HepG2 (ATCC HB-8065) has been listed on the American Type Culture
Collection (ATCC) repository in the USA. It was derived from the liver tissue
of a 15-year-old white male with a well-differentiated hepatocellular carcinoma.
It has been widely used as an in vitro model of the human liver cancer due to its
high degree of morphological and functional differentiation in vitro as well as
the absence of viral infection.
However, the origin of the HepG2 is confusing. Studies show that more
than 9000 HepG2 references in the scientific literature published in PubMed
from 1979 to March 2009 have referred it as hepatocarcinoma or hepatoma more
than 7000 times and as hepatoblastoma less than 500 times (Lopez-Terrada et
al., 2009). In the study of RNA-Seq gene expression profiling of HepG2 cell
versus hepatocarcinoma, it reflected the fact that HepG2 cells are derived from
a hepatocarcinoma (Tyakht et al., 2014).
16
2.5 Potential of Plant as a Source of Alternative Medicine for Cancer
Treatment
During the last few decades, tremendous effort has been put in by various
parties, including pharmaceutical companies, research institutions, to develop
various novel synthetic chemotherapeutic agents so that cancer could be
eradicated or reduced with fewer side effects such as nausea, hair loss, vomit,
fatigue and so on, upon patients. However, their effectiveness is still far from
satisfactory. One of the main problems in cancer treatment is gradual resistance
of cancer cells against treatment. The fatality rate of cancer is rather high
compared with other diseases. Therefore, there is a constant demand to develop
new, effective, and affordable anticancer drugs.
Plants provide a broad spectrum of sources as a drug for diseases,
including cancers. Throughout the history, our ancestor has accumulated a lot of
experience about medicinal uses of various plants. The records of their
therapeutic uses were passed down in different ways. Some could be traced back
to ancient literatures, such as those in Traditional Chinese Medicine (TCM) and
Ayurveda. However, most of other folkloric medicine systems are not as well-
established as TCM and Ayurveda. For many communities, knowledge of
therapeutics uses of plants was passed down from one generation to another
generation orally. Not recorded, they are at risk of disappearing from mainstream
of treatment. It includes procedure of preparing different parts of plant,
procedure of handling herbal material so that it could be consumed safely, way
of administering the multiple plants together in water decoction to obtain their
synergistic effect as a whole.
17
Close to 80% of world population residing in third world countries is still
using natural resources for primary health care (Gordaliza, 2007). Based on the
study on the anti-cancer drugs effectively available to the West and Japan
covering a time frame from 1940s to 2010, there are 175 small molecule
medicines for cancer treatment and 131 medicines or 74.8% of them are other
than synthetic medicine, with 85 or48.6% actually being either natural products
or medicines directly derived from these natural products (Newman and Cragg,
2012). In the same study, the significant influence of natural product structures
can be observed, especially in the area of anti-infections.
Some of the well-known anticancer drugs include Vincaalkaloids
(Vinblastine, Vincristine, Vindesine, and Vinorelbine), Taxus diterpenes
(Paclitaxel, Docetaxel), Camptotheca alkaloids, Podophyllotoxin and its
derivatives (Topothecan, Irinothecan), derived from the Madagascar periwinkle
plant Catharantus Roses, the Pacific Yew Taxus Brevifolia, and the Chinese tree
Camptotheca Acuminate and Podophyllum species respectively (Mans et al.,
2000). These findings were the effort initiated by National Cancer Institute since
1960. It took 30 years (1960-1990) to develop various types of anticancer drug
and bring them into clinical uses (Safarzadeh et al., 2014). This small success in
discovering the therapeutic agents for cancer has excited the researchers to put
in the effort to identify more potential agents from the plants.
However, there are 250,000 to 300,000 plant species in the world with
only 5000 over the plant species studied for their possible medical application.
Although high throughput screening technology has managed to reduce the drug
18
discovery time significantly and accelerated the development of drug, a more
rational and pragmatic approach should be considered and adopted, instead of
using a random screening approach on the plants. With the long history of TCM
and Ayurveda and their documented medical effects on humans, they have
provided a very fast-track opportunity in screening through some of the plants
effectively. The uses of natural plants based on the TCM theory or Ayurveda
have been refined on humans, through centuries of trial and error. This
refinement has made the molecular target-based therapeutic treatment possible
(Wang et al., 2012).
TCM herbalists tend to use different parts of plants, such as the roots,
leaves, barks, stems, flowers and exudates, for boiling. They do not isolate any
particular phytochemicals from plants before consumption. They believe in
combined synergistic effects of herbs. However, for the purpose of “perceived”
drug safety and standardization, pharmaceutical companies prefer single
ingredients or compounds. Both, medicinal herbs and their derivative
phytocompounds are being increasingly used as complementary treatments for
cancer patients. Clinical studies have shown the benefit of using herbal
medicines together with conventional therapeutics for cancer treatment,
especially in extending the survival, improving quality of life, and boosting the
immunological systems (Yin et al., 2013).
19
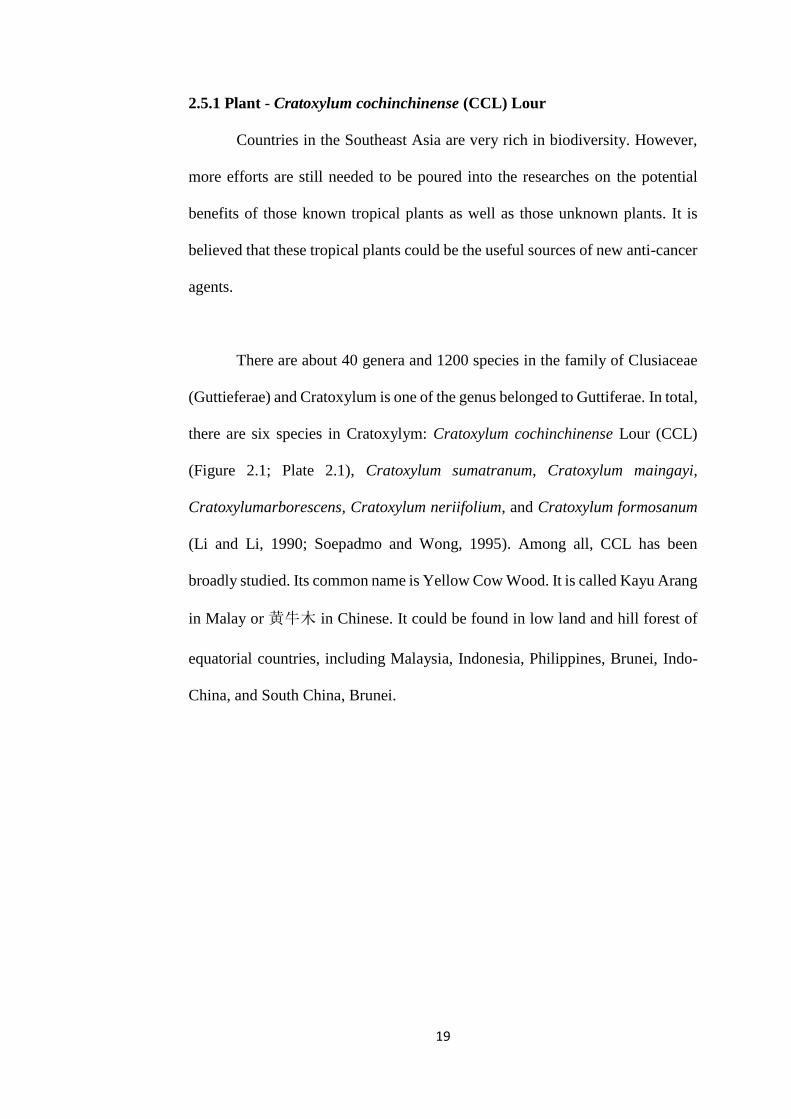
2.5.1 Plant - Cratoxylum cochinchinense (CCL) Lour
Countries in the Southeast Asia are very rich in biodiversity. However,
more efforts are still needed to be poured into the researches on the potential
benefits of those known tropical plants as well as those unknown plants. It is
believed that these tropical plants could be the useful sources of new anti-cancer
agents.
There are about 40 genera and 1200 species in the family of Clusiaceae
(Guttieferae) and Cratoxylum is one of the genus belonged to Guttiferae. In total,
there are six species in Cratoxylym: Cratoxylum cochinchinense Lour (CCL)
(Figure 2.1; Plate 2.1), Cratoxylum sumatranum, Cratoxylum maingayi,
Cratoxylumarborescens, Cratoxylum neriifolium, and Cratoxylum formosanum
(Li and Li, 1990; Soepadmo and Wong, 1995). Among all, CCL has been
broadly studied. Its common name is Yellow Cow Wood. It is called Kayu Arang
in Malay or 黄牛木 in Chinese. It could be found in low land and hill forest of
equatorial countries, including Malaysia, Indonesia, Philippines, Brunei, Indo-
China, and South China, Brunei.
20
Figure 2.1: Macroscopic morphology of Cratoxylum cochinchinense (Soepadmo
and Wong, 1995)
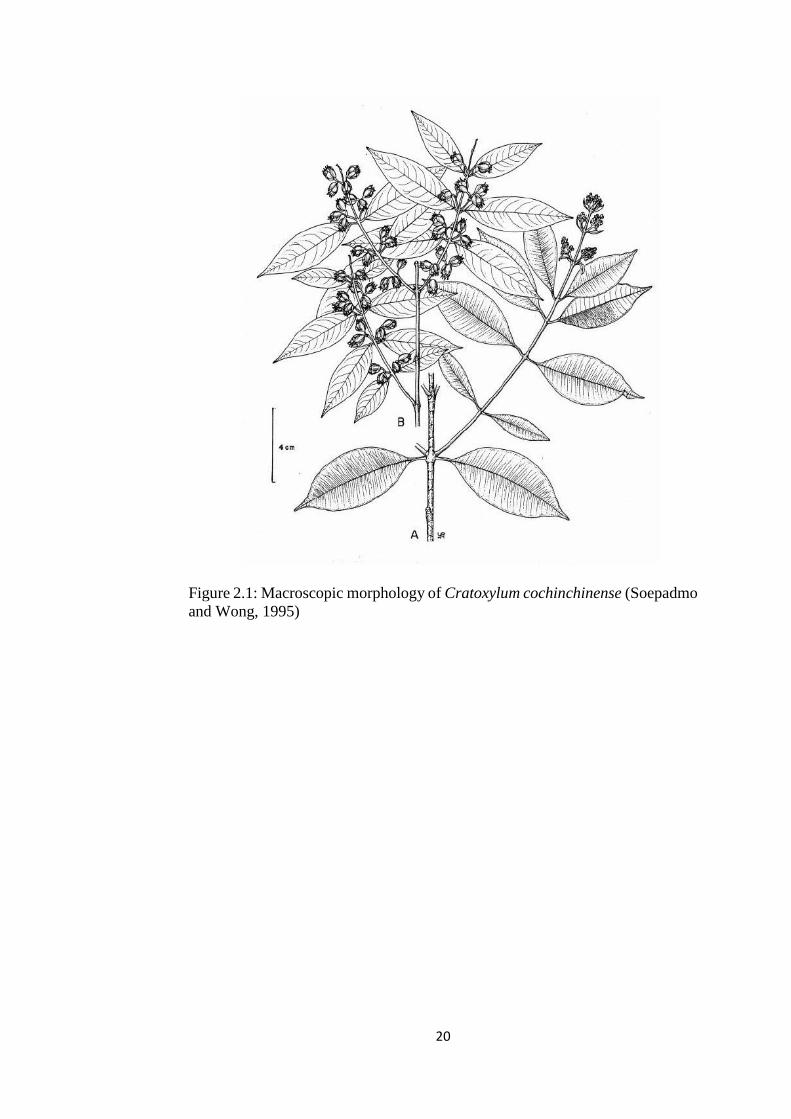
21
Plate 2.1: Photo of full-grown (left) and young (right) Cratoxylum
cochinchinense
Vietnamese has been using CCL as folk medicine for various illnesses.
Its barks, roots and leaves are used for the treatment of fevers, coughs, flatulence,
diarrhoea, stomach aches, scabies and eczema, whilst its twigs are used to treat
scabies, burns and injuries (Nguyen et al., 2011). In Thailand, it is called
‘‘tuegliang’’ locally and has been used as folk medicine to treat fevers, coughs,
diarrhoea, itches, ulcers and abdominal while the decoction of roots and stems
of CCL has been used as a diuretic (Laphookhieo et al., 2006; Mahabusarakam
et al., 2006). In China, it has been used to detoxify our body and for other
treatments, including colds, fever, diarrhoea, jaundice, bruises, carbuncles as
well as cancer (Liu, 2003).
22
Previous investigations on chemical constituents of various parts of CCL
have shown its richness in xanthones, triterpenoids, tocotrienols, tocotrienols
and flavonoids (Table 2.1).Various xanthones were isolated and identified from
hexane extracts of the roots (Laphookhieo et al., 2006), hexane extracts of its
stems (Udomchotphruet et al., 2012), ethyl acetate(EA) extract of its barks
(Bennett et al., 1993), and EA extract of twigs(Nguyen et al.,
2011),dichloromethane extract of its resin and green fruits(Boonnak et al., 2009),
and dichloromethane extract of its roots (Mahabusarakam et al., 2006).
Triterpenoids were isolated and identified from the EA extract of its
barks (Bennett et al., 1993) and hexane extract of its barks (Nguyen and
Harrison, 1999)while tocotrienols were isolated and identified from EA extract
of its barks (Bennett et al., 1993). Benzophenones were isolated and identified
from ethanol extract of its stems(Yu et al., 2009), while flavonoids were derived
from EA extract of leaves (Hoang et al., 2006). Among all, xanthones are the
most abundant composition (Nguyen et al., 2011; Table 2.1).
23
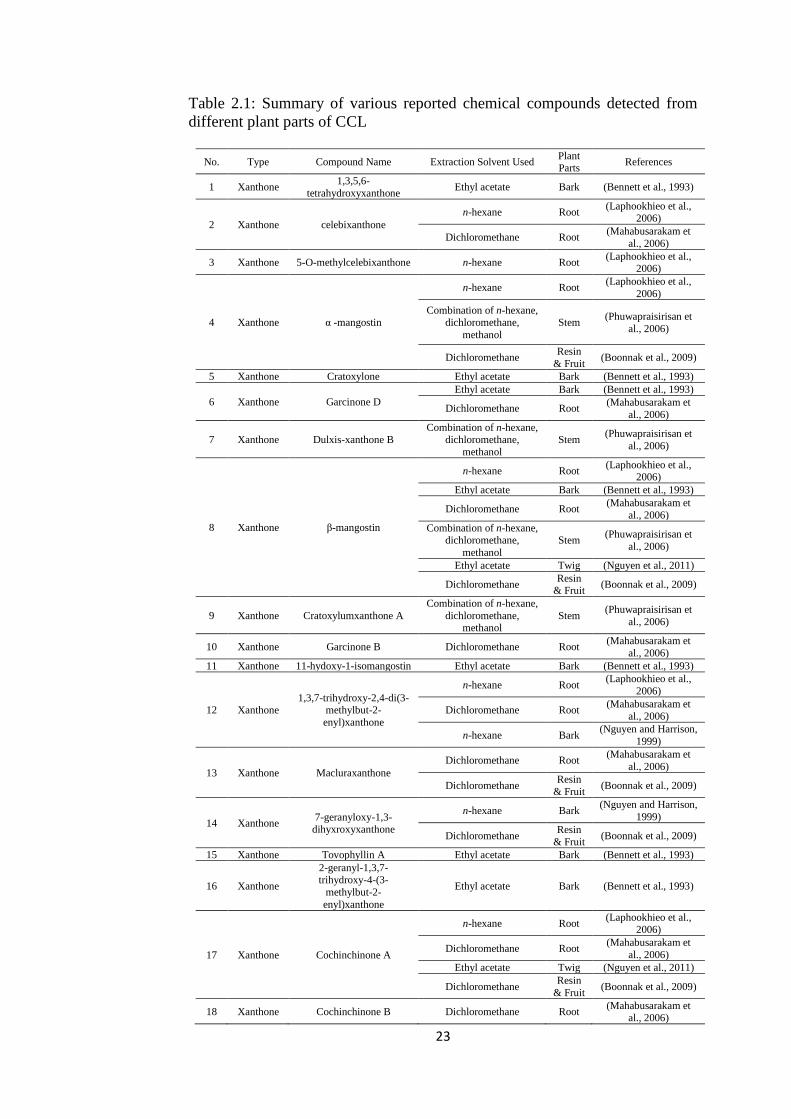
Table 2.1: Summary of various reported chemical compounds detected from
different plant parts of CCL
No. Type Compound Name Extraction Solvent Used Plant Parts
References
1 Xanthone 1,3,5,6-
tetrahydroxyxanthone Ethyl acetate Bark (Bennett et al., 1993)
2 Xanthone celebixanthone
n-hexane Root (Laphookhieo et al.,
2006)
Dichloromethane Root (Mahabusarakam et
al., 2006)
3 Xanthone 5-O-methylcelebixanthone n-hexane Root (Laphookhieo et al.,
2006)
4 Xanthone α -mangostin
n-hexane Root (Laphookhieo et al.,
2006)
Combination of n-hexane, dichloromethane,
methanol
Stem (Phuwapraisirisan et
al., 2006)
Dichloromethane Resin
& Fruit (Boonnak et al., 2009)
5 Xanthone Cratoxylone Ethyl acetate Bark (Bennett et al., 1993)
6 Xanthone Garcinone D
Ethyl acetate Bark (Bennett et al., 1993)
Dichloromethane Root (Mahabusarakam et
al., 2006)
7 Xanthone Dulxis-xanthone B Combination of n-hexane,
dichloromethane,
methanol
Stem (Phuwapraisirisan et
al., 2006)
8 Xanthone β-mangostin
n-hexane Root (Laphookhieo et al.,
2006)
Ethyl acetate Bark (Bennett et al., 1993)
Dichloromethane Root (Mahabusarakam et
al., 2006)
Combination of n-hexane, dichloromethane,
methanol
Stem (Phuwapraisirisan et
al., 2006)
Ethyl acetate Twig (Nguyen et al., 2011)
Dichloromethane Resin
& Fruit (Boonnak et al., 2009)
9 Xanthone Cratoxylumxanthone A
Combination of n-hexane,
dichloromethane, methanol
Stem (Phuwapraisirisan et
al., 2006)
10 Xanthone Garcinone B Dichloromethane Root (Mahabusarakam et
al., 2006)
11 Xanthone 11-hydoxy-1-isomangostin Ethyl acetate Bark (Bennett et al., 1993)
12 Xanthone 1,3,7-trihydroxy-2,4-di(3-
methylbut-2-
enyl)xanthone
n-hexane Root (Laphookhieo et al.,
2006)
Dichloromethane Root (Mahabusarakam et
al., 2006)
n-hexane Bark (Nguyen and Harrison,
1999)
13 Xanthone Macluraxanthone
Dichloromethane Root (Mahabusarakam et
al., 2006)
Dichloromethane Resin
& Fruit (Boonnak et al., 2009)
14 Xanthone 7-geranyloxy-1,3-
dihyxroxyxanthone
n-hexane Bark (Nguyen and Harrison,
1999)
Dichloromethane Resin
& Fruit (Boonnak et al., 2009)
15 Xanthone Tovophyllin A Ethyl acetate Bark (Bennett et al., 1993)
16 Xanthone
2-geranyl-1,3,7-trihydroxy-4-(3-
methylbut-2-
enyl)xanthone
Ethyl acetate Bark (Bennett et al., 1993)
17 Xanthone Cochinchinone A
n-hexane Root (Laphookhieo et al.,
2006)
Dichloromethane Root (Mahabusarakam et
al., 2006)
Ethyl acetate Twig (Nguyen et al., 2011)
Dichloromethane Resin
& Fruit (Boonnak et al., 2009)
18 Xanthone Cochinchinone B Dichloromethane Root (Mahabusarakam et
al., 2006)
24
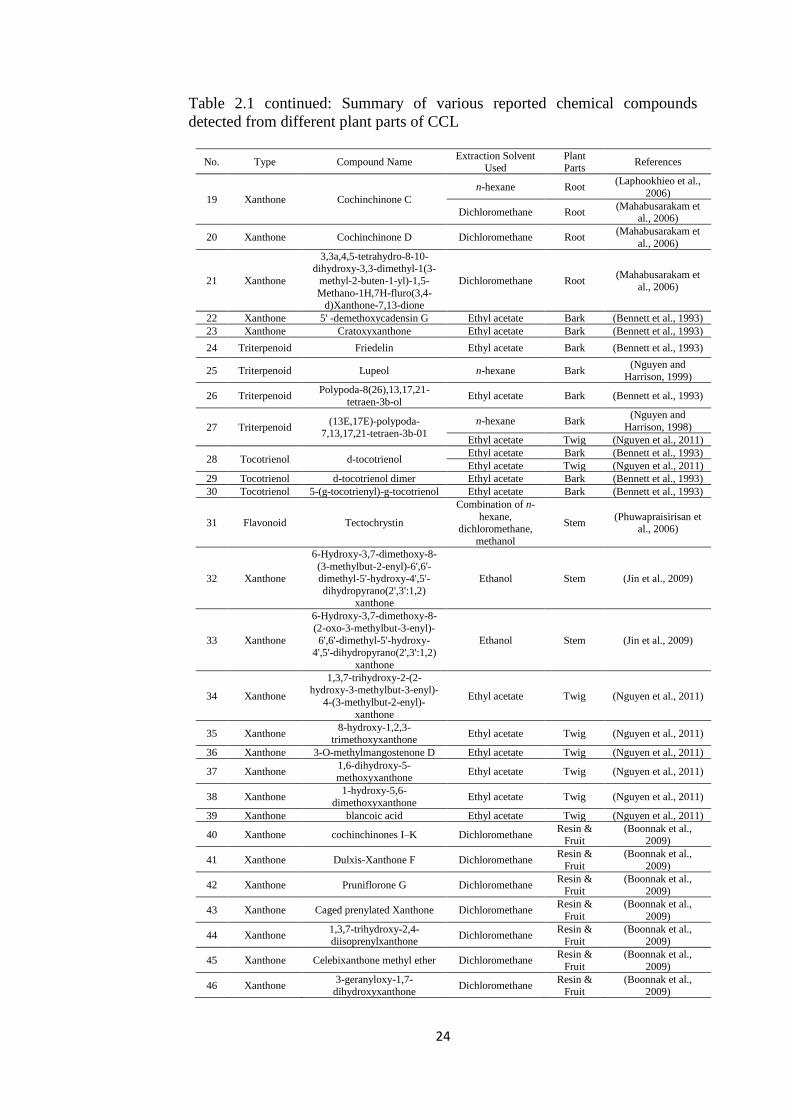
Table 2.1 continued: Summary of various reported chemical compounds
detected from different plant parts of CCL
No. Type Compound Name Extraction Solvent
Used Plant Parts
References
19 Xanthone Cochinchinone C
n-hexane Root (Laphookhieo et al.,
2006)
Dichloromethane Root (Mahabusarakam et
al., 2006)
20 Xanthone Cochinchinone D Dichloromethane Root (Mahabusarakam et
al., 2006)
21 Xanthone
3,3a,4,5-tetrahydro-8-10-dihydroxy-3,3-dimethyl-1(3-
methyl-2-buten-1-yl)-1,5-
Methano-1H,7H-fluro(3,4-d)Xanthone-7,13-dione
Dichloromethane Root (Mahabusarakam et
al., 2006)
22 Xanthone 5' -demethoxycadensin G Ethyl acetate Bark (Bennett et al., 1993)
23 Xanthone Cratoxyxanthone Ethyl acetate Bark (Bennett et al., 1993)
24 Triterpenoid Friedelin Ethyl acetate Bark (Bennett et al., 1993)
25 Triterpenoid Lupeol n-hexane Bark (Nguyen and
Harrison, 1999)
26 Triterpenoid Polypoda-8(26),13,17,21-
tetraen-3b-ol Ethyl acetate Bark (Bennett et al., 1993)
27 Triterpenoid (13E,17E)-polypoda-
7,13,17,21-tetraen-3b-01
n-hexane Bark (Nguyen and
Harrison, 1998)
Ethyl acetate Twig (Nguyen et al., 2011)
28 Tocotrienol d-tocotrienol Ethyl acetate Bark (Bennett et al., 1993)
Ethyl acetate Twig (Nguyen et al., 2011)
29 Tocotrienol d-tocotrienol dimer Ethyl acetate Bark (Bennett et al., 1993)
30 Tocotrienol 5-(g-tocotrienyl)-g-tocotrienol Ethyl acetate Bark (Bennett et al., 1993)
31 Flavonoid Tectochrystin
Combination of n-
hexane, dichloromethane,
methanol
Stem (Phuwapraisirisan et
al., 2006)
32 Xanthone
6-Hydroxy-3,7-dimethoxy-8-
(3-methylbut-2-enyl)-6',6'-dimethyl-5'-hydroxy-4',5'-
dihydropyrano(2',3':1,2) xanthone
Ethanol Stem (Jin et al., 2009)
33 Xanthone
6-Hydroxy-3,7-dimethoxy-8-
(2-oxo-3-methylbut-3-enyl)-
6',6'-dimethyl-5'-hydroxy-4',5'-dihydropyrano(2',3':1,2)
xanthone
Ethanol Stem (Jin et al., 2009)
34 Xanthone
1,3,7-trihydroxy-2-(2-hydroxy-3-methylbut-3-enyl)-
4-(3-methylbut-2-enyl)-
xanthone
Ethyl acetate Twig (Nguyen et al., 2011)
35 Xanthone 8-hydroxy-1,2,3-
trimethoxyxanthone Ethyl acetate Twig (Nguyen et al., 2011)
36 Xanthone 3-O-methylmangostenone D Ethyl acetate Twig (Nguyen et al., 2011)
37 Xanthone 1,6-dihydroxy-5-
methoxyxanthone Ethyl acetate Twig (Nguyen et al., 2011)
38 Xanthone 1-hydroxy-5,6-
dimethoxyxanthone Ethyl acetate Twig (Nguyen et al., 2011)
39 Xanthone blancoic acid Ethyl acetate Twig (Nguyen et al., 2011)
40 Xanthone cochinchinones I–K Dichloromethane Resin &
Fruit (Boonnak et al.,
2009)
41 Xanthone Dulxis-Xanthone F Dichloromethane Resin &
Fruit
(Boonnak et al.,
2009)
42 Xanthone Pruniflorone G Dichloromethane Resin &
Fruit (Boonnak et al.,
2009)
43 Xanthone Caged prenylated Xanthone Dichloromethane Resin &
Fruit
(Boonnak et al.,
2009)
44 Xanthone 1,3,7-trihydroxy-2,4-diisoprenylxanthone
Dichloromethane Resin &
Fruit (Boonnak et al.,
2009)
45 Xanthone Celebixanthone methyl ether Dichloromethane Resin &
Fruit
(Boonnak et al.,
2009)
46 Xanthone 3-geranyloxy-1,7-
dihydroxyxanthone Dichloromethane
Resin &
Fruit
(Boonnak et al.,
2009)
25
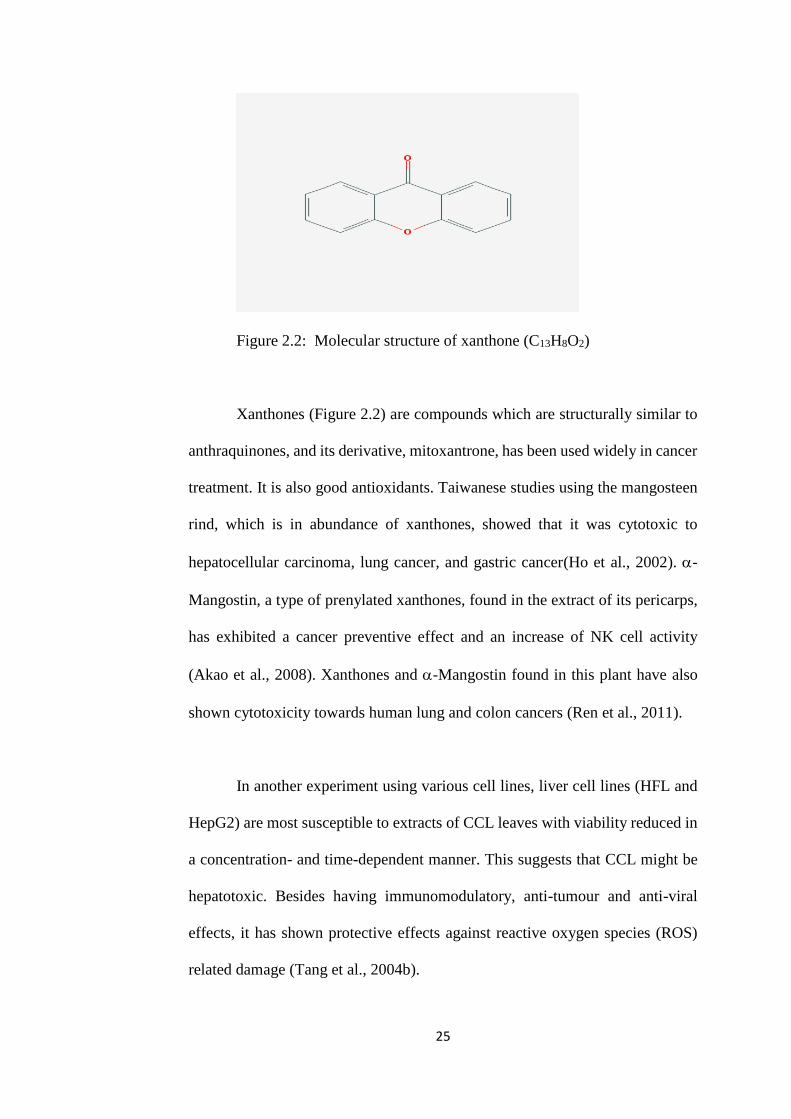
Figure 2.2: Molecular structure of xanthone (C13H8O2)
Xanthones (Figure 2.2) are compounds which are structurally similar to
anthraquinones, and its derivative, mitoxantrone, has been used widely in cancer
treatment. It is also good antioxidants. Taiwanese studies using the mangosteen
rind, which is in abundance of xanthones, showed that it was cytotoxic to
hepatocellular carcinoma, lung cancer, and gastric cancer(Ho et al., 2002). -
Mangostin, a type of prenylated xanthones, found in the extract of its pericarps,
has exhibited a cancer preventive effect and an increase of NK cell activity
(Akao et al., 2008). Xanthones and -Mangostin found in this plant have also
shown cytotoxicity towards human lung and colon cancers (Ren et al., 2011).
In another experiment using various cell lines, liver cell lines (HFL and
HepG2) are most susceptible to extracts of CCL leaves with viability reduced in
a concentration- and time-dependent manner. This suggests that CCL might be
hepatotoxic. Besides having immunomodulatory, anti-tumour and anti-viral
effects, it has shown protective effects against reactive oxygen species (ROS)
related damage (Tang et al., 2004b).
26
In a study done by Ge (2008), ethanol extract of its stems was isolated
where26 xanthones and 2 other kinds of compoundswere identified by bioassay-
guided fractionation. Studies have shown that some of the xanthones inhibited
the growth of various cancer cell lines. This also suggests that xanthones have
the antitumour effect (Ge, 2008).
2.5.2 Metabolic Fingerprinting of Plant
Metabonomics is a branch of system biology, using advanced analytical
techniques and data-mining systems, to analyse the metabolome of samples.
Along with genomics, transcriptomics and proteomics, it has evolved into
another important branch of studies since “system biology” was coined. Not only
is system biology studying all the components in biological system, but also
investigating the interrelationships among these components. It analyses whole
constituents at the molecular level, including gene, proteins, to cell and organ
level (Auffray et al., 2003).
System biology has been integrative part of TCM. The formula-based
medication commonly used in TCM constitutes a drug system including a
mixture of numerous compounds. The philosophy of using TCM is system-to-
system in nature: a drug system interacting with the human body system. It is
different from approach of western medicine which is point to point in nature:
single small molecule on a single target (Luo et al., 2011). With thousands of
years of clinical practices, it has shown that compound recipe of TCM is far
beyond chemistry, rather it is a complex system which has multi-dimensional
nonlinear effects on human. This is a collective effect derived from the synergy
27
of multiple ingredients in a single plant or from a multiple medicinal plant
formulation (Dou et al., 2008).
Metabonomics has been extensively used for the quality control of drugs
as well as its toxicities. However, the understanding of metabonomics varies.
The first level of understanding is target analysis, which targets a subset of
metabolites in a sample while the second level is metabolic profiling in which
quantitative analysis of known metabolites and establishment of its structures
and characteristics. The third level is metabolic fingerprinting in which
qualitative or semi-quantitative analysis of all intracellular and extracellular
metabolites is conducted while the fourth level is metabonomics which involves
comprehensive quantitative and qualitative analysis of all metabolites present in
a specific organism (Xia et al., 2009). Due to the technological constraints, some
just view metabonomics either as targeted or as global metabolite profiling.
Metabonomics is a science based on biology, analytical chemistry and
information science. With advanced analytical instruments, metabonomics could
determine and identify a tremendous number of metabolites simultaneously in
complex samples. The analytical techniques used in metabonomic studies are
primarily nuclear magnetic resonance (NMR) spectroscopy and mass
spectrometry (MS). MS has the advantage over NMR due to its higher sensitivity
and specificity after ionization. Besides, MS provides rapid detection, selective
qualification and quantification, and simultaneous identification and
measurement for a variety of metabolites. Chromatographic separation is needed
for the separation of the metabolic components before analysis by MS. Gas
28
chromatography (GC) or liquid chromatography (LC) is widely used for
separation. Nevertheless, different separation approaches are used for different
types of substances (Lindon et al., 2007; Zhu et al., 2010).
Chromatography-MS-based technologies have been used widely for
analysis of endogenous metabolites in complex samples. Volatile oils are one of
the main pharmacologically active components of many herb plants and GC-MS
based technologies naturally become the preferred choice for analysis. On the
other hand, LC/MS based technologies are used for analysis of non-volatile
components of the herb plants. It is aided by the utilization of high mass accuracy
and information on the tandem mass spectrometry (MS/MS) fragmentation.
Multivariate statistics are generated from the analysis and interpreted by other
visualization software as well as chemometric and bioinformatic methods
(Lindon et al., 2007; Hu and Xu, 2014).
From the perspective of system biology, metabonomics provide links
between compound recipe of TCM or herbal medicine and molecular
pharmacology. The first generation of chemotherapeutic drugs for cancer
treatment were mostly derived from plant secondary metabolites, such as
paclitaxel (Taxol), camptothecin (irinotecan, topotecan), and podophyllotoxins
(etoposide, teniposide) (Shyur and Yang, 2008). With the help of the
metabonomics technology, the potential of using herbs or plants for cancer
treatment could be further explored.
29
2.6 Overview of Gene Expression Technology
Before DNA microarrays started being used in the biological research in
the 1990s, traditional genetic research would manipulate individual gene and
monitor the effects of this gene in different experimental settings. Using this
traditional approach of gathering the data about the genes, researchers might not
be able to get an overall picture of how the relative expression of different genes
was although tremendous time had to spend on it.
The invention of DNA microarrays has overcome this problem and has
allowed large-scale studies of gene expression. This small chip has been
embedded with thousands of small spots, containing different fluorescent dyes,
which bonded to particular DNA or RNA. Tens of thousands of transcripts are
arranged in these arrays of spots. The relative level of the dye could be optically
measured and analysed for the expression level of genes. This is particularly
useful in the field of biological research since it allows researchers exploring the
wide range of gene expression profiles of two or more conditions (treated vs
untreated, or disease vs normal) without prejudices. In another word, just one
single chip could interpret the whole genome of the organism. This provides
better insights into genetic regulation of different diseases. Microarray products
have been in the market for quite some time. Most could accommodate 40,000
and above expressed sequences on a chip and measure the entire complement of
known transcriptome (Romero et al., 2012). It is suitable for any global gene
pattern study, especially for specific diseases or drug treatments.
30
The core principle behind microarrays is hybridization between two
DNA strands. Single stranded labelled probes of known sequence were used to
detect the presence of their complements in unknown samples. The higher
number of complementary base pairs in a nucleotide sequence is, the tighter non-
covalent bonding between the two strands is. Only the strong paired strands
remain hybridized after washing process. The total strength of the signal depends
upon the amount of target sample binding to the probes present on that spot. The
relative quantitation of fluorescence on a microarray can be optically measured
and analysed to determine whether there has been higher or lower expression of
a particular gene. This subsequently involves using strong algorithms for
grouping or clustering those statistically relevant expression data together before
any useful info is sorted out for the elucidation of its functional pathways and
interaction of the genes.
However, microarray technology has some limitations. The background
hybridization has limited the accuracy measurements, especially for those
transcripts with low abundance. The detection of genes is also probes-specific.
Different probe design may generate different hybridization results. Probe
design varies among microarrays. This hybridization specificity depends on the
type of microarray used. Some suppliers, such as Affymetrix, Agilent,
Nimblegen, use short-oligomer probe set approach while some, especially those
for cDNA microarray, may use long-probe approach which involves few
hundreds bases in length (Koltai and Weingarten-Baror, 2008). To overcome
some of the limitations, different suppliers use different approaches to address
the weaknesses of using microarray technology and prolong the lifespan of the
31
technology. For example, based on available commercial from Affymetrix about
its GeneChip Human Transcriptome Array (HTA) 2.0 which was used in this
experiment, it claims it measures expression changes at the exon and sub-exon
level, taking into account the diversity of transcript isoforms derived from
alternative splicing. Ten probes at each unique exonic region provide
independent measurements of every transcript isoform from each gene. In
addition, HTA contains four unique probes for every known exon-exon junction.
On average, 140 probes per gene are measured. HTA, with content from multiple
databases, allows analysis of all 15 transcript isoforms independently. It also
claims it delivers what RNA sequencing technology missed
(http://www.affymetrix.com/fa/media/hta_array_2_0_flyer.pdf).
No doubt, the advent of next-generation sequencing technologies or
RNA sequencing techniques has changed the landscape of transcriptomics study
of samples. It is a high throughput sequencing technology and allows direct
sequencing of transcripts. It does not need the genome annotation for prior probe
selection and hybridization bias could be avoided. It allows comparison of gene
expression level at any combination of samples, even when genomic sequences
are unclear. This makes the whole-genome transcriptome profiling for samples
possible. However, the cost of RNA sequencing technique is still relatively high
compared with microarray technologies ( Zhao et al., 2014).
32
CHAPTER 3
MATERIAL AND METHODS
3.1 Extraction of Crytoxylum Cochinchinense Lour. (CCL)
3.1.1 Collection and Drying of Plant Sample
Cratoxylum Cochinchinense Lour (CCL) plants were collected from the
Rawang forest reserve. Different parts of plant samples were collected; these
include barks, stems and exudates. Bark and stems were cut into 25-50 mm
length with 5-10 mm width or length. There were then dried in room temperature
for one month before subjected for solvent extraction.
3.1.2 Extraction and Fractionation of the Crude Extract of CCL
3.1.2.1 Serial Exhaustive Extraction
Serial exhaustive extraction was used to extract wider range of
compounds from CCL. It involved successive extraction with solvents of
increasing polarity from a non-polar solvent (petroleum ether) to a more polar
solvent (methanol). The plant samples (Plate 3.1), including barks, stems and
exudates, were macerated separately in a conical flask (Plate 3.2) successively
with the solvents of increasing polarity: petroleum ether (PE), ethyl acetate (EA)
and methanol (MeOH), over a period of five days for each solvent. The extracts
were filtered subsequently and solvents were removed from extracts by using
rotary evaporation (Plate 3.3) and freeze-dried. The extracts were stored in
capped vials (Plate 3.4 and Plate 3.5) and were weighed. The extracts collected
were labelled asbark-PE, bark-EA, bark-MeOH, stem-PE, stem-EA, and stem-
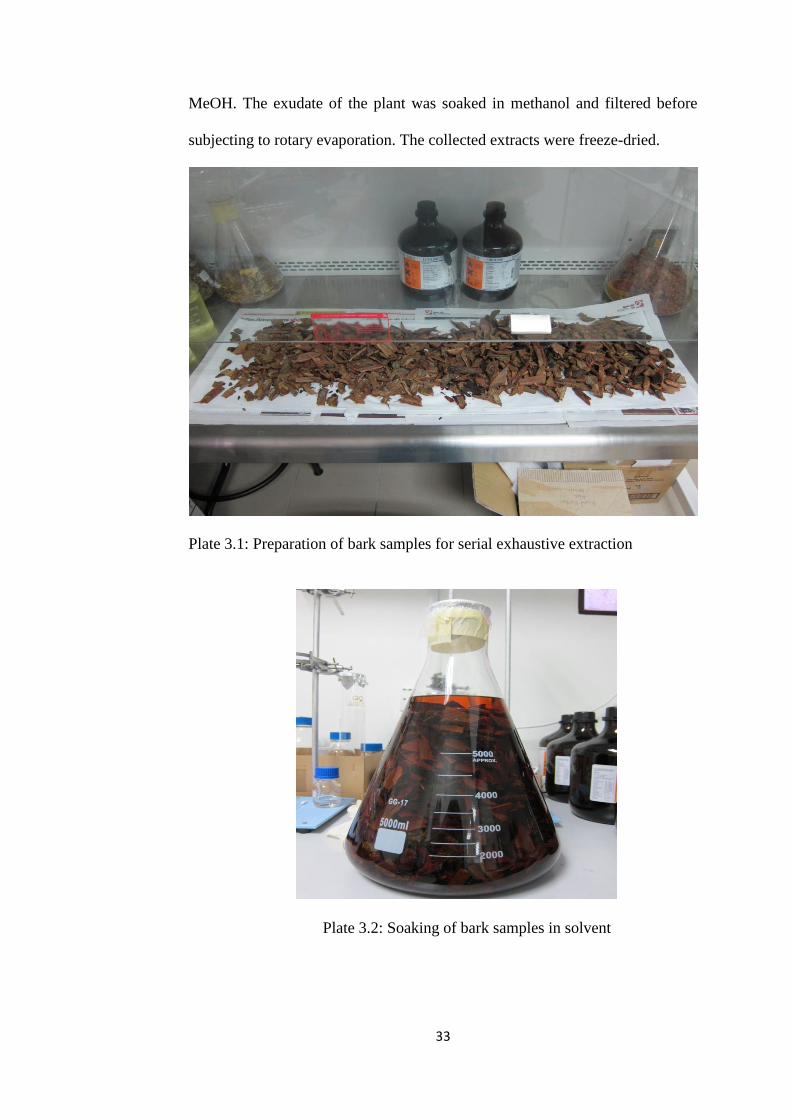
33
MeOH. The exudate of the plant was soaked in methanol and filtered before
subjecting to rotary evaporation. The collected extracts were freeze-dried.
Plate 3.1: Preparation of bark samples for serial exhaustive extraction
Plate 3.2: Soaking of bark samples in solvent
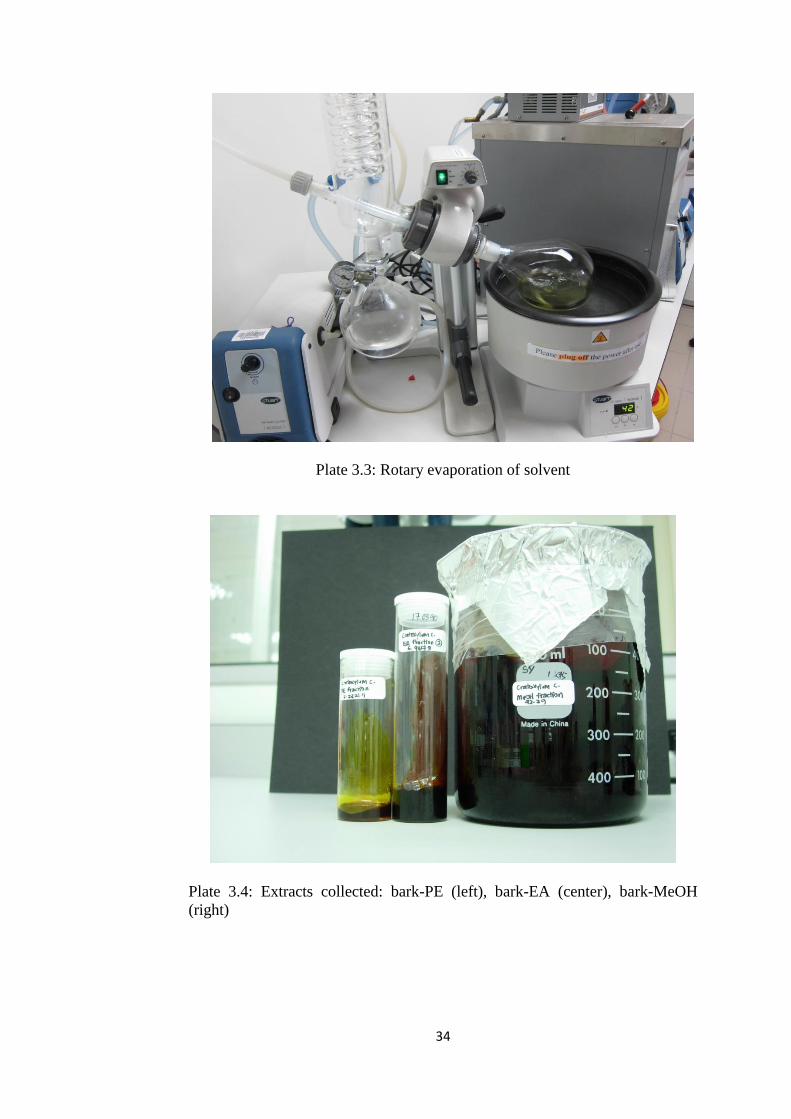
34
Plate 3.3: Rotary evaporation of solvent
Plate 3.4: Extracts collected: bark-PE (left), bark-EA (center), bark-MeOH
(right)
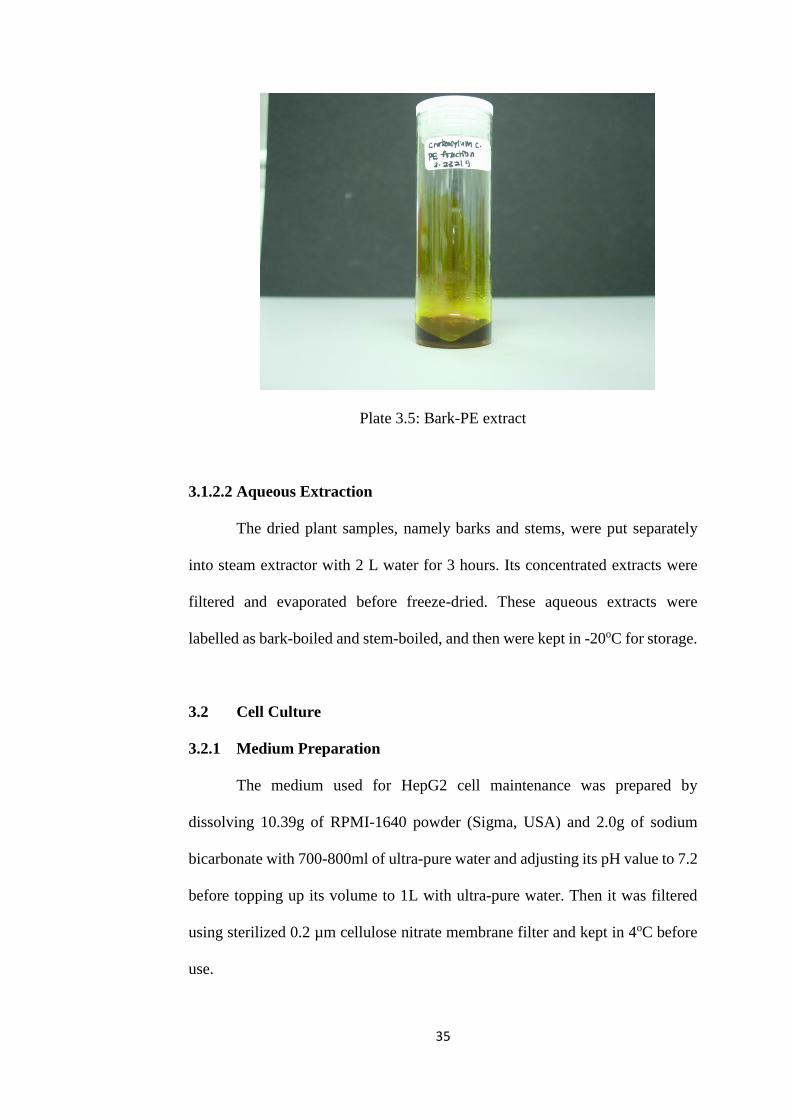
35
Plate 3.5: Bark-PE extract
3.1.2.2 Aqueous Extraction
The dried plant samples, namely barks and stems, were put separately
into steam extractor with 2 L water for 3 hours. Its concentrated extracts were
filtered and evaporated before freeze-dried. These aqueous extracts were
labelled as bark-boiled and stem-boiled, and then were kept in -20oC for storage.
3.2 Cell Culture
3.2.1 Medium Preparation
The medium used for HepG2 cell maintenance was prepared by
dissolving 10.39g of RPMI-1640 powder (Sigma, USA) and 2.0g of sodium
bicarbonate with 700-800ml of ultra-pure water and adjusting its pH value to 7.2
before topping up its volume to 1L with ultra-pure water. Then it was filtered
using sterilized 0.2 µm cellulose nitrate membrane filter and kept in 4oC before
use.
36
3.2.2 Cell Culture Maintenance
HepG2 were maintained in standard T-75 flask with RPMI complete
medium containing 10% of fetal bovine serum (GIBCO, South America) at 37oC
in a humidified incubator circulated with 5% of carbon dioxide. Medium was
changed when the confluency of the cell in flask reached 80%. Cell number and
its viability were determined by trypan blue dye exclusion method by using
haemocytometer (Hirschmann Laborgeraete, Germany). A 1:1 ratio of trypan
blue (10µl) and cells (10µl) were prepared and put on the haemocytometer. The
average number of total viable cells was determined and used for subsequent
bioassays.
3.2.3 Cryopreservation of Cell Culture
The cells were checked for its health status, based on the growth,
morphology and contamination before cryopreservation. HepG2 cells were
transferred into a sterilized centrifuge tube from culture flask and centrifuged at
1500rpm for 5 minutes. The pellet was collected and re-suspended with a
mixture of 0.9ml medium with 10% of fetal bovine serum and 0.1ml of dimethyl
sulfoxide (DMSO). DMSO acted as a cryoprotectant. It was then transferred into
cryopreservation vial and placed in the -80 oC freezer overnight before
transferred to -196oC liquid nitrogen tank.
3.2.4 Thawing of Cell Line
After removed from -80OC freezer, the cells were thawed in 37OC water
bath until it was liquefied. The cell was then transferred to a T-75 flask with.
The cell culture was cultured with 90% prepared medium supplemented with
37
10% fetal bovine serum and incubated at 37oC with 5% CO2 for a day. Fresh
prepared medium with 10% of fetal bovine serum was added in the following
day.
3.3 Cell Viability Assay
3.3.1 Cell Count Assay
Cells were harvested and cell counting performed using Trypan blue
(Sigma-Aldrich, Missouri, US) dye exclusion method by using a
haemocytometer (Hirschmann Laboragerate, Germany). 1:1 ratio of Trypan blue
and cells were prepared to give a 2-fold dilution of cells. The estimated average
number of total viable cells in 1mL was obtained by multiplying this dilution
factor above.
3.3.2 Determination of Optimal Cell Concentration
In order to determine the optimum number of HepG2 cells, cells were
seeded at different concentrations in the 96-well plates. Approximately 6.5x10⁵
cells/ml of HepG2 were seeded in the wells in triplicate. The cells were serially
diluted into 3.25x10⁵, 1.625x10⁵, 0.8125x10⁵, 0.40625x10⁵, 0.203x10⁵,
0.1015x10⁵, 0.5x10⁴, 0.25x104,0.125x104, 0.625x10³ cells/ml respectively. The
plated cells were incubated for 4 days, after which MTT assay was carried out
and its corresponding absorbance was measured at 570nm by using Tecan
Infinite 200 Pro (Tecan, Männedorf, Switzerland). Absorbance versus cell
concentration graph was derived and optimum cell concentration in cytotoxicity
assay was obtained from the curve of the graph where the exponential phase was.
38
3.3.3 Evaluation of Cytotoxicity
3.3.3.1 Preparation of Mother Stock for Crude Plant Extracts
The extracts from the serial exhaustive extraction and aqueous
extractions, namely bark-PE, bark-EA, bark-MeOH, stem-PE, stem-EA, stem-
MeOH, bark-boiled, stem-boiled and exudate were used to prepare the mother
stock for this experiment. Twenty mg of each extract was dissolved in 1ml of
DMSO, followed by 10 minutes of sonication to ensure full dissolution of
extracts. The extracts were kept in 4oC.
3.3.3.2 Preparation of Sub-stocks of Bark Extracts, Stem Extracts,
Exudates and Sorafenib for Evaluation of Cytotoxicity
Sub-stocks of extracts from the barks and exudates, namely bark-PE,
bark-EA, bark-MeOH, exudates-MeOH, were prepared at the concentration of
100µg/ml from the mother stockof20mg/ml while sub-stocks of other extracts,
namely stem-PE, stem-EA, stem-MeOH, stem-boiled, bark-boiled were
prepared at the concentration of 200 µg/ml from the mother stock of 20 mg/ml.
Mother stock of Sorafenib was prepared by dissolving Sorafenib powder (Bayer,
USA) at 10 mg/ml in DMSO.
One hundred µl of each sub-stock, namely bark-PE, bark-EA, bark-
MeOH, exudates-MeOH, was added at the concentration of 100 µg/ml into the
96-wells in triplicate. They were then serially diluted to the concentrations of 50,
25, 12.5, 6.25, 3.125, 1.56, 0.78µg/ml in the wells. While 100 µl of other sub-
stocks, namely stem-PE, stem-EA, stem-MeOH, stem-boiled, bark-boiled, were
added at the concentration of 200 µg/ml to wells in triplicate. They were then
39
serially diluted to the concentration of 100, 50, 25, 12.5, 6.25, 3.125, 1.56, and
0.78 µg/ml in wells in triplicate. As for the preparation of Sorafenib, 100 µl of
sub-stock of Sorafenib at a concentration of 20 µg/ml was added to the wells in
triplicate. It was then serially diluted to a concentration of 10, 5, 2.5, 1.25, 0.625,
0.3125, and 0.156 µg/ml in wells in triplicate. Then, 5x10⁴ cells/ml were added
into the wells containing the extracts.
Besides the wells with extracts, wells with 100µl of medium only and
100µl of medium with 0.5% of DMSO were prepared in triplicate and served as
a control and blank, respectively. The cells were incubated in a CO2incubator for
24 hours. After that, the cells were treated with extracts and incubated for another
72 hours. MTT was then added into each well with a final concentration of 0.5
mg/ml. The plate was then incubated for another 4 hours until the purple
precipitate was visible. Its supernatant was then discarded from each well. 100µl
of DMSO was then added into individual well and the plate was then swirled
gently by using the low speed shaker in order for the DMSO to dissolve the
coloured formazan crystals at room temperature. The absorbance of each well
was obtained from the microtiter plate reader Tecan Infinite 200 Pro (Tecan,
Männedorf, Switzerland).
3.3.3.3 Determination of IC50
IC50 is the concentration of drug required for 50 %inhibition in vitro. It
is a measurement of the effectiveness of a substance in inhibiting specific
biological or biochemical function.
40
With the concentrations of the extract on the inhibition level of biological
function from cytotoxicity assay, the dose-response curve was constructed for
each extract, namely bark-PE, bark-EA, bark-MeOH, bark-boiled, stem-PE,
stem-EA, stem-MeOH, stem-boiled, exudate, Sorafenib. The value of IC50 was
derived and further verified by using GraphPad Prism software 5.0 (GraphPad
Software Inc., California, US).
3.4 Microarray Gene Expression Analysis
3.4.1 Total RNA Extraction
4x10⁵of HepG2 cells were seeded in 60.1sqcm culture dish (TPP,
Switzerland) with 8ml complete medium in order to get the optimum cell
concentration of 5x10⁴ cells/ml which was derived from cell proliferation assay.
After HepG2 cells were seeded for 24hours, the most cytotoxic extract,
Bark-PE, was added into the HepG2 cell culture. The IC50 concentration of Bark-
PE was tested at 20.41µg/ml. The untreated HepG2 cells were incubated with
only 0.5% DMSO.
These extract-treated HepG2 cells were then harvested periodically at 0,
6, 12, 18, 24 and 48 hours respectively. Untreated HepG2 cells were also
harvested periodically at the similar time points. The harvested cells were
subjected total RNA extraction by using total RNA extraction kit (RNeasy Mini
Kit, Qiagen) according to manufacturer’s instructions.
41
The purity and integrity of total RNA extracted from the treated and
untreated cell at different time points were determined by using Nanodrop UV-
Vis Spectrophotometer (Implen, Germany). RNA samples extracted run on a
denaturing agarose gel stained with ethidium bromide (EtBr). The 28S rRNA
band was approximately twice as intense as the 18S rRNA band. This 2:1 ratio
(28S:18S) was a good indication that the RNA was completely intact. These
bands were further verified by using Agilent 2100 Bioanalyzer with RNA
Labchip Kit.
3.4.2 Target Preparation and Hybridization
GeneChip Human Gene 2.0 ST Array (Affymetrix) was used for this
microarray assay. T7 primers (incurring a 3’ bias of transcript sensitivity) were
used in the cDNA synthesis step for target preparation from the total RNA. An
in vitro transcription procedure was then carried out to produce biotin-labelled
cRNA. In this procedure, second-stranded cDNA template was synthesized and
amplified using T7 RNA polymerase. cRNA produced was subsequently
purified by removing its enzymes, salts, inorganic phosphates and
unincorporated nucleotides. The sense-strand of cDNA was synthesized from
this purified cRNA by the reverse transcription using 2nd cycle primers before
being hydrolysed. This cDNA was then purified before the procedure of
fragmentation and labelling. The fragmented and biotin-labelled ss-cDNA was
then mixed with a hybridization cocktail before injected into the GeneChip array,
which was then hybridized for 16 hours at 45oC with rotation at 60rpm.
42
Immediately after hybridization, the hybridized probe arrays underwent
an automated washing and staining protocol on the GeneChip” FS450 fluidic
station and were then scanned on the GeneChip® Scanner 3000 7G Plus where
patterns of hybridization were detected. The hybridization data were collected
as light emitted from the fluorescent reporter groups which were already
incorporated into the target while being bound to the probe array. Probes that
perfectly matched the target generally produced stronger signals than those that
had mismatches. Data generated from the scan was then analysed using the
Affymetrix GeneChip® Command Console software, v1.1, and the Affymetrix
GeneChip® Expression Console software, v 1.1.
3.4.3 Microarray Data Analysis
For each array experiment that was performed using the Affymetrix
GeneChip® arrays, six files were generated (*.DAT, *.CEL, *.CHP, *.ARR,
*.RPT, *.txt) by the scanner. Affymetrix® Expression Console™ Software was
used to perform QC analysis of Gene 2.0 ST Array data. Quality control of chip
could be obtained from *.RPT. *.CEL provides cell intensity file that calculates
the average intensities for each cell and assigned it to an (x, y) coordinate
position. *.ARR contains experimental information. *.CHP contains the analysis
output.
Affymetrix GeneChip Human Transcriptome Array (HTA) 2.0,
combined with Affymetrix Transcriptome Analysis Console (TAC) software
were used for global gene expression analysis for this experiment. Affymetrix
GeneChip Human Transcriptome Array Console TAC 2.0 runs a statistical
43
analysis based on Expression Console (EC) generated CHP to obtain a list of
differentially expressed genes and alternative splicing events. The visualization
of genes, exons, junctions and transcript isoforms could be obtained. Only those
.CEL files and .CHP files satisfied the quality assessment criteria were exported
to TAC for further analysis.
3.4.3.1 Quality Control of Arrays
Only those extract-treated samples which fulfilled the quality assessment
criteria of microarray assay were selected for further analysis. The quality of
microarrays samples was analysed using the functions of RMASketch of
Affymetrix Expression Console software (Appendix A-1). The typical values of
the pos_vs_neg_auc metric of RMASketch normally fall into the range of 0.8 to
0.9. This AUC value (area under the curve) plots the detection of positive
controls against the false detection of negative controls. This metric is a robust
measurement for overall data quality. While a value of 1.0 being perfect, a value
of 0.5 illustrates no discernible difference between the positive and negative
controls. They were further validated by studying the correlation of all the
samples. The obvious outliners of triplicate were excluded (Appendix A-2).
3.4.3.2 Grouping of Sample Arrays
The .CEL files and .CHP files of the selected samples were then exported
to Affymetrix Transcriptome Analysis Console (TAC) for further analysis. The
.CEL files for samples were grouped together based on its type of
treated/untreated samples and time points. The.CEL files of individual grouped
samples, including sample treated with drug for 6 hours (or extract-treated 6 hrs
44
sample, and thereafter D6), extract-treated 12 hours sample (D12), extract-
treated 18 hours sample (D18), extract-treated 24 hours sample (D24), extract-
treated 48 hours sample (D48), untreated 6 hours sample (C6), untreated 12
hours sample (C12), untreated 18 hours sample (C18), untreated 24 hour sample
(C24) and untreated 48 hours sample (C48), were then compared with .CEL files
of grouped control samples (C0), respectively.
The relative expression fold-change of genes from each grouped sample
versus control sample was then derived. This fold change analysis was to
measure the change in the expression level of genes by comparing the expression
of target genes between two groups of arrays, such as treated sample (D6) versus
untreated sample (C6) or D6 versus C0. The data is accessible through GEO
Series accession GSE85746
(http://www.ncbi.nlm.nih.gov/geo/query/acc.cgi?acc=GSE85746)
3.4.3.3 Statistical Analysis among Sample Arrays
The statistical data from TAC allows researchers to screen through the
P-value and level of expression fold change. Only those gene transcripts with
P-value of less than 0.05 and expression fold change > 2.0 or <-2.0 at any single
time point were considered significant (Appendix E). These significant
expressed genes were then exported to DAVID Bioinformatics Resources 6.7 of
National Institute of Allergy and Infectious Diseases (NIAID)
(https://david.ncifcrf.gov/) for functional analysis. Functional annotation cluster
analysis of DAVID allows analysing the differentially expressed glycogens from
the shortlisted genes from TAC and categorizing them based on gene ontology
45
(GO) term. These significant genes obtained were then mapped to Kyoto
Encyclopaedia of Genes and Genomes (KEGG) pathway and their related well-
studied pathways were explicitly indicated.
3.4.4 Gene Selection Guideline for the KEGG Pathway Analysis
The significance of the gene expression was filtered with one-way
ANOVA algorithm. P-value of less than 0.05 was used to discriminate between
differentially expressed genes. Significantly expressed genes, including those
with differential expression more than two-fold-changes, were then exported to
DAVID Bioinformatics for pathway elucidation analysis.
However, genes which show relatively significant expression between
treated samples and untreated samples at their respective time-points were to be
included since it indicated the stark difference between expression of treated
samples and untreated samples. This selection of these genes was done manually
through the screening of genes showing in the Kyoto Encyclopaedia of Genes
and Genomes (KEGG) pathways.
3.5 Data Validation and Correlation
3.5.1 Relative Real-time PCR
3.5.1.1 cDNA Synthesis
Total RNA isolated from extractions was used for cDNA synthesis. The
Maxima First Strand cDNA Synthesis Kit (Themo Scientific) for RT-qPCR
containing oligo(dT)18 and random hexamer primers was used to prime
synthesis of first strand cDNA. Five g of total RNA was mixed with the
46
Maxima Kit according to manufacturer’s instructions. It was then incubated for
10min at 25 oC, followed by 15 min at 50 oC. cDNA produced was then used for
the qPCR.
3.5.1.2 Preparation for qPCR
QuantiNova SYBR Green PCR kits (Qiagen) was used for qPCR assay.
It is composed of Quantinova Yellow template dilution buffer and SYBR Green
PCR Master Mix. The dye QuantiNova Yellow template dilution buffer of kit
was used for the tracking of the pipette samples in qPCR. When added to the
blue SYBR Green PCR Master Mix, the colour changed from blue to green,
indicating the successful inclusion of template.
The PCR started with initial heat activation at 95oC for 2minutes to
activate the QuantiNova DNA Polymerase. It was followed by 2-steps PCR
cycling protocol, which the denaturation step was run at 95oCfor 5s before a
combined annealing and extension step at 60oC for 10s.QuantiNova DNA
polymerase remains inactive during low temperature. Within 2 minutes of
raising the temperature to 95oC, the Antibody and QuantiNova Guard are
denatured and the DNA polymerase is activated and enabled PCR amplification.
Gene-specific Primers (GSP) were used based on the shortlisted genes identified
in Microarray assays.
47
3.5.1.3 Construction of Standard Curve of PCR
An exact 5ng/µl of cDNA samples harvested from various time-points at
0, 12, 24, 48 hours, were then diluted to various concentrations at 0.5, 0.05, 0.005
and 0.0005 ng/µl by tenfold serial dilution. The standard curve of each GSP,
showing the concentration of GSP versus threshold cycles was then derived.
After comparing all the standard curves, the optimum concentration for each
GSP was then used for the PCR assay.
3.5.1.4 Normalization of Gene Expression
An exact 2 µl of each cDNA samples were added with 10 µl of SYBR
Green and 6 µl of RNase Free water for each GSP. GAPDH was selected as a
housekeeping reference gene, while the RNase Free water was used as an
internal control for contamination. All of them were prepared in triplicate. The
expression of the selected gene was then normalized to GADPH, housekeeping
gene.
3.5.2 Western Blot Assay
3.5.2.1 Preparation of Protein and Quantification of Protein
Extract-treated HepG2 cells were harvested at time points of 12, 24, and
48 hours along with untreated HepG2 at time point of 0 hours. RIPA buffer
containing protease inhibitor cocktail (Nacalai Tesque, Japan) was then mixed
with SDS 1% solution and used to lyse the harvested cells according to
manufacturer’s instructions (Nacalai Tesque, Japan).
48
The extracted protein was then quantified using the Thermo Scientific
Pierce 660nm Protein Assay. Exact 10 µl of assay standard, extracted protein
samples for various time points and blank sample were prepared in triplicate and
put into the microplate well. Subsequently, 150 µl of Protein Assay Reagent
were added to each well before mixed in a low-speed plate shaker for a minute
and incubated at room temperature for 5 minutes. The absorbance of the
standards, blank sample, and extracted protein samples were measured at 660
nm using microtiter plate reader Tecan Infinite 200 Pro (Tecan, Männedorf,
Switzerland).
A standard curve within the working range of the assay was derived by
plotting the average blank-corrected 660nm measurement for each bovine serum
albumin (BSA) standard versus its concentration in µg/ml. The protein
concentration of the extracted drug-treated samples was then determined.
3.5.2.2Preparation of Western Blot Buffer/Reagents
Western blot buffers and reagents were prepared based on recipes
(Appendix B) before the assay.
3.5.2.3 Protein Sample Preparation and Ladder Preparation for SDS-
PAGE
Twenty ng of protein samples extracted from untreated cells at 0 hour
and extract-treated cell samples at time points of 12 hours, 24 hours, and 48
hours, were prepared in vials and made up to 10 µl with PBS. 10 µl of sample
buffer (Thermo Scientific, USA) was then added. This total of 20 µl protein
49
samples was then denatured at the 90oC for 5 minutes. 1 µl of Chemi-Lumi One
Markers Kit (Nacalai Tesque, Japan) was added with 5 µl sample buffer and 4
µl of distilled water. It was then denatured at the 90oC for 4 min. This Chemi
ladder was served as detectable protein molecular weight marker on western
blotting membrane under chemi-luminescence in gel imager.5 µl of pre-stained
standard ladder (Nacalai Tesque, Japan) was used as a detectable protein
molecular weight marker for SDS PAGE electrophoresis.
3.5.2.4 Preparation of SDS PAGE Gel
Resolving gel (7.5 %) was poured into the gap between the glass plates
in the assembled gel sandwich. Water-saturated n-butanol was immediately laid
over resolving gel. When polymerization was completed, the overlaid butanol
was completely removed. Stacking gel (4 %) was then added on top of the
polymerized resolving gel. A 10 wells comb was then inserted into the stacking
gel without trapping any bubbles.
After the polymerization of the gels was completed, the comb was
removed. The glass plate sandwich was then moved to electrophoresis tank. 1x
running buffer was added into the tank so that the wells in the glass plate
sandwich were under below buffer surface.
3.5.2.5 Gel Running
An exact 5µl of pre-stained Standards, 10 µl of denatured Chemi ladder
and 20 µl denatured protein samples, including untreated protein at 0 hours and
extract-treated proteins at time points of 12, 24 and 48hrs, were loaded into the
50
wells in a pre-determined order. The electrophoresis procedure was run at110V
for 80 minutes. After the separation of proteins, the gel was carefully removed
from the glass plate sandwich and cut into the right size before being sandwiched
by two pieces of filter paper and one piece of Poly-vinylidene-difluoride (PVDF)
transfer membrane which was wetted by 100% methanol for 10 minutes prior to
the experiment.
The transfer membrane and filter papers were equilibrated with blotting
buffer for 15 minutes before the sandwich was then run at 15V at 16 minutes.
Once separated proteins were completely transferred onto PVDF membrane, it
subsequently was blocked with blocking buffer (Nacalai Tesque, Japan) for 30
minutes and hybridized 1 hour or overnight with the appropriate amount of
primary antibody as per manufacturer’s instruction (Qiagen, USA). Normally,
primary antibody is mixed with the right ratio of washing buffer. The ratio is
ranging from 1 µl: 10 ml to 10 µl: 10ml. It was arranged based on the
concentrations of primary antibody provided by suppliers.
The blots were then washed for 10 minutes thrice with TBST. The
horseradish peroxidase (HRP) conjugated secondary antibody was mixed with
the right ratio of washing buffer. The ratio ranged from 1 µl: 10 ml to 10 µl:
10ml. It was arranged based on the concentrations of secondary antibody
provided by suppliers. Around 2 µl of HRP conjugated Streptavidin was then
added to the 10ml secondary-buffer-washing-buffer. Streptavidin interacted with
the biotin of Chemi-Lumi Marker proteins. After one hour of incubation, it was
51
then followed by the chemiluminescent detection (Nacalai Tesque, Japan) with
UVP gel imager (UVP LLC, USA).
3.5.2.6 Stripping Process
After having UVP gel imaging process, the blot membrane was
incubated in the stripping buffer for 10 minutes at room temperature for two
times before washed with PBS for twice for 10 minutes. Then, it was washed
with TBST for twice for 5 minutes before it was kept dry for future use.
3.5.2.7 Hybridization with Primary and Secondary Antibody for Dry Blot
Membranes
The dry blot membranes were subsequently blocked with blocking buffer
(Nacalai Tesque, Japan) for minimum 30 minutes and hybridized 1 hour or
overnight with the appropriate amount of primary antibody as per
manufacturer’s instruction (Qiagen, USA). Normally, primary antibody is mixed
with the right ratio of washing buffer. The ratio is ranging from 1 µl: 10 ml to
10 µl: 10ml. It was arranged based on the concentrations of primary antibody
provided by suppliers. The blots were then washed for 10 minutes thrice with
TBST. The horseradish peroxidase (HRP) conjugated secondary antibody is
mixed with the right ratio of washing buffer. The ratio ranged from 1 µl: 10 ml
to 10 µl: 10ml. It was arranged based on the concentrations of secondary
antibody provided by suppliers. 2 µl of HRP conjugated Streptavidin was then
added to the 10ml secondary-buffer-washing-buffer. Streptavidin interacted with
the biotin of Chemi-Lumi Marker proteins.
52
3.6 Metabolite Analysis
3.6.1 GC-MS Analysis
The extract was dried using vacuum concentrator and then dissolved in a
hexane before subjected to GC-MS analysis. GC-MS analysis was performed
with a Perkin Elmer Clarus 600 gas chromatography mass spectrometer (GC-
MS) equipped with an Elite 5MS fused silica capillary column (30 X 0.25 mm
ID X 0.25µm). Helium was used as a carrier gas, constantly set at a flow rate of
1.1 ml/min and the injector split ratio was set to 1:50. An injection volume of 1
μL was used and the solvent cut off time was 5 min. The temperature of the
column was programmed to rise from 50ºC, which was held for 2min, to 200ºC
at a rate of 10ºC/min and held for 2min. The temperature was then ramped to
250ºC at a rate of 5ºC/min, held for 6min and finally ramped to 280ºC at a rate
of 10ºC/min and held for 5min. The total run time was 43min.
The mass spectrometer was operated in electron impact (EI) ionization
mode at 70 eV. Elution of solvent, namely PE, was set for the first 5 min. Data
acquisition was performed in the full scan mode from mass-to-charge (m/z) of
50 to 600 with a span of scan time from 5 min to 43 min. Chromatogram
acquisition and tentative compound identification were performed with
TurboMass version 5.4.2.1617 and match against National Institute of Standards
and Technology (NIST (2008)) library with match probability cut-off of 650 and
above.
53
CHAPTER 4
RESULTS
4.1 Plant of Interest- Cratoxylum Cochinchinense Lour. (CCL)
Cratoxylum Cochinchinense Lour (CCL) was collected from Rawang
Forest Reserve, Selangor, Malaysia. Plant identification was authenticated by
Mr. Haw Ming Hock, herbalist from Forest Research Institute Malaysia (FRIM).
Voucher specimen was prepared and will be deposited at FRIM.
4.2 Extraction of Crude Extract
Serial exhaustive extraction approach was used to sequentially extract
various extracts from the barks, stems and exudates of Cratoxylum
Cochinchinense Lour (CCL). The solvents used for the extraction were
petroleum ether (PE), ethyl acetate (EA) and methanol (MeOH) sequentially.
Aqueous crude extracts through boiling were collected from the barks and stems.
About 2.2 kg of CCL barks was macerated in solvents sequentially for
five days with PE, EA and lastly MeOH. PE, EA, and MeOH extracts of the
barks were concentrated using a rotary evaporator, while aqueous extract of
barks was concentrated using freeze-dryer. The same procedure was applied to
obtain the crude extract from the 9.3 kg of the stem parts of CCL. The weight of
raw materials and the yield of extract are listed in Table 4.1.
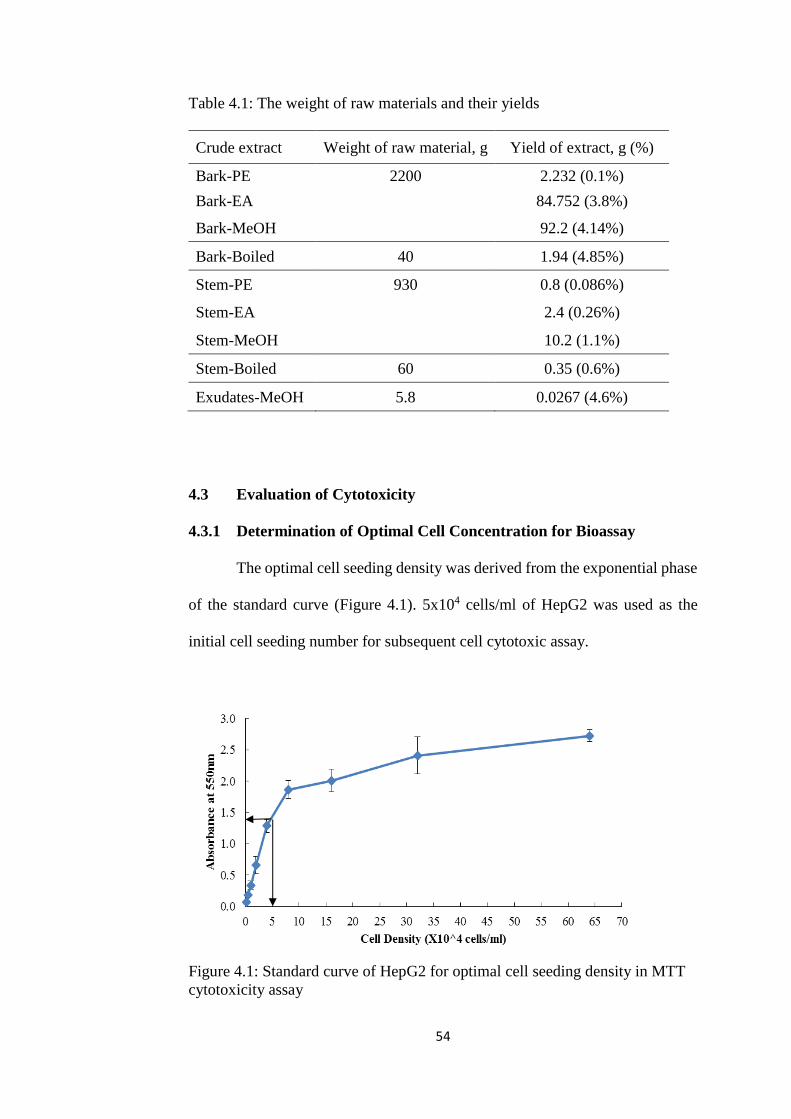
54
Table 4.1: The weight of raw materials and their yields
Crude extract Weight of raw material, g Yield of extract, g (%)
Bark-PE 2200 2.232 (0.1%)
Bark-EA 84.752 (3.8%)
Bark-MeOH 92.2 (4.14%)
Bark-Boiled 40 1.94 (4.85%)
Stem-PE 930 0.8 (0.086%)
Stem-EA 2.4 (0.26%)
Stem-MeOH 10.2 (1.1%)
Stem-Boiled 60 0.35 (0.6%)
Exudates-MeOH 5.8 0.0267 (4.6%)
4.3 Evaluation of Cytotoxicity
4.3.1 Determination of Optimal Cell Concentration for Bioassay
The optimal cell seeding density was derived from the exponential phase
of the standard curve (Figure 4.1). 5x10⁴ cells/ml of HepG2 was used as the
initial cell seeding number for subsequent cell cytotoxic assay.
Figure 4.1: Standard curve of HepG2 for optimal cell seeding density in MTT
cytotoxicity assay
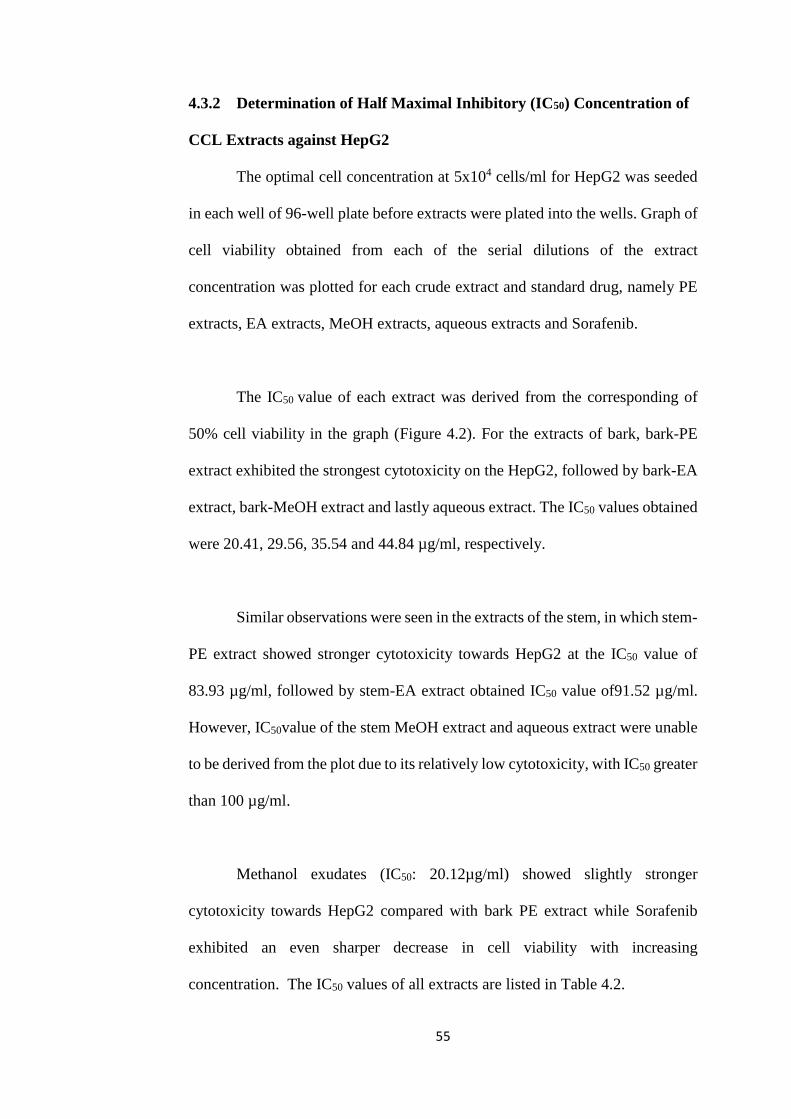
55
4.3.2 Determination of Half Maximal Inhibitory (IC50) Concentration of
CCL Extracts against HepG2
The optimal cell concentration at 5x10⁴ cells/ml for HepG2 was seeded
in each well of 96-well plate before extracts were plated into the wells. Graph of
cell viability obtained from each of the serial dilutions of the extract
concentration was plotted for each crude extract and standard drug, namely PE
extracts, EA extracts, MeOH extracts, aqueous extracts and Sorafenib.
The IC50 value of each extract was derived from the corresponding of
50% cell viability in the graph (Figure 4.2). For the extracts of bark, bark-PE
extract exhibited the strongest cytotoxicity on the HepG2, followed by bark-EA
extract, bark-MeOH extract and lastly aqueous extract. The IC50 values obtained
were 20.41, 29.56, 35.54 and 44.84 µg/ml, respectively.
Similar observations were seen in the extracts of the stem, in which stem-
PE extract showed stronger cytotoxicity towards HepG2 at the IC50 value of
83.93 µg/ml, followed by stem-EA extract obtained IC50 value of91.52 µg/ml.
However, IC50value of the stem MeOH extract and aqueous extract were unable
to be derived from the plot due to its relatively low cytotoxicity, with IC50 greater
than 100 µg/ml.
Methanol exudates (IC50: 20.12µg/ml) showed slightly stronger
cytotoxicity towards HepG2 compared with bark PE extract while Sorafenib
exhibited an even sharper decrease in cell viability with increasing
concentration. The IC50 values of all extracts are listed in Table 4.2.
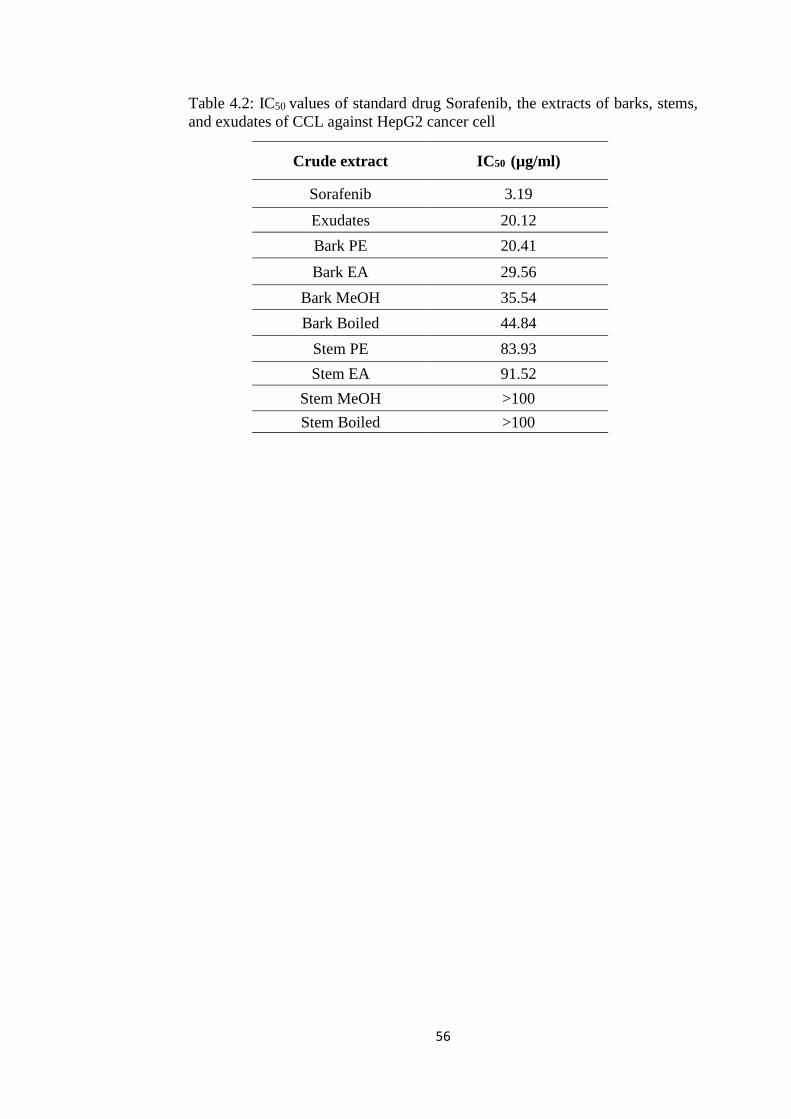
56
Table 4.2: IC50 values of standard drug Sorafenib, the extracts of barks, stems,
and exudates of CCL against HepG2 cancer cell
Crude extract IC50 (µg/ml)
Sorafenib 3.19
Exudates 20.12
Bark PE 20.41
Bark EA 29.56
Bark MeOH 35.54
Bark Boiled 44.84
Stem PE 83.93
Stem EA 91.52
Stem MeOH >100
Stem Boiled >100
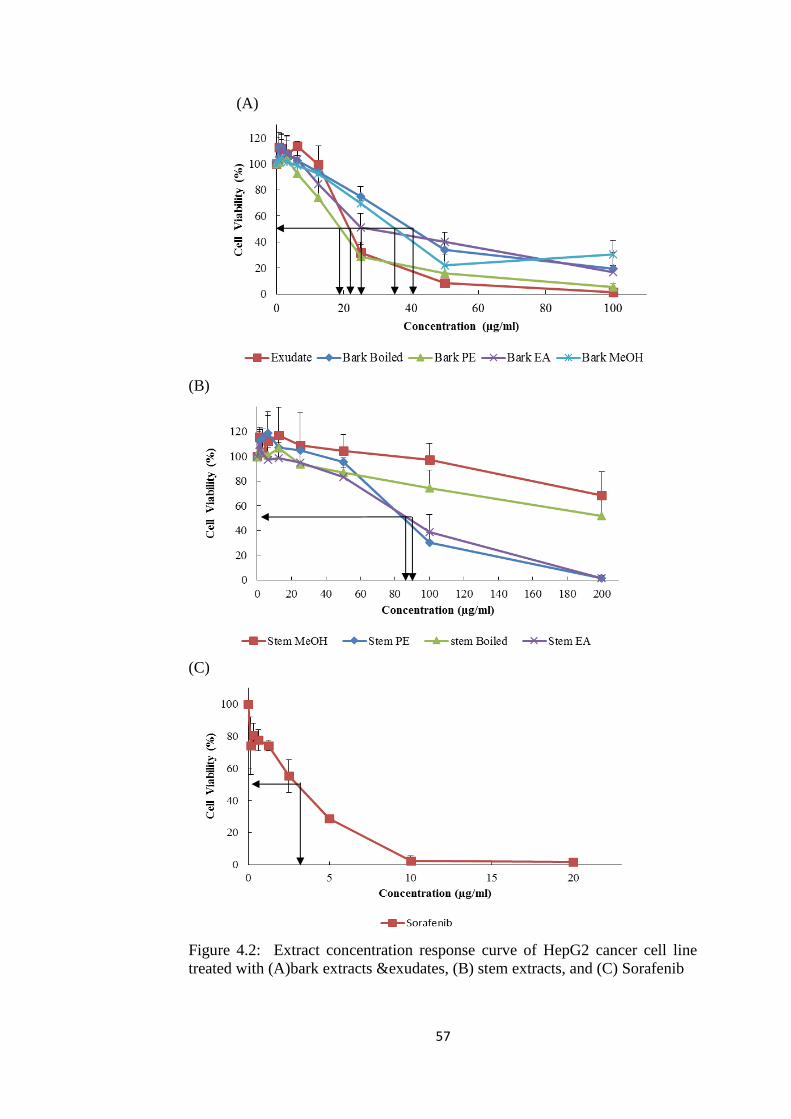
57
(A)
(B)
(C)
Figure 4.2: Extract concentration response curve of HepG2 cancer cell line
treated with (A)bark extracts &exudates, (B) stem extracts, and (C) Sorafenib
58
4.3.3 Selection of the CCL Extracts for the Microarray Gene Expression
Assay
Bark-PE extract was selected for subsequent extract-treated assay due to
its wide availability and comparatively low IC50 value compared with other
extracts.
4.4 Microarray Gene Expression Assays
4.4.1 Observations of Gene Expression among Sample Arrays
There were 1957 significantly regulated genes which are involved in
various pathways (Appendix E). The total number of upregulated genes and
downregulated genes for treated samples versus untreated samples at different
time-points are tabulated in Table 4.3. The following observations were derived:
a) The number of genes down-regulated for extract-treated samples at all the
time points was more apparent than the untreated samples.
b) The number of genes down-regulated for untreated samples was not
significant at all time-points.
c) The number of genes up-regulated for untreated samples is much lesser
than the number of treated samples, except C24.
d) The number of genes up-regulated and down-regulated for extract-treated
samples was at the peak at time points of 12 and 18 hours.
Among all the pathways, the well-studied signalling pathways for cancer
were analysed and their significant genes are tabulated at respective tables and
figures as the following:
59
a) p53 signalling pathway (Table 4.5&Figure 4.3),
b) Cell cycle (Table 4.6& Figure 4.4),
c) Hedgehog signalling pathway (Table 4.7& Figure 4.5),
d) MAPK signalling pathway (Table 4.8& Figure 4.6),
e) mTOR signalling pathway (Table 4.9& Figure 4.7),
f) TGF-β signalling pathway (Table 4.10& Figure 4.8),
g) ErbB signalling pathway (Table 4.11& Figure 4.9),
h) Notch signalling pathway (Table 4.12& Figure 4.10),
i) VEGF signalling pathway (Table 4.13& Figure 4.11),
j) JAK-STAT signalling pathway (Table 4.14& Figure 4.12),
k) WNT signalling pathway (Table 4.15& Figure 4.13),
l) Toll-like receptor signalling pathway (Table 4.16& Figure 4.14),
m) Nod-like receptor signalling pathway (Table 4.17& Figure 4.15),
n) RIG-like receptor signalling pathway (Table 4.18& Figure 4.16),
o) Chemokine signalling pathway (Table 4.19& Figure 4.17),
p) Cytokine-cytokine receptor interaction (Table 4.20& Figure 4.18),
q) T cell receptor signalling pathway (Table 4.21& Figure 4.19),
r) B cell receptor signalling pathway (Table 4.22& Figure 4.20),
s) Apoptosis (Table 4.23& Figure 4.21),
t) Adherens junction signalling pathway (Table 4.24& Figure 4.22),
u) Focal adhesion (Table 4.25& Figure 4.23) and
v) Natural killer cell cytotoxicity (Table 4.26& Figure 4.24).
The significant differentially expressed genes, including genes showing
expression with more than two-fold-changes or showing relatively significant
60
expressions in treated sample versus untreated samples, among these pathways
were selected and tabulated in Table 4.4. Some genes were noted in various
pathways due to the crosstalk of these genes among the pathways.
4.4.2 Pathway Analysis from Statistics among Sample Arrays
The tables (Table 4.5 - 4.26) and graphs (Figure 4.3-4.24) revealed that
there were genes regulated by extracts to different extents in various pathways.
As summarized in Table 4.4, more regulated genes were observed in cytokine-
cytokine receptor interaction, focal adhesion, chemokine signalling, JAK-STAT,
MAPK, cell cycle and P53 signalling pathways. The least number of regulated
genes were observed in Hedgehog, mTOR, B cell, apoptosis, Notch, WNT,
VEGF, Toll-like, Nod-like, RIG-like signalling pathway. Genes in T-cell
pathway was not significantly regulated. However, some genes were manually
selected for this pathway for discussion due to the stark contrast of expression
between treated samples and untreated samples. While a moderate number of
genes were observed in other pathways, including TGF-rbB, adherens
junction, natural killer cell cytotoxicity.
From these tabulated tables and figures, significant downregulated or
upregulated genes in various pathways were noted as follows (more details
would be elaborated in the discussion section):
a) p53 signalling pathway (Table 4.5 & Figure 4.3)
Among the downregulated and upregulated genes, SFN and Serpine1 were
More significantly downregulated, especially at the early timepoints.
b) Cell cycle (Table 4.6 & Figure 4.4)
61
RBL1 and SKP2 were significantly upregulated towards the late
timepoints while WEE1 was significantly downregulated, especially at the early
timepoints.
c) Hedgehog signalling pathway (Table 4.7 & Figure 4.5)
WNT11 was significantly downregulated from timepoint of 12 hours to 24
hours.
d) MAPK signalling pathway (Table 4.8 & Figure 4.6)
MAP2K6 was more significantly upregulated while DUSP5 was more
downregulated significantly across all timepoints among all.
e) mTOR signalling pathway (Table 4.9 & Figure 4.7)
DDIT4 was more significantly downregulated across all the timepoints.
f) TGF-β signalling pathway (Table 4.10 & Figure 4.8)
ID1 and ACVR1 were more significantly downregulated among all the
samples.
g) ErbB signalling pathway (Table 4.11 & Figure 4.9)
AREG, EREG and SOS1 were significantly downregulated across the
timepoints, compared with timepoints of untreated samples.
h) Notch signalling pathway (Table 4.12 & Figure 4.10)
JAG1 was significantly downregulated across all the timepoints, compared
with timepoints of untreated samples.
i) VEGF signalling pathway (Table 4.13 & Figure 4.11)
Cross-talk effect of MAPK13 was seen in this pathway. It was significantly
downregulated across all the timepoints.
j) JAK-STAT signalling pathway (Table 4.14 & Figure 4.12)
62
IL11, LIF, PIM1, SPRY4 were seen downregulated significantly,
especially IL11, which was downregulated in a much larger scale.
k) WNT signalling pathway (Table 4.15 & Figure 4.13)
WNT11 and FOSL1 were significantly downregulated.
l) Toll-like receptor signalling pathway (Table 4.16 & Figure 4.14)
MAP2K6 was significantly upregulated while MAPK13 was significantly
downregulated. Downregulation of IL8 was also seen at all timepoints.
m) Nod-like receptor signalling pathway (Table 4.17 & Figure 4.15) &RIG-
like receptor signalling pathway (Table 4.18 & Figure 4.16)
Cross-talk effect of MAPK13 was also seen in these pathways. It was
significantly downregulated across all the timepoints, along with the significant
downregulation of IL8.
n) Chemokine signalling pathway (Table 4.19 & Figure 4.17)
CCL20 and BCAR1 were significantly downregulated across all
timepoints.
o) Cytokine-cytokine receptor interaction (Table 4.20 & Figure 4.18)
Along with the downregulation of LIF and CCL20, the downregulation of
IL8, IL11, and IL6R were significantly observed while TNFSF10 and
TNFRSF19 were seen upregulated significantly.
p) T cell receptor signalling pathway (Table 4.21 & Figure 4.19)
Cross-talk effect of MAPK13 was seen in this pathway. It was significantly
downregulated across all the timepoints. Downregulation of SOS1 was observed
across all the timepoints.
q) B cell receptor signalling pathway (Table 4.22 & Figure 4.20)
63
Cross-talk effect of MAPK13 was seen in this pathway. Apart from the
downregulation of SOS1, CD22 was seen downregulated significantly across all
the timepoints.
r) Apoptosis (Table 4.23 & Figure 4.21)
Besides the upregulation of TNFSF10, IRAK2 was seen significantly
downregulated across the timepoints.
s) Adherens junction signalling pathway (Table 4.24 & Figure 4.22)
The upregulation of CDH1 and significant downregulation of
SNAI2across timepoints were observed.
t) Focal adhesion (Table 4.25 & Figure 4.23)
Along with the downregulation of SOS1, the significant
downregulationsof ZYX, VASP and BCAR1 were observed across the
timepoints.
u) Natural killer cell cytotoxicity (Table 4.26 & Figure 4.24)
Significant downregulation of SOS1 and upregulation of TNFSF10 were
observed across the timepoints.
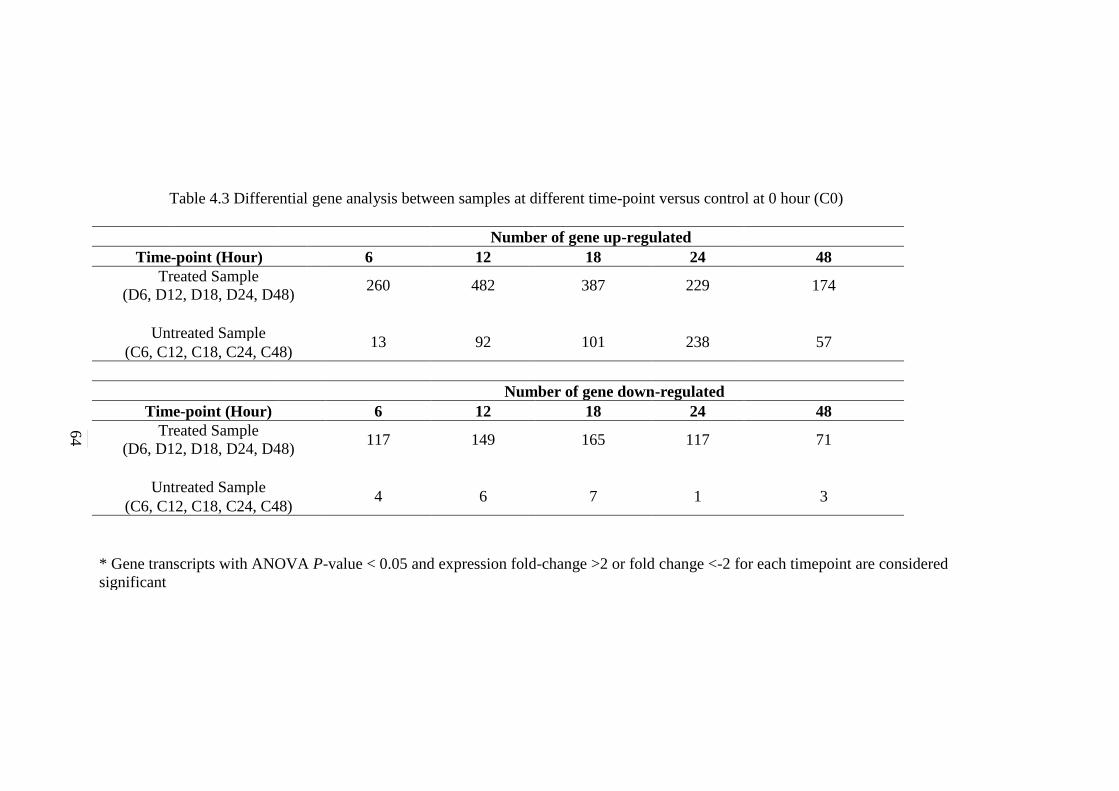
64
Table 4.3 Differential gene analysis between samples at different time-point versus control at 0 hour (C0)
Number of gene up-regulated Time-point (Hour) 6 12 18 24 48
Treated Sample
(D6, D12, D18, D24, D48) 260 482 387 229 174
Untreated Sample 13 92 101 238 57
(C6, C12, C18, C24, C48)
Number of gene down-regulated Time-point (Hour) 6 12 18 24 48
Treated Sample
(D6, D12, D18, D24, D48) 117 149 165 117 71
Untreated Sample 4 6 7 1 3
(C6, C12, C18, C24, C48)
* Gene transcripts with ANOVA P-value < 0.05 and expression fold-change >2 or fold change <-2 for each timepoint are considered
significant
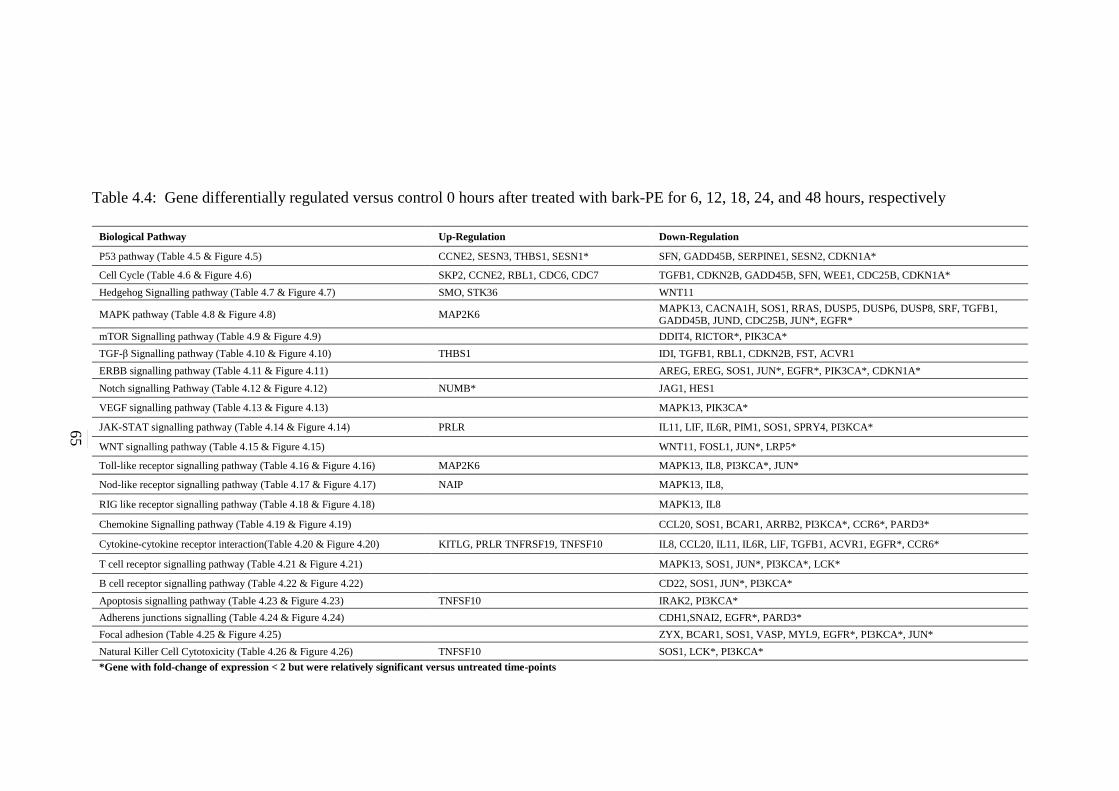
65
Table 4.4: Gene differentially regulated versus control 0 hours after treated with bark-PE for 6, 12, 18, 24, and 48 hours, respectively
Biological Pathway Up-Regulation Down-Regulation
P53 pathway (Table 4.5 & Figure 4.5) CCNE2, SESN3, THBS1, SESN1* SFN, GADD45B, SERPINE1, SESN2, CDKN1A*
Cell Cycle (Table 4.6 & Figure 4.6) SKP2, CCNE2, RBL1, CDC6, CDC7 TGFB1, CDKN2B, GADD45B, SFN, WEE1, CDC25B, CDKN1A*
Hedgehog Signalling pathway (Table 4.7 & Figure 4.7) SMO, STK36 WNT11
MAPK pathway (Table 4.8 & Figure 4.8) MAP2K6 MAPK13, CACNA1H, SOS1, RRAS, DUSP5, DUSP6, DUSP8, SRF, TGFB1, GADD45B, JUND, CDC25B, JUN*, EGFR*
mTOR Signalling pathway (Table 4.9 & Figure 4.9) DDIT4, RICTOR*, PIK3CA*
TGF-β Signalling pathway (Table 4.10 & Figure 4.10) THBS1 IDI, TGFB1, RBL1, CDKN2B, FST, ACVR1
ERBB signalling pathway (Table 4.11 & Figure 4.11) AREG, EREG, SOS1, JUN*, EGFR*, PIK3CA*, CDKN1A*
Notch signalling Pathway (Table 4.12 & Figure 4.12) NUMB* JAG1, HES1
VEGF signalling pathway (Table 4.13 & Figure 4.13) MAPK13, PIK3CA*
JAK-STAT signalling pathway (Table 4.14 & Figure 4.14) PRLR IL11, LIF, IL6R, PIM1, SOS1, SPRY4, PI3KCA*
WNT signalling pathway (Table 4.15 & Figure 4.15) WNT11, FOSL1, JUN*, LRP5*
Toll-like receptor signalling pathway (Table 4.16 & Figure 4.16) MAP2K6 MAPK13, IL8, PI3KCA*, JUN*
Nod-like receptor signalling pathway (Table 4.17 & Figure 4.17) NAIP MAPK13, IL8,
RIG like receptor signalling pathway (Table 4.18 & Figure 4.18) MAPK13, IL8
Chemokine Signalling pathway (Table 4.19 & Figure 4.19) CCL20, SOS1, BCAR1, ARRB2, PI3KCA*, CCR6*, PARD3*
Cytokine-cytokine receptor interaction(Table 4.20 & Figure 4.20) KITLG, PRLR TNFRSF19, TNFSF10 IL8, CCL20, IL11, IL6R, LIF, TGFB1, ACVR1, EGFR*, CCR6*
T cell receptor signalling pathway (Table 4.21 & Figure 4.21) MAPK13, SOS1, JUN*, PI3KCA*, LCK*
B cell receptor signalling pathway (Table 4.22 & Figure 4.22) CD22, SOS1, JUN*, PI3KCA*
Apoptosis signalling pathway (Table 4.23 & Figure 4.23) TNFSF10 IRAK2, PI3KCA*
Adherens junctions signalling (Table 4.24 & Figure 4.24) CDH1,SNAI2, EGFR*, PARD3*
Focal adhesion (Table 4.25 & Figure 4.25) ZYX, BCAR1, SOS1, VASP, MYL9, EGFR*, PI3KCA*, JUN*
Natural Killer Cell Cytotoxicity (Table 4.26 & Figure 4.26) TNFSF10 SOS1, LCK*, PI3KCA*
*Gene with fold-change of expression < 2 but were relatively significant versus untreated time-points
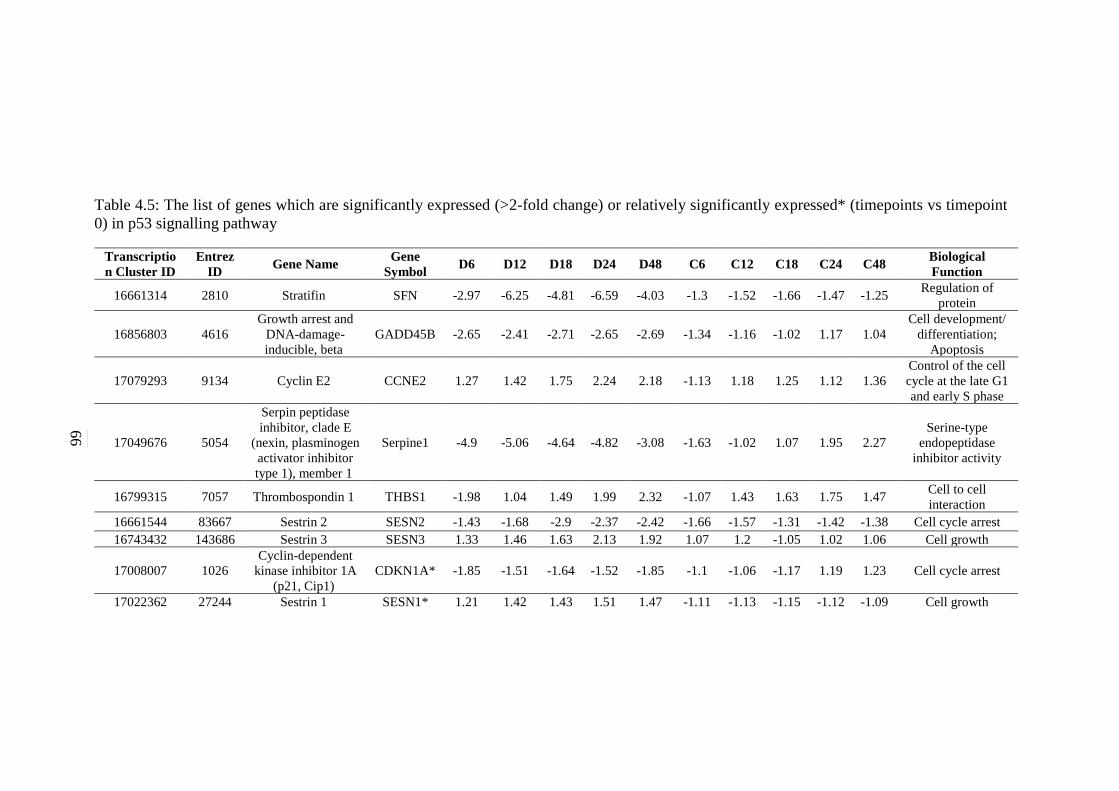
66
Table 4.5: The list of genes which are significantly expressed (>2-fold change) or relatively significantly expressed* (timepoints vs timepoint
0) in p53 signalling pathway
Transcriptio
n Cluster ID
Entrez
ID Gene Name
Gene
Symbol D6 D12 D18 D24 D48 C6 C12 C18 C24 C48
Biological
Function
16661314 2810 Stratifin SFN -2.97 -6.25 -4.81 -6.59 -4.03 -1.3 -1.52 -1.66 -1.47 -1.25 Regulation of
protein
16856803 4616
Growth arrest and
DNA-damage-
inducible, beta
GADD45B -2.65 -2.41 -2.71 -2.65 -2.69 -1.34 -1.16 -1.02 1.17 1.04
Cell development/
differentiation;
Apoptosis
17079293 9134 Cyclin E2 CCNE2 1.27 1.42 1.75 2.24 2.18 -1.13 1.18 1.25 1.12 1.36
Control of the cell
cycle at the late G1
and early S phase
17049676 5054
Serpin peptidase
inhibitor, clade E
(nexin, plasminogen
activator inhibitor
type 1), member 1
Serpine1 -4.9 -5.06 -4.64 -4.82 -3.08 -1.63 -1.02 1.07 1.95 2.27
Serine-type
endopeptidase
inhibitor activity
16799315 7057 Thrombospondin 1 THBS1 -1.98 1.04 1.49 1.99 2.32 -1.07 1.43 1.63 1.75 1.47 Cell to cell
interaction
16661544 83667 Sestrin 2 SESN2 -1.43 -1.68 -2.9 -2.37 -2.42 -1.66 -1.57 -1.31 -1.42 -1.38 Cell cycle arrest
16743432 143686 Sestrin 3 SESN3 1.33 1.46 1.63 2.13 1.92 1.07 1.2 -1.05 1.02 1.06 Cell growth
17008007 1026
Cyclin-dependent
kinase inhibitor 1A
(p21, Cip1)
CDKN1A* -1.85 -1.51 -1.64 -1.52 -1.85 -1.1 -1.06 -1.17 1.19 1.23 Cell cycle arrest
17022362 27244 Sestrin 1 SESN1* 1.21 1.42 1.43 1.51 1.47 -1.11 -1.13 -1.15 -1.12 -1.09 Cell growth
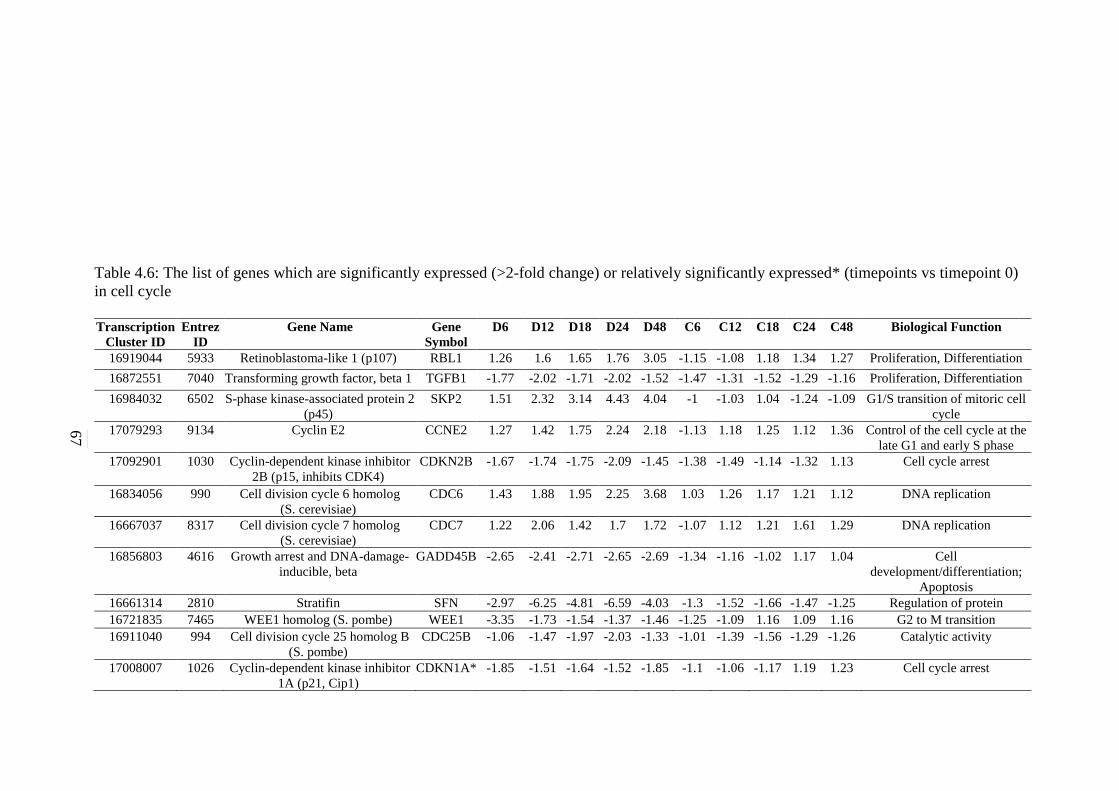
67
Table 4.6: The list of genes which are significantly expressed (>2-fold change) or relatively significantly expressed* (timepoints vs timepoint 0)
in cell cycle
Transcription
Cluster ID
Entrez
ID
Gene Name Gene
Symbol
D6 D12 D18 D24 D48 C6 C12 C18 C24 C48 Biological Function
16919044 5933 Retinoblastoma-like 1 (p107) RBL1 1.26 1.6 1.65 1.76 3.05 -1.15 -1.08 1.18 1.34 1.27 Proliferation, Differentiation
16872551 7040 Transforming growth factor, beta 1 TGFB1 -1.77 -2.02 -1.71 -2.02 -1.52 -1.47 -1.31 -1.52 -1.29 -1.16 Proliferation, Differentiation
16984032 6502 S-phase kinase-associated protein 2
(p45)
SKP2 1.51 2.32 3.14 4.43 4.04 -1 -1.03 1.04 -1.24 -1.09 G1/S transition of mitoric cell
cycle
17079293 9134 Cyclin E2 CCNE2 1.27 1.42 1.75 2.24 2.18 -1.13 1.18 1.25 1.12 1.36 Control of the cell cycle at the
late G1 and early S phase
17092901 1030 Cyclin-dependent kinase inhibitor
2B (p15, inhibits CDK4)
CDKN2B -1.67 -1.74 -1.75 -2.09 -1.45 -1.38 -1.49 -1.14 -1.32 1.13 Cell cycle arrest
16834056 990 Cell division cycle 6 homolog
(S. cerevisiae)
CDC6 1.43 1.88 1.95 2.25 3.68 1.03 1.26 1.17 1.21 1.12 DNA replication
16667037 8317 Cell division cycle 7 homolog
(S. cerevisiae)
CDC7 1.22 2.06 1.42 1.7 1.72 -1.07 1.12 1.21 1.61 1.29 DNA replication
16856803 4616 Growth arrest and DNA-damage-
inducible, beta
GADD45B -2.65 -2.41 -2.71 -2.65 -2.69 -1.34 -1.16 -1.02 1.17 1.04 Cell
development/differentiation;
Apoptosis
16661314 2810 Stratifin SFN -2.97 -6.25 -4.81 -6.59 -4.03 -1.3 -1.52 -1.66 -1.47 -1.25 Regulation of protein
16721835 7465 WEE1 homolog (S. pombe) WEE1 -3.35 -1.73 -1.54 -1.37 -1.46 -1.25 -1.09 1.16 1.09 1.16 G2 to M transition
16911040 994 Cell division cycle 25 homolog B
(S. pombe)
CDC25B -1.06 -1.47 -1.97 -2.03 -1.33 -1.01 -1.39 -1.56 -1.29 -1.26 Catalytic activity
17008007 1026 Cyclin-dependent kinase inhibitor
1A (p21, Cip1)
CDKN1A* -1.85 -1.51 -1.64 -1.52 -1.85 -1.1 -1.06 -1.17 1.19 1.23 Cell cycle arrest
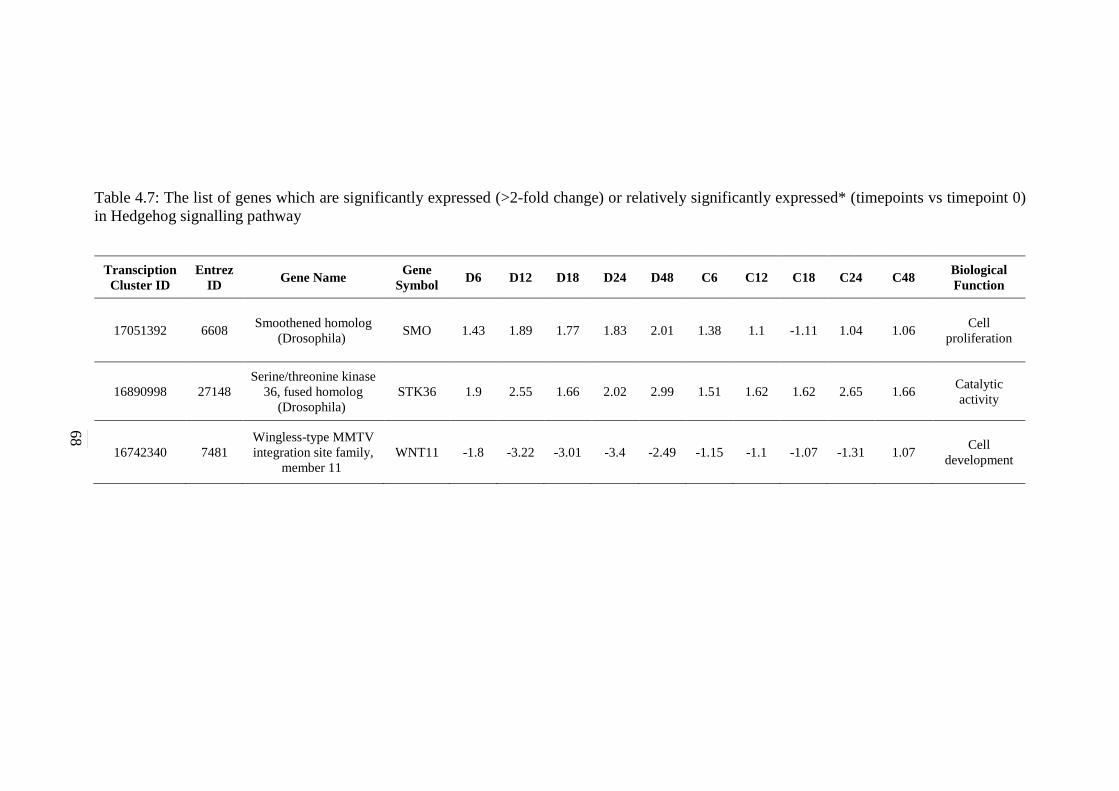
68
Table 4.7: The list of genes which are significantly expressed (>2-fold change) or relatively significantly expressed* (timepoints vs timepoint 0)
in Hedgehog signalling pathway
Transciption
Cluster ID
Entrez
ID Gene Name
Gene
Symbol D6 D12 D18 D24 D48 C6 C12 C18 C24 C48
Biological
Function
17051392 6608 Smoothened homolog
(Drosophila)
SMO 1.43 1.89 1.77 1.83 2.01 1.38 1.1 -1.11 1.04 1.06 Cell
proliferation
16890998 27148
Serine/threonine kinase
36, fused homolog
(Drosophila)
STK36 1.9 2.55 1.66 2.02 2.99 1.51 1.62 1.62 2.65 1.66 Catalytic
activity
16742340 7481
Wingless-type MMTV
integration site family,
member 11
WNT11 -1.8 -3.22 -3.01 -3.4 -2.49 -1.15 -1.1 -1.07 -1.31 1.07 Cell
development
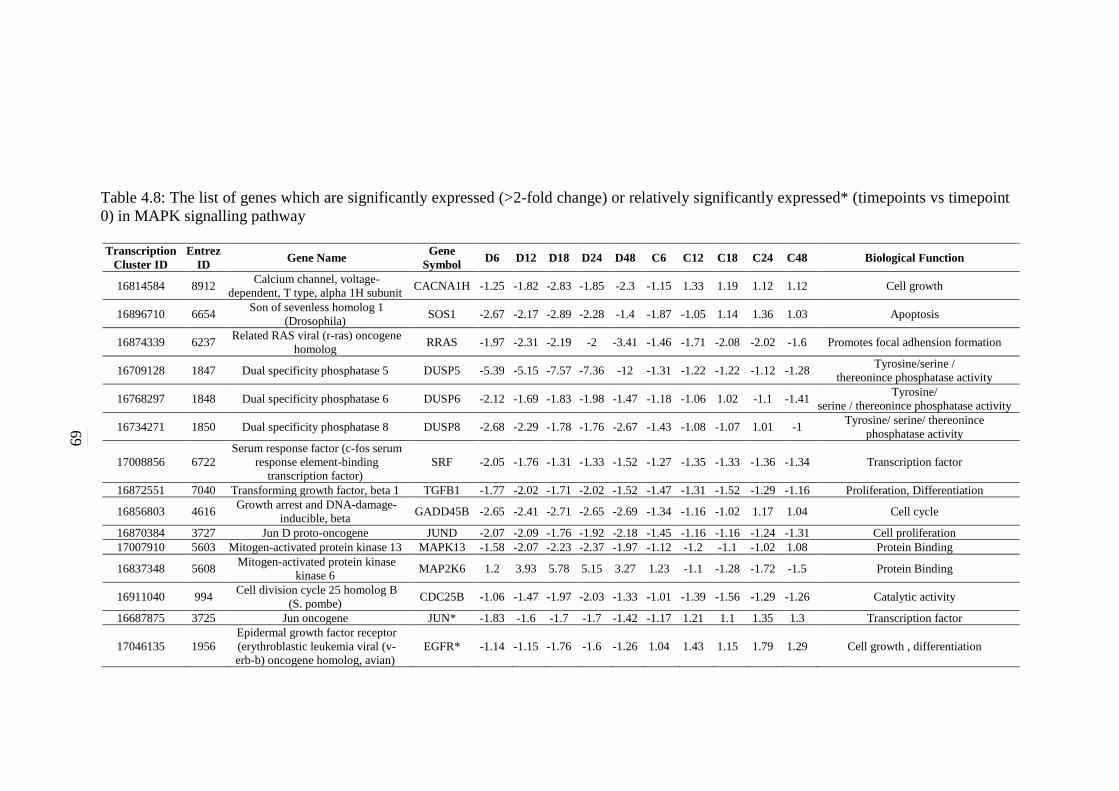
69
Table 4.8: The list of genes which are significantly expressed (>2-fold change) or relatively significantly expressed* (timepoints vs timepoint
0) in MAPK signalling pathway
Transcription
Cluster ID
Entrez
ID Gene Name
Gene
Symbol D6 D12 D18 D24 D48 C6 C12 C18 C24 C48 Biological Function
16814584 8912 Calcium channel, voltage-
dependent, T type, alpha 1H subunit
CACNA1H -1.25 -1.82 -2.83 -1.85 -2.3 -1.15 1.33 1.19 1.12 1.12 Cell growth
16896710 6654 Son of sevenless homolog 1
(Drosophila)
SOS1 -2.67 -2.17 -2.89 -2.28 -1.4 -1.87 -1.05 1.14 1.36 1.03 Apoptosis
16874339 6237 Related RAS viral (r-ras) oncogene
homolog
RRAS -1.97 -2.31 -2.19 -2 -3.41 -1.46 -1.71 -2.08 -2.02 -1.6 Promotes focal adhension formation
16709128 1847 Dual specificity phosphatase 5 DUSP5 -5.39 -5.15 -7.57 -7.36 -12 -1.31 -1.22 -1.22 -1.12 -1.28 Tyrosine/serine /
thereonince phosphatase activity
16768297 1848 Dual specificity phosphatase 6 DUSP6 -2.12 -1.69 -1.83 -1.98 -1.47 -1.18 -1.06 1.02 -1.1 -1.41 Tyrosine/
serine / thereonince phosphatase activity
16734271 1850 Dual specificity phosphatase 8 DUSP8 -2.68 -2.29 -1.78 -1.76 -2.67 -1.43 -1.08 -1.07 1.01 -1 Tyrosine/ serine/ thereonince
phosphatase activity
17008856 6722
Serum response factor (c-fos serum
response element-binding
transcription factor)
SRF -2.05 -1.76 -1.31 -1.33 -1.52 -1.27 -1.35 -1.33 -1.36 -1.34 Transcription factor
16872551 7040 Transforming growth factor, beta 1 TGFB1 -1.77 -2.02 -1.71 -2.02 -1.52 -1.47 -1.31 -1.52 -1.29 -1.16 Proliferation, Differentiation
16856803 4616 Growth arrest and DNA-damage-
inducible, beta
GADD45B -2.65 -2.41 -2.71 -2.65 -2.69 -1.34 -1.16 -1.02 1.17 1.04 Cell cycle
16870384 3727 Jun D proto-oncogene JUND -2.07 -2.09 -1.76 -1.92 -2.18 -1.45 -1.16 -1.16 -1.24 -1.31 Cell proliferation 17007910 5603 Mitogen-activated protein kinase 13 MAPK13 -1.58 -2.07 -2.23 -2.37 -1.97 -1.12 -1.2 -1.1 -1.02 1.08 Protein Binding
16837348 5608 Mitogen-activated protein kinase
kinase 6
MAP2K6 1.2 3.93 5.78 5.15 3.27 1.23 -1.1 -1.28 -1.72 -1.5 Protein Binding
16911040 994 Cell division cycle 25 homolog B
(S. pombe)
CDC25B -1.06 -1.47 -1.97 -2.03 -1.33 -1.01 -1.39 -1.56 -1.29 -1.26 Catalytic activity
16687875 3725 Jun oncogene JUN* -1.83 -1.6 -1.7 -1.7 -1.42 -1.17 1.21 1.1 1.35 1.3 Transcription factor
17046135 1956
Epidermal growth factor receptor
(erythroblastic leukemia viral (v-
erb-b) oncogene homolog, avian)
EGFR* -1.14 -1.15 -1.76 -1.6 -1.26 1.04 1.43 1.15 1.79 1.29 Cell growth , differentiation
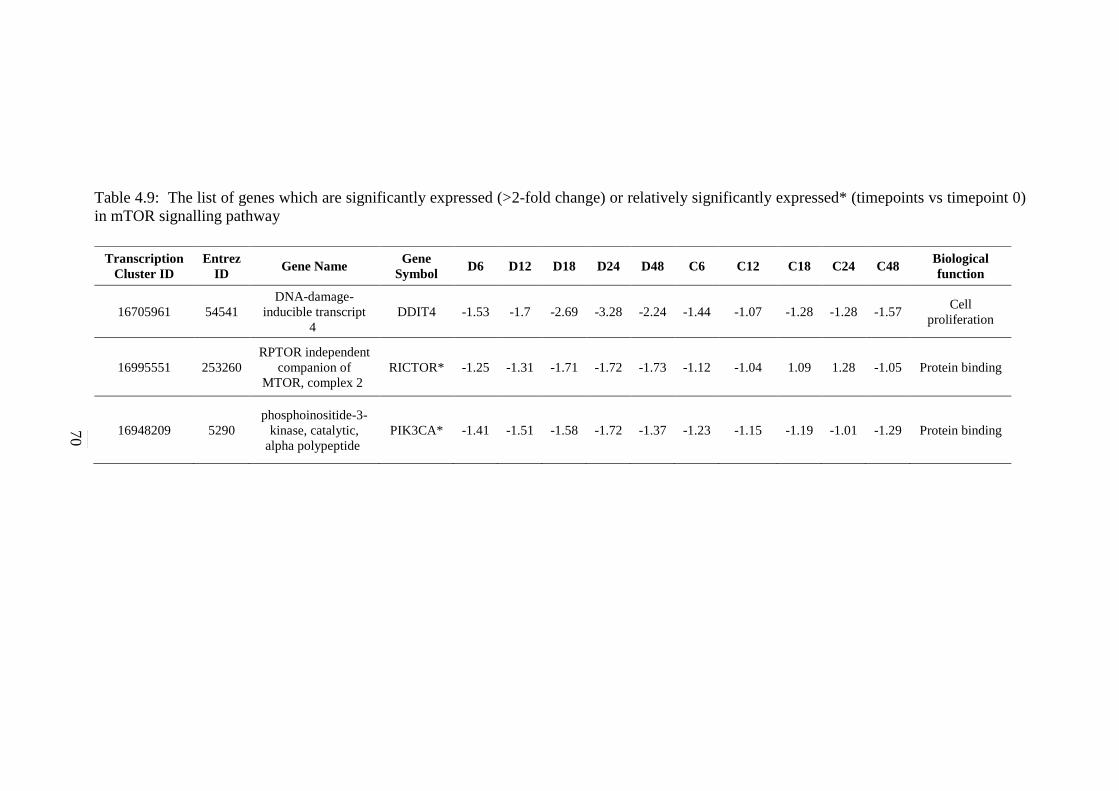
70
Table 4.9: The list of genes which are significantly expressed (>2-fold change) or relatively significantly expressed* (timepoints vs timepoint 0)
in mTOR signalling pathway
Transcription
Cluster ID
Entrez
ID Gene Name
Gene
Symbol D6 D12 D18 D24 D48 C6 C12 C18 C24 C48
Biological
function
16705961 54541
DNA-damage-
inducible transcript
4
DDIT4 -1.53 -1.7 -2.69 -3.28 -2.24 -1.44 -1.07 -1.28 -1.28 -1.57 Cell
proliferation
16995551 253260
RPTOR independent
companion of
MTOR, complex 2
RICTOR* -1.25 -1.31 -1.71 -1.72 -1.73 -1.12 -1.04 1.09 1.28 -1.05 Protein binding
16948209 5290
phosphoinositide-3-
kinase, catalytic,
alpha polypeptide
PIK3CA* -1.41 -1.51 -1.58 -1.72 -1.37 -1.23 -1.15 -1.19 -1.01 -1.29 Protein binding
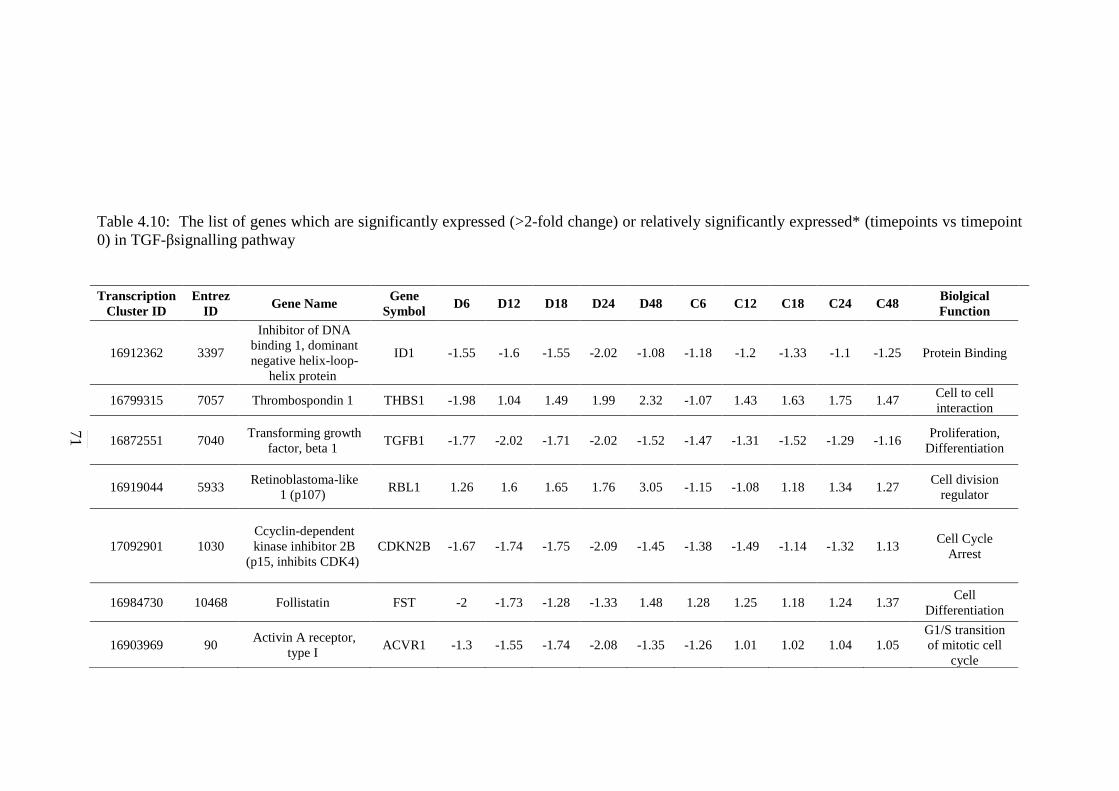
71
Table 4.10: The list of genes which are significantly expressed (>2-fold change) or relatively significantly expressed* (timepoints vs timepoint
0) in TGF-βsignalling pathway
Transcription
Cluster ID
Entrez
ID Gene Name
Gene
Symbol D6 D12 D18 D24 D48 C6 C12 C18 C24 C48
Biolgical
Function
16912362 3397
Inhibitor of DNA
binding 1, dominant
negative helix-loop-
helix protein
ID1 -1.55 -1.6 -1.55 -2.02 -1.08 -1.18 -1.2 -1.33 -1.1 -1.25 Protein Binding
16799315 7057 Thrombospondin 1 THBS1 -1.98 1.04 1.49 1.99 2.32 -1.07 1.43 1.63 1.75 1.47 Cell to cell
interaction
16872551 7040 Transforming growth
factor, beta 1
TGFB1 -1.77 -2.02 -1.71 -2.02 -1.52 -1.47 -1.31 -1.52 -1.29 -1.16 Proliferation,
Differentiation
16919044 5933 Retinoblastoma-like
1 (p107)
RBL1 1.26 1.6 1.65 1.76 3.05 -1.15 -1.08 1.18 1.34 1.27 Cell division
regulator
17092901 1030
Ccyclin-dependent
kinase inhibitor 2B
(p15, inhibits CDK4)
CDKN2B -1.67 -1.74 -1.75 -2.09 -1.45 -1.38 -1.49 -1.14 -1.32 1.13 Cell Cycle
Arrest
16984730 10468 Follistatin FST -2 -1.73 -1.28 -1.33 1.48 1.28 1.25 1.18 1.24 1.37 Cell
Differentiation
16903969 90 Activin A receptor,
type I
ACVR1 -1.3 -1.55 -1.74 -2.08 -1.35 -1.26 1.01 1.02 1.04 1.05
G1/S transition
of mitotic cell
cycle
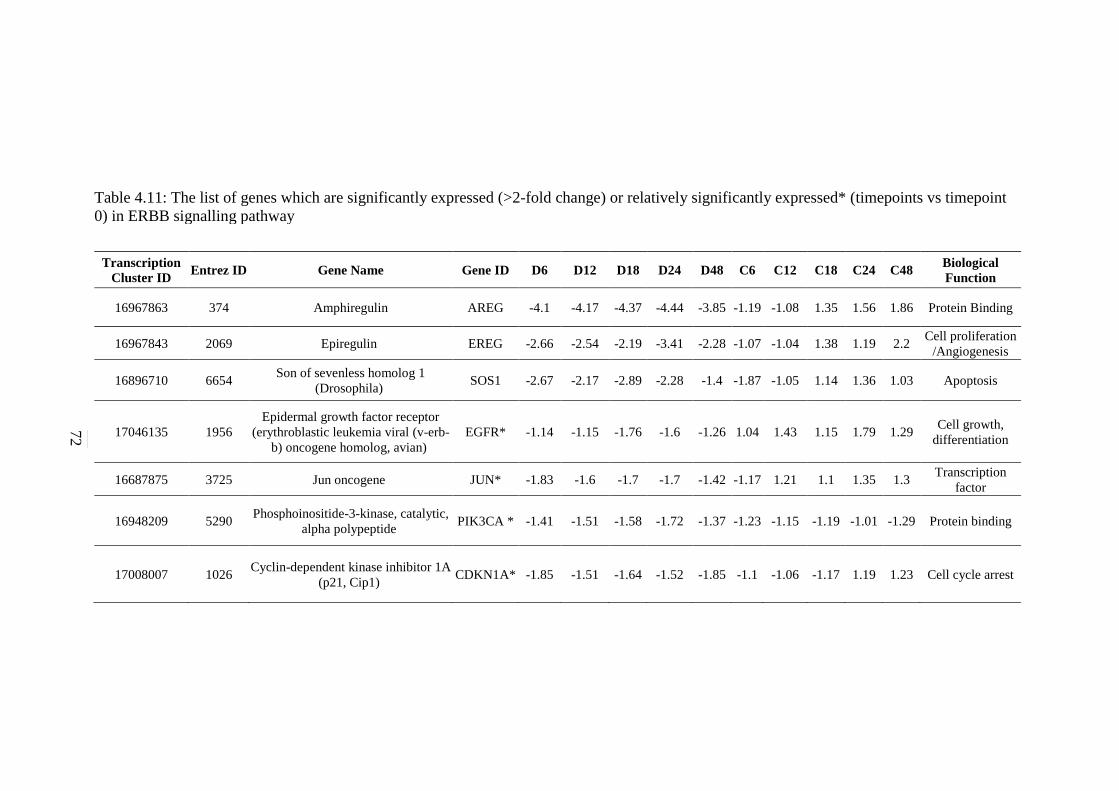
72
Table 4.11: The list of genes which are significantly expressed (>2-fold change) or relatively significantly expressed* (timepoints vs timepoint
0) in ERBB signalling pathway
Transcription
Cluster ID Entrez ID Gene Name Gene ID D6 D12 D18 D24 D48 C6 C12 C18 C24 C48
Biological
Function
16967863 374 Amphiregulin AREG -4.1 -4.17 -4.37 -4.44 -3.85 -1.19 -1.08 1.35 1.56 1.86 Protein Binding
16967843 2069 Epiregulin EREG -2.66 -2.54 -2.19 -3.41 -2.28 -1.07 -1.04 1.38 1.19 2.2 Cell proliferation
/Angiogenesis
16896710 6654 Son of sevenless homolog 1
(Drosophila)
SOS1 -2.67 -2.17 -2.89 -2.28 -1.4 -1.87 -1.05 1.14 1.36 1.03 Apoptosis
17046135 1956
Epidermal growth factor receptor
(erythroblastic leukemia viral (v-erb-
b) oncogene homolog, avian)
EGFR* -1.14 -1.15 -1.76 -1.6 -1.26 1.04 1.43 1.15 1.79 1.29 Cell growth,
differentiation
16687875 3725 Jun oncogene JUN* -1.83 -1.6 -1.7 -1.7 -1.42 -1.17 1.21 1.1 1.35 1.3 Transcription
factor
16948209 5290 Phosphoinositide-3-kinase, catalytic,
alpha polypeptide
PIK3CA * -1.41 -1.51 -1.58 -1.72 -1.37 -1.23 -1.15 -1.19 -1.01 -1.29 Protein binding
17008007 1026 Cyclin-dependent kinase inhibitor 1A
(p21, Cip1)
CDKN1A* -1.85 -1.51 -1.64 -1.52 -1.85 -1.1 -1.06 -1.17 1.19 1.23 Cell cycle arrest
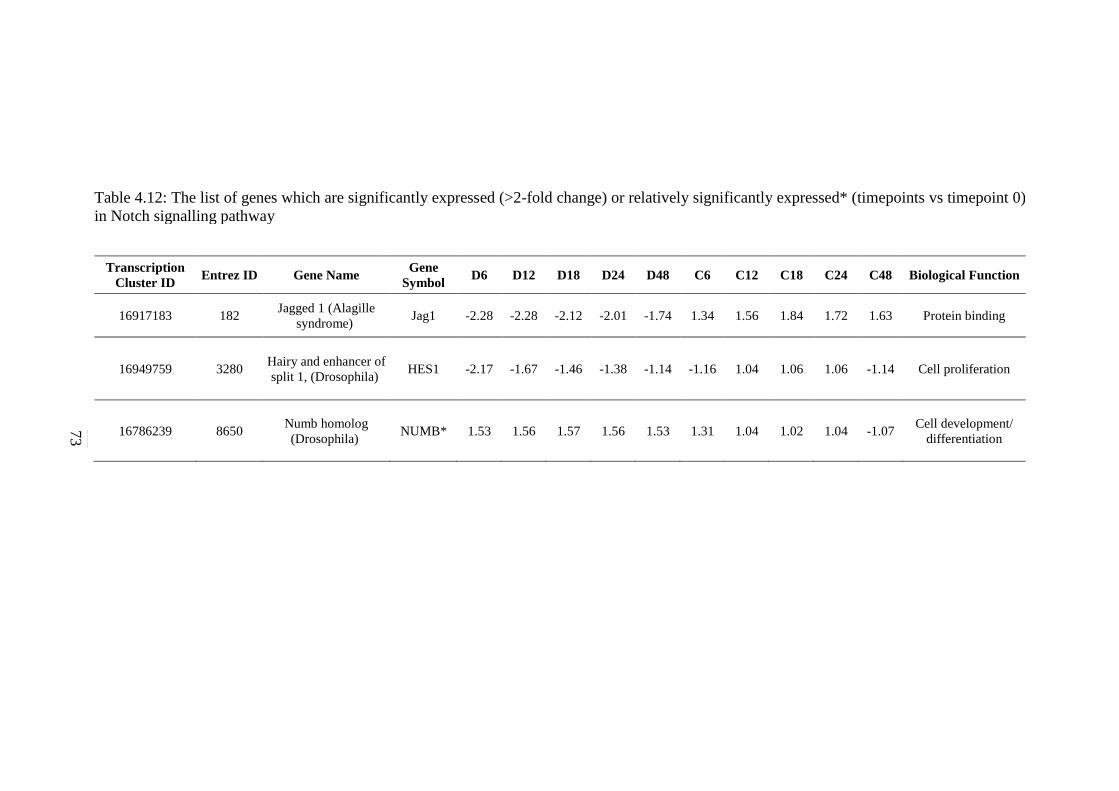
73
Table 4.12: The list of genes which are significantly expressed (>2-fold change) or relatively significantly expressed* (timepoints vs timepoint 0)
in Notch signalling pathway
Transcription
Cluster ID Entrez ID Gene Name
Gene
Symbol D6 D12 D18 D24 D48 C6 C12 C18 C24 C48 Biological Function
16917183 182 Jagged 1 (Alagille
syndrome)
Jag1 -2.28 -2.28 -2.12 -2.01 -1.74 1.34 1.56 1.84 1.72 1.63 Protein binding
16949759 3280 Hairy and enhancer of
split 1, (Drosophila)
HES1 -2.17 -1.67 -1.46 -1.38 -1.14 -1.16 1.04 1.06 1.06 -1.14 Cell proliferation
16786239 8650 Numb homolog
(Drosophila)
NUMB* 1.53 1.56 1.57 1.56 1.53 1.31 1.04 1.02 1.04 -1.07 Cell development/
differentiation
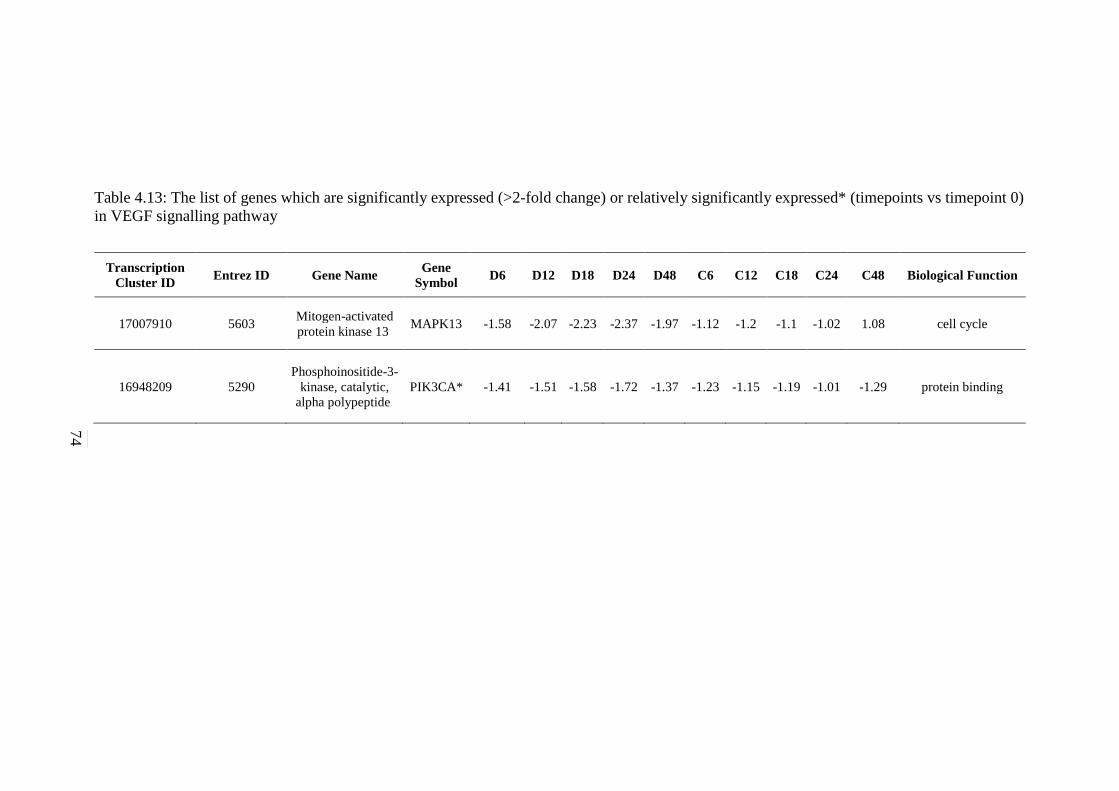
74
Table 4.13: The list of genes which are significantly expressed (>2-fold change) or relatively significantly expressed* (timepoints vs timepoint 0)
in VEGF signalling pathway
Transcription
Cluster ID Entrez ID Gene Name
Gene
Symbol D6 D12 D18 D24 D48 C6 C12 C18 C24 C48 Biological Function
17007910 5603 Mitogen-activated
protein kinase 13
MAPK13 -1.58 -2.07 -2.23 -2.37 -1.97 -1.12 -1.2 -1.1 -1.02 1.08 cell cycle
16948209 5290
Phosphoinositide-3-
kinase, catalytic,
alpha polypeptide
PIK3CA* -1.41 -1.51 -1.58 -1.72 -1.37 -1.23 -1.15 -1.19 -1.01 -1.29 protein binding
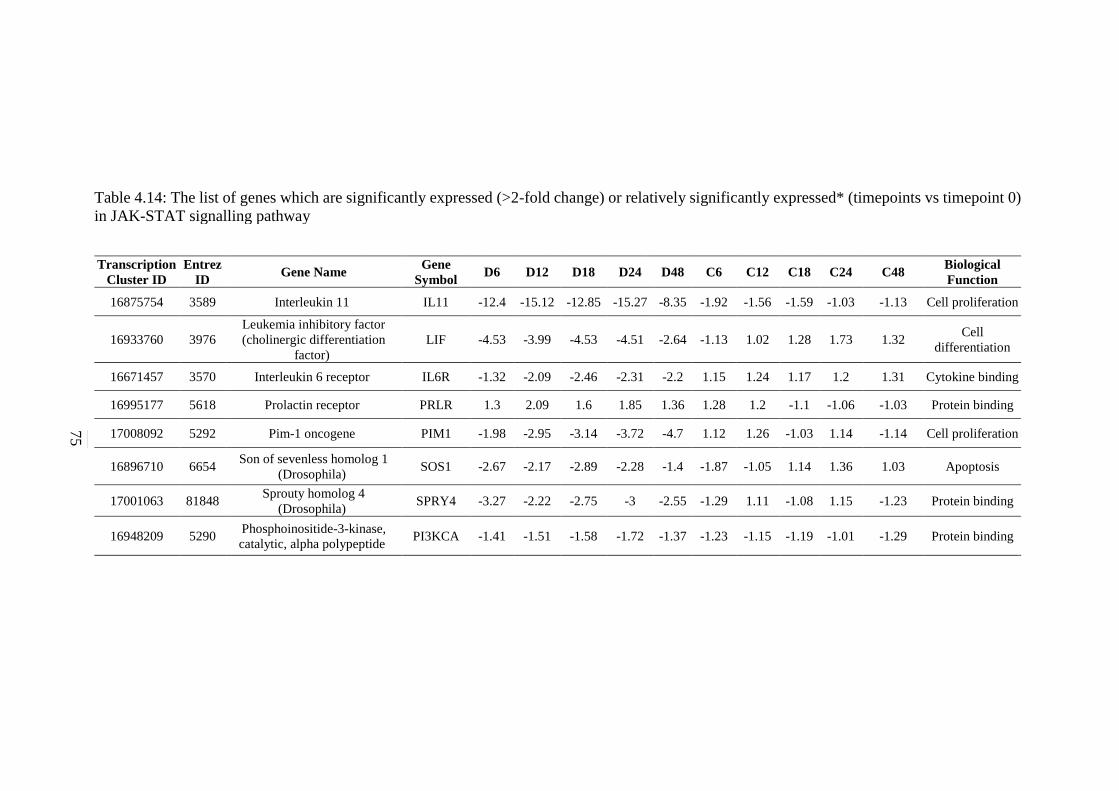
75
Table 4.14: The list of genes which are significantly expressed (>2-fold change) or relatively significantly expressed* (timepoints vs timepoint 0)
in JAK-STAT signalling pathway
Transcription
Cluster ID
Entrez
ID Gene Name
Gene
Symbol D6 D12 D18 D24 D48 C6 C12 C18 C24 C48
Biological
Function
16875754 3589 Interleukin 11 IL11 -12.4 -15.12 -12.85 -15.27 -8.35 -1.92 -1.56 -1.59 -1.03 -1.13 Cell proliferation
16933760 3976
Leukemia inhibitory factor
(cholinergic differentiation
factor)
LIF -4.53 -3.99 -4.53 -4.51 -2.64 -1.13 1.02 1.28 1.73 1.32 Cell
differentiation
16671457 3570 Interleukin 6 receptor IL6R -1.32 -2.09 -2.46 -2.31 -2.2 1.15 1.24 1.17 1.2 1.31 Cytokine binding
16995177 5618 Prolactin receptor PRLR 1.3 2.09 1.6 1.85 1.36 1.28 1.2 -1.1 -1.06 -1.03 Protein binding
17008092 5292 Pim-1 oncogene PIM1 -1.98 -2.95 -3.14 -3.72 -4.7 1.12 1.26 -1.03 1.14 -1.14 Cell proliferation
16896710 6654 Son of sevenless homolog 1
(Drosophila)
SOS1 -2.67 -2.17 -2.89 -2.28 -1.4 -1.87 -1.05 1.14 1.36 1.03 Apoptosis
17001063 81848 Sprouty homolog 4
(Drosophila)
SPRY4 -3.27 -2.22 -2.75 -3 -2.55 -1.29 1.11 -1.08 1.15 -1.23 Protein binding
16948209 5290 Phosphoinositide-3-kinase,
catalytic, alpha polypeptide
PI3KCA -1.41 -1.51 -1.58 -1.72 -1.37 -1.23 -1.15 -1.19 -1.01 -1.29 Protein binding
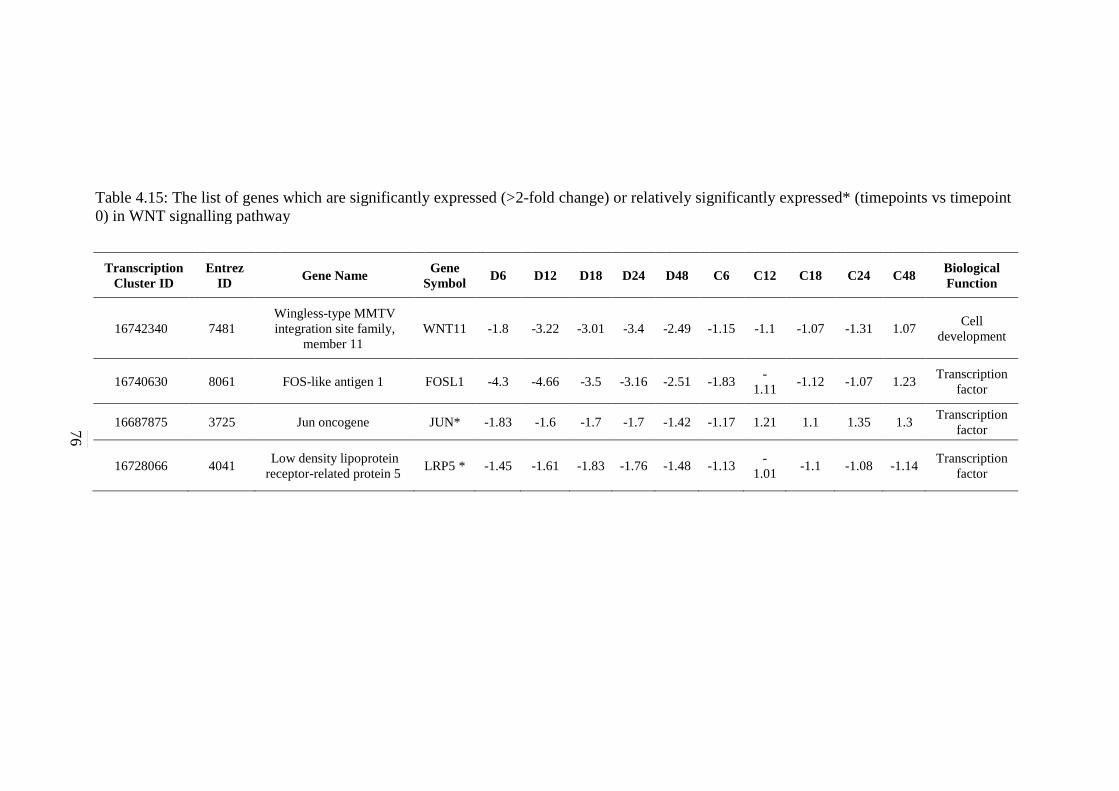
76
Table 4.15: The list of genes which are significantly expressed (>2-fold change) or relatively significantly expressed* (timepoints vs timepoint
0) in WNT signalling pathway
Transcription
Cluster ID
Entrez
ID Gene Name
Gene
Symbol D6 D12 D18 D24 D48 C6 C12 C18 C24 C48
Biological
Function
16742340 7481
Wingless-type MMTV
integration site family,
member 11
WNT11 -1.8 -3.22 -3.01 -3.4 -2.49 -1.15 -1.1 -1.07 -1.31 1.07 Cell
development
16740630 8061 FOS-like antigen 1 FOSL1 -4.3 -4.66 -3.5 -3.16 -2.51 -1.83 -
1.11 -1.12 -1.07 1.23
Transcription
factor
16687875 3725 Jun oncogene JUN* -1.83 -1.6 -1.7 -1.7 -1.42 -1.17 1.21 1.1 1.35 1.3 Transcription
factor
16728066 4041 Low density lipoprotein
receptor-related protein 5
LRP5 * -1.45 -1.61 -1.83 -1.76 -1.48 -1.13 -
1.01 -1.1 -1.08 -1.14
Transcription
factor
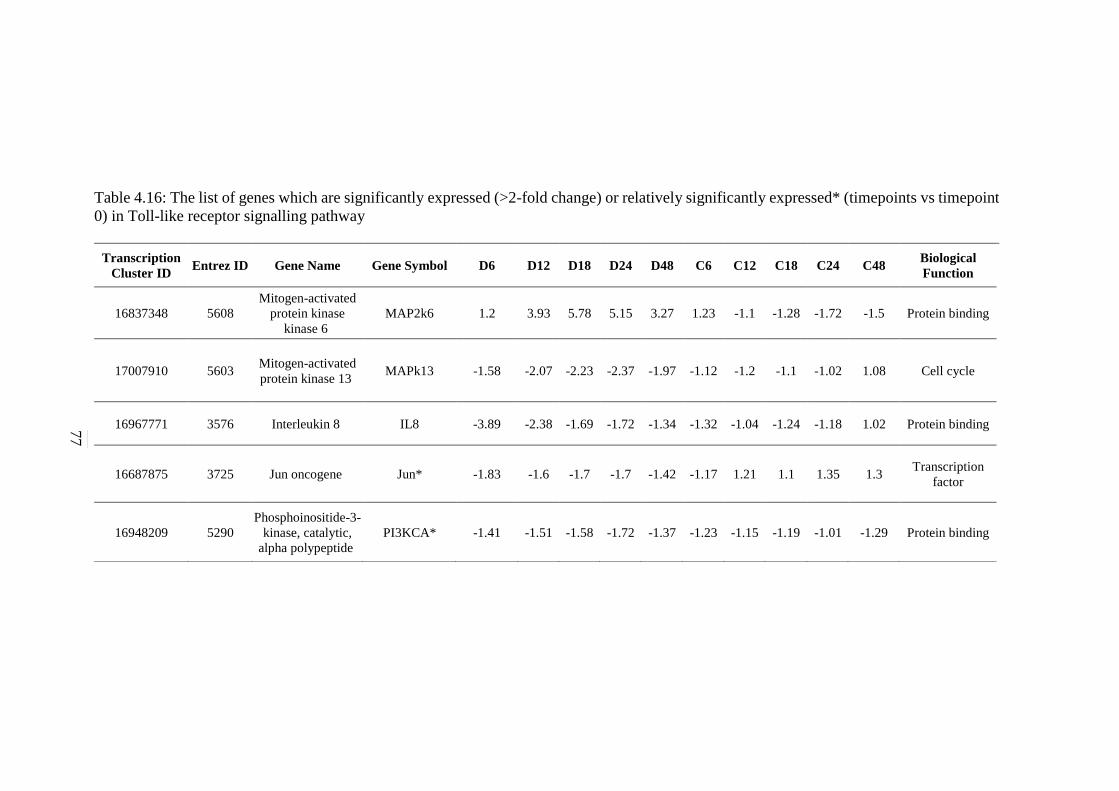
77
Table 4.16: The list of genes which are significantly expressed (>2-fold change) or relatively significantly expressed* (timepoints vs timepoint
0) in Toll-like receptor signalling pathway
Transcription
Cluster ID Entrez ID Gene Name Gene Symbol D6 D12 D18 D24 D48 C6 C12 C18 C24 C48
Biological
Function
16837348 5608
Mitogen-activated
protein kinase
kinase 6
MAP2k6 1.2 3.93 5.78 5.15 3.27 1.23 -1.1 -1.28 -1.72 -1.5 Protein binding
17007910 5603 Mitogen-activated
protein kinase 13
MAPk13 -1.58 -2.07 -2.23 -2.37 -1.97 -1.12 -1.2 -1.1 -1.02 1.08 Cell cycle
16967771 3576 Interleukin 8 IL8 -3.89 -2.38 -1.69 -1.72 -1.34 -1.32 -1.04 -1.24 -1.18 1.02 Protein binding
16687875 3725 Jun oncogene Jun* -1.83 -1.6 -1.7 -1.7 -1.42 -1.17 1.21 1.1 1.35 1.3 Transcription
factor
16948209 5290
Phosphoinositide-3-
kinase, catalytic,
alpha polypeptide
PI3KCA* -1.41 -1.51 -1.58 -1.72 -1.37 -1.23 -1.15 -1.19 -1.01 -1.29 Protein binding
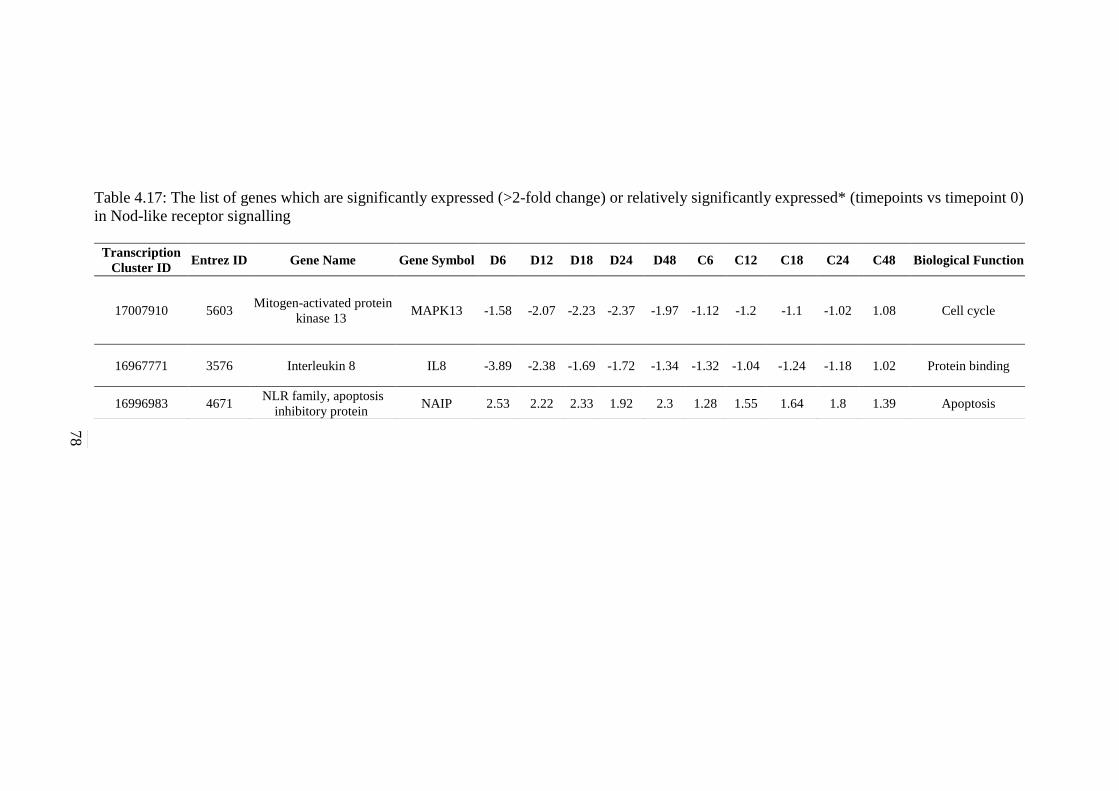
78
Table 4.17: The list of genes which are significantly expressed (>2-fold change) or relatively significantly expressed* (timepoints vs timepoint 0)
in Nod-like receptor signalling
Transcription
Cluster ID Entrez ID Gene Name Gene Symbol D6 D12 D18 D24 D48 C6 C12 C18 C24 C48 Biological Function
17007910 5603 Mitogen-activated protein
kinase 13
MAPK13 -1.58 -2.07 -2.23 -2.37 -1.97 -1.12 -1.2 -1.1 -1.02 1.08 Cell cycle
16967771 3576 Interleukin 8 IL8 -3.89 -2.38 -1.69 -1.72 -1.34 -1.32 -1.04 -1.24 -1.18 1.02 Protein binding
16996983 4671 NLR family, apoptosis
inhibitory protein
NAIP 2.53 2.22 2.33 1.92 2.3 1.28 1.55 1.64 1.8 1.39 Apoptosis
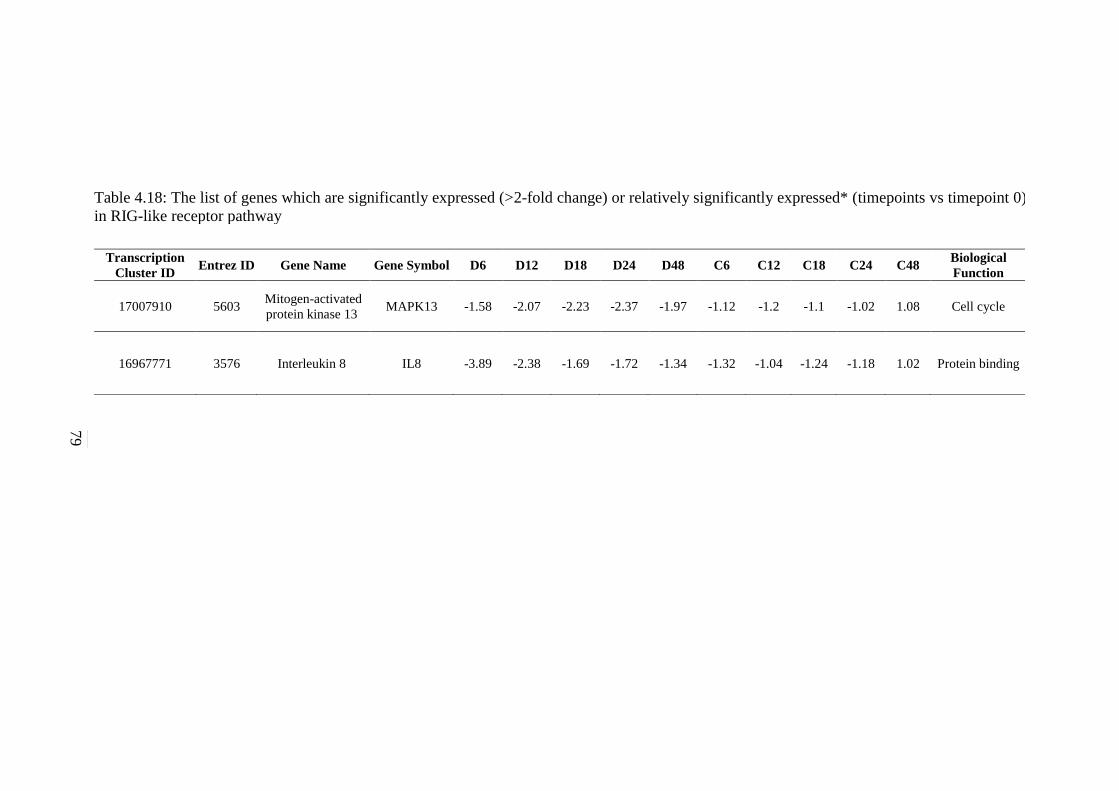
79
Table 4.18: The list of genes which are significantly expressed (>2-fold change) or relatively significantly expressed* (timepoints vs timepoint 0)
in RIG-like receptor pathway
Transcription
Cluster ID Entrez ID Gene Name Gene Symbol D6 D12 D18 D24 D48 C6 C12 C18 C24 C48
Biological
Function
17007910 5603 Mitogen-activated
protein kinase 13
MAPK13 -1.58 -2.07 -2.23 -2.37 -1.97 -1.12 -1.2 -1.1 -1.02 1.08 Cell cycle
16967771 3576 Interleukin 8 IL8 -3.89 -2.38 -1.69 -1.72 -1.34 -1.32 -1.04 -1.24 -1.18 1.02 Protein binding
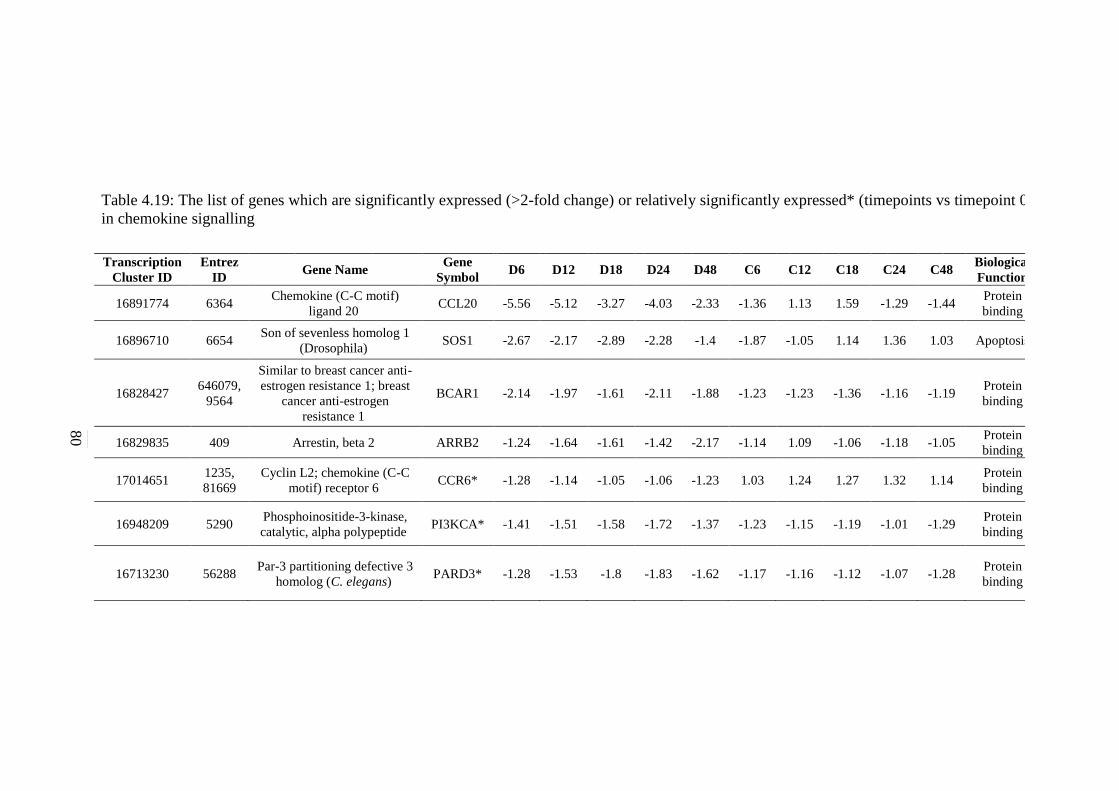
80
Table 4.19: The list of genes which are significantly expressed (>2-fold change) or relatively significantly expressed* (timepoints vs timepoint 0)
in chemokine signalling
Transcription
Cluster ID
Entrez
ID Gene Name
Gene
Symbol D6 D12 D18 D24 D48 C6 C12 C18 C24 C48
Biological
Function
16891774 6364 Chemokine (C-C motif)
ligand 20
CCL20 -5.56 -5.12 -3.27 -4.03 -2.33 -1.36 1.13 1.59 -1.29 -1.44 Protein
binding
16896710 6654 Son of sevenless homolog 1
(Drosophila)
SOS1 -2.67 -2.17 -2.89 -2.28 -1.4 -1.87 -1.05 1.14 1.36 1.03 Apoptosis
16828427 646079,
9564
Similar to breast cancer anti-
estrogen resistance 1; breast
cancer anti-estrogen
resistance 1
BCAR1 -2.14 -1.97 -1.61 -2.11 -1.88 -1.23 -1.23 -1.36 -1.16 -1.19 Protein
binding
16829835 409 Arrestin, beta 2 ARRB2 -1.24 -1.64 -1.61 -1.42 -2.17 -1.14 1.09 -1.06 -1.18 -1.05 Protein
binding
17014651 1235,
81669
Cyclin L2; chemokine (C-C
motif) receptor 6
CCR6* -1.28 -1.14 -1.05 -1.06 -1.23 1.03 1.24 1.27 1.32 1.14 Protein
binding
16948209 5290 Phosphoinositide-3-kinase,
catalytic, alpha polypeptide
PI3KCA* -1.41 -1.51 -1.58 -1.72 -1.37 -1.23 -1.15 -1.19 -1.01 -1.29 Protein
binding
16713230 56288 Par-3 partitioning defective 3
homolog (C. elegans)
PARD3* -1.28 -1.53 -1.8 -1.83 -1.62 -1.17 -1.16 -1.12 -1.07 -1.28 Protein
binding
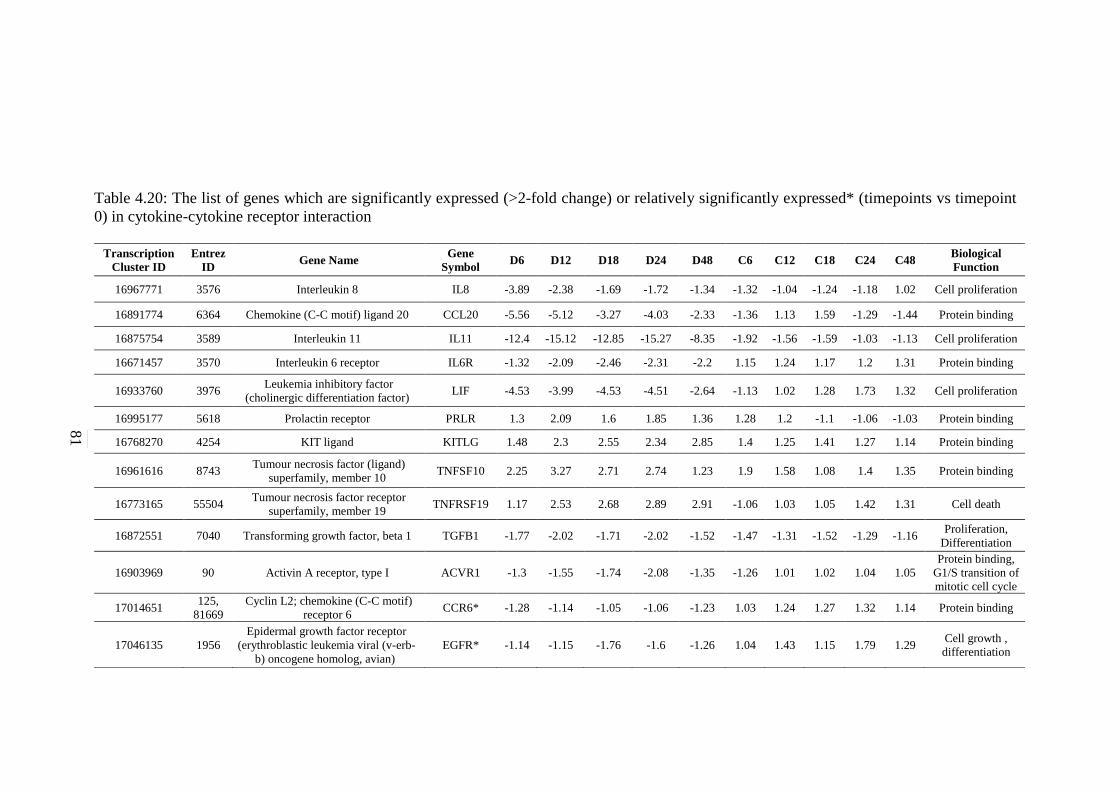
81
Table 4.20: The list of genes which are significantly expressed (>2-fold change) or relatively significantly expressed* (timepoints vs timepoint
0) in cytokine-cytokine receptor interaction
Transcription
Cluster ID
Entrez
ID Gene Name
Gene
Symbol D6 D12 D18 D24 D48 C6 C12 C18 C24 C48
Biological
Function
16967771 3576 Interleukin 8 IL8 -3.89 -2.38 -1.69 -1.72 -1.34 -1.32 -1.04 -1.24 -1.18 1.02 Cell proliferation
16891774 6364 Chemokine (C-C motif) ligand 20 CCL20 -5.56 -5.12 -3.27 -4.03 -2.33 -1.36 1.13 1.59 -1.29 -1.44 Protein binding
16875754 3589 Interleukin 11 IL11 -12.4 -15.12 -12.85 -15.27 -8.35 -1.92 -1.56 -1.59 -1.03 -1.13 Cell proliferation
16671457 3570 Interleukin 6 receptor IL6R -1.32 -2.09 -2.46 -2.31 -2.2 1.15 1.24 1.17 1.2 1.31 Protein binding
16933760 3976 Leukemia inhibitory factor
(cholinergic differentiation factor)
LIF -4.53 -3.99 -4.53 -4.51 -2.64 -1.13 1.02 1.28 1.73 1.32 Cell proliferation
16995177 5618 Prolactin receptor PRLR 1.3 2.09 1.6 1.85 1.36 1.28 1.2 -1.1 -1.06 -1.03 Protein binding
16768270 4254 KIT ligand KITLG 1.48 2.3 2.55 2.34 2.85 1.4 1.25 1.41 1.27 1.14 Protein binding
16961616 8743 Tumour necrosis factor (ligand)
superfamily, member 10
TNFSF10 2.25 3.27 2.71 2.74 1.23 1.9 1.58 1.08 1.4 1.35 Protein binding
16773165 55504 Tumour necrosis factor receptor
superfamily, member 19
TNFRSF19 1.17 2.53 2.68 2.89 2.91 -1.06 1.03 1.05 1.42 1.31 Cell death
16872551 7040 Transforming growth factor, beta 1 TGFB1 -1.77 -2.02 -1.71 -2.02 -1.52 -1.47 -1.31 -1.52 -1.29 -1.16 Proliferation,
Differentiation
16903969 90 Activin A receptor, type I ACVR1 -1.3 -1.55 -1.74 -2.08 -1.35 -1.26 1.01 1.02 1.04 1.05
Protein binding,
G1/S transition of
mitotic cell cycle
17014651 125,
81669
Cyclin L2; chemokine (C-C motif)
receptor 6
CCR6* -1.28 -1.14 -1.05 -1.06 -1.23 1.03 1.24 1.27 1.32 1.14 Protein binding
17046135 1956
Epidermal growth factor receptor
(erythroblastic leukemia viral (v-erb-
b) oncogene homolog, avian)
EGFR* -1.14 -1.15 -1.76 -1.6 -1.26 1.04 1.43 1.15 1.79 1.29 Cell growth ,
differentiation
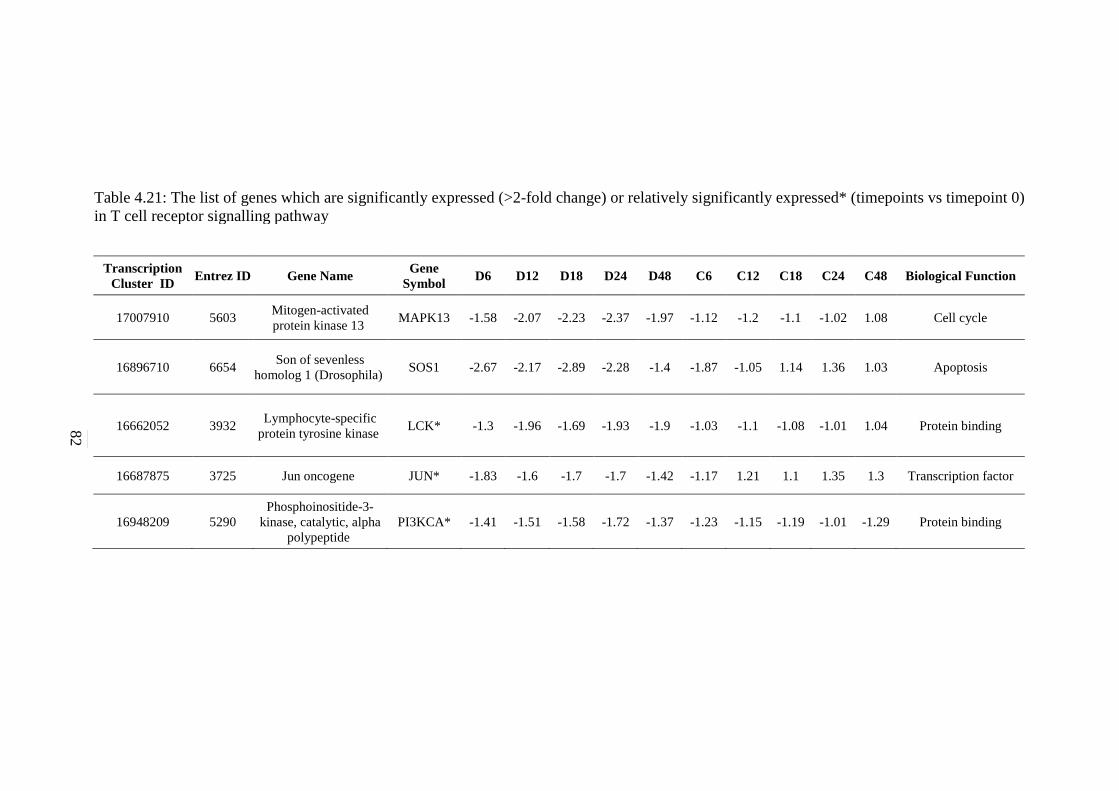
82
Table 4.21: The list of genes which are significantly expressed (>2-fold change) or relatively significantly expressed* (timepoints vs timepoint 0)
in T cell receptor signalling pathway
Transcription
Cluster ID Entrez ID Gene Name
Gene
Symbol D6 D12 D18 D24 D48 C6 C12 C18 C24 C48 Biological Function
17007910 5603 Mitogen-activated
protein kinase 13
MAPK13 -1.58 -2.07 -2.23 -2.37 -1.97 -1.12 -1.2 -1.1 -1.02 1.08 Cell cycle
16896710 6654 Son of sevenless
homolog 1 (Drosophila)
SOS1 -2.67 -2.17 -2.89 -2.28 -1.4 -1.87 -1.05 1.14 1.36 1.03 Apoptosis
16662052 3932 Lymphocyte-specific
protein tyrosine kinase
LCK* -1.3 -1.96 -1.69 -1.93 -1.9 -1.03 -1.1 -1.08 -1.01 1.04 Protein binding
16687875 3725 Jun oncogene JUN* -1.83 -1.6 -1.7 -1.7 -1.42 -1.17 1.21 1.1 1.35 1.3 Transcription factor
16948209 5290
Phosphoinositide-3-
kinase, catalytic, alpha
polypeptide
PI3KCA* -1.41 -1.51 -1.58 -1.72 -1.37 -1.23 -1.15 -1.19 -1.01 -1.29 Protein binding
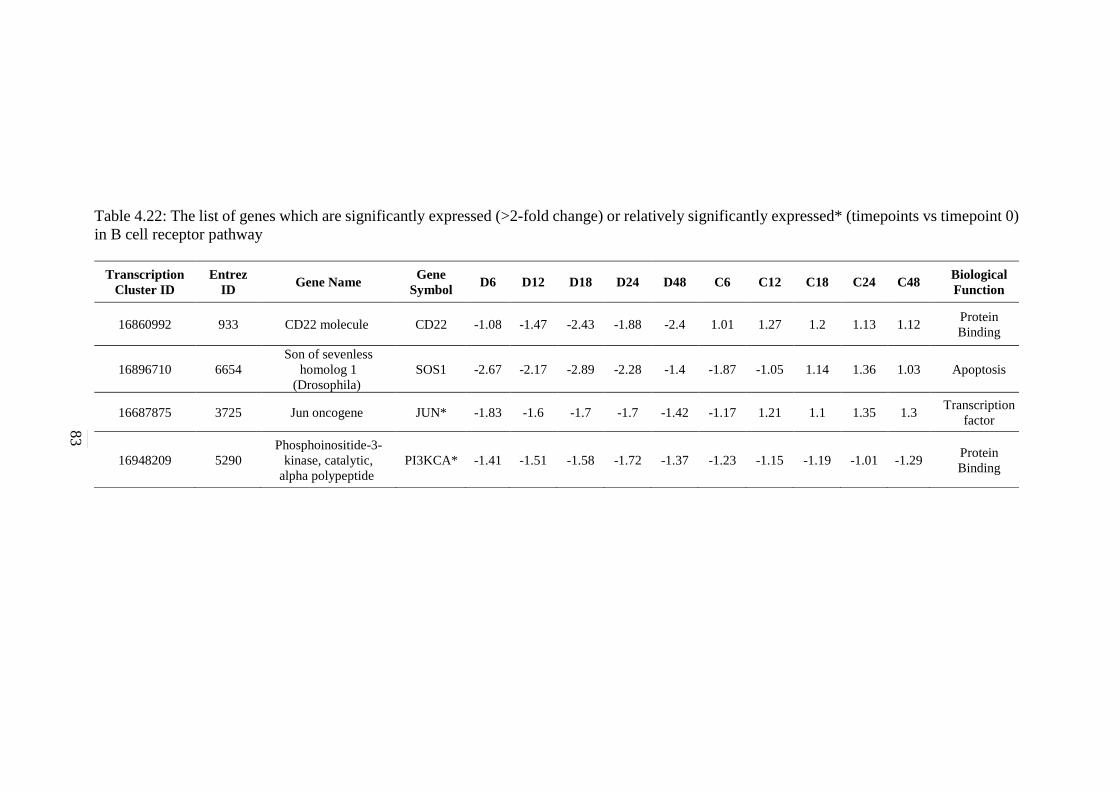
83
Table 4.22: The list of genes which are significantly expressed (>2-fold change) or relatively significantly expressed* (timepoints vs timepoint 0)
in B cell receptor pathway
Transcription
Cluster ID
Entrez
ID Gene Name
Gene
Symbol D6 D12 D18 D24 D48 C6 C12 C18 C24 C48
Biological
Function
16860992 933 CD22 molecule CD22 -1.08 -1.47 -2.43 -1.88 -2.4 1.01 1.27 1.2 1.13 1.12 Protein
Binding
16896710 6654
Son of sevenless
homolog 1
(Drosophila)
SOS1 -2.67 -2.17 -2.89 -2.28 -1.4 -1.87 -1.05 1.14 1.36 1.03 Apoptosis
16687875 3725 Jun oncogene JUN* -1.83 -1.6 -1.7 -1.7 -1.42 -1.17 1.21 1.1 1.35 1.3 Transcription
factor
16948209 5290
Phosphoinositide-3-
kinase, catalytic,
alpha polypeptide
PI3KCA* -1.41 -1.51 -1.58 -1.72 -1.37 -1.23 -1.15 -1.19 -1.01 -1.29 Protein
Binding
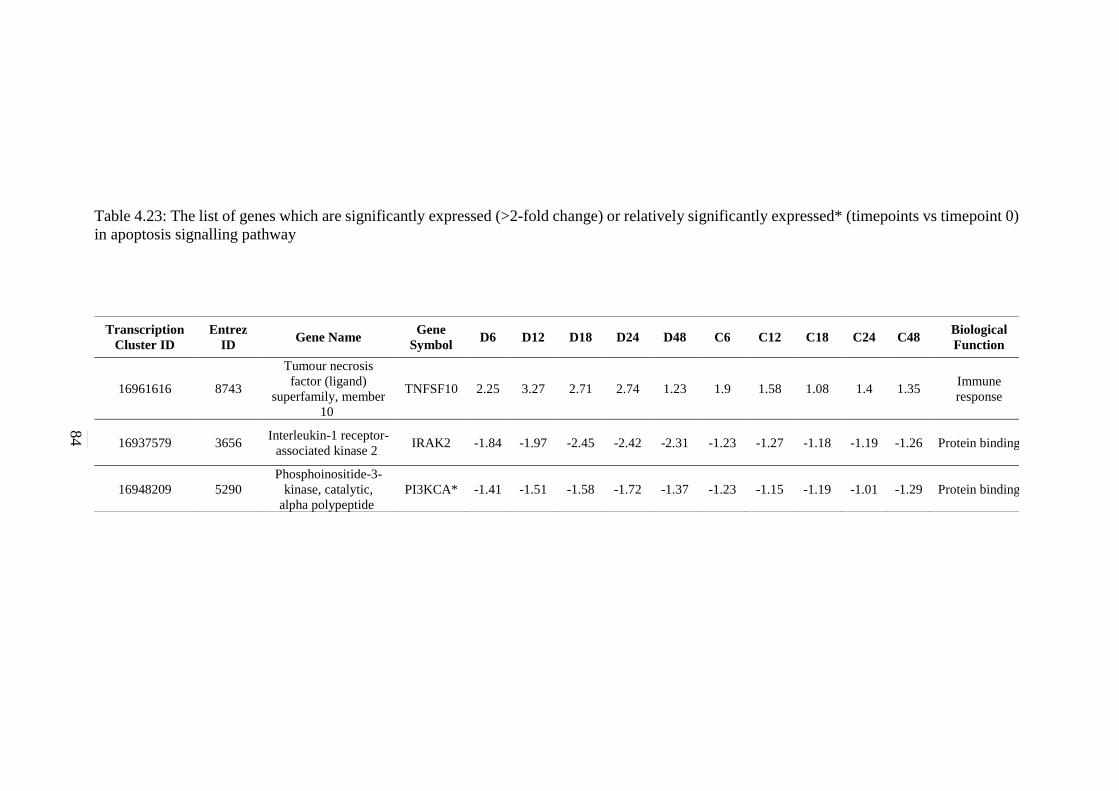
84
Table 4.23: The list of genes which are significantly expressed (>2-fold change) or relatively significantly expressed* (timepoints vs timepoint 0)
in apoptosis signalling pathway
Transcription
Cluster ID
Entrez
ID Gene Name
Gene
Symbol D6 D12 D18 D24 D48 C6 C12 C18 C24 C48
Biological
Function
16961616 8743
Tumour necrosis
factor (ligand)
superfamily, member
10
TNFSF10 2.25 3.27 2.71 2.74 1.23 1.9 1.58 1.08 1.4 1.35 Immune
response
16937579 3656 Interleukin-1 receptor-
associated kinase 2
IRAK2 -1.84 -1.97 -2.45 -2.42 -2.31 -1.23 -1.27 -1.18 -1.19 -1.26 Protein binding
16948209 5290
Phosphoinositide-3-
kinase, catalytic,
alpha polypeptide
PI3KCA* -1.41 -1.51 -1.58 -1.72 -1.37 -1.23 -1.15 -1.19 -1.01 -1.29 Protein binding
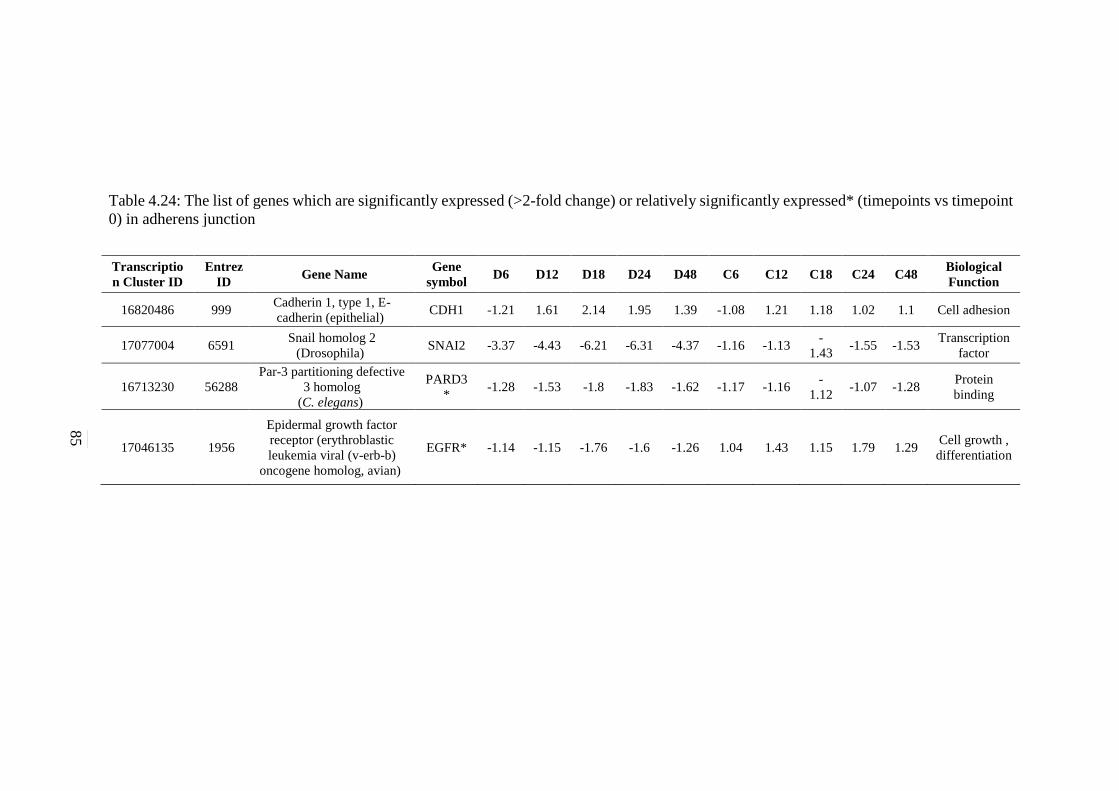
85
Table 4.24: The list of genes which are significantly expressed (>2-fold change) or relatively significantly expressed* (timepoints vs timepoint
0) in adherens junction
Transcriptio
n Cluster ID
Entrez
ID Gene Name
Gene
symbol D6 D12 D18 D24 D48 C6 C12 C18 C24 C48
Biological
Function
16820486 999 Cadherin 1, type 1, E-
cadherin (epithelial)
CDH1 -1.21 1.61 2.14 1.95 1.39 -1.08 1.21 1.18 1.02 1.1 Cell adhesion
17077004 6591 Snail homolog 2
(Drosophila)
SNAI2 -3.37 -4.43 -6.21 -6.31 -4.37 -1.16 -1.13 -
1.43 -1.55 -1.53
Transcription
factor
16713230 56288
Par-3 partitioning defective
3 homolog
(C. elegans)
PARD3
* -1.28 -1.53 -1.8 -1.83 -1.62 -1.17 -1.16
-
1.12 -1.07 -1.28
Protein
binding
17046135 1956
Epidermal growth factor
receptor (erythroblastic
leukemia viral (v-erb-b)
oncogene homolog, avian)
EGFR* -1.14 -1.15 -1.76 -1.6 -1.26 1.04 1.43 1.15 1.79 1.29 Cell growth ,
differentiation
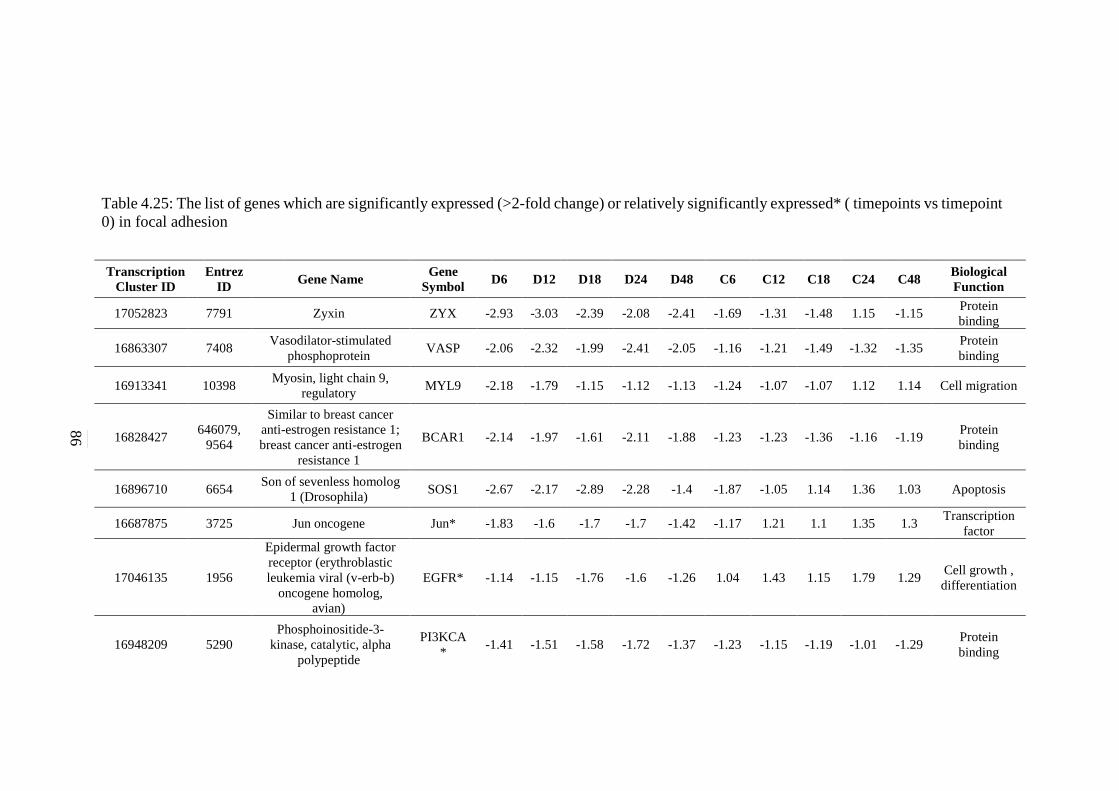
86
Table 4.25: The list of genes which are significantly expressed (>2-fold change) or relatively significantly expressed* ( timepoints vs timepoint
0) in focal adhesion
Transcription
Cluster ID
Entrez
ID Gene Name
Gene
Symbol D6 D12 D18 D24 D48 C6 C12 C18 C24 C48
Biological
Function
17052823 7791 Zyxin ZYX -2.93 -3.03 -2.39 -2.08 -2.41 -1.69 -1.31 -1.48 1.15 -1.15 Protein
binding
16863307 7408 Vasodilator-stimulated
phosphoprotein
VASP -2.06 -2.32 -1.99 -2.41 -2.05 -1.16 -1.21 -1.49 -1.32 -1.35 Protein
binding
16913341 10398 Myosin, light chain 9,
regulatory
MYL9 -2.18 -1.79 -1.15 -1.12 -1.13 -1.24 -1.07 -1.07 1.12 1.14 Cell migration
16828427 646079,
9564
Similar to breast cancer
anti-estrogen resistance 1;
breast cancer anti-estrogen
resistance 1
BCAR1 -2.14 -1.97 -1.61 -2.11 -1.88 -1.23 -1.23 -1.36 -1.16 -1.19 Protein
binding
16896710 6654 Son of sevenless homolog
1 (Drosophila)
SOS1 -2.67 -2.17 -2.89 -2.28 -1.4 -1.87 -1.05 1.14 1.36 1.03 Apoptosis
16687875 3725 Jun oncogene Jun* -1.83 -1.6 -1.7 -1.7 -1.42 -1.17 1.21 1.1 1.35 1.3 Transcription
factor
17046135 1956
Epidermal growth factor
receptor (erythroblastic
leukemia viral (v-erb-b)
oncogene homolog,
avian)
EGFR* -1.14 -1.15 -1.76 -1.6 -1.26 1.04 1.43 1.15 1.79 1.29 Cell growth ,
differentiation
16948209 5290
Phosphoinositide-3-
kinase, catalytic, alpha
polypeptide
PI3KCA
* -1.41 -1.51 -1.58 -1.72 -1.37 -1.23 -1.15 -1.19 -1.01 -1.29
Protein
binding
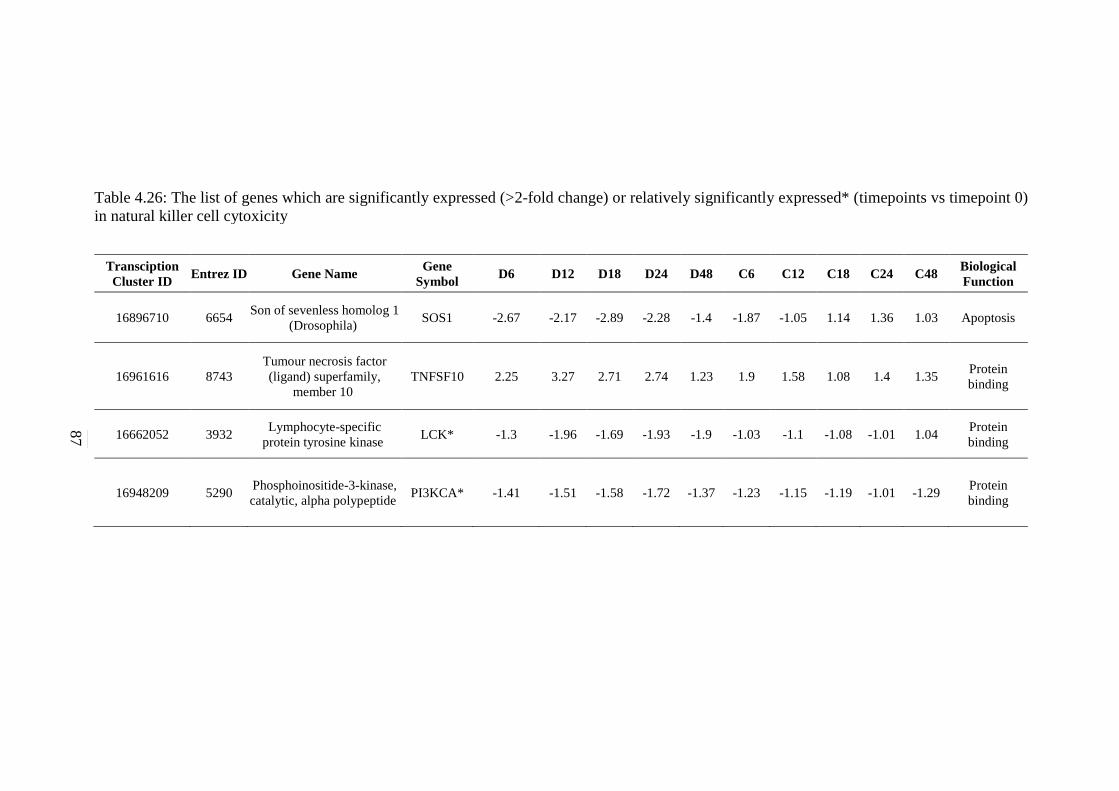
87
Table 4.26: The list of genes which are significantly expressed (>2-fold change) or relatively significantly expressed* (timepoints vs timepoint 0)
in natural killer cell cytoxicity
Transciption
Cluster ID Entrez ID Gene Name
Gene
Symbol D6 D12 D18 D24 D48 C6 C12 C18 C24 C48
Biological
Function
16896710 6654 Son of sevenless homolog 1
(Drosophila)
SOS1 -2.67 -2.17 -2.89 -2.28 -1.4 -1.87 -1.05 1.14 1.36 1.03 Apoptosis
16961616 8743
Tumour necrosis factor
(ligand) superfamily,
member 10
TNFSF10 2.25 3.27 2.71 2.74 1.23 1.9 1.58 1.08 1.4 1.35 Protein
binding
16662052 3932 Lymphocyte-specific
protein tyrosine kinase
LCK* -1.3 -1.96 -1.69 -1.93 -1.9 -1.03 -1.1 -1.08 -1.01 1.04 Protein
binding
16948209 5290 Phosphoinositide-3-kinase,
catalytic, alpha polypeptide
PI3KCA* -1.41 -1.51 -1.58 -1.72 -1.37 -1.23 -1.15 -1.19 -1.01 -1.29 Protein
binding
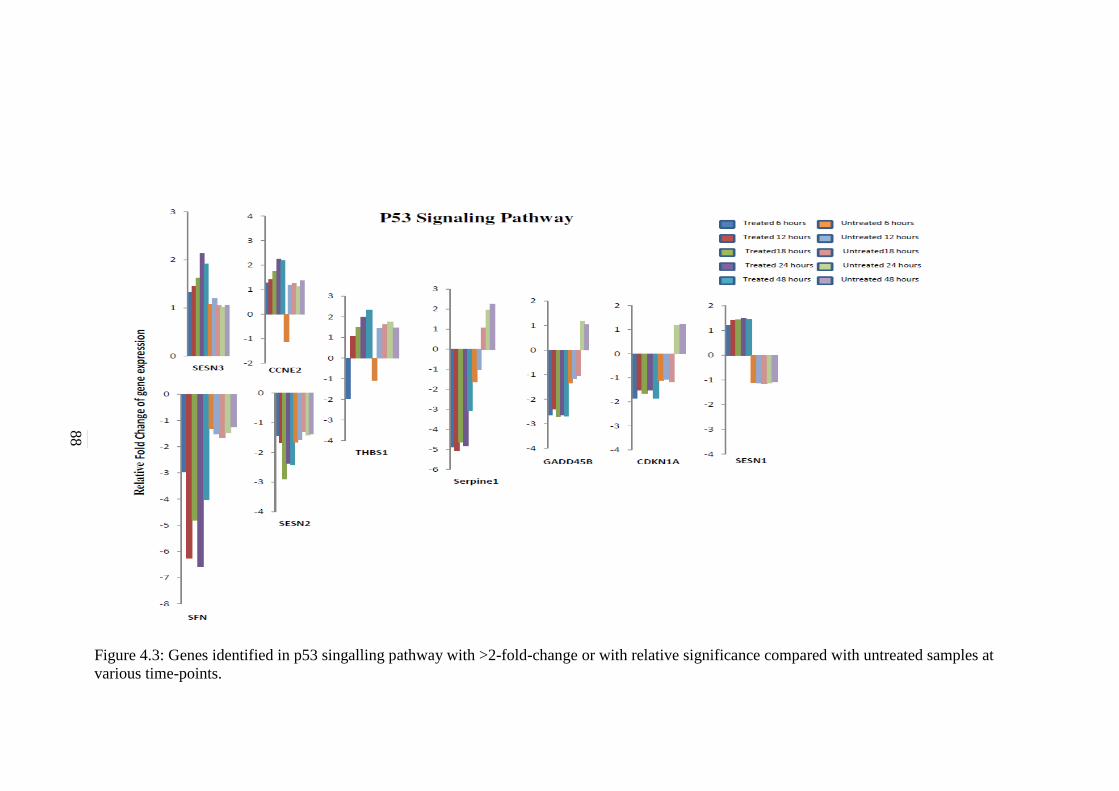
88
Figure 4.3: Genes identified in p53 singalling pathway with >2-fold-change or with relative significance compared with untreated samples at
various time-points.
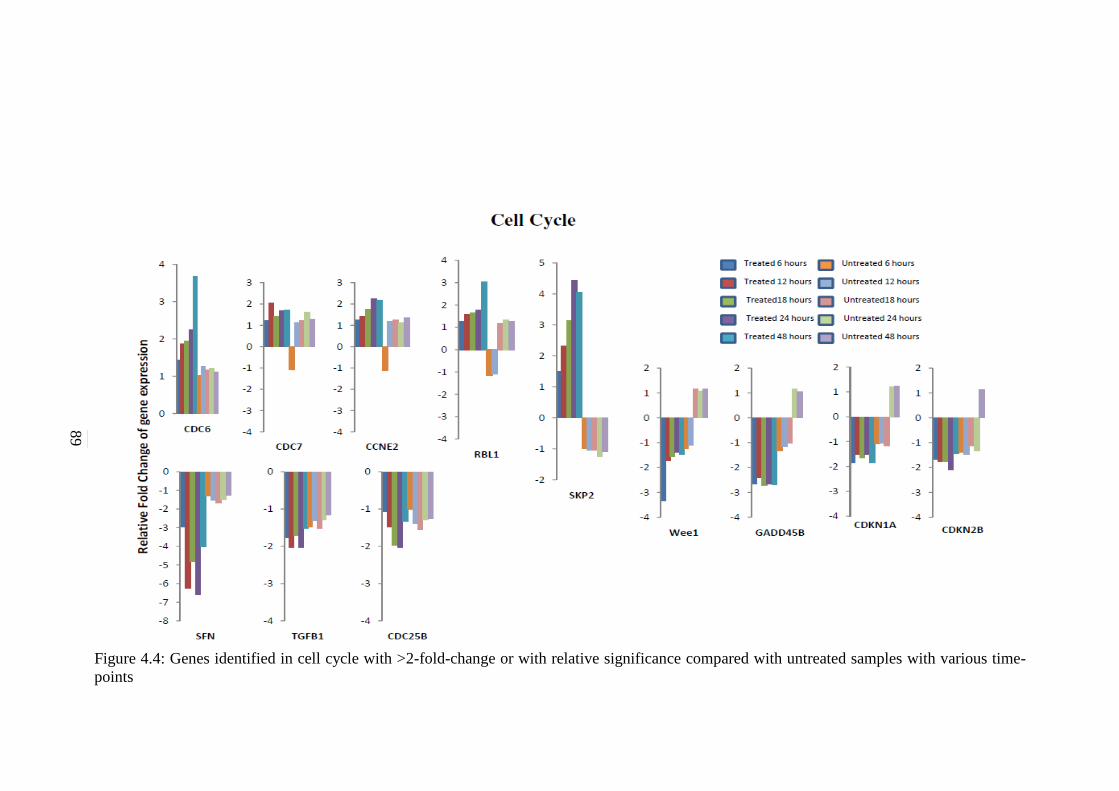
89
Figure 4.4: Genes identified in cell cycle with >2-fold-change or with relative significance compared with untreated samples with various time-
points
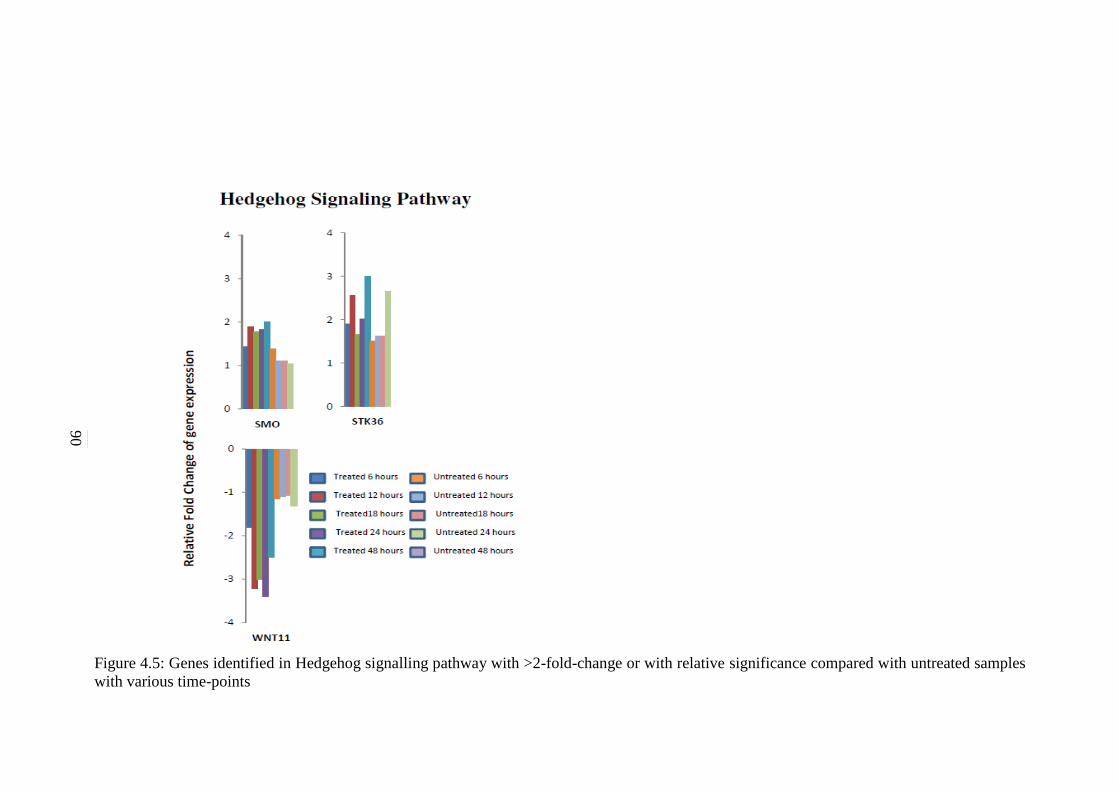
90
Figure 4.5: Genes identified in Hedgehog signalling pathway with >2-fold-change or with relative significance compared with untreated samples
with various time-points
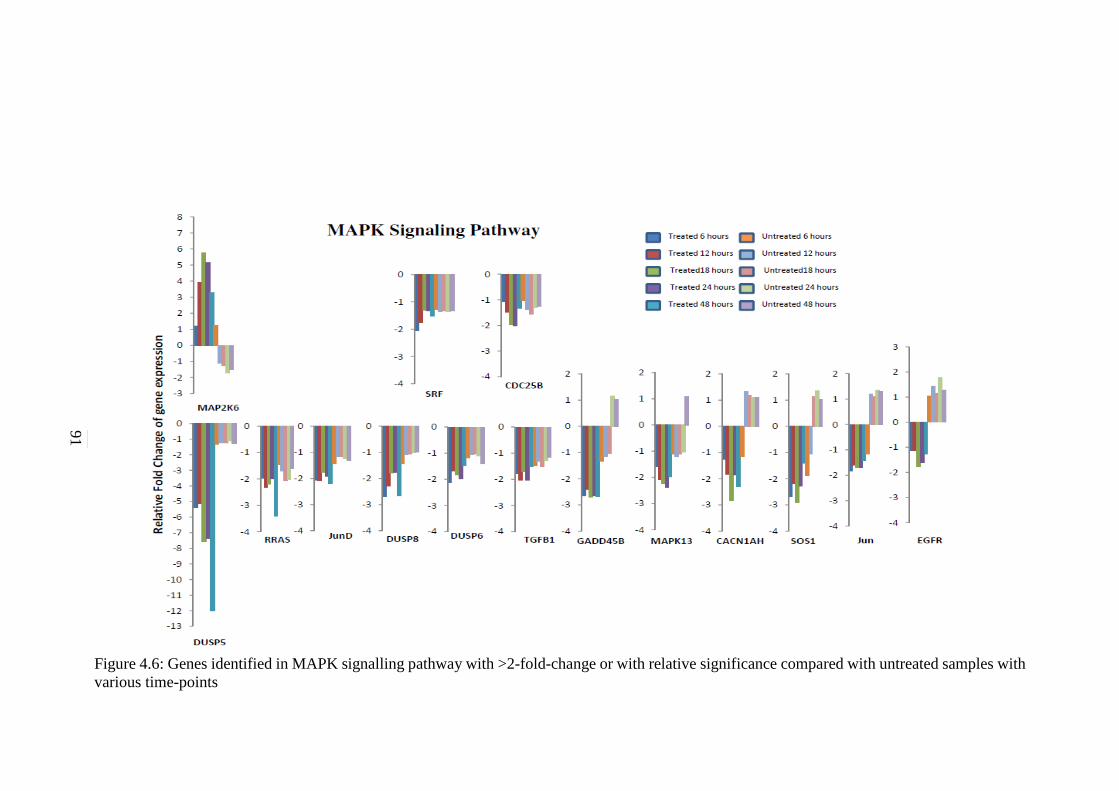
91
Figure 4.6: Genes identified in MAPK signalling pathway with >2-fold-change or with relative significance compared with untreated samples with
various time-points
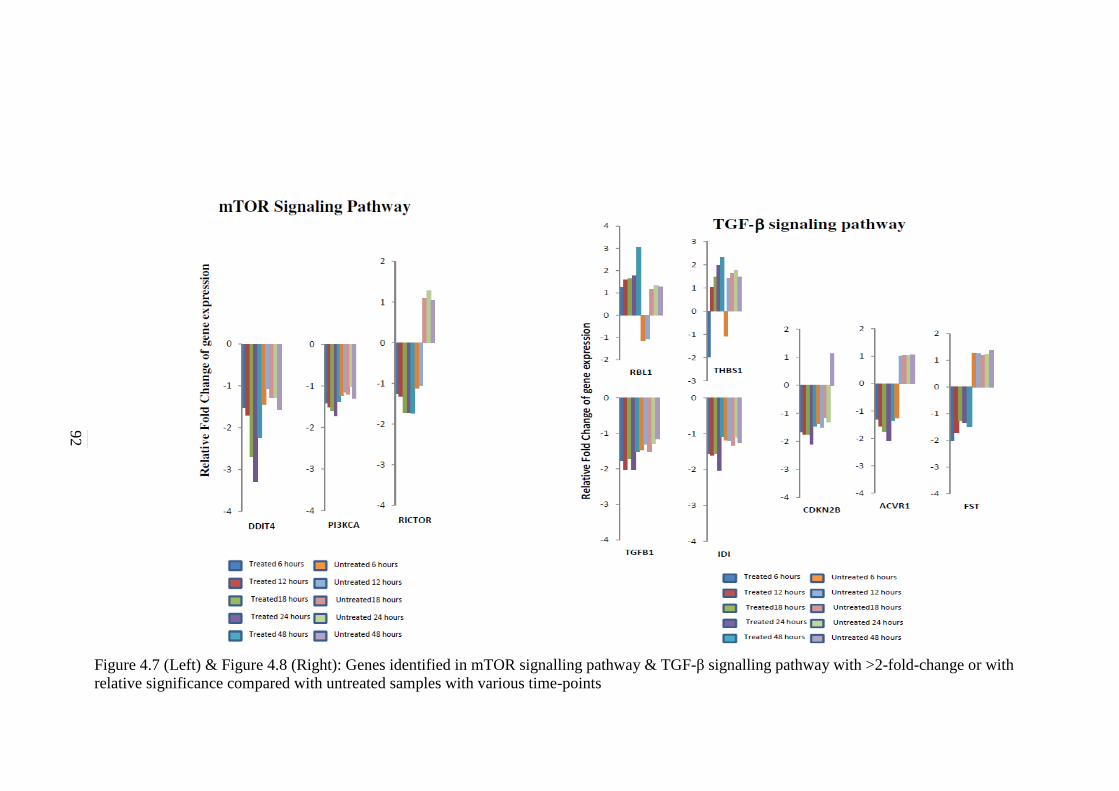
92
Figure 4.7 (Left) & Figure 4.8 (Right): Genes identified in mTOR signalling pathway & TGF-β signalling pathway with >2-fold-change or with
relative significance compared with untreated samples with various time-points
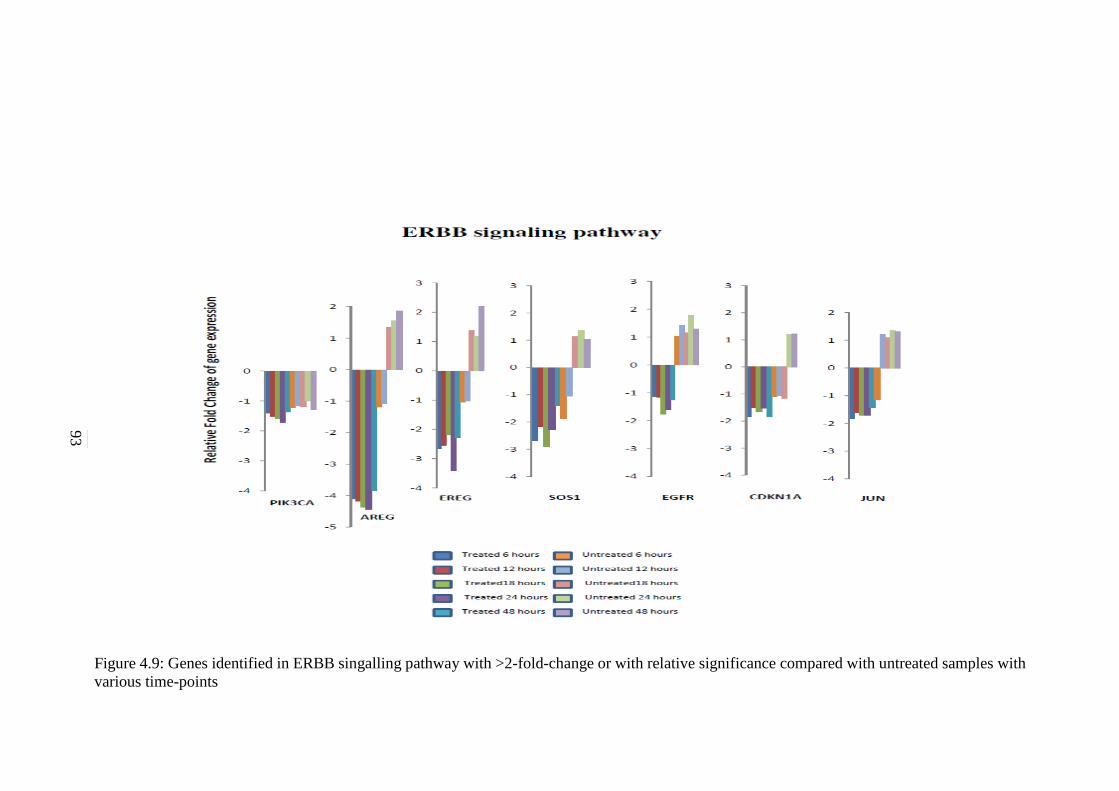
93
Figure 4.9: Genes identified in ERBB singalling pathway with >2-fold-change or with relative significance compared with untreated samples with
various time-points
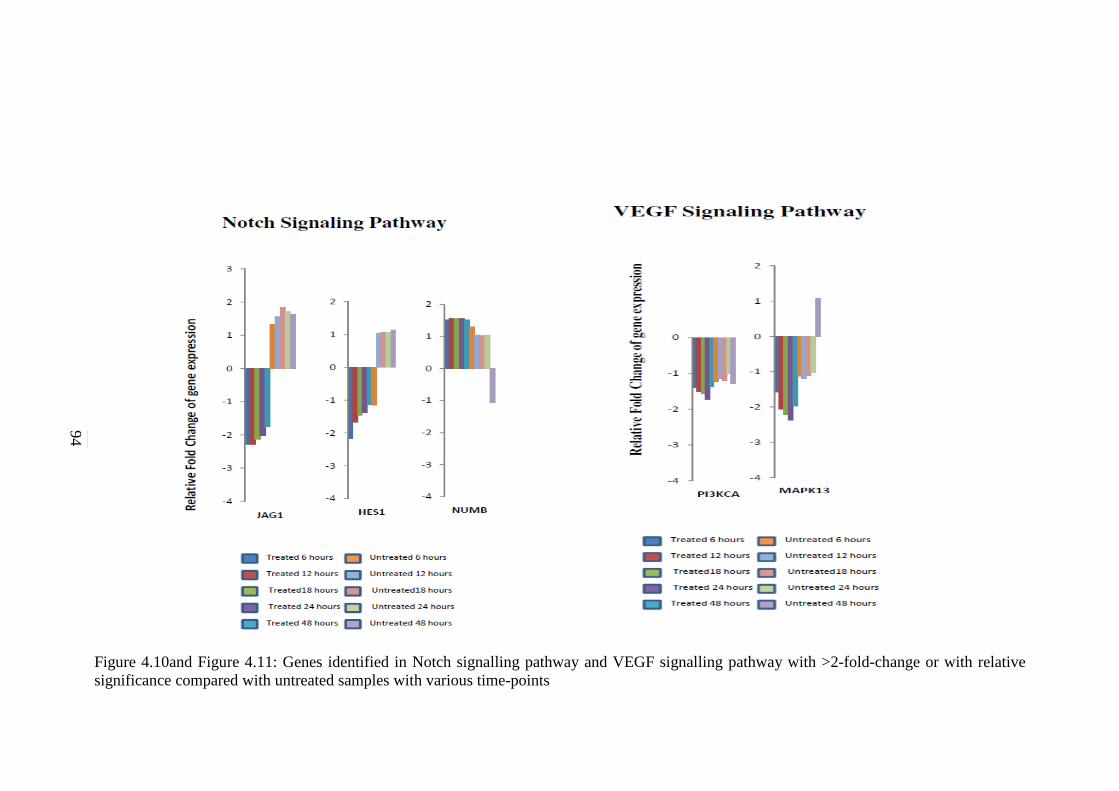
94
Figure 4.10and Figure 4.11: Genes identified in Notch signalling pathway and VEGF signalling pathway with >2-fold-change or with relative
significance compared with untreated samples with various time-points
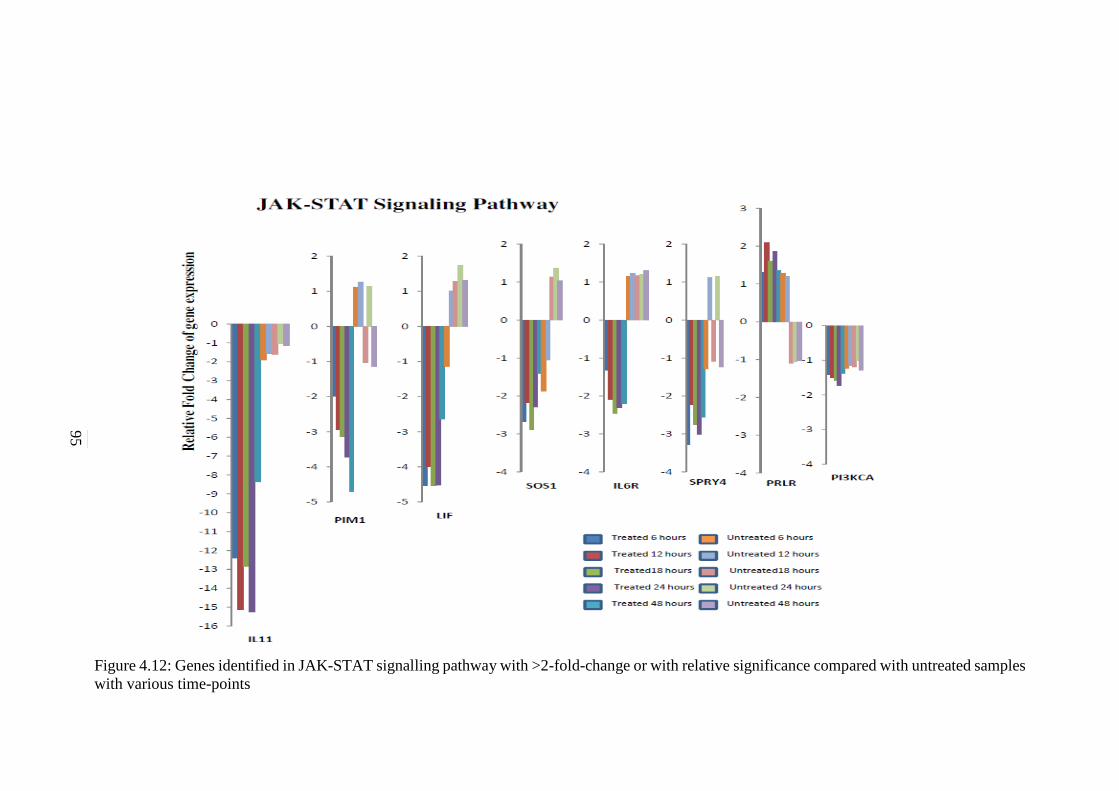
95
Figure 4.12: Genes identified in JAK-STAT signalling pathway with >2-fold-change or with relative significance compared with untreated samples
with various time-points
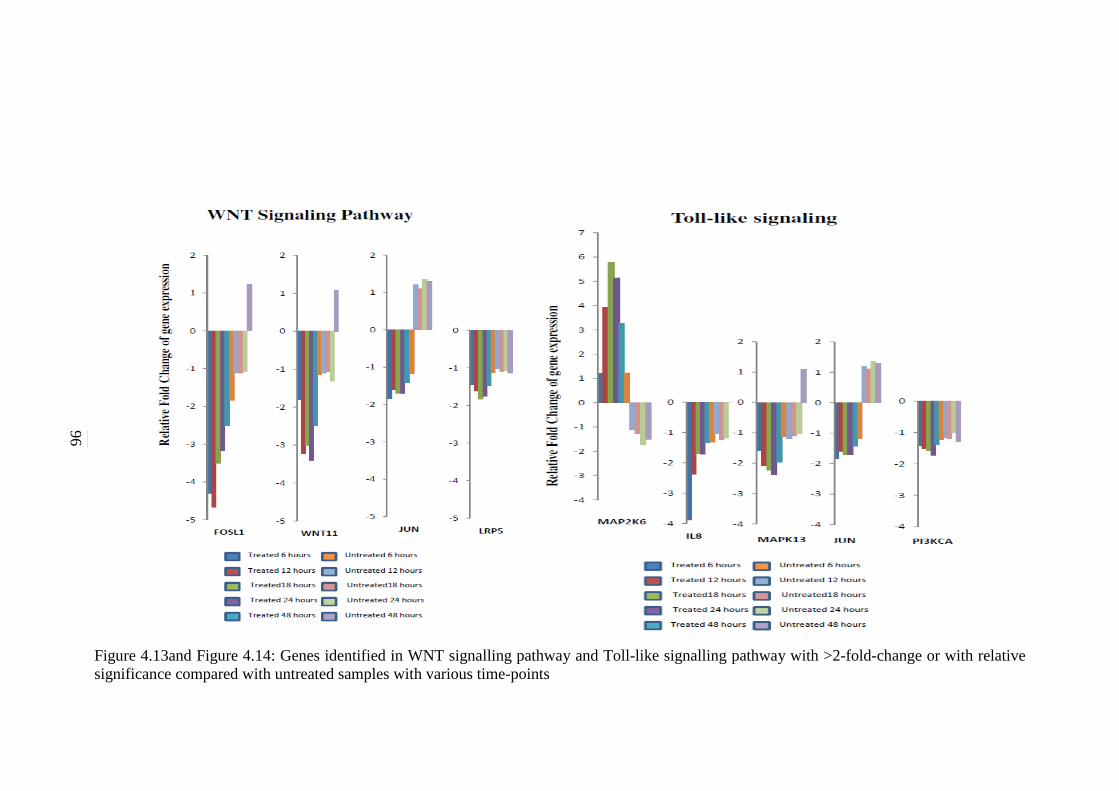
96
Figure 4.13and Figure 4.14: Genes identified in WNT signalling pathway and Toll-like signalling pathway with >2-fold-change or with relative
significance compared with untreated samples with various time-points
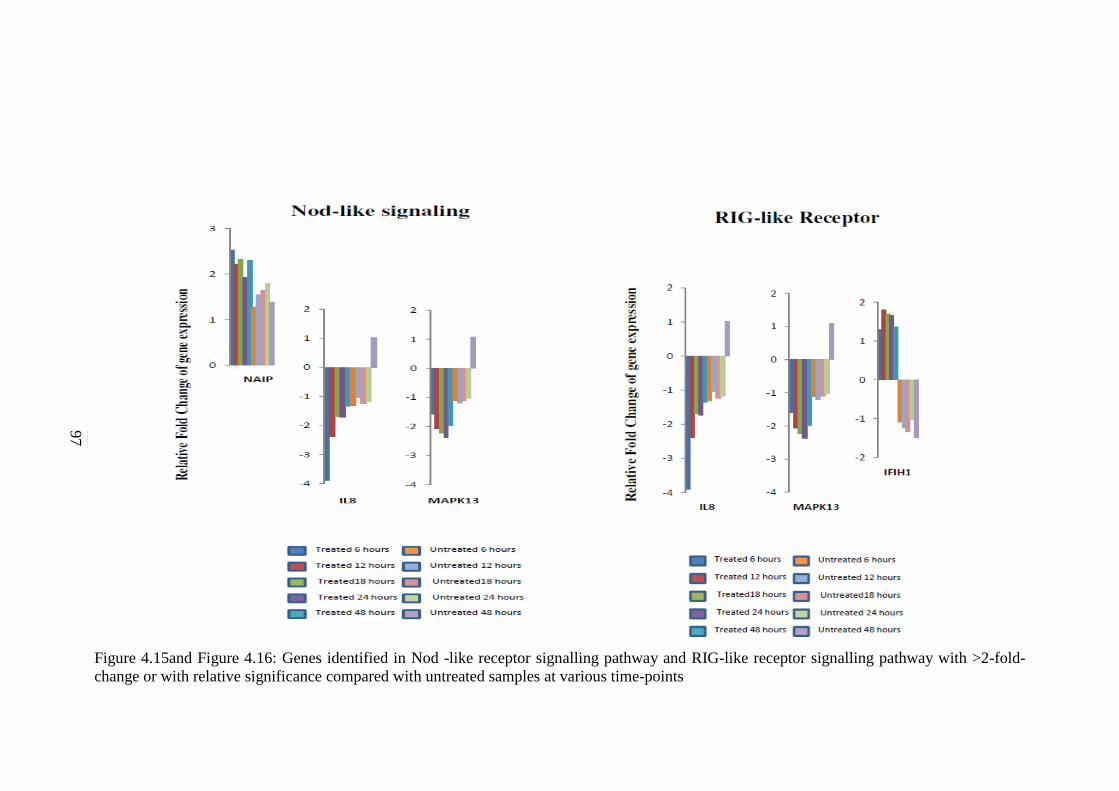
97
Figure 4.15and Figure 4.16: Genes identified in Nod -like receptor signalling pathway and RIG-like receptor signalling pathway with >2-fold-
change or with relative significance compared with untreated samples at various time-points
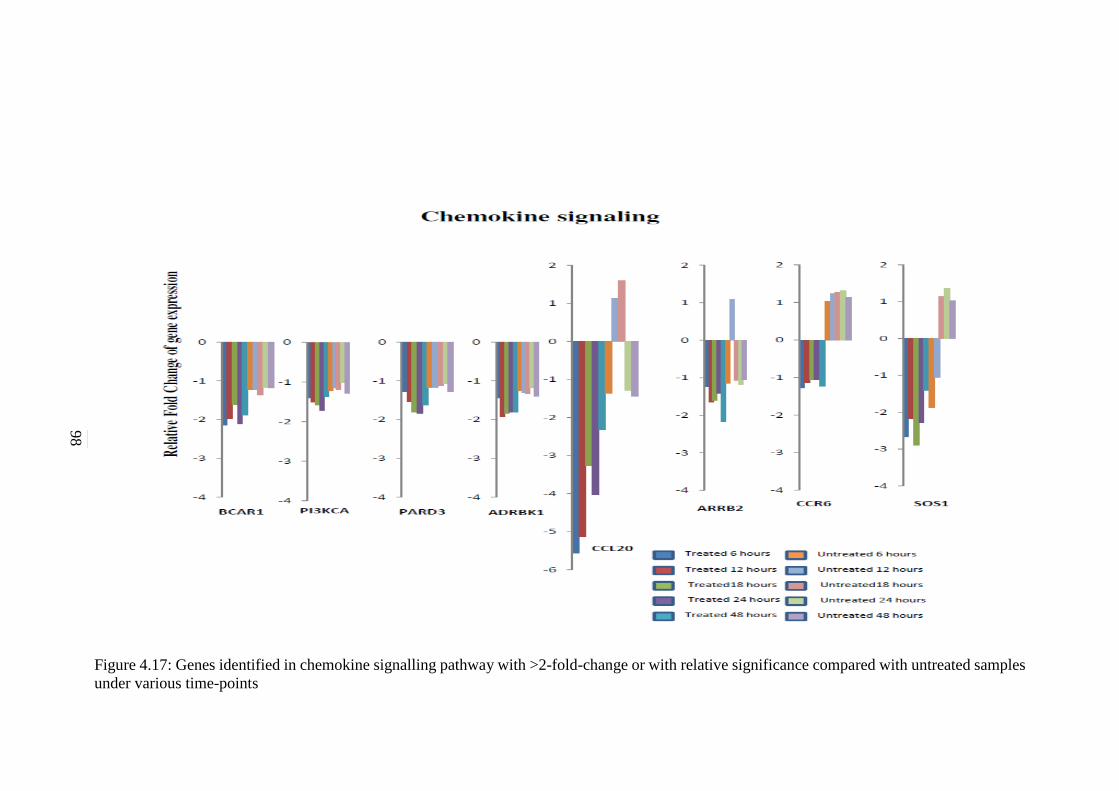
98
Figure 4.17: Genes identified in chemokine signalling pathway with >2-fold-change or with relative significance compared with untreated samples
under various time-points
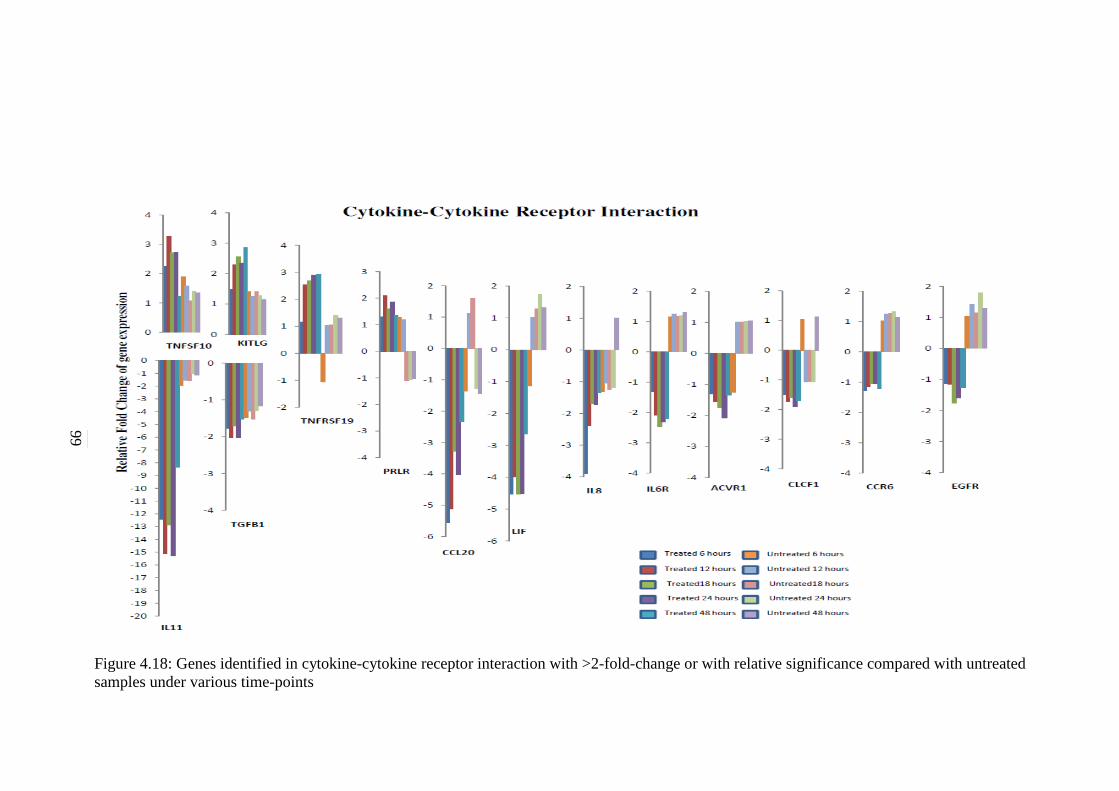
99
Figure 4.18: Genes identified in cytokine-cytokine receptor interaction with >2-fold-change or with relative significance compared with untreated
samples under various time-points
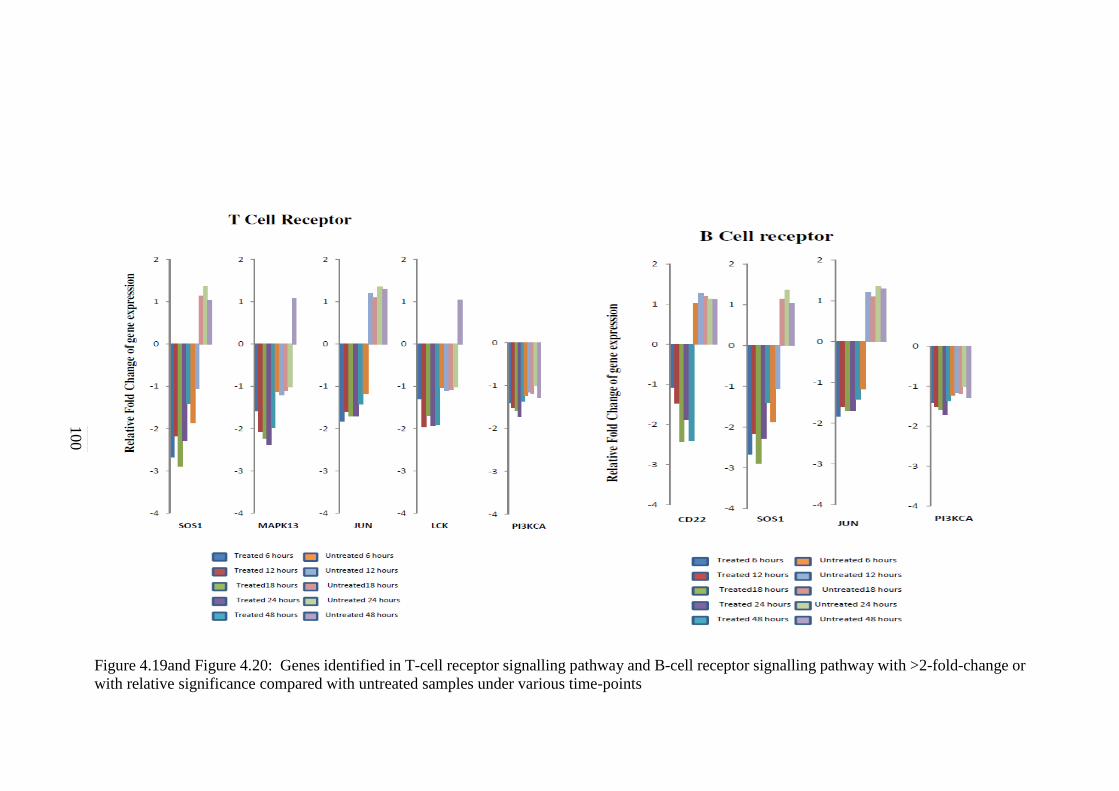
100
Figure 4.19and Figure 4.20: Genes identified in T-cell receptor signalling pathway and B-cell receptor signalling pathway with >2-fold-change or
with relative significance compared with untreated samples under various time-points
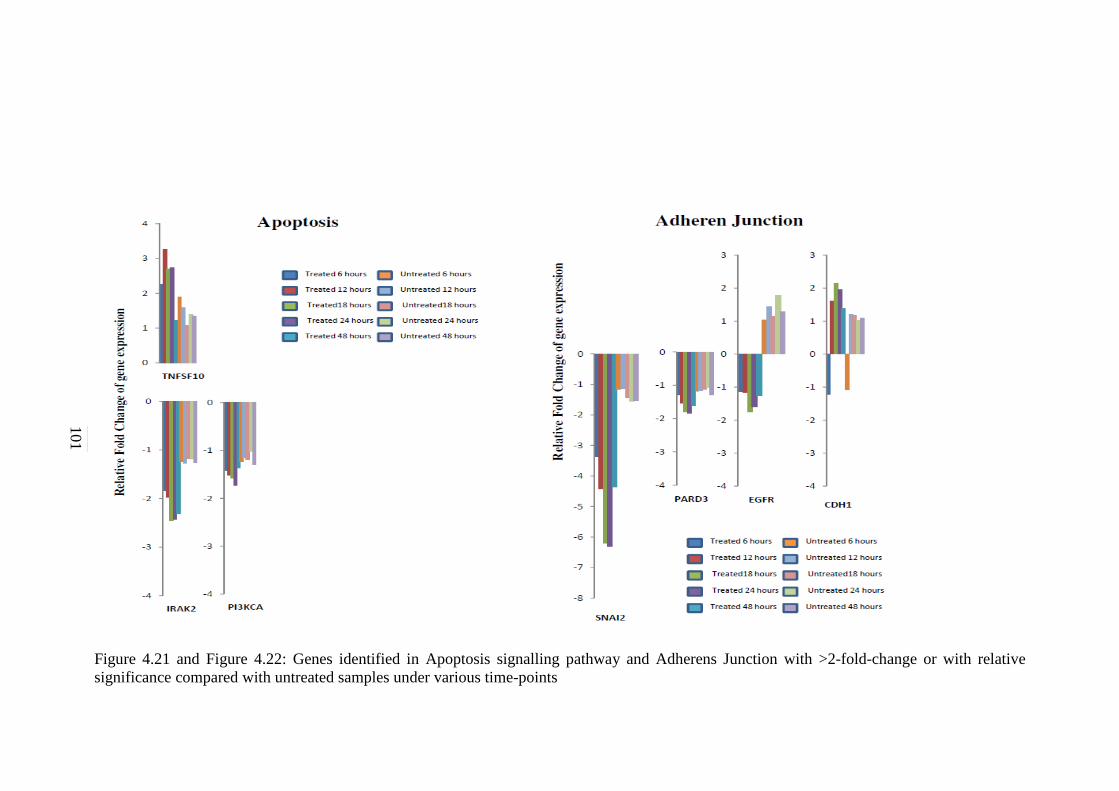
101
Figure 4.21 and Figure 4.22: Genes identified in Apoptosis signalling pathway and Adherens Junction with >2-fold-change or with relative
significance compared with untreated samples under various time-points
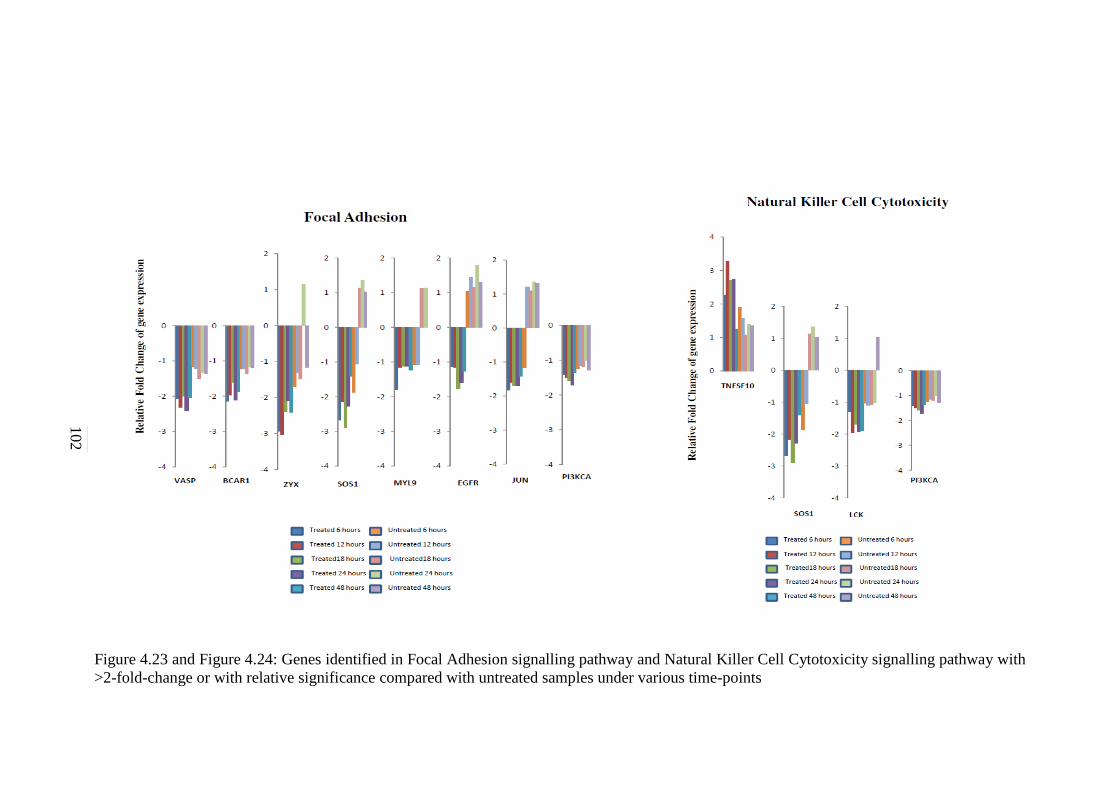
102
Figure 4.23 and Figure 4.24: Genes identified in Focal Adhesion signalling pathway and Natural Killer Cell Cytotoxicity signalling pathway with
>2-fold-change or with relative significance compared with untreated samples under various time-points
103
4.5 Data Validation
4.5.1 Data Validation with Relative Real-time PCR Methodology
Real-time PCR has been widely used as a gold standard for validation of
results obtained from microarrays based experiment. DNA microarrays provide
an unprecedented capacity for whole genome profiling. However, the quality of
gene expression data obtained from microarrays can vary greatly with platform
and procedures used. Quantitative real-time PCR (qRT-PCR) is a commonly
used validation tool for confirmation of gene expression results obtained from
microarray analysis. However, microarray and qPCR data often result in certain
level of disagreement.
Six genes were chosen based on their high fold-change value of
differential expression, their genetic ontology and pathways. Among these, four
significantly up-regulated genes (MAP2K, SKP2, PCY1B, and SLC2A2) and
two significantly down-regulated genes (MMP3, SLC16A6) were selected for
further validation. The mean values of gene expression of the fold-change for
treated samples at different time-points (6, 12, 18, 24, and 48 hours) against the
control group (0 hours) were derived and tabulated in Table 4.27.
The validation of microarray result by qRT-PCR results were carried out
by plotting correlation chart of the gene expression of fold-change of microarray
experiment and qRT-PCR approach (Figure 4.25 and Table 4.28). The
measurement of the correlation value of these six genes has indicated the range
of correlation from relatively acceptable correlation, 0.60, to good correlation,

104
0.947. This showed that the result of the microarray assay was consistent with
the result of the qRT-PCR assay.
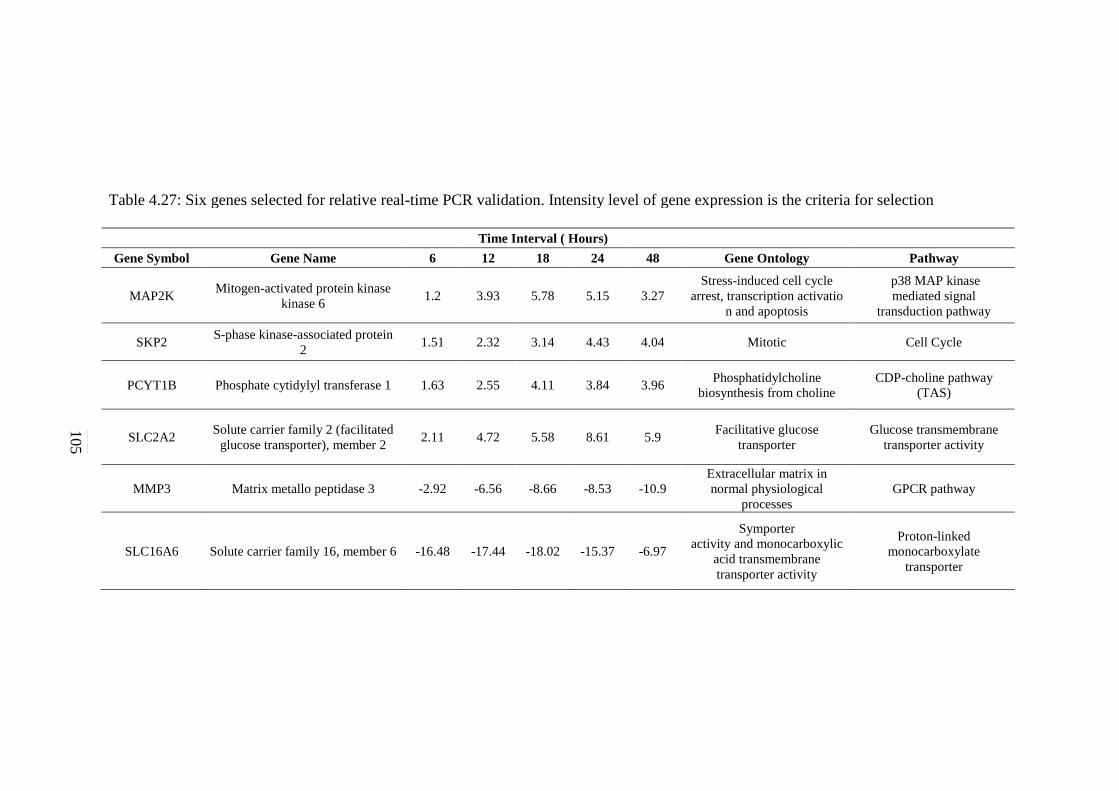
105
Table 4.27: Six genes selected for relative real-time PCR validation. Intensity level of gene expression is the criteria for selection
Time Interval ( Hours)
Gene Symbol Gene Name 6 12 18 24 48 Gene Ontology Pathway
MAP2K Mitogen-activated protein kinase
kinase 6 1.2 3.93 5.78 5.15 3.27
Stress-induced cell cycle
arrest, transcription activatio
n and apoptosis
p38 MAP kinase
mediated signal
transduction pathway
SKP2 S-phase kinase-associated protein
2 1.51 2.32 3.14 4.43 4.04 Mitotic Cell Cycle
PCYT1B Phosphate cytidylyl transferase 1 1.63 2.55 4.11 3.84 3.96 Phosphatidylcholine
biosynthesis from choline
CDP-choline pathway
(TAS)
SLC2A2 Solute carrier family 2 (facilitated
glucose transporter), member 2 2.11 4.72 5.58 8.61 5.9
Facilitative glucose
transporter
Glucose transmembrane
transporter activity
MMP3 Matrix metallo peptidase 3 -2.92 -6.56 -8.66 -8.53 -10.9
Extracellular matrix in
normal physiological
processes
GPCR pathway
SLC16A6 Solute carrier family 16, member 6 -16.48 -17.44 -18.02 -15.37 -6.97
Symporter
activity and monocarboxylic
acid transmembrane
transporter activity
Proton-linked
monocarboxylate
transporter
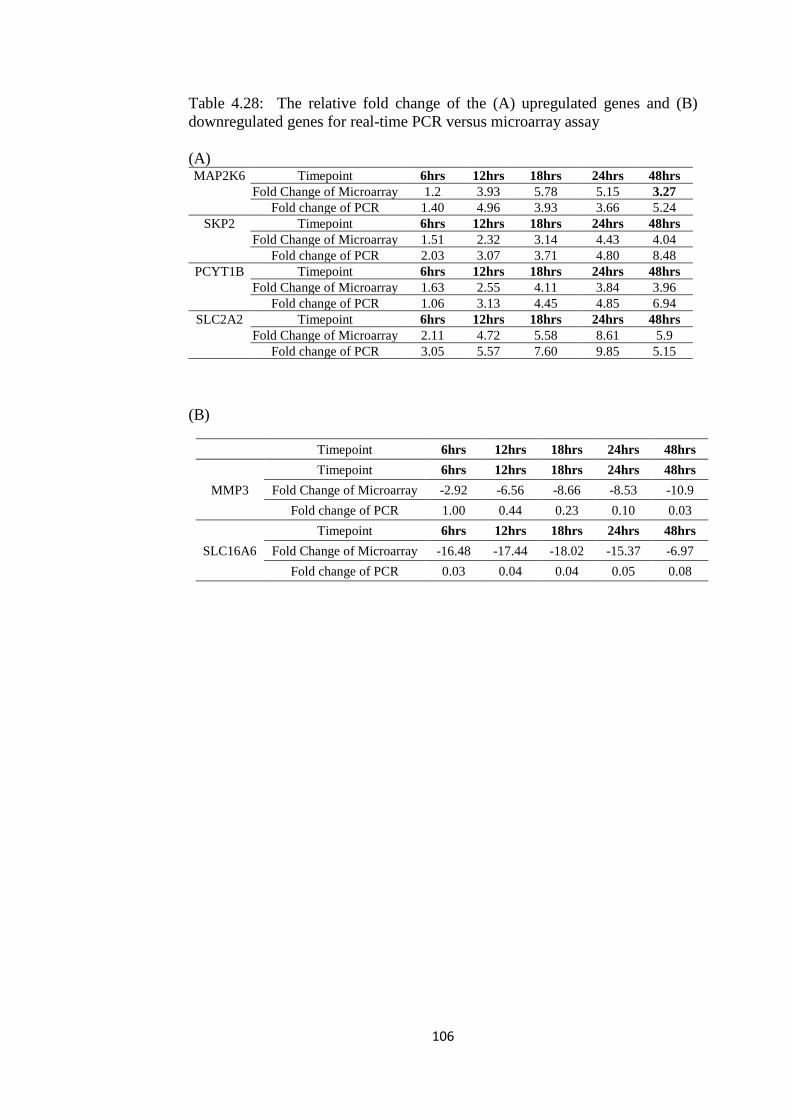
106
Table 4.28: The relative fold change of the (A) upregulated genes and (B)
downregulated genes for real-time PCR versus microarray assay
(A) MAP2K6 Timepoint 6hrs 12hrs 18hrs 24hrs 48hrs
Fold Change of Microarray 1.2 3.93 5.78 5.15 3.27
Fold change of PCR 1.40 4.96 3.93 3.66 5.24
SKP2 Timepoint 6hrs 12hrs 18hrs 24hrs 48hrs
Fold Change of Microarray 1.51 2.32 3.14 4.43 4.04
Fold change of PCR 2.03 3.07 3.71 4.80 8.48
PCYT1B Timepoint 6hrs 12hrs 18hrs 24hrs 48hrs
Fold Change of Microarray 1.63 2.55 4.11 3.84 3.96
Fold change of PCR 1.06 3.13 4.45 4.85 6.94
SLC2A2 Timepoint 6hrs 12hrs 18hrs 24hrs 48hrs
Fold Change of Microarray 2.11 4.72 5.58 8.61 5.9
Fold change of PCR 3.05 5.57 7.60 9.85 5.15
(B)
Timepoint 6hrs 12hrs 18hrs 24hrs 48hrs
MMP3
Timepoint 6hrs 12hrs 18hrs 24hrs 48hrs
Fold Change of Microarray -2.92 -6.56 -8.66 -8.53 -10.9
Fold change of PCR 1.00 0.44 0.23 0.10 0.03
SLC16A6
Timepoint 6hrs 12hrs 18hrs 24hrs 48hrs
Fold Change of Microarray -16.48 -17.44 -18.02 -15.37 -6.97
Fold change of PCR 0.03 0.04 0.04 0.05 0.08
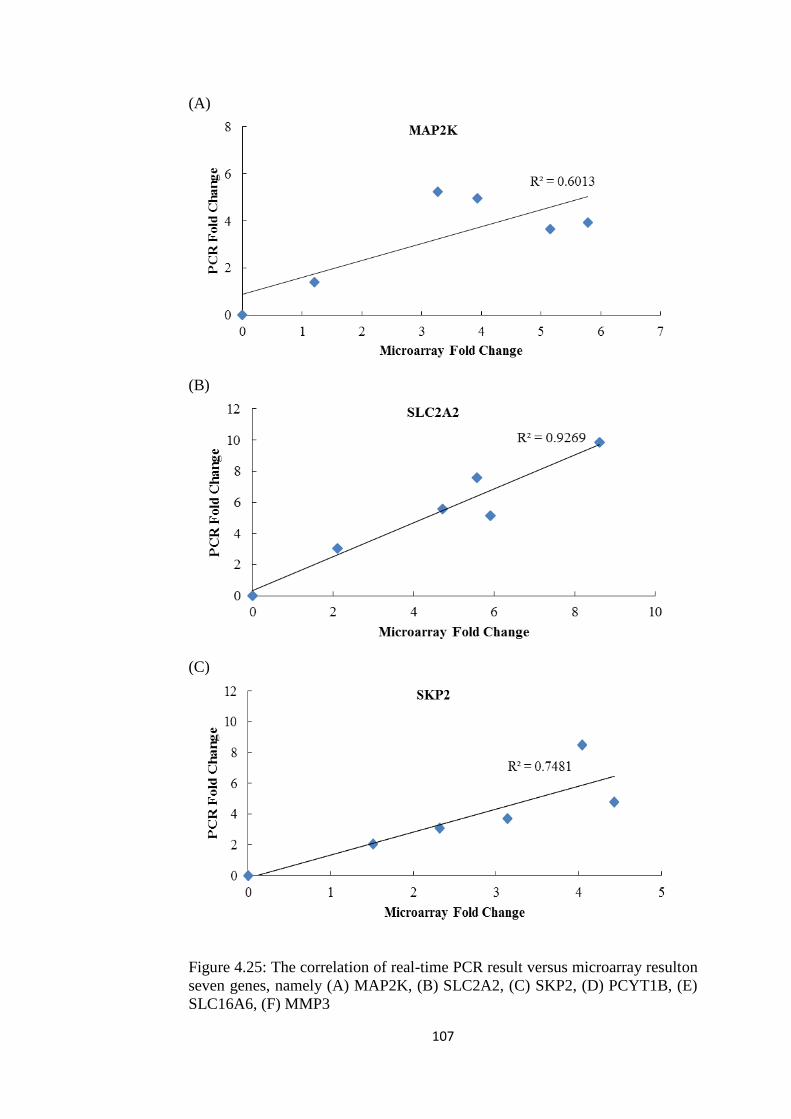
107
(A)
(B)
(C)
Figure 4.25: The correlation of real-time PCR result versus microarray resulton
seven genes, namely (A) MAP2K, (B) SLC2A2, (C) SKP2, (D) PCYT1B, (E)
SLC16A6, (F) MMP3
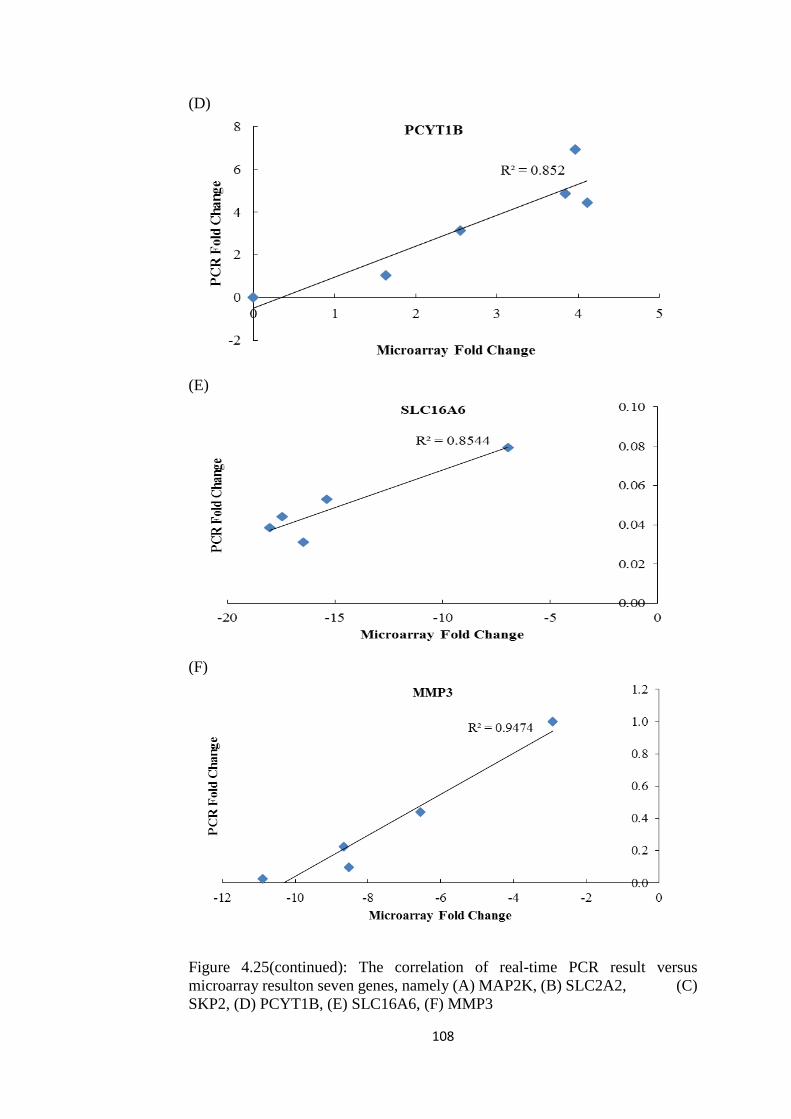
108
(D)
(E)
(F)
Figure 4.25(continued): The correlation of real-time PCR result versus
microarray resulton seven genes, namely (A) MAP2K, (B) SLC2A2, (C)
SKP2, (D) PCYT1B, (E) SLC16A6, (F) MMP3
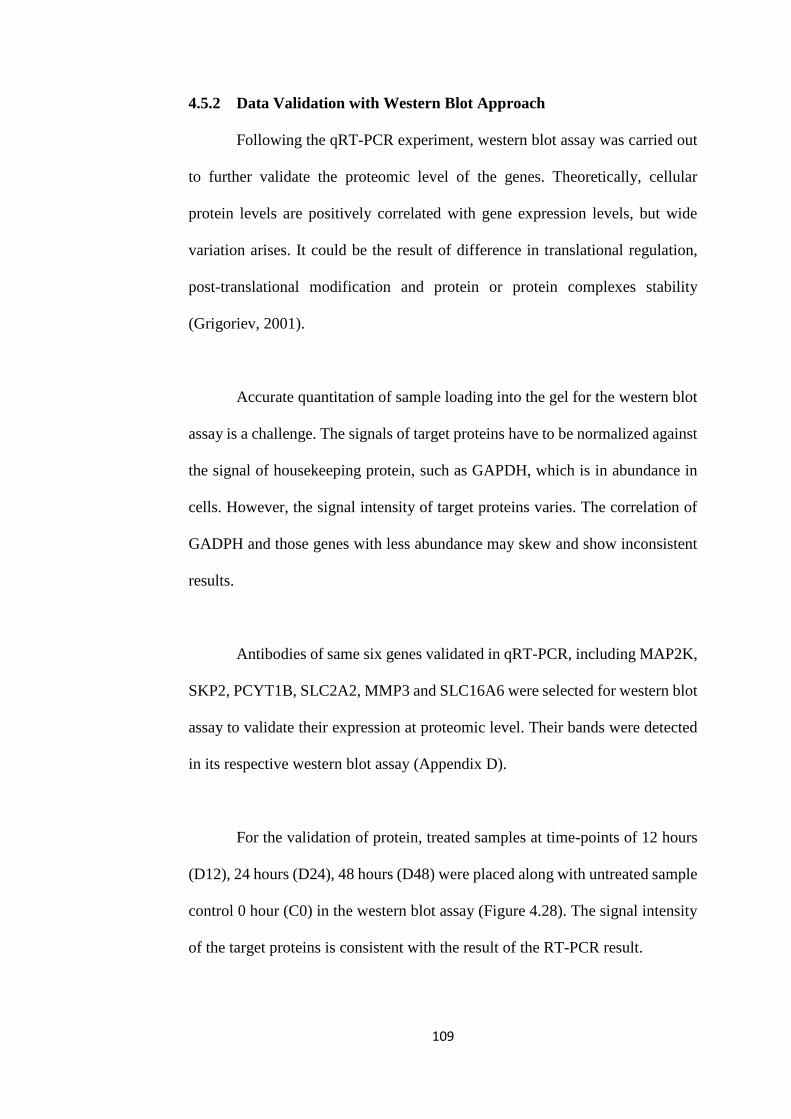
109
4.5.2 Data Validation with Western Blot Approach
Following the qRT-PCR experiment, western blot assay was carried out
to further validate the proteomic level of the genes. Theoretically, cellular
protein levels are positively correlated with gene expression levels, but wide
variation arises. It could be the result of difference in translational regulation,
post-translational modification and protein or protein complexes stability
(Grigoriev, 2001).
Accurate quantitation of sample loading into the gel for the western blot
assay is a challenge. The signals of target proteins have to be normalized against
the signal of housekeeping protein, such as GAPDH, which is in abundance in
cells. However, the signal intensity of target proteins varies. The correlation of
GADPH and those genes with less abundance may skew and show inconsistent
results.
Antibodies of same six genes validated in qRT-PCR, including MAP2K,
SKP2, PCYT1B, SLC2A2, MMP3 and SLC16A6 were selected for western blot
assay to validate their expression at proteomic level. Their bands were detected
in its respective western blot assay (Appendix D).
For the validation of protein, treated samples at time-points of 12 hours
(D12), 24 hours (D24), 48 hours (D48) were placed along with untreated sample
control 0 hour (C0) in the western blot assay (Figure 4.28). The signal intensity
of the target proteins is consistent with the result of the RT-PCR result.
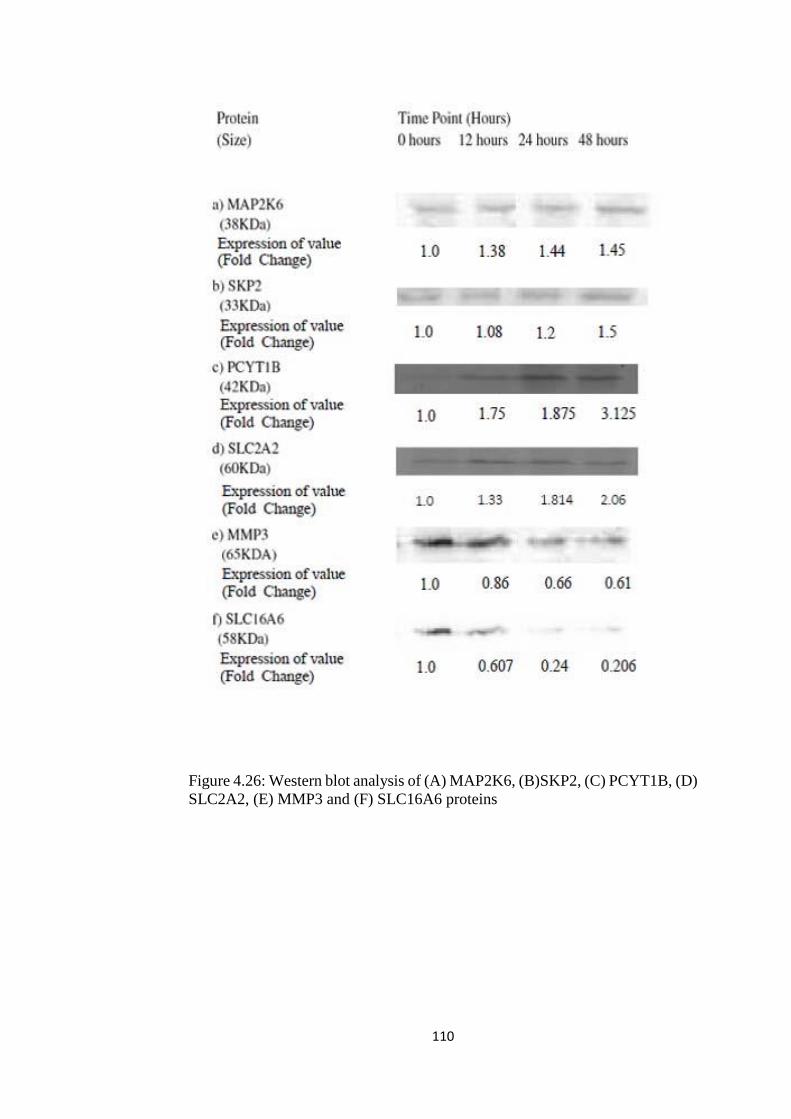
110
Figure 4.26: Western blot analysis of (A) MAP2K6, (B)SKP2, (C) PCYT1B, (D)
SLC2A2, (E) MMP3 and (F) SLC16A6 proteins
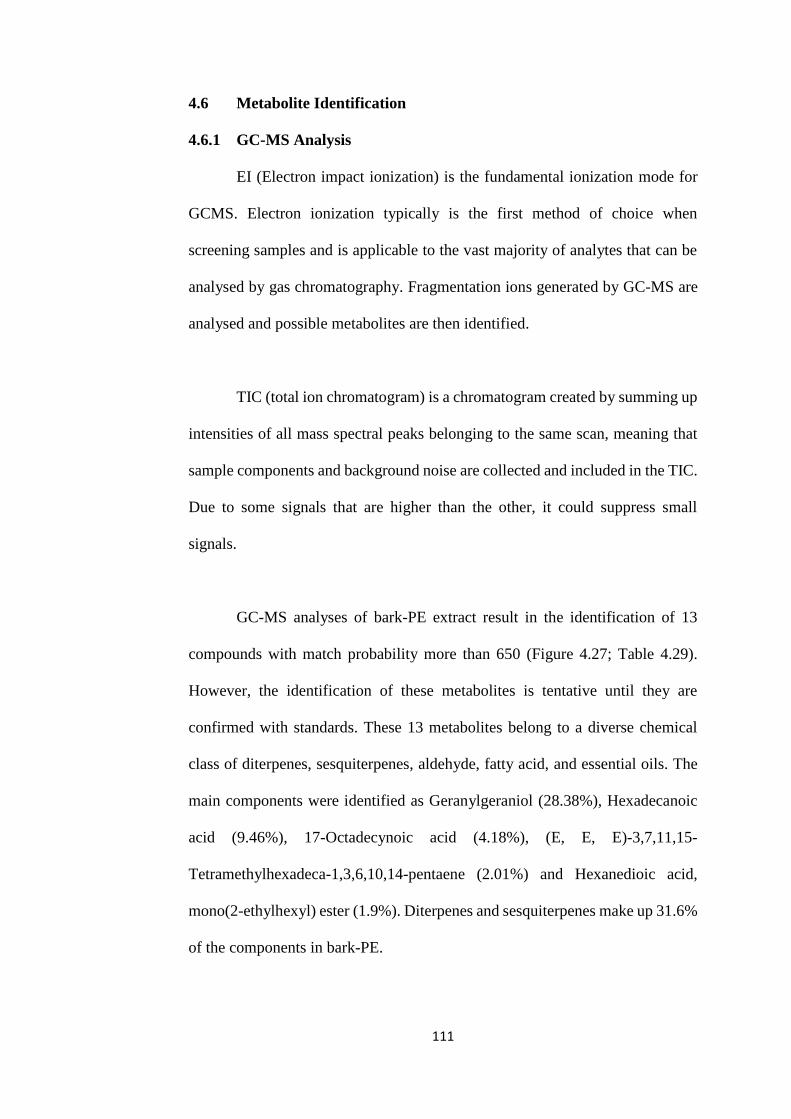
111
4.6 Metabolite Identification
4.6.1 GC-MS Analysis
EI (Electron impact ionization) is the fundamental ionization mode for
GCMS. Electron ionization typically is the first method of choice when
screening samples and is applicable to the vast majority of analytes that can be
analysed by gas chromatography. Fragmentation ions generated by GC-MS are
analysed and possible metabolites are then identified.
TIC (total ion chromatogram) is a chromatogram created by summing up
intensities of all mass spectral peaks belonging to the same scan, meaning that
sample components and background noise are collected and included in the TIC.
Due to some signals that are higher than the other, it could suppress small
signals.
GC-MS analyses of bark-PE extract result in the identification of 13
compounds with match probability more than 650 (Figure 4.27; Table 4.29).
However, the identification of these metabolites is tentative until they are
confirmed with standards. These 13 metabolites belong to a diverse chemical
class of diterpenes, sesquiterpenes, aldehyde, fatty acid, and essential oils. The
main components were identified as Geranylgeraniol (28.38%), Hexadecanoic
acid (9.46%), 17-Octadecynoic acid (4.18%), (E, E, E)-3,7,11,15-
Tetramethylhexadeca-1,3,6,10,14-pentaene (2.01%) and Hexanedioic acid,
mono(2-ethylhexyl) ester (1.9%). Diterpenes and sesquiterpenes make up 31.6%
of the components in bark-PE.
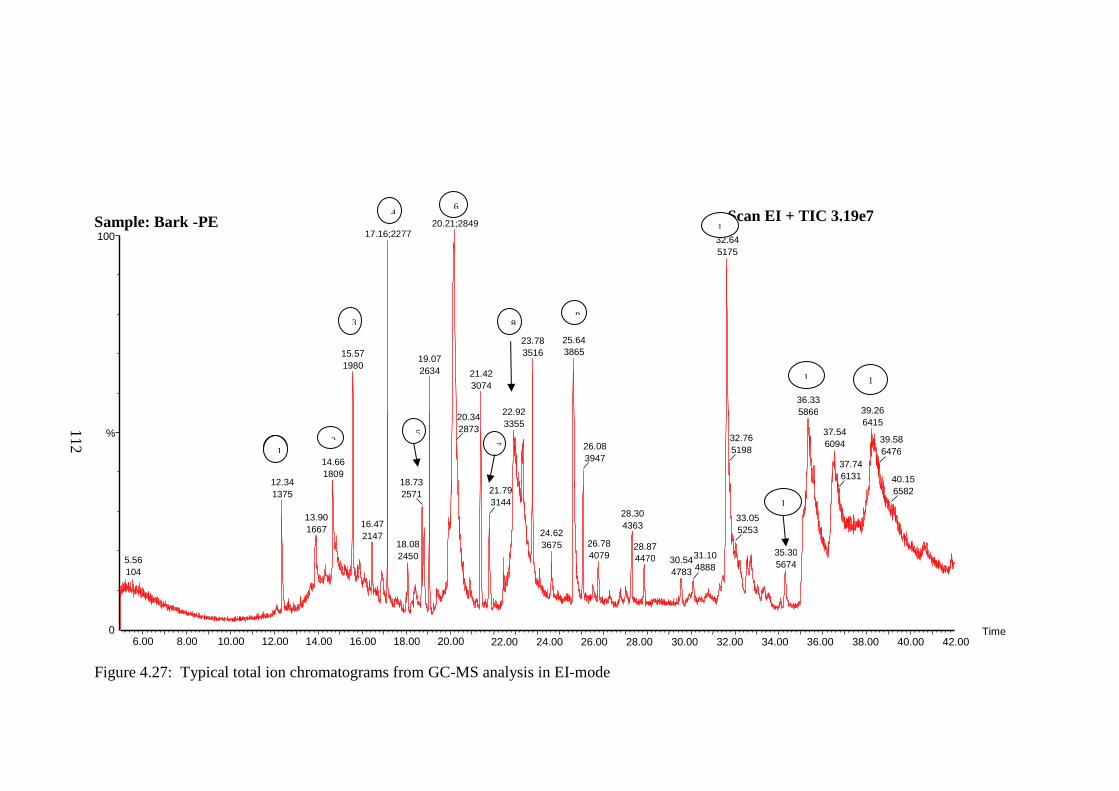
112
Figure 4.27: Typical total ion chromatograms from GC-MS analysis in EI-mode
Scan EI + TIC 3.19e7
6.00 8.00 10.00 12.00 14.00 16.00 18.00 20.00 22.00 24.00 26.00 28.00 30.00 32.00 34.00 36.00 38.00 40.00 42.00 Time 0
100
%
Sample: Bark -PE
20.21;2849 17.16;2277
15.57 1980
14.66 1809
12.34 1375
5.56 104
13.90 1667 16.47
2147
19.07 2634
18.73 2571
18.08 2450
32.64 5175
25.64 3865
23.78 3516
21.42 3074
20.34 2873
22.92 3355
21.79 3144
24.62 3675
26.08 3947
28.30 4363
26.78 4079
28.87 4470 30.54
4783 31.10 4888
36.33 5866
32.76 5198
33.05 5253
35.30 5674
39.26 6415
37.54 6094
37.74 6131
39.58 6476
40.15 6582
1 2
3
1
4
5
6
7
8
1
3
1
2
1
1
1
9
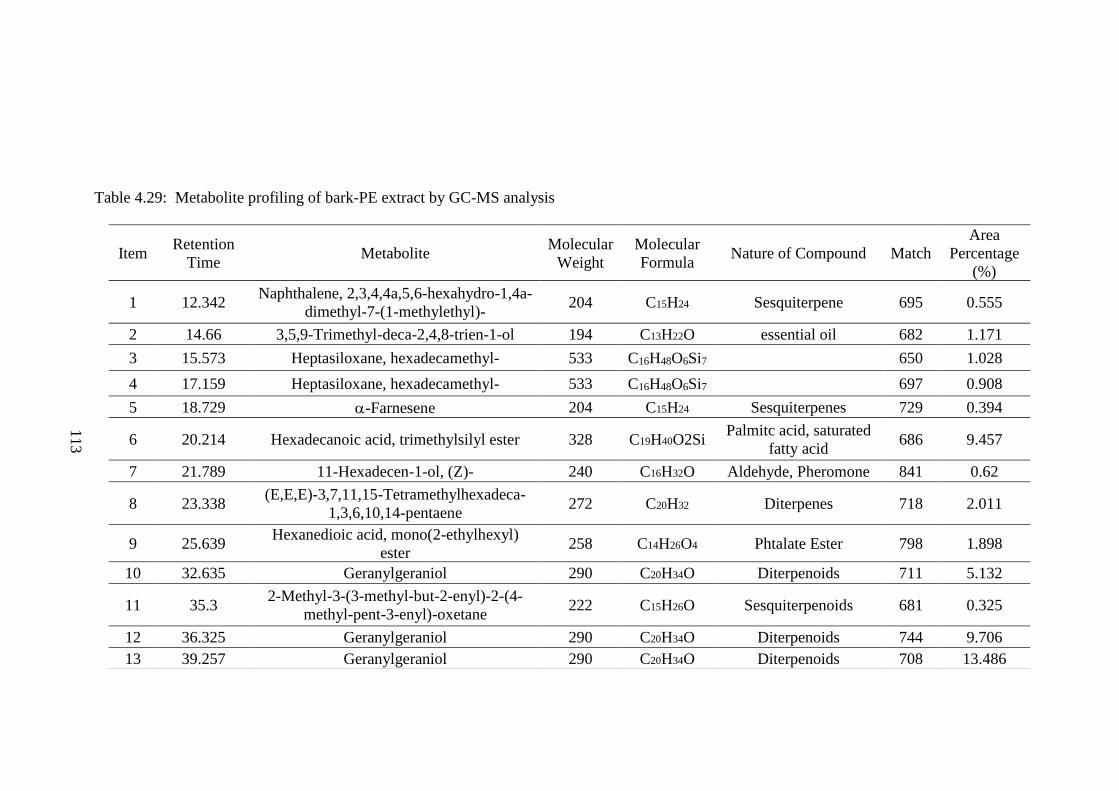
113
Table 4.29: Metabolite profiling of bark-PE extract by GC-MS analysis
Item Retention
Time Metabolite
Molecular
Weight
Molecular
Formula Nature of Compound Match
Area
Percentage
(%)
1 12.342 Naphthalene, 2,3,4,4a,5,6-hexahydro-1,4a-
dimethyl-7-(1-methylethyl)- 204 C15H24 Sesquiterpene 695 0.555
2 14.66 3,5,9-Trimethyl-deca-2,4,8-trien-1-ol 194 C13H22O essential oil 682 1.171
3 15.573 Heptasiloxane, hexadecamethyl- 533 C16H48O6Si7 650 1.028
4 17.159 Heptasiloxane, hexadecamethyl- 533 C16H48O6Si7 697 0.908
5 18.729 -Farnesene 204 C15H24 Sesquiterpenes 729 0.394
6 20.214 Hexadecanoic acid, trimethylsilyl ester 328 C19H40O2Si Palmitc acid, saturated
fatty acid 686 9.457
7 21.789 11-Hexadecen-1-ol, (Z)- 240 C16H32O Aldehyde, Pheromone 841 0.62
8 23.338 (E,E,E)-3,7,11,15-Tetramethylhexadeca-
1,3,6,10,14-pentaene 272 C20H32 Diterpenes 718 2.011
9 25.639 Hexanedioic acid, mono(2-ethylhexyl)
ester 258 C14H26O4 Phtalate Ester 798 1.898
10 32.635 Geranylgeraniol 290 C20H34O Diterpenoids 711 5.132
11 35.3 2-Methyl-3-(3-methyl-but-2-enyl)-2-(4-
methyl-pent-3-enyl)-oxetane 222 C15H26O Sesquiterpenoids 681 0.325
12 36.325 Geranylgeraniol 290 C20H34O Diterpenoids 744 9.706
13 39.257 Geranylgeraniol 290 C20H34O Diterpenoids 708 13.486
114
CHAPTER 5
DISCUSSION
5.1 Properties of Cancer Cells
During the last few decades, research has revealed that cancer is a
dynamic disease involving changes in the genome. Advancement in technology
allows researchers to have a better understanding of the pathogenesis of cancer
in a precise and prompt manner.
Normal cell grows and divides to make a new cell. It dies in an orderly
manner if any attempt to repair the damaged DNA fails. However, cancer cell
does not die like it should. It could grow in a tremendous manner through a
multistep, mutagenic process(Barrett, 1993). Its limitless replicative potential,
self-sufficiency in growth signal, insensitivity to anti-growth signals and evasion
of apoptosis allow it to proliferate and avoid being killed.
Its capability of forming new blood vessels, known as angiogenesis,
allows its access to oxygen, nutrients and waste disposal. For cancer cell to grow,
an angiogenic gene may be activated to make normally quiescent vasculature to
continually expand new blood for the growth of tumour(Hanahan and Folkman,
1996).
115
Angiogenesis is critical for cancer development. Tumour cells need
oxygen and nutrients for survival and proliferation. In order to get the adequate
supply of oxygen and nutrients, they need to be within 100-200 m from blood
vessels(Carmeliet and Jain, 2000). For solid tumours smaller than 1-2 mm3, the
blood vessels are not established or vascularized. However, for those beyond the
critical volume of 2 mm3, new blood vessels are established to supply oxygen
and nutrients and remove metabolic wastes (Hawkins, 1995).
This ultimately also leads the cell to metastasize to the distal part of the
body. It evades immune detection, survive and proliferate. Cancer cell acquires
a competitive advantage by gene mutation in order to grow faster, survive longer
and produce more offspring than the normal cell. These genetic alterations
involve the gain-of-function mutation, amplification, or overexpression of key
oncogenes together with the loss-of-function mutation, deletion, or epigenetic
silencing of key tumour suppressors. Despite the difficulties, many of the genes
that are repeatedly mutated in human cancers have been identified over the last
few decades. It has reached a common understanding that cancer is caused by
some corrupted cellular genes, known as oncogenes, to survive longer than it
should and proliferate aberrantly. The genesis and progression of a tumour are
further complicated by inactivation of some identified tumour suppressor genes.
These genes act to prevent any aberrant cell growth and survival or genomic
instability. This inactivation could be caused by gene deletion, inactivating
mutation, or epigenetic silencing, which results in the removal of restraints,
leading to tumorigenesis (Hanahan and Weinberg, 2011).
116
The stochastic accumulation of these genetic alterations in cancer-critical
genes, including oncogenes and tumour suppressors, progressively contribute to
the evolution of cancer from a benign expansion of cells to an invasive and
metastatic tumour. The discovery of these cancer-critical geneses of great
clinical interest is target for cancer therapeutics. The inhibition of these
oncogenes can lead to tumour cell death, differentiation, arrest, or senescence.
The results of this cancer therapeutics have been encouraging. It includes the
successful imatinib or Gleevec for the protein kinase oncogenes BCR-ABL,
Gefitinib and Erlotinib for EGFR and Trastuzumab for Her2 (Roberts and Der,
2007; Sharma and Settleman, 2007; Luo et al., 2009).
Germline mutations in tumour suppressor genes p53 and Rb leave
affected individual, particularly susceptible to the development of cancers by
reducing the number of somatic mutations required for a cell to become
malignant(Thomas and Balan, 2012). Scientists have been exploring to
reintroduce tumour suppressor genes into a tumour, leading to tumour
regression. However, the effort in restoring in these genes is still lagging behind
the study in oncogenes due to its difficulty(Luo et al., 2009).
Any possible cure of cancer must show differential toxicity toward
cancer cells relative to normal cells. Cancer evolves from the stepwise
accumulation of genetic aberration. Despite the multitude of genetic and
epigenetic alteration in cancers, its growth and survival can be implicated by the
gain of single oncogene or loss of single tumour suppressor. These unique
properties of cancer cells not shared by normal cells could be explored for their
117
detriment. Bernard Weinstein described this as oncogene addiction, which
would have the tumour maintenance depended on the continued activity of
certain oncogene or loss of certain tumour suppressor gene (Weinstein, 2002).
In principle, cancer cells can be induced to undergo apoptosis, necrosis,
senescence, or differentiation leading to its demise. Cancer cells have the
capabilities of rewiring pathways for growth and survival that underlie the
malignant phenotype. Any successful therapy is to identify the critical nodes in
the oncogenic network, which will lead to its cessation of the tumorigenesis. This
provides cues for molecular targeted therapy in cancers (Weinstein and Joe,
2006).
5.2 Cytotoxic effects of CCL on HepG2 and its Regulation on Cancer
Pathways
To determine the significantly regulated pathways, the genes obtained in
this study were mapped to the Kyoto Encyclopaedia of Genes and Genomes
(KEGG) pathways. The bark-PE extract used in this study showed a differential
gain or loss of expression upon HepG2 cells relative to untreated HepG2 at time-
points of 0, 6, 12, 18, 24 and 48 hours.
Various pathways were confirmed based on KEGG pathways in the
DAVID Bioinformatic Tool, where its functional annotation tool identified the
KEGG pathways showing an enrichment or loss of these genes and the
probability of that pathway was significantly regulated.
118
5.2.1 p53 Signalling Pathway
Stresses, both intrinsic and extrinsic to the cell, can act upon the p53
pathway (Appendix C-1). p53 is the major cellular stress responder for intrinsic
stress signals while NF-B is the major stress responder for extrinsic stress
signals, such as infectious diseases, cytokine signals, etc., activating the genes
of the innate and adaptive immune responses (Lane and Levine, 2010). p53
pathway oversees the DNA replication, chromosome segregation and cell
division. The integrity of the DNA is affected by stresses, such as Gamma or UV
irradiation, alkylation of bases, depurination of DNA or its reaction with
oxidative free radicals. In response to these stresses, the genes and its products
in the cascades of p53 pathway are activated by post-translational modifications,
leading to cell cycle arrest which induces cell senescence or cellular apoptosis
(Vogelstein et al., 2000; Harris and Levine, 2005).
Metastasis of cancer, the migration of its cell from one organ to another
distant organ, is related to the poor prognosis of various cancers. This cellular
migration involves the complex barrier changes by interactions of structural
components of the extracellular matrix (ECM) and surface binding element,
namely integrins. It is noted that several proteases and protease inhibitors,
including plasminogen activator inhibitor type-1 (PAI-1) or Serpine1, urokinase
plasminogen activator (µPA) interact with several cell surface receptors, like
µPA receptor (µPAR) and transduce intracellular signals that significantly affect
other proliferative pathways (Czekay et al., 2011).
119
Plasminogen activator inhibitors (PAIs) are classified as a subgroup of
the serine protease inhibitor (serpine) superfamily. It may have a role in
regulating tumour invasion, angiogenesis and metastasis. The overexpression of
PAI-1 together with µPA, µPAR were found in HCC compared with those of
cancer-adjacent tissue and normal liver tissue. This suggests that the increased
PAI-1in HCC is related to the invasiveness, metastasis, and prognosis of HCC
(Zheng et al., 2000). It concurs with Czekay that the deficiencies in PAI-1 levels
correlate with significantly reduced epithelial cell migration and tumour
progression (Czekay et al., 2011). The down-regulations of PAI-1were observed
across all the time-points of extract-treated HepG2 compared with time-points
of untreated HepG2 in this study (Table 4.5; Figure 4.3). The high negative fold
changes in all time-points of extract-treated HepG2 indicated that growth of
HepG2 was suppressed significantly.
Sestrins are part of the antioxidant defence system. It helps inhibit cell
proliferation and suppress mTOR activity in the liver following genotoxic and
ER stress. The appearance of cancer cells triggers the expression of antioxidant
proteins. Studies showed that active RAS oncogene downregulates SESN1 and
SESN3 (Budanov and Karin, 2008; Lee et al., 2013). In this study, the significant
up-regulations of SESN3 were observed across all the time-points of extract-
treated HepG2 compared with time-points of untreated HepG2 (Table 4.5;
Figure 4.3), while SESN1 showed relatively higher fold changes (<2) in all time-
points of extract-treated HepG2 indicated that growth of HepG2 was suppressed
significantly.
120
Study has shown that SESN2 activates p21 network and regulates
hepatocyte proliferation and tumour development in mice with liver injury
(Buitrago-Molina et al., 2013). The down-regulation of SESN2 in all time-
points of the extract-treated HepG2 indicated its suppression effect on the growth
of HepG2 (Table 4.5; Figure 4.3).
5.2.2 Cell Cycle Signalling Pathway
All cancers share the common characteristic of a disordered cell cycle
that is characterized by rapid and uncontrolled cell growth. Thus, targeting the
molecules that regulate the cell cycle has become a major thrust in the
development of anticancer therapeutics (Toogood, 2002) (Appendix C-2).
Overexpression or amplification of SKP2 has been documented in
various human cancers, including HCC, prostate cancer, breast cancer,
lymphoma, small cell lung cancer, oral squamous cell carcinoma, and colorectal
carcinoma. It correlates with their poor prognosis. This suggests that SKP2 may
be associated with the growth and expansion of tumour cells (Gstaiger et al.,
2001; Zhang et al., 2003; Huang et al., 2005; Calvisi et al., 2009). SKP2 is a
downstream effector of multiple pathways, including H-Ras, AKT, JAK/STAT,
and Wnt/-catenin, which are commonly seen in human hepatocarcinogenesis
(Thorgeirsson and Grisham, 2002). It is believed that its up-regulation may
positively associate with cellular transformation and tumour progression.Study
has shown that HBx selectively binds to SKP2, in which SKP2 substrate proteins
may be the natural targets of HBV during viral infection (Kalra and Kumar,
121
2006). Therefore, SKP2 may be a therapeutic target for HBV-related HCC
(Huang et al., 2011).The increased expression of SKP2 was noticed across all
time-points for extract-treated HepG2 compared with untreated HepG2 (Table
4.6; Figure 4.4). This indicated that the extract induced proliferation and
accelerated the division of the HepG2 cells.
SKP2 is associated with the down-regulation of cell cycle regulators,
including CCKN1A (p21WAF1/CIP1) during HCC pathogenesis. CCKN1A,
cyclin kinase inhibitor, is an important regulator of cell cycle progression and
proliferation. It is down-regulated in HCC and its deficiency can cooperate with
other oncogenic mutations to enhance carcinogenesis (Calvisi et al., 2009).On
the contrary, study of Marhenke et al (2014) has shown that loss of CCKN1A
delays tumour development in the liver and expression of CCKN1A in HCC is
associated with shorter survival (Marhenke et al., 2014). CDKN2B (P15),cyclin-
dependent kinase inhibitor, was found to be downregulated in the cancerous
tissues in most of HCC (Qin et al., 2004). In this study, the down-regulations of
the CCKN1A and CCKN2B were observed across all the treated HepG2 cell line
at all time-points compared with time-points of untreated HepG2 (Table 4.6;
Figure 4.4). The downregulation of CCKN2B may suggest that proliferation of
HepG2 cells was not suppressed.
Defects in the growth arrest DNA damage-inducible gene 45 (GADD45)
pathway can be related to the initiation and progression of malignancies. In a
study done by Qiu et al. (2003), the expression of GADD45β in HCC as well as
HepG2 and Hep3B was down-regulated while other cancer tissues, including
122
colon cancer, breast cancer, prostate cancer, squamous cell cancer, and
lymphoma were strongly stained. This may suggest that decreased expression of
GADD45β is specific to HCC (Qiu et al., 2003). Similarly, the decreased
GADD45β expression is seen in those infected by hepatitis C virus, and is
associated with hyper-methylation of the GADD45β promoter upon viral
infection (Higgs et al., 2010).
In cancer cells, the activation of GADD45 proteins induces pro-apoptotic
pathways. While in some normal cell lines, GADD45 proteins play a role in pro-
survival pathways. The main target of GADD45-mediated cell cycle arrest is
CDK1/Cyclin B1 complex, a guard for the G2/M checkpoint. This cell cycle
arrest leads to a reduced cell proliferation rate, in both normal and cancer cells
without evidence of apoptosis inductions (Jin et al., 2002). Down-regulation of
GADD45 genes may be related to methylation of its promoter region, which
contribute to the alteration in its expression. Targeting this process is the anti-
cancer mechanism used by chemotherapeutic drugs (Tamura et al., 2012).
In studies of Alexey et al, GADD45 may have dual roles in apoptosis and
cell survival. The excessive DNA damage beyond a certain threshold may trigger
apoptosis. GADD45 proteins exert a pro-apoptotic function for irreparable
damage while the GADD45α and GADD45β proteins act as anti-apoptotic agents
for moderate DNA damage and increase hematopoietic cell survival under UV-
irradiation or treatment with certain chemotherapeutic drugs (Moskalev et al.,
2012). The significant down-regulations of GADD45β were observed across all
123
the time-points of extract-treated HepG2 compared with time-points of untreated
HepG2 in this study (Table 4.6; Figure 4.4).
Stratifin (SFN or 14-3-3) plays an active role in different steps of cancer
development. It regulates many cellular processes in cancer biology, including
apoptosis and cell cycle checkpoints. 14-3-3σ is one of seven human 14-3-
3 genes that only show induction after DNA damage. Transcriptional expression
of 14-3-3σ is directly activated by the p53 tumour suppressor protein. This p53-
mediated induction of 14-3-3σ is essential for the maintenance of a stable G2/M
arrest after DNA damage (Samuel et al., 2001).However, the expression of 14-
3-3σ is down-regulated by CpG methylation in several types of human cancer,
including prostate, lung, breast and several types of skin cancer (Yang et al.,
2003; Lodygin and Hermeking, 2006). It is also reported that hyper-methylation
and the resulting loss of expression of the 14-3-3σ gene are the most common
abnormalities in HCC. This gives the cue in its role in the development and
progression of HCC (Iwata et al., 2000). On contrary to earlier reports, the
studies done by Liu et al. (2014) indicate that 14-3-3σ overexpression promotes
tumour progression in HCC (Chen et al., 2010; Liu et al., 2014). These results,
suggesting a “bipolar” role for 14-3-3σ. The significant down-regulations of SFN
were significantly observed across all the time-points of extract-treated HepG2
compared with time-points of untreated HepG2 in this study (Table 4.6; Figure
4.4).
124
WEE1 kinase is one of the key proteins in maintaining G2 arrest for DNA
repair. Damaged normal cells are repaired during G1-arrest, while cancer cells
may rely on G2-arrest, due to its deficiency in G1-arrest. Besides overexpressed
in advanced HCC compared with noncancerous cirrhotic tissue, WEE1 is also
overexpressed in various cancer types (Masaki et al., 2003; Lee et al., 2011).
WEE1 silencing significantly increases the expression of p53 and p21 in WEE1-
deficient HepG2 cells and subsequently lead to cell cycle arrest and induction of
apoptosis (Lee et al., 2011). The down-regulations of WEE1 were observed
across all the time-points of extract-treated HepG2 compared with time-points
of untreated HepG2 in this study (Table 4.6; Figure 4.4). This may suggest that
the extract has suppressed the proliferation of HepG2. The RBL1 gene is a
known tumour suppressor protein which regulates cell cycle. The up-regulations
of RBL1 were significantly observed across all the time-points of extract-treated
HepG2 compared with time-points of untreated HepG2 in this study (Table 4.6;
Figure 4.4). This may suggest that the extract has suppressed the proliferation
of HepG2.
Cell division cycle 25 homolog phosphatases (CDC25) are important
activators of the Cdk/cyclins. Its isoform, CDC25A controls both the G1-to-S
and G2-to-M transitions, whereas CDC25B and CDC25C are regulators of the
G2-to-M transition. Over-expressions of CDC25A and CDC25B, are often
associated with malignant tumours with poorer prognosis (Kristjansdottir and
Rudolph, 2004). CDC25B is highly regulated by phosphorylation via several
protein kinases in different pathways, including AKT, CDK/cyclin, p38, which
in turn regulate CDC25B activity. It was identified as one of most significantly
125
overexpressed genes in HCC compared with non-tumour liver (Yan et al., 2008).
The down-regulations of CDC25B were observed across all the time-
points of extract-treated HepG2 compared with time-points of untreated HepG2
in this study (Table 4.6; Figure 4.4). This may suggest that the extract has
inhibited the growth of HepG2.
CDC6 and CDC7 are essential regulators of DNA replication. CDC6 is
upregulated during the G1 phase of the cell cycle while CDC7 is upregulated
during S phase. Overexpression of CDC6 and CDC7 may indicate the
progression of the tumour. The significant up-regulations of CDC6& CDC7
were observed across all the time-points of extract-treated HepG2 compared
with time-points of untreated HepG2 in this study (Table 4.6; Figure 4.4). This
may suggest that the extract has promoted the proliferation of HepG2.
The role of CCNE2 on HCC is not known although high level of
expression of CCNE2 in many cancers (Sieuwerts et al., 2006). In this
experiment, the up-regulations of CCNE2 were observed across all the time-
points of extract-treated HepG2 compared with time-points of untreated HepG2
(Table 4.6; Figure 4.4).
5.2.3 Hedgehog Signalling Pathway
The Hedgehog (Hh) signalling pathway plays important role in
embryonic development (Appendix C-3). However, studies also show that it has
been involved in the development of multiple malignancies (Lappano and
Maggiolini, 2012).
126
In the absence of Hh ligand, Hh receptor Patched (Ptch) keeps down the
activity of Smoothened (SMO), G-protein-coupled receptors. Following Hh
ligand binding to Ptch, the repression of SMO is released and the downstream
transcription factors, including glioma-associated oncogene homologue (Gli),
are stimulated (Merchant and Matsui, 2010).The overexpression of Hh ligands
has been identified in tumours. This suggests its role in cell proliferation and
survival. The Hh signalling pathway also interacts with other signalling
pathways commonly implicated in human cancers, such as PI3K,WNT, and
VEGF (Scales and de Sauvage, 2009; Gupta et al., 2010; Merchant and Matsui,
2010).
Hh signalling is dysregulated in human hepatocarcinogenesis. In studies
by Sicklick et al. (2006) using HCC cell lines (HepG2 and Hep3B) show that
overexpression of both SMO and SMO-mediated c-Myc play critical role in
hepatocarcinogenesis and suggests that SMO is a prognostic factor in HCC
tumorigenesis (Sicklick et al., 2006). The up-regulations of SMO were observed
across all the time-points of extract-treated HepG2 compared with time-points
of untreated HepG2 in this study (Table 4.7; Figure 4.5). This may suggest that
extract may help HepG2 proliferate.
WNT11 was significantly up-regulated in a number of tumours. Up-
regulation of WNT11 might play an important role in human carcinogenesis
through activation of the WNT signalling pathway (Kirikoshi et al., 2001). The
down-regulations of WNT11 were observed across all the time-points of extract-
treated HepG2 compared with time-points of untreated HepG2 (Table 4.7;
127
Figure 4.5). This may suggest that extract help suppress the proliferation of
HepG2.
5.2.4 MAPK Signalling Pathway
Mitogen-activated protein kinases (MAPKs) are a highly-conserved
family of serine/threonine protein kinases involved in a variety of fundamental
cellular processes such as proliferation, differentiation, motility, stress response,
apoptosis, and survival (Appendix C-4). MAPK signalling pathway is a three-
tiered cascade. The extracellular stimuli, including mitogens, cytokines, growth
factors, and environmental stressors activate kinases of MAPKK pathway. They
phosphorylate and in turn activate a downstream MAPK kinase (MAPKK),
which subsequently phosphorylates and activates MAPKs. The classic MAP
kinase family includes extracellular signal-regulated kinases (ERK), c-Jun NH2-
terminal kinases (JNK), and p38-MAP kinases. Among the three MAPKs, ERKs
are activated by the broad range of cytokines and growth factors and play an
important role in cell growth and differentiation. JNKs and p38 MAPKs are
stress-activated MAPKs and mainly activated by pro-inflammatory cytokines,
such as tumour necrosis factor α (TNFα), or other stresses. After activated,
stress-activated MAPKs phosphorylate specific serine/threonine residues of
target substrates and trigger downstream cellular functions, such as cell death,
survival, proliferation, migration, and inflammation (Yan et al., 1994; Xia et al.,
2007; Nakagawa and Maeda, 2012).
MAPK phosphatases (MKPs) are one of the subgroups of DUSPs.
DUSP5, DUSP6 and DUSP8 are known tumour suppressor or negative
128
regulators of MAPK activity (Kidger and Keyse, 2016). In this study, significant
down-regulations of DUSP5, DUSP6 and DUSP8 were observed across all the
time-points of extract-treated HepG2 compared with time-points of untreated
HepG2 (Table 4.8; Figure 4.6). This may suggest that the extract promotes the
proliferation of HepG2.
The ERK pathway is ubiquitous and can be activated by various
receptors, particularly RTKs. Upon docking with the activated receptors, SOS1
and GRB2 activate the small GTPase RAS (HRAS, NRAS and KRAS). All RAS
protein family members belong to a class of protein called small GTPase. RAS
is the most common oncogenes in human cancer. Activated RAS activates
several downstream effectors, such as serine–threonine kinase RAF-1,
phosphoinositide 3′-kinase (PI3K), and RalGDS. These downstream effectors in
turn activate several signalling cascades, leading to activation of certain genes
which is favourable for cancer growth, including growth factors like
transforming growth factor-α and vascular endothelial growth factor (VEGF)
(Adjei, 2001).RAF-1 in turn activates the ERK pathway. Studies show that
MAPK/ERK was upregulated in human HCC. However, EGFR triggers the
activation on RAS, which in turn, activates this RAF-MAPK-ERK. ERK
activation, in turn, also promotes upregulated expression of EGFR ligands,
promoting an autocrine growth loop critical for tumour growth. Thus, the EGFR-
RAS-RAF-MEK-ERK signalling network has been the focus of research for
cancer treatment (Roberts and Der, 2007). The obvious down-regulations of
SOS1 were observed across all the time-points of extract-treated HepG2
compared with time-points of untreated HepG2 in this study (Table 4.8; Figure
129
4.6). It may suggest that extract induced apoptosis in HegG2. However, the role
of RRAS in cancer was not widely studied. The down-regulations of RRAS were
observed across all the time-points of extract-treated HepG2 compared with
time-points of untreated HepG2 in this study (Table 4.8; Figure 4.6).
HCCs show lower p38 MAPK and MKK6 activity than non-tumorigenic
tissues supporting the observation that increased p38 MAPK activity induces
apoptosis in hepatoma cell lines (Iyoda et al., 2003; Min et al., 2011). This
suggests that diminished p38 MAPK and MKK6 activities may account for the
resistance to apoptosis, leading to unrestricted cell growth of human HCC (Koul
et al., 2013). The significant down-regulations of P38 and up-regulations of
MKK6 were observed across all the time-points of extract-treated HepG2
compared with time-points of untreated HepG2 (Table 4.8; Figure 4.6). This
may suggest that counteraction or neutralization of effects of both genes on the
growth of HepG2.
The AP-1 transcription factor plays active roles in cell growth and
proliferation. It is composed primarily of members of the JUN and FOS families
of proteins. JUND is also part of the member of AP-1 transcription factor. JUN
and JUND encode a central component of AP-1 transcription factors. They are
the major regulators of the proliferative and stress responses of mammalian cells
leading to oncogenesis. They are downregulated in response to osmotic stress,
indicating that their downregulation promotes apoptosis (Xia et al., 2007;
Nakagawa and Maeda, 2012). The significant down-regulations JUND were
observed across all the time-points of extract-treated HepG2 compared with
130
time-points of untreated HepG2 (Table 4.8; Figure 4.6). This may suggest that
extract promoted apoptosis and suppressed the growth of HepG2.
Serum response factor (SRF), transcriptional regulator, is frequently
activated in hepatocellular carcinoma (HCC). Study showed that SRF-active
mice developed hyperproliferative liver nodules that progressed to lethal HCC
(Ohrnberger et al., 2015). The down-regulations of SRF were observed across
all the time-points of extract-treated HepG2 compared with time-points of
untreated HepG2 (Table 4.8; Figure 4.6). This may suggest that the extract
suppressed the growth of HepG2.
CACNA1H was not well studied in most of the cancer type. However, it
was detected in breast cancer(Asaga et al., 2006).The down-regulations of
CACNA1H across all the time-points of extract-treated HepG2 compared with
time-points of untreated HepG2 may potentially shed some lights on its
suppression effect on cancer cell (Table 4.8; Figure 4.6).
5.2.5 mTOR Signalling Pathway
mTOR is a serine/threonine protein kinase that regulates cell growth, cell
proliferation, cell motility, cell survival, protein synthesis, autophagy, and
transcription (Appendix C-5). The mTOR signalling is activated in many tumour
types. It contains a number of tumour suppressor genes, including PTEN, LKB1,
TSC1, andTSC2, and a number of proto-oncogenes including PI3K, AKT,
andeIF4E (Law, 2005). Over-activation of mTOR signalling significantly
131
contributes to the initiation and development of tumours including breast,
prostate, lung, melanoma, bladder, brain, and renal carcinomas (Xu et al., 2014).
Comprised of mTOR and a regulatory associated protein of mTOR
(RAPTOR), mTOR complex 1 (mTORC1) is a downstream target of AKT. It
acts as a central regulator of cell growth and proliferation and regulates protein
synthesis and allows progression from G1 to S phase of the cell. While mTOR
complex 2 (mTORC2), formed by mTOR, RICTOR and PRR5/GβL, activates
AKT and plays important role of mTOR pathway activation in human HCC
(Villanueva et al., 2008).
In a study by Kimball and Jefferson (2012), DNA-damage-inducible
transcript 4 (DDIT4) is rapidly induced in response to a wide variety of
situations, including hypoxia conditions, food deprivation, or during
glucocorticoid treatment. They deplete intracellular ATP or cause DNA damage
(Kimball and Jefferson, 2012). The significant down-regulations of DDIT4 were
observed across all the time-points of extract-treated HepG2 compared with
time-points of untreated HepG2 in this study (Table 4.9; Figure 4.7). This may
suggest that extract may help reduce oxidative stress and suppress the growth of
HepG2.
5.2.6 TGF-β Signalling Pathway
Transforming growth factor-β (TGF-β) is known as a multifunctional
polypeptide that controls proliferation, differentiation, embryonic development,
132
angiogenesis, wound healing and other functions in many cell types (Massagué,
2008; Appendix C-6).
TGF-β and its receptors are widely expressed in all tissues. Low
expression of TGF-β has been noticed in diseases like hyper-proliferative
disorders, tumour formation, inflammation, and autoimmune diseases while
higher expression is observed in diseases involved immunosuppression and
tumour metastasis. Thus, TGF-β plays a dual role in human cancers, acting both
as a tumour suppressor and as a promoter of tumour metastasis. It acts as a
tumour suppressor in normal epithelial cells and in early stage of tumour
progression while inducing many activities that lead to growth, invasion and
metastasis of cancer cells in advanced cancer (Derynck et al., 2001; Mishra et
al., 2005; Lebrun, 2012).
TGF-β triggers signalling cascade and promotes liver fibrosis, cirrhosis
and subsequent progression to HCC (Giannelli et al., 2011; Stauffer et al., 2012).
The other observation also suggests that the association of TGF-β with cancer is
strongest in the most advanced stages of tumour progression. The cancer cells in
advanced stages secrete larger amounts of TGF-β than their normal cell.
However, TGF-β is highly protective against cancer in the early stage (Yasmin
Anum et al., 2009; Nagaraj and Datta, 2010). These observations could be
reconciled with other findings and provide a clue about its roles in anti-tumour
and pro-tumour at different stages of HCC progression (Lebrun, 2012;Capece et
al., 2013).
133
TGF-β also plays an important role in tumour progression as an effector
in the microenvironment of epithelial-to-mesenchymal transition (EMT), which
is conducive for cancer metastasis. TGF-β, along with others including VEGF,
ErbB/EGF, WNT, interleukin 6 (IL-6), IL-8, IL-11, IL-1, insulin-like growth
factor I & II (IGF I & II), platelet-derived growth factor (PDGF) and hedgehog
(HH) signalling pathways have been identified as the important EMT and
mesenchymal-to-epithelial transition(MET) effectors for bone metastasis
formation (Katoh and Katoh, 2008; Scheel and Weinberg, 2012; Demirkan,
2013). The down-regulations of TGF-β were observed across all the time-points
of extract-treated HepG2 compared with time-points of untreated HepG2 in this
study (Table 4.10; Figure 4.8).
TGF-β mediates G1 cell cycle arrest. It induces CDK inhibitors and
downregulates downstream transcription factors, which are inhibitors of
differentiation, including c-Myc, ID1 and ID2. However, in most of the tumour,
TGF-β is not able to downregulate c-Myc and ID proteins (Sheen et al., 2013).
The down-regulations of ID1were observed across all the time-points of extract-
treated HepG2 compared with time-points of untreated HepG2 in this study
(Table 4.10; Figure 4.8). This may suggest that the extract suppressed the growth
of HepG2.
High expression of thrombospondin 1 (THBS1) is associated with tumour
invasiveness and progression in HCC. It is believed that THBS1 is a
proangiogenic factor that stimulates angiogenesis in HCC (Poon et al., 2004). In
this study, fold-change of gene expression at a time-point 6, 12 and 18 hours of
134
treated samples is less than untreated samples’, while time-point 24 and 48 hours
of treated samples exhibit higher fold-change compared with untreated samples’.
This may suggest that suppression effect of extract was more effective for shorter
intervals in the study (Table 4.10; Figure 4.8).
Study showed that follistatin (FST) is overexpressed in rodent liver
tumours (Rossmanith et al., 2002) . The downregulations of FST across all the
time-points of extract-treated HepG2 compared with time-points of untreated
HepG2 in this experiment may indicate the suppression of HepG2 by the extract
(Table 4.10; Figure 4.8).
Activin A type I receptor gene (ACVR1) plays an essential role in the
development of cancer. Increased expression of ACVR1, along with its
downstream genes like IL-8, was associated with shorter survival in HCC cases
(Li et al., 2015). The down-regulations of ACVR1 were observed across all the
time-points of extract-treated HepG2 compared with time-points of untreated
HepG2 in this study (Table 4.10; Figure 4.8). This may suggest that the extract
suppressed the growth of HepG2.
5.2.7 ErbB Signalling Pathway
Erythroblastic Leukemia Viral Oncogene Homolog (ErbB) or EGF
Epidermal Growth Factor (EGF) family of transmembrane Receptor Tyrosine
Kinases (RTKs) plays an important role during the growth and development of
135
a number of organs. They stimulate cell growth, proliferation, survival and
differentiation. The ErbB family of proteins contains four receptor tyrosine
kinases: namely EGFR/ErbB1, ErbB2/HER2, ErbB3/HER3 and ErbB4/HER4.
They are structurally related to the epidermal growth factor receptor (EGFR) in
which EGFR is its first discovered member. They play a well-established role in
various types of cancer while ErbB2 is the most well-studied and mutated in
many epithelial tumours (Hynes and MacDonald, 2009).
The ErbB pathway is also believed to have contributed to the occurrence
of inflammation (Appendix C-7). The development of HCC is associated with
persistent and chronic liver inflammation. Inflammatory cytokines and their
receptors play vital roles in the development and progression of HCC. Besides
ErbB pathway, they also activate other signalling pathways, including mitogen
activated protein kinase (MAPK) and PI3K pathways, which in turn stimulate
cellular responses such as survival, proliferation, and migration (Bischoff et al.,
2015).
Increased levels of ErbB1 and ErbB3 expression are found to be
associated with more aggressive tumours, including the poorly differentiated
HCC (Berasain et al., 2007).AREG, EREG are part of the EGFR family. They
were significantly down-regulated across all the time-points of extract-treated
HepG2 compared with time-points of untreated HepG2 in this study (Table 4.11;
Figure 4.9). This may suggest that extract promotes the apoptosis of HepG2.
136
5.2.8 Notch Signalling Pathway
There are four membrane receptors (Notch1-4) in Notch signalling and
are activated by their binding to three Delta-like ligands (Dll1, Dll3, and Dll4),
and two ligands of the Jagged family (Jag1 and Jag2). Direct cell-cell contact is
a pre-requisite for the activation of Notch signalling (Appendix C-8).
Seven key signal transduction pathways that control cell communication
during animal development have been identified: WNT, TGF-β, Hedgehog (Hh),
RTK, nuclear receptor, JAK/STAT, and Notch signalling. Intriguingly, Notch is
the only pathway that relies on cell-cell contact (Guo et al., 2014). Ligand
binding activates Notch through proteolysis and endocytosis of the receptor.
Notch receptors interact with ligands on a neighbouring cell, which lead to Notch
intracellular domain before entering the nucleus and activating the transcription
of target genes (Gordon et al., 2008; Fortini, 2009).
Notch signalling is frequently dysregulated and overactivated across
many cancers, including breast cancer, medulloblastoma, colorectal cancer, non-
small cell lung carcinoma (NSCLC), melanoma, and T-cell acute lymphoblastic
leukaemia (T-ALL). It leads to poorer prognosis for patients. Recent studies
show that Notch signalling increases tumour cell proliferation, maintains a
significant cancer stem-cell pool, induces epithelial-mesenchymal transition
(EMT) and promotes chemo-resistance (Capaccione and Pine, 2013;
Ranganathan et al., 2011)
137
Tumours grow due to aberrantly overexpressed Notch Ligand, such as
JAG1 and defective inhibitors, such as FBXW7, NUMB, or
DELTEX(Strazzabosco and Fabris, 2012). In the study done by Huntzicker et al.
(2015) also shows similar results. The inhibition of NOTCH2 and JAG1 reduces
tumour burden by eliminating highly malignant HCC-like and
cholangiocarcinoma-like tumours. This comes to a consistent conclusion that
JAG1 plays important role in the development of HCC (Huntzicker et al. 2015).
The down-regulations of the JAG1 were observed across all the time-points of
extract-treated HepG2 compared with time-points of untreated HepG2 (Table
4.12; Figure 4.10). This may suggest that the extract inhibited the proliferation
of HepG2.
The downstream target gene of Notch signalling, HES1, was significantly
overexpressed in HCC-like nodules and tumours (Villanueva et al., 2012;
Huntzicker et al., 2015). Different phase of clinical trial for cancer treatment
targeting HES1 has been carried out (Morell and Strazzabosco, 2014).The down-
regulations of HES1 were observed across all the time-points of extract-treated
HepG2 compared with time-points of untreated HepG2 in this study (Table 4.11;
Figure 4.9). This may suggest that the extract promoted differentiation and
inhibited tumorigenesis of HepG2 cell.
5.2.9 VEGF Signalling Pathway
The production of VEGF is stimulated by upstream activators, including
environmental cues, growth factors, oncogenes, cytokines, and hormones. The
binding of VEGF to its receptors on the surface of endothelial cells activates
138
intracellular tyrosine kinases, triggering multiple downstream signals that
promote angiogenesis (Appendix C-9).
Expression of VEGF was observed in the HCC tumour and occludin
disassembly in the normal liver parenchyma next to the tumour and it steadily
increases with the progression of the hepatocarcinogenic process from a normal
liver, to a dysplastic nodule, to HCC (Yamaguchi et al., 1998;Schmitt et al.,
2004; Wu and Li, 2012b). In addition to its known angiogenic properties, studies
suggest that VEGF may promote HCC spreading into the normal liver
parenchyma. The VEGF pathway is clearly important for HCC pathogenesis,
providing a cue for the development of VEGF antagonists for tumour therapy
(Martin and Jiang, 2009). In this study, not much variation of expression of
VEGF was observed (Table 4.13; Figure 4.11). This may suggest that the extract
did not affect the expression level of VEGF in HepG2.
5.2.10 JAK-STAT Signalling Pathway
Janus associated kinase-signal transducer and activator of transcription
(JAK-STAT) pathway regulates the transduction of extracellular signals from
cytokines and growth factors (Appendix C-10). It is involved in proliferation,
differentiation, migration, apoptosis, and cell survival.
The binding of IL-6 to its receptor, IL-6R, which leads to dimerization
of gp130, initiates JAK-STAT signalling. IL-6 is a known type I cytokine
produced by macrophages, endothelial cells and activated T cells. The binding
complex then binds to JAK family before it phosphorylates and activates STAT3
139
and STAT1, which in turn regulate the downstream transcription
factors(Heinrich et al., 2003; Furqan et al., 2013).
Overexpression of IL-6 has been observed in many cancers, including
breast, renal cell, colon, prostate, bladder and B-cell malignancies, especially
myeloma and HCC. Elevated serum levels of IL-6 are related to poorer prognosis
in all these tumour types. Secretion of high level IL-6 may serve as an autocrine
growth factor for cancer cell to survive. It is believed as a potent inducer of both
RAS and JAK-STAT pathways which are universally activated in human HCC
(Trikha et al., 2003; Calvisi et al., 2006). IL-6, along with TNF-α, are identified
as tumour promoting cytokines and work with latent transcription factors such
as STAT3 and NF-B (Stauffer et al., 2012). NF-B has been known as
intracellular signalling effector for many proinflammatory cytokines. It has been
implicated in the development of cancer and activated by the underlying
inflammation during malignant progression. Studies show that STAT3 and NF-
kB are strongly linked to HCC development, in which STAT3 is activated by the
upregulated IL-6. STAT3-positive HCC tumour tend to be more aggressive (He
and Karin, 2011). Corticosteroids are effective agents against myeloma due to
its effective inhibition on IL-6. Effort of developing IL-6 ligand-binding
antibodies and IL-6R blocking antibodies has proven positive. The growth of
tumour is inhibited by using these antibodies alone or in combination with
cytotoxic chemotherapies (Lee and Margolin, 2011; Sansone and Bromberg,
2012). The significant down-regulations of IL-6R were observed across all the
time-points of extract-treated HepG2 compared with time-points of untreated
140
HepG2 (Table 4.14; Figure 4.12). This may suggest that extract induced
apoptosis of HepG2.
IL11 is overexpressed in inflammatory HCC. It is released from dying
hepatocytes to facilitate its proliferation to neighbouring cells by inducing
STAT3 pathway (Ernst and Putoczki, 2014).The overexpression of IL-11and IL-
6 is observed in tumour epithelial cell. It correlates with staging of tumour
(Necula et al., 2012). Along with OSM and IL-6, LIF was upregulated in higher
grade prostatic carcinoma (Richards, 2013). The significant down-regulations of
IL-11and LIF were observed across all the time-points of extract-treated HepG2
compared with time-points of untreated HepG2 in this study (Table 4.14; Figure
4.12). This may suggest that extract effectively inhibited the survival and
proliferation of HepG2.
Overexpression of PIM1, proto-oncogenic protein, could be observed in
tumour. When it is overexpressed, it inhibits apoptosis, promotes cell
proliferation and genomic instability. However, its expression in normal tissues
is nearly undetectable (Magnuson et al., 2010). PIM1 expression was induced
through downstream effectors or cytokines such as IL-6, IL-3, GM-CSF, and G-
CSF. PIM1 expression is not only regulated at the transcriptional, but also at the
post-transcriptional, translational and post-translational levels (Brault et al.,
2010). The significant down-regulations of PIM1 were observed across all the
time-points of extract-treated HepG2 compared with time-points of untreated
HepG2 (Table 4.14; Figure 4.12). This may suggest that extract inhibited
tumorigenesis of HepG2 cells.
141
Sprouty proteins are important modulators of MAPK/ERK pathway and
mediate a crosstalk among different signalling pathways for a coordinated
cellular response. SPRY2, sprouty protein, was among the genes found to be
downregulated in HCC compared with non-tumour liver. However, SPRY1 was
found significantly upregulated and SPRY4 was found significantly
downregulated compared with non-tumour tissues (Fong et al., 2006; Masoumi-
Moghaddam et al., 2014). The significant down-regulations of SPRY4 were
observed across all the time-points of extract-treated HepG2 compared with
time-points of untreated HepG2 (Table 4.14; Figure 4.12). This may suggest that
stimulation of MAPK and the promotion of survival of HepG2 cells by the
extract. However, the extract did not affect the expression level of SPRY1 at all
timepoints. This may indicate that the extract may not induce the growth of
HepG2 cells.
5.2.11 WNT Signalling Pathway
Besides RAS/RAF/MEK/ERK pathway, PI3K/AKT/mTOR pathway,
JNK pathway and NF-κB pathway, WNT signalling pathway has been identified
as one of oncogenic pathways being responsible for initiating and sustaining
HCC (Fatima et al., 2011).
There are three different pathways for WNT receptor activation,
including canonical Wnt/β-catenin cascade, noncanonical planar cell polarity
(PCP) pathway, and Wnt/Ca2+ pathway (Appendix C-11). However, Wnt/β-
catenin signalling is more broadly studied compared with the others.
142
The Wnt/β-catenin signalling plays important roles in the development
of most organ systems, especially the liver. Canonical Wnt/β-catenin signalling
pathway works through its formation of three distinct protein complexes: the
ligand-receptor complex, the β-catenin destruction complex, and the β-
catenin/TCF transcription complex (Takigawa and Brown, 2008).
In the absence of Wnt ligands, -catenin is continually degraded in the
cytoplasm. The pathway is only activated when a Wnt ligand binds to the one of
the members of extracellular frizzled (FZD) receptor and its co-receptor low-
density lipoprotein receptor-related protein 5 or 6 (LRP5/6), leading to the
phosphorylation of LRP5/6 with the protein dishevelled (DVL) and recruitment
of axin and GSK3β to the receptor, which in turn disrupts the formation of the
β-catenin destruction complex. This allows non-phosphorylated β-catenin to be
accumulated and transported to the nucleus before forming complexes with the
TCF/LEF transcription factors and activating WNT target genes, such c-Myc and
cyclin D1 which are implicated in cell proliferation, anti-apoptosis, and
angiogenesis (Giles et al., 2003; Clevers, 2006; Gordon and Nusse, 2006; Fatima
et al., 2011).
Besides c-Myc and cyclin D1, there are other oncogenes involved in this
pathway, such as conductin (AXIN2), matrix metalloproteinase-7 (MMP-7),
FRA-1 (FOSL1), JUN, uPAR, and immunoglobulin transcription factor-2 (ITF-
2) (Giles et al., 2003). The significant down-regulations of FOSL1 was observed
across all the time-points of extract-treated HepG2 compared with time-points
143
of untreated HepG2 (Table 4.15; Figure 4.13). This may suggest that the extract
suppressed the growth of HepG2.
Accumulated β-catenin is seen in gastrointestinal and liver cancers and
50-70 % of HCC has high levels of -catenin in the cytoplasm and in the nucleus.
It is believed that the TGFβ-mediated loss of E-cadherin results in the release of
β-catenin from cell-cell contacts and both contribute to the modulation of HCC
(Nejak-Bowen and Monga, 2008). Overexpression of c-Myc and cyclin D1 in
HCC, along with high level of β-catenin, has a poor prognosis(Fatima et al.,
2011). In some studies, FZD has been found consistently overexpressed in
several mouse models of HCC.DKK1, an inhibitor of canonical Wnt signalling,
is under-expressed in HCC. It binds specifically to LRP5/6 and stops Wnt-
mediated signal transduction (Takigawa and Brown, 2008). There were not
many variations (< 2) in the expression of β-catenin, c-Myc, FZD, DVL and
DKK1 across all time-points in this study. This may suggest that the extract
maintained the level of these proteins while suppressing the level of FOSL1,
LRP5 and WNT11.
5.2.12 Toll-like Receptor Signalling Pathway
There are four main groups of pattern recognition receptors identified:
Toll-like receptors (TLR), NOD-like receptors (NLR), RIG-I-like receptors and
C-type lectin receptors. Studies have shown that infectious agents could cause
human cancer. These agents could be recognized by pattern recognition
receptors (PRR), including TLRs and NODs. This suggests that TLRs and NODs
play a major role in the immune response against biological carcinogens.
144
Together with other PRRs, TLR initiates both pathogen-specific and cell type-
specific host immune responses to fight infections. Interleukin-1β (IL-1β) is a
pro-inflammatory cytokine playing major role in innate and adaptive immunity.
Being the earliest cytokines released in the early stage of inflammation, it
regulates the activation of inflammation by inducing other cytokines, such as IL-
6, TNF-α, and IL-1α to be released. IL-1β is commonly overexpressed in many
tumours and used as a potential prognosis indicator for cancer patients. The
inflammatory response triggered by an infection is part of normal host defence
to kill the pathogens. However, these pathogens get around host immunity and
cause consistent infections leading to chronic inflammation. The chronic
inflammation is characterized by the continued expression of cytokines and the
recruitment of immune cells to the organs. It is one of the key environmental risk
factors associated with cancers (Kutikhin and Yuzhalin, 2012).
Inflammatory microenvironment constitutes one of the important
elements of all tumours. It involves innate immune cells and adaptive immune
cells on top of cancer cell and its surrounding stroma. Innate immune cells are
mainly made up of macrophages, neutrophils and NK cells while adaptive
immune cells are made up of T and B lymphocytes. This microenvironment
provides important cytokines, chemokines, growth factors and others which
contribute to the growth of cancer cells. TLRs are involved in sensing
endogenous danger signals by invading microorganism and initiate early innate
immune response to these invading pathogens. There were the first PRR
identified before PRRs other than TLRs were identified to be also involved in
pathogen-associated molecular patterns (PAMPs) recognition. PAMPs include
145
various bacterial cell wall components such as lipopolysaccharide (LPS),
peptidoglycan (PGN), lipopeptides, flagellin, as well as bacterial DNA, single-
stranded (ss) RNA and double-stranded (ds) RNA. There are more than ten TLRs
identified in human to detect various PAMPs derived from viruses, bacteria,
mycobacteria, fungi and parasites. This list of TLRs will get longer (Akira et al.,
2006).
Upon recognition of PAMPs, TLRs recruit appropriate adaptor
molecules for one of its two distinct pathways: a MyD88-dependent pathway,
which is used by all TLRs with the exception of TLR3, leading to the production
of inflammatory cytokines through NF-B and MAPK activation, or a MyD88-
independent pathway associated with the stimulation of IFN-β and the
maturation of dendritic cells (Appendix C-12). As a result, neutrophils are
recruited and macrophages are activated for the killing of the infected pathogens
(Kawai and Akira, 2011).
Downstream genes of MyD88-dependent pathway include transcription
factor AP-1 (JUN), IL-6, IL-8, interferon-α (IFN-α). IL-8 is a chemokine
produced by macrophages and mostly present at epithelial and endothelial cells.
It transactivates EGFR, promoting the downstream activation of MAPK
signalling, which is involved in cell proliferation and cell survival (Waugh and
Wilson, 2008). Studies show that expression of IL-8 and MyD88 correlates with
the angiogenesis, tumorigenicity and metastasis of tumours. Patients with high
plasma IL-8 and MyD88 have a poor prognosis and higher recurrence rate(Liang
et al., 2013;Lu et al., 2015).
146
Cancer growth is believed to be driven by a population of tumour-
initiating cells (TICs), type of stem-like cells. Studies show that TIC population
derived from HCC is characterized by membrane expression of CD133, in which
upregulated expression of IL-8 in CD133 liver TICs is observed. It induces
tumour angiogenesis, and initiates tumours (Tang et al., 2012). The
significant down-regulations of IL-8 were observed across all the time-points of
extract-treated HepG2 compared with time-points of untreated HepG2. No much
fold-change variation (< 2) in the expression of MyD88, together with down-
regulation of IL-8, may suggest that the extract suppressed proliferation of
HepG2. The up-regulation of the MAP2K6 also showed the effect of the extract
in the suppression of proliferation of HepG2 (Table 4.16; Figure 4.14).
5.2.13 NOD-like Receptor Signalling Pathway
Recent studies show that NOD-like receptors (NLRs) have been involved
in infections, cancer, autoimmune disease and inflammatory disorders. Among
infection-related neoplasms, gastric cancer, hepatocellular carcinoma (HCC),
and cervical cancer are more prevalent. Persistent infection of Helicobacter
pylori in the stomach, HBC and HCV in the liver, and human papilloma virus in
cervix uteri of women are linked to them, respectively. Researches show that
inflammation caused by bacteria and viruses increases cancer risk (de Martel and
Franceschi, 2009).
Like TLRs, upon activation, NLRs, by interacting with receptor-
interacting protein 2 (RIP2), activate the downstream pathways, NF-κB and
147
MAPK signalling which are common pathways for cancers (Di Virgilio, 2013)
(Appendix C-13). RIP2 is needed to produce pro-inflammatory and anti-
microbial molecules. It recruits TGFβ-activated kinase1 (TAK1) before forming
protein complexes which in turn activate the target genes in NF-κB and MAPK
pathways (Saxena and Yeretssian, 2014). However, this result is contradicting
with other murine studies by Zhang and Chin (2014), larger orthotopic bladder
tumours developed in the absence of RIP2 while tumour metastases in both the
lung and kidneys were observed. In this study, down-regulations of RIP2 were
observed across all the time-points of extract-treated HepG2 compared with
time-points of untreated HepG2 (Table 4.17; Figure 4.15).
High level expression of NAIP has been reported in prostate cancer cell
line, breast cancer patients and bone marrow of AML (Mazrouei et al., 2012).
However, there is no study related to NAIP on HCC. In this study, up-regulations
of NAIP were observed across all the time-points of extract-treated HepG2
compared with time-points of untreated HepG2 (Table 4.17; Figure 4.15).
5.2.14 RIG-I-like Receptor Signalling Pathway
While there is increasing number of research to investigate the
association of TLRs and NLRs with the progression of cancer, the research
analysing the correlation between RIG-I like receptor (RLR) and cancer is
scarce. This happens to the research of C-type lectin receptor too.
RIG-I is one of the sensors for host recognition of RNA virus infection.
Upon activation, it triggers downstream signalling and induce type I IFN
148
production (Appendix C-14). So far the studies showed contradictory in results
on the association of RLR with cancers as well as other diseases (Chistiakov,
2010; Kutikhin and Yuzhalin, 2012).
However, significant down-regulation of IL-8 in this pathway may
suggest that extract trigger the apoptosis of the HepG2. It is interesting to note
the crosstalk of P38 in Toll-like, NOD-like and RIG-like pathways. As
discussed, down-regulation of P38 may promote the proliferation of HepG2
(Table 4.18; Figure 4.16).
5.2.15 Chemokine Signalling Pathway
Chemokines are involved in innate and adaptive immunity. The innate
immune response is mediated by neutrophils, monocytes, dendritic cells (DC)
and natural killer (NK) cells while naïve and memory CD4 and CD8 cells and
immature DCs are involved in the adaptive immune response. Chemokines have
been implicated in chronic inflammation, tumorigenesis and metastasis, as well
as autoimmune diseases (Raman et al., 2011) (Appendix C-15).
According to the presence of its cysteine residues in conserved locations,
chemokines and their receptors are divided into four families: namely CXC, CC,
CX3C and C, where C represents the cysteine and X represents non-cysteine
amino acids (Zlotnik and Yoshie, 2000). Approximately 20 chemokine receptors
and 50 chemokines have been identified in humans (Sarvaiya et al., 2013).
149
The expression of chemokines and their receptors is significantly
changed in various cancers. In studies related to the expression profiles of
various chemokines and their receptors in tumour and its neighbouring tissues
from HCC patients, all kinds of chemokines are found to express in both normal
liver and HCC tissues. However, CCL20 has been the only chemokine showing
significant upregulation in HCC tissues. Further analysis also showed that in
CCL20 has higher expression in grade III HCC tumour tissues in comparison to
grade II tumours HCC tumour tissues (Rubie et al., 2006). This suggests that the
CCL20/CCR6 system is implicated in hepatocarcinogenesis. Observation by
Chen et al. (2011) showed CCR6/CCL20 has elevated expression in HCC
tumour tissues. Studies also showed CCR6 has been involved in intra-hepatic
metastasis of HCC and used as potential prognostic factors for HCC (Huang and
Geng, 2010). In this study, the significant down-regulations of CCL20 and
CCR6 were observed across all the time-points of extract-treated HepG2
compared with time-points of untreated HepG2 (Table 4.19; Figure 4.17). This
may suggest that the extract exhibit inhibitory effect on the hepatocarcinogenesis
of HepG2.
G protein-coupled receptors (GPCRs) are the families of membrane
receptors playing vital role in cellular differentiation and proliferation. Its
kinases (GRKs), together with the β-arrestin (ARRB) used as scaffolds, are
involved in the desensitization process of GPCRs. The GPCR- β-arrestins
complex in turn activates the downstream signalling, including ERK1/2, PI3K-
AKT, NF-kB pathways, which are implicated in HCC. (Vroon et al., 2006;
Sobolesky and Moussa, 2013).
150
β-arrestins (ARRB) regulate processes in cancer cell migration, invasion
and metastasis.High level of ARRB is observed in advanced stage of breast
cancer tissues compared to early stage disease. In another study, ARRB1 is
overexpressed in HCC, NSCLC tumour and their para-cancerous tissues
(Bagnato et al., 2005; Sobolesky and Moussa, 2013; Yang et al., 2015). The
down-regulations of ARRB2 were observed across all the time-points of extract-
treated HepG2 compared with time-points of untreated HepG2 (Table 4.19;
Figure 4.17). Combining the effect of the significant down-regulations ofBCAR1
andPARD3, which were also implicated in focal adhesion signalling pathway
(5.2.21), and adherens junctions signalling pathway (5.2.20), it may significantly
suppress invasion and migration of the HepG2 cells.
5.2.16 Cytokine-Cytokine Receptor Interaction Signalling Pathway
Cytokines are released in response to cellular stresses, including
infection or inflammation (Appendix C-16). They are the important proteins,
allowing the immune cells of the innate immune response and adaptive immune
response to communicate with each other to fight infections and other
pathologies.
Common cytokines include chemokines, lymphokines, interleukins,
interferons, tumour necrosis factor and others. Different names were derived
from their functionality. For examples, cytokines with chemtactic activities is
called chemokines while cytokines secreted by lymphocytes are called
151
lymphokine. Similarly, cytokines secreted by leukocyte are called interleukin,
and cytokines secreted by monocytes is called monokine.
Excessive immune cell infiltration to the inflammation site leading to
increased cytokine level could be seen if the inflammation persists. This
inflammatory microenvironment allows stressed cells to release free radicals,
such as reactive oxygen species (ROS) and nitric oxide (NO) reactive species
which in turn cause further DNA damage leading to possible gene mutations.
This host response to persistent higher cytokine expression has the impact on the
formation and progression of the cancer. However, inflammation plays
contradictory roles in tumour development. It promotes anti-tumour immune
responses and also has the potential to support tumour growth and metastases
(Kutikhin and Yuzhalin, 2012).
There are diverse groups of peptides and glycoproteins that are secreted
by different hematopoietic cells, such as lymphocytes, monocytes, and
granulocytes. Some are proinflammatory or anti-inflammatory. They mediate
the intercellular signalling to regulate homeostasis of the immune system in a
multifaceted and efficient manner. In order to function properly, cytokines must
bind to specific extracellular receptors. Some cytokines have a dedicated
receptor while others may have shared receptors (Schreiber and Walter, 2010).
In humans, TNFRSF19 (TROY) is mainly expressed in the brain and
prostate while having low expression in other normal organs, including heart,
lung, liver, thymus, uterus, skeletal muscle, spleen, colon, testis, kidney, and
152
peripheral blood lymphocytes. In various studies, it is highly expressed in
glioblastoma specimens, colorectal cancer cell lines and carcinomas (Paulino et
al., 2010; Schon et al., 2014). However, there is not much study of TNFRSF19
in HCC. In this study, up-regulations of TNFRSF19 were observed across all the
time-points of extract-treated HepG2 compared with time-points of untreated
HepG2 (Table 4.20; Figure 4.18).
Prolactin (PRL) is a multifunctional peptide hormone secreted by the
anterior pituitary gland. In addition to its lactation, it regulates differentiation,
proliferation. Its receptor (PRLR), part of the class 1 cytokine receptor family,
is found in various human tissues, including liver, gastrointestinal tract,
pancreas, and lung. The interaction of PRL and its receptor activates Janus
kinase 2 (JAK2) which in turn promotes HCC proliferation. High level of PRL
and PRLR is observed in HCC patients, predicting poor prognosis in these
patients (Yeh et al., 2012). On the other hand, similar observation on its role is
seen in the tumorigenesis of breast and prostate (Damiano et al., 2013). In this
study, up-regulations of PRLR were observed across all the time-points of
extract-treated HepG2 compared with time-points of untreated HepG2 (Table
4.20; Figure 4.18).
KIT is part of the PDGFR family with stem cell factor (SCF) as its ligand.
SCF is encoded by the protooncogene KIT and involved in cellular proliferation
and anti-apoptotic functions. It is found upregulated in various malignant
tumours, including ovarian cancer, breast cancer, lung cancer, prostate cancer,
leukaemia (Liu et al., 2009a). A significant amount of both SCF and KIT have
153
been found in the liver. This high amount could be related to its self-regenerating
capability liver cells have. However, high expression of both is found implicated
in the neoplastic processes in the liver. Their proliferative capability is mediated
by IL6. IL6 induced the production of SCF (Ren et al., 2008). In this study, up-
regulations of KIT were observed across all the time-points of extract-treated
HepG2 compared with time-points of untreated HepG2 (Table 4.20; Figure
4.18). It may indicate its stronger self-regenerating capability or progression of
HepG2.
However, the significant down-regulation of IL-8, IL-11, CCL20, IL-6R,
LIF, ACVR1, and TNFSF10 were recorded in this study for this pathway and
might suggest its suppression effect on HepG2.
5.2.17 B-cell Receptor Signalling Pathway
B cells provide first line of defence by producing antibodies and
protection from invading pathogen or disease. CD22 is a B lymphocyte–specific
phosphoglycoprotein and is highly expressed on the B cell surface. Besides its
function as a cell adhesion molecule, CD22 also modulates signal transduction
through the B-cell receptor (Appendix C-18).
CD22 is expressed on the malignant cells in more than 90 % of B
lymphoid malignancies, including acute lymphoblastic leukaemia, non-Hodgkin
lymphoma (Sapra et al., 2013). Similar to TCR, B cell receptor (BCR) induces
the P13K, NF-kB, and AP1 signalling pathway. However, the mechanism of
BCR on the liver cancer is less studied.
154
The down-regulations of CD22 were observed across all the time-points
of extract-treated HepG2 compared with time-points of untreated HepG2 (Table
4.22; Figure 4.20).
5.2.18 Apoptosis Signalling Pathway
Apoptosis is a controlled form of cell death. Normal cell going through
regulated apoptotic cell death sees its chromatin condensed, membrane
blebbed, and cell shrunk. It has its pivotal role in controlling irregular cell
proliferation through either its extrinsic pathway or intrinsic pathway (Appendix
C-19).
External pathway is mediated by death receptors on the cell membrane
while internal pathway, associated with mitochondria, is initiated by the
intracellular signals controlled by Bcl-2 family. Both pathways cause the
activation of “initiator” caspases, which then activate “effector” caspases. The
caspase cascade can be activated upon death receptor triggering. Caspases are
cysteine-dependent, aspartate-specific proteases and are regulated at a
posttranslational level which ensures that they can be rapidly activated
(Falschlehner et al., 2007). TNFSF10 or TNF-related apoptosis inducing ligand
(TRAIL), tumour necrosis factor α (TNFα) and FAS ligand are the ligand
involved in the initiation of the external pathway.
Tumour necrosis factor (TNF) and TNF receptor (TNFR) superfamily
are involved cell survival, programmed cell death, inflammation, and
155
differentiation. It is a type II transmembrane protein related to the TNF
superfamily. The cancer patients with higher TRAIL have a better prognosis (Liu
et al., 2005). TRAIL is mainly found on the surface of natural killer cells (NK),
cytotoxic T lymphocytes, macrophages and dendritic cells. The study found that
human soluble TRAIL is present at extremely high levels in human colostrum.
It is known that the first secretion from the mammary glands after giving birth
is rich in antibodies. Antibodies acquired through colostrum at birth are critical
to the health of new-born. TRAIL might have a significant role in mediating the
anti-cancer activity of human milk (Davanzo et al., 2013).
TRAIL functions as a tumour suppressor and induce apoptosis in tumour
cell without affecting normal cells. It is secreted by normal tissues as part of
natural immune responses. It suppresses tumour metastasis (Kemter et al., 2005;
Refaat et al., 2014). It is regulated by two death receptors, TRAIL receptors 1
and 2 (TRAIL-R1and TRAIL-R2), and two decoy receptors: TRAIL-R3and
TRAIL-R4. TRAIL-Rs are also implicated in most human HCC (Fabregat et al.,
2007). The significant up-regulations of TRAIL were observed across all the
time-points of extract-treated HepG2 compared with time-points of untreated
HepG2 (Table 4.23; Figure 4.21). This may suggest that extract inhibit the
metastasis and promote differentiation of the HepG2 cells.
TRAIL signalling does not only lead to the activation of effector caspases
and subsequent initiation of apoptosis, but also induce non-apoptotic pathways,
involving the activation of NF-kB, AKT and MAPKs pathway (Falschlehner et
al., 2007). Interleukin-1 receptor-associated kinases 2 (IRAK2) is known to
induce NF-κB activation through various TLRs. Activation of IRAK2promotes
156
carcinogenesis. It plays an important role in inflammatory responses which are
critical for elimination of viruses, bacteria, and cancer cells, as well as for wound
healing. It can be initiated from Toll-like receptors (TLRs) or from the
interleukin-1 family receptors (IL-1R) (Jain et al., 2014). The significant down-
regulations of IRAK2 were observed across all the time-points of extract-treated
HepG2 compared with time-points of untreated HepG2 (Table 4.23; Figure
4.21). The upregulation of TRAIL and downregulation of IRAK2 may suggest
that the extract promotes the apoptosis of HepG2.
5.2.19 Adherens Junction Signalling Pathway
The adherens junction (AJ) provides adhesive contacts between
neighbouring epithelial cells. It helps maintain tissue architecture and integrity.
It also controls the cell motility and proliferation. As a classical cadherin family
of Ca2+-dependent adhesion proteins, E-cadherin (CDH1) is an essential
transmembrane protein, which initiates intercellular contacts in adherens
junction. The binding of E-cadherin with the cytoplasmic catenin family
members, including p120-catenin, β-catenin and α-catenin forms the actin
cytoskeleton and regulate the signalling pathway (Appendix C-20). Major
changes in the cytoskeleton structure or loss of cell-cell adhesion or change of
expression level in these proteins indicates the disruption to the stability of the
AJ (Meng and Takeichi, 2009).
Down-regulation of CDH1 expression disrupts the structure of AJ and
help tumour cell proliferate and metastasize to distal cells. Gain of expression of
CDH1 on cancer cell help restore the AJ and decrease proliferation of cancer cell
157
(Conacci-Sorrell et al., 2002). Various studies on the epithelial derived tumours,
especially breast cancer, show that loss in CDH1 and its catenin members are
associated with the advanced stages and poor prognosis (Hartsock and Nelson,
2008). Normal hepatocyte junctions help regulate the flow of molecules and
maintain cellular polarity. However, studies show that the hepatocyte junctions
have been compromised for HCC. The level of AJ expression is significantly
lower for the advanced stage of HCC (Cao et al., 2007; Wickline et al., 2013).
The expressions of CDH1 swung from low negative fold-change to significant
positive fold-change in this study may indicate that hepatocyte junctions had
been re-built and proliferation of HepG2 decreased (Table 4.24; Figure 4.22).
SNAIL (SNAI1) and SLUG (SNAI2) genes play important roles in cancer
progression by suppressing the E-Cadherin and inducing the EMT, which results
in the acquisition of an invasive, mesenchymal phenotype by epithelial cells.
With its upregulation, it inhibits cell cycle and prevents cell death. However,
the high level of β-catenin may impair E-cadherin expression. HCC show high
level of β-catenin (Fabregat, 2009). The TGF-β family of signalling molecules
has been involved in the upregulation of SNAIL and SLUG as well as in EMT.
The dual roles of TGF-β in tumour suppression and tumour promotion just make
this pathway highly complex (Dhasarathy et al., 2011). The significant
downregulations of the SLUG across all the time-points of the treated HepG2
compared with time-points of untreated HepG2 (Table 4.24; Figure 4.22)
indicate the proliferation of HepG2 was suppressed.
158
5.2.20 Focal Adhesion Signalling Pathway
Focal adhesion (FA) is a dynamic protein complexes through which the
signalling events of interacting cell link to the ECM. The degradation of ECM
is observed in cancer invasion and metastasis. Cell invasion is a driving force in
malignant tumour diseases. Changes of contact of cell-cell and cell to ECM
adhesions, including changes of adhesion strength among cells or detachment of
cell from cytoskeletal structure, facilitate the invasion of cancer cells. It correlate
to the malignancy of cancer (Mierke, 2008).FA is the important link between the
actin cytoskeleton of the cell and its plasma membrane. This physical interaction
allows cells to communicate with their external environment and trigger various
responses, including cell attachment, migration, proliferation, differentiation,
and death. The proteins of FA are consistently associating with or disassociating
from it so that the signal is transmitted to different parts of the cell. Different
components are involved in the formation of the FA, including scaffolding
molecules, GTPases, and enzymes such as kinases, phosphatases, proteases, and
lipases (Appendix C-21).
Focal adhesion kinase (FAK) is phosphorylated and coupled with some
downstream effectors for various pathways for different responses. FAK
overexpression results in increased cell motility and suppresses apoptosis.
Multiple downstream signalling pathways, including PI3K/AKT and
BCAR1/Rac-1, are identified to mediate FAK regulation of migration of various
normal cells as well as invasion and metastasis of cancer cells (Wozniak et al.,
2004).
159
The study showed that HCC samples with positive expression of BCAR1
had worse pathohistological grades and TNM stages than samples with a
negative expression of BCAR1. It leads to the activation of the Ras family
GTPases, which plays a significant role in cancer progression. The patients with
positive expression of BCAR1 had higher chances to develop regional nodal
metastasis and worse prognosis. The upregulation of BCAR1 expression can
loosen the contact of cell-cell or cell-ECM adhesion which in turn enhances cell
migration from HCC. Furthermore, this type of BCAR1 phenotype HCC coming
with lower expression of E-cadherin and abnormal expression of β-catenin
proliferate faster and provide poorer prognosis. Same observation derived from
breast cancer samples, high level of BCAR1 is positively correlated with the
clinical stage of samples (Wozniak et al., 2004;Guo et al., 2008). The significant
down-regulations of BCAR1 were observed across all the time-points of extract-
treated HepG2 compared with time-points of untreated HepG2 (Table 4.25;
Figure 4.23). This may suggest that the extract suppressed proliferation of
HepG2.
ZYX is believed to have played an important role through its interaction
with integrins at FA. ZYX suppression inhibits cell growth. It is recruited from
cytoplasm to integrin-mediated focal complexes, which is converted into FA.
ZYX is overexpressed in most of HCC cases. Similar observations are found in
the melanoma samples (Sy et al., 2006). The significant down-regulations of
ZYX were observed across all the time-points of extract-treated HepG2
compared with time-points of untreated HepG2 (Table 4.25; Figure 4.23). This
may suggest that the extract suppressed proliferation of HepG2.
160
VASP promotes tumour growth by regulating focal adhesion dynamics
within the tumour microenvironment (Tu et al., 2015). Studies showed that
VASP proteins were found to be overexpressed in breast and colorectal cancers
(Stevenson et al., 2012). The significant down-regulations of VASP were
observed across all the time-points of extract-treated HepG2 compared with
time-points of untreated HepG2 (Table 4.25; Figure 4.23). It may suggest that
the extract suppressed proliferation of HepG2 in this pathway.
5.2.21 Natural Killer Cells Mediated Cytotoxicity Signalling
Pathway
NK cells are known to provide a first line of defence against invading
infectious microbes and tumour cells. Most of them locate at peripheral blood,
lymph nodes, spleen, and bone marrow and migrate towards inflammation by
chemoattractant. NK cells are unique compared with other immune cells. They
can recognize stressed cells in the absence of antibodies and MHC before
reacting promptly. Their role is critical because stressed cells without MHC 1
markers may skip the scrutiny by other immune cells, such as T lymphocyte
cells, let alone the destruction of these stressed cells. Mature NK cells have large
amounts of cytotoxic granules containing perforin and granzymes. Upon
stimulation of cytokines, such as IL-2, IL-12, IL-15, IL-18, IL-21 and type I
IFNs, NK cell transforms itself into lymphokine-activated killer (LAK) cells and
form synapses with stressed cells and release the perforin and granzyme to lyse
the stressed target. NK cells can initiate the transduction of death signals within
target cells through death receptor/ligand ligation (Appendix C-22).
161
Clinical studies show that using the approaches of therapeutic cytokines
via NK cells activate their differentiation and functions which in turn leads to a
more efficient elimination of tumour growth (Cheng et al., 2013; Wang et al.,
2015). TRAIL in NK cells, along with FASL, can trigger apoptosis in target cells
(Ames et al., 2009).As discussed, the downregulations of TRAIL across all time
points may indicate that the pathway was suppressed.
5.3 Cytotoxic effects of CCL on HepG2 and its Regulation on Selective
Genes
Although not expressing fold-change>2 or <-2, some of genes did show
relatively significant fold-change if the timepoints of treated samples were
compared with untreated samples’. These genes, including PI3KCA, EGFR,
PARD3, LCK, NUMB, RICTOR, LRP5 and JUN, were studied due to its
significant roles played in the progression of HCC.
PI3KCA is an oncogene of Phosphatidylinositol 3-kinase (PI3K)
pathway, main effector pathways of RAS, which regulates cell growth, cell cycle
entry, cell survival, cytoskeleton reorganization, and metabolism. In normal
cells, the activity of PI3Ks is tightly regulated by internal signals, like
phosphatase and tensin homolog (PTEN). PI3KCA triggers various signalling
pathway which may lead to cell growth and proliferation (Jun et al., 1999;
Engelman et al., 2006). This deregulation of the PI3K signalling pathway may
lead to mutations of receptor tyrosine kinases (RTKs), such as EGFR and HER2
which are positively associated with development in one-third of human cancers
162
(Thomas et al., 2007; Engelman, 2009; Liu et al., 2009b). In this study, PI3KCA
is relatively down-regulated across all the time-points of extract-treated HepG2
compared with time-points of untreated HepG2 (Table 4.9; Figure 4.7). This may
suggest that an extract has the suppressive effect on the HepG2.
JUN, AP-1 transcription factor, plays an active role in cell growth and
proliferation. It is the major regulators of the proliferative and stress responses
of mammalian cells leading to oncogenesis. It is downregulated in response to
osmotic stress and its downregulation promotes apoptosis (Xia et al., 2007;
Nakagawa and Maeda, 2012). The relatively down-regulating JUN were
observed across all the time-points of extract-treated HepG2 compared with
time-points of untreated HepG2 (Table 4.8; Figure 4.6). This may suggest that
extract promoted apoptosis and suppressed the growth of HepG2.
EGF and EGFR were overexpressed in many cancers, such as breast,
lung and liver cancers. Overexpression of EGFR has been observed in around
40-70 % of conventional HCC with poorer prognosis in most studies (Feitelson
et al., 2004; Buckley et al., 2008). EGF could be produced by autocrine and
paracrine from HCCs and overexpression of EGF/EGFR might be associated
with poor prognosis of patients with HCC (Berasain et al., 2009). Studies done
by Huang et al. (2014) provide evidence that EGF plays an initial role in the
development of the inflammation and in the promotion of cancer cells from low
metastatic potentials into high metastatic potential. The EGFR pathway has been
possibly involved in an increasing number of inflammatory mediators and in
extensive crosstalk with other signalling pathways. The banding of EGF and
EGFR could trigger signal transduction cascade in various cancer pathways,
163
including ERK-PI3K-AKT pathway, the RAS/RAF/MEK /MAPK pathway and
NF-B pathway (Buckley et al., 2008). The relatively down-regulating of EGFR
were observed across all the time-points of extract-treated HepG2 compared
with time-points of untreated HepG2 (Table 4.11; Figure 4.9). It may indicate
that the extract suppressed the proliferation of HepG2.
Partitioning defective 3 (PARD3) is a crucial component of partitioning-
defective complex proteins in AJ. Besides controlling cell polarity, it helps in
cell migration and facilitates cancer cell in EMT. EMT has been postulated to
play an important role in cancer metastasis. The study shows that up-regulation
of PARD3 expression in primary tumours has poor five-year overall survival
rates. It also shows its association with distant metastasis of cancer and poor
survival rates in HCC patients. It could be a novel prognostic biomarker and
therapeutic target for HCC (Jan et al., 2013). The relatively down-regulating of
PARD3 were observed across all the time-points of extract-treated HepG2
compared with time-points of untreated HepG2 (Table 4.24; Figure 4.22). It
may indicate migration of HepG2 in EMT was disrupted.
LCK, down-stream Src family kinase, is activated after T-cell receptor
(TCR) is bound by antigen presented in the major histocompatibility complex
(MHC) and in turn phosphorylate ZAP-70, which activate the mitogen-activated
protein kinases (MAPKs) pathway, including ERK, JNK and p38. LCK plays an
essential role in the maturation of developing lymphoid cells. High expressions
of LCK are found in metastatic cancers compared to their primary cancer (Choi
et al., 2012).
164
T cell or T lymphocytes, both CD4+ T helper cells (Th) and CD8+
cytotoxic T cells, are involved in killing tumour cells. It is activated in response
to pathogens via TCR (Appendix C-17). TCR stimulation triggers various
pathways, which in turn activates their downstream effectors, including JUN,
nuclear factor of activated T cells (NFAT) and NF-κB. The presence of T cell in
cancer areas is correlated with a favourable prognosis in many cancers. Studies
show the high expression of CD8+ in HCC provide positive prognosis while low
expression of CD4+ contribute to the malignancy of the cirrhosis and HCC
(Thompson et al., 2010).
Effector lymphocytes (CD4, cytotoxic CD8 cells) and regulatory T cells
(Tregs) are found in low amount in the human liver. CD4+CD25+ Tregs, the
most common Tregs, shut the immune response after invading antigens are
eliminated. Tregs attenuate the inflammation of hepatitis by suppressing the
CD4 and CD8. The presence of Tregs is positively correlated with disease
severity. Higher expression of Tregs is observed in advanced stages of HCC
compared with initial stages of HCC. Reduction of CD8 is noted in tumours
while Tregs is highly expressed (Oo and Sakaguchi, 2013; Sachdeva et al.,
2015).
Cellular signalling that is mediated by the Raf-1 and VEGF pathways
have been implicated in the molecular pathogenesis of hepatocellular
carcinoma(Llovet et al., 2008). Sorafenib acts by inhibiting VEGFRs and
PDGFRs and reduces the phosphorylation of ZAP70 by inhibiting the
165
phosphorylation of LCK. By activating T-cell signalling, it inhibits the
recruitment of ZAP70 and phosphorylation of LCK and ITAM (Zhao et al.,
2008). In this study, relatively down-regulating LCK were observed across all
the time-points of extract-treated HepG2 compared with time-points of untreated
HepG2 (Table 4.21; Figure 4.19; Table 4.26; Figure 4.24). This may suggest that
extract suppressed the growth of HepG2.
Relatively up-regulating NUMB, tumour inhibitor of NOTCH pathway,
were observed across all the time-points of extract-treated HepG2 compared
with time-points of untreated HepG2 (Strazzabosco and Fabris, 2012; Table
4.12; Figure 4.10). This may suggest that extract suppressed the growth of
HepG2.
Together with mTOR and PRR5/GβL, RICTOR activates AKT and plays
important role of mTOR pathway activation in human HCC (Villanueva et al.,
2008). The relatively down-regulating RICTOR was observed across all the
time-points of extract-treated HepG2 compared with time-points of untreated
HepG2 (Table 4.9; Figure 4.7). This may suggest that extract may suppress the
growth of the HepG2.
Lack of phosphorylation of LRP5/6 with the protein dishevelled (DVL)
in WNT pathway, WNT pathway is not activated (Giles et al., 2003; Clevers,
2006; Gordon and Nusse, 2006; Fatima et al., 2011). The relatively down-
regulating LRP5 of WNT pathway were observed across all the time-points of
extract-treated HepG2 in this experiment may suggest that less downstream
166
oncogenes in WNT pathway were activated (Table 4.15; Figure 4.13). This, in
turn, suppressed the proliferation of HepG2.
5.4 Properties of metabolites and their anti-tumour activities
In decades, attempts have been put in to categorize some anti-tumour
components derived from plants or TCM herbs by their chemical structures.
Many different types of phytochemicals have been derived from these natural
products. The major groups of them include alkaloids, terpenes, phenolic
compounds, steroids and their corresponding glycosides as well as saccharides
(including polysaccharides), amino acids and peptides. The chemical structures
of these reagents decide or affect their activities in various cancer pathways (Xia,
et al., 2014). The high abundance of diterpenes and sesquiterpenes in bark-PE
extract may indicate that they may play a significant role in inhibiting the growth
or proliferation of HepG2 in this study.
The classification of terpenes depends on the number of isoprene units
(C5H8) present in the skeleton of the product. It is the building block for various
terpenes. Diterpenes (C20H32) are composed of four isoprene units. Dimerization
of two isoprene units is called monoterpenes (C10H16). Having extra isoprene
units sequentially, sesquiterpenes (C15H24), diterpenes (C20H32), sesterterpenes
(C25H40), triterpenes (C30H48) and tetraterpenes (C40H64) are formed respectively
although their biosynthetic routes of forming are different (Lanzotti, 2013).
Terpenoids is one of the largest group of natural products, with 40,000
individual compounds identified. Besides its anti-microbial, anti-fungal, anti-
167
parasitic, antiviral, anti-allergenic, anti-spasmodic, anti-hyperglycemic, anti-
inflammatory, and immunomodulatory properties, terpenoids have also
exhibited its properties in inhibiting the growth of cancer cells. With the diverse
array of terpenoid structures and functions, it is believed that terpenoids have a
lot medical benefits which could be further explored (Thoppil & Bishayee, 2011).
Classified separately from terpenes, steroids, which are widely used in
the cancer treatment, belong to the group of isoprenoids as they originate from
triterpenes. During the process of the biosynthesis, its structure deviated from
the isoprene units with loss of carbon or various chemical reactions. Therefore,
they are classified separately from terpenes. Hundreds of steroids are widely
found in plants, animals and fungi. All steroids are synthesized from lanosterol,
a type of sterol in animal cells and fungi, or from cycloartenol in plants cells.
Both lanosterol and cycloartenol are in turn synthesized from the triterpene
squalene (Summons, et al., 2006).
Geranylgeraniol was found abundant in this plant extract. It is a
diterpenoid which is an important molecule in the synthesis of various terpenes,
including the acylation of proteins and the synthesis of retinol, retinal and phytol.
They are critical for the formation of various vitamins, including vitamins A, E
and K. Together with hexadecanoic acid, a saturated fatty acid, they showed anti-
fungal and anti-microbial, anti-inflammatory functions (Nair et al., 1984; Karau
et al., 2015). Research showed that sufficient production of diterpenes or
diterpenoids in macrophages produced sizable pro-inflammatory cytokines for
innate immune responses after detection of microbial infection(Kim et al., 2013).
168
Taxol, which is widely used as chemotherapy agents for various cancer
treatment, including breast cancer, ovarian carcinoma, melanoma and lung
cancer, is a diterpenoid with a taxadiene core (Rowinsky, 1997).
Studies showed that diterpenes exhibited their anti-tumour activities and
led to the decrease in cell proliferation and DNA damage. Besides exhibiting
anti-angiogenic and anti-inflammatory properties in epidemiological studies,
they have also showed their anti-proliferation activities against a panel of tumour
cell lines (Cardenas, et al., 2011). Their inhibitory effects on
hepatocarcinogenesis by apoptosis were also observed (Yan, et al, 2014; Thoppil
& Bishayee, 2011; Vergara, et al, 2014; Petiwala & Johnson, 2015). The
diterpenoids induce apoptosis and inhibit invasion of cancer cells via various
pathways, including PI3K/AKT pathway, MAPK pathway, NF-κB pathway,
HIF-1α pathway, FAK pathway (Xia, et al., 2014).
Sesquiterpenes have played important role in the prevention and
reduction of carcinogenesis by increasing the ROS as well as involving in
inflammatory response. They sensitize tumour cells to conventional drug
treatments (Chadwick, et al., 2013). Studies have showed that sesquiterpenes
extracted from chamomile and wild ginger exhibited anti-cancer activity in
HCC. They suppressed liver carcinogenesisand showed efficacy against HCC
(Thoppil & Bishayee, 2011). These sesquiterpenes blocked proliferation and
invasion of cancer cells via various pathways, including AKT/GSK3β pathway,
mTOR pathway, SMAD3 pathway, SNAIL/E-cadherin pathway, Notch-1
pathway and JNK pathway (Xia, et al., 2014).
169
The presence of these diverse chemical compounds in the extract of CCL
may indicate their role in inhibiting the growth and proliferation of HepG2.
Previous studies may have exhibited the inhibitory effects of individual chemical
compound on the carcinogenesis. However, the synergistic effects of these
compounds on the suppression of carcinogenesis were not much studied. The
richness of various terpenes in the extract may have showed the collective effects
of these chemical compounds in inhibiting the proliferation of HepG2 by
suppressing various cancer pathways as shown in the study.
170
CHAPTER 6
CONCLUSION
With the concentration of 20.41µg/ml, Bark-PE extract exhibited highest
inhibitory rate on HepG2. It regulated genes of various pathways in different
extent.
Its inhibitory effect on biological function of cells was obvious. NK cells
mediated cytotoxicity pathway, adherens junction, focal adhesion, chemokine
signalling are significantly suppressed. The downregulated LCK, SOS1, PI3KCA
and upregulating TRAIL in NK cells mediated cytotoxicity pathway indicate its
inhibitory effect against the progression of the cancer. The downregulated
BRAC1, ZYX, VASP, JUN, JUN-D, EGFR, SOS, PI3K, PARD3, SLUG, and
upregulated CDH1in adherens junction and focal adhesion shed the similar light.
Chemokine acted as a chemoattractant to guide the migration of cells was seen
down-regulated, which may indicate the inhibitory effects of the extract on
chemokine pathway too. This is reflected from its downregulated CCL20/CCR6,
IL-6R, β-arrestins, SOS1, BRCA1, ARRB2, IL-8, JUN, PARD3, and PI3KCA.
The inhibitory effect of extract was also observed in the pathways which
are widely implicated in cancers, including WNT pathway, Notch pathway,
mTOR pathway, ErbB pathway, and Apoptosis. WNT, LRP5/6 and FRA-1,
genes of WNT pathway are significantly down-regulated along with JUN. The
significantly down-regulated DDIT4, along with PI3KCA and RICTOR, also
indicate its inhibitory effects on mTOR pathway. The notably down-regulated
171
EGFR, AREG, EREG and SOS1 of ErbB pathway, along with PI3KCA and JUN,
also indicate the inhibitory effect of extract on the development of HepG2. The
down-regulated JAG1, HES1 and up-regulated NUMB in Notch pathway also
indicates the inhibitory effect of extract on the migration of HepG2. Its obvious
inhibitory effect was also observed in apoptosis pathway with its significant
upregulated TRAIL and down-regulated IRAK2. B cell pathway was obviously
suppressed with its CD22, along with SOS1, LCK, and PI3KCA down-regulated.
The genes for pathways related to pattern recognition receptors,
including Toll-like receptors (TLR), Nod-like receptors (NLR), and RIG-I-like
receptors have indicated the inhibitory effects of extract on their respective
pathways. The up-regulated MKK6 and down-regulated IL8, IL-6R, JUN,
PI3KCA of these pathways has indicated the suppression effect of the extract.
However, the suppression effect of these pattern recognition receptors is
counteracted by the cross-talk of down-regulated P38 of MAPK pathway. Low
expression of P38 is common in HCC. This counteracting effect of cross-talk by
P38 also was observed in VEGF pathway and T-cell pathway although down-
regulated SOS1, JUN, PI3K, LCK of these pathways has exerted inhibitory
effects on growth of HepG2.
MAPK pathway is considered favourably suppressed by CCL. Its genes,
including EGFR, SOS1, CACNA1H, JUN, JUN-D are downregulated while
MKK6 is upregulated. However, MAPK cascades usually do not operate
individually, but communicate with each other or with different signalling
pathways, generating a wide network. Through its wide range of cross-talk
172
possibilities with other pathways, including Toll-like, Nod-like, Rig-1 receptor
pathways, VEGF pathway, T-cell pathway, via specifically down-regulated P38,
may withhold the suppression effect of the extract on these pathways.
Cross-talk effect was also observed in cell cycle. Upregulation of SKP2,
CDC 6, CDC7 and down-regulation of CDKN2B may be conducive to the
growth of HCC. However, while the upregulation of RBL1 and downregulation
of WEE1 and CDC25Bwould inhibit the progression of HCC. CDKN2B have
showed the cross-talk effect on TGF-β pathway. The up-regulation of RBL1 and
down-regulation of ID1, ACVR1, FST of TGF-β pathway have indicated the
suppression effects of extracts on this pathway. Inhibitory effect was observed
in JAK-STATS pathway with its downregulated IL11, IL6R, PIM1, LIF. These
genes, together with ACVR1, also exerted its inhibitory effects on cytokine-
cytokine receptor interaction pathway although the up-regulation of PRLR may
indicate otherwise. The inhibitory effect of down-regulated WNT11 in Hedgehog
pathway was counteracted by the up-regulated SMO. Significant downregulated
of PAI-1, CDKN1A and up-regulated SESN1, SESN3 indicated its inhibitory
effect in P53 pathway.
The suppressive effect of the bark-PE extraction HepG2 is obviously
observed in the experiment. Genes highly expressed in hepatocellular carcinoma
(HCC) that were observed to be down-regulated in this study include IL8, IL11,
IL6R, CCL20, LIF, ACVR1, SOS1, BCAR1, VASP, ZYX, CD22, SLUG, IRAK2,
FOSL1, WNT11, PIM1, LIF, JAG1, HES1, AREG, EREG, DDIT4, IDI, FST,
ACVR1, JUND, WEE1, JUN, LCK, EGFR, PI3KCA, RICTOR, and PARD3 while
173
genes expressed low in HCC that were observed to be up-regulated significantly,
include MKK6, RBL1, TRAIL, and TNSRSF19. However, some genes, including
P38, SKP2 and SMO, exhibited cross-talks with some of the pathways and
counteract their inhibitory effect.
This finding is significant since it indicates that CCL has the inhibitory
effect on the HepG2. This provides the scientific proof for interested
communities to exploit further on its potential use clinically. The high
abundance of diterpenes and sesquiterpenes was noted in bark-PE extract. This
indicates that they are likely the potent inhibitors of liver cancer. It also paves
the way for future studies in CCL, including, but not limited to, identification of
active compounds of CCL as potent anti-HCC agent, expansion of experiment
for broader range of cancer cell lines and clinical study using CCL on HCC
subjects.
174
REFERENCES
Adjei, A.A., 2001. Blocking oncogenic Ras signaling for cancer therapy. Journal
of the National Cancer Institute, 93 (14), pp. 1062-1074.
Aggarwal, B.B., Vijayalekshmi, R.V. and Sung, B., 2009. Targeting
inflammatory pathways for prevention and therapy of cancer: short-term friend,
long-term foe. Clinical Cancer Research, 15 (2), pp. 425-430.
Akao, Y., Nakagawa, Y., Iinuma, M. and Nozawa, Y., 2008. Anticancer effects
of xanthones from pericarps of mangosteen. International Journal of Molecular
Sciences, 9 (3), pp. 355-370.
Akira, S., Uematsu, S. and Takeuchi, O., 2006. Pathogen recognition and innate
immunity. Cell, 124 (4), pp. 783-801.
American Association for Cancer Research. 2015. AACR Cancer Progress
Report 2015. Clinical Cancer Research, 21 (1), pp. S1-S128.
Ames, E., Hallett, W.H. and Murphy, W.J., 2009. Sensitization of human breast
cancer cells to natural killer cell-mediated cytotoxicity by proteasome inhibition.
Clinical and Experimental Immunology, 155 (3), pp. 504-513.
Asaga, S., et al., 2006. Identification of a new breast cancer-related gene by
restriction landmark genomic scanning. Anticancer Research, 26 (1a), pp. 35-
42.
Auffray, C., Imbeaud, S., Roux-Rouquié, M. and Hood, L., 2003. From
functional genomics to systems biology: concepts and practices. Comptes
Rendus Biologies, 326 (10–11), pp. 879-892.
Bagnato, A., Spinella, F. and Rosano, L., 2005. Emerging role of the endothelin
axis in ovarian tumor progression. Endocrine-Related Cancer, 12 (4), pp. 761-
772.
Barrett, J.C., 1993. Mechanisms of multistep carcinogenesis and carcinogen risk
assessment. Environmental Health Perspectives, 100, pp. 9-20.
Bennett, G.J., Harrison, L.J., Sia, G.-L. and Sim, K.-Y., 1993. Triterpenoids,
tocotrienols and xanthones from the bark of Cratoxylum Cochinchinense.
Phytochemistry, 32 (5), pp. 1245-1251.
Berasain, C., Castillo, J., Prieto, J. and Avila, M.A., 2007. New molecular targets
for hepatocellular carcinoma: the ErbB signaling system. Liver International, 27
(2), pp. 174-185.
Berasain, C., et al., 2009. The epidermal growth factor receptor: a link between
inflammation and liver cancer. Experimental Biology and Medicine, 234 (7), pp.
713-725.
175
Berasain, C., et al., 2011. Epidermal growth factor receptor (EGFR) crosstalks
in liver cancer. Cancers, 3 (2), pp. 2444-2461.
Bischoff, A., et al., 2015. A global microRNA screen identifies regulators of the
ErbB receptor signaling network. Cell Communication and Signaling, 13 (5),
pp. 1-15.
Boonnak, N., et al., 2009. Anti-Pseudomonas aeruginosa xanthones from the
resin and green fruits of Cratoxylum cochinchinense. Tetrahedron, 65 (15), pp.
3003-3013.
Brault, L., et al., 2010. PIM serine/threonine kinases in the pathogenesis and
therapy of hematologic malignancies and solid cancers. Haematologica, 95 (6),
pp. 1004-1015.
Bruix, J. et al., 2001. Clinical management of hepatocellular carcinoma.
Conclusions of the Barcelona-2000. Journal of Hepatology, 35, pp. 421-443.
Buckley, A.F., Burgart, L.J., Sahai, V. and Kakar, S., 2008. Epidermal growth
factor receptor expression and gene copy number in conventional hepatocellular
carcinoma. American Journal of Clinical Pathology, 129 (2), pp. 245-251.
Budanov, A.V. and Karin, M., 2008. The p53-regulated Sestrin gene products
inhibit mTOR signaling. Cell, 134 (3), pp. 451-460.
Buitrago-Molina, L.E., et al., 2013. The degree of liver injury determines the
role of p21 in liver regeneration and hepatocarcinogenesis in mice. Hepatology,
58 (3), pp. 1143-1152.
Calvisi, D.F., et al., 2006. Ubiquitous activation of Ras and Jak/Stat pathways in
human HCC. Gastroenterology, 130 (4), pp. 1117-1128.
Calvisi, D.F., et al., 2009. SKP2 and CKS1 promote degradation of cell cycle
regulators and are associated with hepatocellular carcinoma prognosis.
Gastroenterology, 137 (5), pp. 1816-1826.e10.
Cao, Y., Chang, H., Li, L., Cheng, R.C. and Fan, X.N., 2007. Alteration of
adhesion molecule expression and cellular polarity in hepatocellular carcinoma.
Histopathology, 51 (4), pp. 528-538.
Capaccione, K.M. and Pine, S.R., 2013. The Notch signaling pathway as a
mediator of tumor survival. Carcinogenesis, 34 (7), pp. 1420-1430.
Capece, D., et al., 2013. The inflammatory microenvironment in hepatocellular
carcinoma: a pivotal role for tumor-associated macrophages. BioMed Research
International, 2013, pp. 15.
Cardenas, C., Quesada, A. & Medina, M., 2011. Anti-Angiogenic and Anti-
Inflammatory Properties of Kahweol, a Coffee Diterpene. PLoS ONE, 6(8), p.
e23407.
176
Carmeliet, P. and Jain, R.K., 2000. Angiogenesis in cancer and other diseases.
Nature, 407 (6801), pp. 249-257.
Cervello, M., et al., 2012. Molecular mechanisms of Sorafenib action in liver
cancer cells. Cell Cycle, 11 (15), pp. 2843-2855.
Chen, K.J., et al., 2011. Selective recruitment of regulatory T cell through CCR6-
CCL20 in hepatocellular carcinoma fosters tumor progression and predicts poor
prognosis. PloS One, 6 (9), pp. e24671.
Chen, X.L., et al., 2010. Hepatocellular carcinoma-associated protein markers
investigated by MALDI-TOF MS. Molecular Medicine Reports, 3 (4), pp. 589-
596.
Cheng, A.L., et al., 2009. Efficacy and safety of Sorafenib in patients in the Asia-
Pacific region with advanced hepatocellular carcinoma: a phase III randomised,
double-blind, placebo-controlled trial. The Lancet Oncology, 10 (1), pp. 25-34.
Cheng, M., Chen, Y., Xiao, W., Sun, R. and Tian, Z., 2013. NK cell-based
immunotherapy for malignant diseases. Cellular & Molecular Immunology, 10
(3), pp. 230-252.
Chistiakov, D.A., 2010. Interferon induced with helicase C domain 1 (IFIH1)
and virus-induced autoimmunity: a review. Viral Immunology, 23 (1), pp. 3-15.
Choi, D.S., et al., 2012. Quantitative proteomics of extracellular vesicles derived
from human primary and metastatic colorectal cancer cells. Journal of
Extracellular Vesicles, 1, pp. 18704.
Clevers, H., 2006. Wnt/beta-catenin signaling in development and disease. Cell,
127 (3), pp. 469-480.
Conacci-Sorrell, M., Zhurinsky, J. and Ben-Ze'ev, A., 2002. The cadherin-
catenin adhesion system in signaling and cancer. The Journal of Clinical
Investigation, 109 (8), pp. 987-991.
Czekay, R.P., et al., 2011. PAI-1: An integrator of cell signaling and migration.
International Journal of Cell Biology, 2011, pp. 9.
Damiano, J.S., et al., 2013. Neutralization of prolactin receptor function by
monoclonal antibody LFA102, a novel potential therapeutic for the treatment of
breast cancer. Molecular Cancer Therapeutics, 12 (3), pp. 295-305.
Davanzo, R., et al., 2013. Human colostrum and breast milk contain high levels
of TNF-related apoptosis-inducing ligand (TRAIL). Journal of Human
Lactation, 29 (1), pp. 23-25.
de Martel, C. and Franceschi, S., 2009. Infections and cancer: established
associations and new hypotheses. Critical Reviews in Oncology/Hematology, 70
(3), pp. 183-194.
177
Demirkan, B., 2013. The roles of epithelial-to-mesenchymal transition (EMT)
and mesenchymal-to-epithelial transition (MET) in breast cancer bone
metastasis: potential targets for prevention and treatment. Journal of Clinical
Medicine, 2 (4), pp. 264-282.
Derynck, R., Akhurst, R.J. and Balmain, A., 2001. TGF-beta signaling in tumor
suppression and cancer progression. Nature Genetics, 29 (2), pp. 117-129.
Dhasarathy, A., Phadke, D., Mav, D., Shah, R.R. and Wade, P.A., 2011. The
transcription factors Snail and Slug activate the transforming growth factor-beta
signaling pathway in breast cancer. PloS One, 6 (10), pp. e26514.
Dhiman, R.K. and Chawla, Y.K., 2005. Herbal medicines for liver diseases.
Digestive Diseases and Sciences, 50 (10), pp. 1807-1812.
Di Virgilio, F., 2013. The therapeutic potential of modifying inflammasomes and
NOD-like receptors. Pharmacological Reviews, 65 (3), pp. 872-905.
Dou, S.S., et al., 2008. System biology and its application in compound recipe
of traditional Chinese medicine study. World Science and Technology, 10 (2),
pp. 116-121.
Engelman, J.A., 2009. Targeting PI3K signalling in cancer: opportunities,
challenges and limitations. Nature Reviews Cancer, 9 (8), pp. 550-562.
Engelman, J.A., Luo, J. and Cantley, L.C., 2006. The evolution of
phosphatidylinositol 3-kinases as regulators of growth and metabolism. Nature
Reviews Genetics, 7 (8), pp. 606-619.
Ernst, M. and Putoczki, T.L., 2014. Molecular pathways: IL11 as a tumor-
promoting cytokine-translational implications for cancers. Clinical Cancer
Research, 20 (22), pp. 5579-5588.
Fabregat, I., 2009. Dysregulation of apoptosis in hepatocellular carcinoma cells.
World Journal of Gastroenterology, 15 (5), pp. 513-520.
Fabregat, I., Roncero, C. and Fernandez, M., 2007. Survival and apoptosis: a
dysregulated balance in liver cancer. Liver International, 27 (2), pp. 155-162.
Falschlehner, C., Emmerich, C.H., Gerlach, B. and Walczak, H., 2007. TRAIL
signalling: decisions between life and death. The International Journal of
Biochemistry & Cell Biology, 39 (7-8), pp. 1462-1475.
Fatima, S., Lee, N.P. and Luk, J.M., 2011. Dickkopfs and Wnt/β-catenin
signalling in liver cancer. World Journal of Clinical Oncology, 2 (8), pp. 311-
325.
Feitelson, M.A., Pan, J. and Lian, Z., 2004. Early molecular and genetic
determinants of primary liver malignancy. The Surgical Clinics of North
America, 84 (2), pp. 339-354.
178
Ferlay, J., et al., 2013, GLOBOCAN 2012 V1.0, Cancer incidence and mortality
worldwide [Online]. Available at: http://globocan.iarc.fr [Accessed: 13
November 2015].
Fong, C.W., et al., 2006. Sprouty 2, an inhibitor of mitogen-activated protein
kinase signaling, is down-regulated in hepatocellular carcinoma. Cancer
Research, 66 (4), pp. 2048-2058.
Fortini, M.E., 2009. Notch signaling: the core pathway and its posttranslational
regulation. Developmental Cell, 16 (5), pp. 633-647.
Furqan, M., Mukhi, N., Lee, B. and Liu, D., 2013. Dysregulation of JAK-STAT
pathway in hematological malignancies and JAK inhibitors for clinical
application. Biomarker Research, 1, pp. 5.
Ge, S.L., 2008. Anti-cancer bioactive compounds of Cratoxylum
cochinchinense. PhD thesis, Shenyang Pharmaceutical University, China.
Giannelli, G., Mazzocca, A., Fransvea, E., Lahn, M. and Antonaci, S., 2011.
Inhibiting TGF-beta signaling in hepatocellular carcinoma. Biochimica et
Biophysica Acta, 1815 (2), pp. 214-223.
Giles, R.H., van Es, J.H. and Clevers, H., 2003. Caught up in a Wnt storm: Wnt
signaling in cancer. Biochimica et Biophysica Acta, 1653 (1), pp. 1-24.
Gordaliza, M., 2007. Natural products as leads to anticancer drugs. Clinical &
Translational Oncology, 9 (12), pp. 767-776.
Gordon, M.D. and Nusse, R., 2006. Wnt signaling: multiple pathways, multiple
receptors, and multiple transcription factors. Journal of Biological Chemistry,
281 (32), pp. 22429-22433.
Gordon, W.R., Arnett, K.L. and Blacklow, S.C., 2008. The molecular logic of
Notch signaling--a structural and biochemical perspective. Journal of Cell
Science, 121 (Pt 19), pp. 3109-3119.
Grigoriev, A., 2001. A relationship between gene expression and protein
interactions on the proteome scale: analysis of the bacteriophage T7 and the
yeast Saccharomyces cerevisiae. Nucleic Acids Research, 29 (17), pp. 3513-
3519.
Grivennikov, S.I., Greten, F.R. and Karin, M., 2010. Immunity, inflammation,
and cancer. Cell, 140 (6), pp. 883-899.
Gstaiger, M., et al., 2001. SKP2 is oncogenic and overexpressed in human
cancers. PNAS, 98 (9), pp. 5043-5048.
Guo, C., Liu, Q.G., Yang, W., Zhang, Z.L. and Yao, Y.M., 2008. Relation among
p130Cas, E-cadherin and beta-catenin expression, clinicopathologic significance
and prognosis in human hepatocellular carcinoma. Hepatobiliary & Pancreatic
Diseases International, 7 (5), pp. 490-496.
179
Guo, H., et al., 2014. Targeting the Notch signaling pathway in cancer
therapeutics. Thoracic Cancer, 5 (6), pp. 473-486.
Gupta, S., Takebe, N. and LoRusso, P., 2010. Targeting the Hedgehog pathway
in cancer. Medical Oncology, 2 (4), pp. 237-250.
Hamid, A.S., Tesfamariam, I.G., Zhang, Y. and Zhang, Z.G., 2013. Aflatoxin
B1-induced hepatocellular carcinoma in developing countries: Geographical
distribution, mechanism of action and prevention. Oncology Letters, 5 (4), pp.
1087-1092.
Hanahan, D. and Folkman, J., 1996. Patterns and emerging mechanisms of the
angiogenic switch during tumorigenesis. Cell, 86 (3), pp. 353-364.
Hanahan, D. and Weinberg, R.A., 2011. Hallmarks of cancer: the next
generation. Cell, 144 (5), pp. 646-674.
Harris, S.L. and Levine, A.J., 2005. The p53 pathway: positive and negative
feedback loops. Oncogene, 24 (17), pp. 2899-2908.
Hartsock, A. and Nelson, W.J., 2008. Adherens and tight junctions: structure,
function and connections to the actin cytoskeleton. Biochimica et Biophysica
Acta, 1778 (3), pp. 660-669.
Hawkins, M.J., 1995. Clinical trials of antiangiogenic agents. Current Opinion
in Oncology, 7 (1), pp. 90-93.
He, G. and Karin, M., 2011. NF-kappaB and STAT3 - key players in liver
inflammation and cancer. Cell Research, 21 (1), pp. 159-168.
Heinrich, P.C., et al., 2003. Principles of interleukin (IL)-6-type cytokine
signalling and its regulation. The Biochemical Journal, 374 (Pt 1), pp. 1-20.
Higgs, M.R., Lerat, H. and Pawlotsky, J.-M., 2010. Downregulation of
Gadd45beta expression by hepatitis C virus leads to defective cell cycle arrest.
Cancer Research, 70 (12), pp. 4901-4911.
Hiotis, S.P., et al., 2012. Hepatitis B vs. hepatitis C infection on viral hepatitis-
associated hepatocellular carcinoma. BMC Gastroenterology, 12, pp. 64.
Ho, C.K., Huang, Y.L. and Chen, C.C., 2002. Garcinone E, a xanthone
derivative, has potent cytotoxic effect against hepatocellular carcinoma cell
lines. Planta Medica, 68 (11), pp. 975-979.
Hoang, T.H., Cam, T.I. and Ha, V.S., 2006. Study on the ethyl acetate extract of
the leaves from Cratoxylum cochinchinese (Lour.) Blume. Tap Chi Hoa Hoc, 44
(1), pp. 71-75.
Hu, C. and Xu, G., 2014. Metabolomics and traditional Chinese medicine.
Trends in Analytical Chemistry, 61, pp. 207-214.
180
Huang, F. and Geng, X.P., 2010. Chemokines and hepatocellular carcinoma.
World Journal of Gastroenterology, 16 (15), pp. 1832-1836.
Huang, H., et al., 2005. SKP2 inhibits FOXO1 in tumor suppression through
ubiquitin-mediated degradation. PNAS, 102 (5), pp. 1649-1654.
Huang, P., et al., 2014. The role of EGF-EGFR signalling pathway in
hepatocellular carcinoma inflammatory microenvironment. Journal of Cellular
and Molecular Medicine, 18 (2), pp. 218-230.
Huang, Y., Tong, S., Tai, A.W., Hussain, M. and Lok, A.S., 2011. Hepatitis B
virus core promoter mutations contribute to hepatocarcinogenesis by
deregulating SKP2 and its target, p21. Gastroenterology, 141 (4), pp. 1412-
1421.
Huntzicker, E.G., et al., 2015. Differential effects of targeting Notch receptors
in a mouse model of liver cancer. Hepatology, 61 (3), pp. 942-952.
Hynes, N.E. and MacDonald, G., 2009. ErbB receptors and signaling pathways
in cancer. Current Opinion in Cell Biology, 21 (2), pp. 177-184.
Iwata, N., et al., 2000. Frequent hypermethylation of CpG islands and loss of
expression of the 14-3-3 sigma gene in human hepatocellular carcinoma.
Oncogene, 19 (46), pp. 5298-5302.
Iyoda, K., et al., 2003. Involvement of the p38 mitogen-activated protein kinase
cascade in hepatocellular carcinoma. Cancer, 97 (12), pp. 3017-3026.
Jain, A., Kaczanowska, S. and Davila, E., 2014. IL-1 receptor-associated kinase
signaling and its role in inflammation, cancer progression, and therapy
resistance. Frontiers in Immunology, 5, pp. 553.
Jan, Y.J., et al., 2013. Expression of partitioning defective 3 (Par-3) for
predicting extrahepatic metastasis and survival with hepatocellular carcinoma.
International Journal of Molecular Sciences, 14 (1), pp. 1684-1697.
Jin, S.L., Wang, N.L., Zhang, X., Dai, Y. and Yao, X.S., 2009. Two new
xanthones from the stems of Cratoxylum cochinchinense. Journal of Asian
Natural Products Research, 11 (4), pp. 322-325.
Jin, S., et al., 2002. GADD45-induced cell cycle G2-M arrest associates with
altered subcellular distribution of cyclin B1 and is independent of p38 kinase
activity. Oncogene, 21 (57), pp. 8696-8704.
Jun, T., Gjoerup, O. and Roberts, T.M., 1999. Tangled webs: evidence of cross-
talk between c-Raf-1 and Akt. Science's STKE, 1999 (13), pp. Pe1.
Kalra, N. and Kumar, V., 2006. The X protein of hepatitis B virus binds to the F
box protein SKP2 and inhibits the ubiquitination and proteasomal degradation
of c-Myc. FEBS Letters, 580 (2), pp. 431-436.
181
Karau, G.M., Njagi, E.N.M., Machocho, A.K., Wangai, L.N. and Nthinga, M.J.,
2015. Chemical composition and in vitro antioxidant activities of Ocimum
americanum. Advances in Analytical Chemistry, 5 (2), pp. 42-49.
Kaseb, A.O., 2013. Hepatocellular carcinoma-future outlook, 1st ed. Croatia:
InTech.
Katoh, Y. and Katoh, M., 2008. Hedgehog signaling, epithelial-to-mesenchymal
transition and miRNA (review). International Journal of Molecular Medicine,
22 (3), pp. 271-275.
Kawai, T. and Akira, S., 2011. Toll-like receptors and their crosstalk with other
innate receptors in infection and immunity. Immunity, 34 (5), pp. 637-650.
Kemter, E., et al., 2005. Molecular cloning, expression analysis and assignment
of the porcine tumor necrosis factor superfamily member 10 gene (TNFSF10) to
SSC13q34-->q36 by fluorescence in situ hybridization and radiation hybrid
mapping. Cytogenetic and Genome Research, 111 (1), pp. 74-78.
Kew, M.C., 2003. Synergistic interaction between aflatoxin B1 and hepatitis B
virus in hepatocarcinogenesis. Liver International, 23 (6), pp. 405-409.
Kidger, A.M. and Keyse, S.M., 2016. The regulation of oncogenic Ras/ERK
signalling by dual-specificity mitogen activated protein kinase phosphatases
(MKPs). Seminars in Cell & Developmental Biology, 50, pp. 125-132.
Kim, J., et al., 2013. Sufficient production of geranylgeraniol is required to
maintain endotoxin tolerance in macrophages. Journal of Lipid Research, 54
(12), pp. 3430-3437.
Kimball, S.R. and Jefferson, L.S., 2012. Induction of REDD1 gene expression
in the liver in response to endoplasmic reticulum stress is mediated through a
PERK, eIF2alpha phosphorylation, ATF4-dependent cascade. Biochemical and
Biophysical Research Communications, 427 (3), pp. 485-489.
Kimman, M., Norman, R., Jan, S., Kingston, D. and Woodward, M., 2012. The
burden of cancer in member countries of the Association of Southeast Asian
Nations (ASEAN). Asian Pacific Journal of Cancer Prevention, 13 (2), pp. 411-
420.
Kirikoshi, H., Sekihara, H. and Katoh, M., 2001. Molecular cloning and
characterization of human WNT11. International Journal of Molecular
Medicine, 8 (6), pp. 651-656.
Koltai, H. and Weingarten-Baror, C., 2008. Specificity of DNA microarray
hybridization: characterization, effectors and approaches for data correction.
Nucleic Acids Research, 36 (7), pp. 2395-2405.
Koul, H.K., Pal, M. and Koul, S., 2013. Role of p38 MAP kinase signal
transduction in solid tumors. Genes & Cancer, 4 (9-10), pp. 342-359.
182
Kristjansdottir, K. and Rudolph, J., 2004. Cdc25 phosphatases and cancer.
Chemistry & Biology, 11 (8), pp. 1043-1051.
Kutikhin, A.G. and Yuzhalin, A.E., 2012. C-type lectin receptors and RIG-I-like
receptors: new points on the oncogenomics map. Cancer Management and
Research, 4, pp. 39-53.
Lane, D. and Levine, A., 2010. p53 Research: the past thirty years and the next
thirty years. Cold Spring Harbor Perspectives in Biology, 2 (12), pp. a000893.
Lanzotti, V., 2013. Diterpenes for Therapeutic Use. Natural Products. pp. 3173-
3191 .
Laphookhieo, S., Syers, J.K., Kiattansakul, R. and Chantrapromma, K., 2006.
Cytotoxic and antimalarial prenylated xanthones from Cratoxylum
cochinchinense. Chemical & Pharmaceutical Bulletin, 54 (5), pp. 745-747.
Lappano, R. and Maggiolini, M., 2012. GPCRs and cancer. Acta
Pharmacologica Sinica, 33 (3), pp. 351-362.
Law, B.K., 2005. Rapamycin: an anti-cancer immunosuppressant? Critical
Reviews in Oncology/Hematology, 56 (1), pp. 47-60.
Lebrun, J.J., 2012. The dual role of TGF in human cancer: from tumor
suppression to cancer metastasis. ISRN Molecular Biology, 2012, pp. 28.
Lee, J.H., Budanov, A.V. and Karin, M., 2013. Sestrins orchestrate cellular
metabolism to attenuate aging. Cell Metabolism, 18 (6), pp. 792-801.
Lee, S. and Margolin, K., 2011. Cytokines in cancer immunotherapy. Cancers,
3 (4), pp. 3856-3893.
Lee, Y.H., et al., 2011. Abstract 1644: siRNA targeting of cell cycle kinase Wee1
inhibits hepatocullar carconima growth in vitro and in vivo. Cancer Research,
71 (8 Supplement), pp. 1644.
Li, L., et al., 2015. Regulatory MiR-148a-ACVR1/BMP circuit defines a cancer
stem cell-like aggressive subtype of hepatocellular carcinoma. Hepatology, 61
(2), pp. 574-584.
Li, X. and Li, Y.H., 1990. Guttiferae. Popularis Sin, 50 (2), pp. 1-112.
Liang, B., et al., 2013. Myeloid differentiation factor 88 promotes growth and
metastasis of human hepatocellular carcinoma. Clinical Cancer Research, 19
(11), pp. 2905-2916.
Lindon, J.C., Holmes, E. and Nicholson, J.K., 2007. Metabonomics in
pharmaceutical R&D. The FEBS Journal, 274 (5), pp. 1140-1151.
Liu, C.C., et al., 2014. 14-3-3σ induces heat shock protein 70 expression in
hepatocellular carcinoma. BioMed Central Cancer, 14 (425), pp. 1-11.
183
Liu, L., et al., 2009a. MEK1-independent activation of MAPK and MEK1-
dependent activation of p70 S6 kinase by stem cell factor (SCF) in ovarian
cancer cells. Biochemical and Biophysical Research Communications, 382 (2),
pp. 385-389.
Liu, M.S., 2003. Conservation and utilization of tropical medicine resources of
Hainan island. Molecular Plant Breeding, 1 (5), pp. 791-794.
Liu, P., Cheng, H., Roberts, T.M. and Zhao, J.J., 2009b. Targeting the
phosphoinositide 3-kinase pathway in cancer. Nature Reviews Drug Discovery,
8 (8), pp. 627-644.
Liu, X.Y., et al., 2005. Effective gene-virotherapy for complete eradication of
tumor mediated by the combination of TRAIL (TNFSF10) and plasminogen k5.
Molecular Therapy, 11 (4), pp. 531-541.
Liu, Y., et al., 2015. Interaction of key pathways in Sorafenib-treated
hepatocellular carcinoma based on a PCR-array. International Journal of
Clinical and Experimental Pathology, 8 (3), pp. 3027-3035.
Liu, Y. and Wu, F., 2010. Global burden of aflatoxin-induced hepatocellular
carcinoma: a risk assessment. Environmental Health Perspectives, 118 (6), pp.
818-824.
Llovet, J.M., et al., 2008. Sorafenib in advanced hepatocellular carcinoma. The
New England Journal of Medicine, 359 (4), pp. 378-390.
Lodygin, D. and Hermeking, H., 2006. Epigenetic silencing of 14-3-3sigma in
cancer. Seminars in Cancer Biology, 16 (3), pp. 214-224.
Lopez-Terrada, D., Cheung, S.W., Finegold, M.J. and Knowles, B.B., 2009.
HepG2 is a hepatoblastoma-derived cell line. Human Pathology, 40 (10), pp.
1512-1515.
Lu, C.C., et al., 2015. Upregulation of TLRs and IL-6 as a marker in human
colorectal cancer. International Journal of Molecular Sciences, 16 (1), pp. 159-
177.
Luo, G.A., Wang, Y.M., Liang, Q.L., Xie, Y.Y. and Xue-Mei, F., 2011. System
medicine and translational medicine. Mode of Traditional Chinese Medicine
Materia Medica, 13 (1), pp. 1-8.
Luo, J., Solimini, N.L. and Elledge, S.J., 2009. Principles of cancer therapy:
oncogene and non-oncogene addiction. Cell, 136 (5), pp. 823-837.
Magnuson, N.S., Wang, Z., Ding, G. and Reeves, R., 2010. Why target PIM1 for
cancer diagnosis and treatment? Future Oncology, 6 (9), pp. 1461-1478.
Mahabusarakam, W., Nuangnaowarat, W. and Taylor, W.C., 2006. Xanthone
derivatives from Cratoxylum cochinchinense roots. Phytochemistry, 67 (5), pp.
470-474.
184
Mans, D.R., da Rocha, A.B. and Schwartsmann, G., 2000. Anti-cancer drug
discovery and development in Brazil: targeted plant collection as a rational
strategy to acquire candidate anti-cancer compounds. The Oncologist, 5 (3), pp.
185-198.
Marhenke, S., et al., 2014. p21 promotes sustained liver regeneration and
hepatocarcinogenesis in chronic cholestatic liver injury. Gut, 63 (9), pp. 1501-
1512.
Martin, T.A. and Jiang, W.G., 2009. Loss of tight junction barrier function and
its role in cancer metastasis. Biochimica et Biophysica Acta, 1788 (4), pp. 872-
891.
Masaki, T., et al., 2003. Cyclins and cyclin-dependent kinases: comparative
study of hepatocellular carcinoma versus cirrhosis. Hepatology, 37 (3), pp. 534-
543.
Masoumi-Moghaddam, S., Amini, A. and Morris, D.L., 2014. The developing
story of Sprouty and cancer. Cancer Metastasis Reviews, 33 (2-3), pp. 695-720.
Massagué, J., 2008. TGFβ in Cancer. Cell, 134 (2), pp. 215-230.
Mazrouei, S., et al., 2012. Apoptosis inhibition or inflammation: the role of
NAIP protein expression in Hodgkin and non-Hodgkin lymphomas compared to
non-neoplastic lymph node. Journal of Inflammation, 9 pp. 4.
Meng, W. and Takeichi, M., 2009. Adherens junction: molecular architecture
and regulation. Cold Spring Harbor Perspectives in Biology, 1 (6), pp. a002899.
Merchant, A.A. and Matsui, W., 2010. Targeting Hedgehog--a cancer stem cell
pathway. Clinical Cancer Research, 16 (12), pp. 3130-3140.
Mierke, C.T., 2008. Role of the endothelium during tumor cell metastasis: is the
endothelium a barrier or a promoter for cell invasion and metastasis? Journal of
Biophysics, 2008, pp. 13.
Min, L., He, B. and Hui, L., 2011. Mitogen-activated protein kinases in
hepatocellular carcinoma development. Seminars in Cancer Biology, 21 (1), pp.
10-20.
Mishra, L., Shetty, K., Tang, Y., Stuart, A. and Byers, S.W., 2005. The role of
TGF- and Wnt signaling in gastrointestinal stem cells and cancer. Oncogene,
24 (37), pp. 5775-5789.
Morell, C.M. and Strazzabosco, M., 2014. Notch signaling and new therapeutic
options in liver disease. Journal of Hepatology, 60 (4), pp. 885-890.
Moskalev, A.A., et al., 2012. Gadd45 proteins: relevance to aging, longevity and
age-related pathologies. Ageing Research Reviews, 11 (1), pp. 51-66.
185
Nagaraj, N.S. and Datta, P.K., 2010. Targeting the transforming growth factor-
beta signaling pathway in human cancer. Expert Opinion on Investigational
Drugs, 19 (1), pp. 77-91.
Nair, P.P., et al., 1984. Diet, nutrition intake, and metabolism in populations at
high and low risk for colon cancer. Dietary cholesterol, beta-sitosterol, and
stigmasterol. The American Journal of Clinical Nutrition, 40 (4 Suppl), pp. 927-
930.
Nakagawa, H. and Maeda, S., 2012. Molecular mechanisms of liver injury and
hepatocarcinogenesis: focusing on the role of stress-activated MAPK. Pathology
Research International, 2012, pp. 14.
Necula, L.G., et al., 2012. IL-6 and IL-11 as markers for tumor aggressiveness
and prognosis in gastric adenocarcinoma patients without mutations in Gp130
subunits. Journal of Gastrointestinal and Liver Diseases, 21 (1), pp. 23-29.
Nejak-Bowen, K. and Monga, S.P.S., 2008. Wnt/β-catenin signaling in hepatic
organogenesis. Organogenesis, 4 (2), pp. 92-99.
Newman, D.J. and Cragg, G.M., 2012. Natural products as sources of new drugs
over the 30 years from 1981 to 2010. Journal of natural Products, 75 (3), pp.
311-335.
Nguyen, H.D., et al., 2011. Xanthones from the twigs of Cratoxylum
cochinchinense. Phytochemistry Letters, 4 (1), pp. 48-51.
Nguyen, L.H.D. and Harrison, L.J., 1999. Triterpenoid and xanthone
constituents of Cratoxylum cochinchinense. Phytochemistry, 50 (3), pp. 471-
476.
Ohrnberger, S., et al., 2015. Dysregulated serum response factor triggers
formation of hepatocellular carcinoma. Hepatology, 61 (3), pp. 979-989.
Oo, Y.H. and Sakaguchi, S., 2013. Regulatory T-cell directed therapies in liver
diseases. Journal of Hepatology, 59 (5), pp. 1127-1134.
Paulino, V.M., et al., 2010. TROY (TNFRSF19) is overexpressed in advanced
glial tumors and promotes glioblastoma cell invasion via Pyk2-Rac1 signaling.
Molecular Cancer Research, 8 (11), pp. 1558-1567.
Petiwala, S. & Johnson, J., 2015. Diterpenes from rosemary (Rosmarinus
officinalis): Defining their potential for anti-cancer activity.. Cancer Letters, 367,
pp. 93-102.
Phuwapraisirisan, P., Udomchotphruet, S., Surapinit, S. and Tip-Pyang, S.,
2006. Antioxidant xanthones from Cratoxylum cochinchinense. Natural Product
Research, 20 (14), pp. 1332-1337.
Poon, R.T., et al., 2004. Clinical significance of thrombospondin 1 expression in
hepatocellular carcinoma. Clinical Cancer Research, 10 (12 Pt 1), pp. 4150-
4157.
186
Purohit, V., Rapaka, R., Kwon, O.S. and Song, B.J., 2013. Roles of alcohol and
tobacco exposure in the development of hepatocellular carcinoma. Life Sciences,
92 (1), pp. 3-9.
Qin, Y., Liu, J.Y., Li, B., Sun, Z.L. and Sun, Z.F., 2004. Association of low
p16INK4a and p15INK4b mRNAs expression with their CpG islands
methylation with human hepatocellular carcinogenesis. World Journal of
Gastroenterology, 10 (9), pp. 1276-1280.
Qiu, W., et al., 2003. Down-regulation of growth arrest DNA damage-inducible
gene 45beta expression is associated with human hepatocellular carcinoma. The
American Journal of Pathology, 162 (6), pp. 1961-1974.
Ramadori, G. and Cameron, S., 2010. Effects of systemic chemotherapy on the
liver. Annals of Hepatology, 9 (2), pp. 133-143.
Raman, D., Sobolik-Delmaire, T. and Richmond, A., 2011. Chemokines in
health and disease. Experimental Cell Research, 317 (5), pp. 575-589.
Ranganathan, P., Weaver, K.L. and Capobianco, A.J., 2011. Notch signalling in
solid tumours: a little bit of everything but not all the time. Nature Reviews
Cancer, 11 (5), pp. 338-351.
Refaat, A., Abd-Rabou, A. and Reda, A., 2014. TRAIL combinations: The new
‘trail’ for cancer therapy (Review). Oncology Letters, 7 (5), pp. 1327-1332.
Ren, X., Hu, B. and Colletti, L., 2008. Stem cell factor and its receptor, c-kit, are
important for hepatocyte proliferation in wild-type and tumor necrosis factor
receptor-1 knockout mice after 70% hepatectomy. Surgery, 143 (6), pp. 790-
802.
Ren, Y., et al., 2011. Cytotoxic and NF-kappaB inhibitory constituents of the
stems of Cratoxylum cochinchinense and their semisynthetic analogues. Journal
of Natural Products, 74 (5), pp. 1117-1125.
Richards, C.D., 2013. The enigmatic cytokine oncostatin M and roles in disease.
ISRN Inflammation, 2013, pp. 23.
Roberts, P.J. and Der, C.J., 2007. Targeting the Raf-MEK-ERK mitogen-
activated protein kinase cascade for the treatment of cancer. Oncogene, 26 (22),
pp. 3291-3310.
Romero, I.G., Ruvinsky, I. and Gilad, Y., 2012. Comparative studies of gene
expression and the evolution of gene regulation. Nature Reviews Genetics, 13
(7), pp. 505-516.
Rossmanith, W., et al., 2002. Follistatin overexpression in rodent liver tumors: a
possible mechanism to overcome activin growth control. Molecular
Carcinogenesis, 35 (1), pp. 1-5.
187
Rowinsky, E., 1997. The development and clinical utility of the taxane class of
antimicrotubule chemotherapy agents. Annual Review Of Medicine, 48, pp. 353-
374.
Rubie, C., et al., 2006. Enhanced expression and clinical significance of CC-
chemokine MIP-3 alpha in hepatocellular carcinoma. Scandinavian Journal of
Immunology, 63 (6), pp. 468-477.
Sachdeva, M., Chawla, Y.K. and Arora, S.K., 2015. Immunology of
hepatocellular carcinoma. World Journal of Hepatology, 7 (17), pp. 2080-2090.
Safarzadeh, E., Sandoghchian Shotorbani, S. and Baradaran, B., 2014. Herbal
medicine as inducers of apoptosis in cancer treatment. Advanced
Pharmaceutical Bulletin, 4 (Suppl 1), pp. 421-427.
Samuel, T., et al., 2001. The G2/M regulator 14-3-3sigma prevents apoptosis
through sequestration of Bax. The Journal of Biological Chemistry, 276 (48),
pp. 45201-45206.
Sansone, P. and Bromberg, J., 2012. Targeting the interleukin-6/Jak/stat
pathway in human malignancies. Journal of Clinical Oncology, 30 (9), pp.
1005-1014.
Sapra, P., et al., 2013. Long-term tumor regression induced by an antibody-drug
conjugate that targets 5T4, an oncofetal antigen expressed on tumor-initiating
cells. Molecular Cancer Therapeutics, 12 (1), pp. 38-47.
Sarvaiya, P.J., Guo, D., Ulasov, I., Gabikian, P. and Lesniak, M.S., 2013.
Chemokines in tumor progression and metastasis. Oncotarget, 4 (12), pp. 2171-
2185.
Saxena, M. and Yeretssian, G., 2014. NOD-like receptors: master regulators of
inflammation and cancer. Frontiers in Immunology, 5, pp. 327.
Scales, S.J. and de Sauvage, F.J., 2009. Mechanisms of Hedgehog pathway
activation in cancer and implications for therapy. Trends in Pharmacological
Sciences, 30 (6), pp. 303-312.
Scheel, C. and Weinberg, R.A., 2012. Cancer stem cells and epithelial-
mesenchymal transition: concepts and molecular links. Seminars in Cancer
Biology, 22 (5-6), pp. 396-403.
Schmitt, M., Horbach, A., Kubitz, R., Frilling, A. and Haussinger, D., 2004.
Disruption of hepatocellular tight junctions by vascular endothelial growth
factor (VEGF): a novel mechanism for tumor invasion. Journal of Hepatology,
41 (2), pp. 274-283.
Schon, S., et al., 2014. Beta-catenin regulates NF-kappaB activity via
TNFRSF19 in colorectal cancer cells. International Journal of Cancer, 135 (8),
pp. 1800-1811.
188
Schreiber, G. and Walter, M.R., 2010. Cytokine-receptor interactions as drug
targets. Current Opinion in Chemical Biology, 14 (4), pp. 511-519.
Sharma, S.V. and Settleman, J., 2007. Oncogene addiction: setting the stage for
molecularly targeted cancer therapy. Genes & Development, 21 (24), pp. 3214-
3231.
Sheen, Y.Y., Kim, M.J., Park, S.A., Park, S.Y. and Nam, J.S., 2013. Targeting
the transforming growth factor-β signaling in cancer therapy.Biomolecules &
Therapeutics, 21 (5), pp. 323-331.
Shibuya, M., 2011. Vascular endothelial growth factor (VEGF) and its receptor
(VEGFR) signaling in angiogenesis: a crucial target for anti- and pro-angiogenic
therapies. Genes & Cancer, 2 (12), pp. 1097-1105.
Shyur, L.F. and Yang, N.S., 2008. Metabolomics for phytomedicine research
and drug development. Current Opinion in Chemical Biology, 12 (1), pp. 66-
71.
Sicklick, J.K., et al., 2006. Dysregulation of the Hedgehog pathway in human
hepatocarcinogenesis. Carcinogenesis, 27 (4), pp. 748-757.
Sieuwerts, A.M., et al., 2006. Which cyclin E prevails as prognostic marker for
breast cancer? Results from a retrospective study involving 635 lymph node-
negative breast cancer patients. Clinical Cancer Research, 12 (11 Pt 1), pp.
3319-3328.
Sobolesky, P.M. and Moussa, O., 2013. The role of beta-arrestins in cancer.
Progress in Molecular Biology and Translational Science, 118, pp. 395-411.
Soepadmo, E. and Wong, K.M., 1995. Tree flora of Sabah and Sarawak volume
1, 1st ed. Malaysia: Joint publication of Sabah Forestry Department, Forest
Research Institute Malaysia and Saraway Forestry Department.
Staib, F., Hussain, S.P., Hofseth, L.J., Wang, X.W. and Harris, C.C., 2003. TP53
and liver carcinogenesis. Human Mutation, 21 (3), pp. 201-216.
Stauffer, J.K., Scarzello, A.J., Jiang, Q. and Wiltrout, R.H., 2012. Chronic
inflammation, immune escape, and oncogenesis in the liver: a unique
neighborhood for novel intersections. Hepatology, 56 (4), pp. 1567-1574.
Stevenson, R.P., Veltman, D. and Machesky, L.M., 2012. Actin-bundling
proteins in cancer progression at a glance. Journal of Cell Science, 125 (Pt 5),
pp. 1073-1079.
Strazzabosco, M. and Fabris, L., 2012. Notch signaling in hepatocellular
carcinoma: guilty in association! Gastroenterology, 143 (6), pp. 1430-1434.
Summons, R., Bradley, A., Jahnke, L. & Waldbauer, J., 2006. Steroids,
triterpenoids and molecular oxygen. Philosophical Transactions of the Royal
Society B: Biological Sciences, 361(1470), pp. 951-968.
189
Sy, S.M., et al., 2006. Novel identification of zyxin upregulations in the motile
phenotype of hepatocellular carcinoma. Modern Pathology, 19 (8), pp. 1108-
1116.
Takigawa, Y. and Brown, A.M., 2008. Wnt signaling in liver cancer. Current
Drug Targets, 9 (11), pp. 1013-1024.
Tamura, R.E., et al., 2012. GADD45 proteins: central players in tumorigenesis.
Current Molecular Medicine, 12 (5), pp. 634-651.
Tang, K.H., et al., 2012. CD133(+) liver tumor-initiating cells promote tumor
angiogenesis, growth, and self-renewal through neurotensin/interleukin-
8/CXCL1 signaling. Hepatology, 55 (3), pp. 807-820.
Tang, S.Y., Whiteman, M., Jenner, A., Peng, Z.F. and Halliwell, B., 2004a.
Mechanism of cell death induced by an antioxidant extract of Cratoxylum
cochinchinense (YCT) in Jurkat T cells: the role of reactive oxygen species and
calcium. Free Radical Biology & Medicine, 36 (12), pp. 1588-1611.
Tang, S.Y., et al., 2004b. Characterization of antioxidant and antiglycation
properties and isolation of active ingredients from traditional chinese medicines.
Free Radical Biology and Medicine, 36 (12), pp. 1575-1587.
Thomas, M.B. and Abbruzzese, J.L., 2005. Opportunities for targeted therapies
in hepatocellular carcinoma. Journal of Clinical Oncology, 23 (31), pp. 8093-
108.
Thomas, R.K., et al., 2007. High-throughput oncogene mutation profiling in
human cancer. Nature Genetics, 39 (3), pp. 347-351.
Thomas, S. and Balan, A., 2012. Retinoblastoma tumour suppresor gene: an
overview. Journal of Indian Academy of Oral Medicine and Radiology, 24 (1),
pp. 30-35.
Thompson, E.D., Enriquez, H.L., Fu, Y.X. and Engelhard, V.H., 2010. Tumor
masses support naive T cell infiltration, activation, and differentiation into
effectors. The Journal of Experimental Medicine, 207 (8), pp. 1791-1804.
Thoppil, R. and Bishayee, A., 2011. Terpenoids as potential chemopreventive
and therapeutic agents in liver cancer. World Journal of Hepatology, 3(9), pp.
228-249.
Thorgeirsson, S.S. and Grisham, J.W., 2002. Molecular pathogenesis of human
hepatocellular carcinoma. Nature Genetics, 31 (4), pp. 339-346.
Toogood, P.L., 2002. Progress toward the development of agents to modulate
the cell cycle. Current Opinion in Chemical Biology, 6 (4), pp. 472-478.
Torre, L.A., et al., 2015. Global cancer statistics, 2012. CA: A Cancer Journal
for Clinicians, 65 (2), pp. 87-108.
190
Trikha, M., Corringham, R., Klein, B. and Rossi, J.F., 2003. Targeted anti-
interleukin-6 monoclonal antibody therapy for cancer: a review of the rationale
and clinical evidence. Clinical Cancer Research, 9 (13), pp. 4653-4665.
Tu, K., et al., 2015. Vasodilator-stimulated phosphoprotein promotes activation
of hepatic stellate cells by regulating Rab11-dependent plasma membrane
targeting of transforming growth factor beta receptors. Hepatology, 61 (1), pp.
361-374.
Tyakht, A.V., et al., 2014. RNA-Seq gene expression profiling of HepG2 cells:
the influence of experimental factors and comparison with liver tissue. BMC
Genomics, 15 (1), pp. 1-9.
Udomchotphruet, S., Phuwapraisirisan, P., Sichaem, J. and Tip-pyang, S., 2012.
Xanthones from the stems of Cratoxylum cochinchinense. Phytochemistry, 73,
pp. 148-151.
Vergara, D., et al., 2014. Antitumor activity of the dietary diterpene carnosol
against a panel of human cancer cell lines. Food Function, 5, pp. 1261-1269.
Villanueva, A., et al., 2012. Notch signaling is activated in human hepatocellular
carcinoma and induces tumor formation in mice. Gastroenterology, 143 (6), pp.
1660-1669.e7.
Villanueva, A., et al., 2008. Pivotal role of mTOR signaling in hepatocellular
carcinoma. Gastroenterology, 135 (6), pp. 1972-1983.
Vogelstein, B., Lane, D. and Levine, A.J., 2000. Surfing the p53 network.
Nature, 408 (6810), pp. 307-310.
Vroon, A., Heijnen, C.J. and Kavelaars, A., 2006. GRKs and arrestins: regulators
of migration and inflammation. Journal of Leukocyte Biology, 80 (6), pp. 1214-
1221.
Wang, W., Erbe, A.K., Hank, J.A., Morris, Z.S. and Sondel, P.M., 2015. NK
cell-mediated antibody-dependent cellular cytotoxicity in cancer
immunotherapy. Frontiers in Immunology, 6 pp. 368.
Wang, Z., Wang, N., Chen, J. and Shen, J., 2012. Emerging glycolysis targeting
and drug discovery from chinese medicine in cancer therapy. Evidence-based
Complementary and Alternative Medicine, 2012, pp. 873175.
Waugh, D.J. and Wilson, C., 2008. The interleukin-8 pathway in cancer. Clinical
Cancer Research, 14 (21), pp. 6735-6741.
Weinstein, I.B., 2002. Cancer. Addiction to oncogenes--the Achilles heal of
cancer. Science, 297 (5578), pp. 63-64.
Weinstein, I.B. and Joe, A.K., 2006. Mechanisms of disease: oncogene
addiction--a rationale for molecular targeting in cancer therapy. Nature Clinical
Practice Oncology, 3 (8), pp. 448-457.
191
Wickline, E.D., Du, Y., Stolz, D.B., Kahn, M. and Monga, S.P., 2013. gamma-
catenin at adherens junctions: mechanism and biologic implications in
hepatocellular cancer after beta-catenin knockdown. Neoplasia, 15 (4), pp. 421-
434.
Williams, J.H., et al., 2004. Human aflatoxicosis in developing countries: a
review of toxicology, exposure, potential health consequences, and
interventions. The American Journal of Clinical Nutrition, 80 (5), pp. 1106-
1122.
Wozniak, M.A., Modzelewska, K., Kwong, L. and Keely, P.J., 2004. Focal
adhesion regulation of cell behavior. Biochimica et Biophysica Acta, 1692 (2-3),
pp. 103-119.
Wu, X. and Li, Y., 2012a. Signaling pathways in liver cancer, 1st ed. US:
InTech.
Wu, X. and Li, Y., 2012b. Signaling pathways in liver cancer. In: Julianov, A.
(ed.) Liver tumors. Croatia: InTech, pp. 37-58.
Xia, J.F., Liang, Q.L., Hu, P., Wang, Y.M. and Luo, G.A., 2009. Recent trends
in strategies and methodologies for metabonomics. Chinese Journal of
Analytical Chemistry, 37 (1), pp. 136-143.
Xia, J.F., et al., 2014. A map describing the association between effective
components of traditional Chinese medicine and signaling pathways in cancer
cells in vitro and in vivo.. Drug Discoveries & Therapeutics, 8(4), pp. 139-153.
Xia, Y., et al., 2007. MEKK1 mediates the ubiquitination and degradation of c-
Jun in response to osmotic stress. Molecular and Cellular Biology, 27 (2), pp.
510-517.
Xu, K., Liu, P. and Wei, W., 2014. mTOR signaling in tumorigenesis.
Biochimica et Biophysica Acta- Reviews on Cancer, 1846 (2), pp. 638-654.
Yamaguchi, R., et al., 1998. Expression of vascular endothelial growth factor in
human hepatocellular carcinoma. Hepatology, 28 (1), pp. 68-77.
Yan, M., et al., 1994. Activation of stress-activated protein kinase by MEKK1
phosphorylation of its activator SEK1. Letters to Nature, 372 (6508), pp. 798-
800.
Yan, X., Chua, M.S., He, J. and So, S., 2008. Small interfering RNA targeting
CDC25B inhibits liver tumor growth in vitro and in vivo. Molecular Cancer, 7
(1), pp. 1-9.
Yan X.J., et al., 2014. Triterpenoids as reversal agents for anticancer drug
resistance treatment. Drug Discovery Today, 19(4), pp. 482-488.
192
Yang, H.Y., Wen, Y.Y., Chen, C.H., Lozano, G. and Lee, M.H., 2003. 14-3-3
sigma positively regulates p53 and suppresses tumor growth. Molecular and
Cellular Biology, 23 (20), pp. 7096-7107.
Yang, Y., et al., 2015. beta-Arrestin1 enhances hepatocellular carcinogenesis
through inflammation-mediated Akt signalling. Nature Communications, 6, pp.
7369.
Yasmin Anum, M.Y., et al., 2009. Combined assessment of TGF-beta-1 and
alpha-fetoprotein values improves specificity in the diagnosis of hepatocellular
carcinoma and other chronic liver diseases in Malaysia. The Medical Journal of
Malaysia, 64 (3), pp. 223-227.
Yeh, Y.T., Lee, K.T., Tsai, C.J., Chen, Y.J. and Wang, S.N., 2012. Prolactin
promotes hepatocellular carcinoma through Janus kinase 2. World Journal of
Surgery, 36 (5), pp. 1128-1135.
Yin, S.Y., Wei, W.C., Jian, F.Y. and Yang, N.S., 2013. Therapeutic applications
of herbal medicines for cancer patients. Evidence-based Complementary and
Alternative Medicine, 2013, pp. 302426.
Yu, H.Y., et al., 2009. Two new benzophenone glucosides from Cratoxylon
cochinchinensis. Chinese Chemical Letters, 20 (4), pp. 459-461.
Zhang, H. and Chin, A.I., 2014. Role of Rip2 in development of tumor-
infiltrating MDSCs and bladder cancer metastasis. PloS One, 9 (4), pp. e94793.
Zhang, H., et al., 2003. Mechanism of beta 1-integrin-mediated hepatoma cell
growth involves p27 and S-phase kinase-associated protein 2. Hepatology, 38
(2), pp. 305-313.
Zhao, S., Fung-Leung, W.P., Bittner, A., Ngo, K. and Liu, X., 2014. Comparison
of RNA-Seq and microarray in transcriptome profiling of activated T cells. PloS
One, 9 (1), pp. e78644.
Zhao, W., Gu, Y.H., Song, R., Qu, B.Q. and Xu, Q., 2008. Sorafenib inhibits
activation of human peripheral blood T cells by targeting LCK phosphorylation.
Leukemia, 22 (6), pp. 1226-1233.
Zhu, C., Liang, Q.L., Wang, Y.M. and Luo, G.A., 2010. Integrated development
of metabonomics and its new progress. Chinese Journal of Analytical Chemistry,
38 (7), pp. 1060-1068.
Zlotnik, A. and Yoshie, O., 2000. Chemokines: a new classification system and
their role in immunity. Immunity, 12 (2), pp. 121-127.
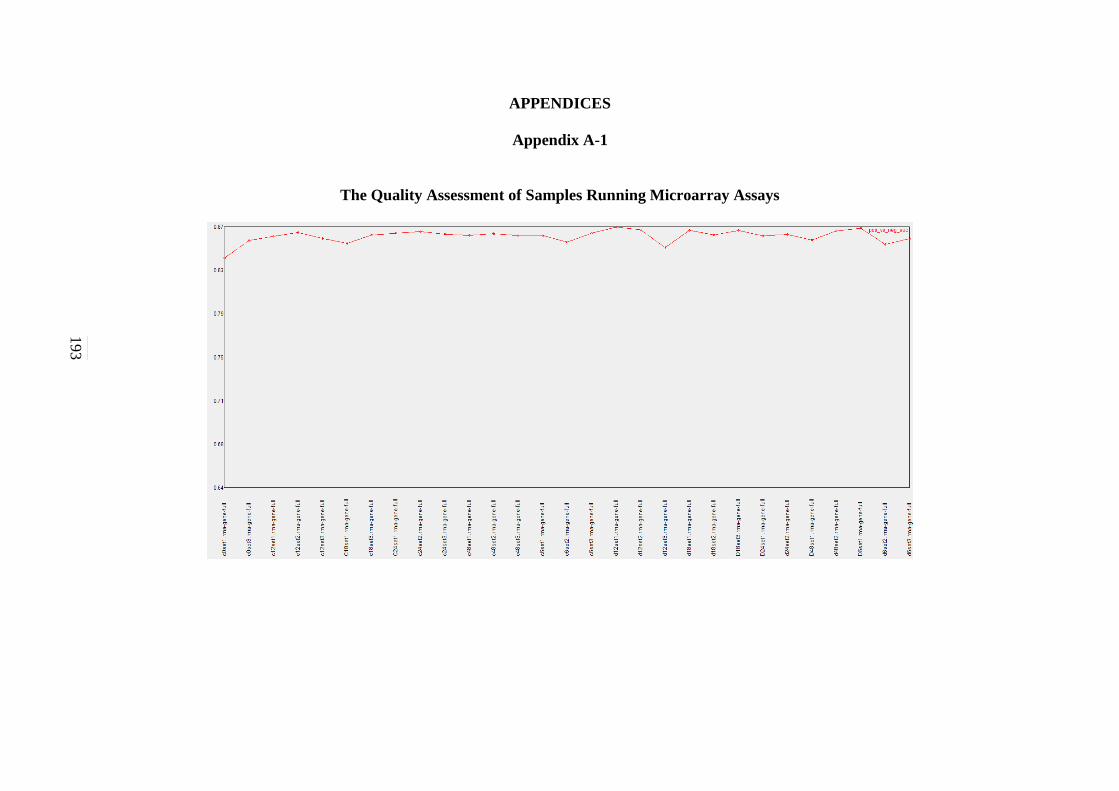
193
APPENDICES
Appendix A-1
The Quality Assessment of Samples Running Microarray Assays
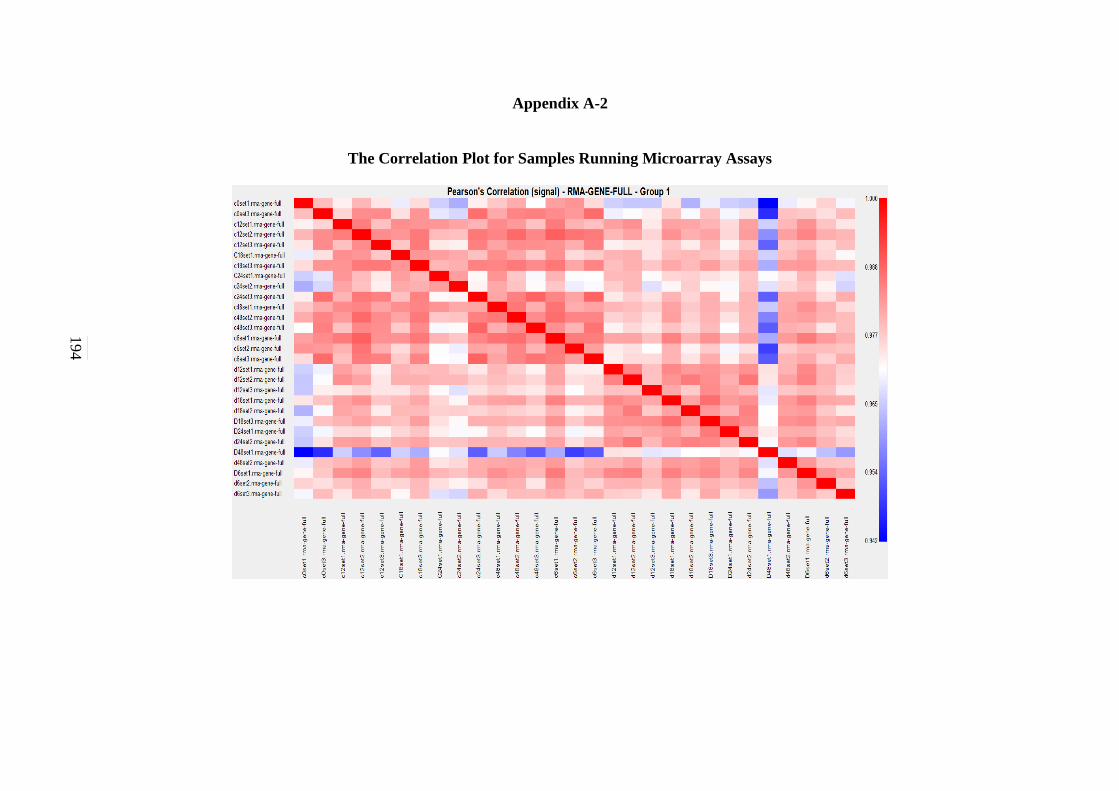
194
Appendix A-2
The Correlation Plot for Samples Running Microarray Assays
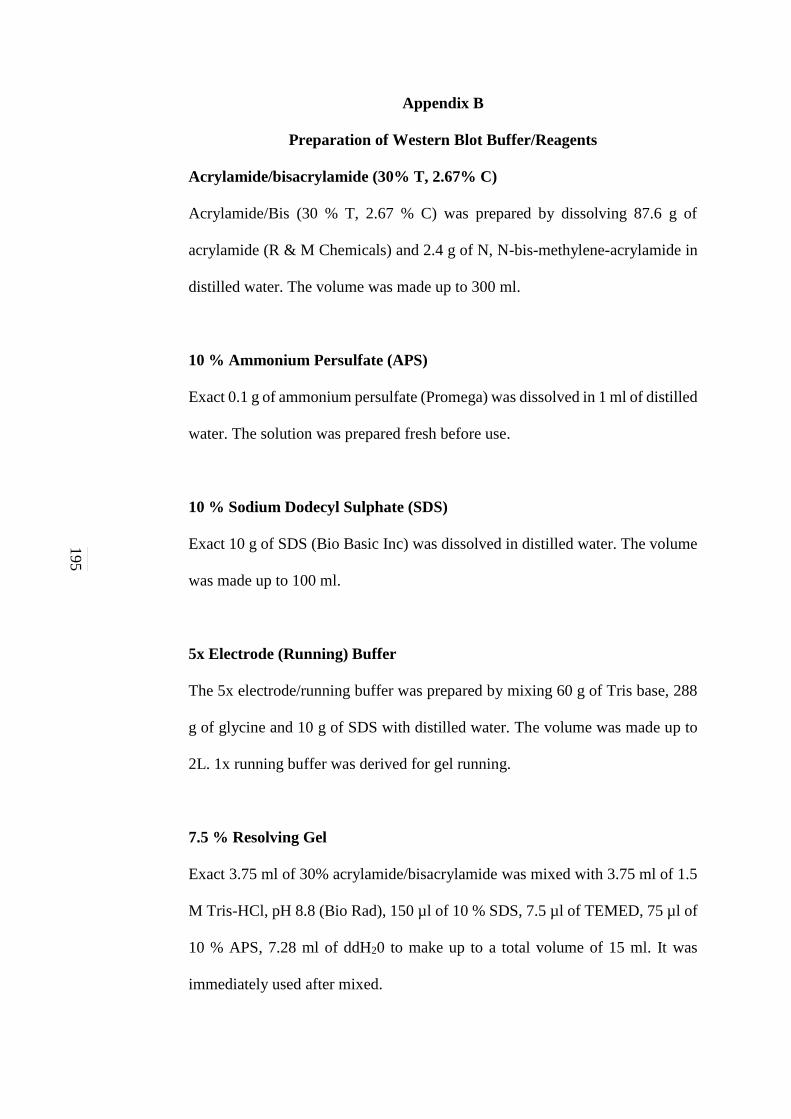
195
Appendix B
Preparation of Western Blot Buffer/Reagents
Acrylamide/bisacrylamide (30% T, 2.67% C)
Acrylamide/Bis (30 % T, 2.67 % C) was prepared by dissolving 87.6 g of
acrylamide (R & M Chemicals) and 2.4 g of N, N-bis-methylene-acrylamide in
distilled water. The volume was made up to 300 ml.
10 % Ammonium Persulfate (APS)
Exact 0.1 g of ammonium persulfate (Promega) was dissolved in 1 ml of distilled
water. The solution was prepared fresh before use.
10 % Sodium Dodecyl Sulphate (SDS)
Exact 10 g of SDS (Bio Basic Inc) was dissolved in distilled water. The volume
was made up to 100 ml.
5x Electrode (Running) Buffer
The 5x electrode/running buffer was prepared by mixing 60 g of Tris base, 288
g of glycine and 10 g of SDS with distilled water. The volume was made up to
2L. 1x running buffer was derived for gel running.
7.5 % Resolving Gel
Exact 3.75 ml of 30% acrylamide/bisacrylamide was mixed with 3.75 ml of 1.5
M Tris-HCl, pH 8.8 (Bio Rad), 150 µl of 10 % SDS, 7.5 µl of TEMED, 75 µl of
10 % APS, 7.28 ml of ddH20 to make up to a total volume of 15 ml. It was
immediately used after mixed.
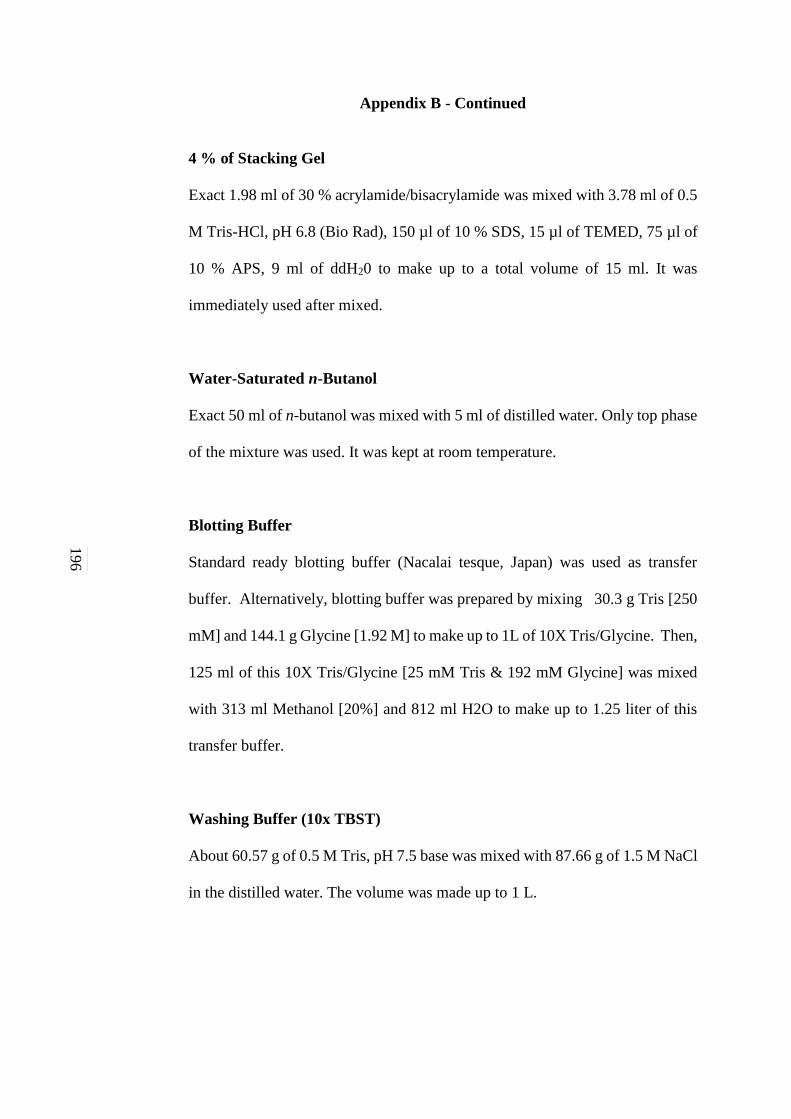
196
Appendix B - Continued
4 % of Stacking Gel
Exact 1.98 ml of 30 % acrylamide/bisacrylamide was mixed with 3.78 ml of 0.5
M Tris-HCl, pH 6.8 (Bio Rad), 150 µl of 10 % SDS, 15 µl of TEMED, 75 µl of
10 % APS, 9 ml of ddH20 to make up to a total volume of 15 ml. It was
immediately used after mixed.
Water-Saturated n-Butanol
Exact 50 ml of n-butanol was mixed with 5 ml of distilled water. Only top phase
of the mixture was used. It was kept at room temperature.
Blotting Buffer
Standard ready blotting buffer (Nacalai tesque, Japan) was used as transfer
buffer. Alternatively, blotting buffer was prepared by mixing 30.3 g Tris [250
mM] and 144.1 g Glycine [1.92 M] to make up to 1L of 10X Tris/Glycine. Then,
125 ml of this 10X Tris/Glycine [25 mM Tris & 192 mM Glycine] was mixed
with 313 ml Methanol [20%] and 812 ml H2O to make up to 1.25 liter of this
transfer buffer.
Washing Buffer (10x TBST)
About 60.57 g of 0.5 M Tris, pH 7.5 base was mixed with 87.66 g of 1.5 M NaCl
in the distilled water. The volume was made up to 1 L.
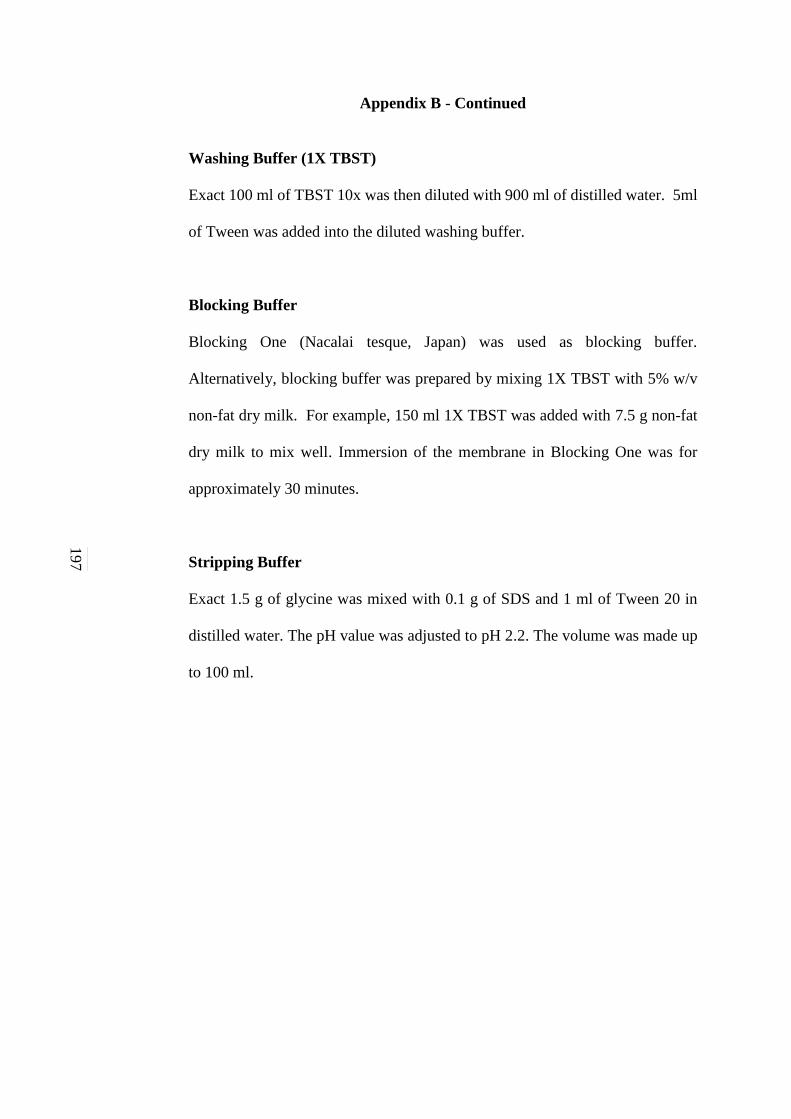
197
Appendix B - Continued
Washing Buffer (1X TBST)
Exact 100 ml of TBST 10x was then diluted with 900 ml of distilled water. 5ml
of Tween was added into the diluted washing buffer.
Blocking Buffer
Blocking One (Nacalai tesque, Japan) was used as blocking buffer.
Alternatively, blocking buffer was prepared by mixing 1X TBST with 5% w/v
non-fat dry milk. For example, 150 ml 1X TBST was added with 7.5 g non-fat
dry milk to mix well. Immersion of the membrane in Blocking One was for
approximately 30 minutes.
Stripping Buffer
Exact 1.5 g of glycine was mixed with 0.1 g of SDS and 1 ml of Tween 20 in
distilled water. The pH value was adjusted to pH 2.2. The volume was made up
to 100 ml.

198
Appendix C-1
KEGG: P53 Signalling Pathway
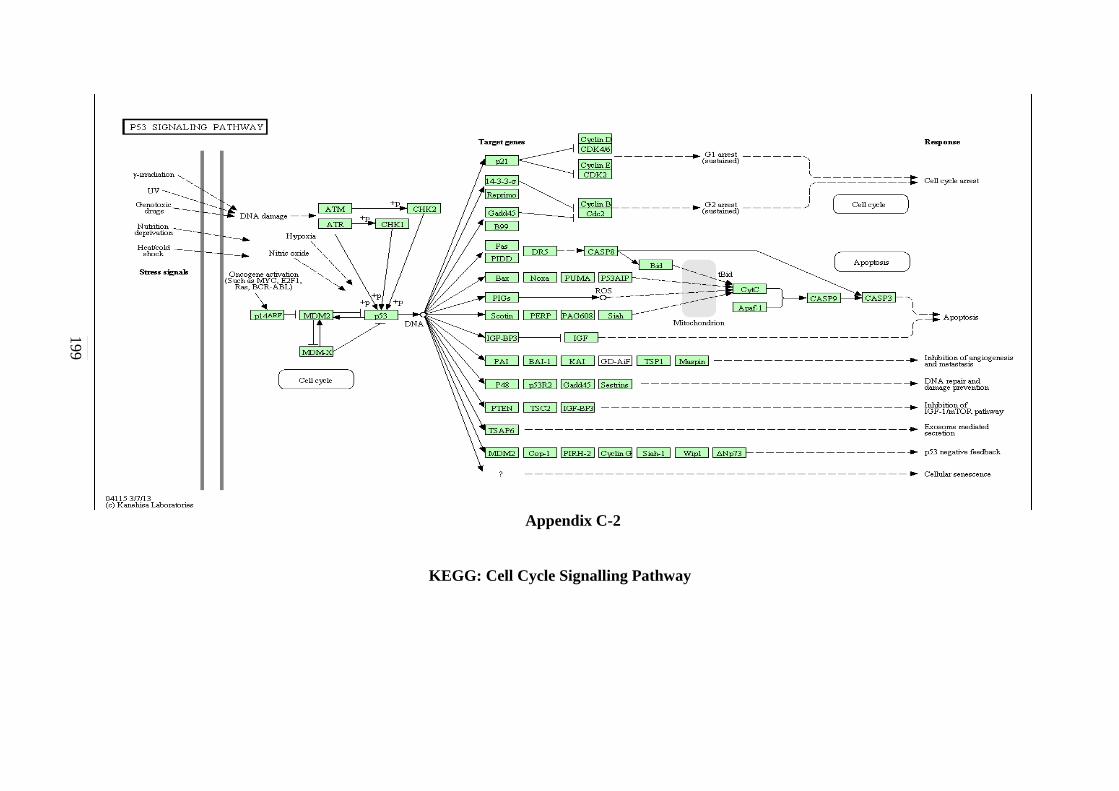
199
Appendix C-2
KEGG: Cell Cycle Signalling Pathway
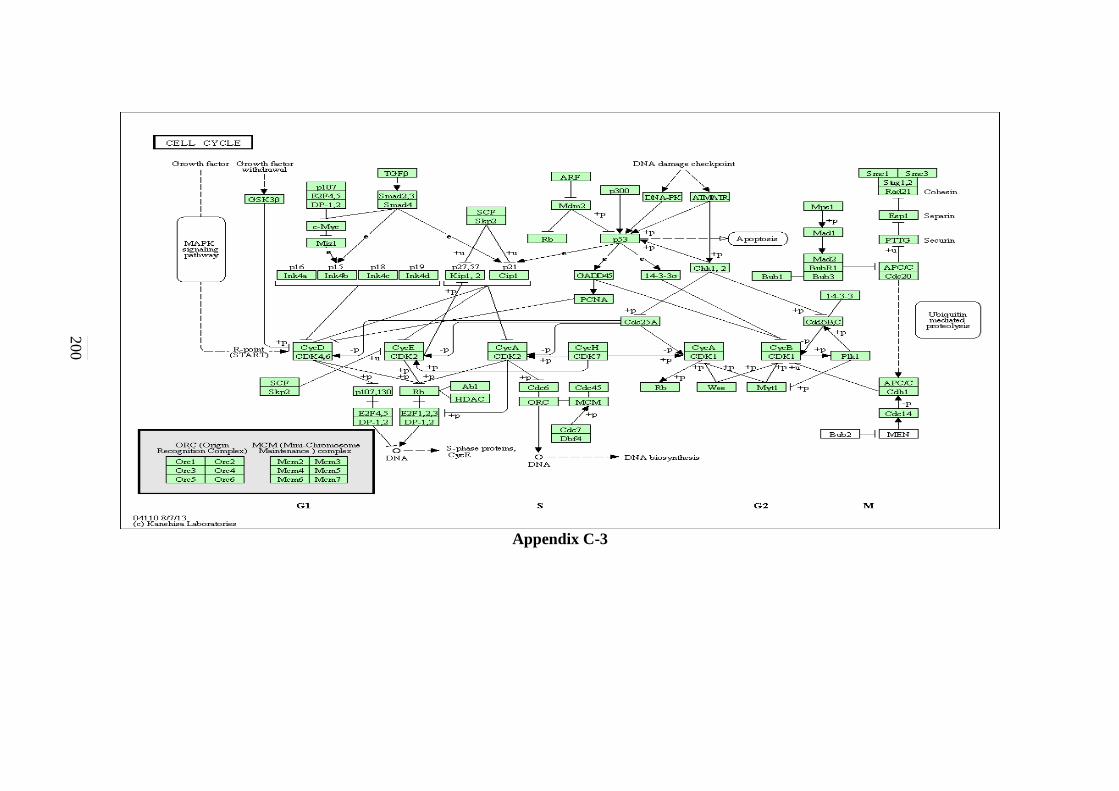
200
Appendix C-3
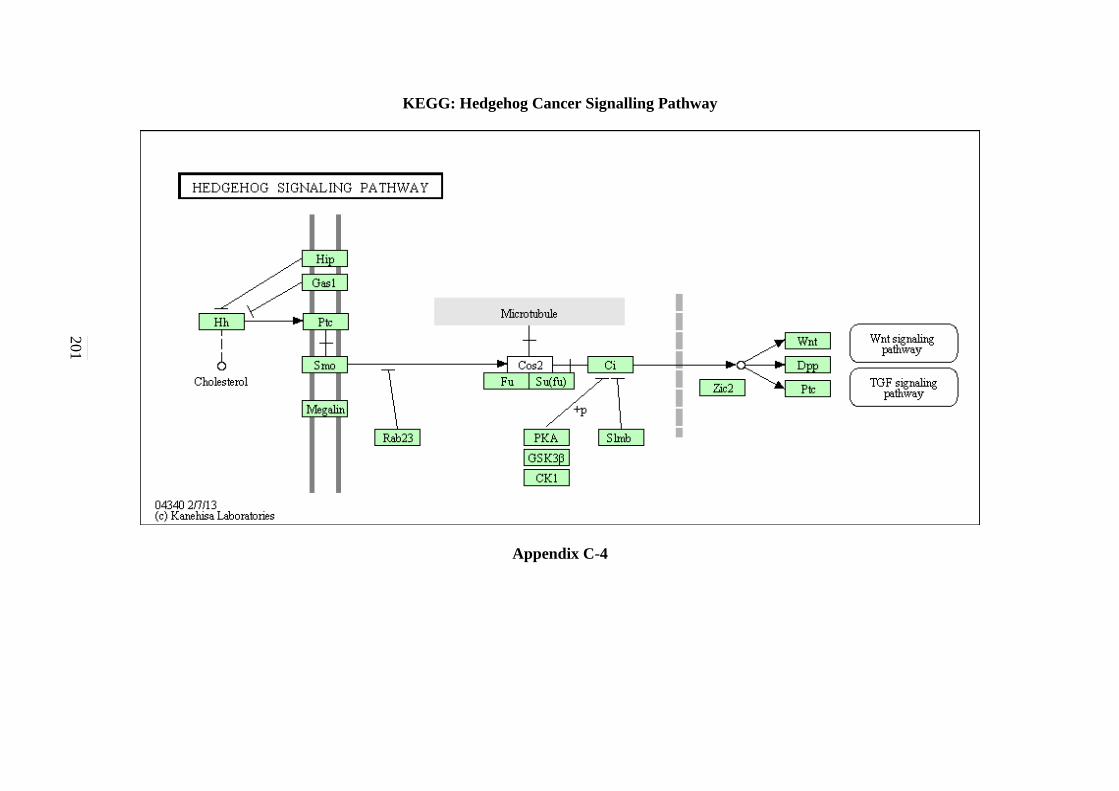
201
KEGG: Hedgehog Cancer Signalling Pathway
Appendix C-4
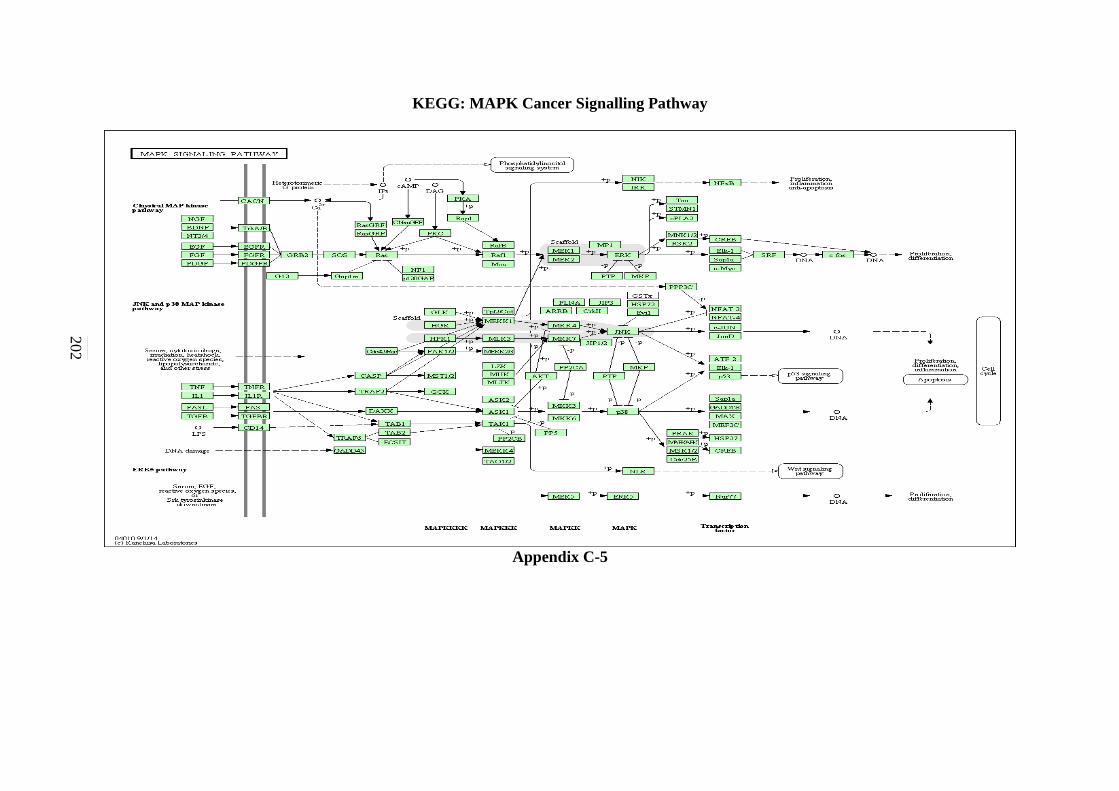
202
KEGG: MAPK Cancer Signalling Pathway
Appendix C-5
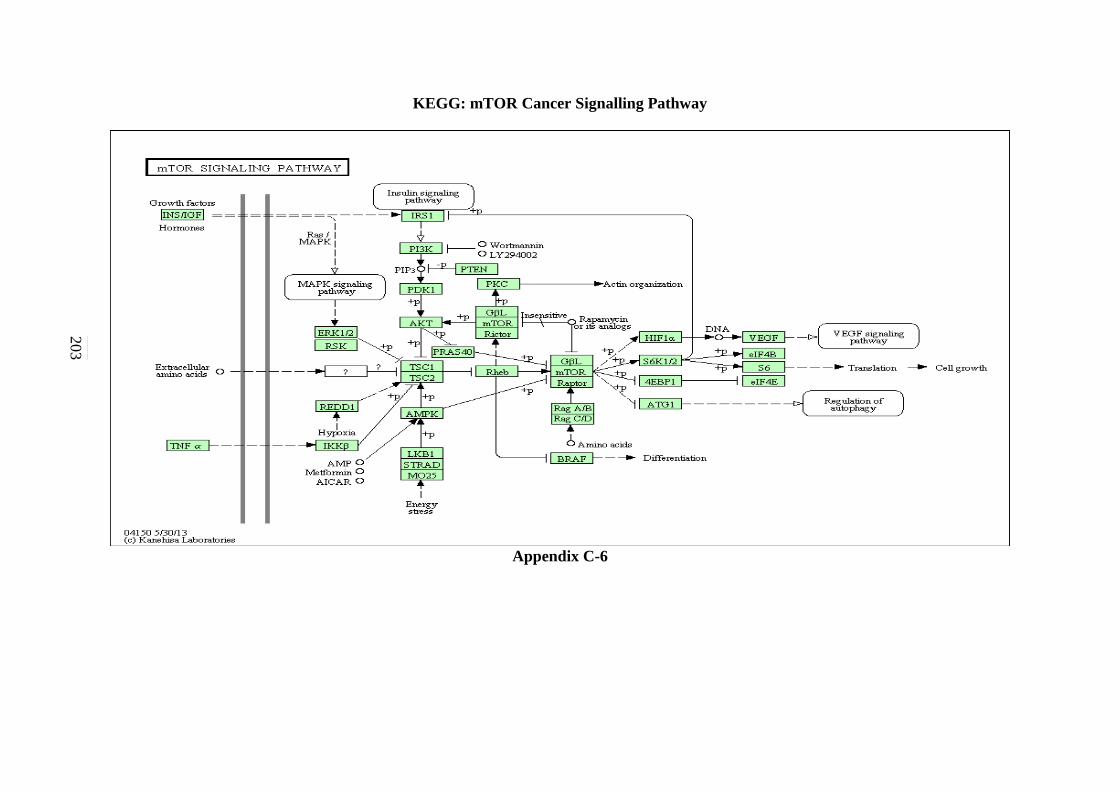
203
KEGG: mTOR Cancer Signalling Pathway
Appendix C-6
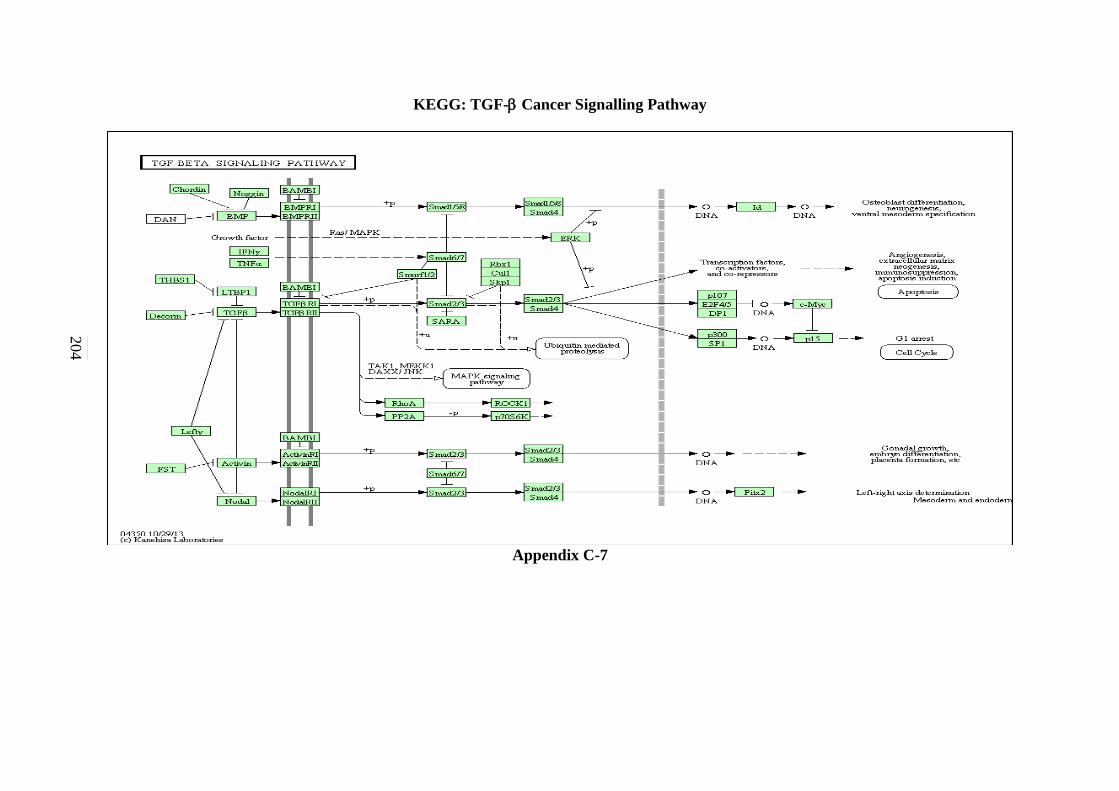
204
KEGG: TGF- Cancer Signalling Pathway
Appendix C-7
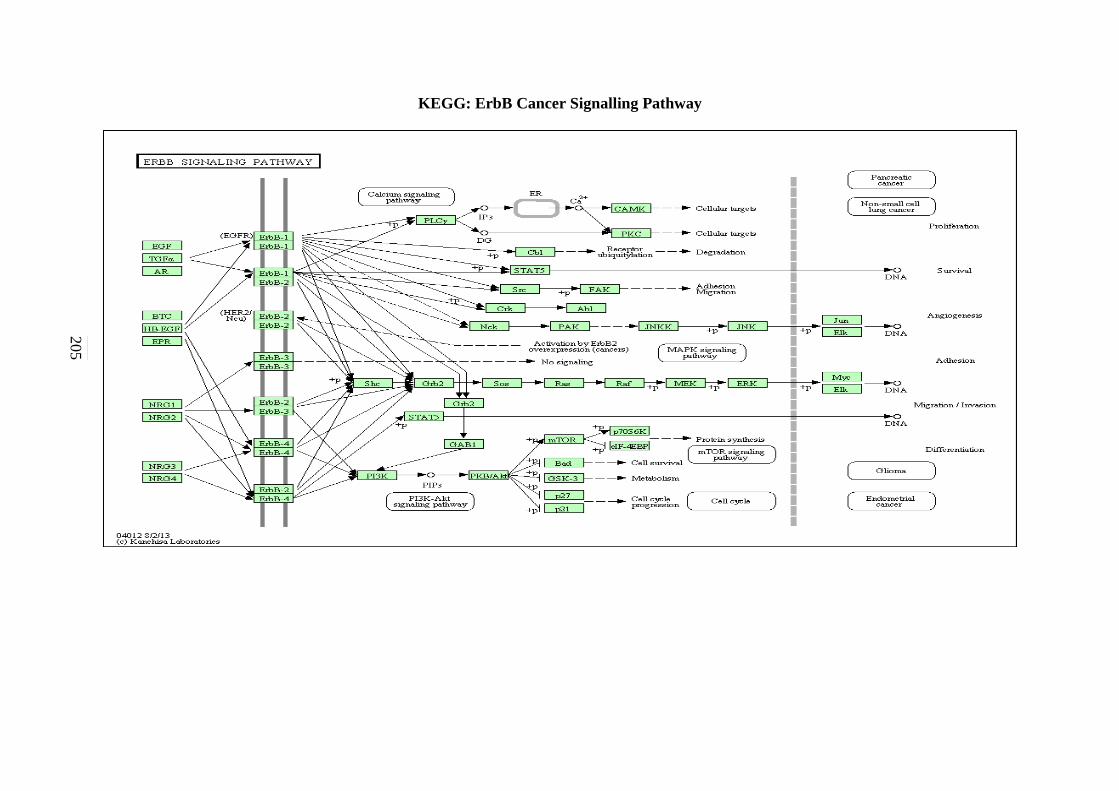
205
KEGG: ErbB Cancer Signalling Pathway
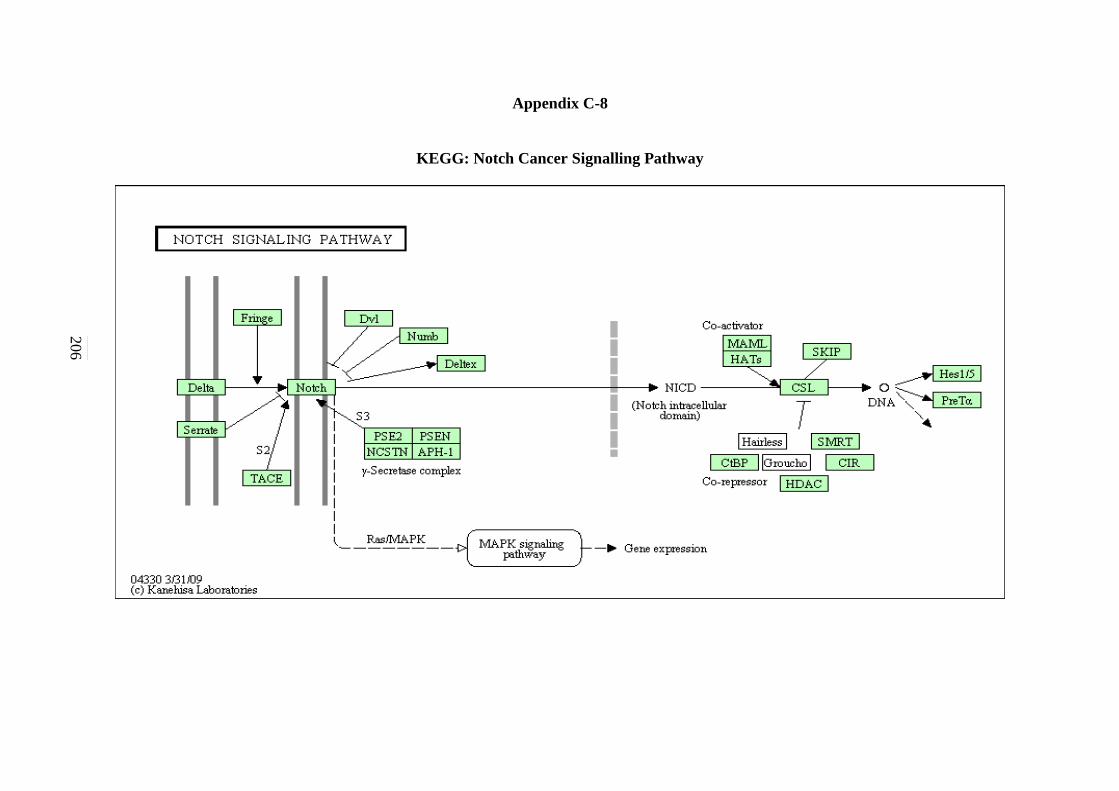
206
Appendix C-8
KEGG: Notch Cancer Signalling Pathway
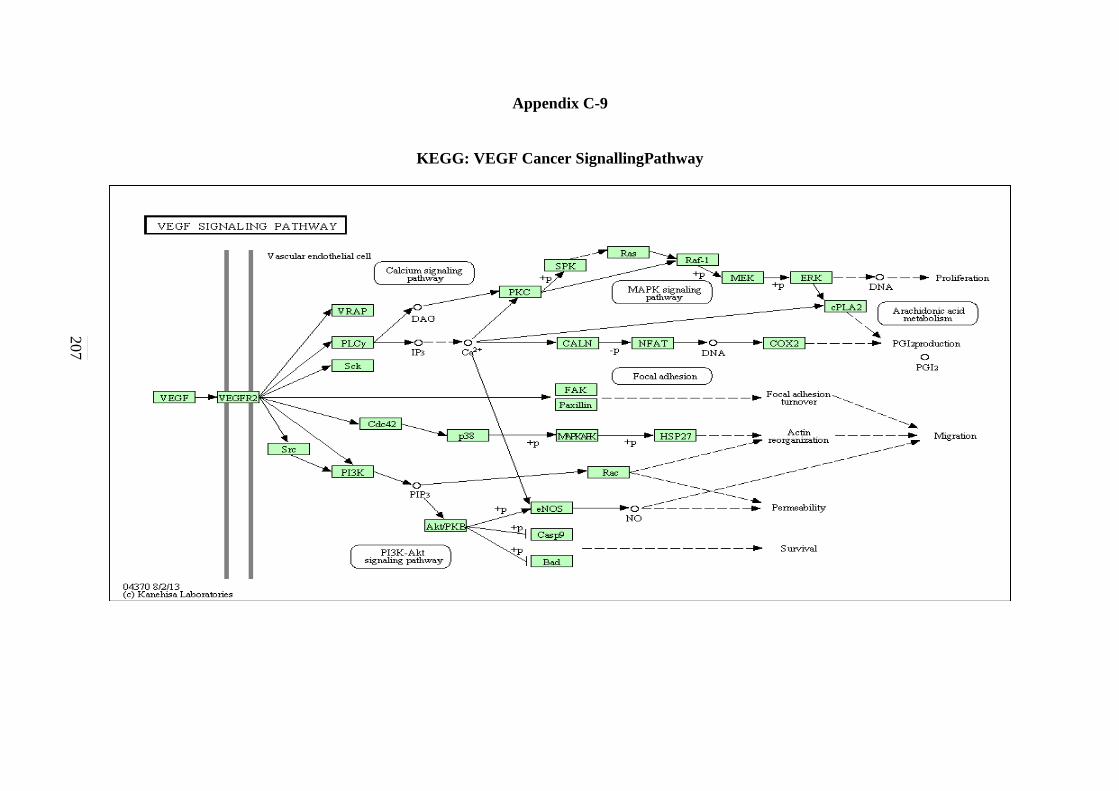
207
Appendix C-9
KEGG: VEGF Cancer SignallingPathway
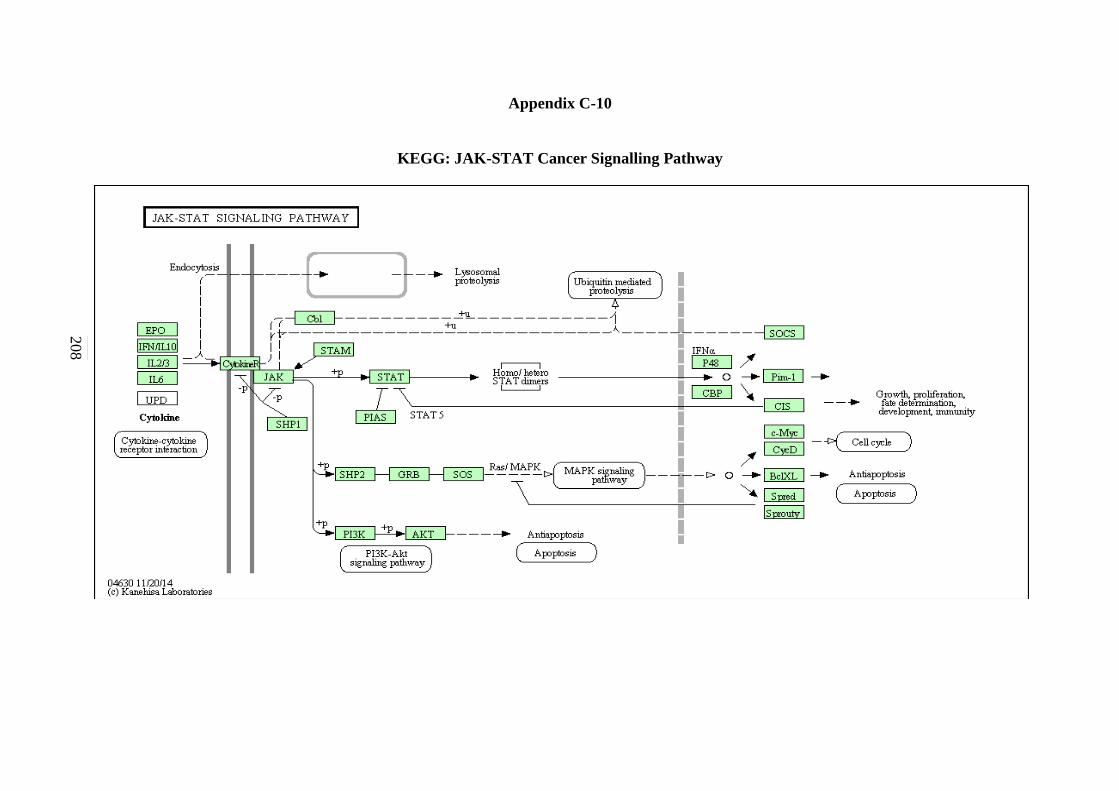
208
Appendix C-10
KEGG: JAK-STAT Cancer Signalling Pathway
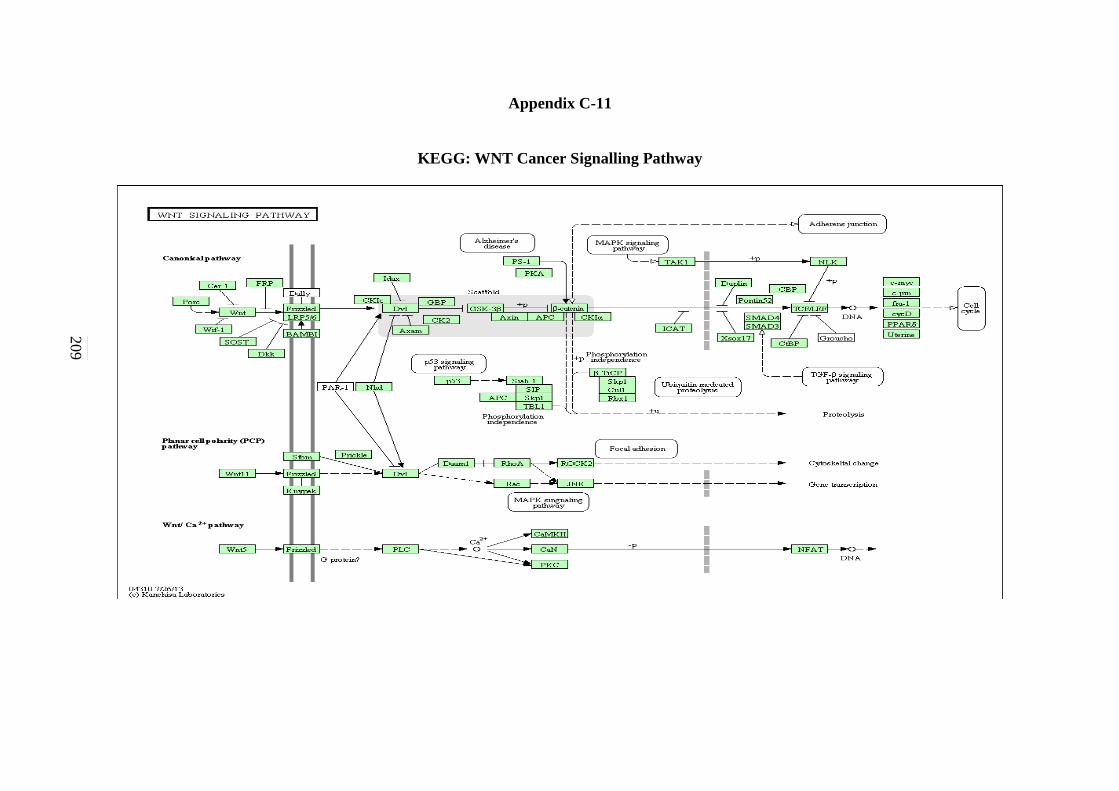
209
Appendix C-11
KEGG: WNT Cancer Signalling Pathway
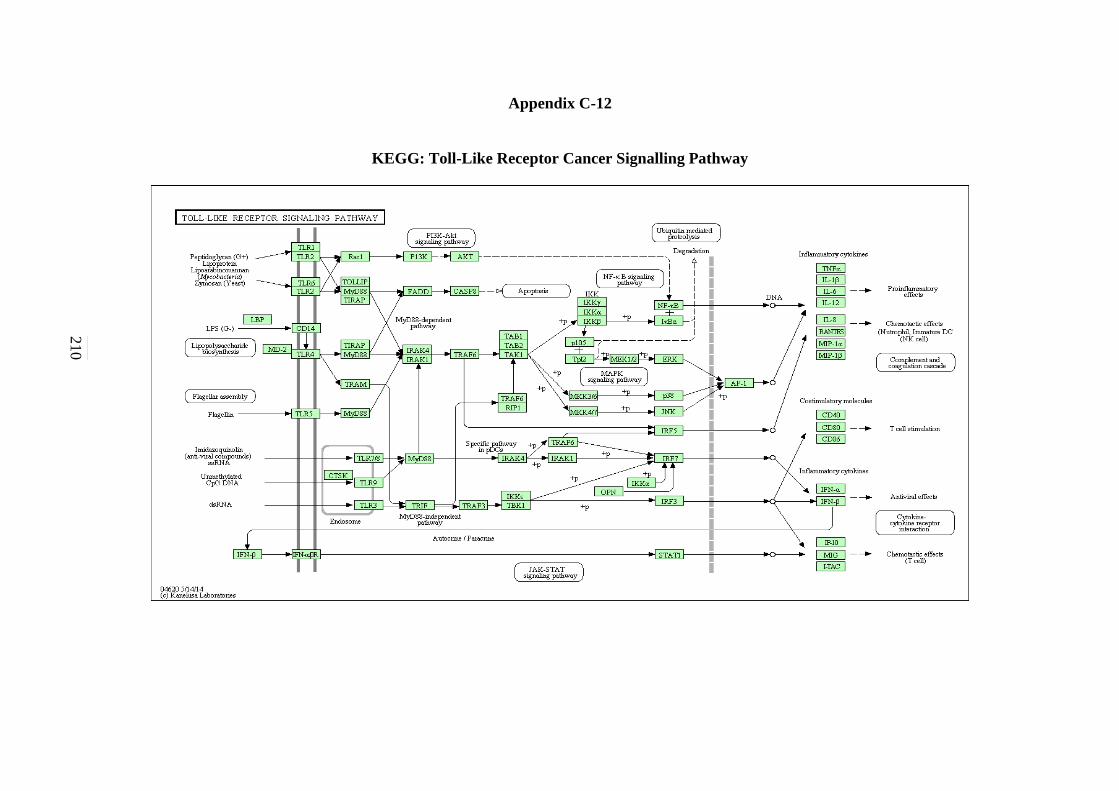
210
Appendix C-12
KEGG: Toll-Like Receptor Cancer Signalling Pathway
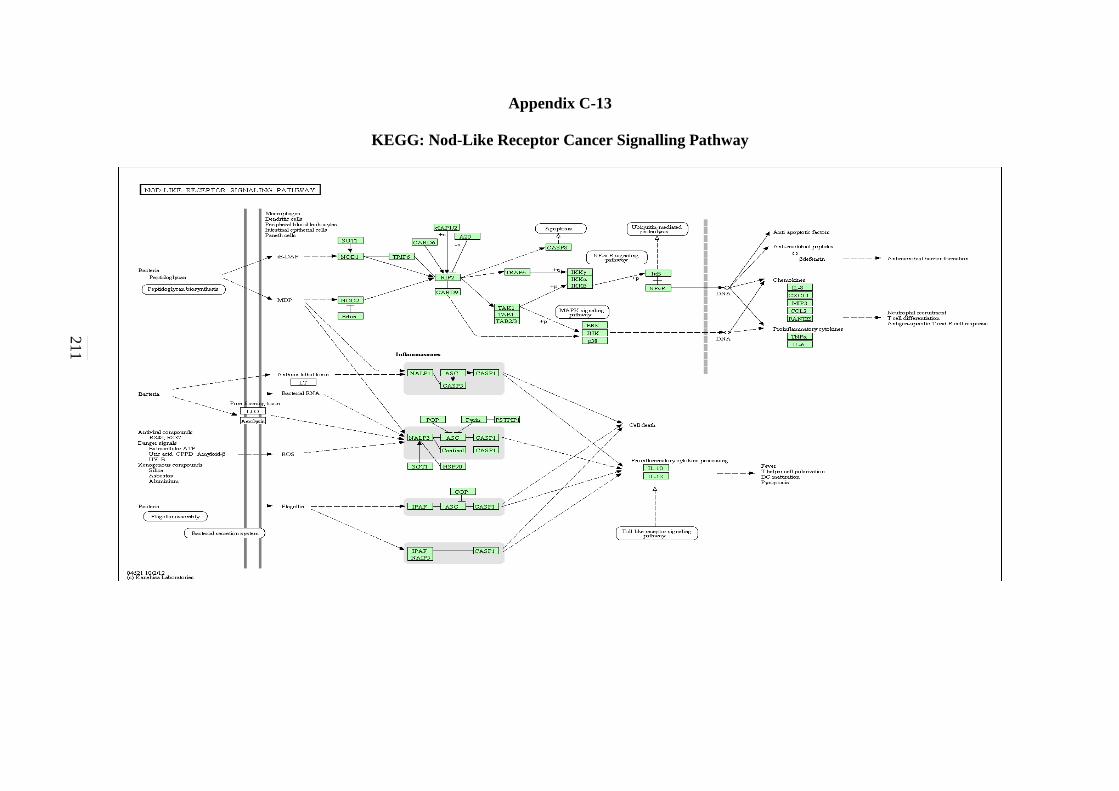
211
Appendix C-13
KEGG: Nod-Like Receptor Cancer Signalling Pathway
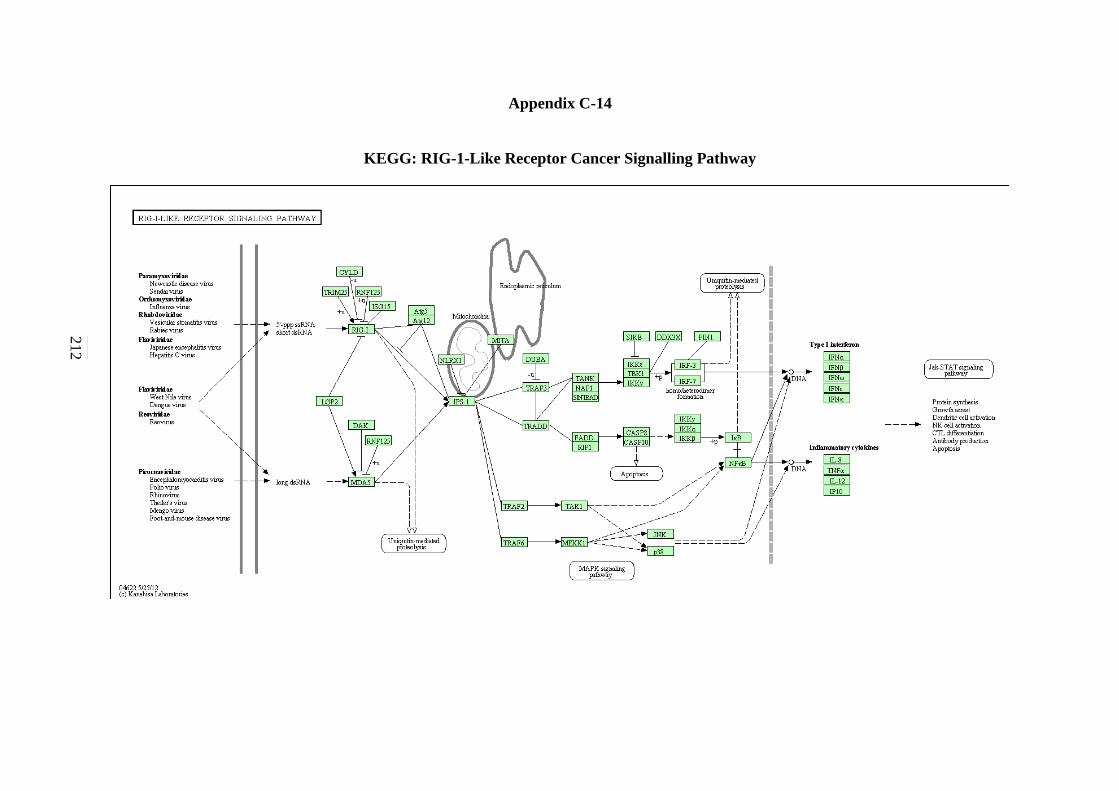
212
Appendix C-14
KEGG: RIG-1-Like Receptor Cancer Signalling Pathway
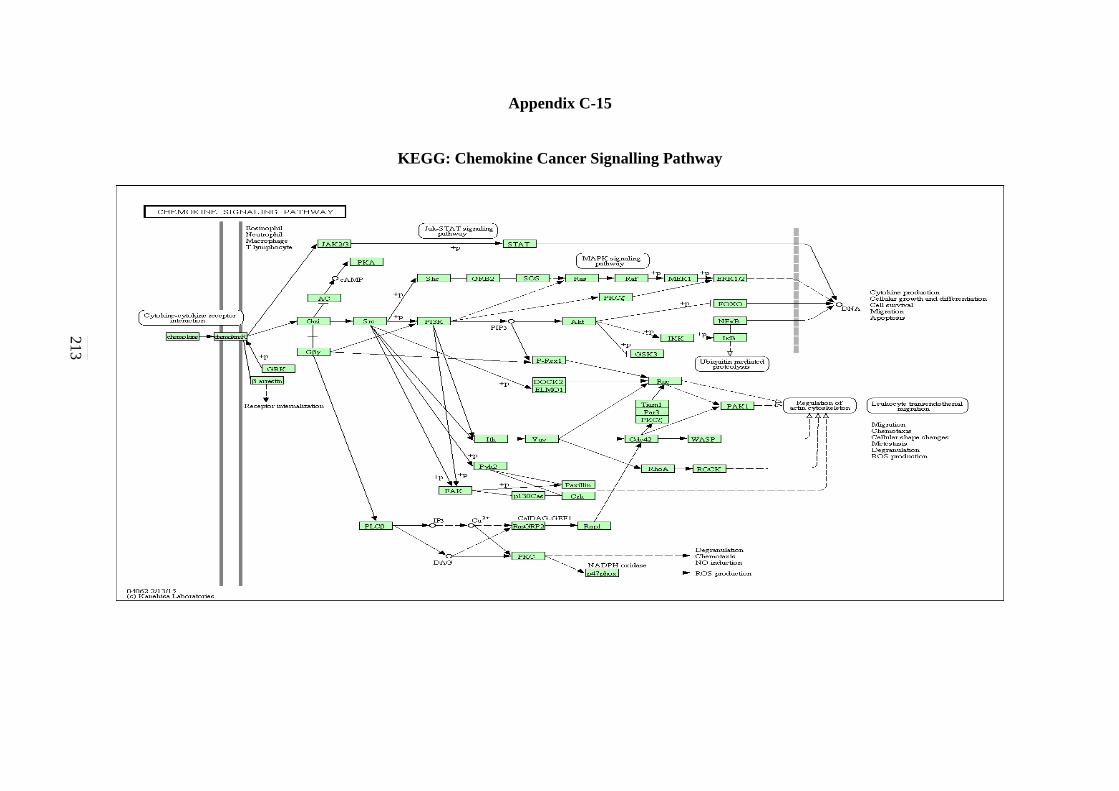
213
Appendix C-15
KEGG: Chemokine Cancer Signalling Pathway
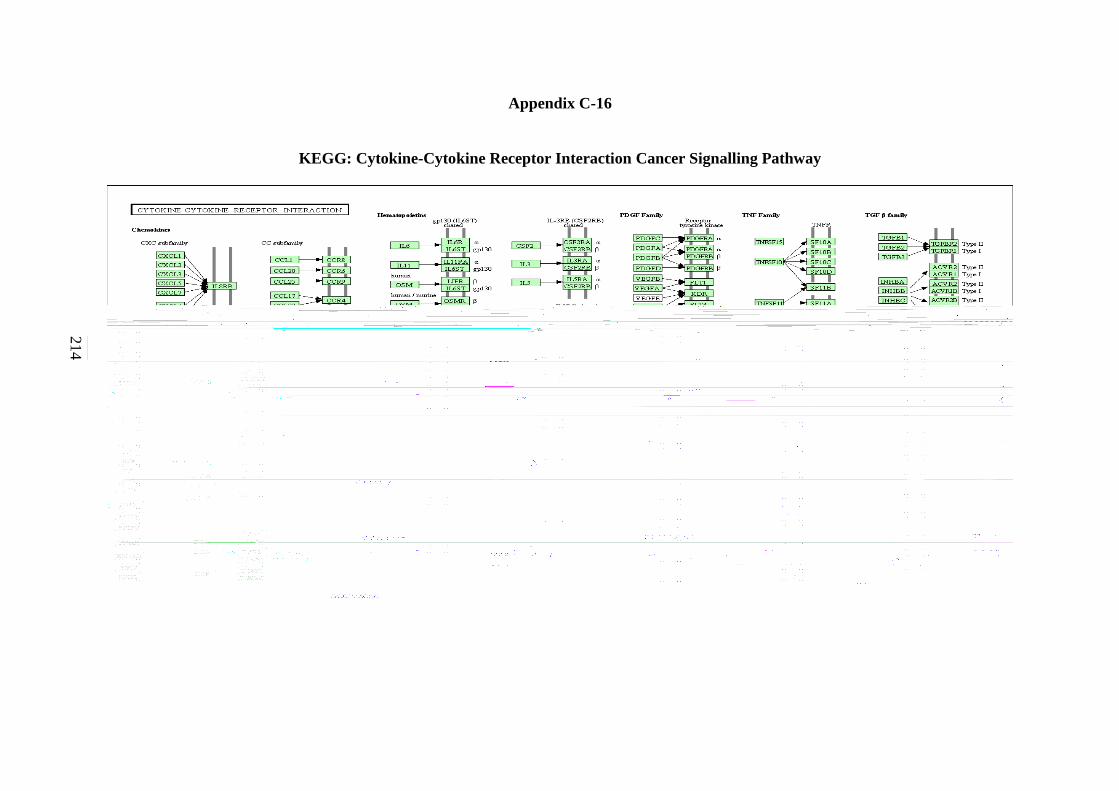
214
Appendix C-16
KEGG: Cytokine-Cytokine Receptor Interaction Cancer Signalling Pathway
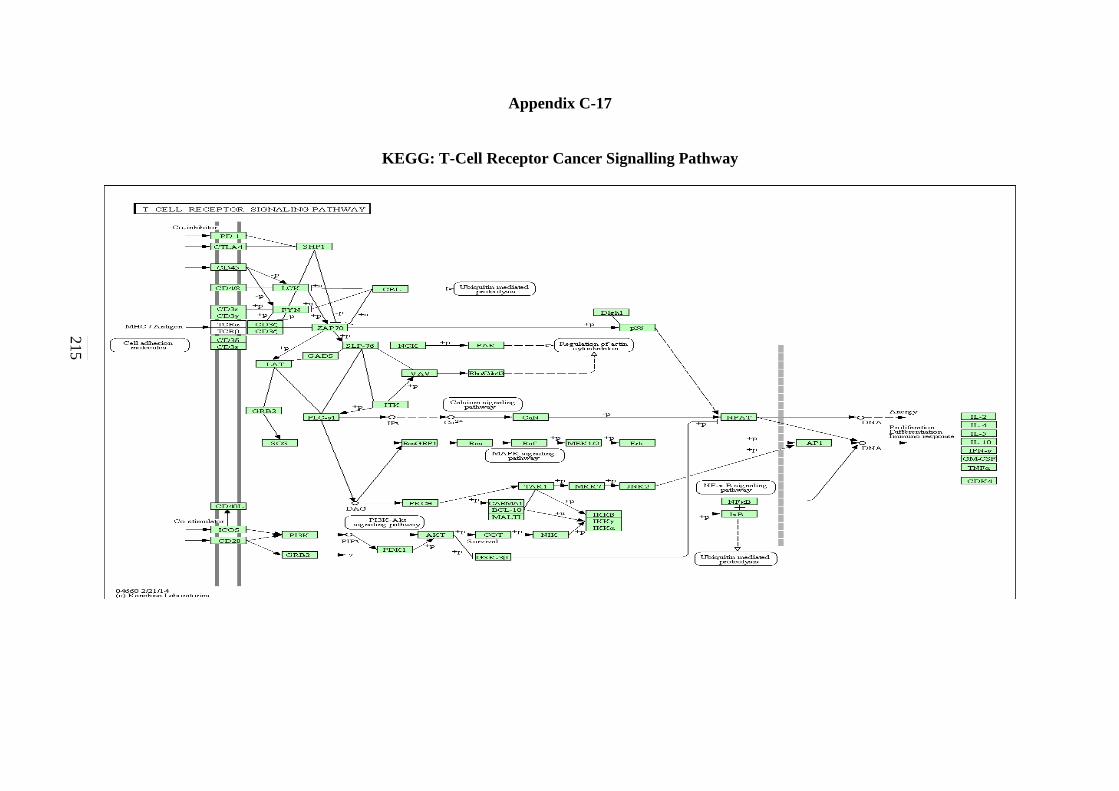
215
Appendix C-17
KEGG: T-Cell Receptor Cancer Signalling Pathway
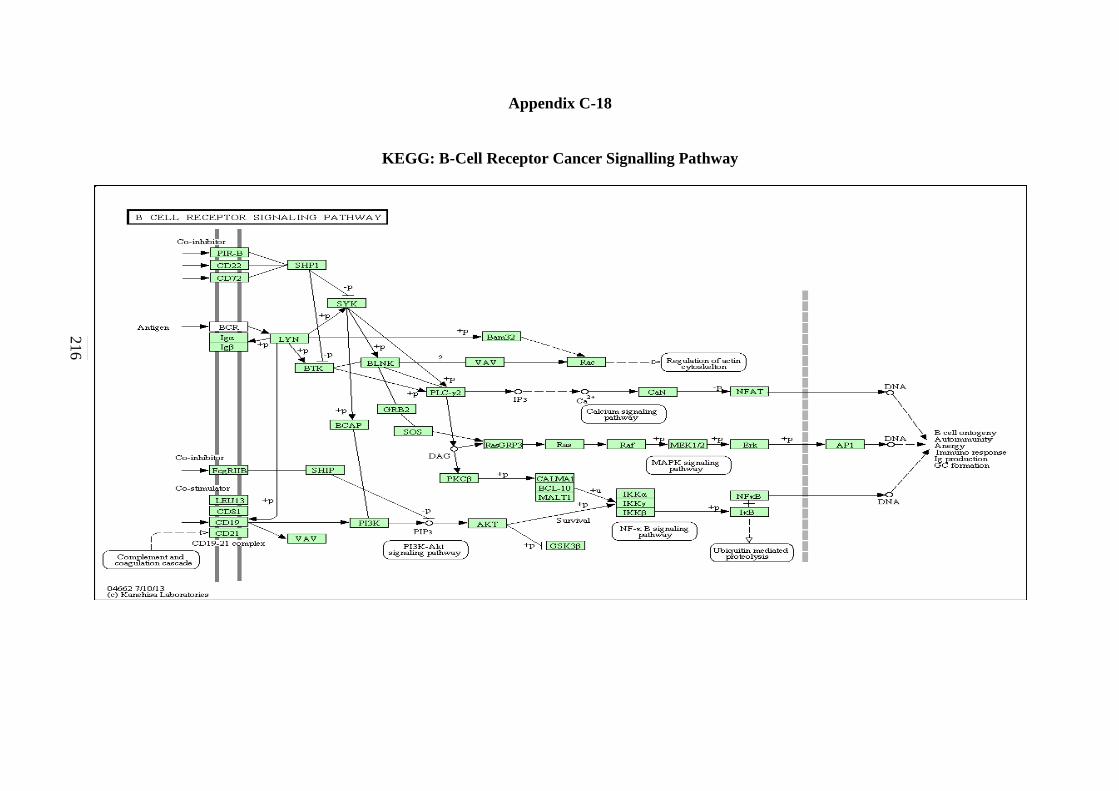
216
Appendix C-18
KEGG: B-Cell Receptor Cancer Signalling Pathway
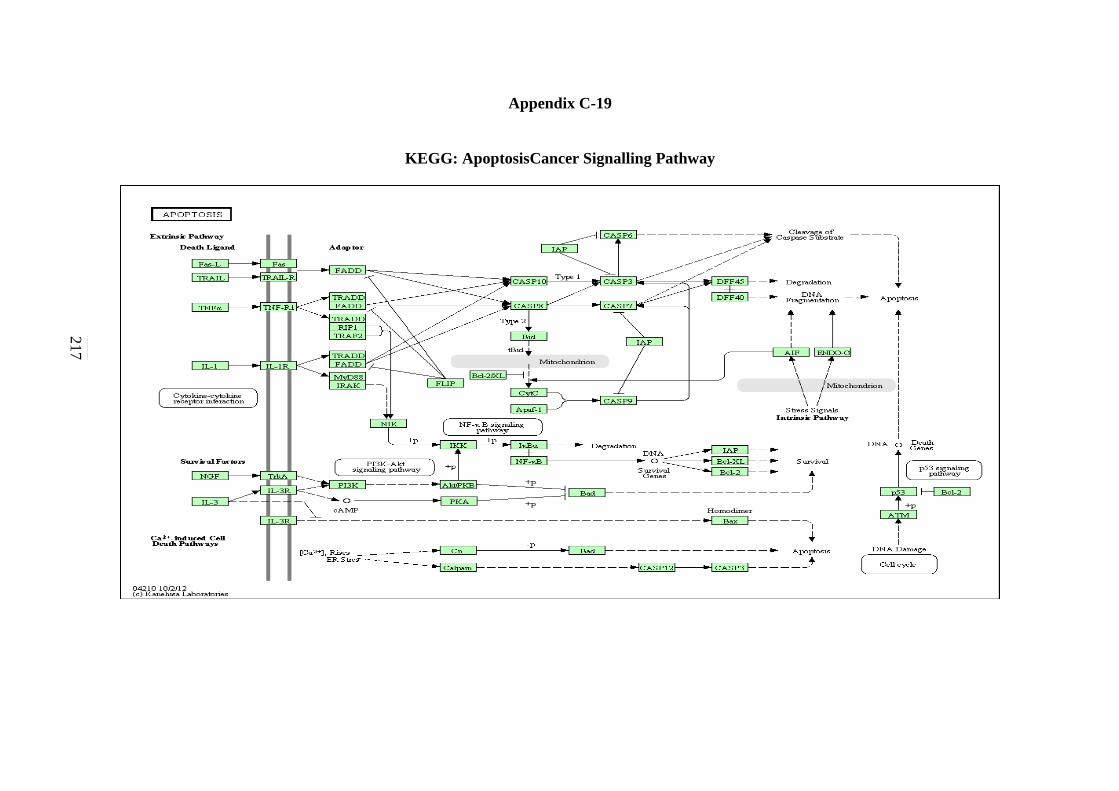
217
Appendix C-19
KEGG: ApoptosisCancer Signalling Pathway
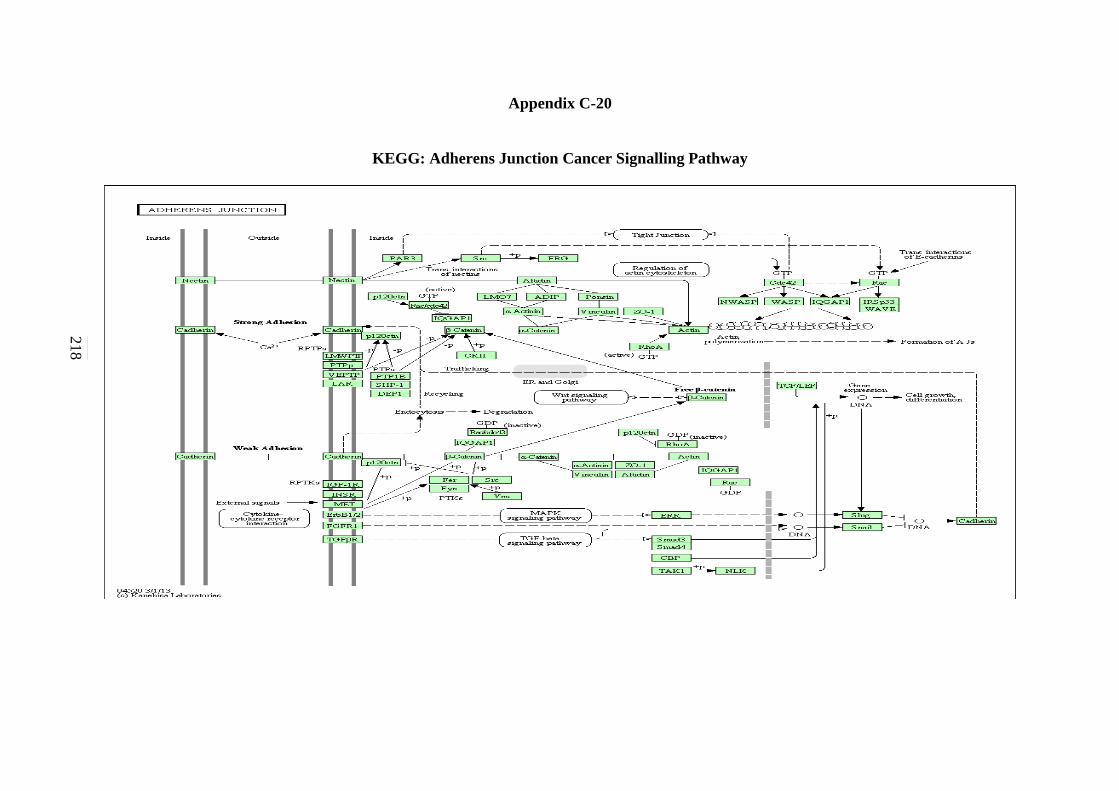
218
Appendix C-20
KEGG: Adherens Junction Cancer Signalling Pathway
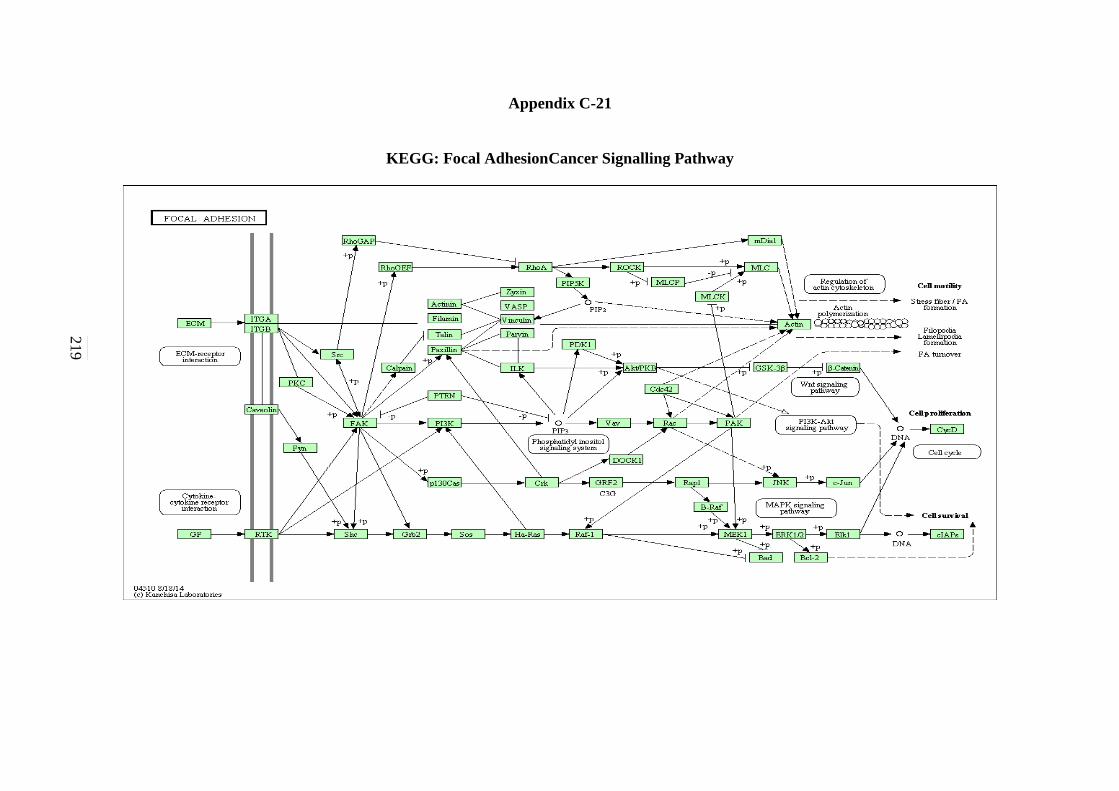
219
Appendix C-21
KEGG: Focal AdhesionCancer Signalling Pathway
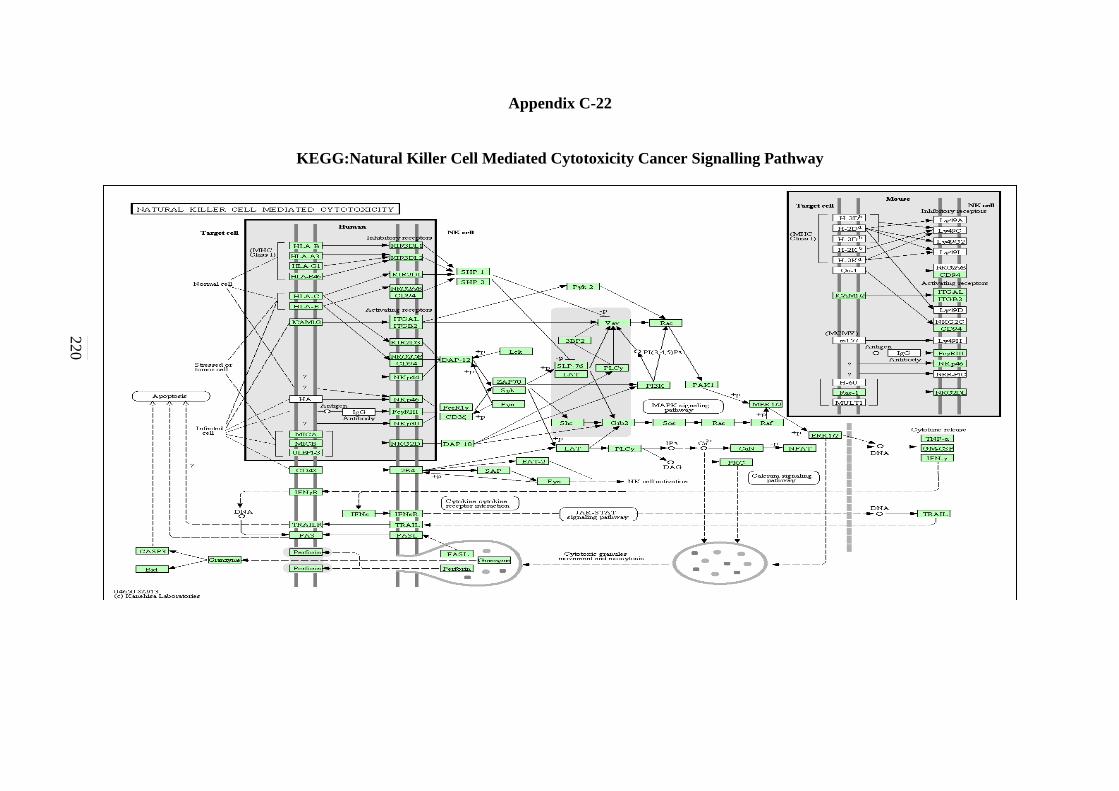
220
Appendix C-22
KEGG:Natural Killer Cell Mediated Cytotoxicity Cancer Signalling Pathway
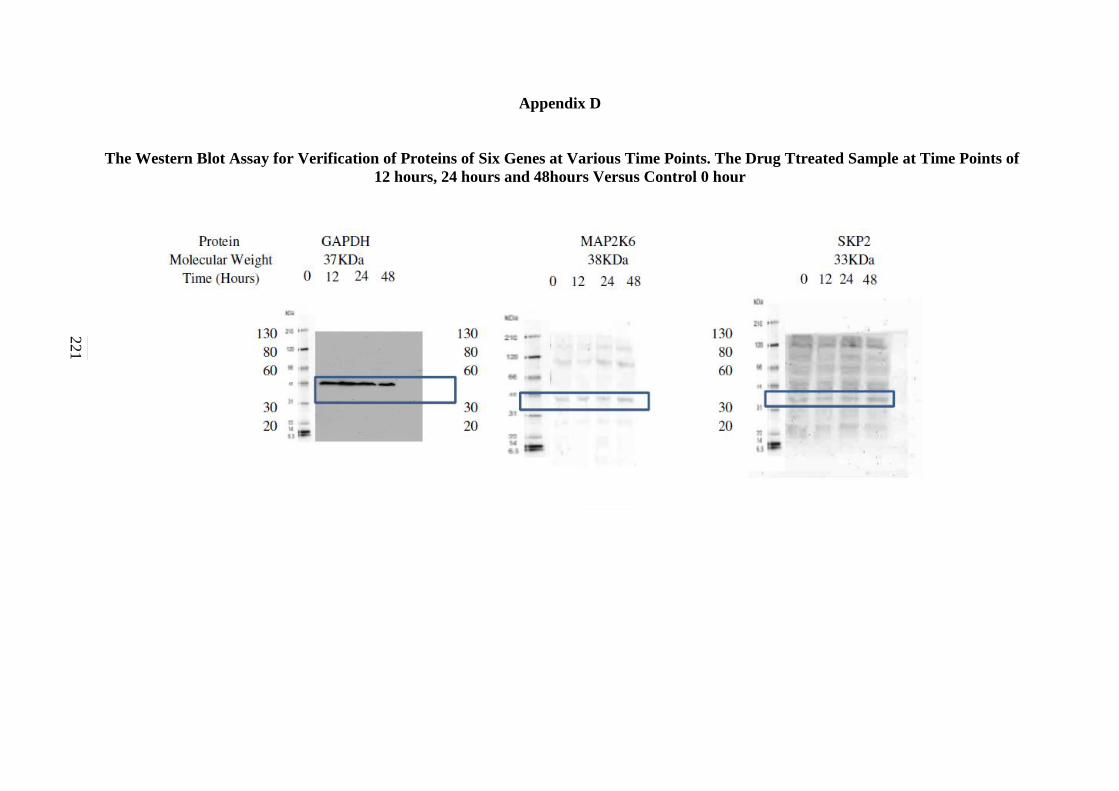
221
Appendix D
The Western Blot Assay for Verification of Proteins of Six Genes at Various Time Points. The Drug Ttreated Sample at Time Points of
12 hours, 24 hours and 48hours Versus Control 0 hour
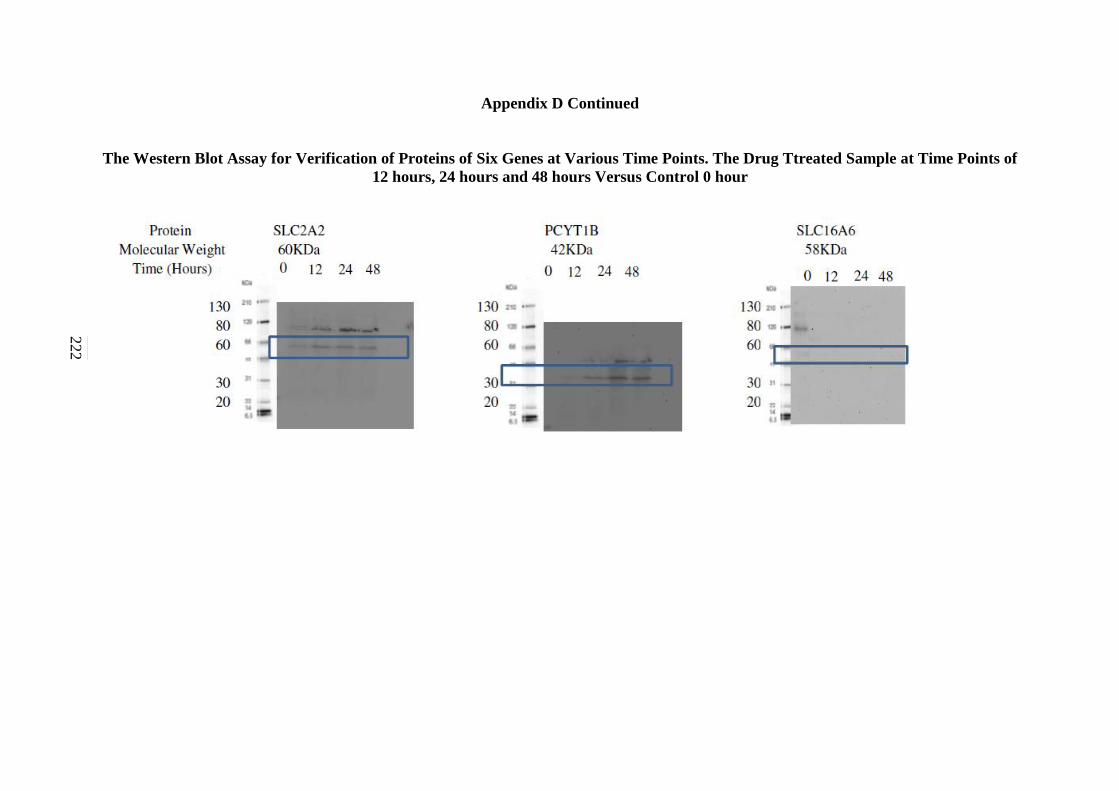
222
Appendix D Continued
The Western Blot Assay for Verification of Proteins of Six Genes at Various Time Points. The Drug Ttreated Sample at Time Points of
12 hours, 24 hours and 48 hours Versus Control 0 hour
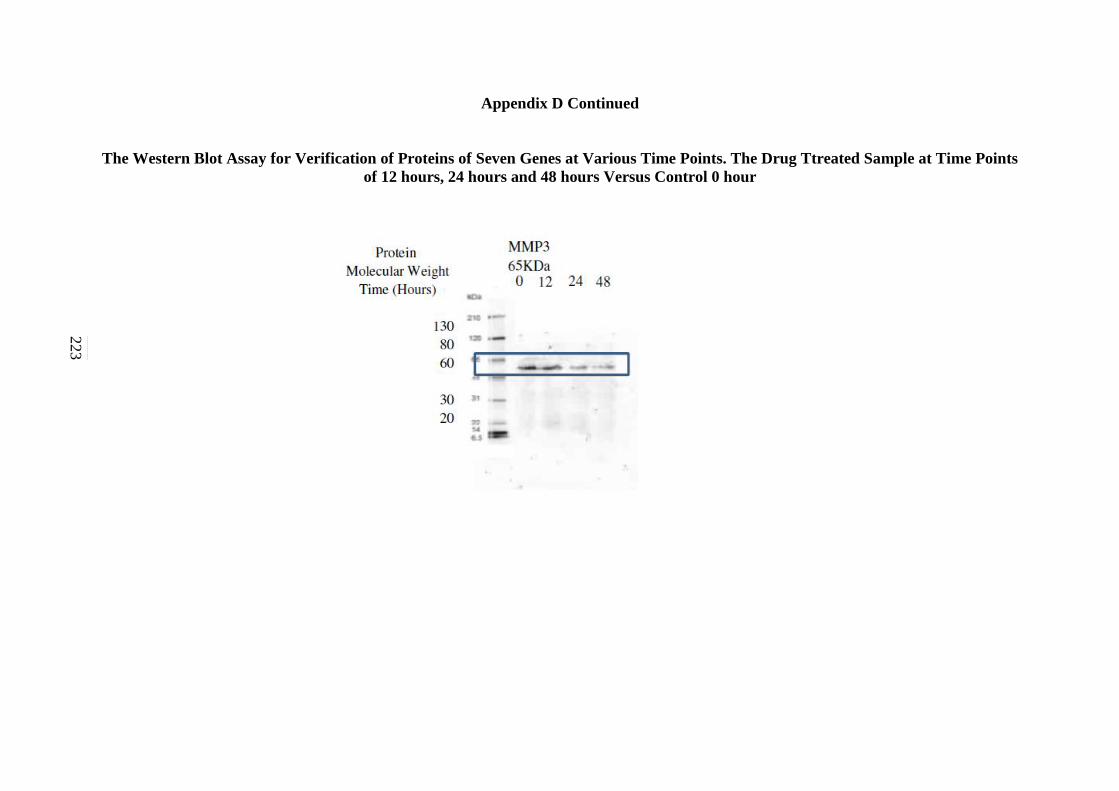
223
Appendix D Continued
The Western Blot Assay for Verification of Proteins of Seven Genes at Various Time Points. The Drug Ttreated Sample at Time Points
of 12 hours, 24 hours and 48 hours Versus Control 0 hour
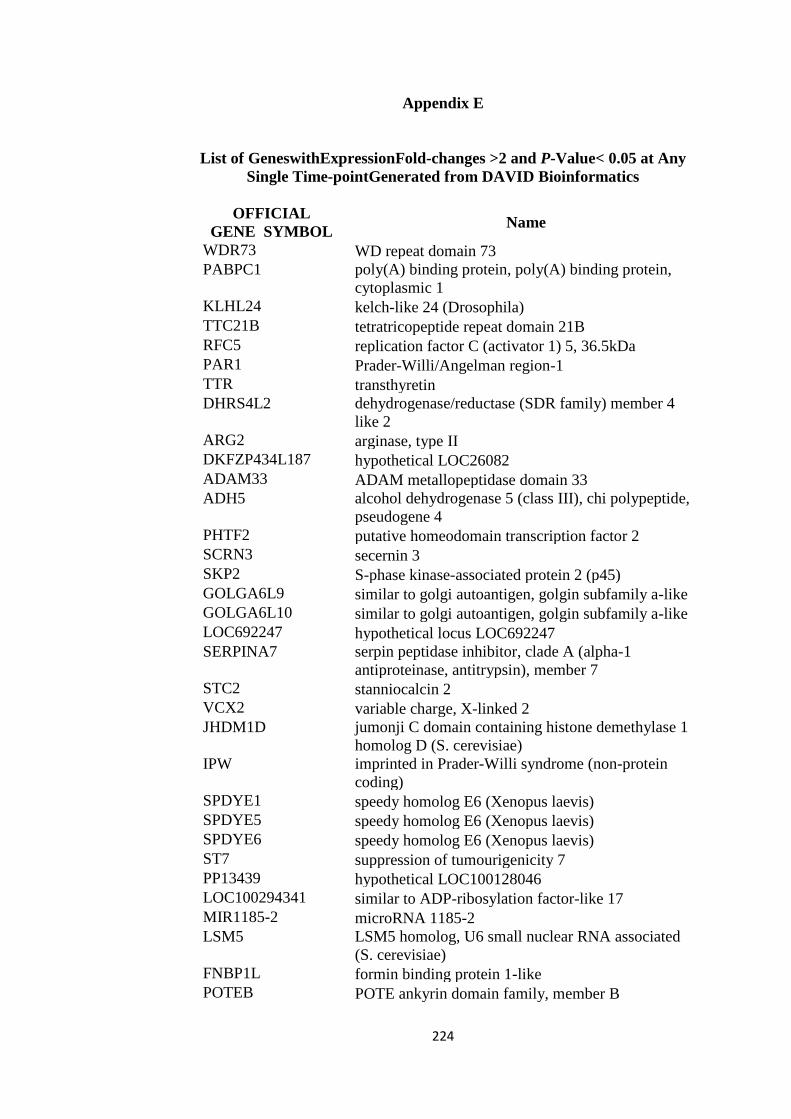
224
Appendix E
List of GeneswithExpressionFold-changes >2 and P-Value< 0.05 at Any
Single Time-pointGenerated from DAVID Bioinformatics
OFFICIAL
GENE SYMBOL Name
WDR73 WD repeat domain 73
PABPC1 poly(A) binding protein, poly(A) binding protein,
cytoplasmic 1
KLHL24 kelch-like 24 (Drosophila)
TTC21B tetratricopeptide repeat domain 21B
RFC5 replication factor C (activator 1) 5, 36.5kDa
PAR1 Prader-Willi/Angelman region-1
TTR transthyretin
DHRS4L2 dehydrogenase/reductase (SDR family) member 4
like 2
ARG2 arginase, type II
DKFZP434L187 hypothetical LOC26082
ADAM33 ADAM metallopeptidase domain 33
ADH5 alcohol dehydrogenase 5 (class III), chi polypeptide,
pseudogene 4
PHTF2 putative homeodomain transcription factor 2
SCRN3 secernin 3
SKP2 S-phase kinase-associated protein 2 (p45)
GOLGA6L9 similar to golgi autoantigen, golgin subfamily a-like
GOLGA6L10 similar to golgi autoantigen, golgin subfamily a-like
LOC692247 hypothetical locus LOC692247
SERPINA7 serpin peptidase inhibitor, clade A (alpha-1
antiproteinase, antitrypsin), member 7
STC2 stanniocalcin 2
VCX2 variable charge, X-linked 2
JHDM1D jumonji C domain containing histone demethylase 1
homolog D (S. cerevisiae)
IPW imprinted in Prader-Willi syndrome (non-protein
coding)
SPDYE1 speedy homolog E6 (Xenopus laevis)
SPDYE5 speedy homolog E6 (Xenopus laevis)
SPDYE6 speedy homolog E6 (Xenopus laevis)
ST7 suppression of tumourigenicity 7
PP13439 hypothetical LOC100128046
LOC100294341 similar to ADP-ribosylation factor-like 17
MIR1185-2 microRNA 1185-2
LSM5 LSM5 homolog, U6 small nuclear RNA associated
(S. cerevisiae)
FNBP1L formin binding protein 1-like
POTEB POTE ankyrin domain family, member B
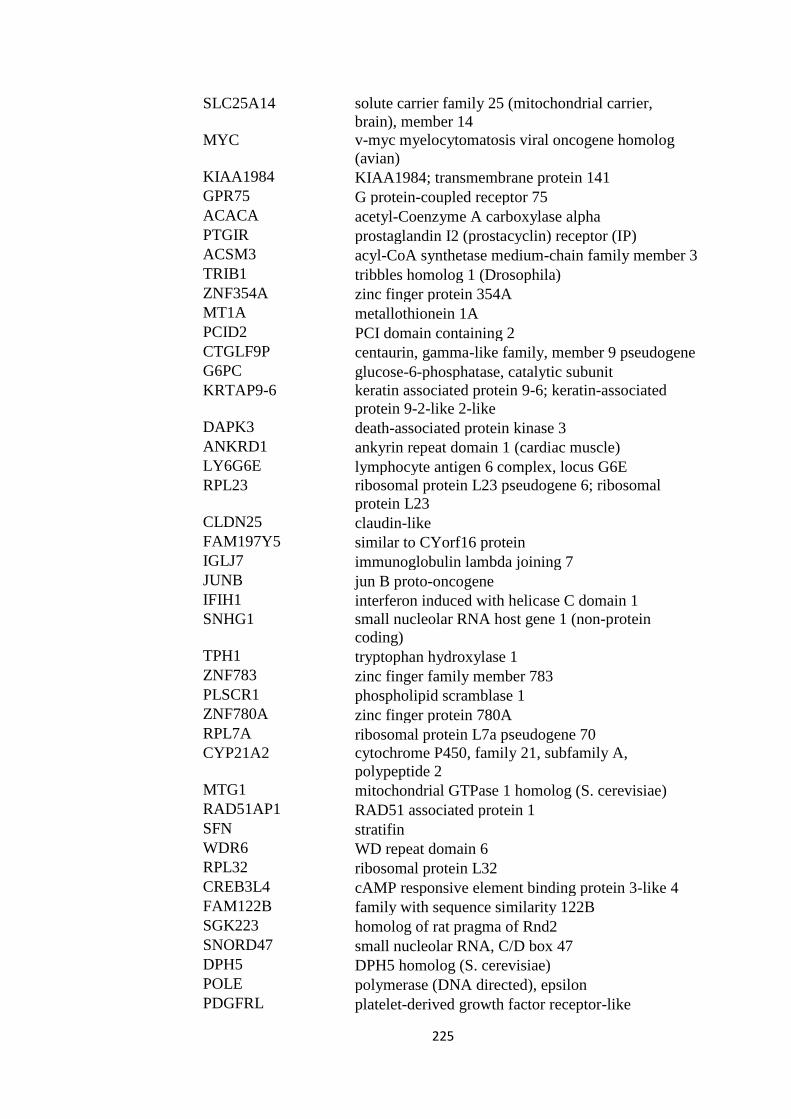
225
SLC25A14 solute carrier family 25 (mitochondrial carrier,
brain), member 14
MYC v-myc myelocytomatosis viral oncogene homolog
(avian)
KIAA1984 KIAA1984; transmembrane protein 141
GPR75 G protein-coupled receptor 75
ACACA acetyl-Coenzyme A carboxylase alpha
PTGIR prostaglandin I2 (prostacyclin) receptor (IP)
ACSM3 acyl-CoA synthetase medium-chain family member 3
TRIB1 tribbles homolog 1 (Drosophila)
ZNF354A zinc finger protein 354A
MT1A metallothionein 1A
PCID2 PCI domain containing 2
CTGLF9P centaurin, gamma-like family, member 9 pseudogene
G6PC glucose-6-phosphatase, catalytic subunit
KRTAP9-6 keratin associated protein 9-6; keratin-associated
protein 9-2-like 2-like
DAPK3 death-associated protein kinase 3
ANKRD1 ankyrin repeat domain 1 (cardiac muscle)
LY6G6E lymphocyte antigen 6 complex, locus G6E
RPL23 ribosomal protein L23 pseudogene 6; ribosomal
protein L23
CLDN25 claudin-like
FAM197Y5 similar to CYorf16 protein
IGLJ7 immunoglobulin lambda joining 7
JUNB jun B proto-oncogene
IFIH1 interferon induced with helicase C domain 1
SNHG1 small nucleolar RNA host gene 1 (non-protein
coding)
TPH1 tryptophan hydroxylase 1
ZNF783 zinc finger family member 783
PLSCR1 phospholipid scramblase 1
ZNF780A zinc finger protein 780A
RPL7A ribosomal protein L7a pseudogene 70
CYP21A2 cytochrome P450, family 21, subfamily A,
polypeptide 2
MTG1 mitochondrial GTPase 1 homolog (S. cerevisiae)
RAD51AP1 RAD51 associated protein 1
SFN stratifin
WDR6 WD repeat domain 6
RPL32 ribosomal protein L32
CREB3L4 cAMP responsive element binding protein 3-like 4
FAM122B family with sequence similarity 122B
SGK223 homolog of rat pragma of Rnd2
SNORD47 small nucleolar RNA, C/D box 47
DPH5 DPH5 homolog (S. cerevisiae)
POLE polymerase (DNA directed), epsilon
PDGFRL platelet-derived growth factor receptor-like
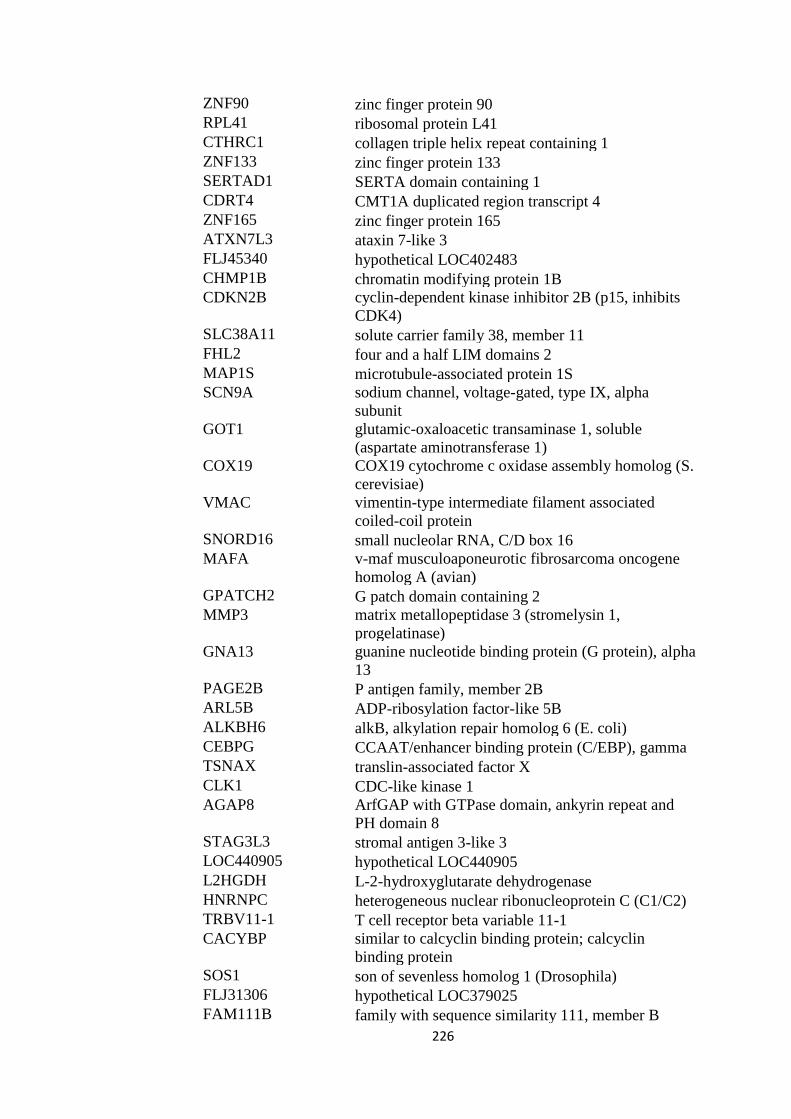
226
ZNF90 zinc finger protein 90
RPL41 ribosomal protein L41
CTHRC1 collagen triple helix repeat containing 1
ZNF133 zinc finger protein 133
SERTAD1 SERTA domain containing 1
CDRT4 CMT1A duplicated region transcript 4
ZNF165 zinc finger protein 165
ATXN7L3 ataxin 7-like 3
FLJ45340 hypothetical LOC402483
CHMP1B chromatin modifying protein 1B
CDKN2B cyclin-dependent kinase inhibitor 2B (p15, inhibits
CDK4)
SLC38A11 solute carrier family 38, member 11
FHL2 four and a half LIM domains 2
MAP1S microtubule-associated protein 1S
SCN9A sodium channel, voltage-gated, type IX, alpha
subunit
GOT1 glutamic-oxaloacetic transaminase 1, soluble
(aspartate aminotransferase 1)
COX19 COX19 cytochrome c oxidase assembly homolog (S.
cerevisiae)
VMAC vimentin-type intermediate filament associated
coiled-coil protein
SNORD16 small nucleolar RNA, C/D box 16
MAFA v-maf musculoaponeurotic fibrosarcoma oncogene
homolog A (avian)
GPATCH2 G patch domain containing 2
MMP3 matrix metallopeptidase 3 (stromelysin 1,
progelatinase)
GNA13 guanine nucleotide binding protein (G protein), alpha
13
PAGE2B P antigen family, member 2B
ARL5B ADP-ribosylation factor-like 5B
ALKBH6 alkB, alkylation repair homolog 6 (E. coli)
CEBPG CCAAT/enhancer binding protein (C/EBP), gamma
TSNAX translin-associated factor X
CLK1 CDC-like kinase 1
AGAP8 ArfGAP with GTPase domain, ankyrin repeat and
PH domain 8
STAG3L3 stromal antigen 3-like 3
LOC440905 hypothetical LOC440905
L2HGDH L-2-hydroxyglutarate dehydrogenase
HNRNPC heterogeneous nuclear ribonucleoprotein C (C1/C2)
TRBV11-1 T cell receptor beta variable 11-1
CACYBP similar to calcyclin binding protein; calcyclin
binding protein
SOS1 son of sevenless homolog 1 (Drosophila)
FLJ31306 hypothetical LOC379025
FAM111B family with sequence similarity 111, member B
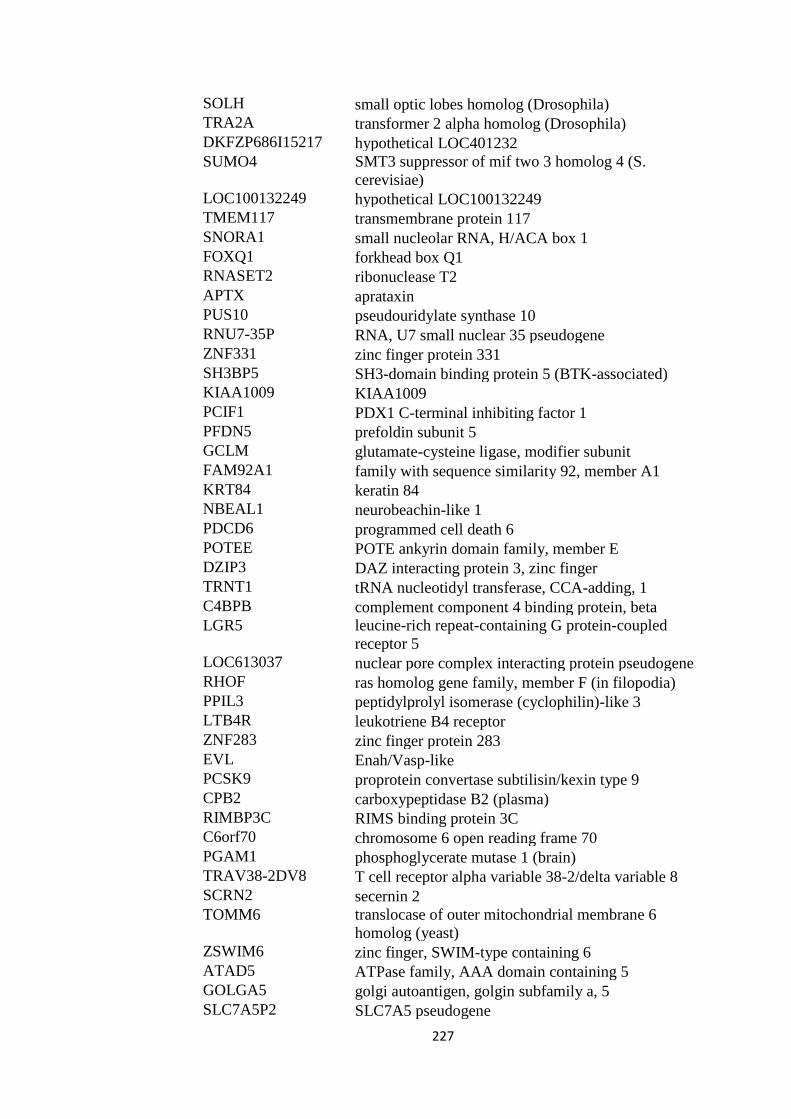
227
SOLH small optic lobes homolog (Drosophila)
TRA2A transformer 2 alpha homolog (Drosophila)
DKFZP686I15217 hypothetical LOC401232
SUMO4 SMT3 suppressor of mif two 3 homolog 4 (S.
cerevisiae)
LOC100132249 hypothetical LOC100132249
TMEM117 transmembrane protein 117
SNORA1 small nucleolar RNA, H/ACA box 1
FOXQ1 forkhead box Q1
RNASET2 ribonuclease T2
APTX aprataxin
PUS10 pseudouridylate synthase 10
RNU7-35P RNA, U7 small nuclear 35 pseudogene
ZNF331 zinc finger protein 331
SH3BP5 SH3-domain binding protein 5 (BTK-associated)
KIAA1009 KIAA1009
PCIF1 PDX1 C-terminal inhibiting factor 1
PFDN5 prefoldin subunit 5
GCLM glutamate-cysteine ligase, modifier subunit
FAM92A1 family with sequence similarity 92, member A1
KRT84 keratin 84
NBEAL1 neurobeachin-like 1
PDCD6 programmed cell death 6
POTEE POTE ankyrin domain family, member E
DZIP3 DAZ interacting protein 3, zinc finger
TRNT1 tRNA nucleotidyl transferase, CCA-adding, 1
C4BPB complement component 4 binding protein, beta
LGR5 leucine-rich repeat-containing G protein-coupled
receptor 5
LOC613037 nuclear pore complex interacting protein pseudogene
RHOF ras homolog gene family, member F (in filopodia)
PPIL3 peptidylprolyl isomerase (cyclophilin)-like 3
LTB4R leukotriene B4 receptor
ZNF283 zinc finger protein 283
EVL Enah/Vasp-like
PCSK9 proprotein convertase subtilisin/kexin type 9
CPB2 carboxypeptidase B2 (plasma)
RIMBP3C RIMS binding protein 3C
C6orf70 chromosome 6 open reading frame 70
PGAM1 phosphoglycerate mutase 1 (brain)
TRAV38-2DV8 T cell receptor alpha variable 38-2/delta variable 8
SCRN2 secernin 2
TOMM6 translocase of outer mitochondrial membrane 6
homolog (yeast)
ZSWIM6 zinc finger, SWIM-type containing 6
ATAD5 ATPase family, AAA domain containing 5
GOLGA5 golgi autoantigen, golgin subfamily a, 5
SLC7A5P2 SLC7A5 pseudogene
228
SNAR-G2 small ILF3/NF90-associated RNA G2
ANKRD18A ankyrin repeat domain 18A
UPK3BL uroplakin-like protein
MARK4 MAP/microtubule affinity-regulating kinase 4
ORAOV1 oral cancer overexpressed 1
MIR1224 microRNA 1224
CYCS cytochrome c, somatic
KIF19 kinesin family member 19
LOC100132062 hypothetical LOC100132062
LOC100128288 hypothetical protein LOC100128288
TMEM135 transmembrane protein 135
ZNF337 zinc finger protein 337
C11orf39 chromosome 11 open reading frame 39
VASP vasodilator-stimulated phosphoprotein
OR4F21 olfactory receptor, family 4, subfamily F, member 21
SYNJ2 synaptojanin 2
CDC42BPB CDC42 binding protein kinase beta (DMPK-like)
PIK3CA phosphoinositide-3-kinase, catalytic, alpha
polypeptide
TRAJ28 T cell receptor alpha joining 28
LOC644961 similar to cytoplasmic beta-actin
RPL23AP7 ribosomal protein L23a pseudogene 7
MIR564 microRNA 564
FLJ20464 hypothetical protein FLJ20464
CCNL2 cyclin L2; chemokine (C-C motif) receptor 6
CDC34 cell division cycle 34 homolog (S. cerevisiae)
CENPC1 centromere protein C 1
PGM2L1 phosphoglucomutase 2-like 1
SNORD77 small nucleolar RNA, C/D box 77
YME1L1 YME1-like 1 (S. cerevisiae)
LOC440300 chondroitin sulfate proteoglycan 4 pseudogene
TSTD1 thiosulfate sulfurtransferase KAT, putative
ACSM1 acyl-CoA synthetase medium-chain family member 1
SNORA52 small nucleolar RNA, H/ACA box 52
OBP2B odorant binding protein 2B
MLNR motilin receptor
ZNF114 zinc finger protein 114
D2HGDH D-2-hydroxyglutarate dehydrogenase
DGCR11 DiGeorge syndrome critical region gene 11
EDC3 enhancer of mRNA decapping 3 homolog (S.
cerevisiae)
MAGOH mago-nashi homolog, proliferation-associated
(Drosophila)
STK36 serine/threonine kinase 36, fused homolog
(Drosophila)
WIPI1 WD repeat domain, phosphoinositide interacting 1
ACOX2 acyl-Coenzyme A oxidase 2, branched chain
ELMOD2 ELMO/CED-12 domain containing 2
229
TOMM40L translocase of outer mitochondrial membrane 40
homolog (yeast)-like
IGLJ3 immunoglobulin lambda joining 3
MT2A metallothionein 2A
BRD1 bromodomain containing 1
TAC4 tachykinin 4 (hemokinin)
CYP24A1 cytochrome P450, family 24, subfamily A,
polypeptide 1
LPPR1 plasticity related gene 3
NR1D1 nuclear receptor subfamily 1, group D, member 1
LOC100130428 IGYY565
FOXRED1 FAD-dependent oxidoreductase domain containing 1
FAM157B family with sequence similarity 157, member B
LOC388242 coiled-coil domain containing 101 pseudogene
CHUK conserved helix-loop-helix ubiquitous kinase
NKAP NFKB activating protein
COG7 component of oligomeric golgi complex 7
NUMB numb homolog (Drosophila)
LOC100288069 similar to hCG1640306
UCHL3 ubiquitin carboxyl-terminal esterase L3 (ubiquitin
thiolesterase)
IGLJ5 immunoglobulin lambda joining 5 (non-functional)
POTEH POTE ankyrin domain family, member H
DHCR7 7-dehydrocholesterol reductase
NCOR1 nuclear receptor co-repressor 1
SNORA11D small nucleolar RNA, H/ACA box 11D
HCG9 HLA complex group 9
MYLK4 myosin light chain kinase family, member 4
TMEM144 transmembrane protein 144
NLGN4Y neuroligin 4, Y-linked
F11R F11 receptor
HNRNPA3 heterogeneous nuclear ribonucleoprotein A3
BOLA2 bolA homolog 2 (E. coli); bolA homolog 2B (E. coli)
SNRPE small nuclear ribonucleoprotein polypeptide E-like 1
PRKY protein kinase, Y-linked
PKD2 polycystic kidney disease 2 (autosomal dominant)
SCARNA17 small Cajal body-specific RNA 17
WDR52 WD repeat domain 52
GPR21 G protein-coupled receptor 21
PLAU plasminogen activator, urokinase
DLEU2 deleted in lymphocytic leukemia 2 (non-protein
coding)
SMO smoothened homolog (Drosophila)
OPRL1 opiate receptor-like 1
ACPL2 acid phosphatase-like 2
ADAMTS4 ADAM metallopeptidase with thrombospondin type
1 motif, 4
230
SRF serum response factor (c-fos serum response
element-binding transcription factor)
DISC1 disrupted in schizophrenia 1
RTEL1 regulator of telomere elongation helicase 1
TNFRSF6B tumour necrosis factor receptor superfamily, member
6b, decoy
LOC100130927 hypothetical protein LOC100130927
STEAP2 six transmembrane epithelial antigen of the prostate 2
ARPC1A actin related protein 2/3 complex, subunit 1A, 41kDa
LGALS3 lectin, galactoside-binding, soluble, 3
ERN1 endoplasmic reticulum to nucleus signalling 1
TMEM97 transmembrane protein 97
ABCA11P ATP-binding cassette, sub-family A (ABC1),
member 11 (pseudogene)
SGCE sarcoglycan, epsilon
ZNF658 zinc finger protein 658
RASGRF1 Ras protein-specific guanine nucleotide-releasing
factor 1
DND1 dead end homolog 1 (zebrafish); similar to dead end
homolog 1
KDM6B lysine (K)-specific demethylase 6B
HIST1H2BI histone cluster 1, H2bi
HIST1H2BG histone cluster 1, H2bg
HIST1H2BC histone cluster 1, H2bc
HIST1H2BE histone cluster 1, H2be
HIST1H2BF histone cluster 1, H2bf
LOC100130642 hypothetical LOC100130642
TNS4 tensin 4
ZNF776 zinc finger protein 776
C4orf36 chromosome 4 open reading frame 36
LOC493754 RAB guanine nucleotide exchange factor (GEF) 1
pseudogene
JUND jun D proto-oncogene
ZNF224 zinc finger protein 224
RPS27 ribosomal protein S27 pseudogene 19
FLJ44342 hypothetical LOC645460
ANAPC4 anaphase promoting complex subunit 4
SNORD103A small nucleolar RNA, C/D box 103A
FAM3C family with sequence similarity 3, member C
RAB9B RAB9B, member RAS oncogene family
SORBS2 sorbin and SH3 domain containing 2
CSGALNACT2 chondroitin sulfate N-
acetylgalactosaminyltransferase 2
ADAMTS13 ADAM metallopeptidase with thrombospondin type
1 motif, 13
DDX11L1 similar to DEAD/H box polypeptide 11 like 9
SH2D7 SH2 domain containing 7
PLXNC1 plexin C1
231
ZMIZ1 zinc finger, MIZ-type containing 1
CELA3B chymotrypsin-like elastase family, member 3B
HNRNPA2B1 heterogeneous nuclear ribonucleoprotein A2/B1
GATAD2A GATA zinc finger domain containing 2A
CDC25B cell division cycle 25 homolog B (S. pombe)
CHTF18 CTF18, chromosome transmission fidelity factor 18
homolog (S. cerevisiae)
SNRPG small nuclear ribonucleoprotein polypeptide G
BRCA2 breast cancer 2, early onset
MGC2752 hypothetical LOC65996
ZNF789 zinc finger protein 789
CYR61 cysteine-rich, angiogenic inducer, 61
GLMN glomulin, FKBP associated protein
HIBCH 3-hydroxyisobutyryl-Coenzyme A hydrolase
WIPF2 WAS/WASL interacting protein family, member 2
MIR933 microRNA 933
NCOR2 nuclear receptor co-repressor 2
RICTOR RPTOR independent companion of MTOR, complex
2
DDX11 DEAD/H (Asp-Glu-Ala-Asp/His) box polypeptide
11
UBD ubiquitin D
NPM1 nucleophosmin 1 (nucleolar phosphoprotein B23,
numatrin) pseudogene 21
EIF2C2 eukaryotic translation initiation factor 2C, 2
DEFB113 defensin, beta 113
STX3 syntaxin 3
GPSM2 G-protein signalling modulator 2 (AGS3-like, C.
elegans)
MIR421 microRNA 421
SNAI2 snail homolog 2 (Drosophila)
KDM4D lysine (K)-specific demethylase 4D
VSNL1 visinin-like 1
MTRF1L mitochondrial translational release factor 1-like
SLC37A4 solute carrier family 37 (glucose-6-phosphate
transporter), member 4
CYP51A1 cytochrome P450, family 51, subfamily A,
polypeptide 1
ERAP2 endoplasmic reticulum aminopeptidase 2
PPP4R4 protein phosphatase 4, regulatory subunit 4
NR0B2 nuclear receptor subfamily 0, group B, member 2
CDH26 cadherin-like 26
LOC553103 hypothetical LOC553103
FOXD4L6 forkhead box D4-like 6
RCAN3 RCAN family member 3
TRIM59 tripartite motif-containing 59
CARM1 coactivator-associated arginine methyltransferase 1
232
B3GNT3 UDP-GlcNAc:betaGal beta-1,3-N-
acetylglucosaminyltransferase 3
DCDC5 doublecortin domain containing 5
RPL23AP32 ribosomal protein L23a pseudogene 32
SNORD75 small nucleolar RNA, C/D box 75
MT1X metallothionein 1X
RNU7-11P RNA, U7 small nuclear 11 pseudogene
CARD17 caspase recruitment domain family, member 17
OGFOD2 2-oxoglutarate and iron-dependent oxygenase
domain containing 2
PRR4 proline rich 4 (lacrimal)
METRNL meteorin, glial cell differentiation regulator-like
KCTD9 potassium channel tetramerisation domain containing
9
CSAD cysteine sulfinic acid decarboxylase
PLCG1 phospholipase C, gamma 1
TMEM25 transmembrane protein 25
RPS2 ribosomal protein S2
FOXD4L5 forkhead box D4-like 5
SNORA70B small nucleolar RNA, H/ACA box 70B
(retrotransposed)
ABCA7 ATP-binding cassette, sub-family A (ABC1),
member 7
STX16 syntaxin 16
PLEKHG2 pleckstrin homology domain containing, family G
(with RhoGef domain) member 2
CCDC53 coiled-coil domain containing 53
ACVR1 activin A receptor, type I
CRIPAK cysteine-rich PAK1 inhibitor
HES1 hairy and enhancer of split 1, (Drosophila)
SIGLEC15 sialic acid binding Ig-like lectin 15
C14orf145 chromosome 14 open reading frame 145
DLX2 distal-less homeobox 2
RNU7-77P RNA, U7 small nuclear 77 pseudogene
CSNK1G3 casein kinase 1, gamma 3
SPAG4 sperm associated antigen 4
IL8 interleukin 8
CD46 CD46 molecule, complement regulatory protein
LOC644450 hypothetical protein LOC644450
TRAV1-2 T cell receptor alpha variable 1-2
PTPDC1 protein tyrosine phosphatase domain containing 1
ERCC1 excision repair cross-complementing rodent repair
deficiency, complementation group 1
TUBB2A tubulin, beta 2A
GSTO2 glutathione S-transferase omega 2
HERC2P5 hect domain and RLD 2 pseudogene 5
GLS glutaminase
ZFP30 zinc finger protein 30 homolog (mouse)
233
FANCA Fanconi anemia, complementation group A
ZNF614 zinc finger protein 614
HMGN3 high mobility group nucleosomal binding domain 3
B4GALT6 UDP-Gal:betaGlcNAc beta 1,4-
galactosyltransferase, polypeptide 6
MTERFD3 MTERF domain containing 3
ANAPC10 anaphase promoting complex subunit 10
SNORA64 small nucleolar RNA, H/ACA box 64
LRRC25 leucine rich repeat containing 25
RNU7-72P RNA, U7 small nuclear 72 pseudogene
LRP5 low density lipoprotein receptor-related protein 5
SLC6A14 solute carrier family 6 (amino acid transporter),
member 14
NKAIN1 Na+/K+ transporting ATPase interacting 1
IFT80 intraflagellar transport 80 homolog
(Chlamydomonas)
RNU7-47P RNA, U7 small nuclear 47 pseudogene
C9orf3 chromosome 9 open reading frame 3
GDPD5 glycerophosphodiester phosphodiesterase domain
containing 5
CCDC41 coiled-coil domain containing 41
GADD45B growth arrest and DNA-damage-inducible, beta
CLEC18C C-type lectin domain family 18, member C
MSTO2P misato homolog 2 pseudogene
ASAP2 ArfGAP with SH3 domain, ankyrin repeat and PH
domain 2
FAM133B family with sequence similarity 133, member B
pseudogene
MEX3C mex-3 homolog C (C. elegans)
STMN1 stathmin 1
MBNL2 muscleblind-like 2 (Drosophila)
LRTOMT leucine rich transmembrane and 0-methyltransferase
domain containing
CHD2 chromodomain helicase DNA binding protein 2
LCK lymphocyte-specific protein tyrosine kinase
AGAP11 ankyrin repeat and GTPase domain Arf GTPase
activating protein 11
LOC100133032 hypothetical LOC100133032
TCEA1 transcription elongation factor A (SII), 1
TCEA1P2 transcription elongation factor A (SII), 1 pseudogene
2
BTAF1 BTAF1 RNA polymerase II
DCDC1 doublecortin domain containing 1
LOC90784 hypothetical protein LOC90784
GSTA3 glutathione S-transferase alpha 3
LOC100287628 hypothetical protein LOC100287628
AQP3 aquaporin 3 (Gill blood group)
CNP 2',3'-cyclic nucleotide 3' phosphodiesterase
234
PARD3 par-3 partitioning defective 3 homolog (C. elegans)
MAPK13 mitogen-activated protein kinase 13
WASH1 similar to WAS protein family homolog 1
MED13L mediator complex subunit 13-like
SAT1 spermidine/spermine N1-acetyltransferase 1
ZNF280A zinc finger protein 280A
CDHR3 hypothetical protein FLJ23834
SNORA27 small nucleolar RNA, H/ACA box 27
MTM1 myotubularin 1
SERINC2 serine incorporator 2
MIDN midnolin
PNN pinin, desmosome associated protein
BMS1P2 BMS1 pseudogene 2
MAT2A methionine adenosyltransferase II, alpha
ARHGAP33 sorting nexin 26
ST7L suppression of tumourigenicity 7 like
RALB v-ral simian leukemia viral oncogene homolog B (ras
related; GTP binding protein)
RNF19B ring finger protein 19B
TREX1 three prime repair exonuclease 1
CCDC15 coiled-coil domain containing 15
CHKB-CPT1B choline kinase-like, carnitine palmitoyltransferase 1B
(muscle) transcription unit
GUSBP3 glucuronidase, beta pseudogene
CYTH2 cytohesin 2
TMPRSS9 transmembrane protease, serine 9
SOD2 superoxide dismutase 2, mitochondrial
DDX11L9 similar to DEAD/H box polypeptide 11 like 9
HGFAC HGF activator
CEBPB CCAAT/enhancer binding protein (C/EBP), beta
TM2D1 TM2 domain containing 1
OBFC1 oligonucleotide/oligosaccharide-binding fold
containing 1
PIGZ phosphatidylinositol glycan anchor biosynthesis,
class Z
CHRD chordin
LOC441259 PMS2 postmeiotic segregation increased 2 (S.
cerevisiae)-like
KRT80 keratin 80
SCFV single-chain Fv fragment
FKSG49 FKSG49
C5orf54 chromosome 5 open reading frame 54
HAUS4 HAUS augmin-like complex, subunit 4
CLMN calmin (calponin-like, transmembrane)
SLC2A3 solute carrier family 2 (facilitated glucose
transporter), member 3
MIRLET7E microRNA let-7e
SESN1 sestrin 1
235
DCAF10 WD repeat domain 32
SNORD116-28 small nucleolar RNA, C/D box 116-28
XPNPEP3 X-prolyl aminopeptidase (aminopeptidase P) 3,
putative
PRH1 proline-rich protein HaeIII subfamily 1
CCL20 chemokine (C-C motif) ligand 20
MIR34A microRNA 34a
SERPINB2
serpin peptidase inhibitor, clade B (ovalbumin),
member 2
MED8 mediator complex subunit 8
TTPA tocopherol (alpha) transfer protein
CCDC138 coiled-coil domain containing 138
RSL24D1 ribosomal L24 domain containing 1
KLK11 kallikrein-related peptidase 11
SPDYE2 speedy homolog E2 (Xenopus laevis)
SNAR-C3 small ILF3/NF90-associated RNA C3
NAT9 N-acetyltransferase 9 (GCN5-related, putative)
FNDC4 fibronectin type III domain containing 4
PAR-SN paternally expressed transcript PAR-SN
PDE4D phosphodiesterase 4D
UGT2B28 UDP glucuronosyltransferase 2 family, polypeptide
B28
MIR93 microRNA 93
ZFP36 zinc finger protein 36, C3H type, homolog (mouse)
RPL13AP6 ribosomal protein L13a pseudogene 6
PPP1R10 protein phosphatase 1, regulatory (inhibitor) subunit
10
ARHGAP11B Rho GTPase activating protein 11B; Rho GTPase
activating protein 11A
TIA1 TIA1 cytotoxic granule-associated RNA binding
protein
AHI1 Abelson helper integration site 1
DQX1 DEAQ box RNA-dependent ATPase 1
RPL21 119; ribosomal protein L21 pseudogene 125
AK2 adenylate kinase 2
IRAK2 interleukin-1 receptor-associated kinase 2
RRAS related RAS viral (r-ras) oncogene homolog
IL15RA interleukin 15 receptor, alpha
OXER1 oxoeicosanoid (OXE) receptor 1
MTMR2 myotubularin related protein 2
ADAMTS6 ADAM metallopeptidase with thrombospondin type
1 motif, 6
CUL9 cullin 9
LONRF1 LON peptidase N-terminal domain and ring finger 1
SMYD4 SET and MYND domain containing 4
EP400NL EP400 N-terminal like
EGR1 early growth response 1
236
GLUD1 glutamate dehydrogenase 1
BHLHE40 basic helix-loop-helix family, member e40
LOC729603 calcium binding protein P22 pseudogene
CACNA2D4 calcium channel, voltage-dependent, alpha 2/delta
subunit 4
RPL36A ribosomal protein L36a
HNRNPH2 heterogeneous nuclear ribonucleoprotein H2 (H')
IGKV1-8 immunoglobulin kappa variable 1-8
TAS1R1 taste receptor, type 1, member 1
FHL3 four and a half LIM domains 3
RHOT1 ras homolog gene family, member T1
MITD1 MIT, microtubule interacting and transport, domain
containing 1
LIPG lipase, endothelial
FADS2 fatty acid desaturase 2
PTAFR platelet-activating factor receptor
MIR645 microRNA 645
ZNF594 zinc finger protein 594
GOLT1A golgi transport 1 homolog A (S. cerevisiae)
MAFG v-maf musculoaponeurotic fibrosarcoma oncogene
homolog G (avian)
TAGLN transgelin
C3orf35 chromosome 3 open reading frame 35
LOC728730 hypothetical LOC728730
MADD MAP-kinase activating death domain
RAPH1 Ras association (RalGDS/AF-6) and pleckstrin
homology domains 1
SERPINB9 serpin peptidase inhibitor, clade B (ovalbumin),
member 9
SNORD44 small nucleolar RNA, C/D box 44
ETV3 ets variant 3
PRSS22 protease, serine, 22
ATF3 activating transcription factor 3
CD22 CD22 molecule
EME1 essential meiotic endonuclease 1 homolog 1 (S.
pombe)
IL6R interleukin 6 receptor
ZNF260 zinc finger protein 260
NBPF7 neuroblastoma breakpoint family, member 7
PTCD2 pentatricopeptide repeat domain 2
MIR623 microRNA 623
FAM197Y2 chromosome Y open reading frame 16
TEAD3 TEA domain family member 3
SNORD79 small nucleolar RNA, C/D box 79
ABCG5 ATP-binding cassette, sub-family G (WHITE),
member 5
NVL nuclear VCP-like
RGL1 ral guanine nucleotide dissociation stimulator-like 1
237
HOXD1 homeobox D1
MIR1304 microRNA 1304
PPIA peptidylprolyl isomerase A (cyclophilin A)
ZNF768 zinc finger protein 768
MSTO1 misato homolog 1 (Drosophila)
C21orf90 chromosome 21 open reading frame 90
CROT carnitine O-octanoyltransferase
SNORD33 small nucleolar RNA, C/D box 33
SNORD32A small nucleolar RNA, C/D box 32A
CENPL centromere protein L
ALS2CR8 amyotrophic lateral sclerosis 2 (juvenile)
chromosome region, candidate 8
CPLX3 complexin 3
LOC728208 hypothetical protein LOC728208
SNORD5 small nucleolar RNA, C/D box 5
FLJ41757 hypothetical gene supported by AF086285
HNRNPA1 similar to heterogeneous nuclear ribonucleoprotein
A1
RBM27 RNA binding motif protein 27
ZNF688 zinc finger protein 688; zinc finger protein 785
LOC100130015 hypothetical LOC100130015
DHX32 DEAH (Asp-Glu-Ala-His) box polypeptide 32
KRTAP10-7 keratin associated protein 10-7
TEX9 testis expressed 9
FAM138E family with sequence similarity 138, member E
SERPINA4 serpin peptidase inhibitor, clade A (alpha-1
antiproteinase, antitrypsin), member 4
SLC16A6 solute carrier family 16, member 6
SLC37A2 solute carrier family 37 (glycerol-3-phosphate
transporter), member 2
SUMO1 SUMO1 pseudogene 3
SLC7A11 solute carrier family 7, (cationic amino acid
transporter, y+ system) member 11
MAP2K6 mitogen-activated protein kinase kinase 6
LOC728323 hypothetical LOC728323
PTGIS prostaglandin I2 (prostacyclin) synthase
TRAM1 translocation associated membrane protein 1
LOC645166 lymphocyte-specific protein 1 pseudogene
ZSCAN16 zinc finger and SCAN domain containing 16
NQO1 NAD(P)H dehydrogenase, quinone 1
C9orf152 chromosome 9 open reading frame 152
DGCR8 DiGeorge syndrome critical region gene 8
FAM111A family with sequence similarity 111, member A
FOSL1 FOS-like antigen 1
MLF1IP MLF1 interacting protein
PHF11 PHD finger protein 11
ISX intestine-specific homeobox
238
TNFRSF19 tumour necrosis factor receptor superfamily, member
19
LOC613038 coiled-coil domain containing 101 pseudogene
PLXNA2 plexin A2
AKR1D1 aldo-keto reductase family 1, member D1 (delta 4-3-
ketosteroid-5-beta-reductase)
SYNE2 spectrin repeat containing, nuclear envelope 2
NUPR1 nuclear protein, transcriptional regulator, 1
KLF12 Kruppel-like factor 12
TMCC2 transmembrane and coiled-coil domain family 2
CADM1 cell adhesion molecule 1
IGHM immunoglobulin heavy constant gamma 1 (G1m
marker)
NPPC natriuretic peptide precursor C
DNAJC5 DnaJ (Hsp40) homolog, subfamily C, member 5
DDC dopa decarboxylase (aromatic L-amino acid
decarboxylase)
ARHGAP27 Rho GTPase activating protein 27
RHBG Rh family, B glycoprotein (gene/pseudogene)
MAGED4B melanoma antigen family D, 4B; melanoma antigen
family D, 4
MAGED4 melanoma antigen family D, 4B; melanoma antigen
family D, 4
ZNF443 zinc finger protein 443
PLCD3 phospholipase C, delta 3
LOC729083 hypothetical protein LOC729083
LOC728724 hCG1814486
NQO2 NAD(P)H dehydrogenase, quinone 2
TPD52L2 tumour protein D52-like 2
CDO1 cysteine dioxygenase, type I
IGBP1 immunoglobulin (CD79A) binding protein 1
POM121L1P POM121 membrane glycoprotein-like 1 (rat)
pseudogene
ITPR2 inositol 1,4,5-triphosphate receptor, type 2
ACBD5 acyl-Coenzyme A binding domain containing 5
MIR27B microRNA 27b
CARS cysteinyl-tRNA synthetase
ABHD4 abhydrolase domain containing 4
GINS1 GINS complex subunit 1 (Psf1 homolog)
DDIT3 DNA-damage-inducible transcript 3
FATE1 fetal and adult testis expressed 1
MPPE1 metallophosphoesterase 1
PRMT7 protein arginine methyltransferase 7
SGTB small glutamine-rich tetratricopeptide repeat (TPR)-
containing, beta
IDS iduronate 2-sulfatase
SNORD103B small nucleolar RNA, C/D box 103B
TXNIP thioredoxin interacting protein
239
TBC1D8 TBC1 domain family, member 8 (with GRAM
domain)
TAF1D TATA box binding protein (TBP)-associated factor,
RNA polymerase I, D, 41kDa
SNORA32 small nucleolar RNA, H/ACA box 32
ACSS1 acyl-CoA synthetase short-chain family member 1
SH2B3 SH2B adaptor protein 3
UBE2G2 ubiquitin-conjugating enzyme E2G 2 (UBC7
homolog, yeast)
LOC643696 hypothetical LOC643696
MKRN3 makorin ring finger protein 3
TMCO6 transmembrane and coiled-coil domains 6
LOC440149 hypothetical LOC440149
PACS1 phosphofurin acidic cluster sorting protein 1
SNORD107 small nucleolar RNA, C/D box 107
SKIL SKI-like oncogene
PION pigeon homolog (Drosophila)
AGAP7 ArfGAP with GTPase domain, ankyrin repeat and
PH domain 7
AREGB amphiregulin; amphiregulin B
AREG amphiregulin; amphiregulin B
POLE2 polymerase (DNA directed), epsilon 2 (p59 subunit)
MRPL45P2 mitochondrial ribosomal protein L45 pseudogene 2
MIR637 microRNA 637
NAMPTL nicotinamide phosphoribosyltransferase-like
MPV17L MPV17 mitochondrial membrane protein-like
UHRF2 ubiquitin-like with PHD and ring finger domains 2
PAQR5 progestin and adipoQ receptor family member V
SSH1 slingshot homolog 1 (Drosophila)
ZNF493 zinc finger protein 493
ADH4 alcohol dehydrogenase 4 (class II), pi polypeptide
ATP7B ATPase, Cu++ transporting, beta polypeptide
LOC441124 hypothetical gene supported by AK093729;
BX647918
DEFB103A defensin, beta 103B; defensin, beta 103A
DEFB103B defensin, beta 103B; defensin, beta 103A
EED embryonic ectoderm development
C9orf173 hypothetical protein LOC441476
NDRG1 N-myc downstream regulated 1
DOC2GP double C2, gamma pseudogene
CBWD1 COBW domain containing 6; COBW domain
containing 1
CBWD6 COBW domain containing 6; COBW domain
containing 1
SPG7 spastic paraplegia 7 (pure and complicated autosomal
recessive)
SNORD80 small nucleolar RNA, C/D box 80
PRSS33 protease, serine, 33
240
SFI1 Sfi1 homolog, spindle assembly associated (yeast)
GLB1L galactosidase, beta 1-like
KRT37 keratin 37
ZGPAT zinc finger, CCCH-type with G patch domain
FAM27B family with sequence similarity 27, member B
FAM27C family with sequence similarity 27, member C
FAM27A family with sequence similarity 27, member A
CISD2 CDGSH iron sulfur domain 2
TMEM18 transmembrane protein 18
GDPD1 glycerophosphodiester phosphodiesterase domain
containing 1
PCBP1 poly(rC) binding protein 1
SNAR-C5 small ILF3/NF90-associated RNA C5
MT1G metallothionein 1G
TCEA3 transcription elongation factor A (SII), 3
GLT8D1 glycosyltransferase 8 domain containing 1
APOF apolipoprotein F
OSTF1 osteoclast stimulating factor 1
BMS1P7 BMS1 pseudogene 7
EIF1B eukaryotic translation initiation factor 1B
DDX11L10 DEAD/H box polypeptide 11 like 11
MAP3K2 mitogen-activated protein kinase kinase kinase 2
MAFK v-maf musculoaponeurotic fibrosarcoma oncogene
homolog K (avian)
CLDN19 claudin 19
TRNP1 TMF1-regulated nuclear protein 1
CREBZF CREB/ATF bZIP transcription factor
MKLN1 muskelin 1, intracellular mediator containing kelch
motifs
PARG similar to poly (ADP-ribose) glycohydrolase; poly
(ADP-ribose) glycohydrolase
CYP4F12 similar to cytochrome P450, family 4, subfamily F,
polypeptide 12
ITPR1 inositol 1,4,5-triphosphate receptor, type 1
LOC339260 hypothetical protein LOC339260
ACACB acetyl-Coenzyme A carboxylase beta
ZNF440 zinc finger protein 440
DUT deoxyuridine triphosphatase
LOC100129518 similar to hCG2029803
GRB10 growth factor receptor-bound protein 10
SNORD53 small nucleolar RNA, C/D box 53
THRA thyroid hormone receptor, alpha (erythroblastic
leukemia viral (v-erb-a) oncogene homolog, avian)
NAIP NLR family, apoptosis inhibitory protein
SNAR-E small ILF3/NF90-associated RNA E
SUB1 SUB1 homolog (S. cerevisiae)
ACTR3B ARP3 actin-related protein 3 homolog B (yeast)
CASP8AP2 caspase 8 associated protein 2
241
MRPS6 mitochondrial ribosomal protein S6
TMEM218 transmembrane protein 218
MIR570 microRNA 570
HIST2H3PS2 histone cluster 2, H3, pseudogene 2
TTC30A tetratricopeptide repeat domain 30A
SH3BGR SH3 domain binding glutamic acid-rich protein
SMN2 survival of motor neuron 2, centromeric
SMN1 survival of motor neuron 1, telomeric
LUC7L3 cisplatin resistance-associated overexpressed protein
CRLF3 cytokine receptor-like factor 3
CSRNP1 cysteine-serine-rich nuclear protein 1
CREBBP CREB binding protein
CAMLG calcium modulating ligand
SESN2 sestrin 2
LOC441081 POM121 membrane glycoprotein (rat) pseudogene
NPIPL2 nuclear pore complex interacting protein-like 2
SH3RF1 SH3 domain containing ring finger 1
SETD1B SET domain containing 1B
SLC2A10 solute carrier family 2 (facilitated glucose
transporter), member 10
CFI complement factor I
PPP1R1B protein phosphatase 1, regulatory (inhibitor) subunit
1B
LOC100131655 hypothetical LOC100131655
C1orf220 chromosome 1 open reading frame 220
NBPF9 neuroblastoma breakpoint family, member 9
NBPF10 neuroblastoma breakpoint family, member 10
NBPF1 neuroblastoma breakpoint family, member 1
NBPF12 neuroblastoma breakpoint family, member 12
NBPF8 neuroblastoma breakpoint family, member 8
LOC81691 exonuclease NEF-sp
LOC338797 hypothetical LOC338797
SNHG10 small nucleolar RNA host gene 10 (non-protein
coding)
SCARNA13 small Cajal body-specific RNA 13
HIVEP2 human immunodeficiency virus type I enhancer
binding protein 2
LOC100288102 similar to Putative uncharacterized protein C20orf69
EPAS1 endothelial PAS domain protein 1
LOC100216546 hypothetical LOC100216546
FAM3B family with sequence similarity 3, member B
OAS1 2',5'-oligoadenylate synthetase 1, 40/46kDa
SLC44A5 solute carrier family 44, member 5
SQRDL sulfide quinone reductase-like (yeast)
LOC100272216 hypothetical LOC100272216
SENP7 SUMO1/sentrin specific peptidase 7
UBE2N ubiquitin-conjugating enzyme E2N (UBC13
homolog, yeast)
242
UQCC ubiquinol-cytochrome c reductase complex
chaperone
CMIP c-Maf-inducing protein
BMS1P6 BMS1 pseudogene 6
MAGI3 membrane associated guanylate kinase, WW and
PDZ domain containing 3
AKR7L aldo-keto reductase family 7-like
LRRC45 leucine rich repeat containing 45
HIST2H2BC histone cluster 2, H2bc
MIR587 microRNA 587
RABGAP1 RAB GTPase activating protein 1
MMAB
methylmalonic aciduria (cobalamin deficiency) cblB
type
UBE2B ubiquitin-conjugating enzyme E2B (RAD6 homolog)
SUCLA2 succinate-CoA ligase, ADP-forming, beta subunit
NFE2L2 nuclear factor (erythroid-derived 2)-like 2
EREG epiregulin
PINK1 PTEN induced putative kinase 1
GHRLOS ghrelin opposite strand (non-protein coding)
NR3C1 nuclear receptor subfamily 3, group C, member 1
(glucocorticoid receptor)
MT1F metallothionein 1F
ZNF664 zinc finger protein 664
LOC399753 hypothetical LOC399753
UCA1 urothelial cancer associated 1
TNFSF10 tumour necrosis factor (ligand) superfamily, member
10
SPATA5 spermatogenesis associated 5
LOC100292922 similar to hCG1644292
DHRS1 dehydrogenase/reductase (SDR family) member 1
LOC728715 similar to hCG38149
AIP aryl hydrocarbon receptor interacting protein
SMOX spermine oxidase
RB1CC1 RB1-inducible coiled-coil 1
MUC15 mucin 15, cell surface associated
STK40 serine/threonine kinase 40
L1CAM L1 cell adhesion molecule
NFYC nuclear transcription factor Y, gamma
MIR99B microRNA 99b
THBS1 thrombospondin 1
CMC1 COX assembly mitochondrial protein homolog (S.
cerevisiae)
PRAMEF16 PRAME family member 16
CCDC111 coiled-coil domain containing 111
HSD17B7 hydroxysteroid (17-beta) dehydrogenase 7
LOC728407 poly(ADP-ribose) glycohydrolase pseudogene
243
TWF1 twinfilin, actin-binding protein, homolog 1
(Drosophila)
NHLRC3 NHL repeat containing 3
C1orf159 chromosome 1 open reading frame 159
SGK494 uncharacterized serine/threonine-protein kinase
SgK494
IFT172 intraflagellar transport 172 homolog
(Chlamydomonas)
ANG angiogenin, ribonuclease, RNase A family, 5
RRN3 RRN3 RNA polymerase I transcription factor
homolog (S. cerevisiae)
SESN3 sestrin 3
CPT1B choline kinase beta; carnitine palmitoyltransferase
1B (muscle)
CHKB choline kinase beta; carnitine palmitoyltransferase
1B (muscle)
PRLR prolactin receptor
CACNA1H calcium channel, voltage-dependent, T type, alpha
1H subunit
IL11 interleukin 11
RPL37 ribosomal protein L37
ZRANB2 zinc finger, RAN-binding domain containing 2
HSD17B7P2 hydroxysteroid (17-beta) dehydrogenase 7
pseudogene 2
LOC219690 hypothetical protein LOC219690
FAM72C family with sequence similarity 72, member C
HMGA1 hypothetical LOC100130009; high mobility group
AT-hook 1
SLA2 Src-like-adaptor 2
LIX1L Lix1 homolog (mouse)-like
LOC729737 hypothetical LOC729737
GOLGA6L3 hypothetical golgin-like LOC100133220
XPA xeroderma pigmentosum, complementation group A
FLJ45513 hypothetical LOC729220
C3orf58 chromosome 3 open reading frame 58
KLF10 Kruppel-like factor 10
CYTH3 cytohesin 3
CYP4F3 cytochrome P450, family 4, subfamily F, polypeptide
3
FBXL21 F-box and leucine-rich repeat protein 21
MST1P2 macrophage stimulating, pseudogene 2
ETS2 v-ets erythroblastosis virus E26 oncogene homolog 2
(avian)
PPP1R2 protein phosphatase 1, regulatory (inhibitor) subunit
2
GSTP1 glutathione S-transferase pi 1
CHORDC1 cysteine and histidine-rich domain (CHORD)-
containing 1
SNORD20 small nucleolar RNA, C/D box 20
244
WDR67 WD repeat domain 67
JUN jun oncogene
C14orf1 chromosome 14 open reading frame 1
LRIG2 leucine-rich repeats and immunoglobulin-like
domains 2
SPCS2 signal peptidase complex subunit 2 homolog (S.
cerevisiae)
NR4A1 nuclear receptor subfamily 4, group A, member 1
KNTC1 kinetochore associated 1
TTC31 tetratricopeptide repeat domain 31
NPIPL3 nuclear pore complex interacting protein-like 3
ARHGEF17 Rho guanine nucleotide exchange factor (GEF) 17
KRTAP9-3 keratin associated protein 9-3
KLF6 Kruppel-like factor 6
CYTL1 cytokine-like 1
RGS10 regulator of G-protein signalling 10
SLC4A11 solute carrier family 4, sodium borate transporter,
member 11
SNAR-D small ILF3/NF90-associated RNA D
ACAD10 acyl-Coenzyme A dehydrogenase family, member 10
MYL5 myosin, light chain 5, regulatory
TMEM106C transmembrane protein 106C
GOLGA6L5 golgi autoantigen, golgin subfamily a-like
pseudogene
HMGA2 high mobility group AT-hook 2
EEF1A2 eukaryotic translation elongation factor 1 alpha 2
PTGR2 prostaglandin reductase 2
UBC ubiquitin C
ATPBD4 ATP binding domain 4
GTF2IRD1 GTF2I repeat domain containing 1
TECPR1 tectonin beta-propeller repeat containing 1
MTRF1 mitochondrial translational release factor 1
KRTAP9-8 keratin associated protein 9-8
HCG23 HLA complex group 23
FKSG29 FKSG29
ZNF483 zinc finger protein 483
DDX11L2 hypothetical LOC84771
ESF1 ESF1, nucleolar pre-rRNA processing protein,
homolog (S. cerevisiae)
LOC283587 hypothetical protein LOC283587
MIR608 microRNA 608
PNMA1 paraneoplastic antigen MA1
CLTCL1 clathrin, heavy chain-like 1
NFKBIZ nuclear factor of kappa light polypeptide gene
enhancer in B-cells inhibitor, zeta
LOC100132705 similar to immunoglobulin superfamily, member 3
SLC17A2 solute carrier family 17 (sodium phosphate), member
2
245
CD9 CD9 molecule
EBP emopamil binding protein (sterol isomerase)
NMNAT3 nicotinamide nucleotide adenylyltransferase 3
F2RL1 coagulation factor II (thrombin) receptor-like 1
MNS1 meiosis-specific nuclear structural 1
MEF2D myocyte enhancer factor 2D
SQSTM1 sequestosome 1
ANKRD20A3 ankyrin repeat domain 20 family, member A3
ANKRD20A2 ankyrin repeat domain 20 family, member A2
ANKRD20A1 ankyrin repeat domain 20 family, member A1
LOC402269 similar to SLC29A4 protein
SMA5 glucuronidase, beta pseudogene
CBX4 chromobox homolog 4 (Pc class homolog,
Drosophila)
PVT1 Pvt1 oncogene (non-protein coding)
NLK nemo-like kinase
MIR192 microRNA 192
LOC285758 hypothetical protein LOC285758
LOC100287934 similar to hCG2042721
ARL6IP6 ADP-ribosylation-like factor 6 interacting protein 6
RBM12B RNA binding motif protein 12B
GEN1 Gen homolog 1, endonuclease (Drosophila)
LOC100129617 hypothetical protein LOC100129617
SNAR-C2 small ILF3/NF90-associated RNA C2
NPEPL1 aminopeptidase-like 1
NAT8B N-acetyltransferase 8B (GCN5-related, putative,
gene/pseudogene)
HIST1H2BM histone cluster 1, H2bm
SNORD25 small nucleolar RNA, C/D box 25
TRIM50 tripartite motif-containing 50
SNORD72 small nucleolar RNA, C/D box 72
P2RX3 purinergic receptor P2X, ligand-gated ion channel, 3
CTH cystathionase (cystathionine gamma-lyase)
OVOL2 ovo-like 2 (Drosophila)
LOC653501 zinc finger protein 658 pseudogene; zinc finger
protein 658B
ZNF658B zinc finger protein 658 pseudogene; zinc finger
protein 658B
TMED6 transmembrane emp24 protein transport domain
containing 6
TBC1D7 TBC1 domain family, member 7
AGPAT9 1-acylglycerol-3-phosphate O-acyltransferase 9
PCGF2 polycomb group ring finger 2
FOXD4L3 forkhead box D4-like 3
BARD1 BRCA1 associated RING domain 1
MPP1 membrane protein, palmitoylated 1, 55kDa
FAM72B family with sequence similarity 72, member B
ZNF334 zinc finger protein 334
246
LRCH1 leucine-rich repeats and calponin homology (CH)
domain containing 1
BRD2 bromodomain containing 2
PSIMCT-1 MCTS1 pseudogene
MRPL52 mitochondrial ribosomal protein L52
GATSL2 GATS protein-like 2
MYLK myosin light chain kinase
ZNF26 zinc finger protein 26
SNORD35A small nucleolar RNA, C/D box 35B; small nucleolar
RNA, C/D box 35A
GPN3 GPN-loop GTPase 3
RNF146 ring finger protein 146
ZNF782 zinc finger protein 782
ZNF765 zinc finger protein 765
MGEA5 meningioma expressed antigen 5 (hyaluronidase)
BCL3 B-cell CLL/lymphoma 3
EEF1D
eukaryotic translation elongation factor 1 delta
(guanine nucleotide exchange protein)
ZNF563 zinc finger protein 563
GNAI1 guanine nucleotide binding protein (G protein), alpha
inhibiting activity polypeptide 1
SLC5A3 solute carrier family 5 (sodium/myo-inositol
cotransporter), member 3
RSF1 remodeling and spacing factor 1
SMA4 glucuronidase, beta pseudogene
H3F3B H3 histone, family 3B (H3.3B)
H3F3A H3 histone, family 3A pseudogene
FAM197Y7 similar to CYorf16 protein
ESAM endothelial cell adhesion molecule
MANF mesencephalic astrocyte-derived neurotrophic factor
SNX12 sorting nexin 12
ZNF226 zinc finger protein 226
PPM1N protein phosphatase 1B-like
GCFC1 chromosome 21 open reading frame 66
BCDIN3D BCDIN3 domain containing
NDRG4 NDRG family member 4
KCMF1 potassium channel modulatory factor 1
RPL32P3 ribosomal protein L32 pseudogene 3
ZNF131 zinc finger protein 131
FLJ38717 FLJ38717 protein
MCL1 myeloid cell leukemia sequence 1 (BCL2-related)
HDAC5 histone deacetylase 5
ORMDL1 ORM1-like 1 (S. cerevisiae)
ZNF280D zinc finger protein 280D
HDAC10 histone deacetylase 10
IDI1 isopentenyl-diphosphate delta isomerase 1
247
RNU105B RNA, U105A small nucleolar; RNA, U105B small
nucleolar
LOC729218 hypothetical LOC729218
TARBP1 TAR (HIV-1) RNA binding protein 1
TRGV4 T cell receptor gamma variable 4
SNORD34 small nucleolar RNA, C/D box 34
RPS25 ribosomal protein S25 pseudogene 8; ribosomal
protein S25
NAGS N-acetylglutamate synthase
YIPF2 Yip1 domain family, member 2
AKR7A3 aldo-keto reductase family 7, member A3 (aflatoxin
aldehyde reductase)
GOLGA8DP golgi autoantigen, golgin subfamily a, 8D
GOLGA8F golgi autoantigen, golgin subfamily a, 8F
GOLGA8G golgi autoantigen, golgin subfamily a, 8G
PDCD1 programmed cell death 1
ANKRD16 ankyrin repeat domain 16
RBL1 retinoblastoma-like 1 (p107)
ZNF703 zinc finger protein 703
OPTN optineurin
ZNF625 zinc finger protein 625
NUP62CL nucleoporin 62kDa C-terminal like
EWSR1 Ewing sarcoma breakpoint region 1
ARGLU1 arginine and glutamate rich 1
ZNF860 zinc finger protein 860
CD109 CD109 molecule
FLJ42393 hypothetical LOC401105
AIG1 androgen-induced 1
ELF5 E74-like factor 5 (ets domain transcription factor)
MYADM myeloid-associated differentiation marker
SCGN secretagogin, EF-hand calcium binding protein
ANKK1 ankyrin repeat and kinase domain containing 1
POU5F1 POU class 5 homeobox 1
GABPB1 GA binding protein transcription factor, beta subunit
1
RPL13A ribosomal protein L13a
MAML2 mastermind-like 2 (Drosophila)
ALG12 asparagine-linked glycosylation 12, alpha-1,6-
mannosyltransferase homolog (S. cerevisiae)
CDH15 cadherin 15, type 1, M-cadherin (myotubule)
PRKCI protein kinase C, iota
LYPLAL1 lysophospholipase-like 1
LRRC61 leucine rich repeat containing 61
RPS15AP10 ribosomal protein S15a pseudogene 10
INPP1 inositol polyphosphate-1-phosphatase
PA2G4 proliferation-associated 2G4, 38kDa
NPFF neuropeptide FF-amide peptide precursor
PCSK5 proprotein convertase subtilisin/kexin type 5
248
GPLD1 glycosylphosphatidylinositol specific phospholipase
D1
MICALL1 MICAL-like 1
ADH6 alcohol dehydrogenase 6 (class V)
SNORD81 small nucleolar RNA, C/D box 81
NICN1 nicolin 1
CCDC84 coiled-coil domain containing 84
SLC2A11 solute carrier family 2 (facilitated glucose
transporter), member 11
FBLIM1 filamin binding LIM protein 1
SARS seryl-tRNA synthetase
SCAI chromosome 9 open reading frame 126
SNORA2A small nucleolar RNA, H/ACA box 2A; small
nucleolar RNA, H/ACA box 2B
ARL17A ADP-ribosylation factor-like 17 pseudogene 1; ADP-
ribosylation factor-like 17
ARL17B ADP-ribosylation factor-like 17 pseudogene 1; ADP-
ribosylation factor-like 17
SNORA62 small nucleolar RNA, H/ACA box 62
SNORA6 small nucleolar RNA, H/ACA box 6
MTSS1L metastasis suppressor 1-like
RNU7-25P RNA, U7 small nuclear 25 pseudogene
LOC100133130 PRO1102
TTC6 tetratricopeptide repeat domain 6
RPL34 ribosomal protein L34
STX4 syntaxin 4
SNORD102 small nucleolar RNA, C/D box 102
CYP2A7P1 cytochrome P450, family 2, subfamily A,
polypeptide 7 pseudogene 1
ZNF432 zinc finger protein 432
MSH2 mutS homolog 2, colon cancer, nonpolyposis type 1
(E. coli) NAMPT nicotinamide phosphoribosyltransferase
LMX1B LIM homeobox transcription factor 1, beta
STRN striatin, calmodulin binding protein
PABPC1L poly(A) binding protein, cytoplasmic 1-like
SCML1 sex comb on midleg-like 1 (Drosophila)
MT4 metallothionein 4
FAM156B family with sequence similarity 156, member B
FAM156A family with sequence similarity 156, member A
FEM1A fem-1 homolog a (C. elegans)
CEACAM19 carcinoembryonic antigen-related cell adhesion
molecule 19
RAPGEF5 Rap guanine nucleotide exchange factor (GEF) 5
DUSP8 dual specificity phosphatase 8
DUSP5 dual specificity phosphatase 5
NOXA1 NADPH oxidase activator 1
MXD1 MAX dimerization protein 1
249
UNC5CL unc-5 homolog C (C. elegans)-like
NBR2 neighbor of BRCA1 gene 2
FAM197Y3 similar to CYorf16 protein
HAMP hepcidin antimicrobial peptide
RABGEF1 RAB guanine nucleotide exchange factor (GEF) 1
KIAA0247 KIAA0247
ATP6V1E2 ATPase, H+ transporting, lysosomal 31kDa, V1
subunit E2
LOC399744 hypothetical LOC399744
RASA4 RAS p21 protein activator 4; RAS p21 protein
activator 4 pseudogene
SH3GLB1 SH3-domain GRB2-like endophilin B1
MDM1 Mdm1 nuclear protein homolog (mouse)
NPM2 nucleophosmin/nucleoplasmin, 2
RPL23AP79 ribosomal protein L23a pseudogene 79
FAM110C family with sequence similarity 110, member C
GLS2 glutaminase 2 (liver, mitochondrial)
C1orf138 chromosome 1 open reading frame 138
PDXK pyridoxal (pyridoxine, vitamin B6) kinase
U2AF1L4 U2 small nuclear RNA auxiliary factor 1-like 4
EFHC1 EF-hand domain (C-terminal) containing 1
KITLG KIT ligand
LOC728819 hCG1645220
ZNF767 zinc finger family member 767
EIF5A2 eukaryotic translation initiation factor 5A2
ZNF117 zinc finger protein 117
TOX2 TOX high mobility group box family member 2
FES feline sarcoma oncogene
LOC401180 similar to hCG1745223
AIM1 absent in melanoma 1
BTN3A1 butyrophilin, subfamily 3, member A1
DBI diazepam binding inhibitor (GABA receptor
modulator, acyl-Coenzyme A binding protein)
B4GALNT4 beta-1,4-N-acetyl-galactosaminyl transferase 4
BCAR1 breast cancer anti-estrogen resistance 1
BRPF3 bromodomain and PHD finger containing, 3
COG6 component of oligomeric golgi complex 6
PFKP phosphofructokinase, platelet
MIR1306 microRNA 1306
BMS1P1 BMS1 pseudogene 1
PIF1 PIF1 5'-to-3' DNA helicase homolog (S. cerevisiae)
MIR1208 microRNA 1208
ARFRP1 ADP-ribosylation factor related protein 1
MYL9 myosin, light chain 9, regulatory
TTC39B tetratricopeptide repeat domain 39B
RAP1GAP2 GTPase activating Rap/RanGAP domain-like 4
PIGN phosphatidylinositol glycan anchor biosynthesis,
class N
250
ZFYVE27 zinc finger, FYVE domain containing 27
SNORA21 small nucleolar RNA, H/ACA box 21
FLT3LG fms-related tyrosine kinase 3 ligand
GPR157 G protein-coupled receptor 157
LCA5 Leber congenital amaurosis 5
DENND4A DENN/MADD domain containing 4A
HMGN2 high-mobility group nucleosomal binding domain 2
ZNF519 zinc finger protein 519
USP25 ubiquitin specific peptidase 25
SNORD115-7 small nucleolar RNA, C/D box 115-7
SNORD115-13 small nucleolar RNA, C/D box 115-13
SNORD115-26 small nucleolar RNA, C/D box 115-26
LOC100129540 hypothetical LOC100129540
OR10Z1 olfactory receptor, family 10, subfamily Z, member 1
TEAD2 TEA domain family member 2
FLJ45445 hypothetical LOC399844
CCNB1IP1 cyclin B1 interacting protein 1
RIPK2 receptor-interacting serine-threonine kinase 2
C20orf132 chromosome 20 open reading frame 132
DTWD1 DTW domain containing 1
FAM120A family with sequence similarity 120A
IRAK4 interleukin-1 receptor-associated kinase 4
PI4KAP2 phosphatidylinositol 4-kinase, catalytic, alpha
pseudogene 2
N4BP2L2 NEDD4 binding protein 2-like 2
PTBP2 polypyrimidine tract binding protein 2
HPCA hippocalcin
ADAT2 adenosine deaminase, tRNA-specific 2, TAD2
homolog (S. cerevisiae)
HMGN1 high-mobility group nucleosome binding domain 1
TBX3 T-box 3
C6orf48 chromosome 6 open reading frame 48
SNAR-C4 small ILF3/NF90-associated RNA C4
ERAP1 endoplasmic reticulum aminopeptidase 1
ANKZF1 ankyrin repeat and zinc finger domain containing 1
ATP6V1B1 ATPase, H+ transporting, lysosomal 56/58kDa, V1
subunit B1
SLC22A12 solute carrier family 22 (organic anion/urate
transporter), member 12
TAS2R5 taste receptor, type 2, member 5
RNU7-29P RNA, U7 small nuclear 29 pseudogene
NSMCE4A non-SMC element 4 homolog A (S. cerevisiae)
TRUB2 TruB pseudouridine (psi) synthase homolog 2 (E.
coli)
PI4K2B phosphatidylinositol 4-kinase type 2 beta
ANKRD36B ankyrin repeat domain 36B
BMS1P4 BMS1 pseudogene 4
POLQ polymerase (DNA directed), theta
251
CDH1 cadherin 1, type 1, E-cadherin (epithelial)
ZNF84 zinc finger protein 84
FKBP11 FK506 binding protein 11, 19 kDa
KRTAP9-2 keratin associated protein 9-2
KRTAP9-9 keratin associated protein 9-9; keratin associated
protein 9-2
LOC391322 similar to D-dopachrome tautomerase
LOC100130876 hypothetical LOC100130876
LIF leukemia inhibitory factor (cholinergic
differentiation factor)
ZNF738 zinc finger protein 738
GPR89B G protein-coupled receptor 89B
GPR89A G protein-coupled receptor 89A
RAPGEFL1 Rap guanine nucleotide exchange factor (GEF)-like 1
LOC100133161 hypothetical LOC100133161
BOK BCL2-related ovarian killer
C2orf48 chromosome 2 open reading frame 48
UGT2B10 UDP glucuronosyltransferase 2 family, polypeptide
B10
SLMO1 slowmo homolog 1 (Drosophila)
IGLV3-16 immunoglobulin lambda variable 3-16
SNHG12 small nucleolar RNA host gene 12 (non-protein
coding)
ANGPT4 angiopoietin 4
LOC100287515 similar to zinc finger protein 26 (KOX 20)
ITPR3 inositol 1,4,5-triphosphate receptor, type 3
RPS28 ribosomal protein S28
STAT2 signal transducer and activator of transcription 2,
113kDa
SFTPB surfactant protein B
MIR590 microRNA 590
WDR90 WD repeat domain 90
CENPI centromere protein I
CREB3L3 cAMP responsive element binding protein 3-like 3
MORC3 MORC family CW-type zinc finger 3
ILDR1 immunoglobulin-like domain containing receptor 1
LOC728093 similar to Putative POM121-like protein 1-like
TRIM45 tripartite motif-containing 45
PLCH1 phospholipase C, eta 1
HERC2P2 hect domain and RLD 2 pseudogene 2
HERC2P3 hect domain and RLD 2 pseudogene 3
SH3YL1 SH3 domain containing, Ysc84-like 1 (S. cerevisiae)
FAM197Y1 similar to CYorf16 protein
ESYT1 family with sequence similarity 62 (C2 domain
containing), member A
GRID2IP glutamate receptor, ionotropic, delta 2 (Grid2)
interacting protein
FAM102A family with sequence similarity 102, member A
252
FAM95B1 family with sequence similarity 95, member B1
DAGLA diacylglycerol lipase, alpha
PIGV phosphatidylinositol glycan anchor biosynthesis,
class V
ADHFE1 alcohol dehydrogenase, iron containing, 1
ZNF551 zinc finger protein 551
CYS1 cystin 1
MTHFD2 methylenetetrahydrofolate dehydrogenase (NADP+
dependent) 2
RPL4 ribosomal protein L4
ARL8A ADP-ribosylation factor-like 8A
EPHX2 epoxide hydrolase 2, cytoplasmic
CCDC144NL coiled-coil domain containing 144 family, N-
terminal like
FAM197Y6 similar to CYorf16 protein
ARHGAP32 Rho GTPase-activating protein
ASNS asparagine synthetase
LAIR2 leukocyte-associated immunoglobulin-like receptor 2
ALDOC aldolase C, fructose-bisphosphate
CP ceruloplasmin (ferroxidase)
TAS2R3 taste receptor, type 2, member 3
YARS tyrosyl-tRNA synthetase
GATAD2B GATA zinc finger domain containing 2B
CDCA7 cell division cycle associated 7
OSGIN2 oxidative stress induced growth inhibitor family
member 2
MAPK12 mitogen-activated protein kinase 12
KLF7 Kruppel-like factor 7 (ubiquitous)
SLK STE20-like kinase (yeast)
TARP TCR gamma alternate reading frame protein
MORN1 MORN repeat containing 1
ZNF547 zinc finger protein 547
LOC90834 hypothetical protein BC001742
TADA2A transcriptional adaptor 2 (ADA2 homolog, yeast)-
like
TPT1 tumour protein, translationally-controlled 1
DKFZP586I1420 hypothetical protein DKFZp586I1420
KLF5 Kruppel-like factor 5 (intestinal)
TRPV1 transient receptor potential cation channel, subfamily
V, member 1
PPP1R3F protein phosphatase 1, regulatory (inhibitor) subunit
3F
STAG3L2 stromal antigen 3-like 2
STAG3L1 stromal antigen 3-like 1
LOC100130691 hypothetical LOC100130691
RNU7-57P RNA, U7 small nuclear 57 pseudogene
KIAA0226 KIAA0226
NEK8 NIMA (never in mitosis gene a)- related kinase 8
253
TFE3 transcription factor binding to IGHM enhancer 3
MYO5A myosin VA (heavy chain 12, myoxin)
HIST1H3H histone cluster 1, H3h
HIST2H3A histone cluster 2, H3a
HIST1H3J histone cluster 1, H3j
HIST1H3G histone cluster 1, H3g
HIST1H3F histone cluster 1, H3F
HIST1H3C histone cluster 1, H3c
HIST2H3D histone cluster 2, H3d
HIST1H3E histone cluster 1, H3e
HIST1H3A hhistone cluster 1, H3a
HIST1H3I histone cluster 1, H3i
HIST1H3D histone cluster 1, H3d
HIST2H3C histone cluster 2, H3c
HIST1H3B histone cluster 1, H3b
NGEF neuronal guanine nucleotide exchange factor
ACSS2 acyl-CoA synthetase short-chain family member 2
COL4A6 collagen, type IV, alpha 6
POLR2J3 polymerase (RNA) II (DNA directed) polypeptide J3
RUFY2 RUN and FYVE domain containing 2
ZFP36L1 zinc finger protein 36, C3H type-like 1
NR1H4 nuclear receptor subfamily 1, group H, member 4
FAM101A family with sequence similarity 101, member A
GPR135 G protein-coupled receptor 135
WNT11 wingless-type MMTV integration site family,
member 11
GAS5 growth arrest-specific 5 (non-protein coding)
ATG4A ATG4 autophagy related 4 homolog A (S. cerevisiae)
TMEM82 transmembrane protein 82
SHB Src homology 2 domain containing adaptor protein B
MVK mevalonate kinase
TGFB1 transforming growth factor, beta 1
CBWD2 COBW domain containing 2
HSF2BP heat shock transcription factor 2 binding protein
MIR2110 microRNA 2110
FBXO9 F-box protein 9
SEC16B SEC16 homolog B (S. cerevisiae)
GLYCTK glycerate kinase
TCP11L2 t-complex 11 (mouse)-like 2
RABEP1 rabaptin, RAB GTPase binding effector protein 1
F11 coagulation factor XI
PIP5K1A phosphatidylinositol-4-phosphate 5-kinase, type I,
alpha
FDPS farnesyl diphosphate synthase (farnesyl
pyrophosphate synthetase
RNASE4 ribonuclease, RNase A family, 4
GOLGA6L6 Putative golgin subfamily A member 6-like protein 6
RPLP1 ribosomal protein, large, P1
254
ANKRD12 ankyrin repeat domain 12
TRBV6-6 T cell receptor beta variable 6-6
PLEKHO1 pleckstrin homology domain containing, family O
member 1
SLC25A3 solute carrier family 25 (mitochondrial carrier;
phosphate carrier), member 3
LOC100132352 similar to hCG1989297
INPP5F inositol polyphosphate-5-phosphatase F
NOL6 nucleolar protein family 6 (RNA-associated)
BRCA1 breast cancer 1, early onset
PGRMC2 progesterone receptor membrane component 2
RRAGB Ras-related GTP binding B
LOC100132815 hypothetical protein LOC100132815
SIK3 serine/threonine-protein kinase QSK
SRXN1 sulfiredoxin 1 homolog (S. cerevisiae)
DDX59 DEAD (Asp-Glu-Ala-Asp) box polypeptide 59
MIR591 microRNA 591
MKL1 megakaryoblastic leukemia (translocation) 1
CDRT15L2 CMT1A duplicated region transcript 15-like 2
SCN1A sodium channel, voltage-gated, type I, alpha subunit
C1orf35 chromosome 1 open reading frame 35
C11orf54 chromosome 11 open reading frame 54
SNORD27 small nucleolar RNA, C/D box 27
SNORA8 small nucleolar RNA, H/ACA box 8
SNORA18 small nucleolar RNA, H/ACA box 18
SPDYA speedy homolog A (Xenopus laevis)
FAM76B family with sequence similarity 76, member B
SEC31A SEC31 homolog A (S. cerevisiae)
CTSE cathepsin E
PLIN2 adipose differentiation-related protein
MCF2L MCF.2 cell line derived transforming sequence-like
PORCN porcupine homolog (Drosophila)
OVOL3 ovo-like 3 (Drosophila)
UBQLN4 ubiquilin 4
PFDN4 prefoldin subunit 4
GAB2 GRB2-associated binding protein 2
LOC286109 hypothetical protein LOC286109
SH2B1 SH2B adaptor protein 1
GOLGA6L4 hypothetical protein LOC161527
CLEC18B C-type lectin domain family 18, member B
SNAR-B1 small ILF3/NF90-associated RNA B1
SLC6A4 solute carrier family 6 (neurotransmitter transporter,
serotonin), member 4
ADRBK1 adrenergic, beta, receptor kinase 1
SPIRE2 spire homolog 2 (Drosophila)
HPR haptoglobin-related protein; haptoglobin
HP haptoglobin
LOC441426 hypothetical gene supported by AK126863
255
JUP junction plakoglobin
STARD4 StAR-related lipid transfer (START) domain
containing 4
SNORD45A small nucleolar RNA, C/D box 45A
SNORD45C small nucleolar RNA, C/D box 45C
SNORD45B small nucleolar RNA, C/D box 45B
STK17A serine/threonine kinase 17a
EMP1 epithelial membrane protein 1
KIAA1731 KIAA1731
ZNF721 zinc finger protein 721
POLA2 polymerase (DNA directed), alpha 2 (70kD subunit)
CYP2S1 cytochrome P450, family 2, subfamily S, polypeptide
1
PSMB9 proteasome (prosome, macropain) subunit, beta type,
9
TGFB1I1 transforming growth factor beta 1 induced transcript
1
MAN1B1 mannosidase, alpha, class 1B, member 1
DUSP6 dual specificity phosphatase 6
ID1 inhibitor of DNA binding 1, dominant negative
helix-loop-helix protein
TRBV6-9 T cell receptor beta variable 6-9
UHRF1 ubiquitin-like with PHD and ring finger domains 1
MIR939 microRNA 939
MMP23B matrix metallopeptidase 23A (pseudogene); matrix
metallopeptidase 23B
AHSA2 AHA1, activator of heat shock 90kDa protein
ATPase homolog 2 (yeast)
C1orf131 chromosome 1 open reading frame 131
ENO1 enolase 1, (alpha)
SNAR-B2 small ILF3/NF90-associated RNA B2
ARRB2 arrestin, beta 2
VCL vinculin
SLC2A2 solute carrier family 2 (facilitated glucose
transporter), member 2
ANXA3 annexin A3
MCM9 minichromosome maintenance complex component 9
LOC100128668 hypothetical protein LOC100128668
ICT1 immature colon carcinoma transcript 1
CCNE2 cyclin E2
ADAP1 ArfGAP with dual PH domains 1
KCNK7 potassium channel, subfamily K, member 7
ARHGEF10L Rho guanine nucleotide exchange factor (GEF) 10-
like
PYCRL pyrroline-5-carboxylate reductase-like
HIPK3 homeodomain interacting protein kinase 3
SQLE squalene epoxidase
LOC100287497 similar to Transmembrane protein FLJ23183
256
IFT81 intraflagellar transport 81 homolog
(Chlamydomonas)
EFR3B EFR3 homolog B (S. cerevisiae)
LOC642236 similar to FRG1 protein (FSHD region gene 1
protein)
RPF2 brix domain containing 1 pseudogene; brix domain
containing 1
ARHGAP21 Rho GTPase activating protein 21
STK17B serine/threonine kinase 17b
WEE1 WEE1 homolog (S. pombe)
TBC1D25 TBC1 domain family, member 25
C10orf112 chromosome 10 open reading frame 112
WRB tryptophan rich basic protein
VRK3 vaccinia related kinase 3
CXorf24 chromosome X open reading frame 24
SNORD13P2 RNA, U13 small nuclear pseudogene 2
STARD9 StAR-related lipid transfer (START) domain
containing 9
ZNF248 zinc finger protein 248
WHAMMP1 WAS protein homolog associated with actin, golgi
membranes
and microtubules pseudogene 1
ANKRD20A4 ankyrin repeat domain 20 family, member A4
NAP1L1 nucleosome assembly protein 1-like 1
SLC16A13
solute carrier family 16, member 13 (monocarboxylic
acid transporter 13)
CHMP2B chromatin modifying protein 2B
HTR3A 5-hydroxytryptamine (serotonin) receptor 3A
PMS2 PMS2 postmeiotic segregation increased 2 (S.
cerevisiae)
TLE1 transducin-like enhancer of split 1 (E(sp1) homolog,
Drosophila)
CCDC150 coiled-coil domain containing 150
FAM197Y8 similar to CYorf16 protein
SEPT7P2 septin 13
RBM18 RNA binding motif protein 18
DFNA5 deafness, autosomal dominant 5
PAN2 PAN2 poly(A) specific ribonuclease subunit
homolog (S. cerevisiae)
ZNF581 zinc finger protein 581
BAIAP2L1 BAI1-associated protein 2-like 1
SLC39A5 solute carrier family 39 (metal ion transporter),
member 5
SIRT1 sirtuin (silent mating type information regulation 2
homolog) 1 (S. cerevisiae)
LONP2 lon peptidase 2, peroxisomal
CDC42EP4 CDC42 effector protein (Rho GTPase binding) 4
GTF2H2B general transcription factor IIH, polypeptide 2B
257
GTF2H2C general transcription factor IIH, polypeptide 2C
GTF2H2 general transcription factor IIH, polypeptide 2,
44kDa
GTF2H2D general transcription factor IIH, polypeptide 2D
C11orf93 Uncharacterized protein LOC120376
ATP5O ATP synthase, H+ transporting, mitochondrial F1
complex, O subunit
SLC23A1 solute carrier family 23 (nucleobase transporters),
member 1
LOC100289637 hypothetical protein LOC100289637
KCTD9P2 potassium channel tetramerisation domain containing
9 pseudogene 2
ECHDC1 enoyl Coenzyme A hydratase domain containing 1
ILKAP integrin-linked kinase-associated serine/threonine
phosphatase 2C
PLK1S1 non-protein coding RNA 153
HGC6.3 similar to HGC6.3
IMMP2L IMP2 inner mitochondrial membrane peptidase-like
(S. cerevisiae)
OR4F2P olfactory receptor, family 4, subfamily F, member 2
pseudogene
DNM1P24 DNM1 pseudogene 24
TIGD2 tigger transposable element derived 2
SNRPN small nuclear ribonucleoprotein polypeptide N
SNURF SNRPN upstream reading frame
BTF3L4
basic transcription factor 3-like 4; similar to
hCG2008008
HMGCS1 3-hydroxy-3-methylglutaryl-Coenzyme A synthase 1
(soluble)
SNORD12C small nucleolar RNA, C/D box 12C
YAF2 YY1 associated factor 2
CNN2 calponin 2
ARRDC3 arrestin domain containing 3
DHRS2 dehydrogenase/reductase (SDR family) member 2
PILRB paired immunoglobin-like type 2 receptor beta
C16orf93 chromosome 16 open reading frame 93
HNMT histamine N-methyltransferase
ROR1 receptor tyrosine kinase-like orphan receptor 1
ETNK1 ethanolamine kinase 1
SLC8A2 solute carrier family 8 (sodium/calcium exchanger),
member 2
COL1A1 collagen, type I, alpha 1
ABR active BCR-related gene
ZKSCAN3 zinc finger with KRAB and SCAN domains 3
LEAP2 liver expressed antimicrobial peptide 2
CENPM centromere protein M
EGFR epidermal growth factor receptor
258
(erythroblastic leukemia viral (v-erb-b) oncogene
homolog, avian)
TRAV12-1 T cell receptor alpha variable 12-1
TCTN1 tectonic family member 1
TMC6 transmembrane channel-like 6
TMEM183B transmembrane protein 183A; transmembrane
protein 183B
PPM1L protein phosphatase 1 (formerly 2C)-like
DHRS4L1 dehydrogenase/reductase (SDR family) member 4
like 1
EPS8 epidermal growth factor receptor pathway substrate 8
IGFBP1 insulin-like growth factor binding protein 1
KDM1B amine oxidase (flavin containing) domain 1
GK glycerol kinase
DNMBP dynamin binding protein
SCARNA21 small Cajal body-specific RNA 21
CSRP2BP CSRP2 binding protein
RASD1 RAS, dexamethasone-induced 1
CLEC2D C-type lectin domain family 2, member D
MIR941-4 microRNA 941-4
GK5 glycerol kinase 5 (putative)
EPM2AIP1 EPM2A (laforin) interacting protein 1
PBX1 pre-B-cell leukemia homeobox 1
TRIM66 tripartite motif-containing 66
SFXN2 sideroflexin 2
TRIM61 tripartite motif-containing 61
LOC284009 hypothetical protein LOC284009
ZNF567 zinc finger protein 567
LOC100130357 similar to hCG2038897
LRCH4 leucine-rich repeats and calponin homology (CH)
domain containing 4
C21orf33 chromosome 21 open reading frame 33
RNPC3 RNA-binding region (RNP1, RRM) containing 3
ZNF841 zinc finger protein 841
RFC4 replication factor C (activator 1) 4, 37kDa
PCMTD1 protein-L-isoaspartate (D-aspartate) O-
methyltransferase domain containing 1
LOC100133299 GALI1870
PRINS psoriasis associated RNA induced by stress (non-
protein coding)
PKIA protein kinase (cAMP-dependent, catalytic) inhibitor
alpha
PARP11 poly (ADP-ribose) polymerase family, member 11
LOC220729 succinate dehydrogenase complex, subunit A,
flavoprotein pseudogene
SNORD31 small nucleolar RNA, C/D box 31
HELLS helicase, lymphoid-specific
259
CPSF1 cleavage and polyadenylation specific factor 1,
160kDa
ERAS ES cell expressed Ras
FBXO22 FBXO22 opposite strand (non-protein coding); F-box
protein 22
SEPP1 selenoprotein P, plasma, 1
ASB3 ankyrin repeat and SOCS box-containing 3
FOSL2 FOS-like antigen 2
ALOX12P2 arachidonate 12-lipoxygenase pseudogene 2
POU5F1P3 POU class 5 homeobox 1 pseudogene 3
ZNF620 zinc finger protein 620
RFX5 regulatory factor X, 5 (influences HLA class II
expression)
C10orf118 chromosome 10 open reading frame 118
DDIT4 DNA-damage-inducible transcript 4
TMEFF1 transmembrane protein with EGF-like and two
follistatin-like domains 1
MSH6 mutS homolog 6 (E. coli)
HERC2P4 hect domain and RLD 2 pseudogene 4
LACTB2 lactamase, beta 2
VAT1 vesicle amine transport protein 1 homolog (T.
californica)
RMI1 RMI1, RecQ mediated genome instability 1,
homolog (S. cerevisiae)
STX7 syntaxin 7
FOXD4L1 forkhead box D4-like 1
MTMR10 myotubularin related protein 10
CYP4F8
cytochrome P450, family 4, subfamily F, polypeptide
8
OR4F29 olfactory receptor, family 4, subfamily F, member 29
OR4F16 olfactory receptor, family 4, subfamily F, member 16
OR4F3 olfactory receptor, family 4, subfamily F, member 3
SNAR-C1 small ILF3/NF90-associated RNA C1
MIR1234 microRNA 1234
DDX11L5 similar to DEAD/H box polypeptide 11 like 9
NKTR natural killer-tumour recognition sequence
NAPB N-ethylmaleimide-sensitive factor attachment
protein, beta
CHST15 carbohydrate (N-acetylgalactosamine 4-sulfate 6-O)
sulfotransferase 15
LOC100128131 hypothetical LOC100128131
GPRC5C G protein-coupled receptor, family C, group 5,
member C
SLC7A5P1 solute carrier family 7 (cationic amino acid
transporter, y+ system),
member 5 pseudogene 1
CXorf57 chromosome X open reading frame 57
260
RER1 RER1 retention in endoplasmic reticulum 1 homolog
(S. cerevisiae)
SPATA2 spermatogenesis associated 2
PEG3 PEG3 antisense RNA (non-protein coding)
ZIM2 zinc finger, imprinted 2
MIR98 microRNA 98
SNORA33 small nucleolar RNA, H/ACA box 33
OTUB2 OTU domain, ubiquitin aldehyde binding 2
SPTLC3 serine palmitoyltransferase, long chain base subunit 3
CCDC142 coiled-coil domain containing 142
ALAS1 aminolevulinate, delta-, synthase 1
CCDC68 coiled-coil domain containing 68
BTBD11 BTB (POZ) domain containing 11
KCNQ1OT1 KCNQ1 overlapping transcript 1 (non-protein
coding)
GPRIN2 G protein regulated inducer of neurite outgrowth 2
IRF9 interferon regulatory factor 9
PPP1R3C protein phosphatase 1, regulatory (inhibitor) subunit
3C
JPH4 junctophilin 4
SMAD4 SMAD family member 4
HEPACAM hepatocyte cell adhesion molecule
HEPN1 HEPACAM opposite strand 1
ANKLE2 ankyrin repeat and LEM domain containing 2
PHLDA2 pleckstrin homology-like domain, family A, member
2
ATP9B ATPase, class II, type 9B
ITFG2 integrin alpha FG-GAP repeat containing 2
SERPINE1
serpin peptidase inhibitor, clade E
(nexin, plasminogen activator inhibitor type 1),
member 1
KRT81 keratin 81
PFKFB3 6-phosphofructo-2-kinase/fructose-2,6-biphosphatase
3
C2orf80 chromosome 2 open reading frame 80
ZNF461 zinc finger protein 461
HIST1H2AE histone cluster 1, H2ae
HIST1H2AB histone cluster 1, H2ab
NEDD4L neural precursor cell expressed, developmentally
down-regulated 4-like
ZNF544 zinc finger protein 544
SFXN1 sideroflexin 1
S100A3 S100 calcium binding protein A3
ZSWIM5 zinc finger, SWIM-type containing 5
H2AFY H2A histone family, member Y
MCCD1 mitochondrial coiled-coil domain 1
261
FANCM Fanconi anemia, complementation group M
LOC100289574 hypothetical protein LOC100289574
PAGE2 P antigen family, member 2 (prostate associated)
OR2T12 olfactory receptor, family 2, subfamily T, member 12
POTEF POTE ankyrin domain family, member F
ASB9 ankyrin repeat and SOCS box-containing 9
BRIP1 BRCA1 interacting protein C-terminal helicase 1
ZNF761 zinc finger protein 761
CTGF connective tissue growth factor
LOC100288637 similar to hCG1982161
HNRNPH1 heterogeneous nuclear ribonucleoprotein H1 (H)
BMP2K BMP2 inducible kinase
NAB2 NGFI-A binding protein 2 (EGR1 binding protein 2)
ATF7IP2 activating transcription factor 7 interacting protein 2
SMURF2 SMAD specific E3 ubiquitin protein ligase 2
LOC100233156 hypothetical protein LOC100233156
LOC100130027 hypothetical protein LOC100130027
AKAP12 A kinase (PRKA) anchor protein 12
KRT8 keratin 8 pseudogene 9; similar to keratin 8; keratin 8
CDA cytidine deaminase
ANKRD27 ankyrin repeat domain 27 (VPS9 domain)
SNORD101 small nucleolar RNA, C/D box 101
MIR573 microRNA 573
NEK6 NIMA (never in mitosis gene a)-related kinase 6
LRP4 low density lipoprotein receptor-related protein 4
RPSA ribosomal protein SA
LOC374890 hypothetical gene supported by BC030765
MIR636 microRNA 636
CPVL carboxypeptidase, vitellogenic-like
RPLP0 ribosomal protein, large, P0
SLC7A4 solute carrier family 7 (cationic amino acid
transporter, y+ system), member 4
IGHV4-61 immunoglobulin heavy variable 4-61
FST follistatin
LOC100271836 SMG1 homolog, phosphatidylinositol 3-kinase-
related kinase pseudogene
PSMD3 proteasome (prosome, macropain) 26S subunit, non-
ATPase, 3
ATOX1 ATX1 antioxidant protein 1 homolog (yeast)
RECQL5 RecQ protein-like 5
ZNF417 zinc finger protein 417
UROS uroporphyrinogen III synthase
SLC19A2 solute carrier family 19 (thiamine transporter),
member 2
ZNF613 zinc finger protein 613
SLC22A3 solute carrier family 22 (extraneuronal monoamine
transporter), member 3
CRYAA crystallin, alpha A
262
HMGCR 3-hydroxy-3-methylglutaryl-Coenzyme A reductase
ACAD8 acyl-Coenzyme A dehydrogenase family, member 8
NUDT13 nudix (nucleoside diphosphate linked moiety X)-type
motif 13
ANGPTL4 angiopoietin-like 4
SLC5A9 solute carrier family 5 (sodium/glucose
cotransporter), member 9
PSPN persephin
RETSAT retinol saturase (all-trans-retinol 13,14-reductase)
SNORD108 small nucleolar RNA, C/D box 108
STARD5 StAR-related lipid transfer (START) domain
containing 5
ABHD15 abhydrolase domain containing 15
METTL7A methyltransferase like 7A
DSN1 DSN1, MIND kinetochore complex component,
homolog (S. cerevisiae)
NR2C1 nuclear receptor subfamily 2, group C, member 1
ZNF550 zinc finger protein 550
LGR4 leucine-rich repeat-containing G protein-coupled
receptor 4
AGAP6 ArfGAP with GTPase domain, ankyrin repeat and
PH domain 6
AGAP4 ArfGAP with GTPase domain, ankyrin repeat and
PH domain 4
C10orf12 chromosome 10 open reading frame 12
C9orf147 chromosome 9 open reading frame 147
ATRIP ATR interacting protein
SASH1 SAM and SH3 domain containing 1
PDE11A phosphodiesterase 11A
JMY junction mediating and regulatory protein, p53
cofactor
MOSPD1 motile sperm domain containing 1
MRRF mitochondrial ribosome recycling factor
KIAA0754 hypothetical LOC643314
SNORD18C small nucleolar RNA, C/D box 18C
SNORD18A small nucleolar RNA, C/D box 18A
SNORD18B small nucleolar RNA, C/D box 18B, C/D box 18C
FAM157C family with sequence similarity 157, member C
SAMD5 sterile alpha motif domain containing 5
SDCCAG8 serologically defined colon cancer antigen 8
LOC730268 similar to anaphase promoting complex subunit 1
MIR922 microRNA 922
SLC7A6OS solute carrier family 7, member 6 opposite strand
UTRN utrophin
KRBA2 KRAB-A domain containing 2
KIAA1841 KIAA1841
JAG1 jagged 1 (Alagille syndrome)
GAS2 growth arrest-specific 2
263
LOC100128002 hypothetical LOC100128002
MYSM1 Myb-like, SWIRM and MPN domains 1
DLEU1 deleted in lymphocytic leukemia 1 (non-protein
coding)
CNTNAP1 contactin associated protein 1
MIR1204 microRNA 1204
SNORD36B small nucleolar RNA, C/D box 36B
SNORD36A small nucleolar RNA, C/D box 36A
LOC400548 hypothetical gene supported by BC040918
RNF41 ring finger protein 41
TAF13 TAF13 RNA polymerase II, TATA box binding
protein (TBP)-associated factor, 18kDa
ALG5 asparagine-linked glycosylation 5
PLEKHM2 pleckstrin homology domain containing, family M
(with RUN domain) member 2
METTL2B methyltransferase like 2B
LOC401010 nucleolar complex associated 2 homolog (S.
cerevisiae) pseudogene
RPPH1 ribonuclease P RNA component H1
FANCL Fanconi anemia, complementation group L
GREB1 GREB1 protein
RPS4X ribosomal protein S4, X-linked
METTL6 methyltransferase like 6
HMGB1 high-mobility group box 1; high-mobility group box
1-like 10
DNHD1 dynein heavy chain domain 1
SNORA40 small nucleolar RNA, H/ACA box 40
LOC643401 hypothetical protein LOC643401
LRRC37A leucine rich repeat containing 37A
SMYD3 SET and MYND domain containing 3
LTB4R2 leukotriene B4 receptor 2
MRPS25 mitochondrial ribosomal protein S25
CHIC2 cysteine-rich hydrophobic domain 2
CALM2 calmodulin 2 (phosphorylase kinase, delta)
CALM1 calmodulin 1 (phosphorylase kinase, delta)
CALM3 calmodulin 3 (phosphorylase kinase, delta)
ARID3B AT rich interactive domain 3B (BRIGHT-like)
RRP7B ribosomal RNA processing 7 homolog B (S.
cerevisiae)
ZC3H12A zinc finger CCCH-type containing 12A
LOC100128340 hypothetical protein LOC100128340
LOC541471 hypothetical LOC541471; non-protein coding RNA
152
DNA2 DNA replication helicase 2 homolog (yeast)
VLDLR very low density lipoprotein receptor
TPM4 tropomyosin 4
COX10 COX10 homolog, cytochrome c oxidase assembly
protein, heme A:
264
farnesyltransferase (yeast)
IMPA1 inositol(myo)-1(or 4)-monophosphatase 1
FLJ14186 hypothetical LOC401149
FAM185A family with sequence similarity 185, member A
LOC389602 hypothetical LOC389602
RAP1GAP RAP1 GTPase activating protein
ENY2 enhancer of yellow 2 homolog (Drosophila)
CCDC14 coiled-coil domain containing 14
MLXIPL MLX interacting protein-like
CBL Cas-Br-M (murine) ecotropic retroviral transforming
sequence
CTGLF12P centaurin, gamma-like family, member 12
pseudogene
SRGAP2 SLIT-ROBO Rho GTPase activating protein 2
LOC400464 similar to FLJ43276 protein
POTEG POTE ankyrin domain family, member G
ZXDB zinc finger, X-linked, duplicated B
LOC440416 hypothetical gene supported by BC072410
CSAG3 CSAG family, member 3
CSAG2 CSAG family, member 2
E2F2 E2F transcription factor 2
CRYGS crystallin, gamma S
FOXO3 forkhead box O3
LOC100133616 hypothetical LOC100133616
SMG1 SMG1 homolog, phosphatidylinositol 3-kinase-
related kinase (C. elegans)
CCDC134 coiled-coil domain containing 134
ATM ataxia telangiectasia mutated
CPEB4 cytoplasmic polyadenylation element binding protein
4
ADCK2 aarF domain containing kinase 2
CHMP5 chromatin modifying protein 5
HIST2H2BA histone cluster 2, H2ba
C14orf37 chromosome 14 open reading frame 37
OGDHL oxoglutarate dehydrogenase-like
ATAD3B ATPase family, AAA domain containing 3B
CYP3A5 cytochrome P450, family 3, subfamily A,
polypeptide 5
ZADH2 zinc binding alcohol dehydrogenase domain
containing 2
ZNF44 zinc finger protein 44
LOC389906 hypothetical protein LOC441528
FMO5 flavin containing monooxygenase 5
LOC285505 hypothetical protein LOC285505
ZNF20 zinc finger protein 20
PLK3 polo-like kinase 3 (Drosophila)
LNP1 leukemia NUP98 fusion partner 1
PRIM1 primase, DNA, polypeptide 1 (49kDa)
265
S100A16 S100 calcium binding protein A16
CRNN cornulin
RNF43 ring finger protein 43
RIOK3 RIO kinase 3 (yeast)
SERPINB10 serpin peptidase inhibitor, clade B (ovalbumin),
member 10
RPS27L ribosomal protein S27-like
C4orf21 chromosome 4 open reading frame 21
C2orf44 chromosome 2 open reading frame 44
PDZK1P1 PDZ domain containing 1 pseudogene 1
PDZK1P2 PDZ domain containing 1 pseudogene 2
LOC595101 PI-3-kinase-related kinase SMG-1 pseudogene
LOC440354 PI-3-kinase-related kinase SMG-1 pseudogene
FAM82B family with sequence similarity 82, member B
TFF3 trefoil factor 3 (intestinal)
VEZF1 vascular endothelial zinc finger 1
LOC100133612 similar to hCG1815312
MYOF myoferlin
PPARGC1A peroxisome proliferator-activated receptor gamma,
coactivator 1 alpha
LRLE1 liver-related low express protein 1
ARHGEF9 Cdc42 guanine nucleotide exchange factor (GEF) 9
NOTCH2NL Notch homolog 2 (Drosophila) N-terminal like
LOC100134822 similar to hCG1739109
DET1 de-etiolated homolog 1 (Arabidopsis)
CLCF1 cardiotrophin-like cytokine factor 1
ANKRD36 ankyrin repeat domain 36; similar to ankyrin repeat
domain 36
TLCD1 TLC domain containing 1
LOC221272 hypothetical LOC221272
DEDD2 death effector domain containing 2
LOC100129473 hypothetical LOC100129473
SNORD59B small nucleolar RNA, C/D box 59B
SNORD59A small nucleolar RNA, C/D box 59A
SLC46A1 solute carrier family 46 (folate transporter), member
1
CTGLF8P centaurin, gamma-like family, member 8 pseudogene
C11orf48 chromosome 11 open reading frame 48
SLC7A6 solute carrier family 7 (cationic amino acid
transporter, y+ system), member 6
RSRC2 arginine/serine-rich coiled-coil 2
TMEM165 transmembrane protein 165
LOC644249 hypothetical LOC644249
LOC100129917 hypothetical protein LOC100129917
HSF4 heat shock transcription factor 4
RABGGTB Rab geranylgeranyltransferase, beta subunit
CRYZL1 crystallin, zeta (quinone reductase)-like 1
ENGASE endo-beta-N-acetylglucosaminidase
266
VAMP7 vesicle-associated membrane protein 7
LOC731275 hypothetical LOC731275
MSH5 mutS homolog 5 (E. coli)
MT1CP metallothionein 1C (pseudogene)
C4orf32 chromosome 4 open reading frame 32
SNORD28 small nucleolar RNA, C/D box 28
CDC6 cell division cycle 6 homolog (S. cerevisiae)
WASH3P WAS protein family homolog 3 pseudogene; WAS
protein family homolog 2 pseudogene; WAS protein
family homolog 1; WAS protein family homolog 5
pseudogene
WASH5P WAS protein family homolog 3 pseudogene; WAS
protein family homolog 2 pseudogene; WAS protein
family homolog 1; WAS protein family homolog 5
pseudogene
CCBP2 chemokine binding protein 2
UGT2B11 UDP glucuronosyltransferase 2 family, polypeptide
B11
S100A6 S100 calcium binding protein A6
RCN3 reticulocalbin 3, EF-hand calcium binding domain
ZNF286B zinc finger protein 286B
IER5L immediate early response 5-like
FAM109B family with sequence similarity 109, member B
LOC284926 hypothetical protein LOC284926
IGHV3-30 immunoglobulin heavy variable 3-30; similar to Ig
heavy chain V-III region VH26 precursor
PPP1R3E protein phosphatase 1, regulatory (inhibitor) subunit
3E
MPP6 membrane protein, palmitoylated 6 (MAGUK p55
subfamily member 6)
NAP1L4 nucleosome assembly protein 1-like 4
KIF3C kinesin family member 3C
GDF15 growth differentiation factor 15
CLEC18A C-type lectin domain family 18, member A
FTX Thrombocytosis, familial X-linked
NPHP3 nephronophthisis 3 (adolescent)
ACAD11 acyl-Coenzyme A dehydrogenase family, member 11
FDFT1 farnesyl-diphosphate farnesyltransferase 1
ABCB4 ATP-binding cassette, sub-family B (MDR/TAP),
member 4
RABL2A RAB, member of RAS oncogene family-like 2A
PPP1R15A protein phosphatase 1, regulatory (inhibitor) subunit
15A
CBWD3 COBW domain containing 3
CBWD7 COBW domain containing 7
CBWD5 COBW domain containing 5
MTUS1 mitochondrial tumour suppressor 1
KCNMB3 potassium large conductance calcium-activated
channel, subfamily M beta member 3
267
CTGLF10P centaurin, gamma-like family, member 10
pseudogene
FOXD4L4 forkhead box D4-like 2; forkhead box D4-like 4
FOXD4L2 forkhead box D4-like 2; forkhead box D4-like 4
SIAH1 seven in absentia homolog 1 (Drosophila)
ABCC6 ATP-binding cassette, sub-family C (CFTR/MRP),
member 6
ABCC6P2 ATP-binding cassette, sub-family C, member 6
pseudogene 2
TSKU tsukushin
FAM160B1 family with sequence similarity 160, member B1
CYP1A1 cytochrome P450, family 1, subfamily A,
polypeptide 1
LOC645513 hypothetical LOC645513
HPCAL1 hippocalcin-like 1
LCAT lecithin-cholesterol acyltransferase
EPHA2 EPH receptor A2
PRICKLE4 prickle homolog 4 (Drosophila)
FTCD formiminotransferase cyclodeaminase
COQ4 coenzyme Q4 homolog (S. cerevisiae)
TRNAU1AP tRNA selenocysteine 1 associated protein 1
EML6 echinoderm microtubule associated protein like 6
PDE3B phosphodiesterase 3B, cGMP-inhibited
WDR76 WD repeat domain 76
ORM1 orosomucoid 1
C11orf58 chromosome 11 open reading frame 58
PMS2L2 similar to postmeiotic segregation increased 2-like 2
LRG1 leucine-rich alpha-2-glycoprotein 1
DMBX1 diencephalon/mesencephalon homeobox 1
EPB41L1 erythrocyte membrane protein band 4.1-like 1
KRTAP9-4 keratin associated protein 9-4
SERTAD2 SERTA domain containing 2
PITPNM1 phosphatidylinositol transfer protein, membrane-
associated 1
FAM161A family with sequence similarity 161, member A
SPSB1 splA/ryanodine receptor domain and SOCS box
containing 1
GSTA4 glutathione S-transferase alpha 4
TUBA4A tubulin, alpha 4a
P2RY2 purinergic receptor P2Y, G-protein coupled, 2
LSS lanosterol synthase (2,3-oxidosqualene-lanosterol
cyclase)
CNNM3 cyclin M3
CDHR2 protocadherin 24
RPL23AP82 ribosomal protein L23a pseudogene 82
AXL AXL receptor tyrosine kinase
MPZL3 myelin protein zero-like 3
DDX5 DEAD (Asp-Glu-Ala-Asp) box polypeptide 5
268
CCDC18 coiled-coil domain containing 18
LOC100130193 hypothetical protein LOC100130193
BPHL biphenyl hydrolase-like (serine hydrolase)
PLCXD1 phosphatidylinositol-specific phospholipase C, X
domain containing 1
SNORD56B small nucleolar RNA, C/D box 56B
SNORD26 small nucleolar RNA, C/D box 26
DDX11L16 DEAD/H (Asp-Glu-Ala-Asp/His) box polypeptide
11 pseudogene
TAS2R14 taste receptor, type 2, member 14
ZFP36L2 zinc finger protein 36, C3H type-like 2
RPLP2 ribosomal protein, large, P2
SPDYE7P speedy homolog E7 (Xenopus laevis), pseudogene
RAB3B RAB3B, member RAS oncogene family
LOC100129596 hypothetical protein LOC100129596
GTF2IRD2B GTF2I repeat domain containing 2B
STAM signal transducing adaptor molecule (SH3 domain
and ITAM motif) 1
ZNF839 zinc finger protein 839
ZNF708 zinc finger protein 708
SPRY2 sprouty homolog 2 (Drosophila)
RBMS2 RNA binding motif, single stranded interacting
protein 2
PRPF4B PRP4 pre-mRNA processing factor 4 homolog B
(yeast)
PAR5 Prader-Willi/Angelman syndrome-5
SNAR-H small ILF3/NF90-associated RNA H
UQCRQ ubiquinol-cytochrome c reductase, complex III
subunit VII, 9.5kDa
CDC7 cell division cycle 7 homolog (S. cerevisiae)
SLC13A3 solute carrier family 13 (sodium-dependent
dicarboxylate transporter), member 3
LRRN4 leucine rich repeat neuronal 4
RBM39 RNA binding motif protein 39
RNU7-45P RNA, U7 small nuclear 45 pseudogene
TMEM44 transmembrane protein 44
CDKN1A cyclin-dependent kinase inhibitor 1A (p21, Cip1)
SDR42E1 short chain dehydrogenase/reductase family 42E,
member 1
USP12 ubiquitin specific peptidase 12
PDZK1 PDZ domain containing 1
GATC glutamyl-tRNA(Gln) amidotransferase, subunit C
homolog (bacterial)
RUSC2 RUN and SH3 domain containing 2
KRTAP10-1 keratin associated protein 10-1
ZNF518A zinc finger protein 518A
LOC100133315 similar to hCG1640299
TMEM168 transmembrane protein 168
269
MIR941-2 microRNA 941-2
MIR941-3 microRNA 941-3
MIR941-1 microRNA 941-1
LRRC8D leucine rich repeat containing 8 family, member D
POLR1A polymerase (RNA) I polypeptide A, 194kDa
IER3 immediate early response 3
MIR149 microRNA 149
FAM13B family with sequence similarity 13, member B
LOC374443 CLR pseudogene
POLR2J4 polymerase (RNA) II (DNA directed) polypeptide J4,
pseudogene
HEY1 hairy/enhancer-of-split related with YRPW motif 1
SNORA55 small nucleolar RNA, H/ACA box 55
CRYBA2 crystallin, beta A2
KRTAP17-1 keratin associated protein 17-1
USP32 ubiquitin specific peptidase 32
ENOSF1 enolase superfamily member 1
LOC284373 hypothetical protein LOC284373
RNF207 ring finger protein 207
IL1RAP interleukin 1 receptor accessory protein
KLHL15 kelch-like 15 (Drosophila)
DAAM1 dishevelled associated activator of morphogenesis 1
DUSP18 dual specificity phosphatase 18
PASK PAS domain containing serine/threonine kinase
ELMOD3 ELMO/CED-12 domain containing 3
ZYX zyxin
ANKAR ankyrin and armadillo repeat containing
TRIB3 tribbles homolog 3 (Drosophila)
C9orf9 chromosome 9 open reading frame 9
LOC100130557 hypothetical LOC100130557
ZNF780B zinc finger protein 780B
LOC730102 hypothetical protein LOC730102
ARV1 ARV1 homolog (S. cerevisiae)
HSPA1A heat shock 70kDa protein 1A
HSPA1B heat shock 70kDa protein 1B
HKDC1 hexokinase domain containing 1
DDX46 DEAD (Asp-Glu-Ala-Asp) box polypeptide 46
ZNF250 zinc finger protein 250
RAB9A RAB9A, member RAS oncogene family
ERRFI1 ERBB receptor feedback inhibitor 1
MIR604 microRNA 604
KRT78 keratin 78
SPRR2F small proline-rich protein 2F
TRAPPC2P1 trafficking protein particle complex 2 pseudogene 1
TRAPPC2 trafficking protein particle complex 2
SLC25A24 solute carrier family 25 (mitochondrial carrier;
phosphate carrier), member 24
ANKRD10 ankyrin repeat domain 10
270
SDHAP3 succinate dehydrogenase complex, subunit A,
flavoprotein pseudogene 3
APOL1 apolipoprotein L, 1
GRHL1 grainyhead-like 1 (Drosophila)
NDUFS7 NADH dehydrogenase (ubiquinone) Fe-S protein 7,
20kDa (NADH-coenzyme Q reductase)
SGK2 serum/glucocorticoid regulated kinase 2
TAX1BP1 Tax1 (human T-cell leukemia virus type I) binding
protein 1
ZNF682 zinc finger protein 682
SHPRH SNF2 histone linker PHD RING helicase
MFSD8 major facilitator superfamily domain containing 8
ELK3 ELK3, ETS-domain protein (SRF accessory protein
2)
IGKC immunoglobulin kappa constant
MST4 serine/threonine protein kinase MST4
CSTF3 cleavage stimulation factor, 3' pre-RNA, subunit 3,
77kDa
BMS1P5 BMS1 pseudogene 5
TAS2R30 taste receptor, type 2, member 30
LOC100288807 similar to Putative WBSCR19-like protein 7
PCBD2 pterin-4 alpha-carbinolamine dehydratase2
RASA4B RAS p21 protein activator 4B
DCAF8 WD repeat domain 42A
HCG8 HLA complex group 8
RNF11 ring finger protein 11
AP1M2 adaptor-related protein complex 1, mu 2 subunit
KCTD18 potassium channel tetramerisation domain containing
18
RHBDD3 rhomboid domain containing 3
AGAP10 ArfGAP with GTPase domain, ankyrin repeat and
PH domain 10
CTGLF11P centaurin, gamma-like family, member 11
pseudogene
AGAP9 ArfGAP with GTPase domain, ankyrin repeat and
PH domain 9
AGAP5 ArfGAP with GTPase domain, ankyrin repeat and
PH domain 5
COL4A5 collagen, type IV, alpha 5
PIM1 pim-1 oncogene
TMEM42 transmembrane protein 42
C1orf112 chromosome 1 open reading frame 112
RFX2 regulatory factor X, 2 (influences HLA class II
expression)
PIGL phosphatidylinositol glycan anchor biosynthesis,
class L
VNN1 vanin 1
KHK ketohexokinase (fructokinase)
RTTN rotatin
271
IGLC1 immunoglobulin lambda constant 1 (Mcg marker)
IGLC2 immunoglobulin lambda constant 2 (Kern-Oz-
marker)
IGLV2-11 immunoglobulin lambda variable 2-11
IGHV2-70 immunoglobulin heavy variable 2-70; similar to
hCG1742309
FOXD4 forkhead box D4
TYSND1 trypsin domain containing 1
KRTAP9-7 keratin-associated protein 9-2-like 1-like; keratin
associated protein 9-7
POM121C POM121 membrane glycoprotein C
RRAGC Ras-related GTP binding C
DUXAP10 double homeobox A pseudogene 10
CST4 cystatin S
ZNF638 zinc finger protein 638
SPRY4 sprouty homolog 4 (Drosophila)
TRIM52 tripartite motif-containing 52
GAS8 growth arrest-specific 8
LOC644794 hypothetical LOC644794
SHPK sedoheptulokinase
SNORD24 small nucleolar RNA, C/D box 24
SNORD76 small nucleolar RNA, C/D box 76
RASAL2 RAS protein activator like 2
FARP1 FERM, RhoGEF (ARHGEF) and pleckstrin domain
protein 1 (chondrocyte-derived)
TMC7 transmembrane channel-like 7
GINS2 GINS complex subunit 2 (Psf2 homolog)
CYP2D6 cytochrome P450, family 2, subfamily D,
polypeptide 6
ZNF678 zinc finger protein 678
WARS2 tryptophanyl tRNA synthetase 2, mitochondrial
SNX33 sorting nexin 33
LOC285540 hypothetical protein LOC285540
PNPLA3 patatin-like phospholipase domain containing 3
MAGOH2 mago-nashi homolog 2, proliferation-associated
(Drosophila)
SNX9 sorting nexin 9
ANO8 anoctamin 8
MGST2 microsomal glutathione S-transferase 2
METTL3 methyltransferase like 3
GOLGA8B golgi autoantigen, golgin subfamily a, 8B
GOLGA8A golgi autoantigen, golgin subfamily a, 8A
CHMP4C chromatin modifying protein 4C
CYP2W1 cytochrome P450, family 2, subfamily W,
polypeptide 1
FAM78B family with sequence similarity 78, member B
FARP2 FERM, RhoGEF and pleckstrin domain protein 2
SNORD22 small nucleolar RNA, C/D box 22

272
RNF121 ring finger protein 121
SNORD29 small nucleolar RNA, C/D box 29
MESDC2 mesoderm development candidate 2
NPAT nuclear protein, ataxia-telangiectasia locus
MERTK c-mer proto-oncogene tyrosine kinase
SLC26A6 solute carrier family 26, member 6
SEPW1 selenoprotein W, 1
![CONTROL OF ITCH GRASS [ROTTBOELLIA COCHINCHINENSIS LOUR ... Milhollon Control of Itch... · agronomy control of itch grass [rottboellia cochinchinensis lour.) clayton] in sugarcane](https://img.pdfslide.us/doc/110x75/5b50a6107f8b9a396e8ee987/control-of-itch-grass-rottboellia-cochinchinensis-lour-milhollon-control-of.jpg)