Embed Size (px)
Citation preview
1
The effect of Consumer’s Socio-Economic stratum on Complexity Expectations of
New Technological Products
Andres Barrios†
Sonia M. Camacho†
Carlos A. Trujillo†
Jose Antonio Rosa††
Bogotá, Colombia
Working paper. A version of this paper is under review for the Journal of Business Research.
This manuscript is being shared through the University of Wyoming Sustainable Business
Practices as a courtesy. Please do not cite without permission from the authors.
† Universidad de los Andes – School of Management
†† University of Wyoming
Send correspondence to Andres Barrios ([email protected])
2
Abstract
The adoption of new technological products is a salient issue in current marketing
activities. As low-income consumers from emerging economies are increasingly targeted
by technology, it becomes necessary to understand the effect of socioeconomic stratum on
the way technology is adopted. We contribute to this topic by proposing and testing a
scheme of the way socioeconomic stratum influence product complexity expectations, a
construct that has been found to be an important determinant of technology adoption (e.g.,
Wood & Moreau, 2006). Using regression analysis and structural equation modeling we
show that socioeconomic stratum influence complexity expectations through consumer’s
knowledge, Self-esteem and subjective beliefs of capabilities.
3
1. Introduction
As technology (cell phones, internet) is being quickly spread to subsistance markets, it is
of salient importance for marketers to understand the particularities of the psychological
mechanisms that underly technology adoption in these segments. One way to apprach the
problem is to explore the way in which socio economic level affects known patterns of
behavior. Knowing these effects allows marketing strategies to go beyond the obvious
income barriers and to incorporate insights about the behavior of subsistence consumers.
Such knowledge truly adds to the long term success of technology adoption with
consideration for the consumer well being. Under this framework, this research mainly
contributes to the understanding of the cognitive barriers that subsistence consumers face
before being ready to adopt new technologies. In addition, we contribute, albeit to a lesser
extent, to knowledge in the adoption proccess of technology, by outlining the particularities
and contingencies that technology companies may face when targeting subsistence
segments. (see Venkatesh, Davis and Morris, 2007, for a recent review of the new
directions of research on technology adoption).
Our work focuses on getting insights into the mechanisms that underly the effect of socio
economic level on the cognitive structures that precede technology adoption. Specifically,
we focus on a relevant construct known as expectations of complexity, which has been
found to be a determinant precedent of adoption (Rogers, 1996). It is rather obvious to
expect that subsistance consumers face more barriers than other segments when adopting
and using new technologies. However, there is little knowldege regarding the detailed
4
mechanisms, psychological and sociological, that shape the negative effect of a low socio
economic context. We argue that we need that knowledge in order to help businesses in the
development of correct strategies that are directed to the real causes of subsistence
consumers barriers to new markets. With this goal in mind, we aim at setting a general
framework that provides an overall map of the main relationships that intervene in the
effect of socio economic level on complexity expectations of new technology.
The paper is organized in the following way. We first conducted a literature review aimed
at identifying psychological variables that are both influenced by socio economic level and
determinants of complexity expectations. From this exploration we extracted some
relationships and then we went further and developed four hypotheses that were necessary
in order to complete a general conceptual scheme of the effect of socio economic stratum
on complexity expectations, specifying the connections among the mediating variables that
operationalize such effect. Once the conceptual model was established, we performed a
quasi experimental procedure to test it. We analyze the results in two steps. First, we sought
empirical evidence of the pairwise relationships. Then, based on those results and the
theoretical arguments, we rebuilt the conceptual map of relationships and tested it through
structural equation modeling. Results show that our scheme is an adequate representation of
the general effect of socio economic level on expectations of complexity, providing insights
on the mechanisms that produce the effect. Finally, implications are analyzed for
marketing, cultural perspectives and policy making.
5
2. Complexity expectations and socio economic stratum
Different approaches have been taken to explain how new technologies are adopted. One of
the most widely used framework focuses on the adopters’ characteristics, according to the
chronological adoption of a new product. This way, a consumer might be classified as
early, average or late adopter (Dickerson and Gentry, 1983; Rogers, 1962). This widespread
approach is very useful for marketing purposes to the extent the researcher is able to find
particular market segments that should be targeted at different moments throughout the
product development. This view, however, says nothing about the internal process a given
consumer performs in order to adopt a new product, regardless of the relative moment of
adoption in comparison with other consumers. There is research on technology adoption
that focuses on the adoption processes, looking in particular for behavioral or judgmental
variables that are related to it (e.g., Bruner and Kumar; 2005; Davis et al 1989). Under this
framework, it has been found that the early experience with a product affects definite
adoption (Shih and Venkatesh, 2004). As part of the early experience with a product,
complexity expectations have been found to be a determinant of the adoption and diffusion
of new products and technologies (e.g. Rogers, 1996; Thompson, Hamilton and Rust, 2005;
Wood and Moreau, 2006). Complexity expectations are consumers’ ex-ante predictions
about ease of use, learning time, and learning difficulty of new products (Wood and
Moreau, 2006). The positive or negative confirmation of these expectations (i.e., the
technology is less or more complex than expected) provides a point of reference that
influences the evaluation of the innovation during its early use, which in turn exerts an
effect on final adoption.
6
Even though the effect of complexity expectations on the adoption process has been the
object of different studies (e.g., Shih and Venkatesh, 2004, Wood and Moreau 2006), little
research has examined the variables that shape such expectations (Moreau, Lehmann and
Markman 2001). For instance, there are no studies that address how complexity
expectations differ among consumers depending on their market and personal context. In
this work, we contribute to the understanding of complexity expectations by linking it with
a contextual variable such as socioeconomic stratum of consumers.
It has been established that consumer’s market context serves as frame for the development
of her cognitions, emotions and intentions (Hill and Gaines, 2007), revealing a connection
between her sense of self and the ability to consume (McCraken, 1986; Zukin and Maguire,
2004). Within a general notion of market context, one of the variables that shape individual
differences is socioeconomic stratum (Boardman and Robert, 2000; Wheatley, Chiu and
Stevens, 1980). Consumer’s socioeconomic stratum contribute to shape beliefs, attitudes
and behaviors (Lewis, 1959; Hill and Stephens, 1997; Jones and Lou, 1999) and it has been
widely accepted that there is a relation between consumption behavior and consumer’s
social class (Coleman, 1983; Levy 1966; Schaninger, 1981). Considering this frame, our
research aims to determine whether a contextual variable like socioeconomic status
influences complexity expectations. More specifically, we hypothesize that the
socioeconomic conditions that surround the consumer, determine certain judgments and
types of knowledge, which in turn produce a cognitive response that shapes the expected
complexity of new technological products. In order to operationalize this notion, we
7
reviewed the literature using a two step strategy: We first looked for some potential
determinants of consumer’s complexity expectations, and then we determined whether
consumer’s socioeconomic status may exert an effect on those determinants. In the
following sections, we provide details on what the literature contains regarding these
relationships, and then we go further proposing a number of hypotheses that complete the
scheme.
3. Determinants of complexity expectations:
The notion of complexity expectations can be generally understood as a construct whose
constituents are related to subjective beliefs and cognitions regarding the relationship of a
person with an object. In this sense, we selected from the literature a set of variables that
capture such beliefs and cognitions and therefore may constitute determinants of the
complexity expectation construct. These are: knowledge of domains (Moreau, Lehmann
and Markman, 2001), previous categorization (Moreau, Markman and Lehmann, 2001)
subjective beliefs of capabilities (Beloff, 1992), and Self-esteem (Twenge and Campbell,
2002).
Complexity expectations and knowledge: The cognitive side of expectations is related with
consumer´s knowledge. Bettman and Park (1980) stressed the role of previous knowledge
in the formation of expectations, pointing out that consumers place new information in a
context based on their past and present events. Such mapping process contributes to form
expectations about a new product. Other researchers emphasize such view stating that
8
complexity expectations are constructed using the consumer’s relevant prior knowledge
(Oliver and Winter, 1987; Wood and Moreau, 2006). Note that this type of knowledge is a
collection of previous experiences without a specified classification structure.
The role of knowledge can also be understood according to some kind of classification.
Previous research has established that consumer’s prior knowledge about related product
categories may be classified according to the domain to which the information belongs: it
could be related whether to the primary domain, when the basic category is directly
associated to the new product or to the supplementary domain, when a superordinate
category is recalled. This process facilitates product learning (Gregan-Paxton and John,
1997), by allowing the consumer to transfer extant knowledge from familiar to novel
domains (Yamauchi and Markman, 2000). Furthermore, it has also been argued that
marketers may facilitate categorization–based transfer of knowledge by giving consumers a
plausible category label. The activation of such category would then influence behavior by
eliciting previously formed preferences that apply to the new product. By the same
mechanism, the primed category may also modify consumer’s expectations of product
features (Moreau, Markman and Lehmann, 2001).
In the present research we test the robustness of these findings by treating expectations of
complexity as one of the subjective judgments that is affected by consumer previous
knowledge of categories, either primary or supplementary. In this sense we hypothesize that
complexity expectations are reduced due to the improved accessibility to knowledge related
to either type of category.
9
Complexity expectations and Self-assessed capabilities: There is no explicit account in the
literature, to our knowledge, of a connection between the subjective beliefs of own
capabilities and the construct of complexity expectations. However, we suggest that such
relation exists and has a key role in the determination in the construction of the expected
complexity of a product. We base this hypothesis on the idea that the subjective concept of
own capacity generates a general sense of difficulty/easiness for any task a person faces.
Such relationship is coherent with the well established notion that perceived self efficacy is
a determinant regulator of cognitive processes (e.g., Bandura, 1989; Gist and Mitchell,
1992). This general judgment of difficulty/easiness can be conceptualized, in a very
specific expression, as the expectations of complexity. This means that the consumer uses
her sense of general efficacy to confront the product and the task ahead. As a result of this
match, a complexity expectation judgment is issued. This way, two consumers with
identical knowledge of a product should display differences in their expectations of
complexity due to different subjective capabilities.
Summarizing, we have put together from the literature a set of cognitive and behavioral
variables that may constitute significant determinants of expectations of complexity. These
are domains of knowledge, related categories and self assessed capabilities. These variables
are expected to be the ones that channel the effect of socio economic stratum on complexity
expectations. Thus, in the following section we explore the evidence regarding the
relationship of these variables with socio economic aspects.
10
4. Effects of socio economic stratum
In this section we discuss the effects of socio economic stratum on the different variables
and psychological constructs that we previously identified as determinants of complexity
expectations. However, we must note that socio economic stratum is the reflection of more
specific socio economic variables, such as income, education and place of residence among
others. In this research we do not discriminate the effects of these variables separately.
Instead, we measure them and then calculate an individual overall socio economic stratum.
The focus of our conceptualization and analysis is the effect of this aggregated variable,
which can be understood as the aggregate effect of the actual causal agents (i.e., Income,
education, etc.)
Socio economic stratum (SES) - Knowledge of domains and categories: The widespread
characterization of low-income consumers as uneducated and limitedly experienced in
important areas of social interactions have made them seem unprofitable and unattractive
for marketers. This causes a kind of exclusion from marketing activities (Alwitt and
Donley, 1996; Bauman, 1998; Boyce, 2000; Hamilton and Catterrall, 2005). Such isolation
affects the formation of knowledge about products. Thus, even though researchers have not
explicitly established a direct relationship between socioeconomic status and knowledge of
technology domains, some have found that prior knowledge about products is formed
through exposure to external sources of information (Gregan- Paxton and Roedder,
1997).This means that socio economic level becomes a proxy for low exposure to the types
of marketing promotions that serve to educate consumers in the capabilities and functions
11
of new technologies. Therefore, we suggest that marketing exclusion constitutes a learning
obstacle for low-income consumers. This naturally decreases their knowledge on both
technology domains and product categories.
Socio economic stratum (SES) - Self-assessed capabilities: The relationship between
socioeconomic stratum and subjective capabilities is treated from different perspectives in
the literature. For instance, Alwitt and Donley (1996) describe some societies where low
SES people are expected to underperform on intellectual tasks. Furthermore, some studies
have found that there exists a stereotypical view of poverty, in the sense that some believe
poverty is actually caused by lack of capabilities (Becker, 1997). Some authors (e.g.,
Croizet & Claire, 1998; Rist 1970) argue that such conceptions about low SES groups can
be strong enough to produce a stereotype that is somehow adopted by the poor. This leads
low SES groups to underperform in different tasks even in the absence of a discriminating
treatment (Crocker & Major, 1989; Steele, 1997). Complementary, such stereotype is
believed to influence the subjective estimates of intelligence (Beloff, 1992). This way, we
expect that SES and Self assessed capabilities are positively correlated.
Socio economic stratum (SES) - Self-esteem – Self assessed capabilities: As it was
explained above, it has been established that SES affects subjective capabilities through the
formation of certain negative beliefs about intelligence. However, there is an additional
component of that relationship that is more affectively laden due to the mediation of Self-
esteem. Consumer self esteem is an important determinant of behavior that has been found
to be related to socio economic stratum. It could be defined as “the overall affective

12
evaluation of one´s own worth, value or importance” (Blascovic and Tomaka, 1991).
Twenge and Campbell (2002) found a small but statistically significant positive
relationship between Self-esteem and SES, emphasizing that income, education and
occupation were the most salient aspects of SES that drive the effect on Self-esteem.
Subsequently, Self-esteem would affect Self assessed capabilities in the following way:
Self-esteem is an overall Self-evaluation (Boardman and Robert, 2000) composed by
different dimensions including an “academic” facet (Marsh, 1986, 1990). It has been
established that such overall evaluation of the Self is some kind of aggregation of the single
dimension assessments. However, if the evaluation of one of the dimensions is not firmly
established and supported by clear evidence, then the directionality of the evaluations may
be reversed. This means that the overall evaluation would be the driver of the weakly
developed dimension evaluation (Rosenberg, Schooler, Schoenbach and Rosenberg, 1995).
Given that low SES people have little evidence and experience regarding their capabilities,
as well as clear biases, such evaluation is weakly supported. We hypothesize that this is
indeed the case and therefore, that a consumer with a low Self-esteem will likely have low
Self-assessed capabilities.
5. Summary of relationships and hypotheses.
We have so far explained the relationships that are likely to play a role in the overall effect
of socioeconomic stratum on expectations of complexity. Initially, socio economic stratum
influences these variables, and through them expectations of complexity is then affected.
These variables are: Consumer self esteem, consumer knowledge of product domains,
13
consumer knowledge of related categories and Self assessed capabilities. Since not all these
relationships are well established in the literature we developed specific hypotheses to
complement the structural conceptualization.
H1: Information about product categories, primary or supplementary reduces complexity
expectations of the new product.
H2: There is an inverse relationship of consumer’s Self-assessed capabilities and
expectations of complexity.
H3: Consumer’s Self-esteem positively influences Self-assessed capabilities.
H4: Socio economic stratum positively influences knowledge of technology.
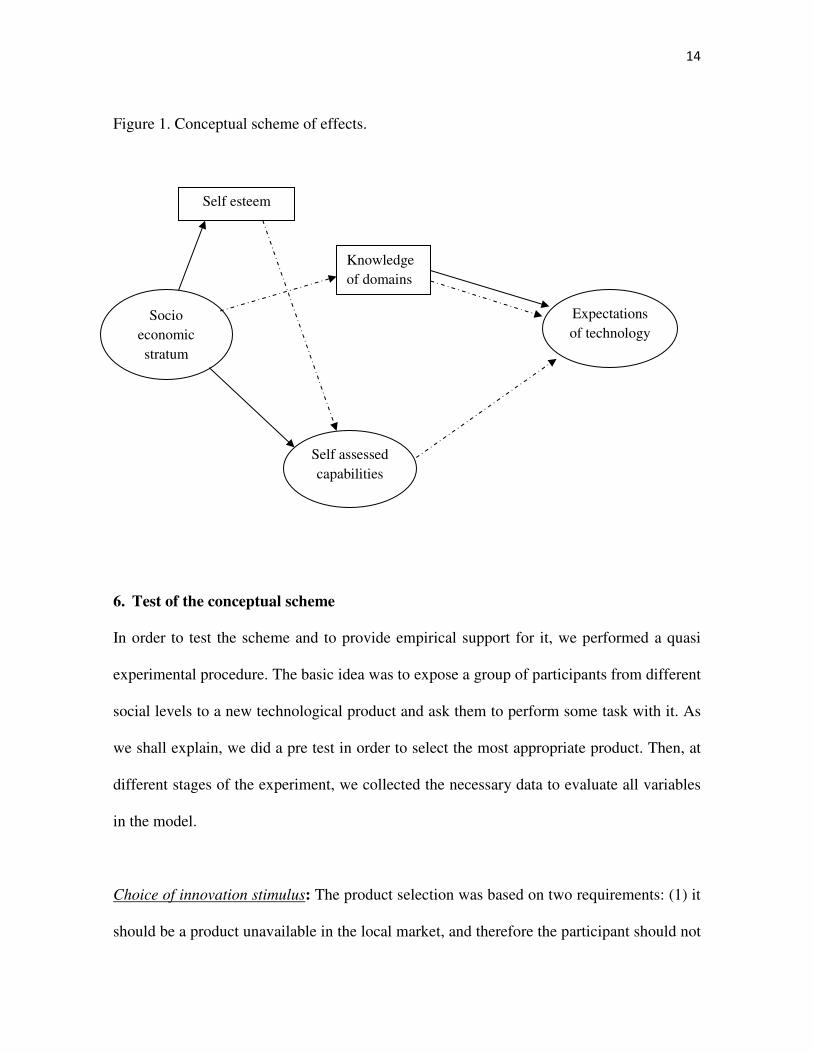
Figure 1 summarizes the complete scheme. The dotted lines denote our hypotheses and
solid lines denote the relationships extracted from the literature. Variables represented by
squares are observable and variables represented by ovals are non observable constructs.
14
Figure 1. Conceptual scheme of effects.
6. Test of the conceptual scheme
In order to test the scheme and to provide empirical support for it, we performed a quasi
experimental procedure. The basic idea was to expose a group of participants from different
social levels to a new technological product and ask them to perform some task with it. As
we shall explain, we did a pre test in order to select the most appropriate product. Then, at
different stages of the experiment, we collected the necessary data to evaluate all variables
in the model.
Choice of innovation stimulus: The product selection was based on two requirements: (1) it
should be a product unavailable in the local market, and therefore the participant should not
Socio
economic
stratum
Self assessed
capabilities
Expectations
of technology
Self esteem
Knowledge
of domains
15
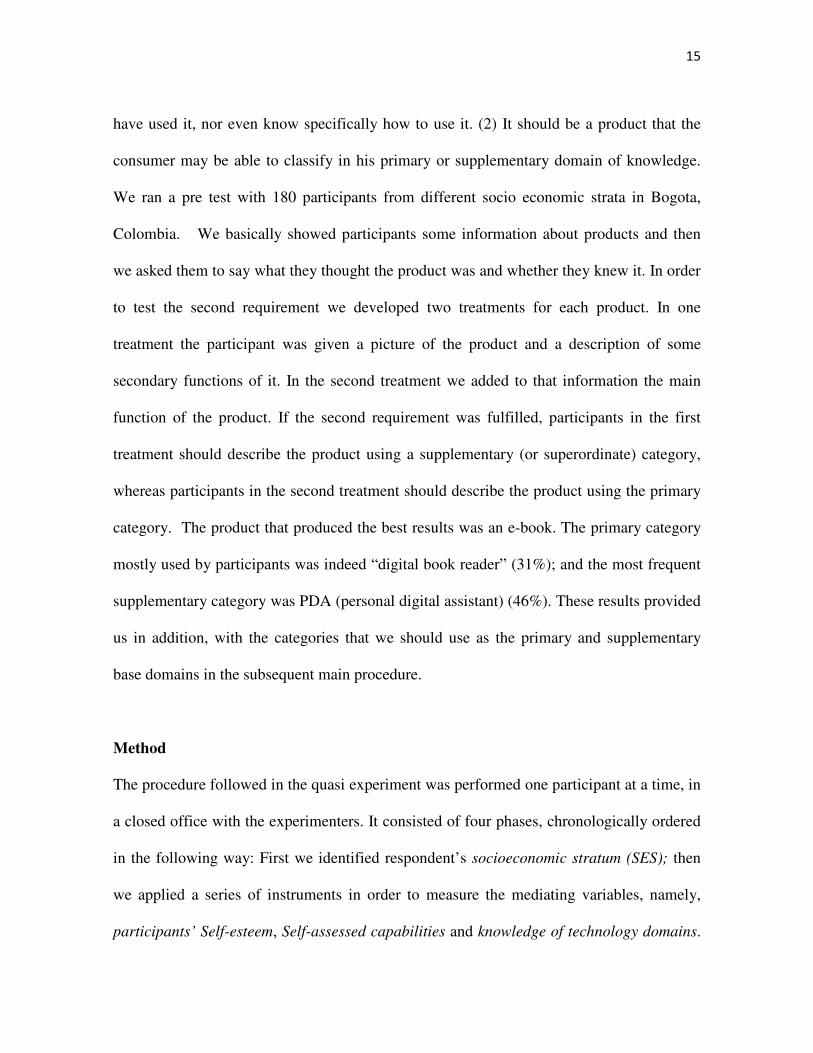
have used it, nor even know specifically how to use it. (2) It should be a product that the
consumer may be able to classify in his primary or supplementary domain of knowledge.
We ran a pre test with 180 participants from different socio economic strata in Bogota,
Colombia. We basically showed participants some information about products and then
we asked them to say what they thought the product was and whether they knew it. In order
to test the second requirement we developed two treatments for each product. In one
treatment the participant was given a picture of the product and a description of some
secondary functions of it. In the second treatment we added to that information the main
function of the product. If the second requirement was fulfilled, participants in the first
treatment should describe the product using a supplementary (or superordinate) category,
whereas participants in the second treatment should describe the product using the primary
category. The product that produced the best results was an e-book. The primary category
mostly used by participants was indeed “digital book reader” (31%); and the most frequent
supplementary category was PDA (personal digital assistant) (46%). These results provided
us in addition, with the categories that we should use as the primary and supplementary
base domains in the subsequent main procedure.
Method
The procedure followed in the quasi experiment was performed one participant at a time, in
a closed office with the experimenters. It consisted of four phases, chronologically ordered
in the following way: First we identified respondent’s socioeconomic stratum (SES); then
we applied a series of instruments in order to measure the mediating variables, namely,
participants’ Self-esteem, Self-assessed capabilities and knowledge of technology domains.
16
Up to that point all participants went through the same procedure. In the third phase we
performed a category knowledge manipulation. Note that product categories were pre-
tested during the choice selection phase, and two (e-book reader and PDA) were used in the
main study to assess generalizabilty across new types of technology. Participants were told
that the product was either a PDA or an e-book. This should not affect complexity
expectations. Finally, respondents were asked to respond the expectations of complexity
questionnaire and afterwards to complete a task with the product. Before leaving,
participants were paid a flat fee of 6, 9 or 14 USD accordingly to the socio economic
stratum.
Measurement instruments.
Socio economic stratum (SES): Participants filled out a set of demographic questions in
order to establish their socioeconomic stratum. We used the assumptions and procedure of
Hollingshead and Redlich (1967) , according to which, socioeconomic status is determined
by: “(1) the existence of a class status structure in the community, (2) that class status
positions are determined mainly by a few commonly accepted symbolic characteristics and
(3) that characteristics symbolic of class status may be scaled and combined by the use of
statistical procedures so that a researcher can reliably and meaningfully stratify the
population” This way, following their procedure the demographic variables used to
determine SES were: residential stratum, monthly income, educational scale and parents’
educational scale.

17
Self-esteem: We used a standard method for assessing the individual Self esteem that
conveniently suited our research procedure. This was the Coopersmith Self-Esteem
Inventory (1967). It consists of a group of 25 questions that evaluates participants’ attitudes
towards themselves in four areas: (1) social self-peers, (2) home-parents, (3) school / work
(4) general-self.
Beliefs of Capabilities: To assess participant’s belief of capabilities, we adapted the
methodology used by Rammstedt and Rammsayer (2002), which asks subjects to assess
their score in the seven aspects of intelligence based on Thurstone’s primary mental
abilities (verbal comprehension, verbal fluency, arithmetic ability, memory, perceptual
speed, inductive reasoning and spatial visualization), and in the types of intelligence
proposed by Gardner (1983) (linguistic, logical-mathematical, spatial, musical, body-
kinesthetic, interpersonal and intrapersonal intelligence).Since this instrument was too long
for our purposes, the adaptation we conducted was the following: Some weeks before the
experiment we applied the test to 64 people different than those of the main experiment.
We performed a factor analysis to determine which of the 14 original items of the test
should be included. We selected surrogated items following the procedure used by Hair et
al (1998): We took the items with a factor loading of 0.7 or above in each of the factors of
the rotated solution and we used those items as the constituents of the reduced version of
the test. These are the items finally included in the adapted Self-assessed capabilities test:
verbal fluency, arithmetic ability, interpersonal intelligence, linguistic intelligence and
spatial intelligence. The test presented a short description of each item and asked subjects
to assess their subjective level in each item using a seven point scale.
18
Knowledge of technology domains: Participants’ knowledge was measured using a
questionnaire that included 6 different true/false statements. We used a separated
questionnaire for each category domain: digital book reader (primary) and PDA
(supplementary). Then, participants answered whether the statements were true or false or
whether they didn’t know the answer (an option used to avoid guessing) (Johar, Jedidi and
Jacobi, 1997; Moreau, Lehmann and Markman 2001). The sum of the correct answers
provided the measure of knowledge.
Complexity expectations: Following Wood and Moreau (2006) and Rogers (1996)
procedure, participants indicated on three seven point scales how difficult to use they
expected the product to be, how long it would take to learn to use it, and how much of a
challenge its use would be.
Sample
The sample consisted of 266 participants from Bogota, Colombia, representing most socio
economic strata of the city. We hired a trained recruiter, experienced with several
marketing research companies, to find the people in the different neighborhoods and bring
them to the university campus in small groups.
7. Results
Descriptive information: The sample had a mean age of 39 years old, with a SD of 16 years
ranging between 19 and 84 years. 50.8% were male and 49.2% women. Since SES was a
19
composite measure of four items, we obtained a continuous variable ranging from 1 to 4.
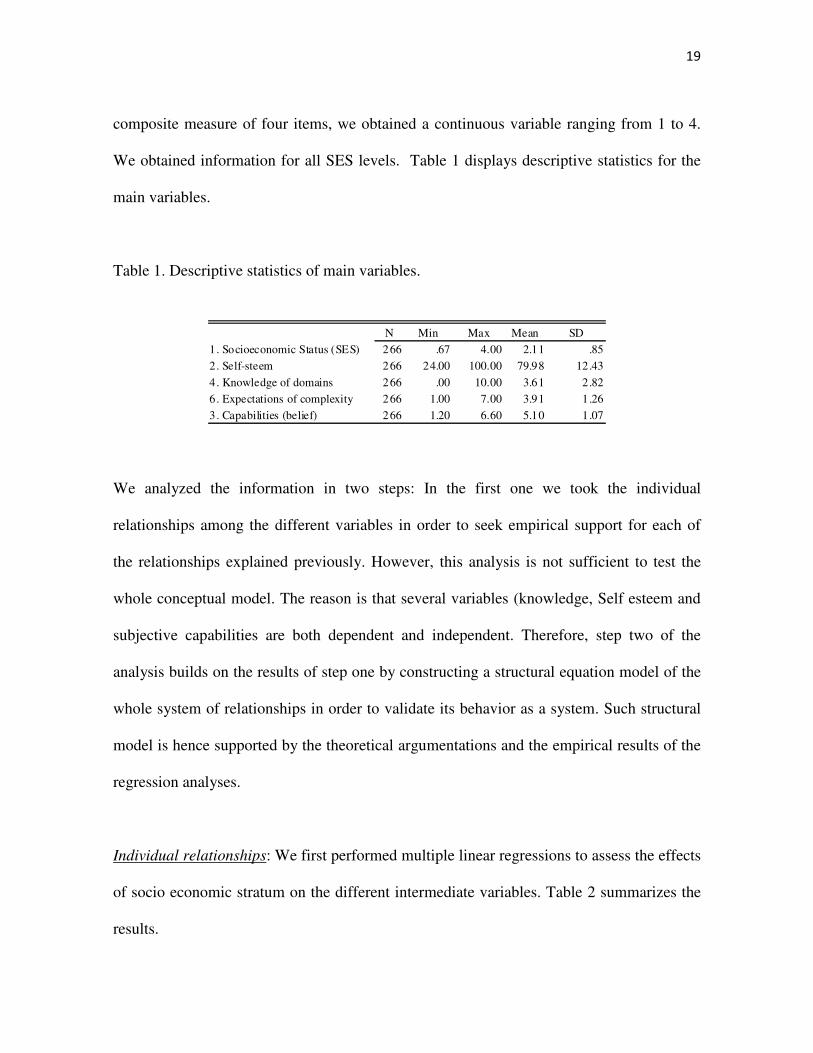
We obtained information for all SES levels. Table 1 displays descriptive statistics for the
main variables.
Table 1. Descriptive statistics of main variables.
N Min Max Mean SD
1. Socioeconomic Status (SES) 266 .67 4.00 2.11 .85
2. Self-steem 266 24.00 100.00 79.98 12.43
4. Knowledge of domains 266 .00 10.00 3.61 2.82
6. Expectations of complexity 266 1.00 7.00 3.91 1.26
3. Capabilities (belief) 266 1.20 6.60 5.10 1.07
We analyzed the information in two steps: In the first one we took the individual
relationships among the different variables in order to seek empirical support for each of
the relationships explained previously. However, this analysis is not sufficient to test the
whole conceptual model. The reason is that several variables (knowledge, Self esteem and
subjective capabilities are both dependent and independent. Therefore, step two of the
analysis builds on the results of step one by constructing a structural equation model of the
whole system of relationships in order to validate its behavior as a system. Such structural
model is hence supported by the theoretical argumentations and the empirical results of the
regression analyses.
Individual relationships: We first performed multiple linear regressions to assess the effects
of socio economic stratum on the different intermediate variables. Table 2 summarizes the
results.
20
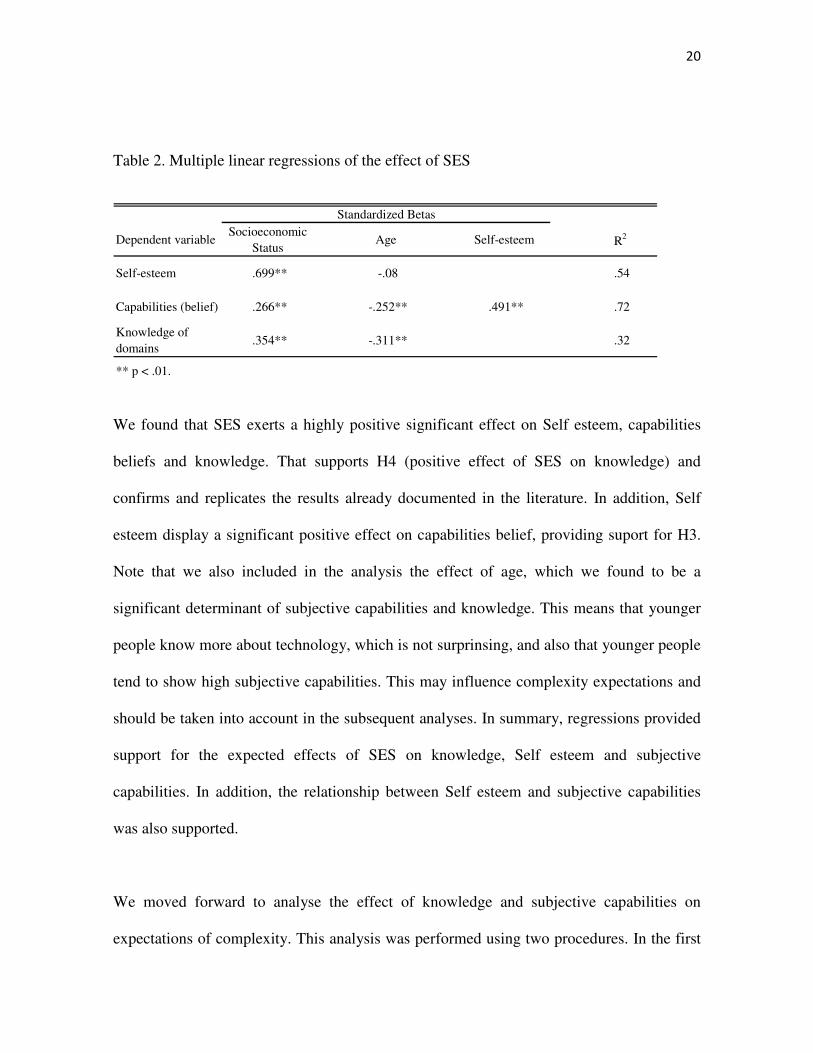
Table 2. Multiple linear regressions of the effect of SES
Dependent variableSocioeconomic
StatusAge Self-esteem R
2
Self-esteem .699** -.08 .54
Capabilities (belief) .266** -.252** .491** .72
Knowledge of
domains .354** -.311** .32
** p < .01.
Standardized Betas
We found that SES exerts a highly positive significant effect on Self esteem, capabilities
beliefs and knowledge. That supports H4 (positive effect of SES on knowledge) and
confirms and replicates the results already documented in the literature. In addition, Self
esteem display a significant positive effect on capabilities belief, providing suport for H3.
Note that we also included in the analysis the effect of age, which we found to be a
significant determinant of subjective capabilities and knowledge. This means that younger
people know more about technology, which is not surprinsing, and also that younger people
tend to show high subjective capabilities. This may influence complexity expectations and
should be taken into account in the subsequent analyses. In summary, regressions provided
support for the expected effects of SES on knowledge, Self esteem and subjective
capabilities. In addition, the relationship between Self esteem and subjective capabilities
was also supported.
We moved forward to analyse the effect of knowledge and subjective capabilities on
expectations of complexity. This analysis was performed using two procedures. In the first
21
one we performed a multiple linear regression including knowldege of domains and
subjective capabilities as regressors of expectation of complexity. We also included age,
due to the effect found in the previous analyses. In the second analysis, we seperately tested
the effect of the category priming manipulation on complexity expectations using Anova.
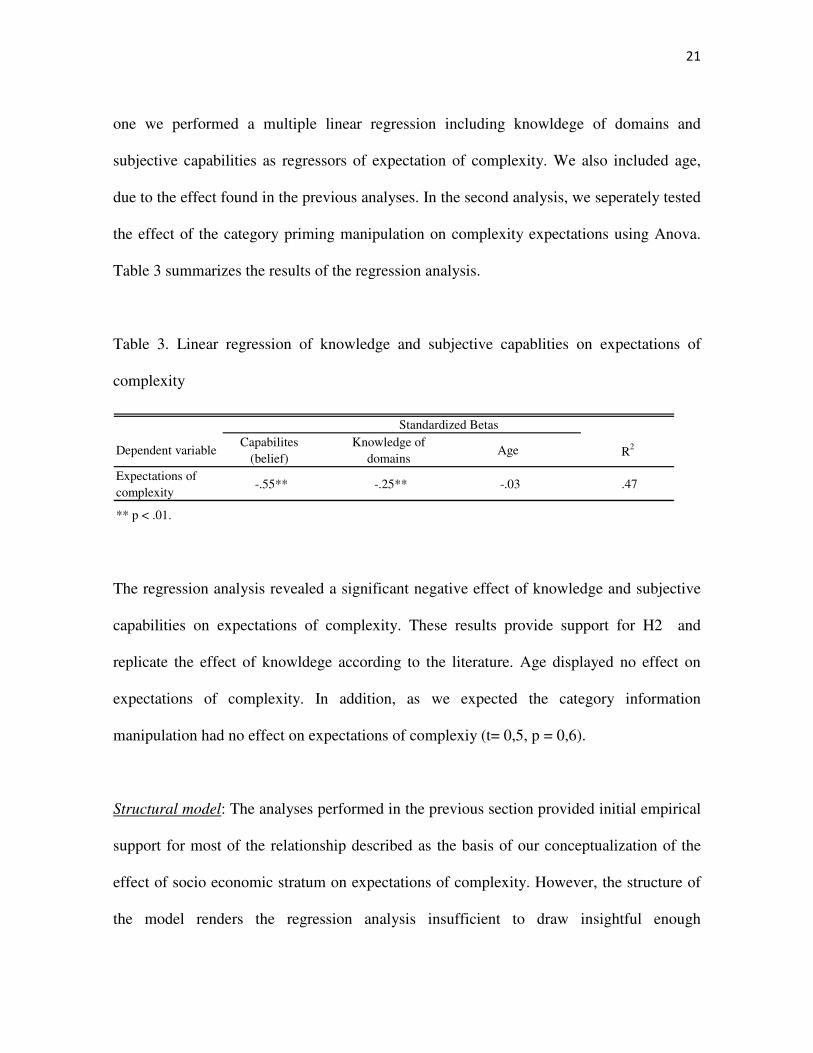
Table 3 summarizes the results of the regression analysis.
Table 3. Linear regression of knowledge and subjective capablities on expectations of
complexity
Dependent variableCapabilites
(belief)
Knowledge of
domainsAge R
2
Expectations of
complexity -.55** -.25** -.03 .47
** p < .01.
Standardized Betas
The regression analysis revealed a significant negative effect of knowledge and subjective
capabilities on expectations of complexity. These results provide support for H2 and
replicate the effect of knowldege according to the literature. Age displayed no effect on
expectations of complexity. In addition, as we expected the category information
manipulation had no effect on expectations of complexiy (t= 0,5, p = 0,6).
Structural model: The analyses performed in the previous section provided initial empirical
support for most of the relationship described as the basis of our conceptualization of the
effect of socio economic stratum on expectations of complexity. However, the structure of
the model renders the regression analysis insufficient to draw insightful enough
22
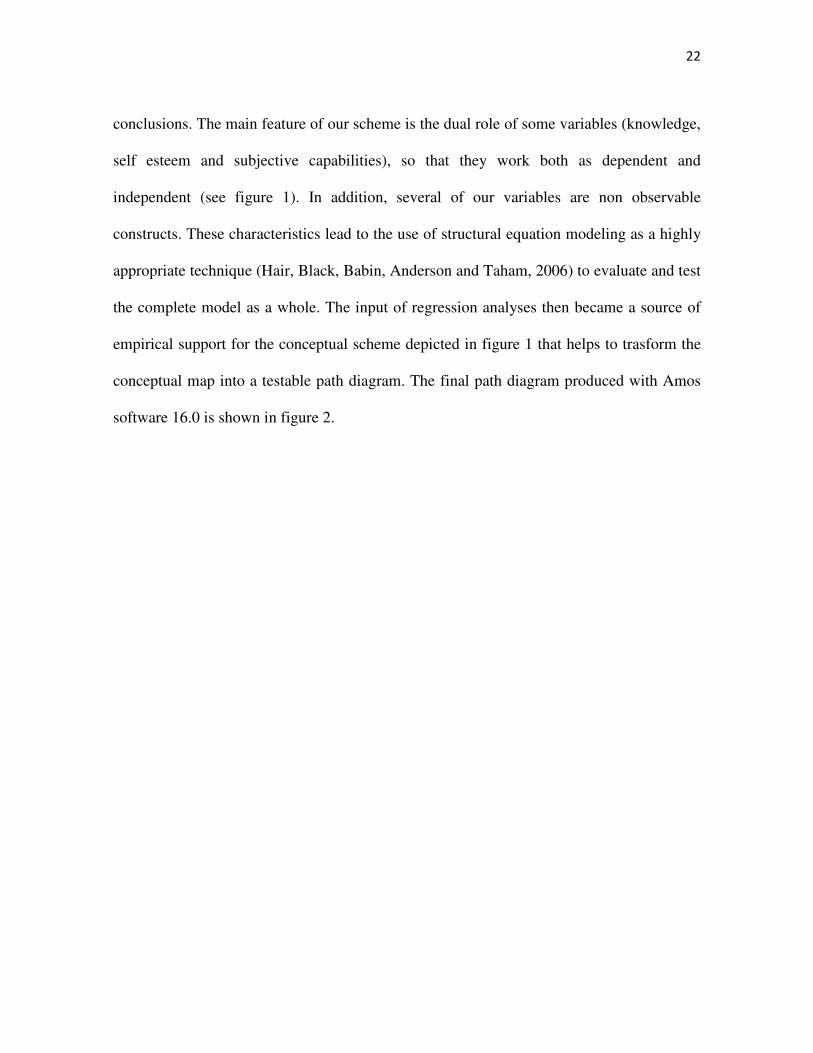
conclusions. The main feature of our scheme is the dual role of some variables (knowledge,
self esteem and subjective capabilities), so that they work both as dependent and
independent (see figure 1). In addition, several of our variables are non observable
constructs. These characteristics lead to the use of structural equation modeling as a highly
appropriate technique (Hair, Black, Babin, Anderson and Taham, 2006) to evaluate and test
the complete model as a whole. The input of regression analyses then became a source of
empirical support for the conceptual scheme depicted in figure 1 that helps to trasform the
conceptual map into a testable path diagram. The final path diagram produced with Amos
software 16.0 is shown in figure 2.
23
Figure 2. Path diagram of the effect of Socio economic stratum on expectations of
complexity.
24
This path diagram produced a Goodness of Fit Index (GIF) of 0,87 with a comparative fit
index (CFI) of 0,93. The root mean square error of approximation (RMSEA) was 0.08 and
the Chi-square was 316, significant at the 0,01 level with 115 degrees of freedom. In
addition, the squared multiple correlation of expectations of complexity was 0.7, meaning
that the model captured 70% of this construct´s variance. Given the characteristics of the
model complexity (16 observed variables and 37 estimated parameters) and sample size
(266), the model shows an adequate fit, following Hair et al., (2006); Carmines and McIver
(1981) and Browne and Cudeck (1993) criteria for model adequacy assessement. Thus, we
can state the we succesfully produced a conceptual scheme that captures a significant extent
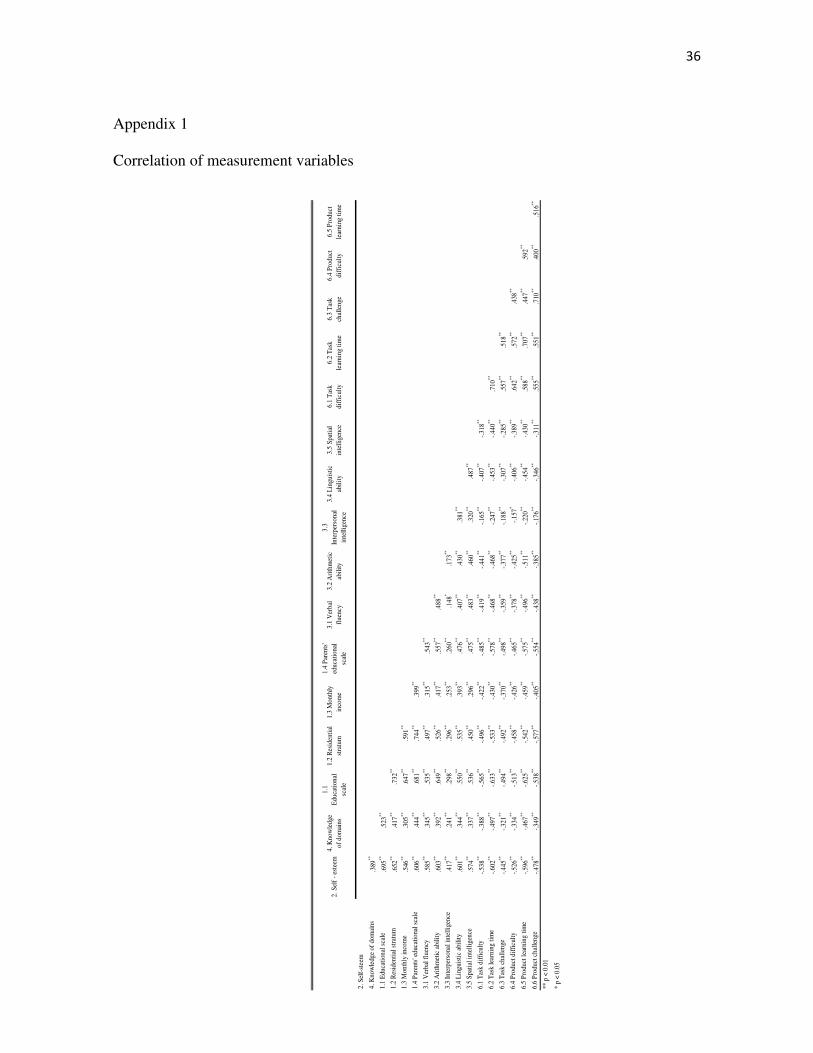
of the effect of SES on complexity expectations. Appendix 2 contains correlations of
measurement variables and appendix 2 contains information on regression coefficients of
both measurement and structural models. Finally, we must note that the model is
appropriate but not excellent. Gooodnes of fit is a little below of a desirable 0.9 and
RMSEA is right on the threshold. This is probably due to the fact that some variance of
expectations of complexity (30%) remains unexplained and the complexity of the
psychological constructs we used. Further research can address these questions using the
baseline we are providing in this work.
8. Discussion
We were able to define a conceptual model that adequately captures the main mechanism
by which expetactions of complexity are reduced as the socio economic level of people
increases. More specifically, we showed that there are three salient variables through which

25
this occurs, namely, knowldege of technology domains, self esteem and subjective beliefes
of own capacities.
Marketing implications: These results contribute to the understanding of the particular
barriers that subsistence consumers face when they start to participate in new markets, in
particular those that involve technological developments. Moreover, this research remarks
the fact that the barriers faced by subsistance consumers go beyond the purchasing power
issues, entering deeper psicological aspects. Our work emphasizes the notion that socio
economic level is a contextual variable that exerts significant effects on a wide range of
psychological constructs that are determinants of observable consumer behaviors.
Understanding these effects is useful for social and behavioral scientists and marketing
practitioners. In this sense, our results provide insights that can be applied to innovative
market segmentation strategies, as well as to develop better framed marketing
comunications of technological products, aimed at acting against the negative
psychological influence of a low socio economic context. For instance, there could be
market segments based on different degrees of consumer knowledge of technological
categories and based on that, three or four communication strategies could be developed,
varying their degree of educational content. Similar approaches may be taken for self
esteem based or capabilities based segmentation strategies. Based on our results, the bottom
line of any strategy targeted to subsistence consumers is that explicit tactics should be
implemented in order to reduce complexity expectations, and this may me accomplished by
incorporating knowledge, self esteem and subjective capabilities as the key strategic objects
of interventions.
26
Note that our research not only confirms the influence of knowledge of domains on the
technology adoption process (Gregan-Paxton and John, 1997; Moreau, Markman and
Lehmann, 2001; Gragan-Paxton, 1999; Yamauchi and Markman, 2000), but also provides
evidence on the relation between consumer knowledge of domains and economic status.
From the marketing perspective, finding this two way link makes salient the consequences
of what some researches (e.g, Alwitt and Donley, 1996; Also, Hamilton and Catterrall,
2005; Boyce, 2000) have called the exclusion of the low income from some marketing
strategies. Such exclusion creates psychological barriers that need time and properly
conceptualized actions to be overcame.
Effects of culture: This research complements studies of cultural differences as a barrier to
technology adoption. It has been suggested that cultural differences can act as a barrier to
technology adoption (Pohjola, 2003; Erumban and de Jong, 2006). At the same time,
different authors state that the low-income consumer has created a culture based on her lack
of resources (Hill, 2002, Hill and Gaines, 2007; Hamilton and Catterall, 2005). Our
research complements these arguments by providing an account of the way socio economic
stratum constitutes a contextual variable that shapes the cultural characteristics of people.
According to our results, this seems to structurally influence the behavior of individuals.
Furthermore, our results also complements knowledge on what Croizet and Claire (1998)
called the stereotype threat of the low-income consumer, adding details on the
characteristic of such stereotype regarding self esteem effects and subjective capabilities
effects on behavior.
27
Policy. Finally, we would like to comment on policy making implications of our research.
Technology diffusion is usually considered as a desirable goal in order to increase living
standards. Different multilateral organizations are working to reduce what they have called
the “Digital Divide” of the low-income population. There are different studies (e.g., Fife
and Pereira 2002; Erumban and de Jong, 2006) that explore macro economic factors that
determine the characteristics of countries’ adoption rates. They also suggest that socio
cultural factors are salient determinants of such adotion rates. Notwithstanding, the details
of how these socio economic factors operate are not clearly understood, let alone
incorporated in policies. We believe that behaviorally driven research can inform policy
makers about important issues that should be part of policy implementation in order to
maximaze its results. Our research leads us to argue that capabilities beliefs and knowledge
are part of the socio cultural factors that influences technology adoption. This provides two
specific directions towards which policies can be focused. In this sense, programs that
promote the construction of better self percepetion as well as inclusion in the difussion of
knowldge should help to increase aggregated technology adoption rates and help people to
be more functional in a technological society.
References
Alwitt. Donley. The Low-income Consumer: Adjusting the Balance of Exchange, London:
Sage Publications, 1996.
28
Bandura Albert. Regulation of cognitive processes through perceived self-efficacy.
Developmental Psychology 1989; 25(5): 729 – 735
Bauman. Work, Consumerism and the New Poor, Buckingham: Open University Press,
1998.
Becker Saul. Responding to Poverty: The Politics of Cash and Care. London: Longman,
1977 .
Beloff, Halla. Mother, Father and Me: Our IQ. The Psychologist 1992; 5: 309–311.
Bettman James. Park Whan. Effects of Prior Knowledge and Experience and Phase of the
Choice Process on Consumer Decision Processes: A protocol Analysis. Journal of
Consumer Research 1980; 7 (December): 234-248.
Blascovich. Tomaka. Measures of Self-esteem. In: Robinson,. Shaver. Wrightsman, editor.
Measures of personality and social psychological attitudes, NY: Academic, 1991.
Boardman Jason. Robert Stephanie. Neighborhood Socioeconomic Status and Perceptions
of self-efficacy. Sociological Perspectives 2000; 43 (1): 117-136.
Boyce Gordon. Valuing Customers and Loyalty: The Rhetoric of Consumer Focus versus
the Reality of Alienation and Exclusion of (Devaluated) Customers. Critical Perspectives
on Accounting 2000; 11 (6), 649-689.
29
Browne Michael. Cudeck Robert. Alternative ways of assessing model fit. In: Bollen
Kenneth and Long Scott, editors. Testing Structural Equation Models. Sage Focus Editions,
1993. pp 136 – 159.
Bruner Gordon. Kumar Anand. Explaining Consumers Acceptance of Handheld Devices.
Journal of Business Research 2005; 58: 553-558.
Carmines Edward. McIver John. Analyzing models with unobserved variables: analysis of
covariance structures. In: G. W. Bohrnstedt and E. F. Borgotta, editors. Social
Measurement: Current Issues. Beverly Hills, CA: Sage 1981. pp. 65 – 115.
Coleman Richard. The Continuing Significance of Social Class to Marketing. Journal of
Consumer Research 1983; 10 (December):265-280.
Coopersmith S. The Antecedents of Self-esteem. NY. Freeman Press, 1967.
Crocker Jennifer. Major Brenda. Social stigma and self-esteem: The Self-protective
properties of stigma. Psychological Review 1989; 96: 608-360
Croizet Jean-Claude. Claire Theresa. Extending the concept of stereotype threat to social
class: The intellectual Underperformance of students from low socioeconomic
backgrounds. Personality and Social Psychology bulletin 1998; 24 (June): 588 – 594.
30
Davis Fred. Bagozzi Richard. Warshaw Paul. User acceptance of computer technology: A
comparison of two theoretical models. Management Science 1989; 35 (August): 982-1003.
Dickerson Mary. Gentry James. Characteristics of adopters and non-adopters of home
computers. Journal of Consumer Research 1983; 10 (September): 225-235
Erumban Abdul. de Jong Simon. Cross-country differences in ICT adoption: A
consequence of Culture?. Journal of world business 2006; 41 (4): 302-314.
Fife Elizabeth. Pereira Francis. Socio-economic and cultural factors affecting adoption of
broadband access: a cross-country analysis. 2002.
www.marshall.usc.edu/ctm/publications/FITCE2002.PDF, accessed in May 2008
Gist Marilyn. Mitchell Terence. Self-efficacy: a theoretical analysis of its determinants and
malleability. Academy of Management Review 1992; 17 (2): 183-211.
Gregan-Paxton Jennifer. How does prior knowledge influence consumer learning? A study
of analogy and categorization effects. Working paper, Department of Business
Administration, University of Delaware, Newark 1999.
31
Gregan-Paxton Jennifer. John, Deborah. Consumer Learning by Analogy: A Model of
Internal Knowledge Transfer. Journal of Consumer Research 1997; 24 (December):266-
284.
Hair. Anderson. Tatham. Black. Multivariate Data Analysis. NJ. Prentice Hall, 1998.
Hamilton Kathy. Catterrall Mitiam. Towards a Better Understanding of the Low Income
Consumer. Advances in consumer Research 2005; 32: 627-632.
Hill Ronald P. Consumer culture and the culture of poverty: Implications for marketing
theory and practice. Marketing theory 2002; 2 (September): 273-294
Hill Ronald P. Gaines Jeannie. The consumer culture of poverty: Behavioral research
findings and their implications in an ethnographic context. Journal of American Culture
2007; 30 (March): 81-95.
Hill Ronald P. Stephens Debra. Impoverished consumers and consumer behavior: The case
of AFDC Mothers. Journal of Macromarketing 1997; 19 (December): 32-48.
Hollingshead August. Redlich Frederick. Social class and mental illness : a community
study , NY: John Wiley, 1967.
32
Johar Gita. Jedidi Kamel. Jacoby Jacob. A Varying Parameter Averaging Model of On-
Line Brand Evaluations. Journal of Consumer Research 1997; 24 (September): 232-248.
Jones Rachel. Ye. Lou. The culture of poverty and African American culture: An empirical
assessment. Sociological Perspectives 1999; 42: 439-459.
Levy, S. Social Class and Consumer Behavior. In: Newman, editor. On knowing the
consumer, NY: John Wiley and Sons, 1966.
Lewis, O. Five families: Mexican case studies in the culture of poverty. NY: Basic Books,
1959.
Marsh Herbert W. Global self-esteem: its relation to specific facets of self-concept and their
importance. Journal of Personality and Social Psychology 1986; 51: 1224 – 1236
Marsh Herbert W. Influences of Internal and External Frames of Reference on the
Formation of Math and English Self-Concepts. Journal of Educational Psychology 1990;
82: 107-116
McCracken Grant. Culture and consumption: A theoretical account of the structure and
movement of the cultural meaning of consumer goods. Journal of Consumer Research
1986; 13 (June):71-84.
33
Moreau Page. Lehmann Donald . Markman Arthur. Entrenched Knowledge Structures and
Consumer Response to New Products. Journal of Marketing Research 2001; 38 (February):
14-29
Moreau Page. Markman Arthur. Lehmann Donald. “What is it?” Categorization Flexibility
and Consumers’ Responses to Really New Products. Journal of Consumers Research 2001;
27 (March): 489-498
Oliver Richard. Winter Russell . A Frame Work for the Formation and Structure of
Consumer Expectations: Review and Propositions. Journal of Economic Psychology 1987;
8 (4); 469-499
Pohjola Matti. The adoption and diffusion of ICT across countries: Patterns and
determinants. In: D.C. Jones, Editor. New Economy Handbook. San Diego, CA: Academic
Press, 2003.
Rammstedt Beatrice. Rammsayer Thomas H. Self-Estimated Intelligence: Gender
differences, relationship to psychometric intelligence and moderating effects of level of
education. European Psychologist 2002; 7 (December): 275-284
Rist R. Students social class and teacher’s expectations: The self-fulfilling prophecy in
ghetto education. Harvard Educational Review 1970; 40: 411-451.
Rogers. Diffusion of innovations, NY: The Free Press, 1996.
34
Rosenberg Morris. Schooler Carmi. Schoenbach Carrie. Rosenberg Florence. Global self-
esteem and specific self-esteem: different concepts, different outcomes. American
Sociological Review 1995; 60 (February): 141 – 156
Schaninger Charles. Social Class versus income: An empirical investigation. Journal of
Marketing Research 1981; 18 (May): 192-208
Shih Chuan-Fong. Venkatesh Alladi. Beyond Adoption: Development and application of a
Use-Diffusion Model. Journal of Marketing 2004; 68 (January): 59-72
Steele C. A threat in the air: how stereotypes shape the intellectual identities and
performance of women and African Americans. American Psychologist 1997; 52:613-629.
Thompson Debora. Hamilton Rebecca. Rust Roland. Feature Fatigue: When product
capabilities become too much of a good thing. Journal of Marketing Research 2005; 42
(November): 431-442
Twenge Jean. Campbell W. Keith. Self-Esteem and Socioeconomic Status: A Meta-
Analytic Review. Personality and Social Psychology Review 2002; 6 (1): 59-71
35
Venkatesh Viswanath. Davis Fred. Morris Michael. Dead or alive? The development,
trajectory and future of technology adoption research. Journal of the Association for
Information Systems 2007; 8 (April): 268 - 286
Wheatley John J. Chiu John S. Stevens Andrea C. Demographics to Predict Consumption.
Journal of Advertising Research 1980; 20 (December): 31-38.
Wood Stacy L. Moreau C. Page. From fear to loathing? How emotions influences the
evaluation and early use of innovations. Journal of Marketing 2006; 70 (July): 44-57.
Yamauchi Takashi. Markman Arthur. Inference using Categories. Journal of Experimental
Psychology: Learning, memory and cognition 2000; 26 (May): 776-795.
Zukin Sharon. Maguire Jennifer. Consumer and consumption. Annual Review of Sociology
2004; 30: 173-197
36
Appendix 1
Correlation of measurement variables
2.
Sel
f -
este
em4
. Kn
ow
led
ge
of
dom
ain
s
1.1
Ed
uca
tio
nal
scal
e
1.2
Res
iden
tial
stra
tum
1.3
Mo
nth
ly
inco
me
1.4
Par
ents
'
edu
cati
on
al
scal
e
3.1
Ver
bal
flu
ency
3.2
Ari
thm
etic
abil
ity
3.3
Inte
rper
son
al
inte
llig
ence
3.4
Lin
guis
tic
abil
ity
3.5
Spa
tial
inte
llig
ence
6.1
Tas
k
dif
ficu
lty
6.2
Tas
k
lear
nin
g ti
me
6.3
Tas
k
chal
len
ge
6.4
Pro
du
ct
dif
ficu
lty
6.5
Pro
duct
lear
nin
g t
ime
2.
Sel
f-st
eem
4.
Kn
ow
ledg
e o
f do
mai
ns
.389
**
1.1
Edu
cati
onal
sca
le.6
95*
*.5
23
**
1.2
Res
iden
tial
str
atu
m.6
52*
*.4
17
**
.73
2**
1.3
Mo
nth
ly i
nco
me
.546
**
.30
5*
*.6
47
**.5
91
**
1.4
Par
ents
' ed
ucat
iona
l sc
ale
.606
**
.44
4*
*.6
81
**.7
44
**
.39
9**
3.1
Ver
bal
flu
ency
.585
**
.34
5*
*.5
35
**.4
97
**
.31
5**
.54
3**
3.2
Ari
thm
etic
ab
ilit
y.6
03*
*.3
92
**
.64
9**
.52
6*
*.4
17
**.5
57*
*.4
88
**
3.3
In
terp
erso
nal
inte
llig
ence
.417
**
.24
1*
*.2
98
**.2
96
**
.25
3**
.26
0**
.14
8*
.17
3**
3.4
Lin
gu
isti
c ab
ilit
y.6
01*
*.3
44
**
.55
0**
.53
5*
*.3
93
**.4
76*
*.4
07
**
.43
0**
.381
**
3.5
Sp
atia
l in
tell
igen
ce.5
74*
*.3
37
**
.53
6**
.45
0*
*.2
96
**.4
75*
*.4
83
**
.46
0**
.320
**
.48
7**
6.1
Tas
k d
iffi
cult
y-.
53
8**
-.3
88
**
-.5
65
**-.
496
**
-.4
22
**-.
48
5**
-.4
19
**
-.4
41
**-.
165
**
-.4
07
**-.
31
8**
6.2
Tas
k le
arn
ing
tim
e-.
60
2**
-.4
97
**
-.6
33
**-.
533
**
-.4
30
**-.
57
8**
-.4
68
**
-.4
68
**-.
247
**
-.4
53
**-.
44
0**
.71
0*
*
6.3
Tas
k ch
alle
nge
-.4
45*
*-.
32
1*
*-.
49
4**
-.49
2*
*-.
37
0**
-.4
98*
*-.
35
9*
*-.
37
7**
-.18
8*
*-.
30
7**
-.2
85*
*.5
57
**
.51
8**
6.4
Pro
duct
dif
ficu
lty
-.5
26*
*-.
33
4*
*-.
51
3**
-.45
8*
*-.
42
6**
-.4
65*
*-.
37
8*
*-.
42
5**
-.1
57
*-.
40
6**
-.3
89*
*.6
42
**
.57
2**
.438
**
6.5
Pro
duct
lea
rnin
g ti
me
-.5
96*
*-.
46
7*
*-.
62
5**
-.54
2*
*-.
45
9**
-.5
75*
*-.
49
6*
*-.
51
1**
-.22
0*
*-.
45
4**
-.4
30*
*.5
88
**
.70
7**
.447
**
.59
2*
*
6.6
Pro
duct
ch
alle
ng
e-.
47
8**
-.3
49
**
-.5
38
**-.
577
**
-.4
05
**-.
55
4**
-.4
38
**
-.3
85
**-.
176
**
-.3
46
**-.
31
1**
.55
5*
*.5
51
**.7
10*
*.4
00
**
.51
6**
** p
< 0
.01
* p
< 0
.05
37
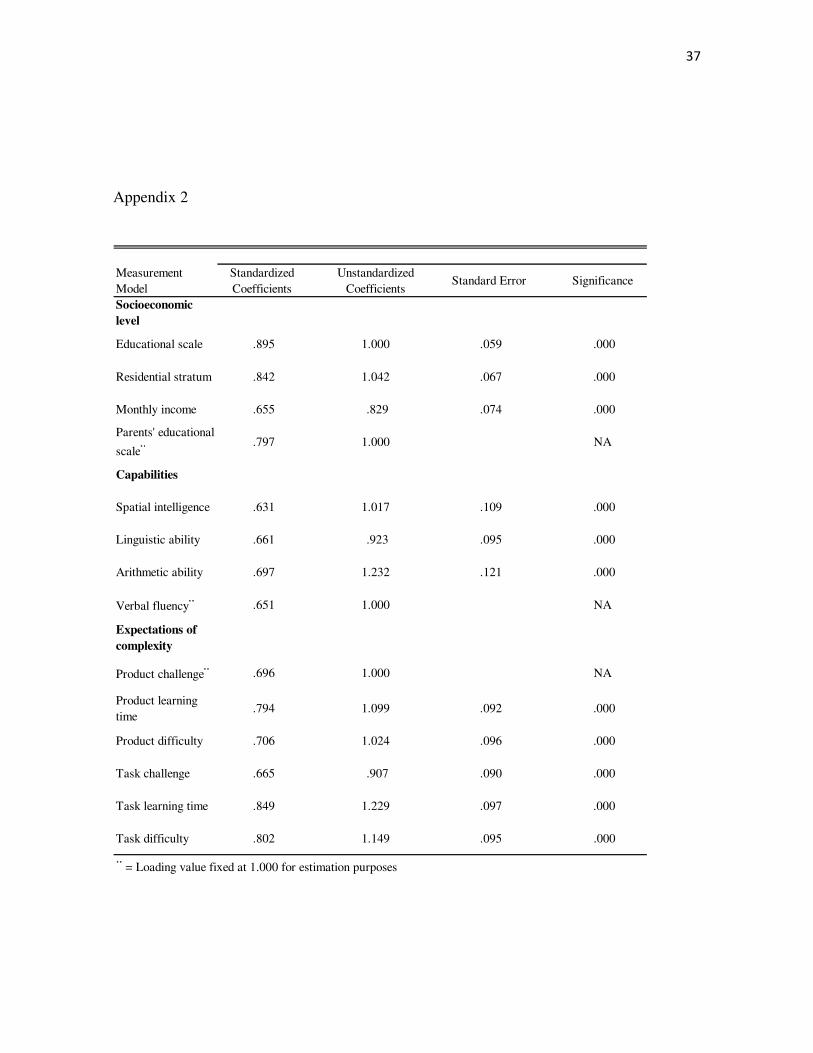
Appendix 2
Measurement
Model
Standardized
Coefficients
Unstandardized
CoefficientsStandard Error Significance
Socioeconomic
level
Educational scale .895 1.000 .059 .000
Residential stratum .842 1.042 .067 .000
Monthly income .655 .829 .074 .000
Parents' educational
scale¨ .797 1.000 NA
Capabilities
Spatial intelligence .631 1.017 .109 .000
Linguistic ability .661 .923 .095 .000
Arithmetic ability .697 1.232 .121 .000
Verbal fluency¨ .651 1.000 NA
Expectations of
complexity
Product challenge¨ .696 1.000 NA
Product learning
time .794 1.099 .092 .000
Product difficulty .706 1.024 .096 .000
Task challenge .665 .907 .090 .000
Task learning time .849 1.229 .097 .000
Task difficulty .802 1.149 .095 .000
¨ = Loading value fixed at 1.000 for estimation purposes
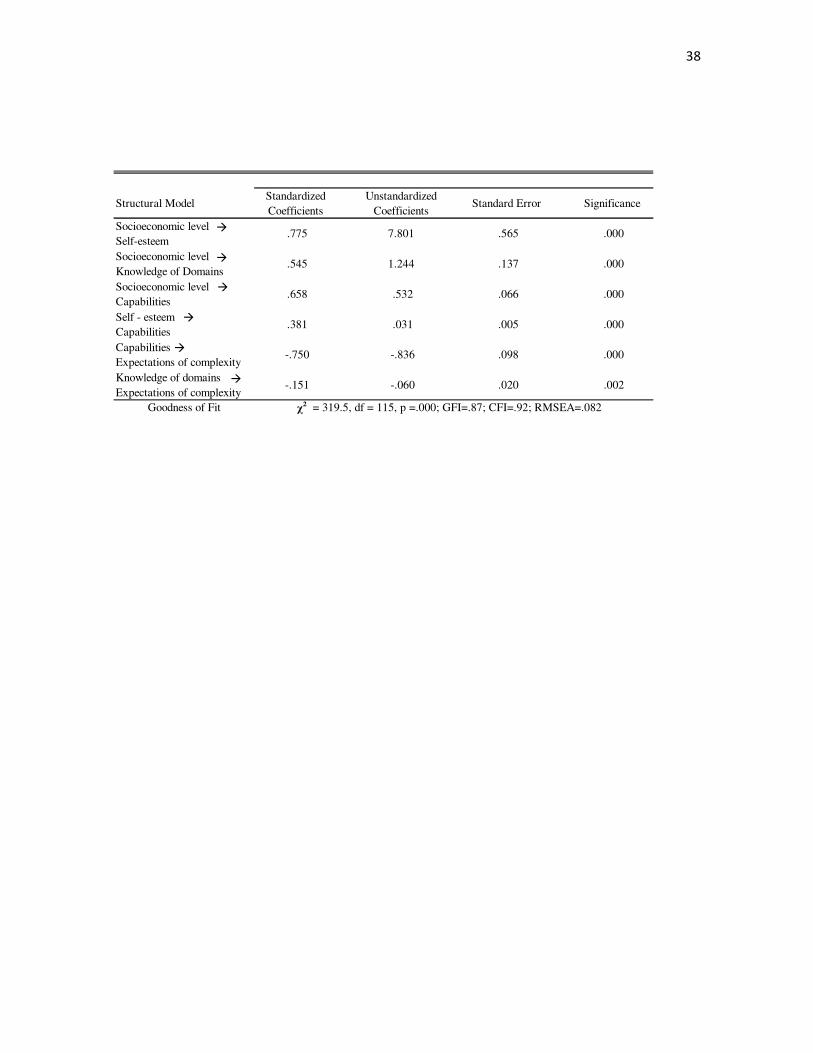
38
Structural ModelStandardized
Coefficients
Unstandardized
CoefficientsStandard Error Significance
Socioeconomic level
Self-esteem .775 7.801 .565 .000
Socioeconomic level
Knowledge of Domains .545 1.244 .137 .000
Socioeconomic level
Capabilities .658 .532 .066 .000
Self - esteem
Capabilities .381 .031 .005 .000
Capabilities
Expectations of complexity -.750 -.836 .098 .000
Knowledge of domains
Expectations of complexity -.151 -.060 .020 .002
Goodness of Fit = 319.5, df = 115, p =.000; GFI=.87; CFI=.92; RMSEA=.082
�
�
�
�
�
�
χ2