Embed Size (px)
Citation preview

THE EFFECT OF CHANGES IN INTEREST RATES ON THE DEMAND FOR
CREDIT AND LOAN REPAYMENTS BY SMALL AND MEDIUM
ENTERPRISES IN KENYA
BY
LILIAN AWINO ODHIAMBO
A RESEARCH PROJECT PRESENTED TO THE SCHOOL OF BUSINESS, UNIVERSITY
OF NAIROBI, IN PARTIAL FULFILMENT OF THE REQUIREMENTS FOR THE AWARD
OF THE DEGREE OF MASTER OF BUSINESS ADMINISTRATION.
2013

i
DECLARATION
This research project is my original work and has not been presented for award of degree in any
other University.
Signed………………………………. Date………………………………
Name: Lilian Awino Odhiambo
Registration Number: D61/63371/2011
This research project has been submitted for examination with my approval as the University
supervisor.
Signed………………………………. Date………………………………
Name: Mrs. Winnie Nyamute
Lecturer Department of Finance and Accounting
School of Business
University of Nairobi

ii
ACKNOWLEDGEMENTS
First and foremost I give thanks to my God Almighty for giving me good health, peace and
financial provision to undertake this course. I also thank the Lord for having given me good
associations throughout this study. I look back and proclaim that surely He has been my
―Ebenezer‖.
I give my sincere thanks to my family both immediate and extended, for believing in me and
encouraging me to go forward on my quest to attain this degree. I recognize my mother
Margaret, for keeping me in her prayers throughout.
I am greatly indebted to my supervisor Mrs. Winnie Nyamute. She has been patient and kind in
guiding me throughout the study. She also offered me constructive criticisms, encouragement
and useful suggestions. I also owe a great deal to my moderators Mr. Herick Ondigo and Mr.
Mirie Mwangi for keeping me on track on this project
I am also deeply indebted to my former and current managers in my former and current work
stations, Mr. Charles Mutunga and Mr. Ben Wandawanda respectively for all their support that
they accorded me to ensure I complete this course appropriately.
I acknowledge the support of my classmates and friends with whom we were together in this
journey. Most importantly, I feel deeply indebted to Jesse, Rugendo and Silas for all the support
and encouragement they gave me throughout.
Finally, may I state that I am solely accountable for any flaws in this contribution to academic
endeavour.

iii
DEDICATION
This is a special dedication to my beloved husband Shem, son Beckham and daughter Valerie.
As a family, we have come a long way and we are still going far. I love you so much and I trust
that God being our guide we shall live to see more of His goodness in our lives. Thank you for
your thoughtfulness, well wishes and continuous prayers. Thank you for your unconditional love.

iv
ABSTRACT
The Small and Medium Enterprise (SME) Sector has continued to play an important role in the
economy of this country. The sector‘s contribution to the Gross Domestic Product (GDP) has
increased from 13.8 per cent in 1993 to about 40 per cent in 2008. It is agreed that most SMEs
heavily depend upon bank loans and generally experience a ‗financing gap,‘ even in developed
countries. This financing gap, often defined as the difference between the demand for funds by
SMEs and the supply of funds, occurs because of various reasons. It is on this premise that the
researcher sought to study the effects of changes in interest rates on the demand for credit and
loan repayment by SMEs in Kenya. The main objectives were to determine interest rates
influence the demand for credit by SMEs in Kenya and also establish whether interest rates
influence the repayment of loans by SMEs in Kenya. The study targeted the 43 banks in Kenya
and various sectors under SMEs in Kenya namely; Agriculture, Manufacturing, Building &
Construction, Mining, Energy & Water, Trade, Tourism, Hotel & Restaurant, Transport &
Communication, Real Estate and Financial Services. This represented the population and the
sample. Secondary data was obtained from CBK supervisory report‘s financial statements and
analyzed further. The data covered a period of 5 years from 2008 to 2012. Descriptive approach
was used to determine the weights of the variables. Interpretation of data was done using SPSS
and MS Excel. Inferential statistics involving use of ANOVA and regression analysis was
done.The study concluded that high interest rates do not necessarily affect the demand for credit.
It was observed that high interest rates were not a major concern for SMEs. In this study, SMEs
still had a high demand for credit even at annual interest rate of 21.75% in the year 2011 and
even a higher demand for credit at an annual interest rate of 18.1%. Those who are willing to pay
high interest rates may, on average, be worse risks; they are willing to borrow at high interest
rates because they perceive their probability of repaying the loan is low. The researcher
therefore concluded that the repayment ability of SMEs is directly affected by changes in interest
rates. Looking at the analysis, the researcher noted that the year 2011 was most harsh in terms of
changes in interest rates. It is in the same year that categorization of loan repayment ability also
changed sharply. The researcher recommends that further research be done to investigate why
the demand for credit is high despite high interest rates. It would be expected that the demand for
credit reduces with increase in interest rates. There is more room to come up with other reasons
that cause this position to arise. It is not clear whether SMEs would increase demand for credit to
be able to execute their projects even in the event they may not be optimal and considering the
fact that it is difficult for SMEs to get financing from financial institutions.

v
TABLE OF CONTENTS
DECLARATION............................................................................................................................ i
ACKNOWLEDGEMENTS ......................................................................................................... ii
DEDICATION.............................................................................................................................. iii
ABSTRACT .................................................................................................................................. iv
ABBREVIATIONS .................................................................................................................... viii
LIST OF TABLES ....................................................................................................................... ix
LIST OF FIGURES ...................................................................................................................... x
CHAPTER ONE: INTRODUCTION ......................................................................................... 1
1.1 Background of the Study ....................................................................................................... 1
1.1.1 Changes in Interest Rates ............................................................................................... 4
1.1.2 Demand for Credit .......................................................................................................... 5
1.1.3 Loan Repayment ............................................................................................................. 6
1.1.4 Effect of Changes in Interest Rate on Demand for Credit and Loan Repayment ........... 8
1.1.5 SME in Kenya ................................................................................................................. 9
1.2 Research Problem .................................................................................................................. 9
1.3 Research Objectives ............................................................................................................ 12
1.4 Value of the Study ............................................................................................................... 12
CHAPTER TWO: LITERATURE REVIEW .......................................................................... 14
2.1 Introduction ......................................................................................................................... 14
2.2 Theoretical Review of Study ............................................................................................... 14

vi
2.2.1 The Theory of Credit Market ........................................................................................ 14
2.2.2. Traditional Theory ....................................................................................................... 16
2.2.3 Liquidity Theory ........................................................................................................... 17
2.3 Conceptual Framework ....................................................................................................... 18
2.4 The Nature and Characteristics of SMEs ............................................................................ 18
2.4.1 Promoting SMEs in Kenya ........................................................................................... 19
2.4.2 Constraints faced by SMEs in Accessing Credit .......................................................... 20
2.4.3 Sources of Finances for SMEs ...................................................................................... 21
2.5 Relationship of Interest Rates, Demand for Credit and Loan Repayments ........................ 24
2.5.1 Determinants of Interest Rates ..................................................................................... 24
2.5.2 SMEs Demand for Credit ............................................................................................. 28
2.5.3 Credit Risk .................................................................................................................... 30
2.5.4 Non - Performing Loans (NPLs) .................................................................................. 31
2.6 Empirical Review ................................................................................................................ 33
2.7 Summary of Literature Review ........................................................................................... 40
CHAPTER THREE: RESEARCH METHODOLOGY ......................................................... 43
3.1 Introduction ......................................................................................................................... 43
3.2 Research design ................................................................................................................... 43
3.3 Population and Sample ........................................................................................................ 43
3.4 Data collection..................................................................................................................... 44
3.4.1 Reliability...................................................................................................................... 44
3.4.2 Validity.......................................................................................................................... 44
3.5 Data Analysis ...................................................................................................................... 45

vii
CHAPTER FOUR: DATA ANALYSIS, RESULTS AND DISCUSSION ............................ 48
4.1 Introduction ......................................................................................................................... 48
4.2 Data Analysis ...................................................................................................................... 48
4.2.1 Non-performing Loans in each SME sector ................................................................. 48
4.2.2 Prevailing Lending Interest rates charged by the Commercial Banks ......................... 49
4.2.3 Repayment Ability ......................................................................................................... 50
4.2.4 Growth of Loans Demanded ......................................................................................... 56
4.2.5 Estimated or Empirical Model ..................................................................................... 56
4.3 Results and Discussion ........................................................................................................ 59
CHAPTER FIVE: SUMMARY, CONCLUSION AND RECOMMENDATIONS .............. 61
5.1 Introduction ......................................................................................................................... 61
5.2 Summary of the Study ......................................................................................................... 61
5.3 Conclusion ........................................................................................................................... 62
5.4 Limitations of the Study ...................................................................................................... 64
5.5 Recommendations ............................................................................................................... 65
5.5.1 Policy Recommendations .............................................................................................. 65
5.5.2 Suggestions for Further Research ................................................................................ 65
REFERENCES ............................................................................................................................ 67
APPENDICES ............................................................................................................................. 70

viii
ABBREVIATIONS
ANOVA Analysis of Variance
BB Bank of Bangladesh
BSB Bangladesh Shilpa Bank
CBK Central Bank of Kenya
CBR Central Bank Rate
CMA Capital Markets Authority
DFI Development Financial Institution
GOB Government of Bangladesh
GDP Gross Domestic Product
IFC International Finance Corporation
KNBS Kenya National Bureau of Statistics
MFI Micro Financial Institutions
MPC Monetary Policy Committee
NBFI Non-Bank Financial Institutions
NSE Nairobi Securities Exchange
NPA Non-Performing Assets
NPL Non-Performing Loans
OTC Over the Counter
SMEs Small and Medium Enterprises

ix
LIST OF TABLES
Table 1: Repayment Ability .......................................................................................................... 50
Table 2: Growth of Loans Demanded ........................................................................................... 56
Table 3: Credit Demand ................................................................................................................ 56
Table 4: Non Performing Loans ................................................................................................... 58

x
LIST OF FIGURES
Figure 1: Conceptual Framework ................................................................................................. 18
Figure 2: Non-performing Loan as per SME ................................................................................ 48
Figure 3: Prevailing Interest Rates as Charged by Commercial Banks ........................................ 49
Figure 4: Repayment Ability in Pie Charts ................................................................................... 51

1
CHAPTER ONE: INTRODUCTION
1.1 Background of the Study
Beaver (2002), found out that small and medium enterprises (SME‘s) are much easier to describe
than to define. Further that there is no generally accepted operational or numerical definition of
what constitute an SME. Countries and in many cases individual institutions within them have
developed classifications and definitions that reflect the nature and compositions of that
country‘s settings. Definitions may also reflect the nature and context of the industrial sector or
the market under consideration. For example different criteria would be considered appropriate
for firms engaged in manufacturing, construction, retailing hospitality and tourism, and
professional services among other.
There is no standard definition of SME in Kenya. Lenders‘ definitions vary, but typically they
define SMEs as businesses with six to 50 employees or with annual revenues less than 50 million
Kenya shillings. Regardless of quantitative definition, it is agreed by virtually all stakeholders in
this market that SMEs in Kenya are the ―missing middle‖. Their size and credit demand have
outgrown the capacity of microfinance institutions, which offer small, short loans via group-
lending methodologies, while the opacity of the SME risk profile - combined with the lenders‘
lack of sophisticated risk assessment techniques - makes many of them appear undesirable as
credit customers for business banking (Snyder, 2008). More than 90% of all enterprises in the
world are SMEs. SMEs consist of firms varying widely in size and characteristics, namely from
very small start-up firms in an infant stage of development to established SMEs already listed on
the stock market. It is agreed that most SMEs heavily depend upon bank loans and generally
experience a ‗financing gap,‘ even in developed countries. This financing gap, often defined as
2
the difference between the demand for funds by SMEs and the supply of funds, occurs because
of various reasons. Research suggests that the fundamental reasons behind SMEs‘ lack of access
to funds can be found in their peculiar characteristics, in addition to the fact that SMEs suffer
from financing gaps because of market imperfections on the supply side. In reality, SMEs face
financing gaps probably because of a combination of reasons originating from both the supply
and demand sides. This financing gap for SMEs is most prominent in capital market financing
and most countries, including developed ones, have problems in SME financing through capital
markets (CMA, 2010).
The Small and Medium Enterprise (SME) Sector has continued to play an important role in the
economy of this country. The sector‘s contribution to the Gross Domestic Product (GDP) has
increased from 13.8 per cent in 1993 to about 40 per cent in 2008. The main challenges facing
SMEs in Kenya include overlap and inconsistencies in legal and sectoral policies, lack of clear
boundaries in the institutional mandates, lack of a suitable legal framework, outdated council by-
laws, unavailability of land and worksites, exclusion of local authorities in policy development,
lack of access to credit, lack of a central coordination mechanism, lack of a devolved
coordination and implementation mechanism. The paper also finds that the main impediments to
SME securities offerings in Kenya include company law limitations, stringent listing
requirements at the NSE, lack of a formal OTC market, control concerns and tax and disclosure
concerns and makes recommendations on how to improve the current situation (CMA, 2010).
From an economic perspective, however, enterprises are not just suppliers, but also consumers.
This plays an important role if they are to position themselves in a market with purchasing
power: their demand for industrial or consumer goods will stimulate the activity of their
suppliers, just as their own activity is stimulated by the demand of their clients. Demand in the

3
form of investment plays a dual role, both from a demand-side with regard to the suppliers of
industrial goods and on the supply-side through the potential for new production arising from
upgraded equipment (Ackah & Vuvor, 2011).
A move away from bank intermediation towards funding in the capital markets has long been
considered a long-term objective of many countries. When companies are in the growth phase,
they tend to get leveraged. Beyond a certain point, banks are reluctant to provide further credit.
Equity capital is required to bring strength to the leveraged balance sheet. At this point, either the
promoter will have to self-provide for injecting in the requisite levels of equity or would have to
do without the capital, which in turn would kill the impetus of growth. Having the option of
equity financing through the equity market, allows the firm not only to raise long-term capital
but also to get further credit due to additional equity cushion now being available. If successful,
this approach would address the chronic lack of long-term credit available to SMEs. This
promising move, however, has many hurdles until its full implementation. The first hurdle to
overcome is having an adequately developed capital market in terms of depth and liquidity.
Second, SMEs, in essence, have relatively high credit risk. While SMEs have high growth
potential, they are also more vulnerable to sudden changes in the economic and competitive
environment. Third, there exists severe information asymmetry in this segment of enterprises.
SMEs‘ corporate information is often nonexistent, or comes with very high access costs in many
economies. Fourth, SME financing is inherently associated with a higher unit cost when
compared with that of large corporations. The relatively smaller size of funding, as well as
higher information and monitoring costs, leads to higher implementation costs per deal when
processing finance in capital markets (CMA, 2010).

4
The debate on whether there has been a higher or lower interest rate is better appreciated by
looking at the context in which interest rate is defined and the trend of interest rate in the
worldwide financial and economic crisis of 2007/2008 and the period of economic reforms from
2009 to date. There are different interest rates, namely, lending/borrowing, deposit rate, among
others. This study will focus on the lending rate to establish the relationship between interest rate
and demand for credit and loans by SMEs (Aduda, Magutu, & Wangu, 2012). The lending policy
of the lending institutions does not seem to give much weight to the SMEs due to several factors
such as preference being given to high yield risk-free treasury bills. Financial institutions also
de-emphasize collateral security as a condition for granting loans in rural areas. For the few who
manage to secure the loans, sometimes interest rises to over 25% per annum. Access to medium
to long- term financing necessary for capital investment is still tight (Amonoo, Acquah, &
Asmah, 2003).
1.1.1 Changes in Interest Rates
Interest rate is the price a borrower pays for the use of money they borrow from a
lender/financial institutions or fee paid on borrowed assets. Interest can be thought of as "rent of
money". Interest rates are fundamental to a ‗capitalist society‘ and are normally expressed as a
percentage rate over the period of one year. Interest rate as a price of money reflects market
information regarding expected change in the purchasing power of money or future inflation
(Ng‘etich & Wanjau, 2011). A bank‘s interest rate risk reflects the extent to which its financial
condition is affected by changes in market interest rates. There are two different ways of thinking
about such effects. The first approach focuses on the impact of changes in market interest rates
on the value of bank assets, liabilities and off balance sheet positions (potentially including those

5
that are not marked to market for reporting purposes), and so arrives at an overall assessment of
the impact of changes in market interest rates on the economic value of the bank.
The second approach focuses on the implications of movements in market rates for the future
cash flows that the bank will obtain. Since the present discounted value of the bank‘s cash flows
must equal the economic value of the bank, these two approaches are consistent and both can be
useful. For example, a focus on flows may suggest impending liquidity problems as cash flow
dwindles. The existence of a causal relationship between changes in money growth and changes
in both the inflation rate and the nominal interest rate is generally acknowledged. However, less
agreement exists on the timing and magnitude of the response of inflation and the nominal
interest rate to money shocks. Many economists believe that a positive shock to money growth
brings about two opposing effects on the nominal interest rate. The first, known as the liquidity
effect, is the fall in the nominal interest rate necessary to induce agents to hold additional real
money balances. The second, known as the anticipated inflation effect, is the rise in the nominal
interest rate due to the increase in expected inflation brought about by the increase in money
growth. In the short run, it is often argued that the liquidity effect dominates the anticipated
inflation effect. There is less agreement on the long-run effect of money shocks on interest rates.
The time period required for the inflation resulting from money growth shocks to be fully
realized, and whether the nominal interest rate moves one to one with expected inflation, are
both unsettled questions that have stimulated a considerable body of research.
1.1.2 Demand for Credit
Amonoo et al, (2003) argued that the role of credit is to bridge the gap between enterprise
owner‘s financial assets and the required financial assets of the enterprise. Due to the persistence
of this imbalance, enterprises are forced to demand credit. Demand for credit can be categorized

6
into perceived, potential and revealed demand. Perceived demand is represented by a situation
where enterprises that assume to be in need of cash, mention finance as a constraint. Potential
demand is characterized by a desire for credit which is not actualized due to market
imperfections and institutional barriers. Revealed demand is characterized as written application
for financial support at a given rate of interest. Our measure of credit demand is an indicator
variable for a firm‘s need for bank loans decreasing during the period. We measure credit supply
using information on whether a firm‘s loan application was rejected, or the firm received less
than 75% of its desired amount. On credit conditions, we use an indicator for an increase in the
interest rate charged on the firm‘s loans, and for whether the size of loan available to a firm had
increased.
Fewer than 20 percent of small to medium sized enterprises (SMEs) in Kenya have ever received
credit from formal financial institutions. Access is limited due to challenges in assessing SME
risk in a cost-effective manner. Lenders in Kenya address this risk-assessment problem either by
not lending to SMEs at all or by requiring collateral and charging high interest rates. High-
income countries, such as the United States, have addressed this challenge in part by using credit
scoring. Credit scoring has the potential to offer a number of benefits which can improve access
to credit for SMEs. There are also a number of prerequisites that must be in place, however, in
order to fully realize the potential benefits of an effective risk management strategy that
incorporates credit scoring (Snyder, 2008).
1.1.3 Loan Repayment
This is the Expected Monthly Installment of the loan that includes the loan principal and the
interest element. (Stiglitz & Weiss, 1981) The interest rate a bank charges may itself affect the
riskiness of the pool of loans by either adverse selection or moral hazard. Both effects derive

7
directly from the residual imperfect information which is present in loan markets after banks
have evaluated loan applications. The adverse selection aspect of interest rates is a consequence
of different borrowers having different probabilities of repaying their loans.
The expected returns to the bank obviously depend on the probability of repayment, so the bank
would like to be able to identify borrowers who are likely to repay. It is difficult to identify
―good borrowers‖ and to do so require the bank to use a variety of screening devices. The
interest rate which an individual is willing to pay may act as one such screening device: those
who are willing to pay high interest rates may, on average, be worse risks; they are willing to
borrow at high interest rates because the perceive their probability of repaying the loan is low.
As the interest rates rises, the average ―riskiness‖ of those who borrow increases, possibly
lowering the bank‘s profits. Similarly, as the interest rate and other terms of the contract change,
the behavior of the borrower is likely to change. For instance, raising the interest rate decreases
the return on projects with lower probabilities of success but higher pay offs when successful. In
a world with perfect and costless information, the bank would stipulate precisely all the actions
which the Borrower could undertake (which might affect the return to the loan). However, the
bank is not able to directly control all the actions of the borrower; therefore, it will formulate the
terms of the loan contract in a manner designed to induce the Borrower to take actions which are
of interest of the bank, as well as to attract low-risk borrowers. Amonoo et al, (2003) argued that
lenders of funds in the formal financial sector use the deposits of their clients whilst lenders
operating in the informal sector use mainly their own funds to advance money to borrowers. In
either case, the transactions are expected to lead to recouping the financial capital. If this does
not happen, borrowers benefit at the expense of lenders. Assuming this continues, bankruptcy
will be the ultimate result and this will reduce financial intermediation.

8
1.1.4 Effect of Changes in Interest Rate on Demand for Credit and Loan Repayment
In Kenya, the interest rates charged by banks are determined by: interest rate on deposits; cost of
liquidity; cost of holding cash; and operational costs. The interest on deposits depends on the
bank‘s cash ratio, its overall financial stability and the type of the bank for example whether it is
a corporate bank or a network bank. The cost of liquidity covers both the cash, which is
maintained by the banks with Central Bank as required cash ratio, and the cash maintained by the
banks as the minimum amounts to meet unexpected demand from the customers. Cost of holding
cash is derived from the cash held by the banks in form of liquid form to meet day-to-day
customer‘s needs. The banks have to compare the costs of cash outs and the opportunity costs
associated with the cash held in liquid form. Operational costs are mainly meant to cover the
costs of running the bank and it includes capital costs, staff costs, and technology costs. The base
rate charged by the banks takes into account all these factors. The commercial banks then
communicate their lending rate which then takes the SMEs to gauge their business need and their
business risks thereby creating the demand for credit.
The capability of borrowers to repay their microcredit loans is an important issue that needs
attention. Borrowers can either repay their loan or choose to default. Borrower defaults may be
voluntary or involuntary. Involuntary defaults of borrowed funds could be caused by unexpected
circumstances occurring in the borrower‘s business that affect their ability to repay the loan.
Unexpected circumstances include lower business revenue generated, natural disasters and
borrowers‘ illness. In contrast, voluntary default is related to morally hazardous behaviour by the
borrower. In this category, the borrower has the ability to repay the borrowed funds but refuses
to because of the low level of enforcement mechanisms used by the institution. Research has
shown that a group lending mechanism is effective in reducing borrower defaults.

9
1.1.5 SME in Kenya
The sector therefore plays a key role in employment creation, income generation and is the
bedrock for industrializing the Country in the near future. Due to their characteristics, SMEs in
Kenya suffer from constraints that lower their resilience to risk and prevent them from growing
and attaining economies of scale. The challenges are not only in the areas of financing
investment and working capital, but also in human resource development, market access, and
access to modern technology and information. Access to financial resources is constrained by
both internal and external factors. Internally, most SMEs lack creditworthiness and management
capacity, so they have trouble securing funds for their business activities such as procuring raw
materials and products, and investing in plant and equipment. From the external perspective,
collateral and have the capacity to absorb only small amount of funds from financial institutions.
Therefore, they are rationed out in their access to credit because of high intermediation costs,
including the cost of monitoring and enforcement of loan contracts.
Some small business managers tend to be restrictive when it comes to providing external
financiers with detailed information about the core of the business, since they believe in one way
or the other, information about their business may leak through to competitors. Aside their
unwillingness to disclose information to financiers, SMEs in Ghana are also faced with the
challenge of proper book keeping practices that makes it difficult for financiers who are even
willing to assist to do so (Ackah & Vuvoh, 2011)
1.2 Research Problem
Despite the role of SMEs in the Kenyan economy, the financial constraints they face in their
operations are daunting and this has had a negative impact on their development and also limited
their potential to drive the national economy as expected. It is agreed that most SMEs heavily

10
depend upon bank loans and generally experience a ‗financing gap,‘ even in developed countries.
This financing gap, often defined as the difference between the demand for funds by SMEs and
the supply of funds, occurs because of various reasons. Research suggests that the fundamental
reasons behind SMEs‘ lack of access to funds can be found in their peculiar characteristics, in
addition to the fact that SMEs suffer from financing gaps because of market imperfections on the
supply side. In reality, SMEs face financing gaps probably because of a combination of reasons
originating from both the supply and demand sides. This financing problem in relation to the
nature of SMEs was the major problem that informed this study.
Amonoo et al, (2003) in their study on the impact of interest rates on demand for credit and loan
repayment b the poor and SMEs in Ghana. They interviewed 50 SMEs and 25 financial
institutions. The study showed how the interplay of interest rates, annual profits and owner‘s
equity affect the credit demand by the poor and SMEs. The results indicated that there is a
negative relationship between interest rates and demand for loans. The analysis demonstrated
that owner‘s contribution to capital, to a large extent determines the weight which the lending
institution attaches to lending to SMEs. The causes of poor loan recovery as revealed by the
financial institutions are high interest rates, poor appraisal and lack of monitoring, late
disbursements and the negative attitudes towards loans. The high interest rates of about 45%
affects the ability of the poor and SMEs to service their loans. It heightens the incidence of
default and constraints the lending institutions ability to advance loans to SMEs. Coleman (2000)
in his study on the access to capital and terms of credit: a comparison of men and women owned
small businesses, argued that most SMEs in the country lack the capacity in terms of qualified
personnel to manage their activities. As a result, they are unable to publish the same quality of
financial information as those big firms and as such are not able to provide audited financial

11
statement, which is one of the essential requirements in accessing credit from the financial
institution. This is buttressed by the statement that privately held firms do not publish the same
quantity or quality of financial information that publicly held firms are required to produce. As a
result, information on their financial condition, earnings, and earnings prospect may be
incomplete or inaccurate. Faced with this type of uncertainty, a lender may deny credit,
sometimes to the firms that are credit worthy but unable to report their results. The financial
sector deepening report compiled by Snyder (2008) on potential of credit lending to SMEs based
on credit scoring revealed that little information on borrowers is known to creditors. Some banks
therefore developed internal models to gauge the risks of lending to SMEs which does not have
the true picture of SMEs hence limiting access or resutling to high interest rates that discourage
SMEs from borrowing. The recommended remedy was to establish credit bureaus that will
furnish creditors with positive and negative repayment information of borrowers.
While analyzing the need for credit scoring practices for lending SMEs in Kenya, Aduda et al,
(2012) argued that information gathered has important implications for the nature of credit
contracts; the ability of credit markets to match borrowers and lenders efficiently and the policy
on the rate of interest allocated to credit among borrowers. However, approval of credit to SMEs
via credit scoring only constitutes 19.4%. The remaining percentage is determined by other
factors that this research will strive to unravel. Bichanga & Aseyo, (2013) in their study on
causes of loan default within micro-finance institutions in Kenya, sought to analyze how non-
supervision of borrowers, effects of shrinking economic growth and how diversion of funds by
borrowers leads to default in loan repayment. The target population comprised a total of 400 loan
borrowers and 200 MFIs out of which a sample of 150 was picked using simple random
sampling. The data was analyzed from questionnaires using both quantitative and qualitative

12
techniques and tabulated by use of frequency tables. The study found out that loan repayment
default was as result of non-supervision of borrowers by the MFIs, and also as a result of
inadequate training of borrowers on utilization of loan funds before they received loans. The
findings also revealed that most borrowers did not spend the loan amount on intended and agreed
projects.
To address the research gaps highlighted by scholars cited above, the study sought to answer the
questions whether interest rate influence the demand for credit by the SMEs in Kenya and
whether changes in interest rates affect the repayment of loans by SMEs in Kenya
1.3 Research Objectives
The overall objective of the study is to determine the effect of changes in interest rate on demand
and credit or loan repayments by SMEs in Kenya. The specific objectives are outlined below: -
i. To establish whether interest rate influence the demand for credit by the SMEs in Kenya.
ii. To determine the effects of changes in interest rate on the repayment of loans by SMEs in
Kenya.
1.4 Value of the Study
The findings of this study will be of benefit to:
Borrowers
Borrowers will be able to appreciate the parameters on how the financial institutions analyse
their credit ability. Keeping this information will raise their eligibility for higher credit than the
current situation.
The Government

13
The Government through the Regulator can derive insights into how the various interplays in the
economy directly affect the business world and eventually the income to the state in form of
taxes.
Commercial banks
Commercial banks can also appreciate how the industry is as a whole and how the sector
performs in line with the changes that surround interest rate risk.
Academicians
Academicians will synthesize the ideas presented, will develop new ways of generating and
expanding knowledge on the subject matter.

14
CHAPTER TWO: LITERATURE REVIEW
2.1 Introduction
This chapter explores the different theories that inform interest rates demand of credit and loan
repayment, like the theory of credit market, the traditional theory and the liquidity theory. The
chapter also looks at SMEs and their operations, depicting their contributions to the economy,
their sources of financing and the difficulties they experience in accessing credit facilities, the
interest rates settings and changes and what entails loan repayment. Finally, it also appreciates
empirical review that other researchers have done regarding this area of interest and a summary.
2.2 Theoretical Review of Study
Several theories have been put forward which have implications on credit risk management.
Interest rates theories recognize that interest rates have an effect on credit risk because the higher
the interest rate the higher the risk that the loan might not be repaid and thus the higher the credit
risk.
2.2.1 The Theory of Credit Market
This theory postulates asymmetric information as the cause of poor workings of financial
markets in developing countries. The imperfect information unleashes two outcomes namely
adverse selection and moral hazard. Two main features of the model can be formulated as
follows; lenders allocate monies to projects which are risky and may not be bankable, and credits
are given out at the costs which are equal to the opportunity cost of funds, for example the
supply price paid to savings or fixed depositors. The pioneering work of (Stiglitz & Weiss, 1981)
marked the beginning of attempts at explanations of credit rationing in credit markets. In this
explanation, interest rates charged by a credit institution are seen as having a dual role of sorting

15
potential borrowers (leading to adverse selection), and affecting the actions of borrowers
(leading to the incentive effect). Interest rates thus affect the nature of the transaction and do not
necessarily clear the market. Both effects are seen as a result of the imperfect information
inherent in credit markets. Adverse selection occurs because lenders would like to identify the
borrowers most likely to repay their loans since the banks‘ expected returns depend on the
probability of repayment. In an attempt to identify borrowers with high probability of repayment,
banks are likely to use the interest rates that an individual is willing to pay as a screening device.
The adverse selection aspect of interest rates is a consequence of different borrowers having
different probabilities of repaying their loans. The expected returns to the bank obviously depend
on the probability of repayment, so the bank would like to be able to identify borrowers who are
likely to repay. It is difficult to identify ―good borrowers‖ and to do so require the bank to use a
variety of screening devices. The interest rate which an individual is willing to pay may act as
one such screening device: those who are willing to pay high interest rates may, on average, be
worse risks; they are willing to borrow at high interest rates because the perceive their
probability of repaying the loan is low. As the interest rates rises, the average ―riskiness‖ of
those who borrow increases possibly lowering the bank‘s profits. Similarly, as the interest rate
and other terms of the contract change, the behavior of the borrower is likely to change. For
instance, raising the interest rate decreases the return on projects with lower probabilities of
success but higher pay offs when successful. In a world with perfect and costless information,
the bank would stipulate precisely all the actions which the Borrower could undertake (which
might affect the return to the loan). However, the bank is not able to directly control all the
actions of the borrower; therefore, it will formulate the terms of the loan contract in a manner

16
designed to induce the Borrower to take actions which are of interest of the bank, as well as to
attract low-risk borrowers.
Adverse Selection can be explained as follows: ex-ante, it is assumed that borrowers of money
know better the risks associated with their projects. The individual with a high-risk project may
succeed in getting credit at a high rate of interest. At this high rate of interest, an individual with
less risk project may be refused credit because it will not make the business viable and threaten
his/her loan repayment potential. If the interest rate is raised and the borrower with a higher risk
is favoured and defaults, this will threaten the capital base of the lender. Lenders who want to
minimize risk will give out their funds at lower rather than higher rates of interest. A realignment
of the average quality of the lender‘s loan portfolio may mean that interest rate mechanism will
not bring about market rate equilibrium; rather rationing of access to credit at a lower interest
rate will follow. If lenders do not maintain different portfolios, interest rates will rise faster.
Moral hazard phenomenon is part of the problem of imperfect information concerning
borrower‘s actions. It is the misapplication of borrowed funds that shifts the risk to the lender,
especially, if the project does not succeed. Borrowers may be tempted to divert approved loans to
other projects with high risk, thereby reducing loan repayment possibility. Lenders may refuse to
take actions that will enhance loan repayment due to incentives and reinforcement problems
(Amonoo et al, 2003). If the moral hazard phenomenon occurs, solution advocated by the model
is credit rationing.
2.2.2. Traditional Theory
Traditional theory defines interest rate as the price of savings determined by demand and supply
of loanable funds. It is the rate at which savings are equal to investment assuming the existence

17
of a capital market. The loanable fund theory argues that interest rate is determined by non-
monetary factors. It assigns no role to quantity of money or level of income on savings, or to
institutional factors such as commercial banks and the government. From the traditional theory,
nominal interest rates adjust fully to the expected rate of inflation leaving real interest rates
unchanged. In his works, Irving Fisher held the same sentiments. He believed that there is a
positive relationship between expected future price increases and nominal interest rate. An
increase in price increases the nominal value of trade, resulting in an increase in demand for
money and leading to an increase in nominal interest rate. Irving Fisher‘s theory is controversial,
however, particularly when it is interpreted as suggesting a constant real interest rate. Earlier
studies estimated the Fisher effect, i.e., the amount of change in nominal rates resulting from a
change in the expected rate of inflation by basing their theoretical expression on nominal interest
rates as the sum of the real interest rates and expected inflation and a residual term.
2.2.3 Liquidity Theory
The liquidity theory, on the other hand, looks at the interest rate as the token paid for abstinence
and inconveniences experienced for having to part with an asset whose liquidity is very high. It
is a price that equilibrates the desire to hold wealth in the form of cash with the available
quantity of cash, and not a reward of savings. Interest rate is a function of income. Its primary
role is to help mobilize financial resources and ensure the efficient utilization of resources in the
promotion of economic growth and development (Ngugi and Kabubo, 1998).

18
2.3 Conceptual Framework
A conceptual framework is a collection of inter related group of ideas that are broad based on
theories. That is, a set of prepositions, which are derived from and supported by data or evidence
taken from fields of inquiry that are relevant (Masese, 2011).Based on the reviewed literature,
this study proposes a conceptual framework in which the dependent variables are Demand for
credit and Loan repayment and the independent variable is Interest rates. The conceptual
framework is shown in figure 1 below and is presented in a model form expressing Credit
Demand and Loan Repayment as functions of Interest Rates as depicted in the linear regression
model in 3.6 of chapter three.
Figure 1: Conceptual Framework
Independent Variables Dependent Variables
Source: (Author, 2013)
2.4 The Nature and Characteristics of SMEs
A distinguishing feature of SMEs from larger firms is that the latter have direct access to
international and local capital markets whereas the former are excluded because of the higher
intermediation costs of smaller projects. The age of SMEs in Kenya have an average life of 15
years of existence. Thus, the firms are not transient which is what one would find by examining
enterprises in the service sector where the needed start-up capital is much smaller. On education
Interest rate Credit Demand
Loan Repayment

19
background, many entrepreneurs running these SMEs have lower educational attainment. The
SMEs are also characterized by their business site. In most cases, their location lacks basic
amenities with inadequate power supplies. Most of the places are open-air markets with little or
no permanent structures to run their businesses from. The only hope of accessing electricity
through rural electrification program has also hit a snug. The sources of start-up capital for the
business also vary with majority having to use their personal savings. Lack of capital is cited as
one greatest problem of SMEs growth in Kenya. Lastly, SMEs are also characterized by
technological machine capacities which are very low in Kenya.
Most economic activity in the world comes from the small and medium-sized enterprise (SME)
sector (Wendel & Harvey, 2006). There is no standard definition of SME in Kenya. Lenders‘
definitions vary, but typically they define SMEs as businesses with six to 50 employees or with
annual revenues less than 50 million Kenyan shillings. Regardless of quantitative definition, it is
agreed by virtually all stakeholders in this market that SMEs in Kenya are the ―missing middle‖.
Small and Medium Enterprises (SMEs) is an important sub sector for the Kenyan economy like
many other developing countries, since it employs about 85 per cent of the Kenyan
workforce(about 7.5 million Kenyans of the country‘s total employment). The current
Constitution provides a new window of opportunity to address SMEs related issues through
regulatory and institutional reforms under a new, devolved governance system as well as the
Micro and Small Enterprises Act 2012.
2.4.1 Promoting SMEs in Kenya
Governments play a fundamental role in ensuring a supportive enabling environment and
expanding the frontier for SME Finance. Ensuring a stable macroeconomic environment, an
effective financial infrastructure and a supportive legal and regulatory framework, is arguably

20
the most important and effective contribution that governments can make to expand the supply of
finance to SMEs. For example, in countries where public credit registries are the only source of
credit information, government has a direct responsibility for ensuring maximum coverage of
financial and non-financial institutions, extensive reporting of the relevant information, and easy
access to credit reports. Government action is also fundamental in the regulation and supervision
of private credit bureaus, ensuring effective credit reporting and curbing any abuse of market
power (through regulation or promotion of entry and competition). Government may also play a
critical role in ensuring a legal and regulatory framework that fosters financial development and
competition. In some cases, it may also play a fundamental role in introducing technological
platforms for some sources of finance, such as venture capital and reverse factoring.
2.4.2 Constraints faced by SMEs in Accessing Credit
In Kenya, strong SMEs tend to be located in urban and peri-urban centres and are usually
registered. However, they face a number of constraints, which include the difficulty in
employing competent people with techniques in financial management because of the salaries
such people would demand, financial problems arising from late payments by debtors, and
inability to raise own finance and access financial services from formal sources. This category of
SMEs usually looks to the banking sector and other financial intermediaries for instruments to
finance working capital and to provide credit for short-term liquidity. They however, often fail to
access the financial resources in the required amounts because banks evaluate them based on a
checklist, including - audited financial statements for the last three years including management
accounts; project proposal highlighting the strengths, weaknesses, opportunities and threats;
financial projections; monitoring costs; credit or default risk because of the problem of
information asymmetry; and enforcement costs.

21
Additionally many SMEs employ less than 5 people, mostly family members who are usually not
legally registered, apply simple and relatively rudimentary technology in production and,
therefore, the quality of their products is likely to be poor. They may suffer from limited market
access and fierce competition from many rival producers. This category of SMEs usually does
not have proper physical structures such as premises from which to operate business, accessible
roads and other essential utilities, which are major catalysts to accessing formal sector credit. In
addition, there is a general lack of professionalism within this category of SMEs in terms of
strategic planning procedures, decision-making processes and business planning, and
management in general. More often than not, the smaller the enterprise, the less likelihood its
management will understand the need for financial management and the poorer the
understanding of financial management. Likewise, the size and the distance from major
cities/urban centres are negatively related to the level of awareness of financial instruments. That
is, the smaller the size of the enterprise and the farther away from the city/urban centres the
enterprise is, the less aware the firm is of the financial instruments available. This makes them
vulnerable to shocks to revenue or costs and, therefore, and makes them unlikely to expand
beyond ascertain limit. This explains why the turnover of majority of SMEs in Kenya is
estimated at only the Kshs.5million (app US$63,000) a year threshold.
2.4.3 Sources of Finances for SMEs
Theoretically, seven modes of finance can be employed - but all have some degree of problem
associated with them in providing capital to SMEs. Banks are invariably restrictive in lending to
SMEs. Early stage ventures often have a low equity base and lack a visibility in cash flow, which
can sustain debt finance. Further, the loans are collateralized, high cost and often are bundled
with a delay in receivables. The high informational asymmetry makes it difficult for the debt

22
finance to thrive. With the banks increasingly being in the public eye, there is an increased
element of risk averseness. The course of debt financing from a development finance institution
has not been a runaway success. Bond finance as an option is as good as negligible even for
larger corporate in Kenya, let alone being workable for an SME. The MFI sector is growing but
not rapidly enough and certainly not large and structured enough to provide the required capital.
The same may be said of the Venture Capital industry, which has stagnated over time and will
have to attain greater significance for Kenya to achieve breakaway growth. A large part of the
capital required by SMEs still comes from lending by Non-Bank Financial Institutions (NBFIs)
and through informal finance – wherein the cost of borrowing is significantly high. Thus, the
situation is complicated by the fact that the preferred mode of finance is self – largely due to
associated high interest rates (CMA, 2010).
Commercial banks play a vital role in giving direction to the affairs of the economy in various
ways. In the context of deposit mobilization, given the income savings ratio, commercial banks
induce the savers in the community to hold their savings in the form of socially useful assets of
which banks deposits constitute the most important element (Ochola, 2010). The banking
industry has recently experienced substantial changes. The industry has become more
competitive due to deregulation of some aspects of it. Today, banks have become flexible and as
such face stiff competition from each other. This has also seen immense expansion of the branch
networks. Bank regulators have therefore come in to manage the speed of integration and
expansion in the banking industry. This is important in protecting the customers who supply
funds to the banking system. In Kenya, commercial banks are regulated by Central Bank of
Kenya that sets and monitors both the operational and capital requirements for all commercial
banks.

23
Hoque and Hossain, (2008) argued that persistent loan defaults have become an order of the day
in developing countries. There has been hardly any bank or Development Financial Institution
(DFI) in developing which has not experienced persistent loan default. This is evidenced by the
undercapitalization and illiquidity of 160 DFIs in 33 developing countries (Hoque, 2004). This
malaise in the development finance market has not only impaired the existence of many DFIs,
but also adversely affected the economies of developing nations. Despite the application of a
number of remedial measures, such as supplying fresh loans, loan rescheduling, imposition of
penal interest rates, denial of additional credit to repeat defaulters, management takeover of
problem projects, and legal actions, loan default problems continued to rein the credit markets in
developing countries. Loan default occurs when borrowers are not able and/or willing to repay
loans. There are borrowers who are willing but not able to repay loans and there are borrowers
who are able but not willing to repay loans. Loan default occurs in either case.
Surveys conducted by the World Bank show that state-owned banks have played an important
role in SME finance in many countries. These have included commercial banks, development
banks, and banks specialized in SME Finance. In contrast with credit guarantee schemes,
however, the risks associated with more direct interventions such as state-owned banks are
higher. The same surveys show that state banks have, on average, weaker risk management
systems. Empirical research indicates that state banks in developing countries have not
performed well in general and have negatively influenced economic and financial development.
Research also shows that state banks provide political patronage and that their lending is
correlated with the election cycle (IFC, 2010).

24
2.5 Relationship of Interest Rates, Demand for Credit and Loan Repayments
Interest rate is the price a borrower pays for the use of money they borrow from a
lender/financial institutions or fee paid on borrowed assets. Interest can be thought of as "rent of
money". Interest rates are fundamental to a ‗capitalist society‘ and are normally expressed as a
percentage rate over the period of one year. Interest rate as a price of money reflects market
information regarding expected change in the purchasing power of money or future inflation
(Ng‘etich & Wanjau, 2011). A bank‘s interest rate risk reflects the extent to which its financial
condition is affected by changes in market interest rates. There are two different ways of thinking
about such effects. The first approach focuses on the impact of changes in market interest rates
on the value of bank assets, liabilities and off balance sheet positions (potentially including those
that are not marked to market for reporting purposes), and so arrives at an overall assessment of
the impact of changes in market interest rates on the economic value of the bank. The second
approach focuses on the implications of movements in market rates for the future cash flows that
the bank will obtain. Since the present discounted value of the bank‘s cash flows must equal the
economic value of the bank, these two approaches are consistent and both can be useful. For
example, a focus on flows may suggest impending liquidity problems as cash flow dwindles.
2.5.1 Determinants of Interest Rates
In Kenya, the interest rates charged by banks are determined by: interest rate on deposits; cost of
liquidity; cost of holding cash; and operational costs. The interest on deposits depends on the
bank‘s cash ratio, its overall financial stability and the type of the bank for example whether it is
a corporate bank or a network bank. The cost of liquidity covers both the cash, which is
maintained by the banks with Central Bank as required cash ratio, and the cash maintained by the
banks as the minimum amounts to meet unexpected demand from the customers. Cost of holding

25
cash is derived from the cash held by the banks in form of liquid form to meet day-to-day
customer‘s needs. The banks have to compare the costs of cash outs and the opportunity costs
associated with the cash held in liquid form. Operational costs are mainly meant to cover the
costs of running the bank and it includes capital costs, staff costs, and technology costs. The base
rate charged by the banks takes into account all these factors. The bank can reduce the base rate
by improving efficiency.
The question is: how ‗high‘ or ‗low‘ interest rates should be? Generally, banks do charge high
interest rates in developing countries where financial market is imperfect as information
asymmetry between borrower and lender prevails, credit-worthiness of borrowers is doubtful,
value of collaterals is overstated and inefficiency is the common features at institutional level.
Nobody precisely knows the degree of such imperfection but all banks are addicted to the policy
of high interest rates. This is counter-productive as high interest rates may contribute to loan
default. This indicates that banks should determine appropriate lending rates on the basis of
proven, not hypothetical, degree of market imperfection. Again, lending rates should be lowered
or adjusted very frequently with the level of real-world imperfection which decreases with pace
of economic development and growth of an economy (Amonoo et al, 2003).
Amonoo et al, (2003) suggested that real rate of interest must be lower than real return on
capital. It means that as the financial market becomes more and more efficient with the process
of development, lending rates should be lowered than before which may contributes towards
reduced level of loan defaults. Failure to do this may result in persistent loan defaults in
developing countries. High interest rates can be detrimental to investment and growth. High
interest rates do not contribute to banks‘ growing profitability in the long run. Stiglitz and Weiss
(1981) believe that high interest rates are responsible for higher defaults and declining bank

26
profit. These clearly provide support to our hypothesis that high interest rates are positively
correlated to loan defaults in developing countries.
Edakasi (2011) in his study established that Equity Bank Uganda customers were aware of the
influence of interest rates have on micro-credits with regard to the performance of businesses.
The study also established that the most important cause of poor business performance and
collapse as being amongst others being high interest rates, limited amount being lent, lack of
entrepreneurship skills and high taxes.
Olweny (2011) argued that interest rate risks can also come in a variety of forms, including
repricing risk, yield curve risk and basis risk. A bank will face repricing risk if either the average
yield on its assets or that on its liabilities is more sensitive to changes in market interest rates.
Such a difference in sensitivity could reflect a number of possible mismatches in the
characteristics of assets and liabilities. First, fixed rate assets and liabilities could have different
maturities. Second, floating rate assets and liabilities could have different repricing periods, with
base rates that have maturities similar to their respective repricing periods (assets that reprice
annually based on a one-year rate and liabilities that reprice quarterly based on a three-month
rate, for example). Third, floating rate assets and liabilities could have base rates of different
maturities (assets that reprice annually based on a long-term rate along with liabilities that
reprice annually based on a one-year rate, for example). Fourth, in many countries there are
assets and liabilities for which banks can adjust pricing at will (e.g. savings deposits and some
types of retail loans) and the rate-setting policies that banks follow determine the effective
repricing behaviour of such instruments. The pricing decisions in these cases will presumably
depend on a variety of factors in addition to market interest rates, including the expected
behaviour of bank customers and the extent of competition in the markets concerned. Finally, in

27
some cases, bank customers have the option either to repay loans or withdraw their deposits at
low (or no) cost, and the decisions of such customers will influence the response of the average
pricing of such assets or liabilities to changes in market interest rates.
English (2002) argued that banks and their supervisors have spent considerable time and effort in
recent years developing systems for monitoring and managing interest rate risk. Some specific
component of interest rate risk arises from the possible effects of changes in market interest rates
on bank net interest margins. Such effects can be very large if interest rate risk is not managed
carefully. For example, the secondary banking crisis in the United Kingdom in the 1970s
reflected, at least in part, the funding of longer-term assets with short-term liabilities. Similarly,
funding of long-term, fixed rate mortgages with savings deposits led to a very sharp drop in net
interest margins at US thrift institutions in the early 1980s when interest rates rose to historic
highs and the yield curve inverted. The result was actually negative net interest income for two
years at US thrifts, after net interest margins had averaged nearly 1.5% over the preceding
decade.
Calice, Chando, & Sekious (2012) Argued that the majority of the banks (56 percent) allow past
SME losses to affect the pricing of future loans, specifically interest rates. The effect can be felt
at the level of the single SME or at the level of the total SME loan portfolio. The rationale for
impacting specific SME clients, according to most banks, was that past losses on a specific SME
would negatively affect the risk rating of that particular client, and therefore increase the risk
premium required from the client. If the overall loan performance experience on the SME
portfolio was poor, the whole portfolio would then be affected, and the pricing would change to
reflect the new risk/return trade-off. However, the effect of past losses on capital requirements

28
was not exactly similar to the effect of past losses on pricing, with half of the banks claiming that
past losses do not feed into their capital requirements.
2.5.2 SMEs Demand for Credit
The role of credit is to bridge the gap between owner‘s financial assets and the required financial
assets of the enterprise. Due to persistence of this imbalance, enterprises are forced to demand
credit. Demand for credit can be categorized into perceived, potential and revealed demand.
Perceived demand is represented by a situation where enterprises that assume to be in need of
cash mention finance as a constraint. Potential demand is characterized by a desire for credit
which is not actualized due to market imperfections and institutional barriers. Revealed demand
is characterized as written application for financial support at a given rate of interest (Amonoo et
al, 2003).
The debate on whether high interest rates affect the demand for credit is inconclusive and may go
on indefinitely. There are two main schools of thought. The first school advocates that high
interest rates negatively affect the demand for credit because only limited borrowers with high-
risk projects may have their demand satisfied. It was argued that high interest rates encourage
adverse selection of loan seekers. Those who take high risk and have their loans approved are
those with high default rates. The second school of thought‘s assertion is that high interest rates
do not affect the demand for credit. It was indicated that high interest rates were not a major
concern for SMEs. In that stud, SMEs considered an average annual interest rate of 19.5% to be
fair and reasonable and his fell below the minimum market rate at that time by seven percentage
points. An individual SME‘s aversion to borrowing influences its potential to demand credit.
Factors like owner‘s equity and annual profit are correlated with demand for credit.
29
The price elasticity of demand for credit—the extent to which demand for credit changes in
response to interest rate shifts—is of key interest to policymakers and practitioners (Karlan &
Zinman, 2013). The price elasticity of demand is defined as the percentage change in quantity
demanded divided by the percentage change in price. To say that the demand for credit is
―elastic‖ means that the amount of credit demanded changes by a greater percentage than the
percentage by which the price of credit changes when a shift in price occurs. For example,
assume initial interest rates are 100% and drop to 90% (a 10% decrease), the demand for credit is
elastic if the amount of credit demanded increases by more than 10% and inelastic if it increases
by less than 10%.
The market for private equity and or long-term risk investment in Kenya is in an early
development stage with few players taking part in the market. The main source of financing for
Kenya‘s SMEs is internal financing followed by bank financing which constitutes 86% of the
total demand for funds. Kenyan SMEs do not use credit cards or leasing as a source of finance.
Only 0.58% of SMEs surveyed used equity finance. (CBK, Credit Officer Survey, 2013)
Comparing the last quarter of 2012 and quarter ending March 2013 indicates that political risk
had the most significant impact in reducing demand for credit; followed by issuance of debt
securities, loans from non-banks and internal financing. It is also notable that retention of the
Central Bank Rate (CBR) at 9.5% in the quarter decreased volatility of funding costs, which
translated to improved investor confidence. However, the then prevailing political risk associated
with the March 2013 elections dampened demand for credit as investors delayed investment
decisions until the political environment stabilized.
Factors affecting demand for credit include internal financing, loans from other banks, loans
from non-banks, issuance of debt securities, issuance of equity, cost of borrowing, available

30
investment opportunities, drop in CBR and political risk. Wanjohi and Mugure (2008), in
acknowledging that credit sources remain a major challenge among the SME‘s, found out that, in
the climaxing of the year 2008, money lenders in the name of ‗pyramid schemes‘ came up
promising hope among the small investors that they can make it to financial freedom through
soft borrowing. The rationale behind turning to these schemes among a good number of
entrepreneurs is to seek source of credit which is not available among the formal financial
institutions.
2.5.3 Credit Risk
According to Basel Committee on Banking Supervision, (1999), credit risk is the oldest and
important risk which banks are exposed to, where credit risk and credit risk management are
increasing with time because of various reasons such as economic crises and stagnation,
company bankruptcies, infraction of rules in company accounting and audits, growth of off-
balance sheet derivatives, declining and volatile values of collateral, borrowing more easily by
small firms, financial globalization and business investments risk-based capital requirements.
Kithinji (2010) Credit risk as the risk of losses caused by default by borrowers. Default occurs
when borrowers do not meet their financial obligations. Credit risk can alternatively be defined
as the risk that a borrower deteriorates in credit quality. This definition also includes the default
of the borrower as the most extreme deterioration in credit worthiness. Credit risk is managed at
both the transaction and portfolio levels. But, banks increasingly measure and manage credit risk
on a portfolio basis instead of on a loan-by-loan basis. The main source of credit risk include,
limited institutional capacity, inappropriate credit policies, volatile interest rates, poor
management, inappropriate laws, low capital and liquidity levels, direct lending, massive
licensing of banks, poor loan underwriting, laxity in credit assessment, poor lending practices,

31
government interference and inadequate supervision by the central bank (Kithinji, 2010).An
increase in bank credit risk gradually leads to liquidity and solvency problems. Credit risk may
increase if the bank lends to borrowers it does not have adequate knowledge about.
Several theories have been put forward which have implications on credit risk management.
Interest rates theories recognize that interest rates have an effect on credit risk because the higher
the interest rate the higher the risk that the loan might not be repaid and thus the higher the credit
risk. The term structure of interest rate theories contends that the long term interest rates are
more risky than short term interest rates, thus investors expect a higher return if they have to be
motivated to hold instruments that are long term interest bearing instrument. Theories of
financial crises contend that crises in the financial sector affect the ability of commercial banks
to extend credit as well as the ability of the borrowers to service their loans. Portfolio theory in
the banking sector is applied in constitution of loan portfolios of banks where there are
guidelines on loans that banks should extend to their clients, such as limit in terms of credit that
should be extended to third parties. The agency theory contends that many banks are managed by
the managers and not by the owners. Banks that are managed by professional managers are
expected to better analyze and monitor credit awarded to their clients. Commercial banks should
be properly managed and management should be ―fit and proper‖ to be able to make decisions on
credit risk management and that which should steer banks to high levels of profitability.
2.5.4 Non - Performing Loans (NPLs)
The Central Bank of Kenya defines NPLs as those loans that are not being serviced as per loan
contracts and expose the financial institutions to potential losses (CBK, 1997). It is important to
note that non – performing loans refers to accounts whose principal or interest remains unpaid 90
days or more after due date. (Ng'etich & Wanjau, 2011) Defined Non - Performing Asset (NPAs)

32
as the money lent to an individual that does not earn income and full payment of principal and
interest is no longer anticipated, principal or interest is 90 days or more delinquent, or the
maturity date has passed and payment in full has not been made. The issue of non-performing
assets has, therefore, gained increasing attentions since the immediate consequence of large
amount of NPAs in the banking system is a cause of bank failure. The NPL recovery process
differs from bank to bank. When an SME is declared bankrupt, the first action the bank takes in
all instances is to call the clients.
In the December 2012 credit survey, banks had forecasted an increase in NPLs in the trade,
tourism, transport & communication, and real estate sectors in the quarter ended March 2013 due
to expected increase in political risk. The March 2013 data on actual NPLs generally confirmed
the banks forecast especially on the trade and real estate sectors. However, the March 2013
financial data revealed an increase of NPLs in personal/household sectors. For the quarter ending
June 2013, institutions forecast that the NPLs will generally remain unchanged. However, some
institutions forecast a decrease in NPLs in the tourism, restaurant & hotels sector (58 per cent of
the respondents) and trade sector (54% of the respondents) following the just concluded peaceful
elections. It was noted that gross non-performing loans increased by 14.1 percent from KShs
61.57 billion in December 2012 to KShs 70.25 billion in March 2013.
The banks expect to intensify their credit recovery efforts in manufacturing, building and
construction, trade, transport and communication, real estate and personal/household sectors in
the quarter ended June 2013. However, the credit recovery efforts towards agriculture, mining
and quarrying, energy and water and financial service sectors are expected to generally remain
constant. Some banks indicated that they intend to intensify credit recovery efforts so as to move
towards less provisions and higher profitability. Others observed that their credit recovery efforts

33
will remain unchanged as they continuously use credit reference bureaus when originating credit
facilities, they also continuously monitor their loans books to identify early warning signs and
others have also been using debt collection agents to fast track credit recovery (CBK, Credit
Officer Survey, 2013)
2.6 Empirical Review
Existing literature suggest various positions on the relationship between interest rates charged by
banks and loan demanded and the repayment thereof. Others argued that high interest rates
negatively affect the demand for credit because only limited borrowers with high risk projects
may have their demand satisfied. It was argued that high interest rates encourage adverse
selection of loan seekers. Those who take high risk and have their loans approved are those with
high default rates.
Amonoo et al, (2003) carried out an empirical survey on the impact of interest rates on demand
for credit and loan repayment by the poor and SME's in Ghana. This was done from September
to November 2001. The study covered 12 Districts in the Central region for SMEs and financial
institutions. The population consisted of all the SMEs in the selected Districts. The sampling
frame for banks and non-banking financial institutions was the total enumeration of the
population.Two sets of interview schedules were used in order to achieve the objectives of the
main survey. The first interview schedule was administered to the banking and non-banking
financial institutions. The main import of this schedule was to find out from the respondents
whether interest rates affected loan recovery performance. Additionally, factors taken into
consideration in determining interest rates and conditions attached to the loans constituted some
of the major issues investigated. The second interview schedule was administered to 50 SMEs.
The interview sought to gather data on capacity utilization, costs of and returns on production,

34
attitudes towards borrowing, whether their enterprises have been supported by loans, the amount
borrowed and the relevant interest rates among others. The study found out that lack of
monitoring, high interest rates and poor appraisal were advanced as the three main factors that
affect loan recovery performance. Attitudes of beneficiaries regarding the repayment of loans in
general were mentioned as a contributory factor to recovery of loans. In terms of attitudes
towards borrowing, the result showed that 68% of the respondents considered borrowing to be
bad. They were of the view that pressure exerted by the banks as well as the terms and conditions
of the loan were too harsh, and that interest rates were too high hence preferred to go without
loans. It also found out that interest rates negatively affect loan repayments; duration of delay in
granting loans also affects loan repayment. Decline in interest rates was not fully reflected in the
bank‘s lending rates. The SMEs also identified the following as the causes of loan default; lack
of ready market, approval of low proportion of loan applied for and low profit margin.
Hoque & Hassain, (2008) conducted a study on flawed interest rate policy and loan default:
experience from a developing country and covered 89 firms financed by the Bangladesh Shilpa
Bank (BSB) between 1985 and 2005. They first considered 3 models in their analysis. All 3
models composed of same set of independent variables but with different dependent variables
like amount recovered, amount overdue and amount outstanding. The case of BSB showed that
the borrowers were charged with high interest which considerably contributed toward
accumulation of overdue loans since such interest expense was not supported by the cash flows
of the firm. These suggested that banks and DFIs should rationalize their interest rate policy so
that such policy is supported by the cash flows of the firm or repayment capacity of the
borrowers. This would contribute towards reducing loan defaults in developing countries. It was
concluded that, the banks and DFIs in developing countries such as the Bangladesh Shilpa Bank

35
(BSB) have been ravaged by persistence loan default and loan loss since mid- 1980s. Despite the
application of a number of conventional remedial measures, loan default and loan loss continued
to haunt the DFIs. The paper advanced this hypothesis that borrowers‘ failure to pay loans is
related to persistent flawed interest rate policy applied by the banks in Bangladesh. They also
found that loan default was not solely attributed to borrowers‘ unwillingness to repay loans; it
was also an in-built problem of the interest policy. In other words, interest rate policy was both a
cause and an effect of the high default rate. As high interest rates increase costs of borrowing,
debt burden grows which led borrowers to default and, as debt default becomes persistent, the
bank loses income and becomes undercapitalized. In order to recover its financial position, it
resorts to high interest rates and the cycle is complete. BSB resorts to high interest rates which,
again, compounds default rate. In this way, BSB is caught in the vicious circle of high interest
rate and high loan default rate.
Edakasi, (2011) carried out to study the effect of interest rates ceiling on loan repayment in
Uganda's commercial banks with specific regard to Equity Bank, analyzing the impact of interest
rates fluctuation (rising and falling interest rates) on loan repayment in Uganda‘s commercial
Banks a case study of Equity Bank and analyzing the effects of interest rate on the supply of
loans. Due to the large size of the population and other constraints, the researcher used both
random sampling and purposive selection to reduce on the size of customers. The sample size
was 60 comprising of 10 Equity bank officials and 50 bank customers. The findings of the study
greatly depended on primary and secondary sources. The study established that most Equity
Bank customers were aware of the influence interest rates have on micro-credits in regard to
business performance. It was established that the provision of loans to entrepreneurs has a great
impact on the businesses performance. The study also established the most important cause of

36
poor business performance and collapse as being amongst others the high interest rates, limited
amount lent, lack of entrepreneurship skills and high taxes.
Kithinji (2010) did a study on the effect of credit risk management on the profitability of
commercial banks in Kenya. Credit risk management policies for commercial banks were
identified as conservative, stringent, lenient and customized and globally standardized credit risk
management policies. Data on the amount of credit, level of nonperforming loans and profits
were collected for the period 2004 to 2008. Amount of credit was measured by loan and
advances to customers divided by total assets, nonperforming loans was measured using
nonperforming loans/ total loans, and profits were measured using return on total assets. A
regression model was used to establish the relationship between amount of credit, non-
performing loans and profits during the period of study. R2 and t-test at 95% confidence level
were estimated. The findings revealed that the bulk of the profits of commercial banks are not
influenced by the amount of credit and non-performing loans, therefore suggesting that other
variables other than credit and non-performing loans impact on profits. Notably, the level of
nonperforming loans given by nonperforming loans to total loans decreased during the period
2004 to 2008. The requirement by the Basle II might have enabled commercial banks to control
their level of nonperforming loans thus reducing banks credit risk. Thus on average the profits of
the banking industry increased during the period 2004 to 2008. However profitability of the
commercial banks fluctuated during the period but on average increased marginally during the
period 2004 to 2008. The profits were generally low during the period of study. The amount of
credit extended to customers was relatively high but assumed a downward trend during the
period. Whereas the level of credit and profits were relatively low and stable, the amount of

37
credit was high and relatively volatile. The regression results indicate that there is no relationship
between profits, amount of credit and the level of nonperforming loans.
Ng'etich & Wanjau, (2011) in their study on to determine the effects of interest rate spread on the
level of non-performing assets in commercial banks in Kenya adopted a descriptive research
design on a sample of all commercial banks in Kenya operating by 2008 which are 43 in number.
The study used questionnaires to collect data from primary data sources and secondary data,
collected from Bank Supervision Report, to augment the primary data findings. The study used
both quantitative and qualitative techniques in data analysis to establish the relationship between
the interest rate spread and loan non-performance. The data were presented using graphs, table
and pie-Charts. The study concluded that interest rate spread affect performing assets in banks as
it increases the cost of loans charged on the borrowers, regulations on interest rates have far
reaching effects on assets non-performance, for such regulations determine the interest rate
spread in banks and also help mitigate moral hazards incidental to NPAs. Credit risk
management technique remotely affects the value of a bank‘s interest rates spread as interest
rates are benchmarked against the associated non-performing assets and non-performing assets is
attributable to high cost of loans. The study recommended that commercial banks in Kenya
should assess their clients and charge interest rates accordingly as ineffective interest rate policy
can increase the level of interest rates and consequently NPAs. They apply stringent regulations
on interest rates charged by banks so as to regulate their interest rate spread and enhance
periodic/regular credit risk monitoring of their loan portfolios to reduce the level of NPAs.
Bichanga & Aseyo, (2013) in their study on causes of loan default within micro-finance
institutions in Kenya, sought to analyze how non-supervision of borrowers, effects of shrinking
economic growth and how diversion of funds by borrowers leads to default in loan repayment.
38
The target population comprised a total of 400 loan borrowers and 200 MFIs out of which a
sample of 150 was picked using simple random sampling. The data was analyzed from
questionnaires using both quantitative and qualitative techniques and tabulated by use of
frequency tables. The study found out that loan repayment default was as result of non-
supervision of borrowers by the MFIs, and also as a result of inadequate training of borrowers on
utilization of loan funds before they received loans. The findings also revealed that most
borrowers did not spend the loan amount on intended and agreed projects.
Olweny,( 2011) did a study on modelling the volatility of short term interest rates in Kenya
where he sought to establish the link between the level of interest and the volatility of interest
rates in Kenya using the Treasury bill rates from August 1991 to December 2007. The main
variable for the study was the short term interest rate series. In Kenya, this is the Central Bank
three month Treasury bill rate. The interest rate volatility was studied using the general
specification for the stochastic behavior of interest rates which is tested in a stochastic
differential equation for the instantaneous risk free rate of interest. The study applied the
monthly averages of the 91-day Treasury bills for the period between August 1991 and
December 2007 which were obtained from the Central Bank of Kenya. The results of the study
were consistent with the hypothesis that the volatility is positively correlated with the level of the
short term interest rate as documented by previous empirical studies. The key findings revealed
that there exists a link between the level of short-term interest and volatility of interest rates in
Kenya.
Masese (2011) carried out a study on the factors affecting credit allocation on financial
institutions in Kenya. The study targeted the managers and the staffs of commercial banks,
Mortgage Institutions and Hire Purchase Institutions who are directly responsible for credit

39
allocation and who constituted the target population. The sample selected from the target
population was the forty three licensed commercial banks, Mortgage Institutions and Hire
Purchase companies, all in Nairobi metropolitan. Primary data was collected using
questionnaires which were administered using drop and pick method. Data was analyzed using
both descriptive and inferential statistics. Descriptive statistics included those of the mean and
standard deviation while inferential statistic involved use of Anovas, correlations and
multivariate regression analysis. The results of the study indicate that financial institutions and
customers obtain accurate information on the subject of credit allocation and consider factors
influencing credit allocation. It also found the existing procedures; in particular factors
considered as different credit allocation attributes that are observed by financial institutions. The
study results postulated clear and precise guidelines designed to enable institutional lenders to
make informed successful credit allocations.
Masese, (2011) however observed that borrowers willing to pay high interest rates may on
average be worse risks; thus as the interest rate increases, the riskiness of those who borrow also
increases, reducing the bank‘s profitability. The incentive effect occurs because as the interest
rate and other terms of the contract change, the behaviour of borrowers is likely to change since
it affects the returns on their projects. Stiglitz & Weiss (1981) further showed that higher interest
rates induce firms to undertake projects with lower probability of success but higher payoffs
when they succeed (leading to the problem of moral hazard). Since the bank is not able to control
all actions of borrowers due to imperfect and costly information, it will formulate the terms of
the loan contract to induce borrowers to take actions in the interest of the bank and to attract low
risk borrowers. The result is an equilibrium rate of interests at which the demand for credit
exceeds the supply. Other terms of the contract, like the amount of the loan and the amount of

40
collateral, will also affect the behaviour of borrowers and their distribution, as well as the return
to banks.
Raising interest rates or collateral in the face of excess demand is not always profitable, and
banks will deny loans to certain borrowers. The result is credit rationing in credit markets, which
refers to two situations; Among loan applicants who appear to be identical, some receive and
others do not, with those who don‘t having no chance of receiving a loan even if they offered to
pay higher interest rates, and identifiable groups of people who at a given supply of credit, are
unable to obtain credit at any interest rate, but with a larger supply, they would. Masese (2011),
following this line of argument, analyses the rationale for interventions in rural credit markets in
the presence of market failure. Since credit markets are characterized by imperfect information,
and high costs of contract enforcement, an efficiency measure as exists in a perfectly competitive
market will not be an accurate measure against which to define market failure. These problems
lead to credit rationing in credit markets, adverse selection and moral hazard.
2.7 Summary of Literature Review
The pioneering work of (Stiglitz & Weiss, 1981) marked the beginning of attempts at
explanations of credit rationing in credit markets. In this explanation, interest rates charged by a
credit institution are seen as having a dual role of sorting potential borrowers (leading to adverse
selection), and affecting the actions of borrowers (leading to the incentive effect). Interest rates
thus affect the nature of the transaction and do not necessarily clear the market. Both effects are
seen as a result of the imperfect information inherent in credit markets. Adverse selection occurs
because lenders would like to identify the borrowers most likely to repay their loans since the
banks‘ expected returns depend on the probability of repayment. In an attempt to identify

41
borrowers with high probability of repayment, banks are likely to use the interest rates that an
individual is willing to pay as a screening device.
The interest rate a bank charges may itself affect the riskiness of the pool of loans by either
adverse selection or moral hazard. Both effects derive directly from the residual imperfect
information which is present in loan markets after banks have evaluated loan applications. The
adverse selection aspect of interest rates is a consequence of different borrowers having different
probabilities of repaying their loans. The expected returns to the bank obviously depend on the
probability of repayment, so the bank would like to be able to identify borrowers who are likely
to repay. It is difficult to identify ―good borrowers‖ and to do so require the bank to use a variety
of screening devices. The interest rate which an individual is willing to pay may act as one such
screening device: those who are willing to pay high interest rates may, on average, be worse
risks; they are willing to borrow at high interest rates because the perceive their probability of
repaying the loan is low. As the interest rates rises, the average ―riskiness‖ of those who borrow
increases possibly lowering the bank‘s profits. Similarly, as the interest rate and other terms of
the contract change, the behavior of the borrower is likely to change. For instance, raising the
interest rate decreases the return on projects with lower probabilities of success but higher pay
offs when successful. In a world with perfect and costless information, the bank would stipulate
precisely all the actions which the Borrower could undertake (which might affect the return to
the loan). However, the bank is not able to directly control all the actions of the borrower;
therefore, it will formulate the terms of the loan contract in a manner designed to induce the
Borrower to take actions which are of interest of the bank, as well as to attract low-risk
borrowers.

42
Adverse selection arises because in the absence of perfect information about the borrower, an
increase in interest rates encourages borrowers with the most risky projects, and hence least
likely to repay, to borrow, while those with the least risky projects cease to borrow. Interest rates
will thus play the allocation role of equating demand and supply for loan funds, and will also
affect the average quality of lenders‘ loan portfolios. Lenders will fix the interest rates at a lower
level and ration access to credit. Imperfect information is therefore important in explaining the
existence of credit rationing in rural credit markets. Moral hazard occurs basically because
projects have identical mean returns but different degrees of risk, and lenders are unable to
discern the borrowers‘ actions (Stiglitz & Weiss, 1981). An increase in interest rates negatively
affects the borrowers by reducing their incentive to take actions conducive to loan repayment.
This will lead to the possibility of credit rationing.
Masese (2011) demonstrates that incomplete information or imperfect contract enforcement
generates the possibility of loan default and eventually problems of credit rationing. The result is
loan supply and implicit credit demand functions, both of which are simultaneously determined.
The role of risk in allocation of credit through its effect on transaction costs, therefore, becomes
important in incomplete credit markets. The results of the determinants of loan repayment
problems among the borrowers showed that the borrower‘s characteristics (age and gender),
business characteristics (business type) and loan characteristics (repayment period, repayment
mode, and repayment amount) were among the factors that influenced borrowers in repaying
their loans.
43
CHAPTER THREE: RESEARCH METHODOLOGY
3.1 Introduction
This chapter provides the methodology of the study. It gives the specific procedures that were
followed in undertaking the study. The research design, population, sampling design, data
collection methods and data analysis techniques are described in this chapter.
3.2 Research design
The researcher adopted a descriptive research approach to carry out the study since it utilized
elements of quantitative research methodologies. A descriptive research design attempts to
describe or define a system, often by creating a profile of a group of problems, people or events,
through the collection of data and tabulation of the frequencies on research variables or their
interaction (Cooper and Schindler 2006). A descriptive research defines questions, people,
surveyed and the method of analysis prior to beginning data collection. Thus the study focused
on ‗what is‘ the effects of interest rates on demand for credit and loan repayment by SMEs in
Kenya. Descriptive approach is also justified since it is efficient in collecting large amounts of
information within a short time. Also, this research design does not permit manipulation of the
variables as Bichanga and Aseyo, (2013) observed.
3.3 Population and Sample
Data was extracted from Central Bank of Kenya for all the 43 commercial banks in Kenya for
the period between year 2008 and 2012. The list of the banks was derived from the Central Bank
of Kenya supervisory reports. These data was extracted from the financial statements of these
banks and the researcher narrowed down to all the SME sectors involved namely; Agriculture,

44
Manufacturing, Building & Construction, Mining, Energy & Water, Trade, Tourism, Hotel &
Restaurant, Transport & Communication, Real Estate and Financial Services.
3.4 Data collection
The various variables in question were the gross loan amounts, the non-performing loans, the
prevailing interest rates, the repayment abilities and the number of loan accounts held. The
nature of data collected for the credit demanded were the gross loan amounts booked in the
respective years, the number of loan accounts held and the interest rates in the various years. On
the other hand, the nature of data collected for the non-performing loans were the non-
performing loans, the repayment abilities and the prevailing interest rates in those periods. These
data were collected from CBK supervisory report and were analyzed further as depicted on
appendix 2. This report had data from all the 43 banks and all the SMEs in Kenya which had
transacted with the banks. These reports had a lot of data but the researcher extracted what would
have been relevant for the study and summarized in appendix 2.
3.4.1 Reliability
Reliability of the secondary data was evaluated through checking the internal consistencies of the
data held in various sources. A constant composite reliability co-efficient (Cronbach Alpha) of
0.6 or above, for all the constructs, was considered adequate for this study. The acceptable
reliability co-efficient is 0.6 and above. Cronbach Alpha was used to test the reliability of the
research instrument.
3.4.2 Validity
Validity is the accuracy and meaningfulness of inferences, based on the research results. The
study used content validity to ascertain the validity of the secondary data. Content validity draws

45
an inference from test scores to a large domain of items similar to those on the test. Content
validity is concerned with sample population representativeness.
3.5 Data Analysis
Data analysis began with editing, coding, tabulation and review of data collected from the
financial statements using quantitative techniques. These financial statements were based on
surveys collected by the Central Bank of Kenya and KNBS. The descriptive approach was used
to determine the weights of the variables under the study while regressive statistics showed the
relationship between various credit strategy variables applied by different SMEs. This was done
by tallying up data, describing and interpreting the data in line with the study objectives and
assumptions through use of Statistical Package for Social Science (SPSS) and Ms Excel.
Quantitative analysis involved the use of pie charts, bar graphs, means and percentages shall be
used to present the information. The processed data were presented in tables, graphs and
explanation given in prose. The information served two functions in relation to the research
objectives:- To find out whether change in interest rate influence the demand for credit by the
SMEs in Kenya and secondly to determine the effects of changes in interest rate on the
repayment of loans by SMEs in Kenya.
The study covered periods between the year 2008 and 2012 and also used inferential statistics
that involved the use of ANOVAs and regression analysis both simple and multiple to study the
effect of independent variable on the dependent variables. The first regression equation for credit
demand was as follows;
Y=β0 + β1X1+ β2X2 + β3X3 + ε

46
Where:
Y1 = Credit Demand
β0 = Constant
β1.. β3 = Co-efficient indicator for credit demand
X1 = Interest rate
X2 = Non Performing loans
X3 = Repayment ability
ε = Random error term
The price elasticity of demand for credit—the extent to which demand for credit changes in
response to interest rate shifts—is of key interest to policymakers and practitioners. (Karlan &
Zinman, 2013). Non-Performing Loans will be measured as accounts whose principal or interest
remains unpaid 90 days or more after due date. Repayment ability – this is measured in the
following categories; Normal means well documented facilities granted to financially sound
customers where no weaknesses exist, Watch means principal and interest is due and unpaid for
30 to 90 days for term loans. These are facilities which exhibit potential weaknesses but are not
past due, Substandard means principal and interest is due and unpaid for more than 90 to 180
days for term loans and paying capacity of the borrower is deteriorating, Doubtful which means
that principal and interest is due and unpaid for more than 180 to 360 days for term loans and
collection being highly questionable and improbable and finally Loss which means principal and
interest is due and unpaid for more than 12 months for term loans. Loans considered
uncollectible.

47
The second regression equation for change in interest rates will be as follows;
Y1=β0 + β1X1 + ε
Where Y1 = Loan repayment
β0 = Constant
β1 = Co-efficient indicator for interest rate
X1 = Interest rate
ε = Random error term
Loan repayment is the Expected Monthly Installment of the loan that includes the loan principal
and the interest element (Stiglitz & Weiss, 1981). Interest rate is the price a borrower pays for
the use of money they borrow from a lender/financial institutions or fee paid on borrowed assets
(Ng‘etich & Wanjau, 2011).

48
CHAPTER FOUR: DATA ANALYSIS, RESULTS AND DISCUSSION
4.1 Introduction
In this chapter data pertaining to the effects of changes in interest rates on demand of credit and
loan repayment by SMEs in Kenya is analyzed and interpreted. The SMEs had the following
sectors analyzed; Agriculture, Manufacturing, Building & Construction, Mining, Energy &
Water, Trade, Tourism, Hotel & Restaurant, Transport & Communication, Real Estate and
Financial Services. Data from all the 43 banks for the period between years 2008 and 2012 were
combined and analyzed.
4.2 Data Analysis
4.2.1 Non-performing Loans in each SME sector
Figure 2: Non-performing Loan as per SME
Source: Author (2013)

49
Data was reviewed for the last four years on the total loans approved by the 43 banks combined.
The researcher went ahead and narrowed down to the individual sectors that form SMEs in
Kenya. It emerged that the level of non-performing loans in trade sector was at an all-time high
throughout the four years. It is also because trade is the largest aspect of SMEs because it has all
the miscellaneous businesses under it. 6 out of 10 sectors had the year 2012 as the highest
amount noted in non-performing loans. This is probably from the aftermath of the high interest
rate regime that began escalating in the year 2011 hence were felt more in the year 2012.
The year 2009 also recorded relatively high rates of non-performing loans. This can be attributed
to the effects of the post-election violence that was experienced in Kenya resulting in many
businesses not being able to repay their loans as expected, either due to partial or total losses.
Figure 2 explains the positions of the non-performing loans per SME sector in each year between
2009 and 2012.
4.2.2 Prevailing Lending Interest rates charged by the Commercial Banks
Figure 3: Prevailing Interest Rates as Charged by Commercial Banks
Source: Author (2013)

50
This is depicted in figure 3 above. The year 2008 had lending interest rates of 14.8%, 2009 had
14.76%, 2010 had 13.87%, 2011 had 21.75% and 2012 had 18.1%. The prevailing lending
interest rates charged by the commercial banks were highest in the year 2011. This was
occasioned by the prevailing economic conditions such as high inflation rates and high currency
exchange rates. The Central Bank Rate (CBR) was first reduced to 5.75 percent in January 2011
from 6.0 percent in December 2010. In subsequent reviews of domestic economic developments
conditions by the Monetary Policy Committee (MPC), the CBK opted to tighten monetary policy
stance by raising the CBR from 5.75 percent in January 2011 to 6 per cent in March 2011. In the
follow up meetings of July and September, the CBR was raised to 6.25 percent and 7 percent,
respectively. Inflation continued to increase albeit at a decelerating rate while the Kenya Shilling
exchange rate remained volatile and depreciating. Further action on the stance of monetary
policy resulted in raising the CBR by an unprecedented 400 basis points to 11.0 percent in
October 2011 and by 550 basis points and 150 basis points to 16.5 percent and 18.0 percent
respectively in November 2011 and December 2011. These measures were taken to also slow
down private sector credit demand which had partly contributed to the deterioration of the
current account balance.
4.2.3 Repayment Ability
Table 1: Repayment Ability
Period
Ratings 2012 2011 2010 2009 2008
Normal 90% 50% 89% 85% 82%
Watch 6% 26% 4% 7% 9%
Sub Standard 1% 5% 1% 2% 2%
Doubtful 2% 15% 4% 5% 6%
Loss 1% 4% 1% 1% 1%
Total 100% 100% 100% 100% 100%
Source: Author (2013)

51
From the above table, it can be depicted the worst year of predicted poor repayment abilities of
the SMEs for loan repayment was the year 2011. This is when out of gross loan of KShs.
872,135 Million, 50% of them i.e. 436,067.50 was considered normal to mean that well
documented facilities granted to financially sound customers where no weaknesses exist, 26%
i.e. Kshs.226, 755.10 were under watch since they exhibited potential weaknesses but are not
past due. 5% were actually considered sub-standard i.e. Kshs.43, 606.75 Million this is to mean
that the paying capacity of the borrowers were deteriorating., 15% were considered doubtful i.e.
KShs. 130,820.25 Million meaning collection being highly questionable and improbable and 4%
were considered a loss i.e. Kshs.34, 885.40 Million meaning loans considered uncollectible. This
position can be understood to be arising from the run-away interest rate regime that was
witnessed in that year as the Central Bank Rate was increased several times in the year.
Figure 4: Repayment Ability in Pie Charts

52
The year 2008 had 82% of gross loan amounts were considered to have well documented
facilities granted to financially sound customers where no weaknesses exist, 9% were considered
as principal and interest is due and unpaid for 30 to 90 days for term loans. These are facilities
which exhibit potential weaknesses but are not past due. On the other hand, 2% were considered
to have principal and interest due and unpaid for more than 90 to 180 days for term loans and
paying capacity of the borrowers were deteriorating, 6% had principal and interest due and
unpaid for more than 180 to 360 days for term loans and collection being highly questionable
and improbable and finally 1% in loss which means principal and interest is due and unpaid for
more than 12 months for term loans which are then considered uncollectible.
The year 2009 had 85% of gross loan amounts were considered to have well documented
facilities granted to financially sound customers where no weaknesses exist, 7% were considered
as principal and interest is due and unpaid for 30 to 90 days for term loans. These are facilities

53
which exhibit potential weaknesses but are not past due. On the other hand, 2% were considered
to have principal and interest due and unpaid for more than 90 to 180 days for term loans and
paying capacity of the borrowers were deteriorating, 5% had principal and interest due and
unpaid for more than 180 to 360 days for term loans and collection being highly questionable
and improbable and finally 1% in loss which means principal and interest is due and unpaid for
more than 12 months for term loans which are then considered uncollectible.
The year 2010 had 89% of gross loan amounts were considered to have well documented
facilities granted to financially sound customers where no weaknesses exist, 4% were considered
as principal and interest is due and unpaid for 30 to 90 days for term loans. These are facilities
which exhibit potential weaknesses but are not past due. On the other hand, 1% were considered

54
to have principal and interest due and unpaid for more than 90 to 180 days for term loans and
paying capacity of the borrowers were deteriorating, 4% had principal and interest due and
unpaid for more than 180 to 360 days for term loans and collection being highly questionable
and improbable and finally 1% in loss which means principal and interest is due and unpaid for
more than 12 months for term loans which are then considered uncollectible.
The year 2011 had 50% of gross loan amounts were considered to have well documented
facilities granted to financially sound customers where no weaknesses exist, 26% were
considered as principal and interest is due and unpaid for 30 to 90 days for term loans. These are
facilities which exhibit potential weaknesses but are not past due. On the other hand, 5% were
considered to have principal and interest due and unpaid for more than 90 to 180 days for term
loans and paying capacity of the borrowers were deteriorating, 15% had principal and interest
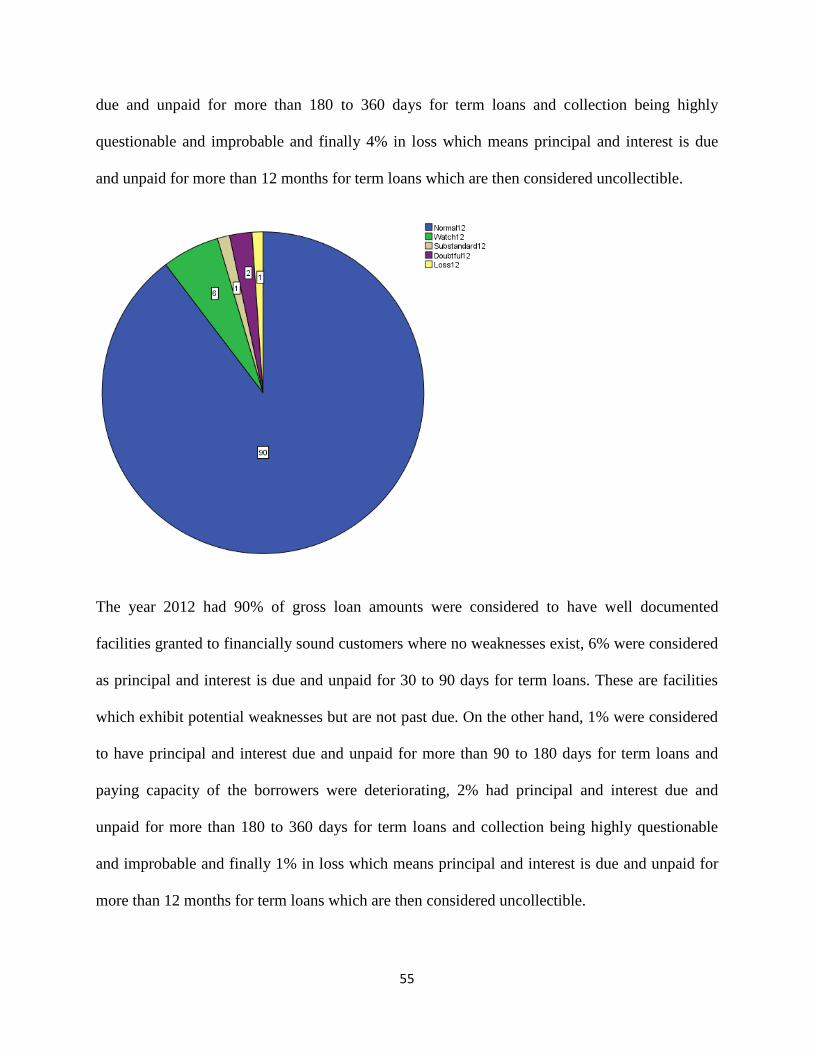
55
due and unpaid for more than 180 to 360 days for term loans and collection being highly
questionable and improbable and finally 4% in loss which means principal and interest is due
and unpaid for more than 12 months for term loans which are then considered uncollectible.
The year 2012 had 90% of gross loan amounts were considered to have well documented
facilities granted to financially sound customers where no weaknesses exist, 6% were considered
as principal and interest is due and unpaid for 30 to 90 days for term loans. These are facilities
which exhibit potential weaknesses but are not past due. On the other hand, 1% were considered
to have principal and interest due and unpaid for more than 90 to 180 days for term loans and
paying capacity of the borrowers were deteriorating, 2% had principal and interest due and
unpaid for more than 180 to 360 days for term loans and collection being highly questionable
and improbable and finally 1% in loss which means principal and interest is due and unpaid for
more than 12 months for term loans which are then considered uncollectible.

56
4.2.4 Growth of Loans Demanded
Table 2: Growth of Loans Demanded
Period
2012 2011 2010 2009 2008
Average Commercial
Bank Lending Rate
18.1% 21.75% 13.87% 14.76% 14.8%
Gross Loan Amounts 1,002,922 872,135 651,400 536,039 299,300
Growth Rate 15% 33.9% 21.5% 79% 0
Source: Author (2013)
The rate of growth of gross loans between the years 2008 and 2009 was 79% yet the rate of
interest was more or less constant. Thereafter in the year 2010, the growth rate was 21.5% yet the
interest rate fell slightly. In 2011, the interest rate increased by 7.88% yet the growth rate of
gross loans was 33.9%. The growth rate was still seen in the year 2012 by 15% despite the
interest rate reducing slightly.
4.2.5 Estimated or Empirical Model
Table 3: Credit Demand
Model Summary
Model R R Square Adjusted R
Square
Std. Error of the
Estimate
1 .934a .873 .809 35058.762
a. Predictors: (Constant), RepayAbility2012, NonPerformLoans2012,
BanksInterest2012
The R square in the above table is 0.873. This number can be interpreted as repayment ability
had a high significance or correlation with the non-performing loans in that particular year.

57
ANOVAa
Model Sum of Squares df Mean Square F Sig.
1
Regression 50484468244.61
6
3 16828156081.53
9
13.691 .004b
Residual 7374700712.984 6 1229116785.497
Total 57859168957.60
0
9
a. Dependent Variable: LoansAmount2012
b. Predictors: (Constant), RepayAbility2012, NonPerformLoans2012, BanksInterest2012
The significance in the above table is 0.004. The above value can therefore be interpreted as
there is a strong linear relationship between the loan amounts and the non-performing loans,
repayment abilities and changes in interest rates in that particular year.
Coefficientsa
Model Unstandardized Coefficients Standardized
Coefficients
t Sig. 95.0% Confidence Interval for B
B Std. Error Beta Lower Bound Upper Bound
1
(Constant) -130826.814 167834.161 -.780 .465 -541502.212 279848.584
BanksInterest2012 9295.152 9634.593 .168 .965 .372 -14279.847 32870.151
NonPerformLoans201
2
20.019 3.361 .996 5.956 .001 11.794 28.243
RepayAbility2012 -.049 .034 -.223 -1.431 .202 -.134 .035
a. Dependent Variable: LoansAmount2012
This depicts that the non-performing loans increased when the loan amounts increased by 99.6%
in that year. (t= 5.956)

58
Table 4: Non Performing Loans
Model Summary
Model R R Square Adjusted R
Square
Std. Error of the
Estimate
1 .450a .203 .103 3777.455
a. Predictors: (Constant), BanksInterest2012
The R square in the above table is 0.203. This number can be interpreted as interest rates had a
lesser significance or correlation with the non-performing loans in that particular year.
ANOVAa
Model Sum of Squares df Mean Square F Sig.
1
Regression 29048802.345 1 29048802.345 2.036 .191b
Residual 114153307.255 8 14269163.407
Total 143202109.600 9
a. Dependent Variable: NonPerformLoans2012
b. Predictors: (Constant), BanksInterest2012
The significance in the above table is 0.191. The above value can therefore be interpreted as
there is a relatively strong linear relationship between the changes in bank interest rates and the
non-performing loans in that particular year.
Coefficientsa
Model Unstandardized
Coefficients
Standardized
Coefficients
t Sig. 95.0% Confidence Interval for
B
B Std. Error Beta Lower Bound Upper Bound
1 (Constant) 24983.167 14664.155 1.704 .127 -8832.435 58798.770
BanksInterest2012 -1239.059 868.415 -.450 -1.427 .191 -3241.627 763.509
a. Dependent Variable: NonPerformLoans2012
This depicts that the non-performing loans increased when the bank interest rates increased by
45% in that year. (t= 1.427)
59
From the table on appendix 3, it can be depicted that the gross loan amounts have a Pearson
correlation of 0.908xx
and 0.693x on non-performing loans and the number loan accounts
respectively. The gross loan amounts also have a significance of 0.000 and 0.038 in relation with
the non-performing loans and number of loan accounts. All these are indicators of strong
significance of the correlations. The non-performing loans have a Pearson correlation of 0.908xx
and 0.887xx
on gross loan amounts and the number of loan accounts respectively. The non-
performing loans also have a significance of 0.000 and 0.001 in relation with gross loan amounts
and number of loan accounts. All these are indicators of strong significance of the correlations.
The number of loan accounts has a Pearson correlation of 0.693x and 0.887
xx on gross loan
amounts and non-performing loans respectively. The number of loan accounts also has a
significance of 0.038 and 0.001 in relation with gross loan amounts and non-performing loans.
All these are indicators of strong significance of correlations.
4.3 Results and Discussion
The study evaluated the various variables that the researcher picked out to check their
relationship with regard to changes in interest rates on demand for credit and loan repayment.
From the above levels of analysis, variables like interest rates, gross loan amounts, loan
accounts, and non-performing loans were assessed.
The result of the study show that for credit demanded the value of R square is 0.873. This means
that independent variables investigated in the study namely non-performing loans and repayment
ability has a strong significance. The regression equation appears useful for making predictions
in credit demanded since R square of 87.3% is considered significant. On the other hand, for
loan repayment, the R square is 0.203. This number can be interpreted as interest rates had a

60
lesser significance or correlation with the non-performing loans in that particular year. The
regression equation appears useful for making predictions in credit demanded since R square of
20.3% is considered less significant
The gross loan amounts have a Pearson correlation of 0.908xx
and 0.693x on non-performing
loans and the number loan accounts respectively. The gross loan amounts also have a
significance of 0.000 and 0.038 in relation with the non-performing loans and number of loan
accounts. All these are indicators of strong significance of the correlations. The non-performing
loans have a Pearson correlation of 0.908xx
and 0.887xx
on gross loan amounts and the number of
loan accounts respectively. The non-performing loans also have a significance of 0.000 and
0.001 in relation with gross loan amounts and number of loan accounts. All these are indicators
of strong significance of the correlations. The number of loan accounts has a Pearson correlation
of 0.693x and 0.887
xx on gross loan amounts and non-performing loans respectively. The number
of loan accounts also has a significance of 0.038 and 0.001 in relation with gross loan amounts
and non-performing loans. All these are indicators of strong significance of correlations.

61
CHAPTER FIVE: SUMMARY, CONCLUSION AND
RECOMMENDATIONS
5.1 Introduction
This chapter depicts the summary of the study, the conclusion and recommendations for further
research. The overall goal of the study was to appreciate the effects of changes of interest rates
on the demand for credit and loan repayments by small and medium enterprises in Kenya. The
results of the study are presented and discussed in the proceeding sections.
5.2 Summary of the Study
The study was geared towards finding out the effects of changes of interest rates on the demand
for credit and loan repayment by small and medium enterprises in Kenya. The study involved
analyzing data from secondary sources. Most of the data was obtained from CBK involving all
the 43 banks in Kenya and various SME sectors. The sectors covered are Agriculture,
Manufacturing, Building & Construction, Mining, Energy & Water, Trade, Tourism, Hotel &
Restaurant, Transport & Communication, Real Estate and Financial Services.
One objective was to find out whether interest rate influences the demand for credit by SMEs in
Kenya. The researcher analyzed the changes in interest rates for a period of 5 years between
years 2008 to year 2012. The year 2011 saw the highest interest rates and still the demand for
gross loans was higher than the previous years.
The second objective was to determine the effect of changes in interest rate on the repayment of
loans by SMEs in Kenya. The same period was analyzed for the repayment ability and still the
year 2011 recorded poor ability to repay the loan installments. This was narrowed down from the

62
behaviour that various SME loan exhibited over this period, indicating that either behaviour had
changed or funds had been diverted or business cash flows had reduced drastically. The research
revealed that non-performing loans are different in each SME sector. This can be influenced by
various factors in the individual sectors. Loan repayments are also influenced greatly by the cash
flows that emanate from the given sectors.
Prevailing lending interest rates charged by commercial banks also matter a lot as at the point
where sectors receive the loans, the usually are ready to pay certain installments. However if this
changes negatively, the repayment is directly affected. Banks at any one point take stocks of
their assets i.e. the loan positions. They are able to categorize the different loans with regard to
possibilities of being recovered or not. It is also clear that SMEs demand for loans is not directly
affected by changes in interest rates. This is because different sectors have different financial
needs at different times.
5.3 Conclusion
The debate on whether high interest rates affect the demand for credit is inconclusive and may go
on indefinitely. There are two main schools of thought. The first school advocates that high
interest rates negatively affect the demand for credit because only limited borrowers with high
risk projects may have their demand satisfied. It was argued that high interest rates encourage
adverse selection of loan seekers. Those who take high risk and have their loans approved are
those with high default rates.
The second school of thought‘s assertion is that high interest rates do not affect the demand for
credit. This study showed that high interest rates were not a major concern for SMEs. In this
study, SMEs still had a high demand for credit even at annual interest rate of 21.75% in the year

63
2011 and even a higher demand for credit at an anal interest rate of 18.1%. Those who are
willing to pay high interest rates may, on average, be worse risks; they are willing to borrow at
high interest rates because they perceive their probability of repaying the loan is low. As the
interest rates rises, the average ―riskiness‖ of those who borrow increases possibly lowering the
bank‘s profits. There are however, many other factors that affect the demand for credit other than
interest rates. These are: internal financing, loans from other banks, loans from non-banks,
issuance of debt securities, issuance of equity, available investment opportunities, drop in CBR
and political risk. SMEs however, often fail to access the financial resources in the required
amounts because banks evaluate them on the basis of a checklist, including; audited financial
statements for the last three years including management accounts, project proposal highlighting
the strengths, weaknesses, opportunities and threats, financial projections, monitoring costs,
credit or default risk because of the problem of information asymmetry and enforcement costs.
The repayment ability of SMEs is directly affected by changes in interest rates. Looking back at
the analysis, the researcher noted that the year 2011 was most harsh in terms of changes in
interest rates. It is in the same year that categorization of loan repayment ability changed sharply.
The loans considered normal were 50% creating a huge variance from an average of 85% in the
other 4 years. 26% were in watch compared to an average of 8% in the remaining 4 years. 15%
were categorized in doubtful when the rest of the years had an average of 4%. Similarly, as the
interest rate and other terms of the contract change, the behavior of the borrower is likely to
change. This therefore means that most SMEs struggled with their current cash flows to meet the
loan installments.

64
5.4 Limitations of the Study
One of the major limitations experienced was use of secondary data entirely. The researcher was
not able to clearly determine what other quantitative and qualitative problems affect SMEs other
than the changes in interest rates. There are so many qualitative aspects that would have come
out better had we used primary data and captured the sentiments directly from the source.
The models applied to analyze the data were so complex and it took a long time to actually work
out and interpret the results. The researcher would have projected the model better had I
combined the use of primary data as well. This is because some variables in the model required
more input other than what was extracted.
Time was a major constraint in this study. The researcher would have wanted to analyze more
relationships but this was not possible since time to complete the study was highly limited. There
was need to review more studies by other researchers to actually investigate various dimensions
on effect of interest rates on demand for credit and loan repayment.
There are limited local previous studies on the same research problem. Most studies that were
close were looking more at the general problems affecting SMEs. The researcher therefore did
not review as much of local studies as desired. There are also a number of interest rates affecting
SMEs other than the bank lending rates. These include CBR, deposit rate and T-Bill rate.
The population and sample used was highly summarized. However, it is a fact that various
sectors have different problems and business environment also has different effect on the SMEs.
The researcher could have done more with primary data on the dynamics and complexities
affecting different sectors as individuals.

65
5.5 Recommendations
5.5.1 Policy Recommendations
The central banks should apply stringent regulations on interest rates charged by banks so as to
regulate their lending interest rate. Commercial banks should also apply rigorous policies on loan
advances so as loans are awarded to those with ability to repay and mitigate moral hazards such
as insider lending and information asymmetry.
Regulations on interest rates have far reaching effects on loan non-performance for such
regulations determine the interest rate spread in banks and also help mitigate moral hazards
incidental to NPAs. When the regulations are lax or ineffective, the level of non-performing
assets increases. In Kenya, banks specific policies and regulations are the responsibility of board
of directors, managing directors and credit risk management committees.
Credit risk management technique remotely affects the value of a bank‘s loan portfolio as
interest rates are benchmarked against the associated non-performing assets. Credit risk
assessment and management ensures that loan are channeled to intended purposes, loans are
allocated to only those who qualify/can repay, loan security/collateral is enough to cover loan,
assessment of the character of the loan candidate and there is sufficient margin to cover loan.
Credit risk management, therefore, directly influences the level of asset nonperformance in
commercial banks.
5.5.2 Suggestions for Further Research
SMEs are a sector that has become very influential in the world over. They are known to
contribute to a huge part of the GDP and employ a number of people in any economy. This is an
area that when well understood, can be a huge source of incomes for banks and other financial
institutions. Therefore further research should be done to investigate what other variables affect

66
them other than interest rates and why SMEs would still have high demand for credit despite
high rates of interest.
Studies have shown that there is a pervasive view amongst some stakeholders that high interest
rate spreads are caused by the internal characteristics of the banks themselves, such as their
tendency to maximize profits in an oligopolistic market, while many others argue that the
spreads are imposed by the macroeconomic, regulatory and institutional environment in which
banks operate. These debates can only be resolved through objective, quantitative analysis of the
determinants of banking sector interest rate spreads in developing countries. Further studies
should be done to establish the links between interest rate spread and the level of NPAs.
There is need for further research that would inform both the government and financial
institutions on what else the banks can do to manage credit risks associated with adverse
selection and moral hazard. This is informed by the observation that SMEs will always demand
for credit since sources of finance is the greatest problem that they experience. A proper model
should be advanced to actually inform understanding of these clientele and how best to lend to
them and have the problem of loan repayment at minimal levels.
67
REFERENCES
Ackah, J., & Vuvor, S. (2011). The Challenges faced by Small & Medium Enterprises (SMEs) in
Obtaining Credit in Ghana. Blekinge: Unpublished.
Aduda, J., Magutu, P. O., & Wangu, G. M. (2012). The Relationship between Credit Scoring
Practices by Commercial Banks and Access to Credit by Small and Medium Enterprises
in Kenya. International Journal of Humanities and Social Science, 203-213.
Amonoo, E., Acquah, P. K., & Asmah, E. E. (2003). The Impact of Interest Rates on Demand for
Credit and Loan Repayment by the Poor and SME's in Ghana. Geneva: ILO Publications
Bureau.
Ayyagari, M., Beck, T., & Demirgüç-Kunt, A. (2007). Small and Medium Enterprises Across the
Globe. Small Business Economics, 29, 415-434.
Beaver, G. (2002). Small Business, Entrepreneurship and Enterprise Development. Harlow:
Pearson Education.
Beck, T., Demirgüç-Kunt, A., & Maksimovic, V. (2008). Financing Patterns around the World:
Are Small Firms Different? Journal of Financial Economics, 89, 467-487.
Bichanga, W. O., & Aseyo, L. (2013). Causes of Loan Default Within Micro Finance Institutions
in Kenya . Interdisciplinary Journal of Contemporary Research in Business, 316-335.
Calice, P., Chando, V. M., & Sekious, S. (2012). Bank Financing to Small and Medium
Enterprises in East Africa: Findings of a Survey in Kenya, Tanzania, Uganda and
Zambia. Tunis: Africa Development Bank Group.
CBK. (1997). Reforming Kenya's Financial Sector. Nairobi: Monthly Economic Review.
CBK. (2013). Credit Officer Survey. Nairobi: Central Bank of Kenya.
CMA. (2010). Capital Raising Opportunities for SMEs: The Develoment of Micro-cap Security
Markets in Kenya. Nairobi: Capital Markets Authority.
Coleman, S. (2000). Access to Capital and Terms of Credit: A Comparison of Men and Women-
Owned Small Businesses. Journal of Small Business Management, 11(1), 37-52.
Edakasi, S. A. (2011, June). Effect of Interest Rates on Loan Repayments; A Case Study of
Equity Bank Masindi Branch.
English, W. B. (2002). Interest Rate Risk and Bank Net Interest Margins. BIS Quartely Review,
67-82.

68
Gori, J. N. (2010). The Relationship between Credit Risk Management Practices and Non-
Performing Loans: A Case Study of Higher Educations Loans Board . Nairobi:
University of Nairobi, School of Business.
Hoque, M. Z., & Hassain, M. Z. (2008, October-November). Flawed Interest RatePolicy and
Loan Default: Experience from a Developing Country. International Review of Business
Research Papers, 4 , 235-246.
IFC. (2010). Scaling-Up SME Access to Financial Services in the Developing World. Seol:
International Finance Corporation.
Karlan, D., & Zinman, J. (2013). Long run Price Elasticities of Demand for Credit: Evidence
from a Countrywide Field Experiment in Mexico. Mexico: Innovations for Poverty
Action and MIT J-PAL.
Kayanula, D., & Quartey, P. (2000). The Policy Environment for Promoting Small and Medium
Sized Enterprises in Ghana and Malawi. Manchester: Institute for Development Policy
and Management, University of Manchester.
Kithinji, A. M. (2010). Credit Risk Management and Profitability of Commercial Banks in
Kenya. University of Nairobi, School of Business, Nairobi.
Kolapo, T. F., Ayeni, R. K., & Oke, M. O. (2012, May). Credit Risk and Commercial Banks'
Performance in Nigeria: A Panel Model Approach. Australian Journal of Business and
Management Research, 2(2), 31-38.
Masese, P. B. (2011). Factors affecting Credit Allocation in Financial Institutions in Kenya.
Eldoret: Moi University.
Ng'etich, J. C., & Wanjau, K. (2011, April). The effects of Interest Rate Spread on the Level of
Non - Performing Assets: A Case of Commercial Banks in Kenya. International Journal
of Business and Public Management, 1(1), 58-65.
Ngugi, R. W., & Kabubo, J. W. (1998). Financial Sector Reforms and Interest Rate
Liberalization: The Kenya Experience. Nairobi: African Economic Research Consortium.
Ochola, J. O. (2010). A Survey of The Credit Risk Management Practices of Commercial Banks
in Kenya. Nairobi: University of Nairobi, School of Business.
Olweny, T. (2011, April). Modelling Volatility of Short -Term Interest Rates in Kenya.
INternational Journal of Business and Social Science, 2(7), 289-303.
Quartey, D. K. (2000). The Policy Environment for Promoting Small and Medium Sized
Enterprises in Ghana and Malawi. Manchester: Institute for Development Policy and
Management, University of Manchester.

69
Schreiner, M., Graham, D. H., & Miranda, M. (1998). Choices by Poor Households when the
Interest Rate for Deposits differs from the Interest Rate for Loans. Washington
University in St. Louis.
Snyder, D. (2008). The Potential for Credit Scoring for SME Lending in Kenya. Nairobi:
Financial Sector Deepening Kenya.
Stiglitz, J. E., & Weiss, A. (1981). Credit Rationing in Markets with Imperfect Information. The
American Economic Review, 71(3), 393-410.
Stiglitz, J. E., & Weiss, A. (1981). Credit Rationing in Markets with Imperfect Information. The
American Economic Review Volume 71, Issue 3, 393-410.
Stiglitz, J. E., & Weiss, A. (1981). Credit Rationing in Markets with Imperfect Information. The
American Economic Review, Volume 71, Issue 3, 393-410.
Wendel, C., & Harvey, M. (2006). SME Credit Scoring: Key Initiatives, Opportunities and
Issues. Access Finance, 10.

70
APPENDICES
APPENDIX 1: INTRODUCTION LETTER
Dear Sir/Madam,
RE: MBA RESEARCH PROJECT
I am a post graduate student at the School of Business, University of Nairobi. As a requirement
in fulfillment of the degree of Master of Business Administration, am carrying out a study on the
Effects of Changes in Interest Rates on the Demand for Credit and Loan Repayments by Small
and Medium Enterprises in Kenya.
Your organization has been chosen as you are well positioned to provide relevant information
that will enable study achieve its objectives. I intend to research on the above mentioned study
by reviewing data from secondary sources.
The information availed will be used only for academic purposes and will be treated with strict
confidence. Where possible, a copy of the research report will be availed to you upon request.
Your assistance and cooperation will be highly appreciated.
Yours faithfully,
LILIAN ODHIAMBO

71
APPENDIX 2: SECONDARY SOURCES OF DATA
Gross Loan Amount in Millions
Period
SME Sector 2012 2011 2010 2009 2008
Agriculture 65,085 61,937 49,400 43,598 27,100
Manufacturing 179,608 156,714 125,100 105,951 70,100
Building & Construction 68,622 41,210 25,300 15,711 35,200
Mining & Quarrying 14,242 16,179 12,000 8,837 5,300
Energy & Water 52,177 36,483 27,000 26,807 0
Trade 263,743 232,729 169,100 135,802 63,800
Tourism/Hotel/Restaurant 32,297 27,685 19,800 15,318 0
Transport &
Communication
98,849 98,252 71,300 63,138 44,300
Real Estate 176,920 146,435 106,700 76,787 26,900
Financial Services 51,379 54,511 45,700 44,090 26,600
Total 1,002,922 872,135 651,400 536,039 299,300
Source: CBK Supervision Reports, 2012, 2011, 2010, 2009 and 2008
Gross Non-Performing Loans in Millions
Period
SME Sector 2012 2011 2010 2009 2008
Agriculture 4,435 4,219 4,600 5,450
Manufacturing 4,016 5,313 7,000 8,422
Building & Construction 2,553 1,749 1,400 1,189
Mining & Quarrying 307 95 100 99
Energy & Water 1,002 203 200 297
Trade 13,852 9,661 12,500 13,377
Tourism/Hotel/Restaurant 1,846 1,989 2,100 1,784
Transport &
Communication
4,751 3,239 3,500 2,973
Real Estate 7,101 6,177 6,500 7,233
Financial Services 1,435 1,281 1,700 2,874
Total 41,298 33,926 39,600 43,698
Source: CBK Supervision Reports, 2012, 2011, 2010, 2009 and 2008

72
No. of Loan Accounts
Period
SME Sector 2012 2011 2010 2009 2008
Agriculture 118,508 109,873 117,371
Manufacturing 22,577 20,559 18,936
Building & Construction 12,560 11,580 7,923
Mining & Quarrying 1,338 1,586 1,022
Energy & Water 6,168 5,247 4,896
Trade 327,713 315,076 285,763
Tourism/Hotel/Restaurant 5,875 5,791 5,364
Transport &
Communication
32,484 28,587 23,521
Real Estate 25,277 23,157 14,495
Financial Services 18,208 18,355 29,683
Total 570,708 539,811 508,974
Source: CBK Supervision Reports, 2012, 2011 and 2010
Repayment Ability in Millions
Period
Ratings 2012 2011 2010 2009 2008
Normal 1,192,833 1,082,805 816,467 636,060 549,456
Watch 76,789 55,373 39,541 51,037 59,048
Sub Standard 16,370 10,848 11,431 13,756 15,460
Doubtful 29,798 32,382 36,329 38,161 40,316
Loss 14,575 9,577 11,142 8,746 6,093
Total 1,330,365 1,190,985 914,910 747,760 670,373
Source: CBK Supervision Reports, 2012, 2011, 2010, 2009 and 2008
Average Commercial Banks Lending Interest Rates
Period
Interest Rates 2012 2011 2010 2009 2008
Average Commercial
Bank Lending Rate
18.1 21.75 13.87 14.76 14.8
Source: CBK Supervision Reports, 2012, 2011, 2010, 2009 and 2008
Total Interest on Advances
PERIOD
Total Interest on Advance 2012 2011 2010 2009 2008
216,807 142,036 142,036 104,006 91,188 75,151
Source: CBK Supervision Reports, 2012, 2011, 2010, 2009 and 2008

73
APPENDIX 3: CORRELATION BETWEEN THE DIFFERENT VARIABLES
Correlations
Norma
l12
LAmtYe
ar2012
NonPerfY
ear2012
NoLoan
sYear20
12
LendRat
es12
Watch
12
Substand
ard12
Doubtf
ul12
Loss1
2
Normal12
Pearson
Correlation
.a .
a .
a .
a .
a .
a .
a .
a .
a
Sig. (2-tailed) . . . . . . . .
N 10 10 10 9 10 10 10 10 10
LAmtYear2
012
Pearson
Correlation
.a 1 .908
** .693
* .
a .
a .
a .
a .
a
Sig. (2-tailed) . .000 .038 . . . . .
N 10 10 10 9 10 10 10 10 10
NonPerfYea
r2012
Pearson
Correlation
.a .908
** 1 .887
** .
a .
a .
a .
a .
a
Sig. (2-tailed) . .000 .001 . . . . .
N 10 10 10 9 10 10 10 10 10
NoLoansYe
ar2012
Pearson
Correlation
.a .693
* .887
** 1 .
a .
a .
a .
a .
a
Sig. (2-tailed) . .038 .001 . . . . .
N 9 9 9 9 9 9 9 9 9
LendRates1
2
Pearson
Correlation
.a .
a .
a .
a .
a .
a .
a .
a .
a
Sig. (2-tailed) . . . . . . . .
N 10 10 10 9 10 10 10 10 10
Watch12
Pearson
Correlation
.a .
a .
a .
a .
a .
a .
a .
a .
a
Sig. (2-tailed) . . . . . . . .
N 10 10 10 9 10 10 10 10 10
Substandar
d12
Pearson
Correlation
.a .
a .
a .
a .
a .
a .
a .
a .
a
Sig. (2-tailed) . . . . . . . .
N 10 10 10 9 10 10 10 10 10
Doubtful12
Pearson
Correlation
.a .
a .
a .
a .
a .
a .
a .
a .
a
Sig. (2-tailed) . . . . . . . .
N 10 10 10 9 10 10 10 10 10
Loss12
Pearson
Correlation
.a .
a .
a .
a .
a .
a .
a .
a .
a
Sig. (2-tailed) . . . . . . . .
N 10 10 10 9 10 10 10 10 10
**. Correlation is significant at the 0.01 level (2-tailed).
*. Correlation is significant at the 0.05 level (2-tailed).
a. Cannot be computed because at least one of the variables is constant.
Source: Author (2013)