Embed Size (px)
Citation preview
University of Central Florida University of Central Florida
STARS STARS
Electronic Theses and Dissertations, 2004-2019
2016
The effect of Baldrige performance excellence program on The effect of Baldrige performance excellence program on
organization's innovation/dynamic capabilities organization's innovation/dynamic capabilities
Mohammed Alomairy University of Central Florida
Part of the Industrial Engineering Commons
Find similar works at: https://stars.library.ucf.edu/etd
University of Central Florida Libraries http://library.ucf.edu
This Doctoral Dissertation (Open Access) is brought to you for free and open access by STARS. It has been accepted
for inclusion in Electronic Theses and Dissertations, 2004-2019 by an authorized administrator of STARS. For more
information, please contact [email protected].
STARS Citation STARS Citation Alomairy, Mohammed, "The effect of Baldrige performance excellence program on organization's innovation/dynamic capabilities" (2016). Electronic Theses and Dissertations, 2004-2019. 4967. https://stars.library.ucf.edu/etd/4967
THE EFFECT OF BALDRIGE PERFORMANCE EXCELLENCE PROGRAM ON ORGANIZATION’S INNOVATION/DYNAMIC
CAPABILITIES
by
MOHAMMED HAMED ALOMAIRY
B.S.E.E King Abdulaziz University, 1996 MBA University of Central Florida, 2011 M.S. University of Central Florida, 2012
A dissertation submitted in partial fulfillment of the requirements for the degree of Doctor of Philosophy
in the Department of Industrial Engineering and Management Systems in the College of Engineering and Computer Science
at the University of Central Florida Orlando, Florida
Spring Term 2016
Major Professor: Ahmad Elshennawy
ii
ABSTRACT
This dissertation investigated the effect of Baldrige performance excellence program on
organization’s innovation/dynamic capabilities improvement. According to the literature, there is
little or no practical method for building dynamic/innovation capabilities within organizations.
The study hypothesizes that Baldrige performance excellence program helps organizations to
systematically develop the required dynamic/innovation capabilities for innovation.
Twenty-four organizations that had implemented Baldrige program over the past five
years participated in this research study. Two types of data were measured/collected from these
organizations; Performance excellence data and Innovation capabilities data. To avoid bias in the
data collection, the two data were measured and collected at different time frames and using
different tools and methods. The analysis confirmed positive correlation between Organizations’
performance excellence improvement through Baldrige program and Innovation capabilities
represented in the Six Building Blocks Innovation model used in this research study.
The performance excellence data of the organizations were measured using three
different assessment programs from Florida Sterling Council, the state approved version of the
US National Malcolm Baldrige Quality Award Program. The three different assessment
programs were designed to help organizations in various stages of their performance excellence
journey. Challenge program; designed for new organizations that have no experience with
Baldrige criteria and typically have low performance, requires a written application and a team
of five experienced examiners to visit the organization and conduct thorough interviews with the
all the employees. Governor Sterling Award (GSA) program; designed for more experienced
iii
organizations that want to further improve their performance using intensive assessment criteria,
requires a written application and a team of eight experienced examiners to visit the organization
and conduct intensive interviews with most of the the employees. And Governor Sustained
program; designed for mature organizations that completed the GSA assessment in the past three
years and want to continue sustain their performance, requires a written application and a team of
three experienced examiners to visit the organization and conduct a thorough meetings and
interviews with management level employees.
ANOVA statistical tool was used to analyze the difference in performance among the
organizations that participated in at least one of the three assessment programs. The result
showed a statistical difference with challenge program being the control group. This confirms
that organizations’ can systematically improve their performance when implementing Baldrige
performance excellence program.
The innovation capabilities data of the participated organizations were
measured/collected using a survey-based tool. The innovation capabilities survey covers six
building blocks; Innovation Value, Innovation Behavior, Innovation Climate, Innovation
Resources, Innovation Process, Innovation Success measures. The Overall innovation
capabilities measured based on the average score of all the six innovation building blocks.
ANOVA statistical tool was used to analyze the innovation capabilities of organizations
from the three assessment programs. The result confirmed a statistical difference with challenge
program being the control group.
iv
Regression analysis was also used to analyze the relationship between performance
excellence and each of the six innovation building blocks.
The outcome of the study shows a positive correlation between the implementation of
Baldrige performance excellence and organizations’ innovation capabilities. Which confirms that
Baldrige performance excellence program can be used by organizations to systematically build
the required dynamic/innovation capabilities for innovations.
I would like to dedicated this to those special people in my life
My parents,
Who provided me with all the love, wisdom, compassion and bles sing. The ones who always
pray for me and support me all the time. I pray to Allah to extend your life, keep you healthy and
help me give back part of what you provided me.
My brothers Dr. Khalid, Captain Tariq, Haytham, and Hattan,
Thank you for your encouragement and support during all the years.
My only Sister Dr. Kholoud,
Who inspired me to continue my graduate studies and encouraged me all the time. I am really
proud of you.
My children Azzam, Alyaa and Zainah,
Who always draw smile on my face and cheer me up. You always inspire me to be the role
model that you deserve.
Finally, my wife, Mervat Binsilm,
The person who shared the past 15 years with me and provided me with unconditional love and
support. Without your sacrifice, encouragement and support this dissertation would not have
been possible. You are the best thing happened to me in life and I will never forget what you did
to me throughout this journey.
ACKNOWLEDGMENT
In the name of Allah, the most gracious, the most merciful
Praise be to Allah, the lord of the worlds and the blessings and the peace be upon the last messenger
of Allah, Mohammed (peace be upon him). First and foremost, thanks and praise to Allah, the most
Gracious and the most Merciful.
I would like to acknowledge some of the people who guided and supported me in this journey.
Dr. Ahamd Elshennawy, my advisor and my mentor, who helped guided me through the Master and
PhD. program and supported me in and outside UCF. I would like also to thank Dr. Bob Porter, my
MBA professor and PhD. Dissertation Committee member, who provided many insights that
developed me in the field of strategic management and Innovation. I also would like to thank my
dissertation committee members Dr. Luis Rabelo and Dr. Petros Xanthopoulos for their advices
and guidance. My deep gratitude to all professors and members of the IEMS and Business
departments at UCF for providing me with the intellectual and knowledge in the fields of IE and
Business.
I would like to express my deepest gratitude to Saudi Airlines for nominating me to continue my
higher education and trusted my ability to be one of the organization’s future leaders. My deepest
gratitude goes to all my friends and colleagues at Saudi Airlines who encouraged and supported me
all the time. I am also grateful to the Government of Saudi Arabia represented by the Ministry of
Higher Education for funding and supporting my education journey.
A special thank goes to Florida Sterling Council for supporting my research and providing me with
all the data needed to complete this dissertation. I am so grateful to Florida Sterling for shaping my
management skills and consulting experience.
ii
TABLE OF CONTENTS
LIST OF FIGURES ...............................................................................................................vii
LIST OF TABLES ................................................................................................................... x
CHAPTER ONE: INTRODUCTION..................................................................................... 1
Research question and objective ......................................................................................... 3
Research objective ............................................................................................................... 6
Research Gap........................................................................................................................ 6
Expected contribution .......................................................................................................... 6
Research Assumptions ......................................................................................................... 7
CHAPTER TWO: LITERATURE REVIEW ........................................................................ 8
Introduction .......................................................................................................................... 8
Methodology .................................................................................................................... 8
Innovation ............................................................................................................................. 9
Classes (magnitude) of innovations.............................................................................. 12
Types of innovations...................................................................................................... 14
Product innovation ..................................................................................................... 15
Process innovation ..................................................................................................... 16
Organizational innovation ......................................................................................... 16
Marketing innovations ............................................................................................... 16
iii
Innovation referent dimension ...................................................................................... 17
Innovation levels of analysis ......................................................................................... 18
Diffusion of innovation ................................................................................................. 19
Organization Innovativeness and innovative capacity ................................................ 20
Process of innovation..................................................................................................... 22
Innovation as a value chain ....................................................................................... 22
Innovation and organization performance.................................................................... 23
Organizational innovation and performance:........................................................... 25
Process innovation and performance:....................................................................... 27
Product innovation and performance:....................................................................... 27
Marketing innovation and performance: .................................................................. 28
Measuring organization innovativeness ....................................................................... 29
Innovation output indicators: .................................................................................... 30
Innovation input indicators: ...................................................................................... 32
Innovation process indicators: .................................................................................. 33
Multi-dimensions indicators: .................................................................................... 34
Data collection methodology: ................................................................................... 35
Organizational capabilities ................................................................................................ 36
Capabilities for Innovation............................................................................................ 39
iv
Malcolm Baldrige Framework .......................................................................................... 41
MBNQA and organization performance ...................................................................... 45
MBNQA Critics & supporters ...................................................................................... 46
Baldrige and Organization’s Dynamic/innovation capabilities .................................. 48
Possible future work........................................................................................................... 49
Conclusion .......................................................................................................................... 50
CHAPTER THREE: METHODOLOGY ............................................................................. 52
Introduction ........................................................................................................................ 52
Methodology....................................................................................................................... 52
Participants ......................................................................................................................... 55
Instruments ......................................................................................................................... 55
Baldrige Framework (Sterling Assessment) ................................................................ 55
Innovation Survey.......................................................................................................... 56
Measurement scale ............................................................................................................. 60
Baldrige Framework (Sterling Assessment) ................................................................ 60
Innovation Survey.......................................................................................................... 61
Quality and validity of tools: ............................................................................................. 66
Analysis .............................................................................................................................. 68
Phased Timeline ................................................................................................................. 70
v
Detailed timeline ................................................................................................................ 71
Limitations.......................................................................................................................... 72
CHAPTER FOUR: FINDINGS ............................................................................................ 74
Introduction ........................................................................................................................ 74
Data demographics............................................................................................................. 74
Organizations Performance excellence data..................................................................... 75
Organizations innovation data........................................................................................... 92
Innovation data analysis..................................................................................................... 94
Innovation – Value....................................................................................................... 100
Innovation – Climate ................................................................................................... 110
Innovation – Resources ............................................................................................... 115
Innovation – Process.................................................................................................... 119
Innovation – Success ................................................................................................... 123
Innovation – Overall score .......................................................................................... 128
CHAPTER FIVE: DISCUSSION ....................................................................................... 133
Performance excellence improvement ............................................................................ 134
Research questions and results ........................................................................................ 135
Final Research Model results ...................................................................................... 138
Performance excellence effect on Innovation’s value ............................................... 139
vi
Performance excellence effect on Innovation’s behavior ......................................... 141
Performance excellence effect on Innovation’s climate/Culture .............................. 143
Performance excellence effect on Innovation’s resources ........................................ 145
Performance excellence effect on Innovation’s Process ........................................... 147
Performance excellence effect on Innovation’s success measurement .................... 149
Performance excellence effect on overall Innovation capabilities ........................... 151
CHAPTER SIX: SUMMARY & CONCLUSIONS .......................................................... 153
Key Findings .................................................................................................................... 159
Future work....................................................................................................................... 162
APPENDIX A: INNOVATION SURVEY QUESTIONNAIRES ................................... 164
APPENDIX B: BALDRIGE ASSESSMENT CRITERIA ............................................... 166
Challenge Assessment program ...................................................................................... 167
GSA Assessment program............................................................................................... 174
Sustain Assessment program ........................................................................................... 201
APPENDIX C: INNOVATION SURVEY DATA............................................................ 204
APPENDIX D: PERFORMANCE EXCELLENCE DATA ............................................. 206
APPENDIX E: IRB HUMAN SUBJECTS PERMISSION LETTER.............................. 208
LIST OF REFERENCES..................................................................................................... 210
vii
LIST OF FIGURES
Figure 1: Conceptual framework for the study ...................................................................... 3
Figure 2: Research Model........................................................................................................ 5
Figure 3: Research Model...................................................................................................... 54
Figure 4: Phased timeline ...................................................................................................... 70
Figure 5: Tukey 95% CI difference of means for performance score ................................ 79
Figure 6: Dunnett method test using Challenge assessment as a control group................. 81
Figure 7: Normality test ......................................................................................................... 83
Figure 8: Performance score per program ............................................................................ 84
Figure 9: individual value plot of performance score vs. assessment type ........................ 84
Figure 10: Histogram ............................................................................................................. 88
Figure 11: Residual vs. Fits ................................................................................................... 89
Figure 12: Normality test without outlier point.................................................................... 89
Figure 13: Residual vs. Order................................................................................................ 90
Figure 14: Performance score per program .......................................................................... 90
Figure 15: Individual value plot of performance score vs. assessment type ...................... 91
Figure 16: Individual plot for innovation score per assessment program .......................... 93
Figure 17: Tukey 95% CI difference of means for innovation score.................................. 96
Figure 18: Dunnett method test using Challenge assessment as a control group .............. 97
Figure 19: Normality test for innovation scores................................................................... 98
Figure 20: interval plot of innovation vs. assessment groups ............................................. 99
Figure 21: individual value plot of innovation vs. assessment groups ............................. 100
viii
Figure 22: Fitted line plot for linear model ........................................................................ 102
Figure 23: Fitted line plot for the quadratic model ............................................................ 104
Figure 24: Tukey test difference of means for innovation value ...................................... 105
Figure 25: Interval Plot of Innovation value vs. assessment type ..................................... 105
Figure 26: Fitted line plot for linear model ........................................................................ 107
Figure 27: Fitted line plot for quadratic model .................................................................. 109
Figure 28: Tukey test different of means for Innovation Behavior .................................. 110
Figure 29: Interval plot of Innovation Behavior vs. assessment type............................... 110
Figure 30: Fitted line plot for linear model ........................................................................ 112
Figure 31: Fitted line plot for quadratic model .................................................................. 113
Figure 32: Tukey test different of means for Innovation Climate .................................... 114
Figure 33: Interval plot of Innovation Climate vs. assessment type ................................. 115
Figure 34: Fitted line plot for linear model ........................................................................ 117
Figure 35: Tukey test different of means for Innovation Resources................................. 118
Figure 36: Interval plot for innovation resources vs. assessment type ............................. 119
Figure 37: Fitted line plot for linear model ........................................................................ 121
Figure 38: Tukey test different of means for Innovation Process ..................................... 122
Figure 39: Interval plot of Innovation Process vs. assessment type ................................. 123
Figure 40: Fitted line plot for linear model ........................................................................ 125
Figure 41: Tukey test different of means for Innovation Success .................................... 127
Figure 42: Interval plot of Innovation Success vs. assessment type ................................. 127
Figure 43: Fitted line plot for linear model ........................................................................ 131
ix
Figure 44: Overall innovation normal probability plot...................................................... 131
Figure 45: Anderson darling normal probability plot ........................................................ 132
Figure 46: Performance Scores Box Plot............................................................................ 135
Figure 47: Research Model Results .................................................................................... 138
Figure 48: Sterling Assessment type on Innovation Value ............................................... 140
Figure 49: Sterling assessment type on Innovation Behavior ........................................... 142
Figure 50: Sterling Assessment type on Innovation Climate ............................................ 144
Figure 51: Sterling Assessment type on Innovation Resources ........................................ 146
Figure 52: Sterling Assessment type on Innovation Process............................................. 148
Figure 53: Sterling Assessment type on Innovation Success ............................................ 150
Figure 54: Sterling Assessment type on Overall Innovation score ................................... 152
x
LIST OF TABLES
Table 1: Sterling Measurement scale .................................................................................... 61
Table 2: Innovation Capabilities score ................................................................................. 63
Table 3: Process criteria measurement scale ........................................................................ 64
Table 4: Results criteria measurement scale......................................................................... 65
Table 5: Detailed timeline ..................................................................................................... 71
Table 6: Performance excellence scores ............................................................................... 76
Table 7: Different assessment programs data....................................................................... 77
Table 8: ANOVA-Challenge, GSA, Sustain ........................................................................ 78
Table 9: Tukey method to compare pairs of groups ............................................................ 79
Table 10: Dunnett method test using Challenge assessment as a control group................ 80
Table 11: Model summary..................................................................................................... 82
Table 12: Different assessment programs data without outliers ......................................... 85
Table 13: ANOVA-Challenge, GSA, Sustain ...................................................................... 86
Table 14: Tukey method to compare pairs of means ........................................................... 87
Table 15: Model Summary .................................................................................................... 88
Table 16: Innovation scores................................................................................................... 92
Table 17: innovation overall scores ...................................................................................... 93
Table 18: Innovation scores without outliers ....................................................................... 94
Table 19: ANOVA-Innovation Challenge, GSA, Sustain ................................................... 94
Table 20: Tukey method to compare pairs of means ........................................................... 95
Table 21: Dunnett method test using Challenge assessment as a control group................ 96
xi
Table 22: Innovation scores model summary....................................................................... 98
Table 23: Innovation value vs. Performance excellence ................................................... 101
Table 24: Linear regression test for Innovation Value vs. performance score................. 102
Table 25: Quadratic regression test for innovation value vs. performance excellence ... 103
Table 26: ANOVA test for Innovation Value .................................................................... 104
Table 27: Tukey method test for Innovation Value ........................................................... 104
Table 28: Innovation Behavior vs. Performance excellence ............................................. 106
Table 29: Linear regression for innovation Behavior vs. performance excellence.......... 107
Table 30: Quadratic regression for innovation Behavior vs. performance excellence .... 108
Table 31: ANOVA test for Innovation Behavior ............................................................... 109
Table 32: Tukey method test for Innovation Behavior ...................................................... 109
Table 33: Innovation Climate vs. Performance excellence ............................................... 111
Table 34: Linear regression for innovation Climate vs. performance excellence............ 112
Table 35: Quadratic regression for innovation Climate vs. performance excellence ...... 113
Table 36: ANOVA test for Innovation Climate ................................................................. 114
Table 37: Tukey method test for Innovation Climate ........................................................ 114
Table 38: Innovation Resources vs. Performance excellence ........................................... 116
Table 39: Linear regression for innovation Resources vs. performance excellence........ 117
Table 40: ANOVA test for Innovation Resources ............................................................. 118
Table 41: Tukey method test for Innovation Resources .................................................... 118
Table 42: Innovation process vs. performance excellence ................................................ 120
Table 43: Linear regression for innovation process vs. performance excellence ............ 121
xii
Table 44: ANOVA test for Innovation Process.................................................................. 122
Table 45: Tukey test for Innovation Process ...................................................................... 122
Table 46: Innovation Success vs. performance excellence ............................................... 124
Table 47: Linear regression for innovation success vs. performance excellence ............ 125
Table 48: ANOVA test for Innovation Success ................................................................. 126
Table 49: Tukey method test for Innovation Success ........................................................ 126
Table 50: Innovation overall score vs. performance excellence ....................................... 129
Table 51: Linear regression for innovation overall score vs. performance excellence ... 130
Table 52: innovation overall score normality test.............................................................. 132
Table 53: Innovation survey data ........................................................................................ 205
Table 54: Performance excellence data .............................................................................. 207
1
CHAPTER ONE: INTRODUCTION
During the 80s and 90s, competitive advantage was mainly based on mainstream
activities such as efficiency, quality, customer service and speed. However, in today’s emerging
knowledge economy and global competitions, Innovation became the main competitive
advantage and the indispensable resource for organizations to stay alive in today’s fast changing
global market.
It is not enough for an organization to rely on its past experience or current financial
status to sustain its business in the future, threat of substitution due to advancement in
technologies, innovation in products or introduction of new business models are out there all the
time. It is becoming harder for organization to survive today’s market competition without
continuous innovation. Thus, Innovation is the lifeblood for every living organization and it
must be in the center of every high performing organization.
In order to innovate, an organization must have innovation capabilities. Scholars call
them dynamic capabilities, which are the ability to build, integrate, and manage internal and
external resources to adopt or develop new ideas and convert them into innovative outcome.
Such dynamic capabilities are not easy to develop and maintain in an organization, they require a
holistic change to the organization culture, learning, processes, and strategies, and they also
require time, leadership, and perseverance.
Baldrige Performance excellence program provides none prescriptive solution and
guidance for senior management to assess current performance and institute a continuous
improvement system throughout the organization, which makes Baldrige an ideal framework for
2
organization to use in order to develop the required innovation capabilities . In this research, I
will study the effect of Baldrige performance excellence program on organization
innovation/dynamic capabilities, through analyzing three different performance excellence
assessment programs at Florida Sterling.
Florida Sterling Council is the approved Florida version of the US National Malcolm
Baldrige Quality Award Program. Florida Sterling offers seven management assessment
programs to help organizations in Florida improve their performance excellence. Three of the
different assessment programs are award level programs that require a written application by the
organizations and experienced external examiners. These three programs are: Sterling Challenge
Award, Governor Sterling Award (GSA), and Governor Sterling Sustained Award.
This research study will utilize Baldrige framework to measure the performance
excellence of a twenty-four organizations, each participating in one of the three Sterling award
assessment programs. The study will also measure the innovation capabilities of these
organizations that completed one of Florida Sterling performance excellence programs using a
survey-based tool. The data collected from both measurements of performance excellence and
innovation capabilities are completely independent from each other, as each measurement will be
conducted through a different mean and during a separate timing frame.
3
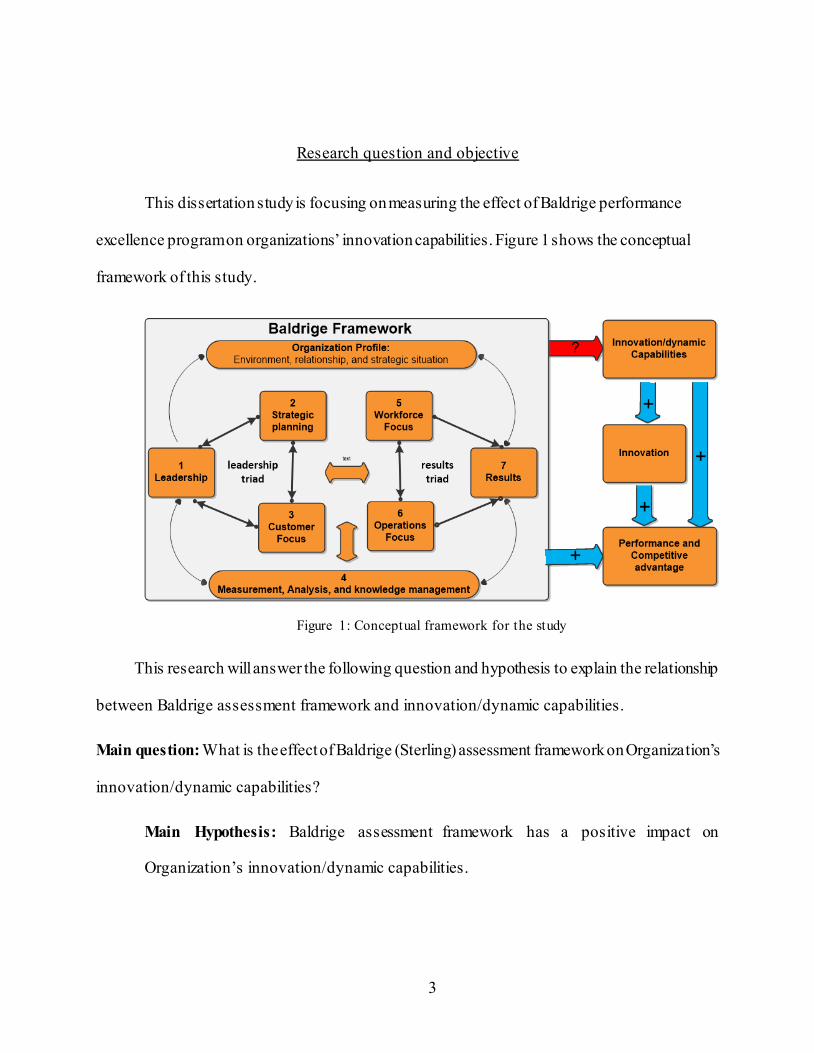
Research question and objective
This dissertation study is focusing on measuring the effect of Baldrige performance
excellence program on organizations’ innovation capabilities. Figure 1 shows the conceptual
framework of this study.
Figure 1: Conceptual framework for the study
This research will answer the following question and hypothesis to explain the relationship
between Baldrige assessment framework and innovation/dynamic capabilities.
Main question: What is the effect of Baldrige (Sterling) assessment framework on Organization’s
innovation/dynamic capabilities?
Main Hypothesis: Baldrige assessment framework has a positive impact on
Organization’s innovation/dynamic capabilities.
4
To answer the research main question, further sub-questions and hypothesises have been
developed, each sub-question addresses one of six areas that represent a foundation block for
organization’s innovation capabilities (figure 2.0).
Sub-question 1: What is the effect of Baldrige assessment framework on Organization’s value for
innovation?
Hypothesis, H1: Baldrige assessment framework has a positive impact on Organization’s
value for innovation.
Sub-question 2: What is the effect of Baldrige assessment framework on Organization’s
behaviour regarding innovation?
Hypothesis, H2: Baldrige assessment framework has a positive impact on Organization’s
behaviour regarding innovation.
Sub-question 3: What is the effect of Baldrige assessment framework on Organization’s
innovation culture?
Hypothesis, H3: Baldrige assessment framework has a positive impact on Organization’s
innovation culture.
Sub-question 4: What is the effect of Baldrige assessment framework on Organization’s
innovation’s resources?
Hypothesis, H4: Baldrige assessment framework has a positive impact on Organization’s
innovation’s resources.

5
Sub-question 5: What is the effect of Baldrige assessment framework on Organization’s
innovation’s processes?
Hypothesis, H5: Baldrige assessment framework has a positive impact on Organization’s
innovation processes.
Sub-question 6: What is the effect of Baldrige assessment framework on Organization’s
innovation measurement?
Hypothesis, H6: Baldrige assessment framework has a positive impact on Organization’s
innovation’s measurement.
Figure 2: Research Model
6
Research objective
The objective of this research is to study the effect of Baldrige program on organizations
innovation capabilities, and to show that this business performance excellence program can help
and guide organizations to conduct the required holistic changes to improve organizations
innovation’ capabilities.
Research Gap
According to literature, there is very little in-depth research on how organizational
capabilities for innovation are developed in practice (Börjesson & Elmquist, 2011). In the
Baldrige side, a recent study shows that limited amount of scholarly research has been performed
using the Baldrige Criteria and applicant data (Evans & Mai, 2014). The study argues that
rigorous research on the impact and effectiveness of the Baldrige program is still nascent.
This dissertation research addresses both calls from organizational capabilities and
Baldrige program literatures. In this study, the effect of Baldrige program on organization
innovation capabilities will be assessed and analyzed (Figure 1.0).
Expected contribution
This study will contribute to both theoretical body of knowledge and practice. In theory,
this study will contribute to organizational capabilities theory through suggesting Baldrige
program as a practical and systematic framework for improving organizational capabilities for
ordinary capabilities and dynamic/innovation capabilities.
7
In practice, this study will help convince organizations leaders and senior managers that
Baldrige program can be used as a framework to guide the organization step by step in assessing
its current capabilities, identifying the gap in its ability to innovate and then systematically
developing and improving the skills, knowledge and processes that are needed to support
organization’s innovation.
Research Assumptions
In this research, several assumptions have been made. First, this study assumes that
organizations participating in Baldrige program know about innovation and have the intentions
to innovate. Secondly, participating employees in the survey are active in their organization and
are aware of their organization innovation efforts. Third, This study assumes that organizations
are participating in Baldrige (Florida Sterling) program to improve their performance excellence
and not for just winning a state award.
8
CHAPTER TWO: LITERATURE REVIEW
Introduction
This literature review covers multiple areas of interest as I am trying to link more than
one discipline to come up with an innovative research topic for my PhD. Dissertation. My
research links three main bodies of knowledge; Total quality management systems represented in
Baldrige program, Organization’s innovation, and organization’s capabilities. As I went through
the literatures and papers that cover these bodies of knowledge I managed to scope the research
to focus on Organization’s innovation/dynamic capabilities area of study and how they are
affected by a total quality management system such as Baldrige Performance Excellence
Program.
Methodology
The literature review started with collecting past literature reviews on the different bodies
of knowledge to understand the current status and know the important and significant research
studies in the field. Several key words were used in the title such as “organization’s innovation”,
“innovation capabilities”, “Baldrige” and “performance improvement” in the following
electronic databases: Science Direct, Proquest, Emerald, and Google scholar. Peer reviewed
mark was checked during the search. However, some references (less than 10%), mostly related
to Baldrige, are either books or manuals and are not considered peer-reviewed articles. Selection
criteria were based on number of citation for papers published before 2010, as I selected the most
cited papers, the ones that have been referenced at least more than 5 times a year, many of the
selected papers are referenced hundreds of times. Also the journal name was used to assess the
9
quality of the paper for articles that have been published in the past two years with low number
of citations.
Innovation
Literatures reviews show no common definition for the term “innovation”, which lead to
confusion and challenges in qualifying innovation activities to advance the body of knowledge
(Cooper, 1998; Zairi, 1994). The different understanding of innovation is mainly attributed to the
vast studies on the topic in diverse fields of knowledge and by different communities of
researchers (F. Damanpour & Aravind, 2011). Lack of communication between these different
communities added some degree of fuzziness to the basic concept of innovation (J. Fagerberg,
2004).
Different definitions of innovation have been offered over the years. As early as 1934, J.
Schumpeter defined innovation as a phenomenon that includes any of the following: 1)
introduction of a new good; 2) introduction of a new method of production; 3) opening new
market; 4) opening up a new source of supply for raw material; 5) creating a new organization
structure. Another early definitions of innovation stated, “Innovation is the generation,
acceptance and implementation of new ideas, processes products or services” (Thompson, 1965).
At the organizational level, Innovation is defined as “any idea, practice, or material artifact
perceived to be new by the relevant unit of adoption” (Zaltman, Duncan, & Holbek, 1973).
Innovation is defined as “the generation, development, and adaptation of novel ideas on the part
of the firm” (F. Damanpour, 1991). Another definition which was also quoted in 2009 (Wong,
Tjosvold, & Liu, 2009) states “Innovation can be defined as the effective application of
10
processes and products new to the organization and designed to benefit it and its stakeholders”
(West & Anderson, 1996). At the managerial level, innovation includes any policy, structure,
method or process, or any product or market opportunity that the manager of an operating unit
perceives to be new (Nohria & Gulati, 1996).
Some scholars tie innovation with “change”, they see innovation as a driver for change
that is needed due to external market pressure or as strategy to influence the external market (F.
Damanpour, 1996). While innovation results in change, not every change is innovation.
Researchers use the word “new” to distinguish innovation from regular changes (Johannessen,
Olsen, & Lumpkin, 2001; Slappendel, 1996). Also the amount of change resulted from an
introduced innovation depends on the organization’s resources, capacity, strategy, and need
(Baregheh, Rowley, & Sambrook, 2009).
The common theme in all different definitions of innovation is the key word “new”, a
further definition went on assessing the relativeness of the idea to the adopted entity, “As long as
the idea is perceived as new to the people involved, it is an ‘innovation’ even though it may
appear to others to be an ‘imitation’ of something that exists elsewhere” (Van de Ven, 1986).
Using the same concept of referent entity, Innovation is defined as an idea, practice or object that
is perceived as new by an individual or other unit of adoption (E.M. Rogers, 2002).
Sometimes people confuse innovation with invention. While invention is the process of
developing or generating a new idea and make it workable, Innovation on the other hand is the
process of converting this new idea into application used by customers and commercially
accepted in the market (Roberts, 2007). So a new workable idea will remain as an invention until
11
this idea goes through a process of manufacturing, marketing, and sales and get accepted by the
customers. Producing an economic value is the main distinction between invention and
innovation (Garcia & Calantone, 2003)
In addition, an invention requires technical knowledge in the field to come up with a new
workable idea, However, innovation requires the rest of skills needed to successfully carry this
idea from the lab or testing field to the outside world, such as manufacturing, management,
marketing, financing skills. (Jan Fagerberg, 2006; Garcia & Calantone, 2003; Roberts, 2007). So
innovation is the process of converting a static idea into a dynamic living product, process, or
concept.
Innovation always follows the introduction of an idea, in some cases there is a
considerable amount of time, years or decades, separate an invention from innovation. This could
be due to lack of required infrastructure, major input, complementary product, or basically
insufficient needs (Jan Fagerberg, 2006). For example, when Microsoft introduced the tablet PC
in 1999, after a decade of trials by other companies, the product failed in the market due to lack
of wireless infrastructure as requirement for mobility and lack of developed applications. On the
contrary, when Apple introduced its tablet “IPad” in 2010, ten years later, the wireless
infrastructure was everywhere, the need for such convenient mobile device was there, and a
market full of applications for this new device was in place. All these factors led to a big success
for the Apple IPad, as it turns to be a big hit and created a new market in the industry and a new
source of revenue for Apple.
12
This distinction between invention and innovation led to the following equation:
Innovation = Invention + Exploitation, where invention covers the seed of the workable idea and
exploitation covers the commercialization part of it (Roberts, 2007)
Latest studies in the field defines innovation comprehensively as “production or adoption,
assimilation, and exploitation of a value-added novelty in economic and social spheres; renewal
and enlargement of products, services, and markets; development of new methods of production;
and establishment of new management systems. It is both a process and an outcome” (Crossan &
Apaydin, 2010).
In summary, there are various definitions for innovations, which, basically depend on the
researcher background and area of study. Even though the definitions vary, but most importantly,
all researchers agree that innovation is something new that adds value to the organization.
While there has been a growing interest in the concept of open innovation from the early
2000s, one of the major challenges facing empirical research today is to understand the learning
mechanisms that might benefit from open innovation (Geenhuizen & Soetanto , 2012).
Classes (magnitude) of innovations
Innovation classification is used to differentiate innovations based on their magnitude of
innovativeness, newness, or degree of departure from existing line of innovation. Current
literature shows the following different classifications:
Dichotomous classification: radical/routine (Meyers & Tucker, 1989),
discontinuous/continuous (Anderson & Tushman, 1990), innovation/re-innovation (Rothwell &
13
Gardiner, 1988), Evolutionary/revolutionary (Utterback, 1996), sustaining/disruptive
(Christensen, 1997), Radical/incremental (Balachandra & Friar, 1997; Freeman, 1998; Kessler &
Chakrabarti, 1999), innovative/incremental (Schmidt & Calantone, 1998), really
new/incremental (Song & Montoya‐ Weiss, 1998).
Triadic classification: discontinuous/dynamically continuous/continuous (Robertson,
1967), low innovativeness/moderate innovativeness/high innovativeness (Kleinschmidt &
Cooper, 1991), incremental/platform/radical (Wheelwright, 1992).
Despite the different naming convention, All researchers agreed on the two extreme ends
of definition for the innovation classification, as they defined continuous/incremental/routine/re-
invention innovation as a miner or regular improvement of an existing product with no market
disruption or creation (Anderson & Tushman, 1990; Meyers & Tucker, 1989; Robertson, 1967),
while discontinuous/radical/revolutionary/discontinuous innovation creates new products that
disrupts current market and create a new one, change customers behaviors and create new trend
(Anderson & Tushman, 1990; Meyers & Tucker, 1989; Robertson, 1967)
The different classifications are a result of different views by researchers in different
fields. One view develops its classification based on firm and industry existing knowledge,
skills, and production techniques. Based on this view, a radical or disruptive innovation will
change current firm and industry investment in the existing knowledge, skills, and production
techniques. Incremental or continuous innovation will keep building on existing knowledge,
skills and production technique (Utterback, 1996). Another view looks into the level of departure
from existing technological innovation, and whether this departure creates a new market or no t
14
(Rothwell & Gardiner, 1988). A third view focuses on level of newness to the world, market, and
firms (Kleinschmidt & Cooper, 1991).
These different classifications have resulted in classifying a certain innovative product
differently, For example, certain innovation might be classified as radical innovation based on
one view in the meantime it’s classified as moderate innovation by another view. Some time the
same innovation is classified with the same magnitude by the different classifications but with
different labels such as, high innovative, radically new, or disruptive innovation (Garcia &
Calantone, 2003).
While different classifications in literature introduced over the years by different
researches in an effort to define the magnitude of the innovation output with more precision, lack
of standardization and the use of different innovation labels confuses the market and managers
who work on producing and managing innovative outputs.
Types of innovations
The identification of different types of innovations is attributed to Schumpeter’s early
work. Schumpeter distinguished between five different innovations: new products, new methods
of production, new sources of supply, new market, and new ways to organize business (Jan
Fagerberg, 2006; Godin, 2002). However, most studies focuses and differentiate between the
first two; product, and process innovations (Cooper, 1998; F. Damanpour & Aravind, 2011; Jan
Fagerberg, 2006; Utterback, 1996; Zaltman et al., 1973)
15
Another classifications of innovations, mostly interested in organizational development,
distinguish three types of innovations; product/service innovation, process innovation, and
business model/organizational innovation (Crossan & Apaydin, 2010).
The organization for economic cooperation and development (OECD), consist of 30
countries from Europe and America, defines and distinguishes between four types of innovation
in the published Oslo manual, these four types are; product innovations, process innovations,
organizational innovations and marketing innovations (Publishing, 2005).
Five different types of innovations were also identified as part of organization’s overall
innovativeness; product innovativeness, market innovativeness, process innovativeness,
behavioral innovativeness, and strategic innovativeness (C. L. Wang & Ahmed, 2004).
The literature provides the following definitions for the four most known types of
innovations: product, process, marketing, and organizational innovation.
Product innovation
Product innovation is defined as improving existing or producing a new product or
service with new capabilities and features new to the market (Publishing, 2005). The focus of
product innovation is external to the organization as the goal is to meet customers needs (F.
Damanpour & Aravind, 2011; Utterback & Abernathy, 1975), Timing of introducing the product
to the market is a critical factor in the definition of product innovation (C. L. Wang & Ahmed,
2004).
16
Process innovation
Process innovation is defined as the introduction of a new method in the organization to
produce a product or render a service (F. Damanpour & Aravind, 2011; Publishing, 2005; C. L.
Wang & Ahmed, 2004). The focus of a process innovation is internal to the organization as the
goal is mostly efficiency improvement through cost cutting and reducing development time for
products (Cohen & Levinthal, 1990; J. Fagerberg, 2004; Frishammar, Kurkkio, Abrahamsson, &
Lichtenthaler, 2012; C. L. Wang & Ahmed, 2004).
Organizational innovation
Organizational innovation is defined as a new configuration of organizational capabilities
or developing a new way of doing business or introducing major changes to current business
practices within organizations (Armbruster, Bikfalvi, Kinkel, & Lay, 2008; Carayannis &
Provance, 2008; Publishing, 2005). In the context of economic development, Schumpeter
defined organizational innovation as “The carrying out of the new organization of any industry,
like the creation of a monopoly position or the breaking up of a monopoly position” (F.
Damanpour & Aravind, 2011). Wang and Ahmed (2004) view this model of innovation as a
strategic innovation, which they define as defining market gap and developing a new strategy to
cover this gap and create value for the firm.
Marketing innovations
Marketing innovation is defined as implementing new marketing channels and methods,
such as new promotions ideas, new pricing structure, new packaging (Publishing, 2005; C. L.
17
Wang & Ahmed, 2004). Marketing innovation is more involved with opening new markets,
product positioning, better understanding customers needs, and increasing sales (Gunday,
Ulusoy, Kilic, & Alpkan, 2011)
Innovations are also categorized as either technical or administrative innovations, this is
popular among organizational and management researchers. Technical innovation refers to novel
technological methods that effect production of products and services, while administrative
innovation is mainly concerns with organization’s activities that affect management systems (F.
Damanpour & Aravind, 2011). Another differentiation between the two types of innovation is
that technical innovation address changes that have direct influence on the core business of the
organization, such as new services or new products, while administrative innovation address
novel changes that has indirect influence on the core business such as management related
activities (S. Gopalakrishnan & Damanpour, 1997).
The different types of innovation has a link to the magnitude of innovation; As
incremental innovation is mostly associated with product/service or process innovation, and
radical innovation is associated with business model that is part of the organizational innovation,
even though radical product innovation is the focus of many organizations (Crossan & Apaydin,
2010).
Innovation referent dimension
Innovation referent defines innovation newness in reference to an entity such as the end
customer, the adopting organization, or the market. For example, a product or service might be
new to the customer (C. L. Wang & Ahmed, 2004), organization (Davila et al., 2006), or market
18
(Lee and Tsai, 2005) but not to another entity. Innovation referent dimension is linked with the
magnitude of innovation, as the degree of innovativeness from highly innovative to low
innovative can be seen differently by different adopting entities. Most studies take the
organization’s perspectives as a referent towards the magnitude of innovation more than other
entities (customers, market) (Garcia & Calantone, 2003).
Innovation levels of analysis
Literatures shows that innovation analysis has been conducted at different levels;
individual, team, organization, industry, region, and nation. The macro level analysis study
innovation at the market, industry, region and nation level. The micro level analysis studies
innovation at the individual and team level. And the in between “meso level” studies innovation
at the organization level. Innovation is a multilevel phenomenon, however, literature shows that
most studies were conducted at specific levels and not across multiple levels (Gupta, Tesluk, &
Taylor, 2007).
Studies of innovation at the Individual level concentrates on the factors that determine
individual creativity. Two directions are used to evaluate innovation at the individual level, one
that treat individual as an entity and creativity as an output of personal traits, the other look at the
individual as part of a working environment which has much effect on the personal creativity
output. Studies at the team level concentrate on fostering group creativity and interaction among
group members. Studies show that teams with high number of diverse members working together
for long time demonstrate higher performance. The majority of researches are conducted at the
organizational level with three main areas of studies; technological innovation, product or
19
business development, networking among organizations and its effect on organizational
innovation. Studies at the industry level focus on the interaction among organizations forming
the industry and the diffusion of innovations. The analysis at this level covers the effect of the
cooperation and competitive nature among organizations in an industry on the emergence and
diffusion of innovations. Studies at the region and nation levels focus on the determination of
innovation and variation of innovation capacity across regions and countries, Studies did not
focus on the management of innovation as much as the interaction among individuals and firms
as well as the diffusion and creation of innovation (Gupta et al., 2007).
The studies of different levels of analysis for innovation shows that organizations do not
innovate in isolation, but they interact with their environment horizontally and vertically which
create a system or network of innovation (Jan Fagerberg, 2006).
In this research, innovation is analyzed at the organization level, the relationship between
organization innovation and organization performance excellence is the target of this study.
Researches related to the macro or micro levels will not be covered in this study.
Diffusion of innovation
Innovation diffusion is the process of disseminating an innovation to target customers
over a period of time (Everett M Rogers, 1995). Certain innovations get adopted quicker than
others because diffusion of innovation is affected by four main factors; the innovative product
that need to be diffused, the channels of diffusion, time, and the target customer (E.M. Rogers,
2002). The characteristics of each innovation define the rate of adoption by the intended
customers. These characteristics are:
20
Relative advantage: the degree an individual perceives the innovation as
advantageous.
Compatibility: the degree of consistency of an innovation with existing value and
previous experience.
Complexity: the degree to which an innovation is perceived hard to use or
understand.
Trialability: the degree to which an innovation may be experimented with for a
limited period of time.
Observability: the degree to which the result of an innovation is visible to others.
An innovation that has perceived greater relative advantage, compatibility, trialability,
observability, and less complexity is adapted more quicker than other innovations(E.M. Rogers,
2002).
Organization Innovativeness and innovative capacity
Innovativeness is defined as the propensity of an organization to develop or adopt new
ideas and use them to develop new products (F. Damanpour, 1991; Ettlie, Bridges, & O'keefe,
1984; Garcia & Calantone, 2003; Hurley & Hult, 1998).
The literature shows diverse understanding and dimensions for organizational
innovativeness, Hurley and Hult (1998) state that organizational innovativeness is associated
with the organization’s culture that is characterized by emphasis on learning, participation in
decision making, support and collaboration, tolerance to conflict, market focus, and power
sharing, They argue that these characteristics are antecedents to organizational innovativeness.
21
Another empirical study argues that market orientation (activities related to generating,
disseminating, and responding to market intelligence), learning orientation (the development of
new knowledge), and entrepreneurial orientation (proactive risk taking through creating new
products and entering new market) are three key antecedents to organizational innovativeness
(Hult, Hurley, & Knight, 2004). Capon et all (1992) use four dimensions for defining
organizational innovativeness; market-related growth, technology-related revenue, tendency to
pioneer, and technological sophistication. Wang and Ahmed (2004) define five dimensions to
determine organizational innovativeness. The five dimensions are product innovativeness
(perceived newness of product), market innovativeness (innovation related to market research,
advertisements and promotion), process innovativeness (new production method or new
management approach), behavioral innovativeness (internal organizational receptivity and
reaction to innovations), and strategic innovativeness (identifying gaps in the industry and seek
new markets to create value to the organization).
While old studies used product innovation and organizational innovativeness
interchangeably (Capon, Farley, Lehmann, & Hulbert, 1992), other scholars differentiate
between organizational innovativeness and product innovativeness, they argue that product
innovativeness measure the degree of product newness to the customer, organization, or market
(Atuahene‐ Gima, 1995; Danneels & Kleinschmidtb, 2001), and it does not measure or reflect
organizational innovativeness accurately, as a matter of fact, using product innovativeness as an
only measure for organizational innovativeness is a very narrow view of organizational
innovativeness (Garcia & Calantone, 2003).
22
Hurley and Hult (1998) suggest that organization innovativeness along with other
organization aspects, such as age, planning, formalizations, differentiation, market intelligence,
increase the organization’s capacity to innovate. Organization capacity to innovate can be
measured by the numbers of innovations developed or adopted successfully, The higher
innovation capacity an organization has the faster and more successful the organization will
respond to changes in the market. The higher the organization capacity to innovate the more
competitive and better performance the organization is in the market (Hurley & Hult, 1998).
Innovative capacity, innovative capability, and absorptive capacity terms have been used
in different studies for almost the same meaning and concept. In one study innovative capability
and absorptive capacity are used synonymously and are defined as the organization’s ability to
identify the importance and value of new external information, understand it, apply it, and
commercialize it in the market successfully (Cohen & Levinthal, 1990). Another study states that
innovative capacity and absorptive capacity are relative and are measured by the number of
successfully adopted innovations (Hurley & Hult, 1998).
Process of innovation
Innovation as a value chain
Innovation process could be viewed, as a value chain comprised of three phases: idea
generation, conversion, and diffusion. Six tasks are linked together across these different phases
to form a chain. Internal, external, and cross-unit collaborations to generate ideas; screening and
development of ideas to convert them into product; then spreading developed ideas within and
outside the company as part of the diffusion phase. Weakness in any link of the chain could
23
break the innovation efforts. The value chain view of the innovation process could help in
focusing on the weakest link and work on improving it to increase the value of innovation with
organizations. Several practices can be used to strengthen these links; building external networks
to extract and pass customers needs to R&D labs and partners for solutions, also building internal
networks, communities of specialized groups from different units of the organizations to solve
specific problems; establish cross unit funding to support and develop radical ideas, establish a
separate business unit to develop new ideas that support the organization strategy, this create a
safe heaven for potential ideas; and designate idea evangelists to support the diffusion of the
developed product (Hansen & Birkinshaw, 2007).
Innovation and organization performance
Innovation has been linked positively with performance ever since the introduction of
innovation concept through the work of Schumpeter in 1934 and 1942, his theory states that
firms maintain temporary quasi monopoly through innovation that allow firms to extract rents,
however this temporary lead in the market can be eroded due to imitators from competitors or a
new innovation that put the leading firm’s innovation to obsolete. With distinctive innovations,
organizations establish dominant position in the competitive market, and provides new ent rants a
foothold in the market (Danneels & Kleinschmidtb, 2001). But to maintain sustainable
competitive advantage, firms must continue to innovate to utilize better productive processes and
keep up with changing customers’ needs and demands (Gunday et al., 2011).
24
According to literatures, Four different types of performance dimensions are used to
define organization performance, these are financial performance, production performance,
market performance, and innovative performance (Gunday et al., 2011)
The literature also shows an increase number of studies that address the effect of
innovation on organization performance in recent years (Rubera & Kirca, 2012). While there is
a general agreement among researchers that innovation influence business performance (Hult et
al., 2004; Szymanski, Kroff, & Troy, 2007), some other studies show neutral effect (Lin & Chen,
2007; Subramanian & Nilakanta, 1996).
The link between innovations and performance was also extended to cover other
dimensions beside types of innovations; for example, quickness and speed in adopting new
innovations and number of adapted innovations were tested against organization performance,
and the study concluded that both speed and amount of adopted innovations have positive
influence on organization’s financial performance (Shanthi Gopalakrishnan, 2000). Another
study tested the effect of magnitude of innovation on organization’s performance, specifically
profit, economic rent, and risk, using data on new products from consumer packaged goods
industry, the study concluded that incremental innovation preserve companies’ value and keep
the company in the market with no additional risk, however, radical innovation increase values
for the companies, allows to achieve long term growth with high associated risk that is usually
offset by increase stock returns (Sorescu & Spanjol, 2008).
The literature shows that most studies on the relationship between firm innovation and
firm performance measure the effect of different types of innovations (product, process,
25
organizational) as a whole or more than one type of innovation (process-product, organizational-
process, or organizational-product) on firm performance (Calantone, Cavusgil, & Zhao, 2002;
Hult et al., 2004; Hurley & Hult, 1998; Jenssen & Rand, 2006; Keskin, 2006; Ortega, 2010;
Yang, Marlow, & Lu, 2009). Studies also show that different innovation’s types influence each
other, thus several innovations types might need to be implemented at the same time to achieve a
better performance results (Walker, 2004).
The various impact of different types of innovations on organizational performance
encourage studying each type of innovation and assess its impact on the performance of the
organization (Publishing, 2005). New studies proofed that different types of innovations have
different influence on organizational performance (Gunday et al., 2011).
Organizational innovation and performance:
Literatures shows that studies on the relationship between organizational innovation and
organization performance scarce and mostly old (Mol & Birkinshaw, 2009). While old studies
showed little evidence on imperial relationship between organizational innovation and
organization performance, A study conducted in 2006 confirmed that organizations that have
better performance are more involved in innovative organizational changes (Mazzanti, Pini, &
Tortia, 2006). Changes introduced by organizational innovation, such as new organizational
method in a firm's business practices, workplace organization, or external relationships have to
be new to differentiate it from other regular changes in the organizations (Armbruster et al.,
2008; Birkinshaw, Hamel, & Mol, 2008).
26
Another study was conducted in china to study SME innovation effect on their
performance, and the result showed that administrative innovation in terms of wide and new
organizational changes leads to increase of sales, which is the measure used to assess the
organizations performance in the study, (Lin & Chen, 2007).
Mol and Birkinshaw (2009) confirmed a positive relationship between the introduction of
new management practices and future improvement of organizaion performance. The
perfromance measure in Mol and Birkinshaw study was based on the productivity growth within
the organization, they argue that other measures of performance such as stock market has the
market condition as an exogenous factor and does not reflect pure results of organizational
innovation. Another study conducted in China and Hong Kong to test the effect of organizational
innovation on organization performance with two different institutional context; chinese
transition economy, and hong kong market economy. The study confirmed that organiational
innovation effects the performance of organizations in transtional economy more than product
innovation, and the opposite was also confirmed in market economy such as in hong kong (Luk
et al., 2008). This study also confirmed that the institutional context may effect the result of
organization perfromace that occur due to organizational innovation.
Camisón and Villar-López (2012) also confirm the relationship between orgnizational
innovation and organization performance using a resource-based view theoritical framework.
They tested different innovation’s types (organizational, process, and product) and their effects
on the performance of the organization as part of the imprical study condusted on 144 spanish
industrial companies. Organizational innoavtion turned out to be as important as other types of
27
innoavtion as studies show better organization performance is resulted when organizational
innovation is considered along with other innovations types (product/process) (Carayannis &
Provance, 2008)
Process innovation and performance:
Process innovations are assumed to enhanced efficiency of organizations and thus
achieve competitive advantage in the market (Baer & Frese, 2002) through internal savings that
lead to competitive pricing offerings in the market (Gunday et al., 2011) and cost leadership .
Cost cutting and saving is always tied with process innovation as stressed in the literatures (J.
Fagerberg, 2004). Beside operational savings, Organizations employ process innovation to
improve delivery lead-time (Fariborz Damanpour, 2010). According to Gunday et al. (2011)
Process innovation has a positive effect on organization’s innovative performance that act as a
mediator to production and market performance. A new study confirmed that process innovation
also has an indirect effect on organization’s performance when it is mediated by the development
of product innovation capability (Camisón & Villar-López, 2012). Process innovation is crucial
for organizations as the competitive advantage and economic improvement lies in the innovative
use of technologies, not in the development of new technologies (Stone, Rose, Lal, & Shipp,
2008).
Product innovation and performance:
Literatures shows that among all the innovations types, product innovation is the most
type examined and the one that has most effect on performance compared to other types of
innovations (Gunday et al., 2011), unlike process innovation that mostly has internal focus,
28
product innovation has an external focus and drive organization’s effectiveness through
responding to customers need and capture market (Fariborz Damanpour, 2010). A study showed
that, hard to copy, new product innovations will help organizations maintain their market
leadership and cash-flow (González-Alvarez & Nieto-Antolín, 2005), Another study confirmed
this using stock market value as the performance measure (Srinivasan, Pauwels, Silva-Risso, &
Hanssens, 2009). The same study also tested the radical type of product innovation, and it
concluded that a new to the market product (radical innovation) has seven times the impact of a
new to the organization product (incremental innovation). Similar conclusion of radically
innovative products result in higher performance impact was introduced in a recent meta-analysis
study (Rubera & Kirca, 2012). These conclusions match with the resource based view (RBV)
study (J. Barney, 1991), which states that firms with distinctive resources that are rare, valuable,
inimitable, and substitutable achieves superior performance and sustained competitive
advantage. Hard to copy radical innovative products have the distinction of rare, valuable, and
inimitable at least for some time.
Marketing innovation and performance:
Marketing innovation is critical for organizational performance, as targeting new markets
or new segment and creating new way to promote products increase the success rate of a new
product and increase sales. Market research that identifies new market practices and new
customer demands are crucial to product and process innovation (Publishing, 2005). Sorescu &
Spanjol (2008) confirmed in their study that marketing innovations represented in new packaging
and merchandising innovation can be a source of significant economic rent.
29
The literature shows a wide variety of studies that tried to explain the effect of innovation
on organizations performance, however, due to the different understandings and views on
innovations, the organization’s level innovation studies are fragmented, also the use of different
categorizations of innovation and different performance measurements lead to contradictory
results, this was mainly due to lack of agreement on innovativeness or performance measures.
Finally, most studies were conduced in developed countries; more studies are needed in
developing countries to better generalize the relationship between innovation and performance.
Measuring organization innovativeness
Measuring innovation is very important; a survey conducted by McKinsey in 2008 found
that companies that measure their innovation activities have the highest return from innovation.
About 70% of the interviewed firms indicated that innovation is in the top three priorities in their
organization agenda. Measuring innovation allows for proper resources allocation, management
and improving of the overall innovation performance (Stone et al., 2008).
Innovation is a complex, nonlinear, and unpredictable phenomenon with multi facet and
dimensions. These various dimensions of innovation illustrate why innovation activities are a
difficult to measure. (Stone et al., 2008). The difficulty of measuring innovation also comes
from the fuzziness in the innovation concept and definition, as some define innovation as an
output of an R&D and other activities, while others define innovation as the activities and R&D
that leads to innovative output, this make innovation measurement a complex and difficult
process (Feeny & Rogers, 2003; Godin, 2002). Since there is no single and fix method to
innovate, using one dimension to measure innovation is likely not accurate (Shapiro, 2006; Stone
30
et al., 2008). Several indicators have been used over the past decades to measure innovation in
organizations. These indicators vary from input indicators, to output indicators, to activities or
process indicators. The literature shows that innovation metrics have evolved over the years;
starting with input indicators that was the main measurement for innovation in 1950s -1960s, then
output indicators came as next generation measurement in the 1970s -1980s, third generation
indicators emerged during the 1990’s with focus on innovation surveys, indexing, and
benchmarking; the fourth generation indicators started in the early 2000 and focus on process
indicators that mostly measure intangibles activities to assess innovation (Stone et al., 2008).The
following is a summary of most known indicators:
Innovation output indicators:
Output indicators represent the results of innovations activities within or outside (collaboration
with external organizations) the organization, these include all types of innovation output
(products, processes, marketing, organizational), it also include number of patents, percentage of
revenue from innovative products (Godin, 2002)
1. Number of Patents: patent statistics are the most commonly used measure for
innovation output. Patent gives firms a temporarily monopoly to use their discoveries, It
is an incentive given to firms to continue innovate. Patent data has several advantages; it
is available all time, shows collaboration with other organizations, and shows
technological level. However, these advantages come with drawbacks, not all innovations
are patented, some innovations are covered by multiple patents, also not all patents are
considered innovations as many patents might not end up in the market. In addition,
31
different industries have different propensity to apply got patents. (Brenner & Broekel,
2011; Publishing, 2005)
2. Number of innovations: counting innovations over a period of time, for example
between 2010 and 2013, using experts’ opinions. The advantage is that this will provide a
direct measure of innovation output, however, the downside of it are the high cost and
efforts to identify these innovations, also this methods can’t be immune to selection bias
(Brenner & Broekel, 2011).
3. Percent of revenues from new products: a quantitative method that is easy to
understand and use to measure innovativeness of organizations. It can be integrated with
an accounting system to automate this measurement once innovative products are defined
in the system. However, just like other methods of measurement, this measure has some
issues; perhaps identifying the innovative product is a major one, companies update their
products frequently; so does any change count as a new? How much update is required to
consider a product as innovative? What if the process of manufacturing a product or
rendering a service changed but the product or the service itself did not, cost will go
down but revenue might be the same. Another issue is related to the time, for how long
will this new product be measured? One year, two, or more. A predefined period of time
is required to measure the percent of revenue out of a new product, and this time frame is
different from one industry to another, in high tech industry one year might be a suitable
time frame, however, one year is not enough to measure revenue coming out of new
products in oil industry. Product life cycle is different from one industry to another and
this might change the time frame for measuring revenue from innovative products. Third
32
issue deals with the type of innovation, while pure product innovations (product or
service) can be measured easily with this approach, process, organizational, or marketing
innovation need extra thinking to be measured. Perhaps even harder if a mix of
innovations are used such as a mix of product with process or product with marketing or
product with new business model (Shapiro, 2006).
4. Percent of revenue from new platforms : another quantitative method proposed to
overcome the limitation of measuring percent of revenue from new products. This
method help measuring other types of innovations (i.e. process, organizational,
marketing). Revenue from platform could be an input indicator, but it’s mostly measure
the output of the types of innovations. New platforms could be new machineries in a
production line, new organization policies, new marketing channels, or new process in
delivering services or products. Just like revenue from new product, revenue from new
platform has similar issues, such as defining new platform and whether new is considered
an innovative or not. Also time frame could be longer here than in revenue from new
product (Shapiro, 2006).
Using the output only to measure innovation treats the innovation process as a black box; all the
interactions inside the box (activities) are not used to measure the firm innovation , which result
in missing many aspects of the efforts and activities used in producing the innovative outputs.
Innovation input indicators:
Input indicators represent all the efforts and resources, tangible and intangible, put into
the innovation system within an organization to innovate. These inputs include human capital,
33
R&D and non R&D expenditure, number of people devoted to innovation number of ideas or
concepts being generated. R&D expenditure is a critical innovation input; most innovative
companies’ invest in R&D to continue innovating in their market. Thus measuring R&D
expenditure thought to be a good assessment for innovation since the information of R&D
expenditures are usually available within firms’ accounting systems (Brenner & Broekel, 2011).
However, even though R&D plays a major role in the innovation process, not all innovations are
based on R&D activities. In a recent survey conducted by economist intelligent Unit, half the
respondent said that their best ideas came from industry and market structure change and only
21% said that they came from R&D (Unit, 2007), as matter of fact many innovations relies on
high skilled workers, interactions with external organizations, and organizational structure and
propensity to innovation (Publishing, 2005). Using R&D expenditure only might not be an
accurate measure as studies show that less than 10% of innovation cost is attributed to R&D
expenditures, This confirms that R&D only dimension is not enough measurement for innovation
(Godin, 2002).
Innovation process indicators:
The innovation process indicators covers all the activities that an organization take
internally and externally to innovate. They are mostly intangible indicators that have produce
innovation outputs and improve performance in organizations (Carayannis & Provance, 2008).
Latest studies shows that collaboration with external organization as oppose to organization’s
internal knowledge represented in R&D, turns out to be more critical for organizations to
innovate (Powell, Koput, & Smith-Doerr, 1996). Open innovation became a strategic direction
34
for many organizations to innovate, it allows for exploring broader solutions, in the meantime
reduce risk and cost associated with internal R&D activities (Stone et al., 2008). Firms
collaborate, share resources, and human capital with partners (external organizations) and all this
contribute to improve organization’s innovations (Brenner & Broekel, 2011) .
Multi-dimensions indicators:
Using a mix of input, output and process indicators to measure innovation (Carayannis &
Provance, 2008; Feeny & Rogers, 2003). The use of multiple indicators overcome some of the
limitation with single dimension measurement, however, the literature shows that this approach
is still underdeveloped as very few studies addressed this approach (Carayannis & Provance,
2008). This approach might bring more accuracy in measuring innovation, however this will add
to the complexity of the measurement process.
In general, two main approaches are used to measure innovation: aggregate indicators
and monetization. The aggregate indices approach combines multiple indicators to come up with
an innovation measure. This approach was first used at the national level where the European
union community innovation surveys used to measure and compare innovation in EU countries.
Aggregate indices collect wide variety of innovation factors related data that is mostly qualitative
in nature. This approach help compare and discriminate between different innovative entities and
units, which is one of the main focus of EU governments, however it does not provide any
descriptive analysis of innovation and knowledge of innovation process, on top of that aggregate
indices are a complex measure and has limited financial data. The monetization approach
measures the ins and outs of innovation dollar sign to assess innovation. It measure the
35
investment in innovation systems and infrastructure and expenditures of innovation activities and
then measure the revenue and other nontangible income from innovation activities to come up
with the innovation value within a unit or entity. The monetizing approach is easier than the
indices approach and offers an insight into the innovation process (Stone et al., 2008).
Innovation measurement is well established and standardized at the nation levels with
community innovation surveys being used in Europe and many other countries in Asia, America,
and Africa. The Oslo manual provides a complete framework for collecting innovation data. In
the other side, there is no standard measurement or framework for measuring innovation at an
organization level; different organizations establish different methods and processes for
measuring their innovation activities.
Data collection methodology:
Defining what type of indicators to use and collect to measure innovation is one issue of
the process of measuring organizations’ innovation, Deciding on a method to collect innovation
data is another issue that is still being researched to find better methods to collect data
accurately. The literature shows that surveys are the most common method for collecting
innovation data in comparison to other methods, focus group and interview.
Survey: surveys are one of the most common used tools to collect innovations
information from organizations. European union (EU) use Community Innovation Survey
(CIS) base on the Oslo manual developed by the Organization for European Economic
Cooperation (OECD) (Brenner & Broekel, 2011; Smith, 2005). Advantages of surveys
are simplicity, wide reach, and collection of detailed information on various innovation
36
types (i.e. product, service, process, marketing, organization), and other interesting
information regarding innovation activities such as, R&D and none R&D expenditures,
and collaboration. The disadvantages of surveys are as usual accuracy and response rate.
The collected data are mostly subjective and highly dependable on the person responding
to the questionnaires (Brenner & Broekel, 2011; Godin, 2002).
Interview: provide better response rate in comparison to surveys, it provide responders
with clarification option, and it also allows for feedback and checking responder’s
behavior. However, interview methods is time consuming and hard to conduct with a big
sample of organizations (Li & Atuahene‐ Gima, 2002).
Focus Group: utilize expert opinions to provide information on organizational
innovative output. This approach provides direct measure of innovation output, however,
it lacks the depth and width or collecting other important data such as innovation’s inputs
and process indicators. Focus group methods can’t be immune to selection bias (Brenner
& Broekel, 2011).
Organizational capabilities
Organizational capabilities refer to what an organization can or can not do (Börjesson &
Elmquist, 2011). Other scholars define organizational capabilities as the ability of an
organization to perform a coordinated set of tasks, utilizing organizational resources, for the
purpose of achieving a particular end result (Schreyögg & Kliesch-Eberl, 2007), They view
organizations’ capabilities as a characteristic that evolve and change over time. Organiza tion
37
capabilities have been also defined as the capacity to perform a particular activity in a reliable
and satisfactory manner (Helfat & Winter, 2011), Helfat and winter see reliability and
repeatability as an important feature of capability, otherwise the firm cannot have the capacity or
capability to do what intended to be done, they also see organization’s capabilities as a key
dimension of firm heterogeneity and characteristics that confers competitive advantage.
Schreyögg & Kliesch-Eberl (2007) share the same view as they see the different levels of firms’
capabilities and resources result in different competitive advantages.
However, despite the various research and interest in organization’s capabilities, the
concept is still vague, as different authors call it different names; core competence, collective
skills, complex routine, best practices, or organizational capabilities (Schreyögg & Kliesch-
Eberl, 2007).
Organizations capabilities can be classified as operational or dynamic, Operational
capabilities enable organization to perform their current on-going activities using existing skills
and techniques to maintain the status quo of the organization, good operational capabilities
enable organizations perform current activities efficiently and effectively. However, dynamic
capabilities are the ones that enable an organization to change the way it is currently doing
business (Helfat & Peteraf, 2003; Helfat & Winter, 2011). Dynamic capabilities are different
from operational capabilities, they differ in their purposes and required outcome, however, the
line between both types of capabilities are blurry since changes occur all the time, level of
changes from regular to radical is not completely defined, and there are some capabilities that
can be used for both operational and dynamic purposes such as distribution, marketing, and sales
38
capabilities (Helfat & Winter, 2011). Helfat & Winter suggest that to distinguish between
operational and dynamic capabilities we have to assess the extent, nature, and speed of change
that a capability enables, capability that introduces significant economic change is dynamic even
if the pace of change is slow. They also suggest that a dynamic capability should not be restricted
to new-to-the-world outcome or fast changes to the market, sometime a dynamic capability can
help support existing business such as opening new outlets for a store in reaction to market
change. Dynamic capabilities are strategic and when used on top of the operational capabilities,
organizations can maintain and extend their competitive advantage into the future (David J.
Teece, 2012).
Dynamic capabilities was first introduced by Teece, Pisano, & Shuen (1997), they
defined it as higher-level competences that determine the firm’s ability to integrate, build, and
reconfigure internal and external resources/competences to address, and possibly shape, rapidly
changing business environments. Dynamic capability was introduced as an extension to the
resource based view (RBV) theory (J. B. Barney, 1986), which states that firms achieve
sustained competitive advantage through bundles of resources and capabilities, these bundles of
resources and capabilities have to be valuable, rare, costly to imitate, and non substitutable for a
firm to have a sustained advantage. The RBV theory was static in nature and could not explain
the competitive advantage in a continuous changing global environment; dynamic capabilities
came to address this gap through aligning the firm’s internal and external configurations of
resources and capabilities with the external changes in the environment. This view established a
link between organizations continuous innovation and their ability to innovation (innovation
39
capability) (Barreto, 2010; Ellonen, Wikström, & Jantunen, 2009; David J Teece, Pisano, &
Shuen, 1997).
Dynamic capabilities describe the ability of an organization to demonstrate timely
responsiveness and continuous innovation that is coupled with the management ability to
coordinate and updates organization’s competences (David J Teece et al., 1997).
Scholars of dynamic capabilities argue that the difference in firms’ innovative
performance is related to the difference in their dynamic capabilities. A new study linked
organization’s dynamic capability with its innovative output, the study revealed that the higher
an organization dynamic capabilities the higher its innovative output (Ellonen et al., 2009)
Dynamic capabilities are demonstrated by three types of activities: (1) identifying and
assessing an opportunity (sensing); (2) mobilization of researches to address an opportunity and
capture value from doing so (seizing); (3) continued renewal (transforming). Organizations need
to perform these activities effectively to sustain market changes; different organization can
maintain some or all of these activities better than others (David J. Teece, 2012).
Capabilities for Innovation
Global intense competition keep pressuring organizations and forcing them to innovate in
order to sustain their competitive advantage, thus the ability of an organization to innovate is one
of the most critical capabilities that should be possessed in todays business (Lawson & Samson,
2001). Moreover, the rapid development of new products and emerging of knowledge economy
require organizations to continuous upgrade their innovation capabilities (C.-h. Wang, Lu, &
40
Chen, 2008). An innovation is a result of successful implementation of creative ideas, and the
level of innovation depends on the organization ability to learn and apply the new knowledge
(Alegre & Chiva, 2008), the more ideas an organization implement the higher innovation
capability the organization is assumed to have (Francis & Bessant, 2005). Wang and Ahmed
(2004) define innovation capability as the organizational ability to produce an innovative
outcome. Studies show that different organization’s capabilities result in different innovative
outputs, some originations tend to produce radical innovations that cannibalize their current
knowledge and existing products, while others produce incremental innovations that build and
enhance their existing knowledge and existing resources (Ellonen et al., 2009)
Differentiating between ordinary capabilities from innovation capabilities have been
identified more than 20 years ago when Kanter (1989) argued that mainstream (ordinary)
business capabilities are different from new stream (innovation) capabilities, he further suggested
that each capabilities require different resources and need to be managed differently. Mainstream
activities provide stable income that funds new stream activities that are needed to develop new
products, which later become part of the mainstream autonomous to provide fund for newer new
stream activities (Kanter, 1989)
Researchers defined innovation capability as a higher order integration capability that is
the ability to mold and manage multiple capabilities (C.-h. Wang et al., 2008), this matches
Treece et all (1997) concept of dynamic capabilities that refer to higher-level competences that
determine organization’s capability to integrate, build, and reconfigure internal and external
resources/competences to create innovative products. In another view, dynamic capabilities
41
explain how organizations manage and deploy its current resources and obtain new resources to
continue innovate over time (Cetindamar, Phaal, & Probert, 2009).
Dynamic capability theory is not specific to certain capability (i.e. technological,
financing, etc.) it is meant to reflect a combination of capabilities needed to continue innovate at
any point of time, these capabilities include management, R&D, manufacturing, sales and
marketing, human resources, product & process development and knowledge learning and
management (Lawson & Samson, 2001).
Even through innovation is in the central focus of dynamic capabilities, Lawson and
Samson (2001) see that dynamic capabilities theory have some deficiencies, they argue that it is
hard to identify which capabilities individually or collectively are effect ive for performance,
furthermore, many resources are complementary, which makes it a system of resources and
capabilities that matters not individual components. However, they still see that dynamic
capabilities approach is well suited to the study of organization innovation due to the fact that it
takes a holistic view of organizational innovation and there is no special focus on technology.
Malcolm Baldrige Framework
The Malcolm Baldrige National Quality Award is one of the top programs that help
organizations in the US and other parts of the world to improve their quality and increase their
overall performance (Evans & Mai, 2014). The award program was the US response to the
Japanese Deming prize. During the 1970s and 1980s, the US manufacturing companies where
lagging behind their overseas competitors, specially the Japanese companies, this created a major
problem for the US economy as customers around the world turned away from American
42
products. The high quality of the Japanese product surprised the American companies to the
point that they had to send representative to Japan to study their methods. They found out that
level of defects was much lower in the Japanese factories compared to the American factories,
sometime staggering 1000 times lower. When the American started investigating the Japanese
methods, they discovered that there is no technique or a tool used to reach this high quality. It
was a complete framework of quality management system such as Just-in-time (JIT) and total
quality control (TQC) that differentiated the Japanese production and business philosophies from
the American counterpart (Loomba & Johannessen, 1997). In 1991, Europe established the
European Quality Award (EQA) through the European Foundation for Quality Management
(EFQM) to recognize companies with high commitment to quality (Lee, Rho, & Lee, 2003).
The Malcolm Baldrige National Quality Improvement Act passed by the U.S. Congress
in 1987 to enhance the competitiveness of U.S. firms and businesses. The purpose of the
program is to identify and recognize role-model organizations that demonstrated significant
improvement in their goods and services quality, also help other US organizations who seek to
improve the quality of their products and services and increase their performance through
establishing criteria for evaluating improvement efforts and adopting best practices from award
winner organizations. The Baldrige program covers manufacturing, service, none-profit, health
care, education, government, small and big businesses (NIST, 2011) Currently, 44 states in the
US have a local Baldrige program (Lee et al., 2003)
The MBNQA criteria have evolved over the years to keep up with the changes in the
market and to serve different industries and organizations in the nation. It started with focus on
43
manufacturing quality then in 1999 it was expanded to include education and healthcare
organizations, then later in 2006 the criteria were updated to include nonprofit and government
organization. The name of the program have also changed in 2010 from Malcolm Baldrige
National Quality Award to the Baldrige Performance Excellence Program (Link, 2011; NIST,
2011).
The Baldrige criteria are non-prescriptive, meaning that the criteria do not prescribe a
specific structure or practice for management, they do not recommend certain tools or
benchmarking, and they do not tell organizations which path their business should take. The
criteria focus on results not on tools or procedures. They also focus on the approach, deployment,
learning, and integration of processes. This encourages organization to develop their own
innovative methods to meet the requirements of the criteria. The focus on the goal rather than the
method foster communications, sharing, and integrations of ideas that results in innovative
solutions. Specific solutions are avoided also to ensure that the program can help different types,
sizes, and level of organization maturity (NIST, 2011).
Applicants are judged and assessed by external examiners in seven categories:
Leadership, strategic planning, customers and market focus, measurements and knowledge
management, human resource focus, process management, organization performance results
(Garvin, 1991; Wisner & Eakins, 1994). The scoring system is based on a 1000 points scale and
three-level judging process. The process starts when applicants submit the answers to the
Baldrige self assessment survey questionnaires, a group of members of the board of examiners
review and score the applicant response then pass the initial results to a panel of judges who
44
select the top applicants based on their scores, then a team of senior and professional examiners
visit the selected applicants for further interviews and documents checking, the score will be
updated based on the site visit outcome, then judges meet again for a final time to select winners
(Garvin, 1991; Loomba & Johannessen, 1997).
Baldrige award is not a quick fix program; it is a journey of transformation that needs
dedication and continuous involvement from senior management. From the time an organization
perform the Baldrige self assessment check to understand and know it is current stand in term of
performance excellence till it reaches a high class organization and win the Baldrige award there
could be many years of work to cover the gap in the various areas assessed by the Baldrige
criteria (Garvin, 1991; Hertz, 2012).
The Baldrige assessment for each process in the first six categories is based on four clear
measures, Approach, Deployment, Learning, and Integration (ADLI). Each process measure is
analyzed for strengths and weaknesses (opportunity for improvement). The ADLI measures
ensure a horizontal and vertical deployment of every improvement process in the framework
with high degree of alignment and harmony. The horizontal deployment shows whither the
improvement program covers one area, couple of areas or all areas in the organization. The
vertical deployment covers the tying of strategic goals established by senior management and
lower activities done by line workers. Based on these four stages of improvement Baldrige board
of examiners differentiates between organizations that have some performance improvement
efforts and others that have fully matured improvement processes. Organizations with low score,
usually 300 or less, have weakness in most Baldrige categories; they might have one or two good
45
projects or one Baldrige category where the company performs well, but lack proper deployment
and integrations of improvement processes, and show no or few links between quality activities
and strategic goals. Organizations with medium score, usually between 400 and 600, are strong
in two or three categories and have more programs that are fully deployed and integrated with
links between strategic goals and activities, these companies are usually strong in the leadership,
human resources, and customer focus categories, but weak in information and knowledge
management, results and strategic planning. Deployments outside the operation areas have issues
with lower activities not linked to strategic goals. High scorers, usually over 700, have balanced
outstanding performance across the organization, All Baldrige seven categories are rated
excellent, Every quality and improvement activity in the organization is deployed and integrated
well horizontally and vertically (Garvin, 1991; NIST, 2011).
MBNQA and organization performance
Baldrige award has been proofed to be an effective framework for improving
organizations’ performance and competitiveness, between 1997 and 2000, the index of the
companies that received MBNQA outperformed Standard & Poor’s 500 by 4.5:1 (Lee et al.,
2003). Hospitals that won Baldrige award are six times more likely to be among the top 100
hospitals, they also outperform their top 100 peers in six out of seven key evaluated measures
(Hertz, 2012). Studies show that Baldrige award winners perform as well or better than their
competitors financially in the market (Wisner & Eakins, 1994). In 2010 Jerry Rose, Vice
President, Cargill, Inc. Baldrige award winner, demonstrated the impact and return on investment
of using Baldrige. He demonstrated the ROI of three different units in the company that have
46
different level of Baldrige deployment, the unit that has high Baldrige deployment showed 30%
increase in cumulative earning after tax (EAT) compared to 13% for the unit that has partial
Baldrige deployment, and -12% for the unit that just started the Baldrige program (Rose, 2010).
A study was conducted on 2001 concluded that the US economic benefit from the program based
on the benefit-to-cost ratio was 207 to 1. This ratio was updated in a new study using data from
273 applicants from 2006 till 2010 and different analysis, the benefit-to-cost ratio surged to reach
820 to 1 (Link, 2011).
MBNQA Critics & supporters
Despite the wide success, business people, journalists, and quality gurus have criticized
the Baldrige award since the beginning of the program. Edward Deming said that Baldrige
concentrate on results and not on actual quality management. Philip Crosby argued that
organizations are not rewarded for becoming expert in quality, but for complying with Baldrige
criteria (Loomba & Johannessen, 1997). Other criticisms were based on three main issues:
First, engagement in the Baldrige award program is costly; it requires major investment
in time and money to go through the application and assessment process. Xerox spent $800,000
and a year long of 20 full time employees working hours to prepare for winning the Baldrige
award in 1989. Small companies cannot afford to compete with such amount of money and
resources needed to win the award (Garvin, 1991; Loomba & Johannessen, 1997).
Second, Baldrige does not reflect financial success, several Baldrige winners suffered
financially after wining the award, including Motorola in 1988, Fedex in 1990, and Cadillac in
47
1990. Even worse, Wallace company Inc., winner of 1990, filed for bankruptcy less than two
years after they had won the award (Garvin, 1991; Loomba & Johannessen, 1997).
Third, Baldrige award does not reflect superior product or high quality service. When
Cadillac won the award in 1990, they ranked number eight in overall customer satisfaction for
the same year by powers reports, consumer reports and J.Ds powers rated Cadillac as less than
other stellar rated cars (Loomba & Johannessen, 1997).
Supporters of Baldrige award believe that most criticisms have no or limited merits,
while some companies spent lots of time and money to win the award other companies did not
spend much in return for winning such a prestigious award, Baldrige has differen t awards for big
and small organizations so fairness is there, in the meantime, Baldrige helps organization on the
long run and not for short term gains, profit is not guaranteed with wining Baldrige award, also
the earlier criteria does not cover all aspect of financial success such as effective marketing,
innovative R&D and financial planning (Garvin, 1991). Newer criteria however have innovation
embedded within the different Baldrige categories (NIST, 2011). Defenders of Baldrige do admit
that it is not perfect and that is why the criteria get reviewed and updated continuously. But, the
adoption of the criteria by many countries around the world provides more evidence for the
success of the program. The main value of the Baldrige program is having a road map and
process that help organizations change to the better in terms of quality and performance. Dr.
Juran supported Baldrige and he thought that critics misunderstood the main goal of the award,
He said that “It’s not, Meeting the criteria is the heroic effort” (Loomba & Johannessen, 1997).
48
Baldrige and Organization’s Dynamic/innovation capabilities
In the 21st century, an organization not only need to do things right, but also need to do
the right things in order to stay in competition. Quality and efficiency that is driven by the
improvement programs such as Baldrige, TQM, Six Sigma, and ISO result in excellent
mainstream (operational) capabilities, however, this might not be sufficient alone to sustain
fierce competition and continuous changes. Organization must possess innovation (dynamic)
capabilities to be able to innovate to sustain the competition. A radical innovative product
introduced by a small company can pose a major threat to a leading company operating in the
same market. At this time, Most CEOs want their organization to innovate and develop the
required capabilities for that, however, this is not an easy task, introducing changes in the
organization requires knowledge, patience and leadership along with a systematic framework
that guide the organization to assess, build and sustain the changes.
Baldrige framework provides a vehicle for change, it helps organizations assess their
current performance, also help management to plan, perform, and measure improvement
activities and results. This leads to continuous enhancement in organization’s products, services,
and processes. It also helps organizations align their processes and resources to achieve the
organizations goals. Baldrige performance excellence program is a complete transformation
framework that is easy to understand and follow. The Baldrige program can be used to improve
the operational/mainstream capabilities and Dynamic/new stream capabilities required to help
organizations innovate to sustain their businesses and increase their competitive advantage.
49
Possible future work
Despite the increased interest in dynamic capabilities approach (David J Teece et al.,
1997) in recent years, The concept is still not fully established in research literature (Ellonen et
al., 2009). Critics suggest that the field of dynamic capabilities requires guidance for future
research regarding construct, relationships, boundaries conditions, and contingencies (Barreto,
2010). Dynamic capabilities literature is still in early stages and future opportunities for further
research lies in the links between individual, group managerial actions, dynamic capabilities, and
firms performance (David J. Teece, 2012). Future research may consider the operationalization
of a firm’s dynamic capabilities as a simple sum of its four dimensions or multiplicative
nonlinear function of these dimensions (Barreto, 2010). Future researches can utilize financial
analysts in surveys to collect data for measuring dynamic capabilities constructs, this will
mitigate firm’s managers responses to such surveys (Barreto, 2010). Furthermore future research
can continue address the relationship between dynamic capabilities and intermediate outcome,
also between intermediate outcome and performance (Barreto, 2010). There is also a need to
have studies that focus on dynamic capabilities and how they link to functional capabilities such
as IT, R&D, and marketing. Furthermore, there is a need to explore the construct of dynamic
capabilities in other context such as traditional industries, and other countries where different
constraints and conditions apply (Easterby‐ Smith, Lyles, & Peteraf, 2009). Future research can
consider how sensing, seizing, and reconfigurations of capabilities are manifested in different
industries, Also the interrelationship between firm’s capabilities and its innovations activities is a
promising research area (Ellonen et al., 2009). Finally, despite the increase interest in
50
organizational and dynamic capabilities, there is little in-depth on how organizational capabilities
for innovation are developed in practice (Börjesson & Elmquist, 2011).
From the Baldrige program literature, limited amount of scholarly research has been
conducted using the Baldrige Criteria, Some scholars like Pannirselvam, Siferd, and Ruch
(1998), Wilson and Collier (2000), Meyer and Collier (2001), and Flynn and Saladin (2001)
focused on validating the Baldrige model using surveys and data from states’ award programs.
Other researches such as Evans (1997), Ford and Evans (2000), Jack and Evans (2003) Evans
(2004) and Stephens, Evans, and Matthews (2005) studied the conceptual linkage among the
elements of the criteria and the results items. However, very little studies have been conducted
using Baldrige applicant data.
Conclusion
In conclusion, the literature review in a multidiscipline topic requires intensive research
in many areas in order to have an established understanding of the status in the various bodies of
knowledge. Even though, such study is overwhelming with information and requires huge
amount of time and efforts, the link between multiple bodies of knowledge is innovative in itself.
According to literature, there is very little in-depth research on how organizational
capabilities for innovation are developed in practice (Börjesson & Elmquist, 2011). In the
Baldrige side, recent a study shows that limited amount of scholarly research has been performed
using the Baldrige Criteria, also very little research has been performed using Baldrige applicant
51
data (Evans & Mai, 2014). The study argues that rigorous research on the impact and
effectiveness of the Baldrige program is still nascent.
Up to this writing, there is no study that has addressed the impact of Baldrige Excellence
Framework, utilizing applicants’ data and scores, on organizations’ innovation/dynamic
capabilities.
52
CHAPTER THREE: METHODOLOGY
Introduction
This chapter describes the design and methods that will be used in this research and will
outline and discuss the steps and rational behind the activities that will take place to measure and
collect the required data to achieve the objective of this research study, which is to measure the
effect and correlation between Baldrige (Sterling) framework on organizations
innovations/dynamic capabilities.
Methodology
A quantitative method is being used in this research study to explain the effect and the
correlation between organizations’ performance excellence measured by Baldrige (Sterling)
assessment score and their innovation/dynamic capabilities level. Two numerical data for each
organization will be measured/collected, one that measures the level of organization’s performance
excellence represented by the Baldrige (Sterling) assessment framework, and one that measures
the organization’s innovation/dynamic capabilities us ing a survey tool.
This research will answer the following question and hypothesis to explain the relationship
between Baldrige assessment framework and innovation/dynamic capabilities.
Main question: What is the effect of Baldrige (Sterling) assessment framework on Organization’s
innovation/dynamic capabilities?
Main Hypothesis: Baldrige assessment framework has a positive impact on Organization’s
innovation/dynamic capabilities.
53
To answer the research main question, further sub-questions and hypothesises have been
developed, each sub-question addresses one of six areas that represent a foundation block for
organization’s innovation capabilities (figure 2.0).
Sub-question 1: What is the effect of Baldrige assessment framework on Organization’s value for
innovation?
Hypothesis, H1: Baldrige assessment framework has a positive impact on Organization’s
value for innovation.
Sub-question 2: What is the effect of Baldrige assessment framework on Organization’s
behaviour regarding innovation?
Hypothesis, H2: Baldrige assessment framework has a positive impact on Organization’s
behaviour regarding innovation.
Sub-question 3: What is the effect of Baldrige assessment framework on Organization’s
innovation culture?
Hypothesis, H3: Baldrige assessment framework has a positive impact on Organization’s
innovation culture.
Sub-question 4: What is the effect of Baldrige assessment framework on Organization’s
innovation’s resources?
Hypothesis, H4: Baldrige assessment framework has a positive impact on Organization’s
innovation’s resources.
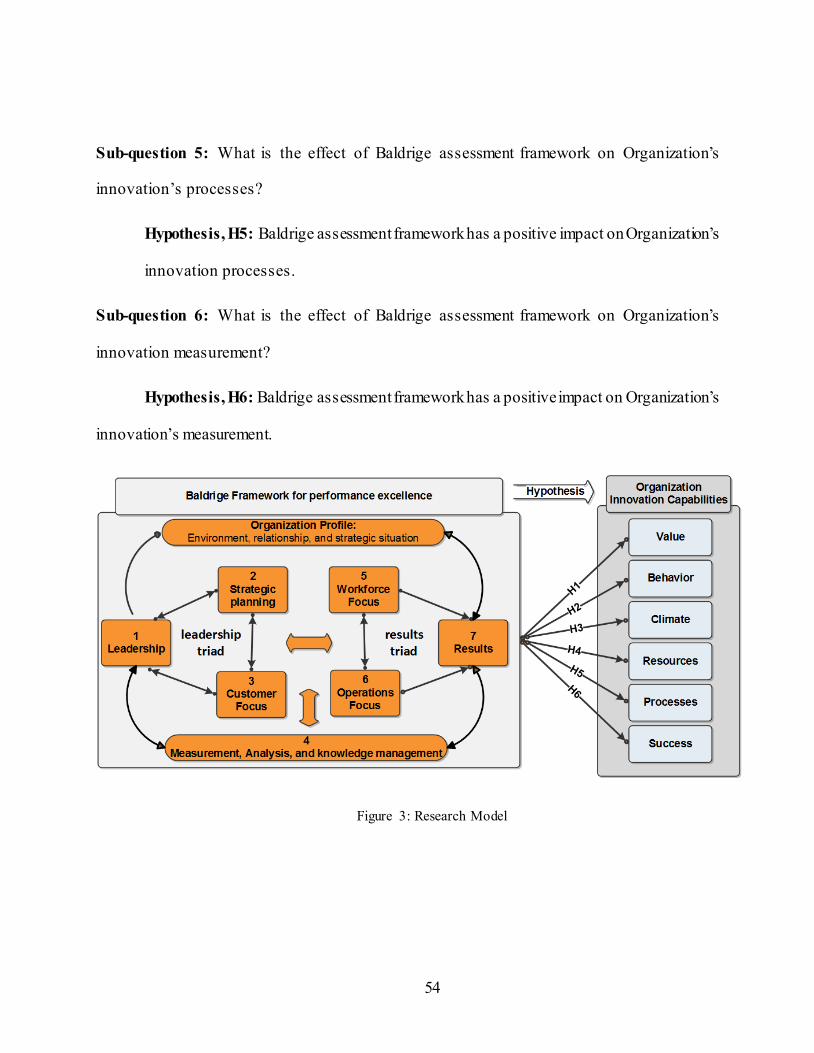
54
Sub-question 5: What is the effect of Baldrige assessment framework on Organization’s
innovation’s processes?
Hypothesis, H5: Baldrige assessment framework has a positive impact on Organization’s
innovation processes.
Sub-question 6: What is the effect of Baldrige assessment framework on Organization’s
innovation measurement?
Hypothesis, H6: Baldrige assessment framework has a positive impact on Organization’s
innovation’s measurement.
Figure 3: Research Model
55
Participants
In this research study, a total of 24 organizations participated in the study. The participating
organizations represent different industries; healthcare; education; private and government. All the
participating organizations are located in Florida State since Florida Sterling council conducts
Baldrige framework assessment on local organizations only.
The organizations selection was coordinated with Florida Sterling council who is supporting
this research by providing the assessment reports for the participating organizations and
communicating with organizations’ leaders to invite/encourage them to participate in the study.
The innovation survey (appendix A) will be assessed at three different levels of organization
hierarchy; top management, middle management, and employees in order to have a broad and 360
feedback from across the organization.
Instruments
This research employed two different instruments to measure organizations’ performance
excellence and innovation capabilities. Baldrige framework (Sterling assessment) was used to
measure organization’s performance excellence, and a comprehensive survey was used to measure
organization’s innovation capabilities.
Baldrige Framework (Sterling Assessment)
Florida Sterling has three main assessment programs ; Challenge, GSA, and Sustained. The
Sterling Challenge is designed for organizations that are in the early stages of developing a system
wide approach to improve their processes, It’s the first step towards GSA and Sustained programs.
56
The Sterling Challenge consist of an organization profile and a 20 pages answers to a simplified
and direct questionnaires on the seven areas of management practices: Leadership, Strategic
Planning, Customer Focus, Measurement, Analysis and Knowledge management, Workforce
Focus, Operations Focus and Results. During the five days site visit, a team of experts between 5-
6 members interview employees at all levels of the organization.
The Sterling GSA is designed for mature organizations with systematic processes and
positive results. The GSA assessment program is rigorous and consisting of organization profile
and a 50 pages response to a detailed questionnaires. GSA is conducted over an extensive seven
days site visit. A detailed feedback report at the item level is provided that identifies strength,
opportunities and overall organization theme.
The Sterling Sustained is designed to help GSA recipients retain their role model status as a
top performing organizations. The sustained program is a high-level assessment process that
examines the long-term sustainability of the Baldrige management framework. A formal off-site
and on-site assessment is conducted by a team of experienced examiners to verify and clarify
current organization performance through interviewing leaders and professionals in the
organization.
Innovation Survey
A comprehensive Innovation survey (appendix A) has been used in this research to measure
organizations’ innovation/dynamic capabilities. The survey is designed with fixed response items
based on a 5-point rating scale question. The survey questionnaires consist of six building blocks:
innovation Value, innovation behaviour, innovation culture, innovation resources, innovation
57
processes, and innovation success measurement. Each building block addresses three factors, and
each factor consists of three elements. This yields a total of 54 questions in the survey. The six
building blocks of organization innovation capabilities reviewed in details as part of the literature
review and summarised as follow:
Block 1 - Innovation value: The ability to value innovation across the organization
through:
o Instituting an entrepreneurial mindset that is action-oriented, has a hunger for
exploring new opportunities, and has tolerance for ambiguity.
o Institute creativity through encouraging new ways of thinking, providing
freedom to pursue new opportunities, and creating playful space.
o Institute learning habit through asking questions to uncover the unknowns,
experimenting new things, and treating failures as learning opportunities.
Block 2 – Innovation behavior: The ability to show the right behavior by leaders and
employees in the organization to reflect the value put on innovation in practice. This
can be done through:
o Energize the organization by inspiring the employees with future vision,
challenge the employees to act innovatively, and show the right innovation
model for employees to follow.
o Engage the employees through coaching and supporting their innovative
initiatives.
58
o Enabling innovation in the organization through use of strategies to overcome
obstacles, change course of action when needed, and follow opportunities
persistently.
Block 3 – Innovation Culture: The ability to transform the organization culture to one
that cultivates and encourage creativity and innovation. This can be done through:
o Create a collaboration climate in the organization through encouraging
teamwork, respecting diversity, having common understanding of innovation.
o Create a safe environment in the organization that encourages employees to
voice their opinions and question decisions that are inconsistent with the
organization values.
o Create a simple workplace environment that minimize bureaucracy, discourage
finger pointing and encourage taking responsibilities.
Block 4 – Innovation Resources: The ability to provide and mobilize the required
resources to support innovation within the organization, resourcing includes:
o People: Are the most critical factors in resources especially champions who
impact organizations values and culture, experts who guide others with
innovation tools, and talents who ensure projects success.
o Systems: that hires the right people for supporting innovation culture in the
organization, provides a collaboration tools to support innovation efforts, and
leverage relationships with suppliers and partners to pursue innovation
opportunities.
59
o Projects: providing employees with time, money, and space to pursue new
opportunities.
Block 5 – Innovation processes: The ability to develop the required processes that
funnel creative ideas through different stages till it become fully commercialized. This
requires:
o Ideation: a process that allows generation and collection of ideas from different
sources, screen the generated ideas for promising ones, and balance risk versus
opportunities.
o Shape: through prototyping promising opportunity, customers’ feedback, and
quick failing based on predefined criteria.
o Capture: through flexible process that takes promising opportunity quickly to
the market and allocates resources to scale initiatives that shows market
promise.
Block 6 – Innovation Success Measurement: The ability to measure innovation
efforts at different levels:
o External: measuring organization’s innovation with customers, against
competitors, and through organization’s financial performance.
o Enterprise: assessing the organization new capabilities over the past three years,
long term vision and approach to innovation.
o Individual: measuring employees’ satisfaction, growth, and reward in regard to
innovation efforts and initiatives.
60
Measurement scale
The two measurement instruments use different scale to assess their related measurements:
Baldrige Framework (Sterling Assessment)
Baldrige Framework (Sterling Assessment) measurement scale is based on two evaluation
dimensions: process and results. The processes criteria follow a scoring scale (Table 1) that is
different from the result criterion scoring scale (Table 2). Process refers to the way organizations
perform and improve works in Leadership, Strategic planning, Customer Focus, Measurement,
Analysis and Knowledge management, Workforce Focus, Operation Focus. The processes are
evaluated based on four factors; Approach, Deployment, Learning and Integration (ADLI).
Approach refers to the method used to accomplish the process and how appropriate and effective
these methods are, Deployment refers the extent and consistency of used approaches across the
organization, Learning refers to the improvement conducted on these approaches and sharing of
best practices and Integration refers to the alignment of these approaches with the organization
goals and needs. Results refer to the output of the organization processes in the six areas mentioned
above. Four factors are used to evaluate results; Levels, trends, Comparisons, and integration
(LeTCI). Level refers the current level of performance. Trends refer to results over extended time
or the slope of the results. Comparisons refer to the organization performance in relation to
competitors and industry leaders. Integration refers to how relative the results to the organization
profile key factors.
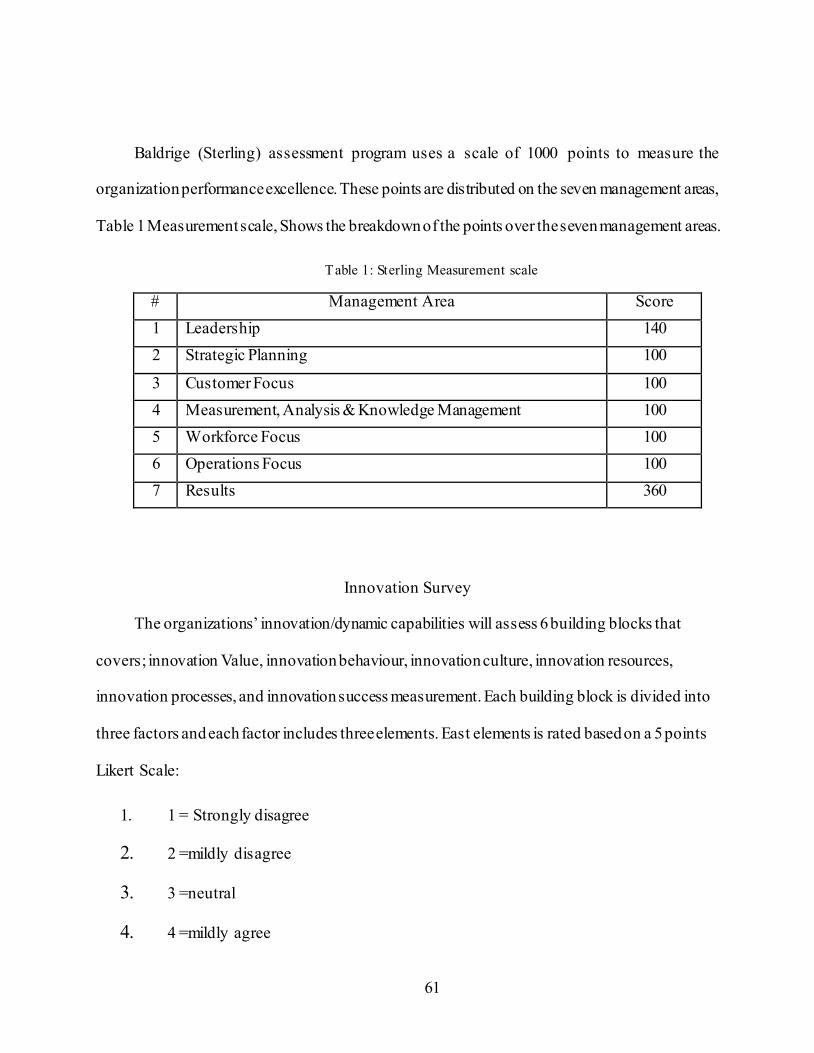
61
Baldrige (Sterling) assessment program uses a scale of 1000 points to measure the
organization performance excellence. These points are distributed on the seven management areas,
Table 1 Measurement scale, Shows the breakdown of the points over the seven management areas.
Table 1: Sterling Measurement scale
# Management Area Score
1 Leadership 140
2 Strategic Planning 100
3 Customer Focus 100
4 Measurement, Analysis & Knowledge Management 100
5 Workforce Focus 100
6 Operations Focus 100
7 Results 360
Innovation Survey
The organizations’ innovation/dynamic capabilities will assess 6 building blocks that
covers; innovation Value, innovation behaviour, innovation culture, innovation resources,
innovation processes, and innovation success measurement. Each building block is divided into
three factors and each factor includes three elements. East elements is rated based on a 5 points
Likert Scale:
1. 1 = Strongly disagree
2. 2 =mildly disagree
3. 3 =neutral
4. 4 =mildly agree
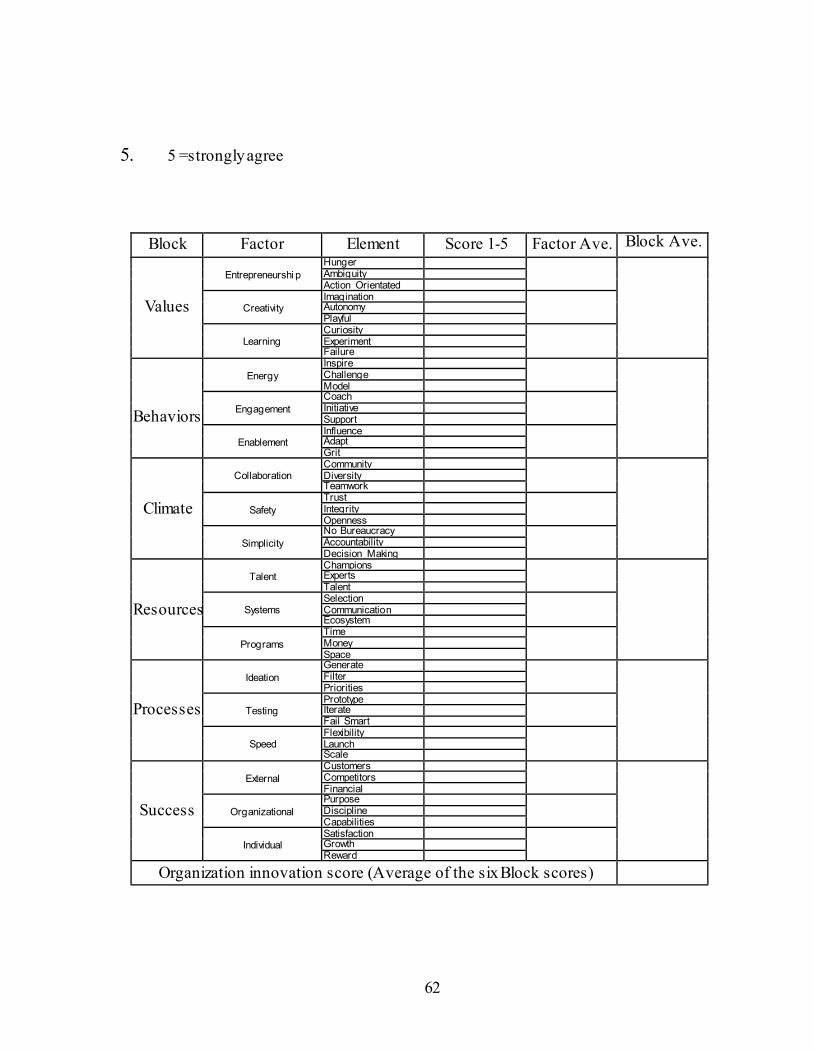
62
5. 5 =strongly agree
Block Factor Element Score 1-5 Factor Ave. Block Ave.
Values
Entrepreneurshi p
Hunger Ambiguity Action Orientated
Creativity
Imagination Autonomy Playful
Learning
Curiosity Experiment Failure
Behaviors
Energy
Inspire Challenge Model
Engagement
Coach Initiative Support
Enablement
Influence Adapt Grit
Climate
Collaboration
Community Diversity Teamwork
Safety
Trust Integrity Openness
Simplicity
No Bureaucracy Accountability Decision Making
Resources
Talent
Champions Experts Talent
Systems
Selection Communication Ecosystem
Programs
Time Money Space
Processes
Ideation
Generate Filter Priorities
Testing
Prototype Iterate Fail Smart
Speed
Flexibility Launch Scale
Success
External
Customers Competitors Financial
Organizational
Purpose Discipline Capabilities
Individual
Satisfaction Growth Reward
Organization innovation score (Average of the six Block scores)
63
Table 2: Innovation Capabilities score
Elements will be averaged to obtain the factor score, and factors will be averaged to
calculate the block score, the average of the six building blocks reflect the overall organization
innovation capabilities score.
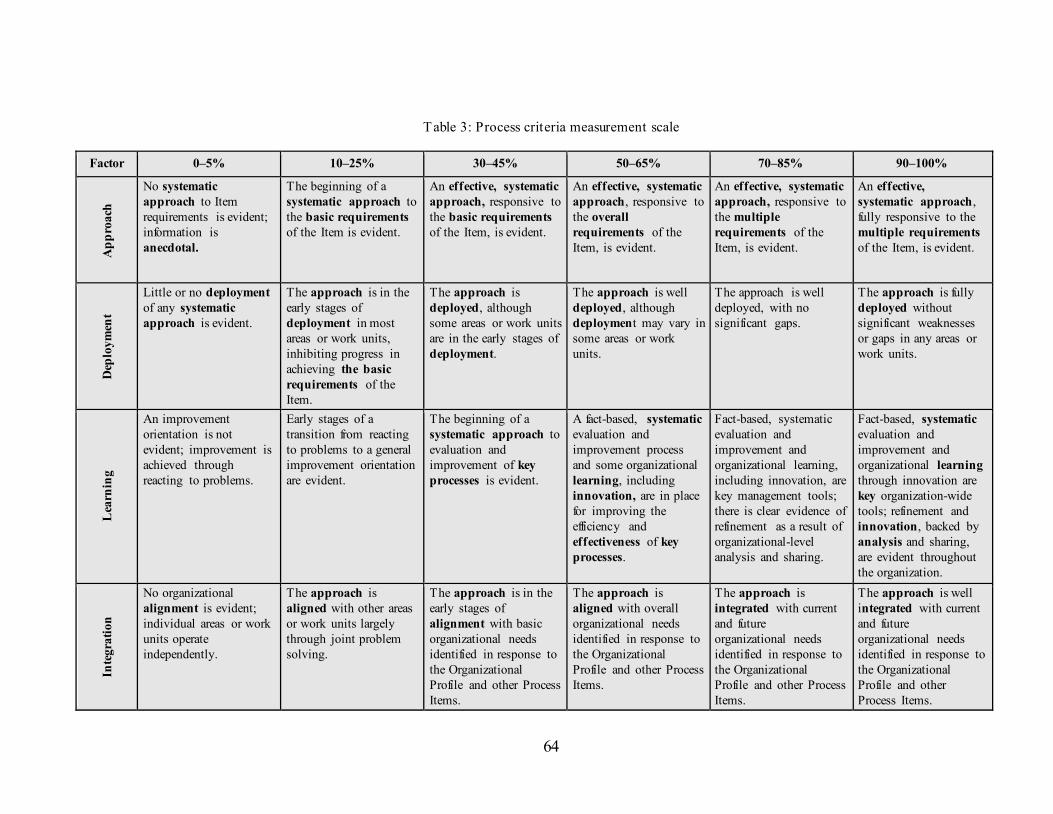
64
Table 3: Process criteria measurement scale
Factor 0–5% 10–25% 30–45% 50–65% 70–85% 90–100%
Ap
pro
ach
No systematic
approach to Item
requirements is evident;
information is
anecdotal.
The beginning of a
systematic approach to
the basic requirements
of the Item is evident.
An effective, systematic
approach, responsive to
the basic requirements
of the Item, is evident.
An effective, systematic
approach, responsive to
the overall
requirements of the
Item, is evident.
An effective, systematic
approach, responsive to
the multiple
requirements of the
Item, is evident.
An effective,
systematic approach,
fully responsive to the
multiple requirements
of the Item, is evident.
Dep
loy
men
t
Little or no deployment
of any systematic
approach is evident.
The approach is in the
early stages of
deployment in most
areas or work units,
inhibiting progress in
achieving the basic
requirements of the
Item.
The approach is
deployed, although
some areas or work units
are in the early stages of
deployment.
The approach is well
deployed, although
deployment may vary in
some areas or work
units.
The approach is well
deployed, with no
significant gaps.
The approach is fully
deployed without
significant weaknesses
or gaps in any areas or
work units.
Lea
rnin
g
An improvement
orientation is not
evident; improvement is
achieved through
reacting to problems.
Early stages of a
transition from reacting
to problems to a general
improvement orientation
are evident.
The beginning of a
systematic approach to
evaluation and
improvement of key
processes is evident.
A fact-based, systematic
evaluation and
improvement process
and some organizational
learning, including
innovation, are in place
for improving the
efficiency and
effectiveness of key
processes.
Fact-based, systematic
evaluation and
improvement and
organizational learning,
including innovation, are
key management tools;
there is clear evidence of
refinement as a result of
organizational-level
analysis and sharing.
Fact-based, systematic
evaluation and
improvement and
organizational learning
through innovation are
key organization-wide
tools; refinement and
innovation, backed by
analysis and sharing,
are evident throughout
the organization.
Inte
gra
tio
n
No organizational
alignment is evident;
individual areas or work
units operate
independently.
The approach is
aligned with other areas
or work units largely
through joint problem
solving.
The approach is in the
early stages of
alignment with basic
organizational needs
identified in response to
the Organizational
Profile and other Process
Items.
The approach is
aligned with overall
organizational needs
identified in response to
the Organizational
Profile and other Process
Items.
The approach is
integrated with current
and future
organizational needs
identified in response to
the Organizational
Profile and other Process
Items.
The approach is well
integrated with current
and future
organizational needs
identified in response to
the Organizational
Profile and other
Process Items.
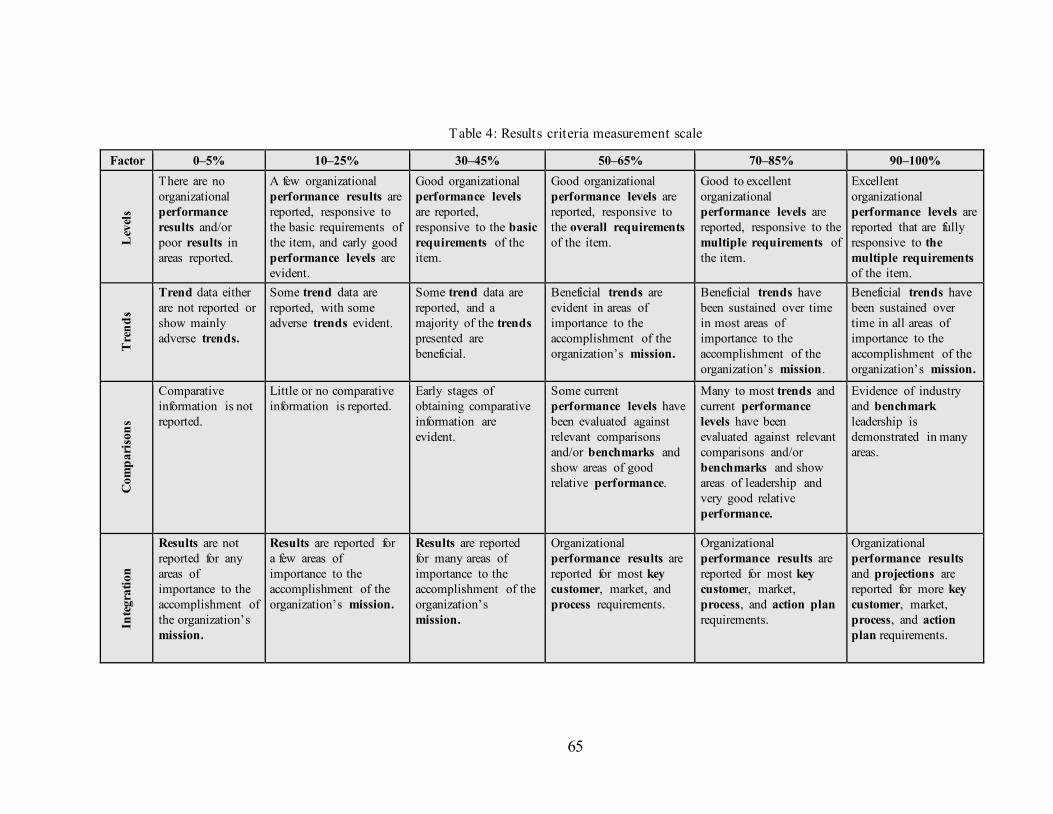
65
Table 4: Results criteria measurement scale
Factor 0–5% 10–25% 30–45% 50–65% 70–85% 90–100%
Lev
els
There are no
organizational
performance
results and/or
poor results in
areas reported.
A few organizational
performance results are
reported, responsive to
the basic requirements of
the item, and early good
performance levels are
evident.
Good organizational
performance levels
are reported,
responsive to the basic
requirements of the
item.
Good organizational
performance levels are
reported, responsive to
the overall requirements
of the item.
Good to excellent
organizational
performance levels are
reported, responsive to the
multiple requirements of
the item.
Excellent
organizational
performance levels are
reported that are fully
responsive to the
multiple requirements
of the item.
Tre
nd
s
Trend data either
are not reported or
show mainly
adverse trends.
Some trend data are
reported, with some
adverse trends evident.
Some trend data are
reported, and a
majority of the trends
presented are
beneficial.
Beneficial trends are
evident in areas of
importance to the
accomplishment of the
organization’s mission.
Beneficial trends have
been sustained over time
in most areas of
importance to the
accomplishment of the
organization’s mission.
Beneficial trends have
been sustained over
time in all areas of
importance to the
accomplishment of the
organization’s mission.
Co
mp
ari
son
s
Comparative
information is not
reported.
Little or no comparative
information is reported.
Early stages of
obtaining comparative
information are
evident.
Some current
performance levels have
been evaluated against
relevant comparisons
and/or benchmarks and
show areas of good
relative performance.
Many to most trends and
current performance
levels have been
evaluated against relevant
comparisons and/or
benchmarks and show
areas of leadership and
very good relative
performance.
Evidence of industry
and benchmark
leadership is
demonstrated in many
areas.
Inte
gra
tio
n
Results are not
reported for any
areas of
importance to the
accomplishment of
the organization’s
mission.
Results are reported for
a few areas of
importance to the
accomplishment of the
organization’s mission.
Results are reported
for many areas of
importance to the
accomplishment of the
organization’s
mission.
Organizational
performance results are
reported for most key
customer, market, and
process requirements.
Organizational
performance results are
reported for most key
customer, market,
process, and action plan
requirements.
Organizational
performance results
and projections are
reported for more key
customer, market,
process, and action
plan requirements.
66
Quality and validity of tools:
Reliability and validity of the used instrument are crucial to ensure quality of the
measurement. Reliability deals with the stability and consistency of the measure instruments.
There are four types of reliability test for a measurement instrument; Test-retest reliability, parallel
form reliability, inter-rater reliability, and internal consistency reliability. Validity refers to the
extent an instrument measures what it is purported to measure. Validity is measured in four forms;
face validity, content validity, criterion validity, and construct validity.
In this research, Organization’s innovation/dynamic capabilities are measured using an
established instrument, survey questionnaires that have been field-tested for over two years for
statistical validity and executive acceptance as both a diagnostic and actionable tool. Data was
gathered from 1,026 executives and managers in 15 companies headquartered in the U.S.,
Europe, Latin America and Asia. Confirmatory factor analysis revealed that 16 out of the 18
factors were reliable at 0.7 or above; the other two were above 0.6. A complete item analysis
showed that item discrimination was 0.3 and above (Rao & Weintraub, 2013).
The organization performance excellence assessment follows the Baldrige framework for
assessment, which is a standard methodology that is being use in the US and other countries across
the world to assess and improve organizations performance. The assessment process goes through
ten steps:
1) Organization training: where Florida Sterling trains potential organizations on the
performance excellence framework and assessment criteria.
67
2) Organization profile: the organization develops a complete profile that reflects the
organizations products, services, customer, partners, workforce profile. The
organization also provides current and future strategy, goals and objectives,
competitive challenges and advantages.
3) Criteria response: The organization responds to the assessment criteria based ADLI
(Approach, Deploy, Learning, and Integration) process. Which means that every
criteria response has to show consistent approach across the organization, it also
has to be deployed and used throughout the organization, there must be learning in
the process, and it has to show integration with whole system. The criteria response
usually takes between 10 to 50 pages.
4) Examiners training: Florida sterling trains the examiners on the assessment process
and this takes three training classes in addition to completing a case assessment.
5) Examiner Team: Sterling organization forms the examining team based on the
domain of knowledge and industry of the organization operate in. usually six to
nine examiners are assigned the assessed organization.
6) Individual evaluation: first actual assessment step is done individually by all
examiners, where each examiner review the organization responses to all criteria
and complete an independent evaluation.
7) Team consensus: where the examining team meet for a full day to review all
independent assessments and come with a consensus result.
68
8) Site visit: the team arrange for a five to seven days site visit during which, the
examiners meet with staff from the organization and conduct an interview with
leaders, managers, and staff working in the organization. The consensus assessment
gets updated based on the site visit collected information.
9) Finalize assessment report: The team finalize the assessment report and sent it to
Florida Sterling.
10) Feedback: Florida Sterling reviews the report and develop an official feedback
report to the applicant in case of Challenge program. If the organization is
participating in a GSA or Sustained program, the final assessment report is sent to
judges to review and select performance winners.
The process for assessing organizations performance is rigorous and takes from two to six
months to complete based on the size and type or assessment. To ensure that the data from the
performance excellence does not interfere or affect the data from innovation capability measure,
Both assessment have been done separately with at least two months difference and through
different medium. The Baldrige assessment is mainly face to face with on-site and off-site
assessment; Innovation assessment is an online survey.
Analysis
Once the data are collected, each organization will have two data records, one that measures
the organization performance excellence in term of leadership, strategic planning, customer focus,
workforce focus, knowledge management, operation, and results, these performance scores are
aggregated to establish the overall organization performance excellence score out of 1000 points.
69
The other data measure represents the organization innovation capability in terms of innovation
value, innovation behaviour, innovation culture, innovation resources, innovation process, and
innovation measurement; these innovations scores are aggregated to establish an organization
innovation capability score out of 5 points.
First step, validate the three different Baldrige (Sterling) performance excellence assessment
programs and their effect on organizations’ overall performance. Using ANOVA, we analyse the
difference of performance means among the three assessment programs; Challenge, GSA, and
sustained. This will show that the different assessment programs do reflect different performance
excellence levels that we will be using to measure their effects on organizations innovations’
capabilities.
Second step, Regression analysis will be used to test the six hypothesises to measure the
relationship between Baldrige assessment framework and each of the six measured innovation
blocks. This will show the effect of Baldrige (Sterling) management framework on each innovation
building block.
Third step, Regression analysis will be used to test the main hypothesis to measure the
relationship between Baldrige assessment framework and overall organization’s innovation
capability score.
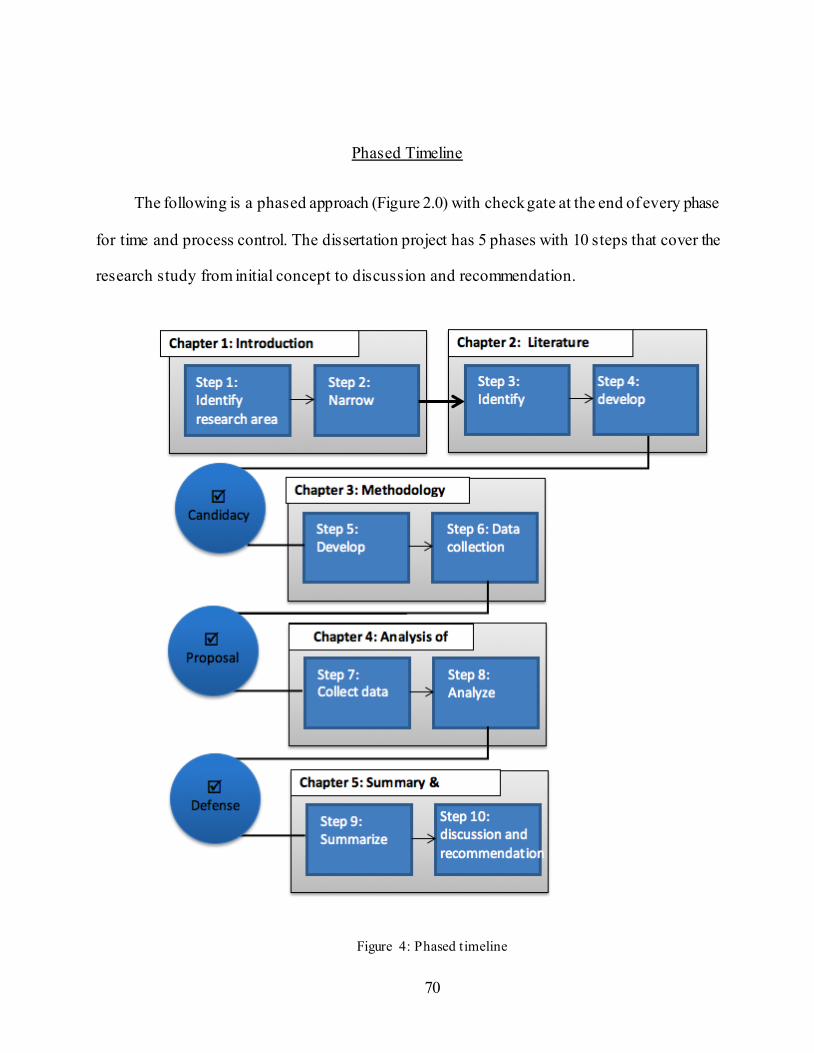
70
Phased Timeline
The following is a phased approach (Figure 2.0) with check gate at the end of every phase
for time and process control. The dissertation project has 5 phases with 10 steps that cover the
research study from initial concept to discussion and recommendation.
Figure 4: Phased timeline
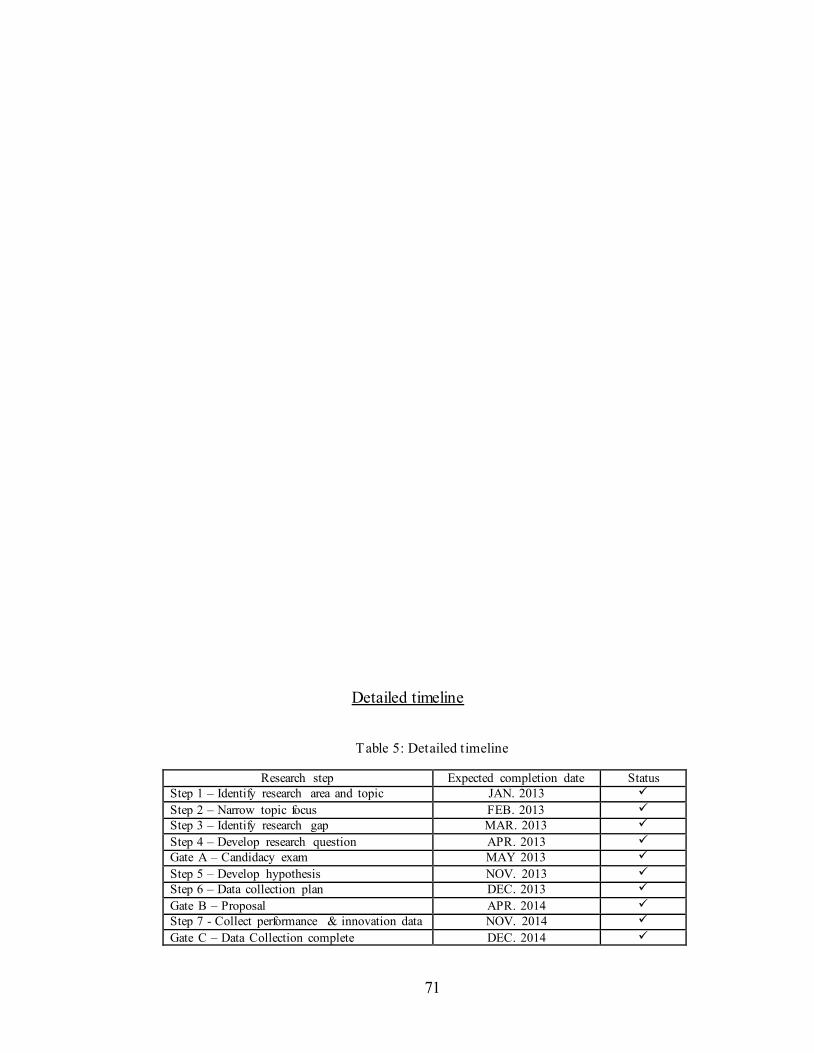
71
Detailed timeline
Table 5: Detailed timeline
Research step Expected completion date Status
Step 1 – Identify research area and topic JAN. 2013
Step 2 – Narrow topic focus FEB. 2013
Step 3 – Identify research gap MAR. 2013
Step 4 – Develop research question APR. 2013
Gate A – Candidacy exam MAY 2013
Step 5 – Develop hypothesis NOV. 2013
Step 6 – Data collection plan DEC. 2013
Gate B – Proposal APR. 2014
Step 7 - Collect performance & innovation data NOV. 2014
Gate C – Data Collection complete DEC. 2014
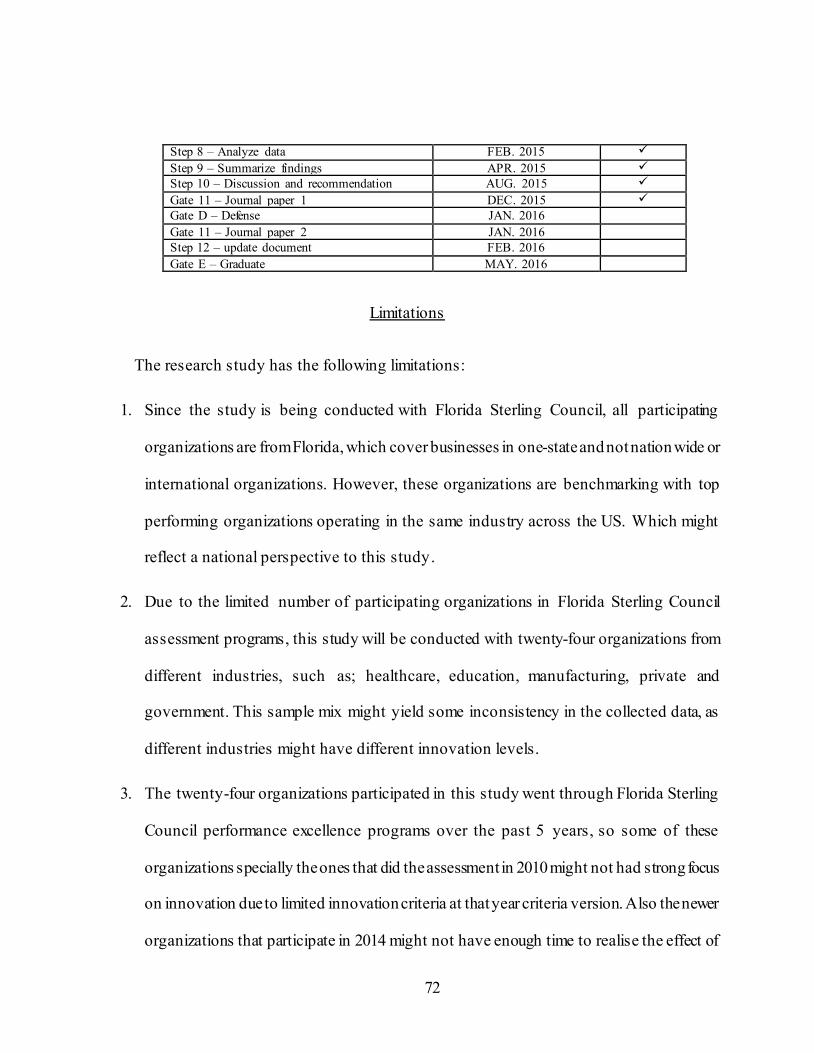
72
Step 8 – Analyze data FEB. 2015
Step 9 – Summarize findings APR. 2015
Step 10 – Discussion and recommendation AUG. 2015
Gate 11 – Journal paper 1 DEC. 2015
Gate D – Defense JAN. 2016
Gate 11 – Journal paper 2 JAN. 2016
Step 12 – update document FEB. 2016
Gate E – Graduate MAY. 2016
Limitations
The research study has the following limitations:
1. Since the study is being conducted with Florida Sterling Council, all participating
organizations are from Florida, which cover businesses in one-state and not nation wide or
international organizations. However, these organizations are benchmarking with top
performing organizations operating in the same industry across the US. Which might
reflect a national perspective to this study.
2. Due to the limited number of participating organizations in Florida Sterling Council
assessment programs, this study will be conducted with twenty-four organizations from
different industries, such as; healthcare, education, manufacturing, private and
government. This sample mix might yield some inconsistency in the collected data, as
different industries might have different innovation levels.
3. The twenty-four organizations participated in this study went through Florida Sterling
Council performance excellence programs over the past 5 years, so some of these
organizations specially the ones that did the assessment in 2010 might not had strong focus
on innovation due to limited innovation criteria at that year criteria version. Also the newer
organizations that participate in 2014 might not have enough time to realise the effect of
73
the program in their innovation capabilities. So all these variations in time and criteria
version used among the participating organizations might produce different data. However,
Florida Sterling Council keep updating participating organizations with newer criteria
every two years and also invite and encourage those organizations to continue their journey
to higher level of performance excellence through providing different assessment
programs. Which might help the organizations continue focus on improving their
operational and dynamic capabilities.
4. Another limitation in might have been in the innovation survey, eleven of the twenty-four
organizations responded to the innovation survey, a response rate of 45.8%. Senior
examiners in mature organizations completed the innovation survey. However, new
organizations with no experienced examiners had their employees completed the survey.
This might have inconsistent feedback, however to control this, a large number of
participants were required from new organizations in order to accept their data.
5. Finally, Performance excellence data were collected through examiners. No clear data is
available to examine the effect of examiners levels in the scoring process. Examiners’
experience might have influenced the data. However, Florida sterling intensive examiners
training, careful examiners selections based on the examiners performance during training
and participation of senior examiners during the site visit and final scores suggest that
reliability of the collected data is not an issue.
74
CHAPTER FOUR: FINDINGS
Introduction
The objective of chapter four is to present the findings that have been collected as part of
this research study, which measures the effect of Baldrige (Florida Sterling) performance
excellence framework on organizations’ innovations capabilities. This is a quantitative
correlation study that is trying to measure the correlation between performance excellence and
the organization’s innovation capabilities. Findings will be presented based on the significance
of the tested hypothesis. The data demographics will be presented in this chapter, where type,
specifications and age of collected data are discussed.
Data demographics
The target population in this research is consisted of any organizations of any size from
private, government, education, manufacturing and healthcare sectors that have participated in
one of Florida Sterling performance excellence programs. This research is focusing on three
main performance excellence assessment programs; Sterling challenge, Governor Sterling Award
(GSA), or Sterling Sustained Award. All organizations are located in the state of Florida, in the
US. However, these organizations are benchmarking with top performing organizations
operating in the same industry across the US. Which reflects a national perspective to this study.
The data were collected from organizations that have been assessed through Sterling programs
over the past five years (2010-2014). Some of these organizations have been assessed multiple
times before 2010 and showed improvement in their performance excellence over the years;
others are being assessed for the first time. New organizations usually start their performance
75
excellence journey with the challenge program and move on to utilize other assessment programs
as they work on improving current processes and results.
Organizations Performance excellence data
The sampled organizations represent a wide range of performance output on the scale of
performance excellence (100-1000) points. Starting from low performing organizations that
score low in the Sterling challenge assessment program, Which is used by most organization in
their early stages of performance excellence journey, to high performing organizations that score
high on the same scale in the Sterling sustained program, which is used by organizations that
have spent years in improvement and went through the detailed assessment program represented
by the Governor Sterling Award (GSA) program.
The performance excellence data are extracted and summarized from each organization
final performance assessment report. Performance assessment reports vary in length from one
assessment type to another. For example, the challenge report assessment averages at twenty
pages. The Governor Sterling Award assessment report, which is the most detailed one, averages
at sixty pages. The Sterling Sustained assessment report averages at sixteen pages.
A typical assessment report reflects a detailed measurement in the Baldrige seven
management areas (Leadership, Strategic planning, Customer focus, Measurement and
knowledge management, Workforce focus, Operation focus and results). A detailed data of the
collected results are listed in Appendix D (performance excellence data). In this study, the
detailed data have been aggregated to calculate the process performance score and the results
score for each organization. The process performance has a maximum score of 640 points and
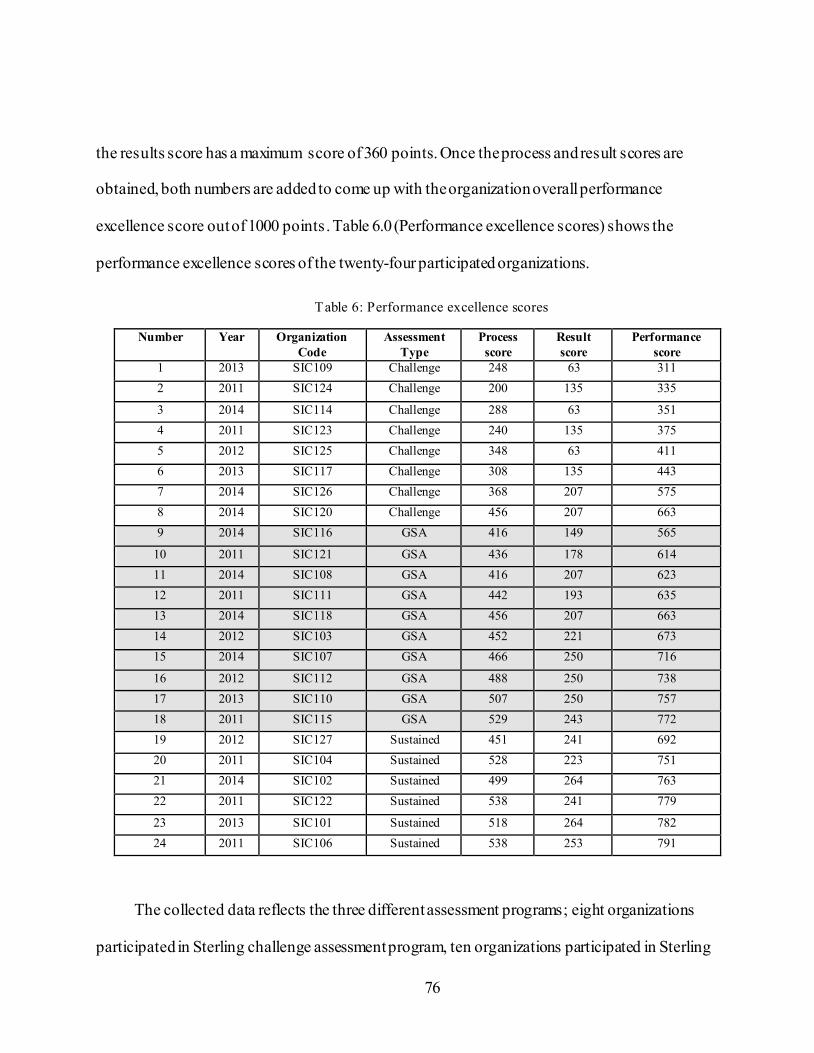
76
the results score has a maximum score of 360 points. Once the process and result scores are
obtained, both numbers are added to come up with the organization overall performance
excellence score out of 1000 points. Table 6.0 (Performance excellence scores) shows the
performance excellence scores of the twenty-four participated organizations.
Table 6: Performance excellence scores
Number Year Organization
Code
Assessment
Type
Process
score
Result
score
Performance
score
1 2013 SIC109 Challenge 248 63 311
2 2011 SIC124 Challenge 200 135 335
3 2014 SIC114 Challenge 288 63 351
4 2011 SIC123 Challenge 240 135 375
5 2012 SIC125 Challenge 348 63 411
6 2013 SIC117 Challenge 308 135 443
7 2014 SIC126 Challenge 368 207 575
8 2014 SIC120 Challenge 456 207 663
9 2014 SIC116 GSA 416 149 565
10 2011 SIC121 GSA 436 178 614
11 2014 SIC108 GSA 416 207 623
12 2011 SIC111 GSA 442 193 635
13 2014 SIC118 GSA 456 207 663
14 2012 SIC103 GSA 452 221 673
15 2014 SIC107 GSA 466 250 716
16 2012 SIC112 GSA 488 250 738
17 2013 SIC110 GSA 507 250 757
18 2011 SIC115 GSA 529 243 772
19 2012 SIC127 Sustained 451 241 692
20 2011 SIC104 Sustained 528 223 751
21 2014 SIC102 Sustained 499 264 763
22 2011 SIC122 Sustained 538 241 779
23 2013 SIC101 Sustained 518 264 782
24 2011 SIC106 Sustained 538 253 791
The collected data reflects the three different assessment programs; eight organizations
participated in Sterling challenge assessment program, ten organizations participated in Sterling
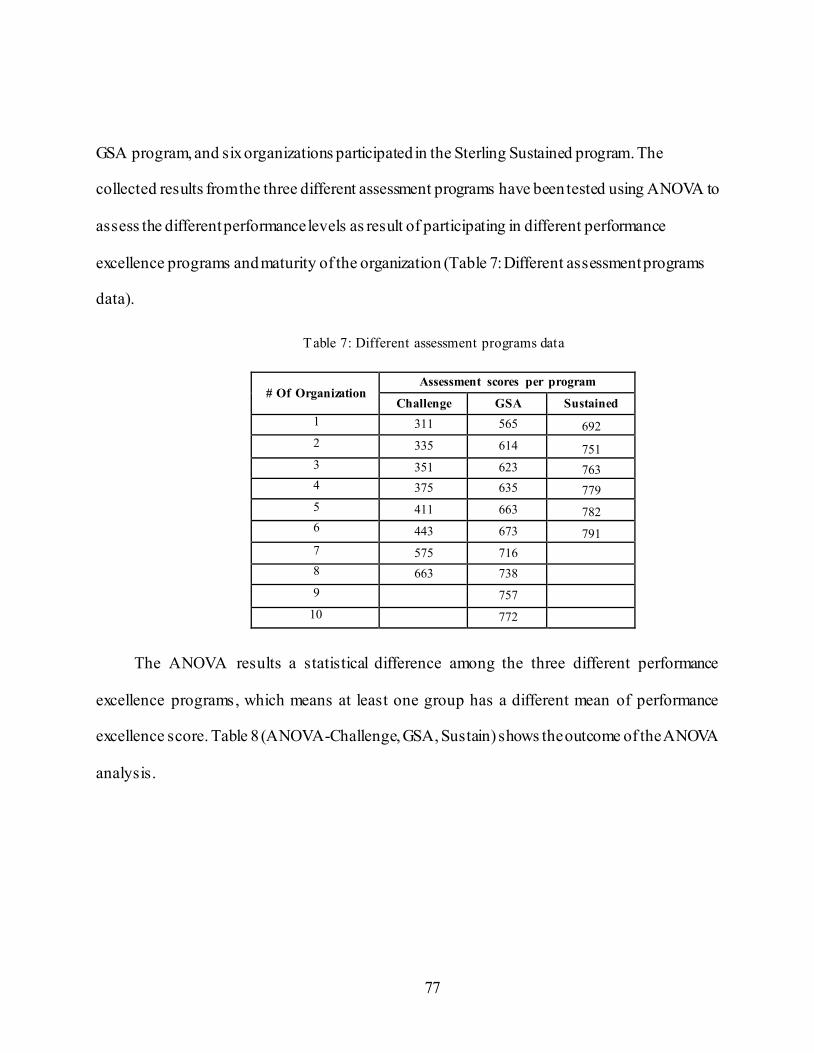
77
GSA program, and six organizations participated in the Sterling Sustained program. The
collected results from the three different assessment programs have been tested using ANOVA to
assess the different performance levels as result of participating in different performance
excellence programs and maturity of the organization (Table 7: Different assessment programs
data).
Table 7: Different assessment programs data
The ANOVA results a statistical difference among the three different performance
excellence programs, which means at least one group has a different mean of performance
excellence score. Table 8 (ANOVA-Challenge, GSA, Sustain) shows the outcome of the ANOVA
analysis.
# Of Organization Assessment scores per program
Challenge GSA Sustained
1 311 565 692
2 335 614 751
3 351 623 763
4 375 635 779
5 411 663 782
6 443 673 791
7 575 716
8 663 738
9 757
10 772
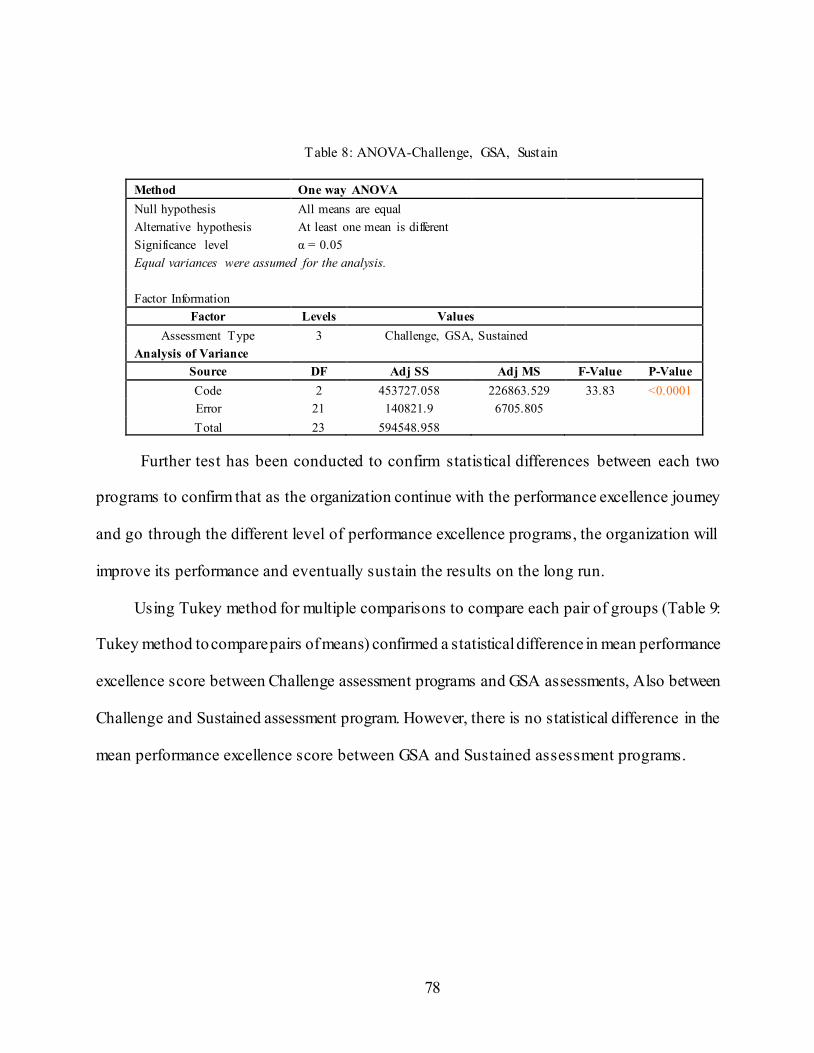
78
Table 8: ANOVA-Challenge, GSA, Sustain
Further test has been conducted to confirm statistical differences between each two
programs to confirm that as the organization continue with the performance excellence journey
and go through the different level of performance excellence programs, the organization will
improve its performance and eventually sustain the results on the long run.
Using Tukey method for multiple comparisons to compare each pair of groups (Table 9:
Tukey method to compare pairs of means) confirmed a statistical difference in mean performance
excellence score between Challenge assessment programs and GSA assessments, Also between
Challenge and Sustained assessment program. However, there is no statistical difference in the
mean performance excellence score between GSA and Sustained assessment programs.
Method One way ANOVA
Null hypothesis All means are equal
Alternative hypothesis At least one mean is different
Significance level α = 0.05
Equal variances were assumed for the analysis.
Factor Information
Factor Levels Values
Assessment Type 3 Challenge, GSA, Sustained
Analysis of Variance
Source DF Adj SS Adj MS F-Value P-Value
Code 2 453727.058 226863.529 33.83 <0.0001
Error 21 140821.9 6705.805
Total 23 594548.958
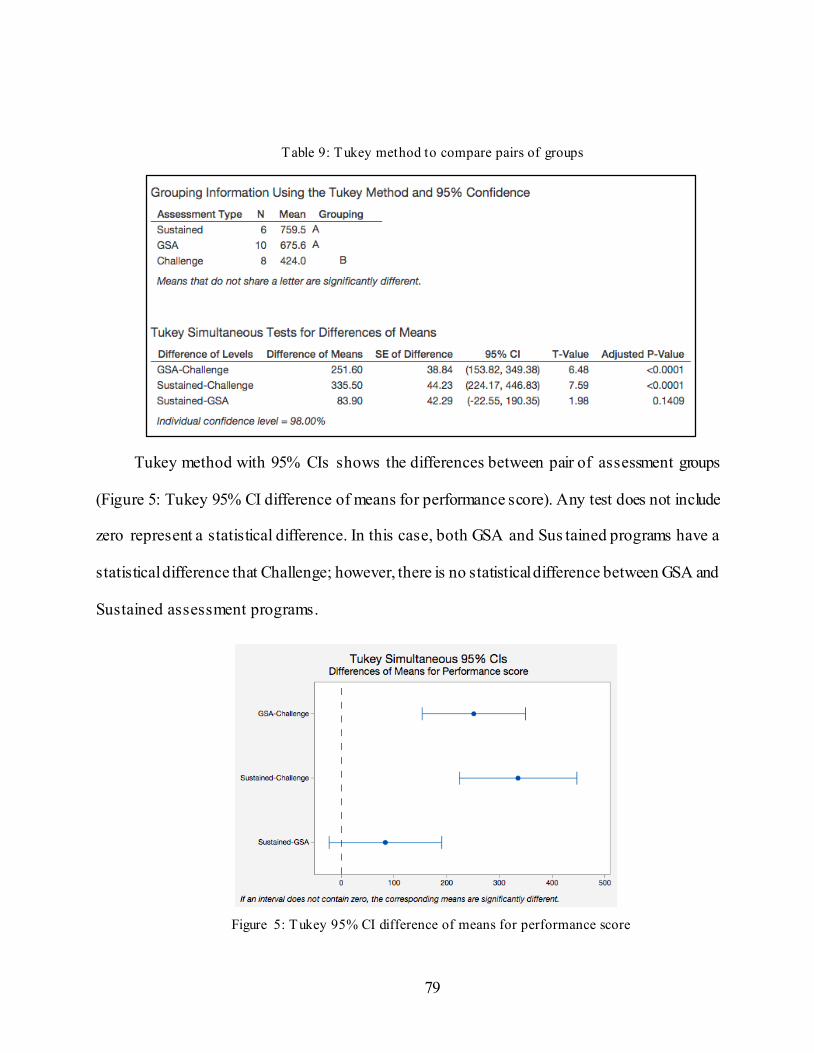
79
Table 9: Tukey method to compare pairs of groups
Tukey method with 95% CIs shows the differences between pair of assessment groups
(Figure 5: Tukey 95% CI difference of means for performance score). Any test does not include
zero represent a statistical difference. In this case, both GSA and Sus tained programs have a
statistical difference that Challenge; however, there is no statistical difference between GSA and
Sustained assessment programs.
Figure 5: Tukey 95% CI difference of means for performance score
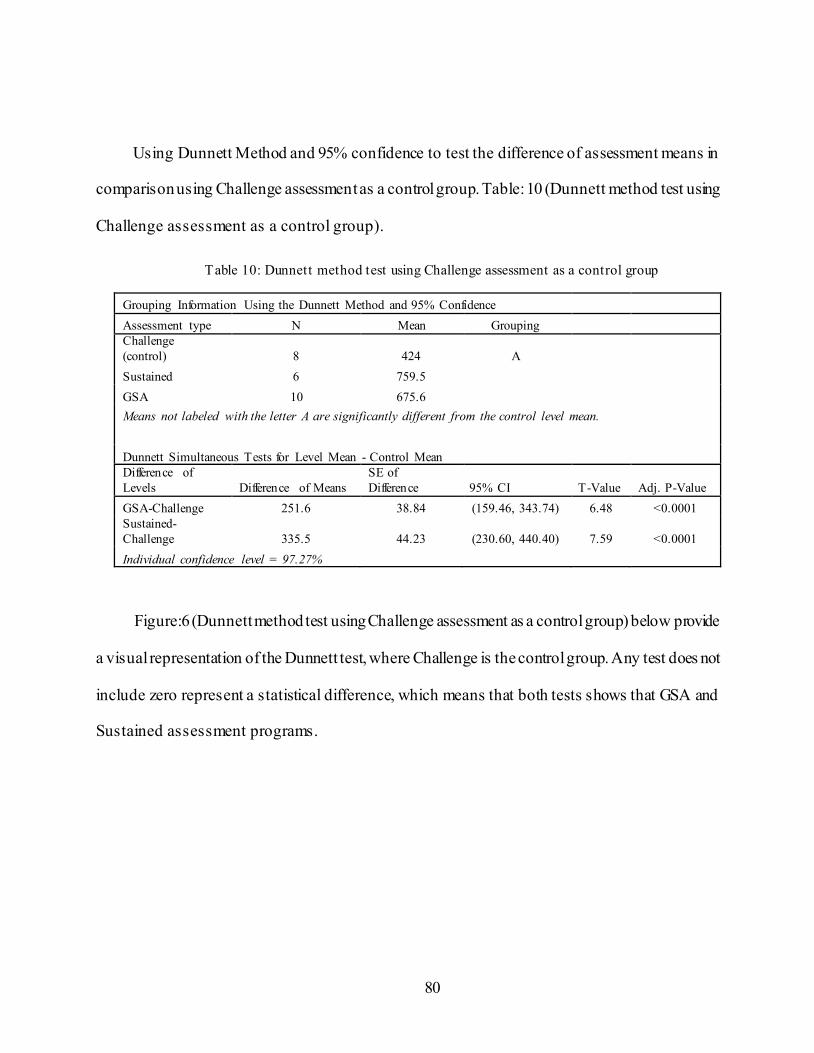
80
Using Dunnett Method and 95% confidence to test the difference of assessment means in
comparison using Challenge assessment as a control group. Table: 10 (Dunnett method test using
Challenge assessment as a control group).
Table 10: Dunnett method test using Challenge assessment as a control group
Grouping Information Using the Dunnett Method and 95% Confidence
Assessment type N Mean Grouping
Challenge
(control) 8 424 A
Sustained 6 759.5
GSA 10 675.6
Means not labeled with the letter A are significantly different from the control level mean.
Dunnett Simultaneous Tests for Level Mean - Control Mean
Difference of
Levels Difference of Means
SE of
Difference 95% CI T-Value Adj. P-Value
GSA-Challenge 251.6 38.84 (159.46, 343.74) 6.48 <0.0001
Sustained-
Challenge 335.5 44.23 (230.60, 440.40) 7.59 <0.0001
Individual confidence level = 97.27%
Figure:6 (Dunnett method test using Challenge assessment as a control group) below provide
a visual representation of the Dunnett test, where Challenge is the control group. Any test does not
include zero represent a statistical difference, which means that both tests shows that GSA and
Sustained assessment programs.
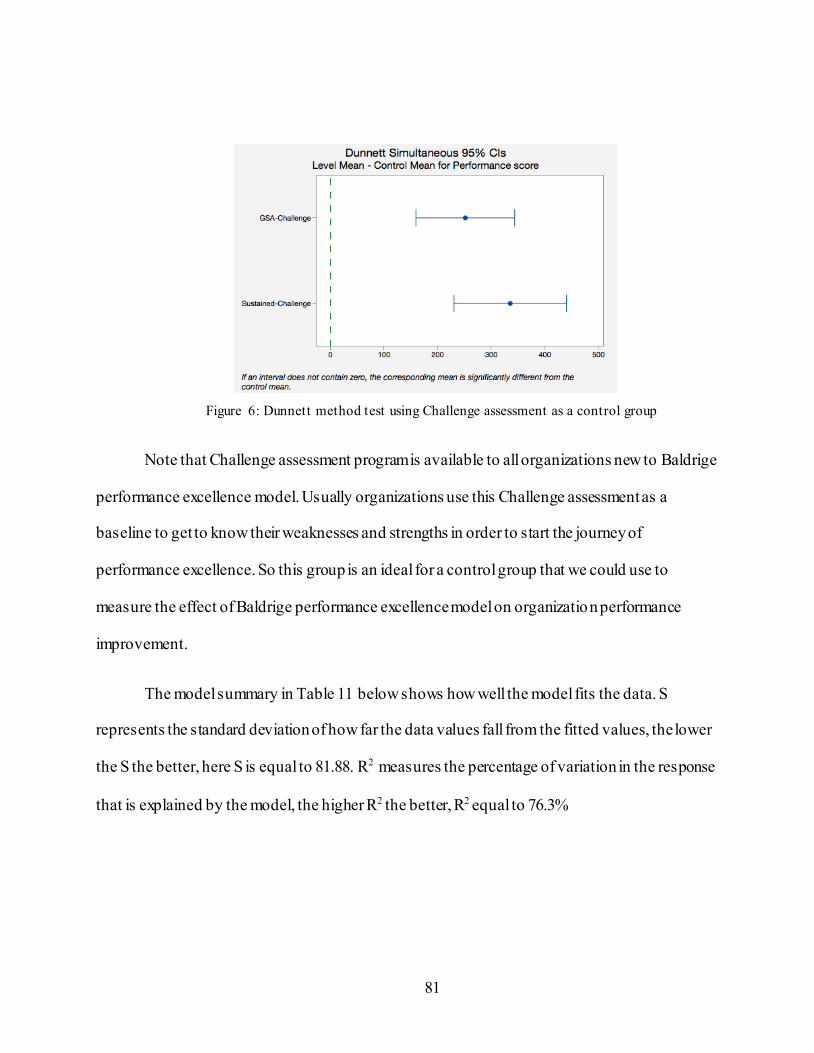
81
Figure 6: Dunnett method test using Challenge assessment as a control group
Note that Challenge assessment program is available to all organizations new to Baldrige
performance excellence model. Usually organizations use this Challenge assessment as a
baseline to get to know their weaknesses and strengths in order to start the journey of
performance excellence. So this group is an ideal for a control group that we could use to
measure the effect of Baldrige performance excellence model on organization performance
improvement.
The model summary in Table 11 below shows how well the model fits the data. S
represents the standard deviation of how far the data values fall from the fitted values, the lower
the S the better, here S is equal to 81.88. R2 measures the percentage of variation in the response
that is explained by the model, the higher R2 the better, R2 equal to 76.3%
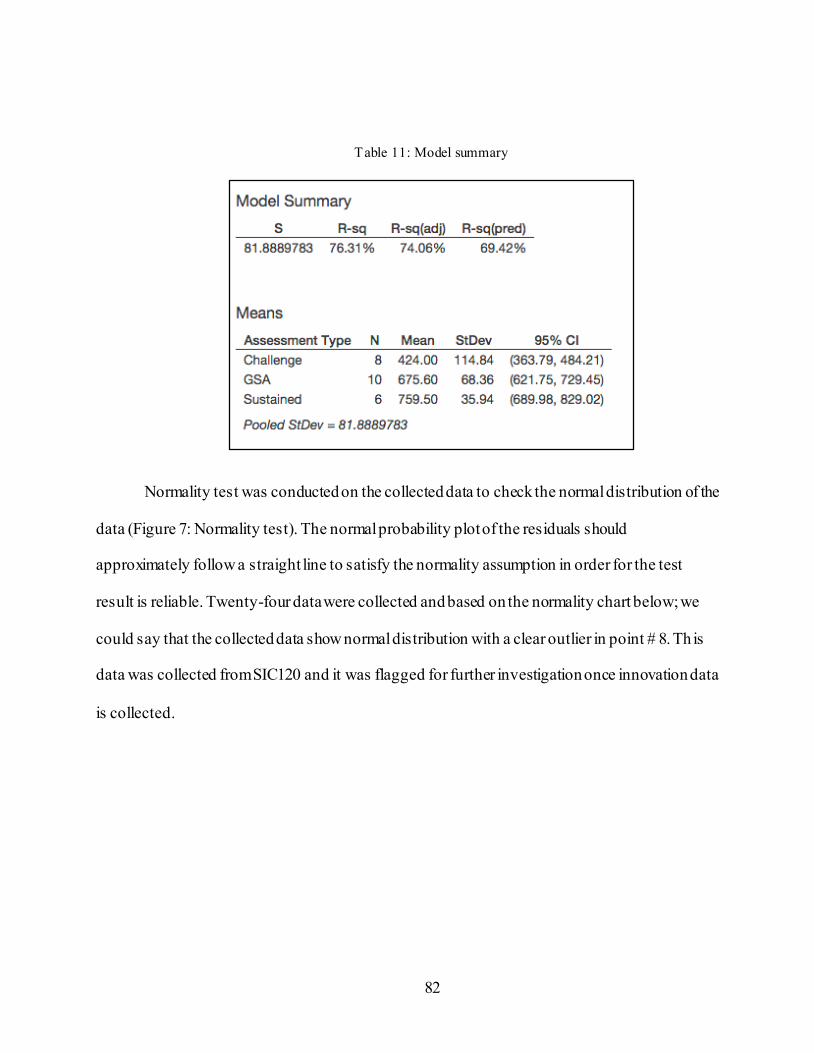
82
Table 11: Model summary
Normality test was conducted on the collected data to check the normal distribution of the
data (Figure 7: Normality test). The normal probability plot of the residuals should
approximately follow a straight line to satisfy the normality assumption in order for the test
result is reliable. Twenty-four data were collected and based on the normality chart below; we
could say that the collected data show normal distribution with a clear outlier in point # 8. This
data was collected from SIC120 and it was flagged for further investigation once innovation data
is collected.
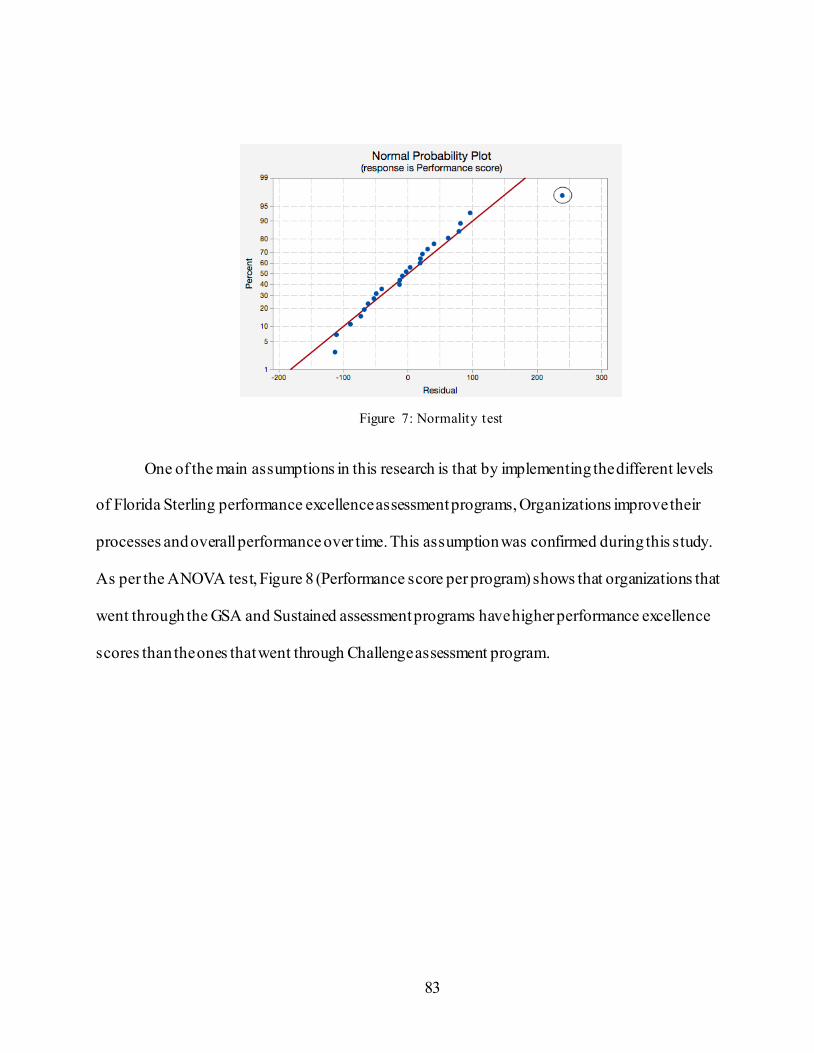
83
Figure 7: Normality test
One of the main assumptions in this research is that by implementing the different levels
of Florida Sterling performance excellence assessment programs, Organizations improve their
processes and overall performance over time. This assumption was confirmed during this study.
As per the ANOVA test, Figure 8 (Performance score per program) shows that organizations that
went through the GSA and Sustained assessment programs have higher performance excellence
scores than the ones that went through Challenge assessment program.
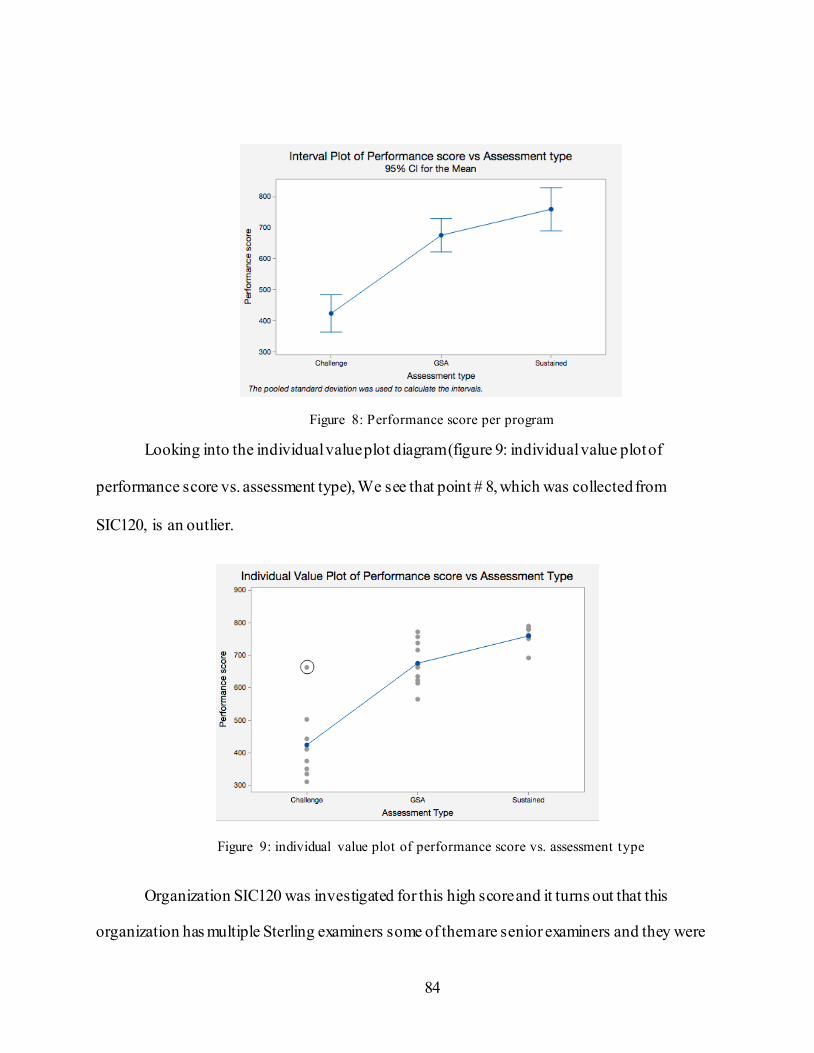
84
Figure 8: Performance score per program
Looking into the individual value plot diagram (figure 9: individual value plot of
performance score vs. assessment type), We see that point # 8, which was collected from
SIC120, is an outlier.
Figure 9: individual value plot of performance score vs. assessment type
Organization SIC120 was investigated for this high score and it turns out that this
organization has multiple Sterling examiners some of them are senior examiners and they were
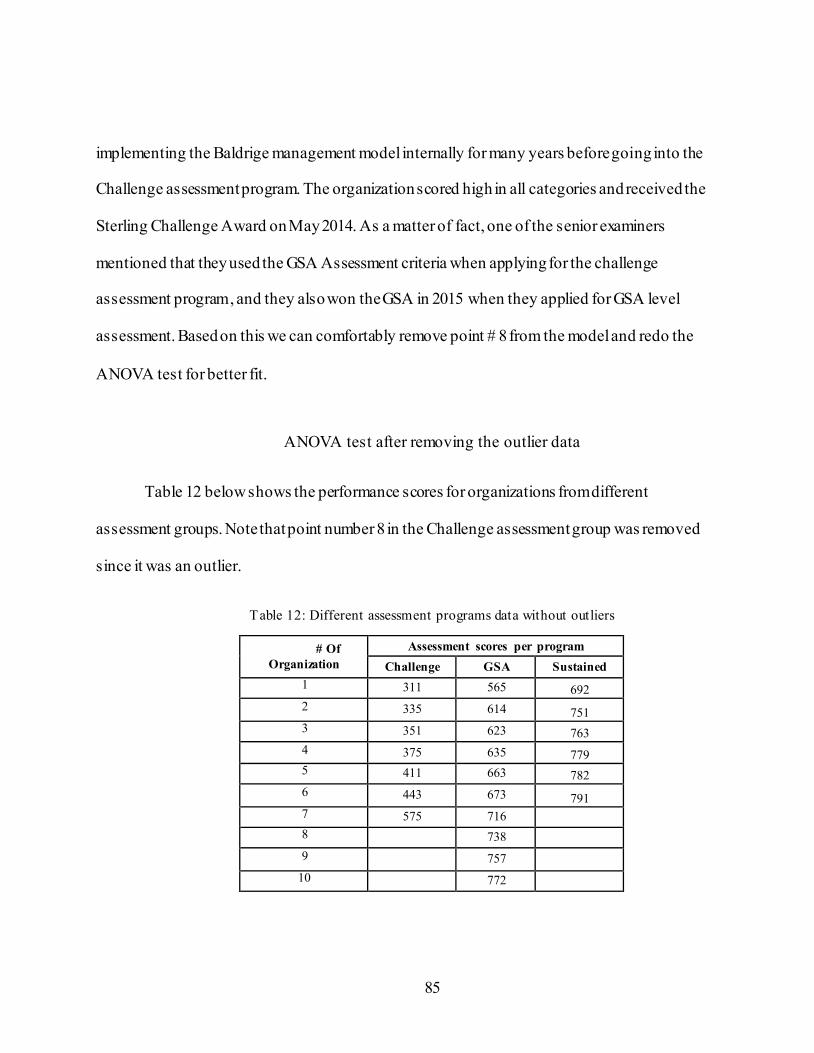
85
implementing the Baldrige management model internally for many years before going into the
Challenge assessment program. The organization scored high in all categories and received the
Sterling Challenge Award on May 2014. As a matter of fact, one of the senior examiners
mentioned that they used the GSA Assessment criteria when applying for the challenge
assessment program , and they also won the GSA in 2015 when they applied for GSA level
assessment. Based on this we can comfortably remove point # 8 from the model and redo the
ANOVA test for better fit.
ANOVA test after removing the outlier data
Table 12 below shows the performance scores for organizations from different
assessment groups. Note that point number 8 in the Challenge assessment group was removed
since it was an outlier.
Table 12: Different assessment programs data without outliers
# Of
Organization
Assessment scores per program
Challenge GSA Sustained
1 311 565 692
2 335 614 751
3 351 623 763
4 375 635 779
5 411 663 782
6 443 673 791
7 575 716
8 738
9 757
10 772
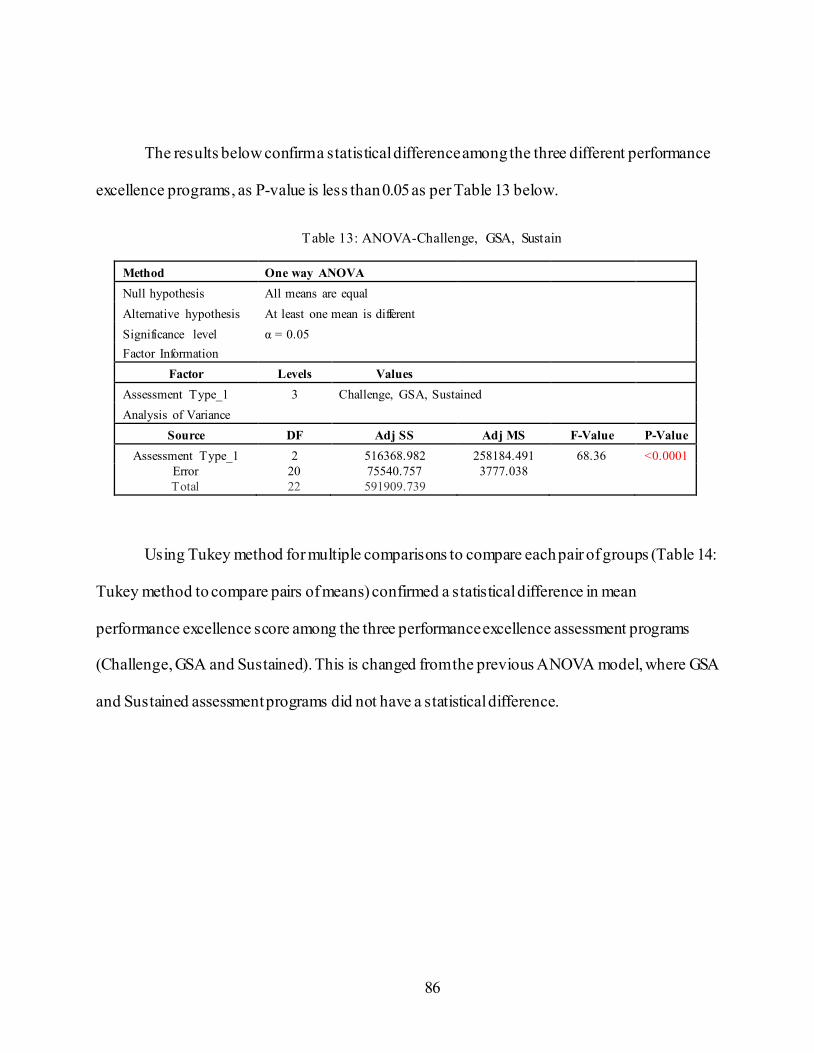
86
The results below confirm a statistical difference among the three different performance
excellence programs, as P-value is less than 0.05 as per Table 13 below.
Table 13: ANOVA-Challenge, GSA, Sustain
Method One way ANOVA
Null hypothesis All means are equal
Alternative hypothesis At least one mean is different
Significance level α = 0.05
Factor Information
Factor Levels Values
Assessment Type_1 3 Challenge, GSA, Sustained
Analysis of Variance
Source DF Adj SS Adj MS F-Value P-Value
Assessment Type_1 2 516368.982 258184.491 68.36 <0.0001
Error 20 75540.757 3777.038
Total 22 591909.739
Using Tukey method for multiple comparisons to compare each pair of groups (Table 14:
Tukey method to compare pairs of means) confirmed a statistical difference in mean
performance excellence score among the three performance excellence assessment programs
(Challenge, GSA and Sustained). This is changed from the previous ANOVA model, where GSA
and Sustained assessment programs did not have a statistical difference.
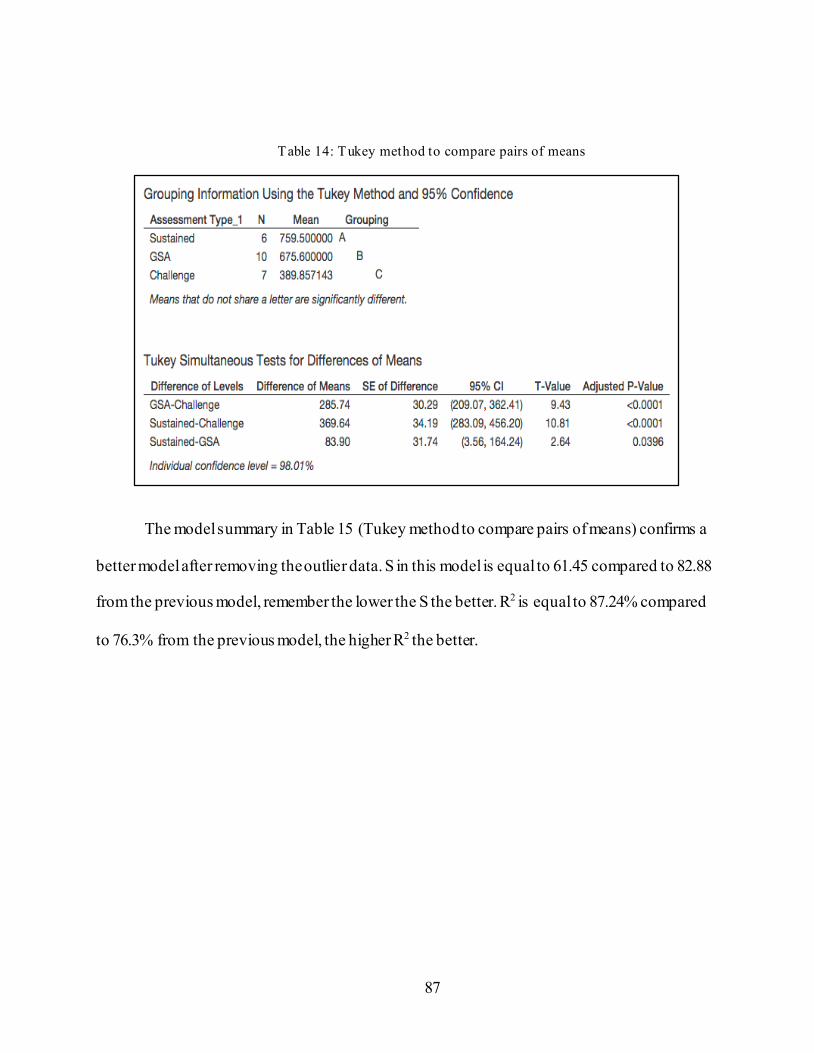
87
Table 14: Tukey method to compare pairs of means
The model summary in Table 15 (Tukey method to compare pairs of means) confirms a
better model after removing the outlier data. S in this model is equal to 61.45 compared to 82.88
from the previous model, remember the lower the S the better. R2 is equal to 87.24% compared
to 76.3% from the previous model, the higher R2 the better.
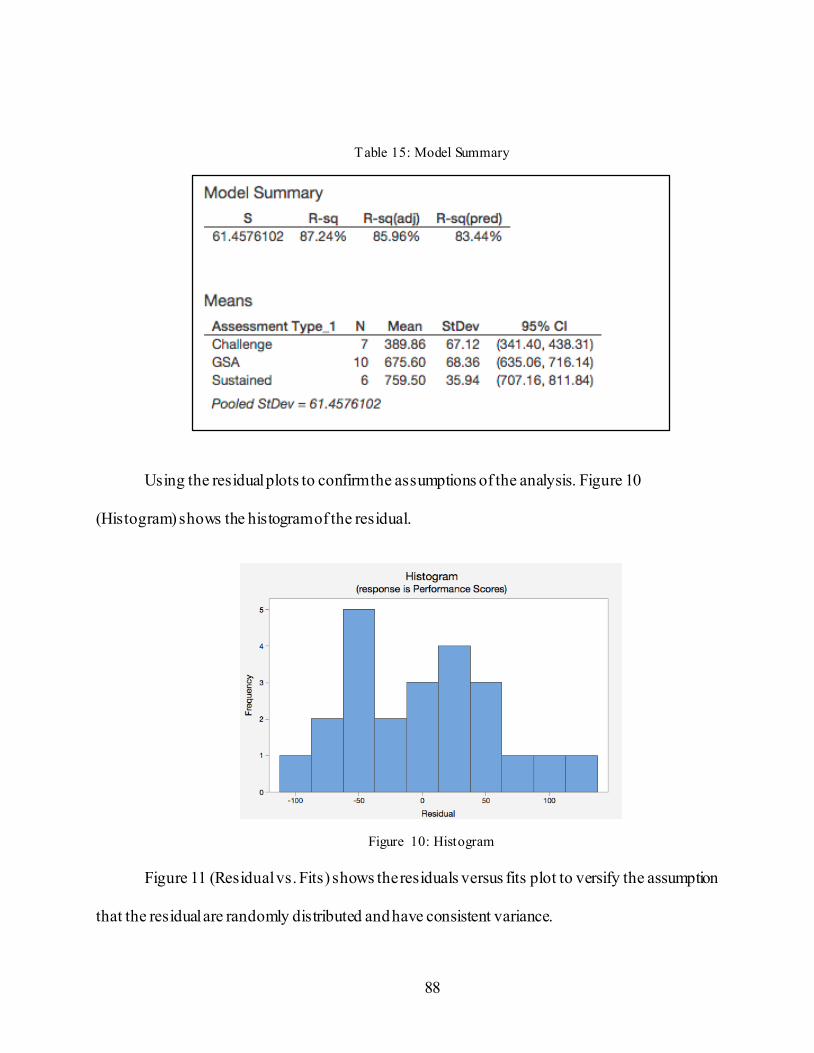
88
Table 15: Model Summary
Using the residual plots to confirm the assumptions of the analysis. Figure 10
(Histogram) shows the histogram of the residual.
Figure 10: Histogram
Figure 11 (Residual vs. Fits) shows the residuals versus fits plot to versify the assumption
that the residual are randomly distributed and have consistent variance.
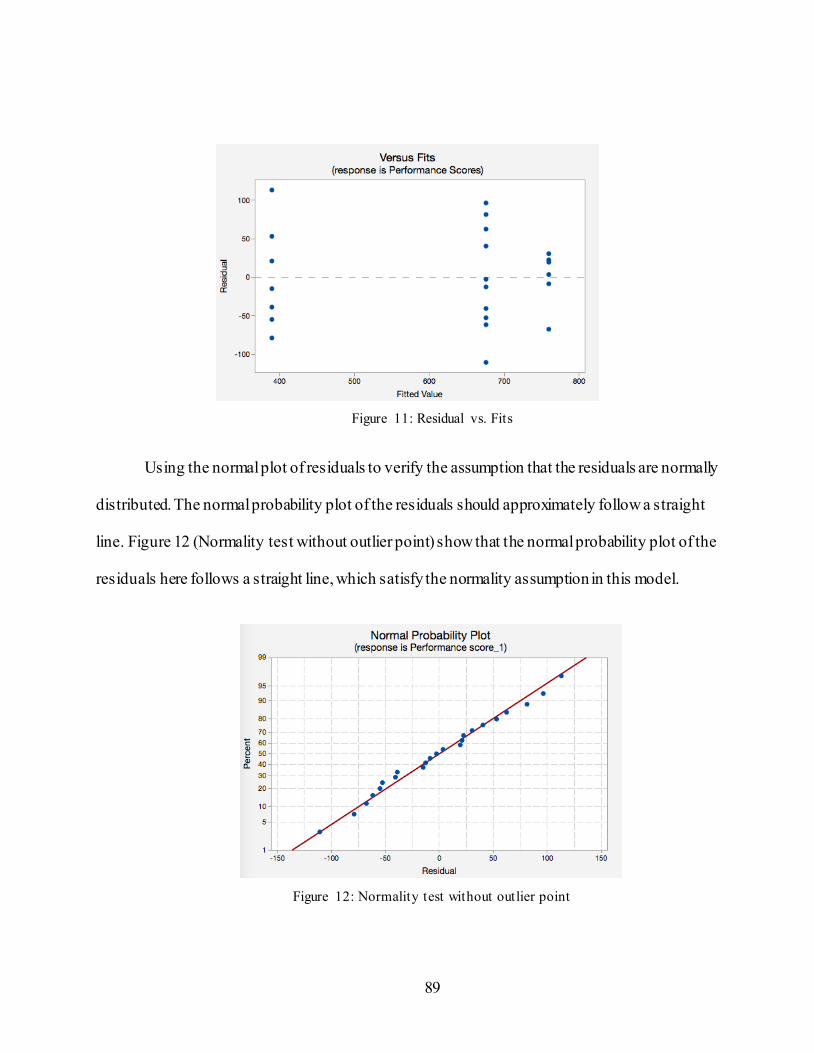
89
Figure 11: Residual vs. Fits
Using the normal plot of residuals to verify the assumption that the residuals are normally
distributed. The normal probability plot of the residuals should approximately follow a straight
line. Figure 12 (Normality test without outlier point) show that the normal probability plot of the
residuals here follows a straight line, which satisfy the normality assumption in this model.
Figure 12: Normality test without outlier point
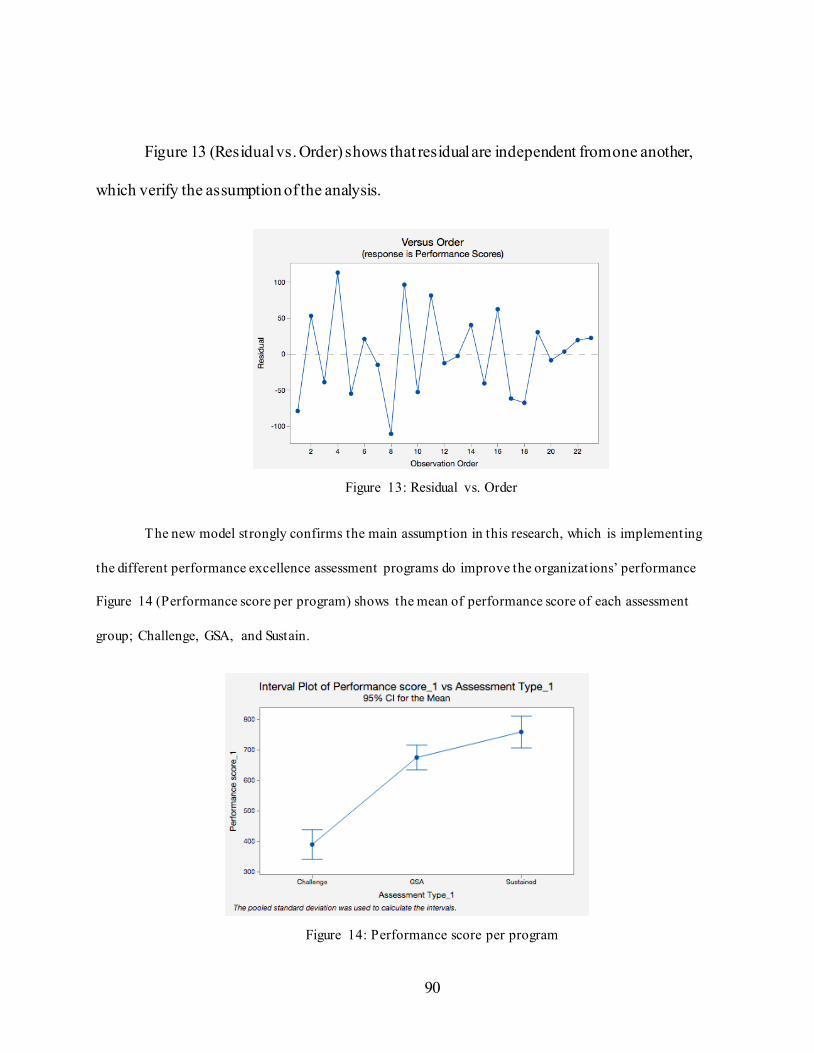
90
Figure 13 (Residual vs. Order) shows that residual are independent from one another,
which verify the assumption of the analysis.
Figure 13: Residual vs. Order
The new model strongly confirms the main assumption in this research, which is implementing
the different performance excellence assessment programs do improve the organizations’ performance
Figure 14 (Performance score per program) shows the mean of performance score of each assessment
group; Challenge, GSA, and Sustain.
Figure 14: Performance score per program
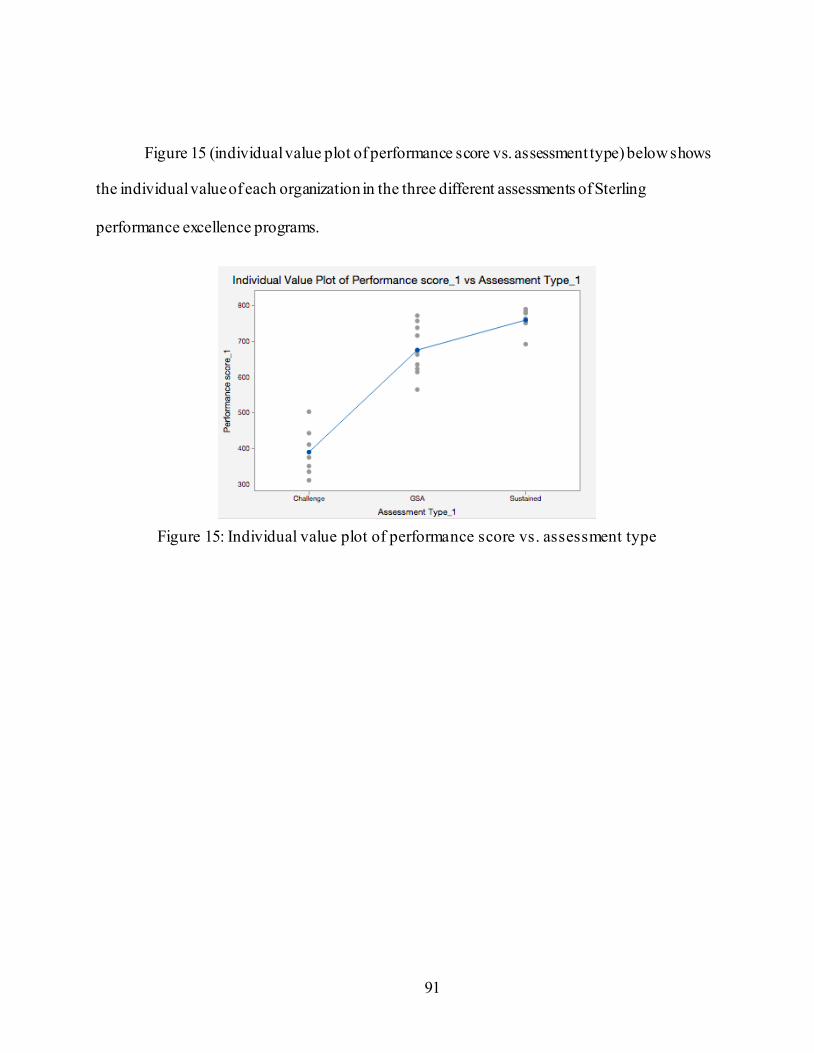
91
Figure 15 (individual value plot of performance score vs. assessment type) below shows
the individual value of each organization in the three different assessments of Sterling
performance excellence programs.
Figure 15: Individual value plot of performance score vs. assessment type
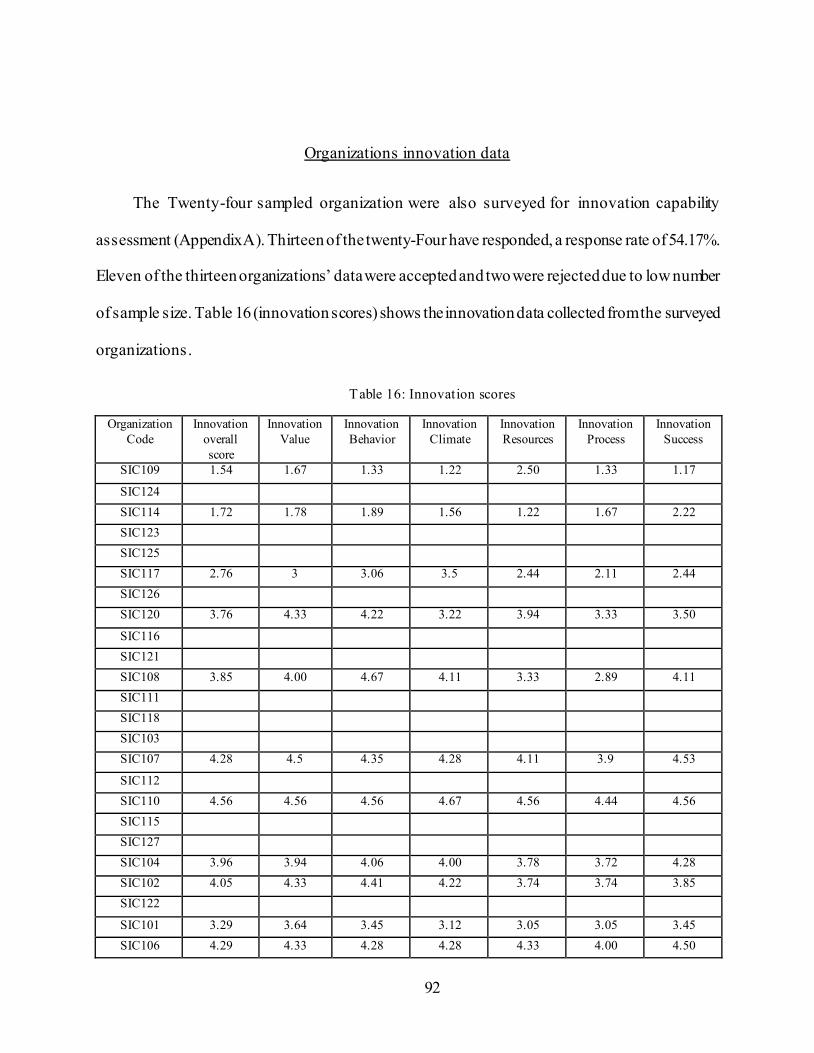
92
Organizations innovation data
The Twenty-four sampled organization were also surveyed for innovation capability
assessment (Appendix A). Thirteen of the twenty-Four have responded, a response rate of 54.17%.
Eleven of the thirteen organizations’ data were accepted and two were rejected due to low number
of sample size. Table 16 (innovation scores) shows the innovation data collected from the surveyed
organizations.
Table 16: Innovation scores
Organization
Code
Innovation
overall
score
Innovation
Value
Innovation
Behavior
Innovation
Climate
Innovation
Resources
Innovation
Process
Innovation
Success
SIC109 1.54 1.67 1.33 1.22 2.50 1.33 1.17
SIC124
SIC114 1.72 1.78 1.89 1.56 1.22 1.67 2.22
SIC123
SIC125
SIC117 2.76 3 3.06 3.5 2.44 2.11 2.44
SIC126
SIC120 3.76 4.33 4.22 3.22 3.94 3.33 3.50
SIC116
SIC121
SIC108 3.85 4.00 4.67 4.11 3.33 2.89 4.11
SIC111
SIC118
SIC103
SIC107 4.28 4.5 4.35 4.28 4.11 3.9 4.53
SIC112
SIC110 4.56 4.56 4.56 4.67 4.56 4.44 4.56
SIC115
SIC127
SIC104 3.96 3.94 4.06 4.00 3.78 3.72 4.28
SIC102 4.05 4.33 4.41 4.22 3.74 3.74 3.85
SIC122
SIC101 3.29 3.64 3.45 3.12 3.05 3.05 3.45
SIC106 4.29 4.33 4.28 4.28 4.33 4.00 4.50
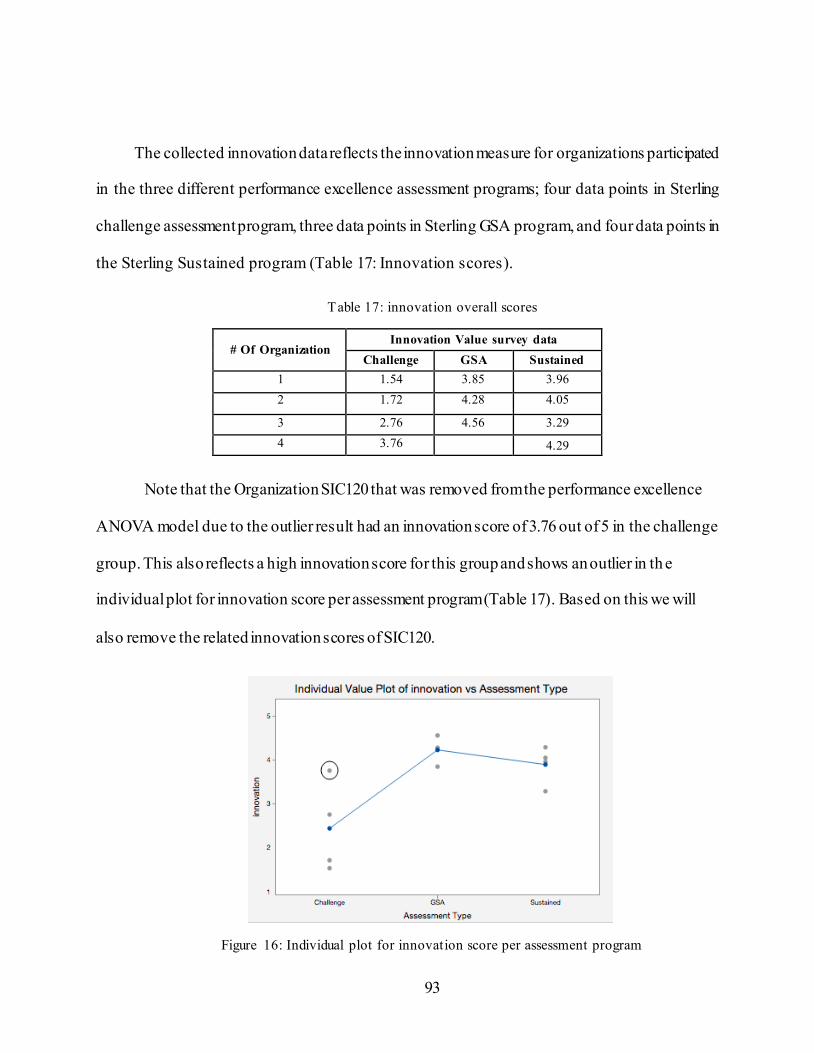
93
The collected innovation data reflects the innovation measure for organizations participated
in the three different performance excellence assessment programs; four data points in Sterling
challenge assessment program, three data points in Sterling GSA program, and four data points in
the Sterling Sustained program (Table 17: Innovation scores).
Table 17: innovation overall scores
# Of Organization Innovation Value survey data
Challenge GSA Sustained
1 1.54 3.85 3.96
2 1.72 4.28 4.05
3 2.76 4.56 3.29
4 3.76 4.29
Note that the Organization SIC120 that was removed from the performance excellence
ANOVA model due to the outlier result had an innovation score of 3.76 out of 5 in the challenge
group. This also reflects a high innovation score for this group and shows an outlier in th e
individual plot for innovation score per assessment program (Table 17). Based on this we will
also remove the related innovation scores of SIC120.
Figure 16: Individual plot for innovation score per assessment program
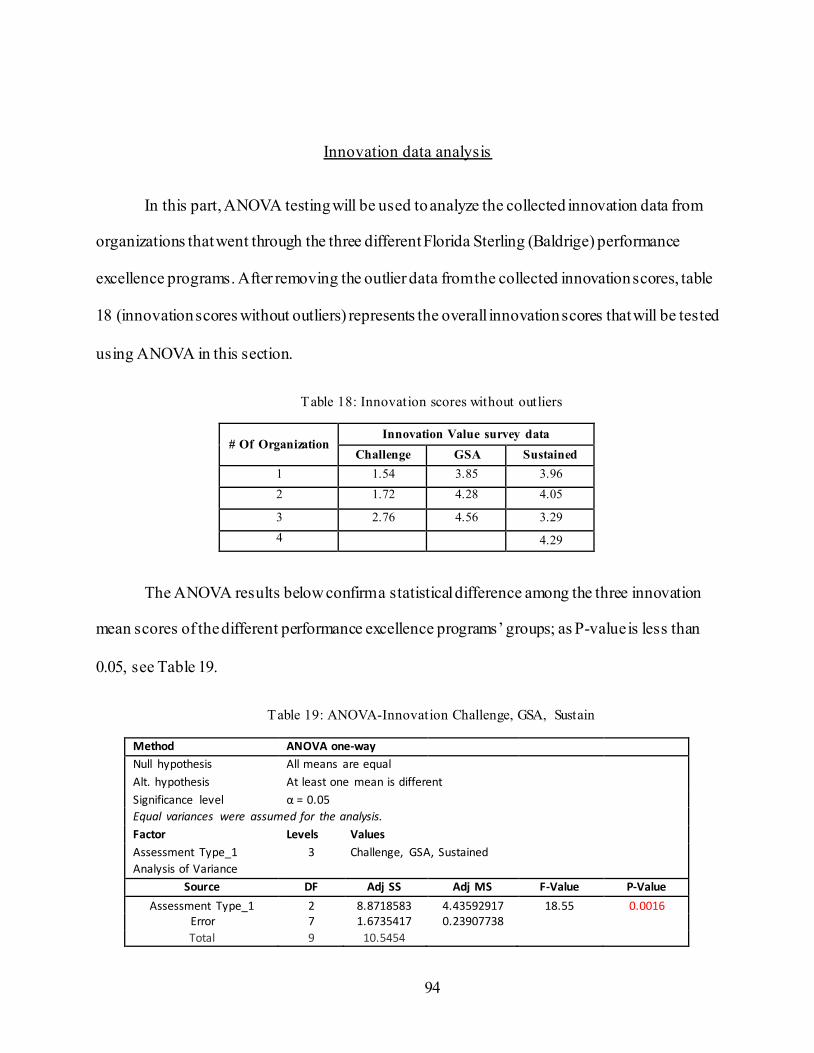
94
Innovation data analysis
In this part, ANOVA testing will be used to analyze the collected innovation data from
organizations that went through the three different Florida Sterling (Baldrige) performance
excellence programs. After removing the outlier data from the collected innovation scores, table
18 (innovation scores without outliers) represents the overall innovation scores that will be tested
using ANOVA in this section.
Table 18: Innovation scores without outliers
# Of Organization Innovation Value survey data
Challenge GSA Sustained
1 1.54 3.85 3.96
2 1.72 4.28 4.05
3 2.76 4.56 3.29
4 4.29
The ANOVA results below confirm a statistical difference among the three innovation
mean scores of the different performance excellence programs’ groups; as P-value is less than
0.05, see Table 19.
Table 19: ANOVA-Innovation Challenge, GSA, Sustain
Method ANOVA one-way
Null hypothesis All means are equal
Alt. hypothesis At least one mean is different
Significance level α = 0.05
Equal variances were assumed for the analysis.
Factor Levels Values
Assessment Type_1 3 Challenge, GSA, Sustained
Analysis of Variance
Source DF Adj SS Adj MS F-Value P-Value
Assessment Type_1 2 8.8718583 4.43592917 18.55 0.0016 Error 7 1.6735417 0.23907738
Total 9 10.5454
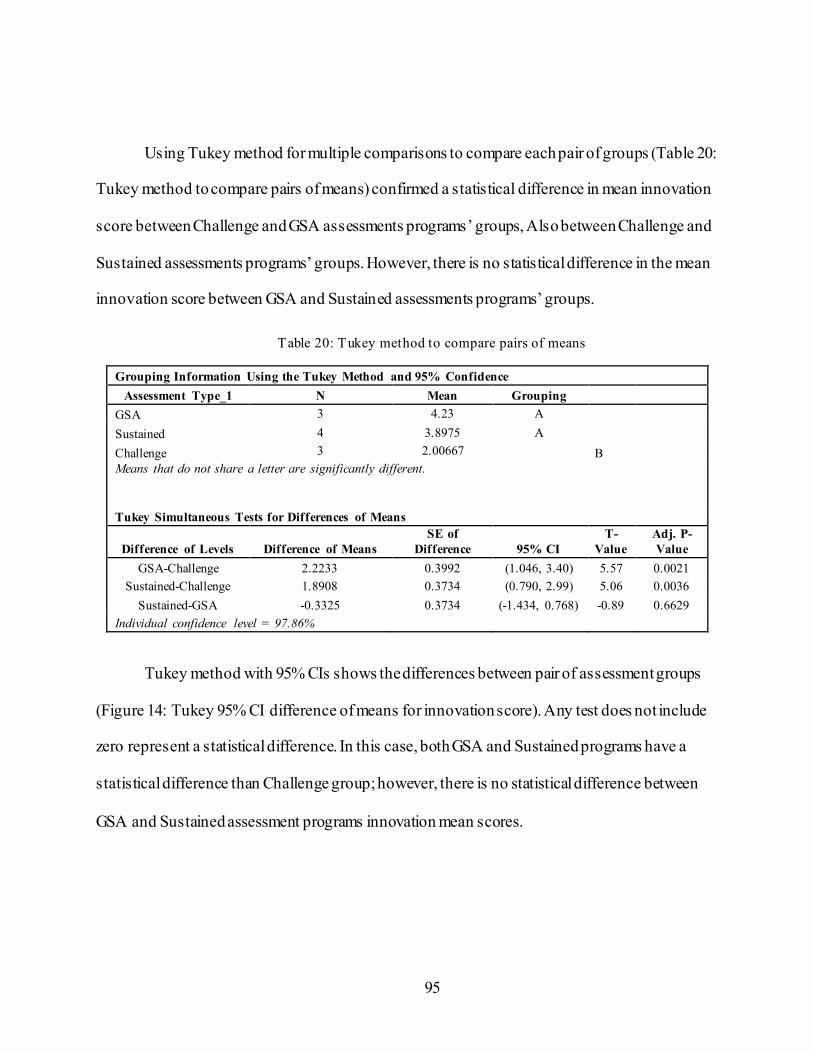
95
Using Tukey method for multiple comparisons to compare each pair of groups (Table 20:
Tukey method to compare pairs of means) confirmed a statistical difference in mean innovation
score between Challenge and GSA assessments programs’ groups, Also between Challenge and
Sustained assessments programs’ groups. However, there is no statistical difference in the mean
innovation score between GSA and Sustained assessments programs’ groups.
Table 20: Tukey method to compare pairs of means
Grouping Information Using the Tukey Method and 95% Confidence
Assessment Type_1 N Mean Grouping
GSA 3 4.23 A
Sustained 4 3.8975 A
Challenge 3 2.00667 B
Means that do not share a letter are significantly different.
Tukey Simultaneous Tests for Differences of Means
Difference of Levels Difference of Means
SE of
Difference 95% CI
T-
Value
Adj. P-
Value
GSA-Challenge 2.2233 0.3992 (1.046, 3.40) 5.57 0.0021
Sustained-Challenge 1.8908 0.3734 (0.790, 2.99) 5.06 0.0036
Sustained-GSA -0.3325 0.3734 (-1.434, 0.768) -0.89 0.6629
Individual confidence level = 97.86%
Tukey method with 95% CIs shows the differences between pair of assessment groups
(Figure 14: Tukey 95% CI difference of means for innovation score). Any test does not include
zero represent a statistical difference. In this case, both GSA and Sustained programs have a
statistical difference than Challenge group; however, there is no statistical difference between
GSA and Sustained assessment programs innovation mean scores.
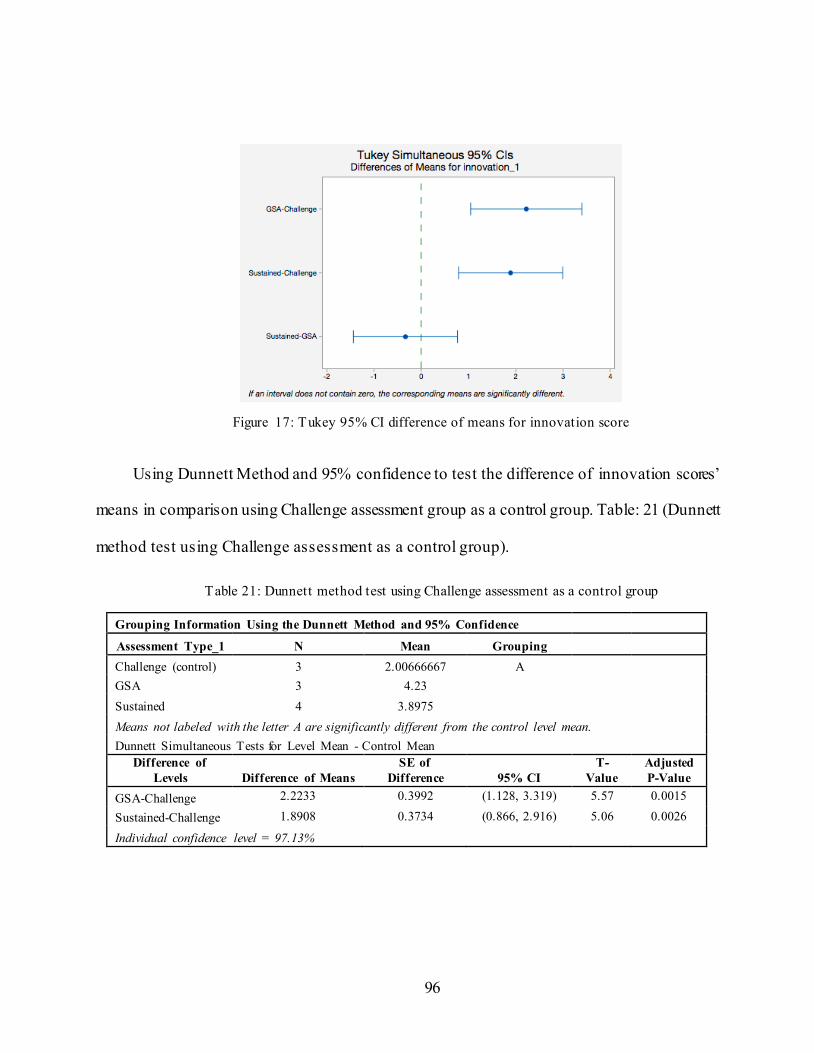
96
Figure 17: Tukey 95% CI difference of means for innovation score
Using Dunnett Method and 95% confidence to test the difference of innovation scores’
means in comparison using Challenge assessment group as a control group. Table: 21 (Dunnett
method test using Challenge assessment as a control group).
Table 21: Dunnett method test using Challenge assessment as a control group
Grouping Information Using the Dunnett Method and 95% Confidence
Assessment Type_1 N Mean Grouping
Challenge (control) 3 2.00666667 A
GSA 3 4.23
Sustained 4 3.8975
Means not labeled with the letter A are significantly different from the control level mean.
Dunnett Simultaneous Tests for Level Mean - Control Mean
Difference of
Levels Difference of Means
SE of
Difference 95% CI
T-
Value
Adjusted
P-Value
GSA-Challenge 2.2233 0.3992 (1.128, 3.319) 5.57 0.0015
Sustained-Challenge 1.8908 0.3734 (0.866, 2.916) 5.06 0.0026
Individual confidence level = 97.13%
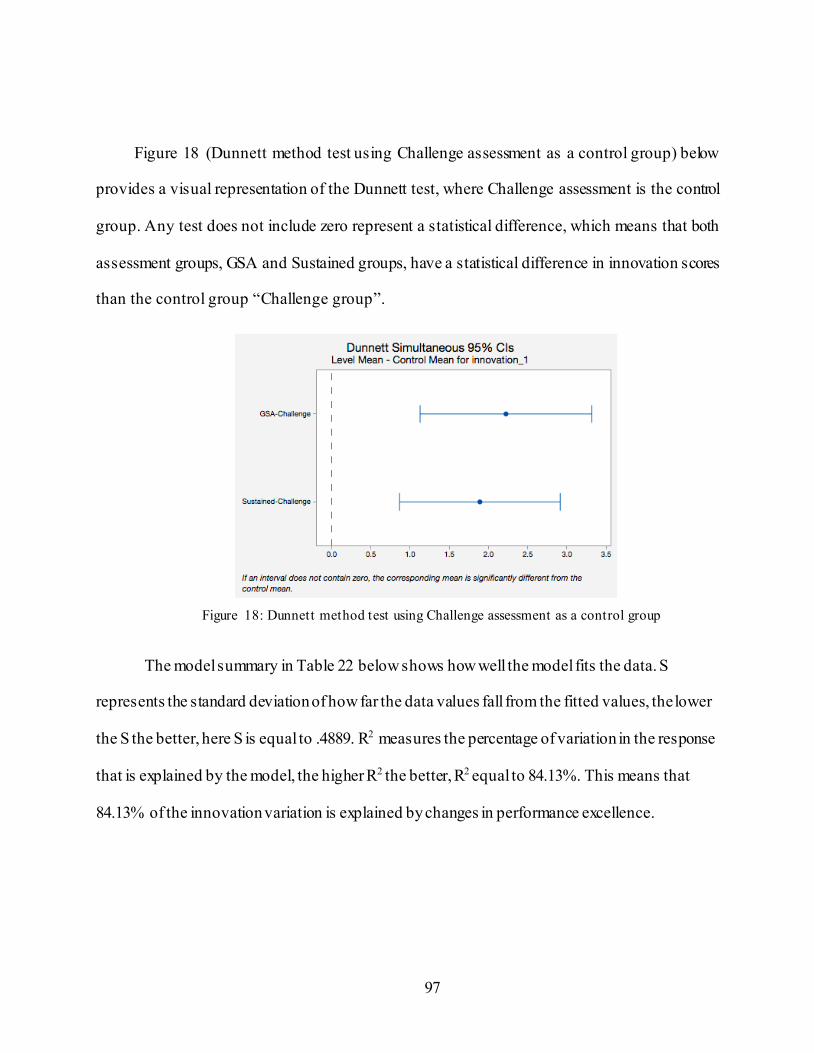
97
Figure 18 (Dunnett method test using Challenge assessment as a control group) below
provides a visual representation of the Dunnett test, where Challenge assessment is the control
group. Any test does not include zero represent a statistical difference, which means that both
assessment groups, GSA and Sustained groups, have a statistical difference in innovation scores
than the control group “Challenge group”.
Figure 18: Dunnett method test using Challenge assessment as a control group
The model summary in Table 22 below shows how well the model fits the data. S
represents the standard deviation of how far the data values fall from the fitted values, the lower
the S the better, here S is equal to .4889. R2 measures the percentage of variation in the response
that is explained by the model, the higher R2 the better, R2 equal to 84.13%. This means that
84.13% of the innovation variation is explained by changes in performance excellence.
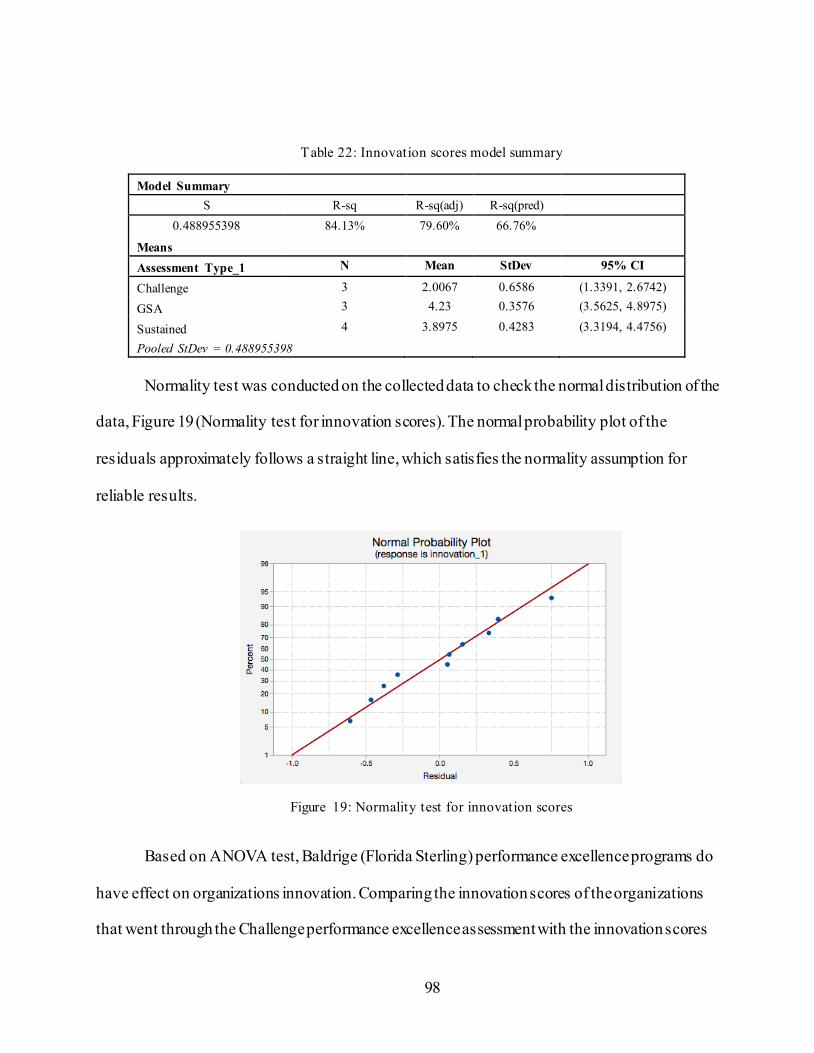
98
Table 22: Innovation scores model summary
Model Summary
S R-sq R-sq(adj) R-sq(pred)
0.488955398 84.13% 79.60% 66.76%
Means
Assessment Type_1 N Mean StDev 95% CI
Challenge 3 2.0067 0.6586 (1.3391, 2.6742)
GSA 3 4.23 0.3576 (3.5625, 4.8975)
Sustained 4 3.8975 0.4283 (3.3194, 4.4756)
Pooled StDev = 0.488955398
Normality test was conducted on the collected data to check the normal distribution of the
data, Figure 19 (Normality test for innovation scores). The normal probability plot of the
residuals approximately follows a straight line, which satisfies the normality assumption for
reliable results.
Figure 19: Normality test for innovation scores
Based on ANOVA test, Baldrige (Florida Sterling) performance excellence programs do
have effect on organizations innovation. Comparing the innovation scores of the organizations
that went through the Challenge performance excellence assessment with the innovation scores
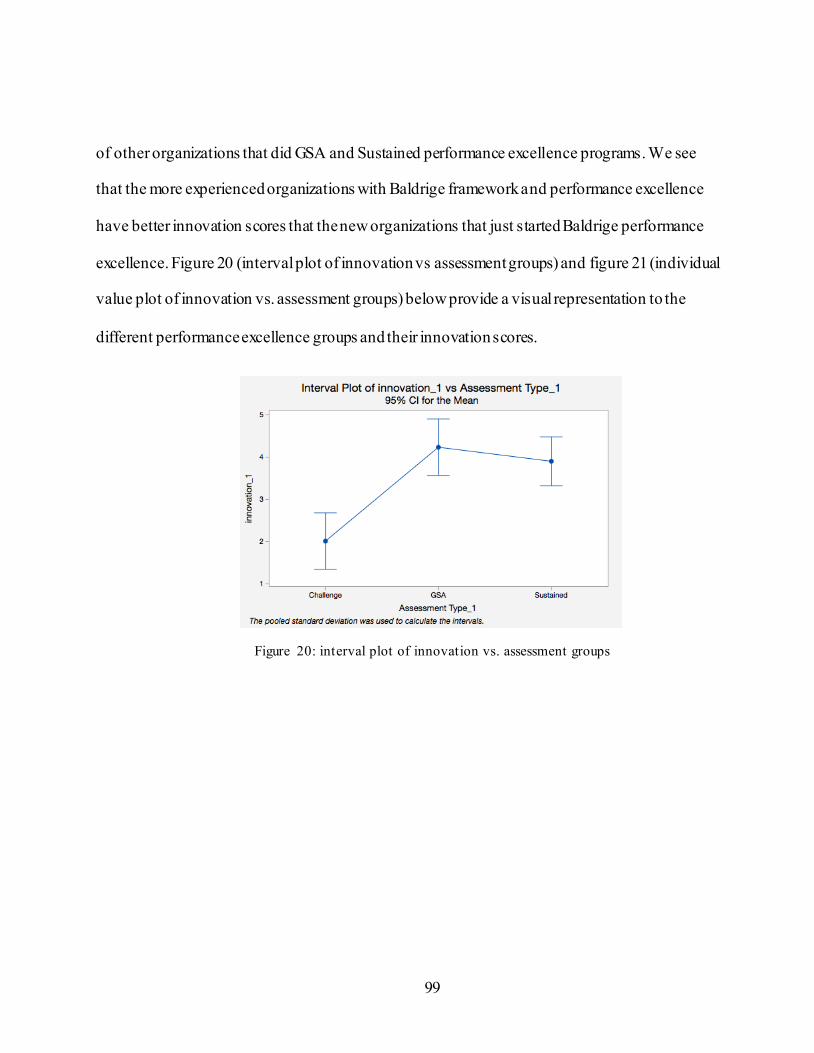
99
of other organizations that did GSA and Sustained performance excellence programs. We see
that the more experienced organizations with Baldrige framework and performance excellence
have better innovation scores that the new organizations that just started Baldrige performance
excellence. Figure 20 (interval plot of innovation vs assessment groups) and figure 21 (individual
value plot of innovation vs. assessment groups) below provide a visual representation to the
different performance excellence groups and their innovation scores.
Figure 20: interval plot of innovation vs. assessment groups
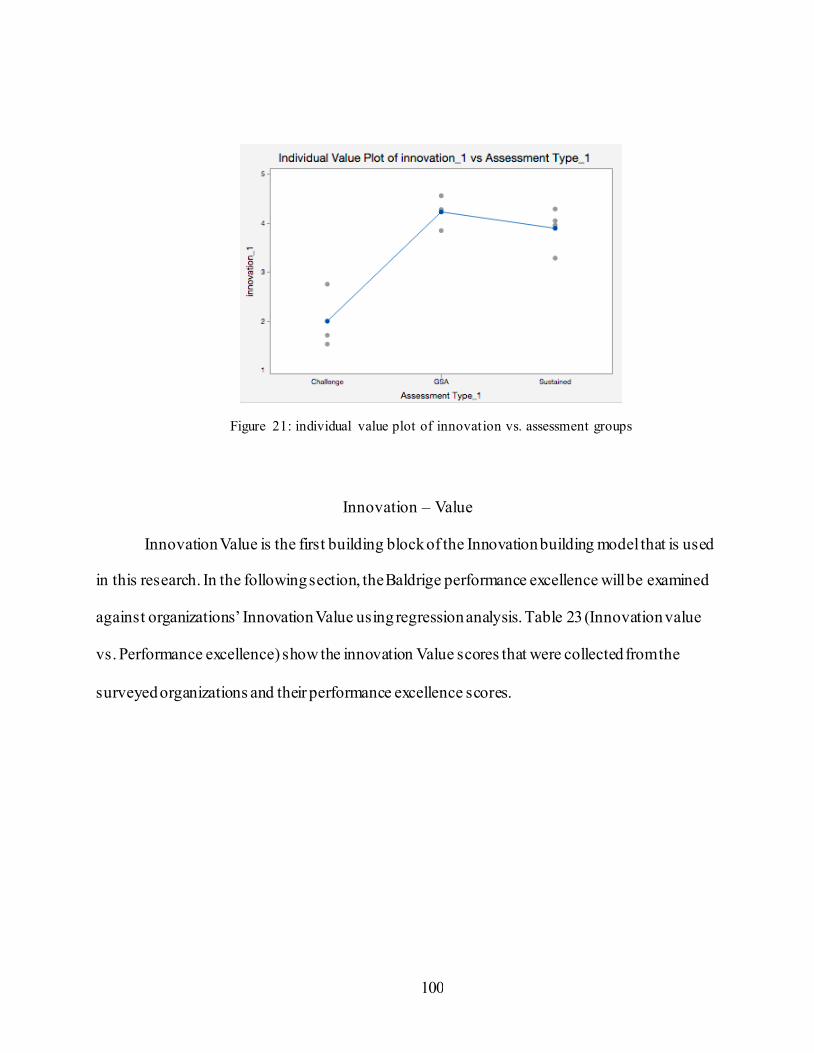
100
Figure 21: individual value plot of innovation vs. assessment groups
Innovation – Value
Innovation Value is the first building block of the Innovation building model that is used
in this research. In the following section, the Baldrige performance excellence will be examined
against organizations’ Innovation Value using regression analysis. Table 23 (Innovation value
vs. Performance excellence) show the innovation Value scores that were collected from the
surveyed organizations and their performance excellence scores.
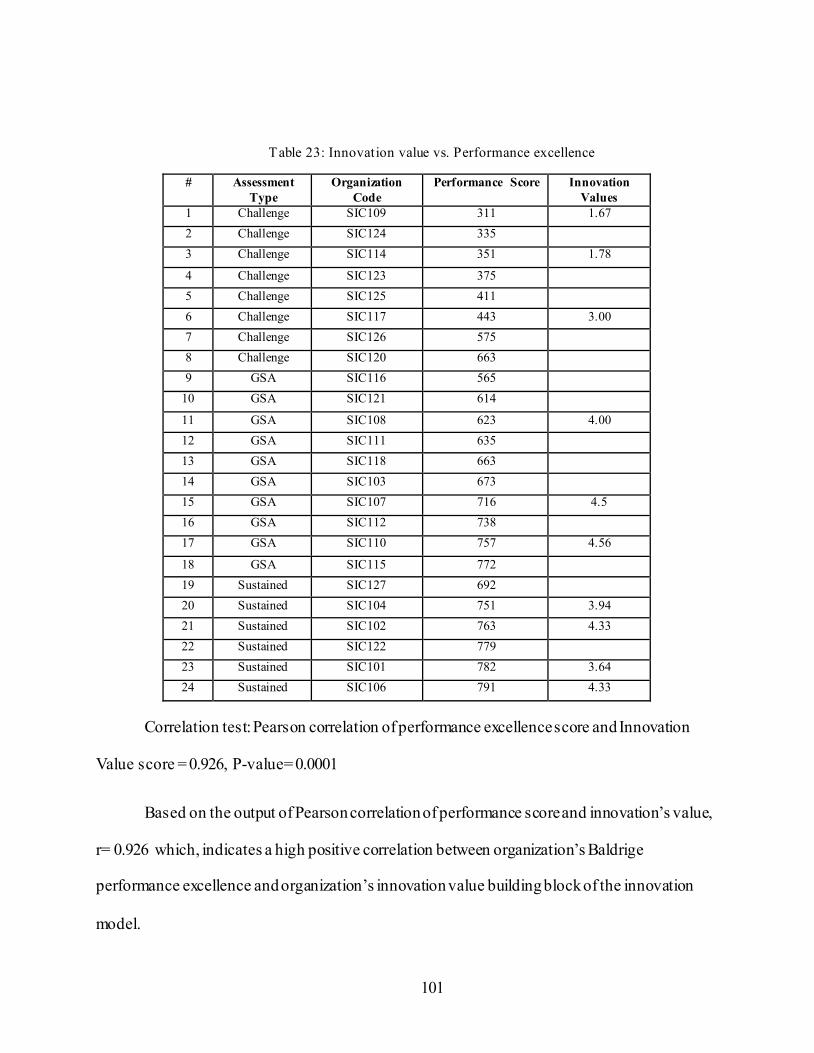
101
Table 23: Innovation value vs. Performance excellence
# Assessment
Type
Organization
Code
Performance Score Innovation
Values
1 Challenge SIC109 311 1.67
2 Challenge SIC124 335
3 Challenge SIC114 351 1.78
4 Challenge SIC123 375
5 Challenge SIC125 411
6 Challenge SIC117 443 3.00
7 Challenge SIC126 575
8 Challenge SIC120 663
9 GSA SIC116 565
10 GSA SIC121 614
11 GSA SIC108 623 4.00
12 GSA SIC111 635
13 GSA SIC118 663
14 GSA SIC103 673
15 GSA SIC107 716 4.5
16 GSA SIC112 738
17 GSA SIC110 757 4.56
18 GSA SIC115 772
19 Sustained SIC127 692
20 Sustained SIC104 751 3.94
21 Sustained SIC102 763 4.33
22 Sustained SIC122 779
23 Sustained SIC101 782 3.64
24 Sustained SIC106 791 4.33
Correlation test: Pearson correlation of performance excellence score and Innovation
Value score = 0.926, P-value= 0.0001
Based on the output of Pearson correlation of performance score and innovation’s value,
r= 0.926 which, indicates a high positive correlation between organization’s Baldrige
performance excellence and organization’s innovation value building block of the innovation
model.
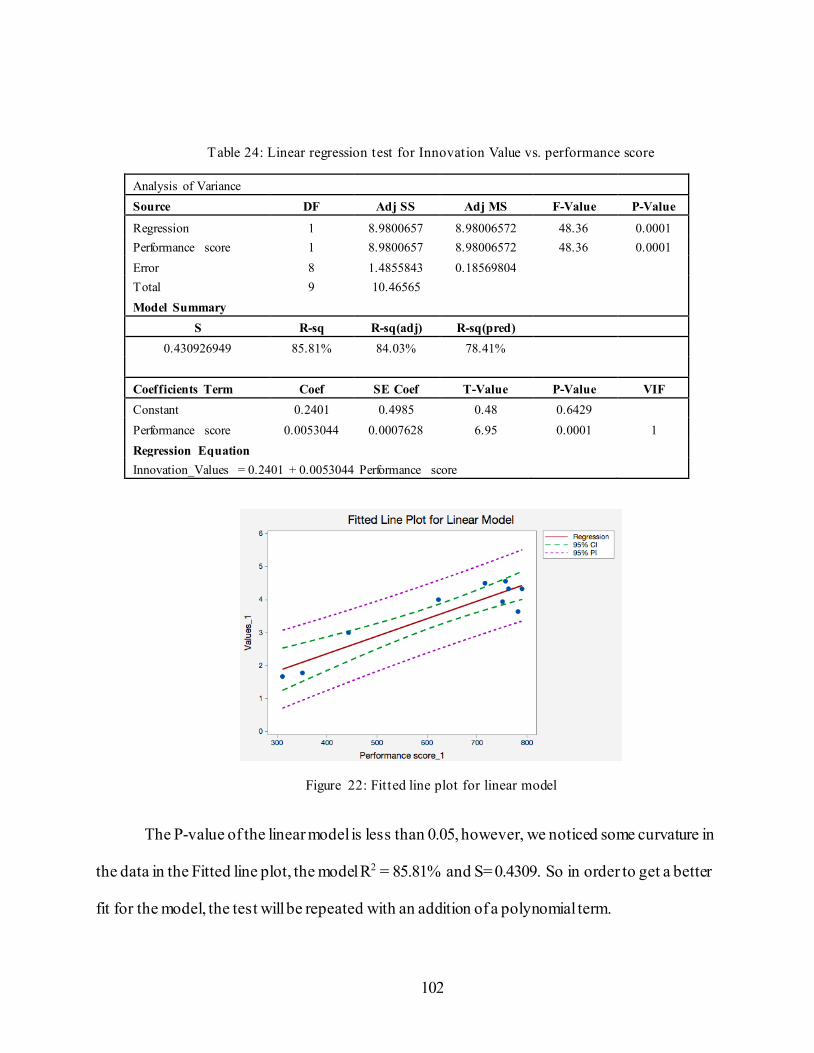
102
Table 24: Linear regression test for Innovation Value vs. performance score
Analysis of Variance
Source DF Adj SS Adj MS F-Value P-Value
Regression 1 8.9800657 8.98006572 48.36 0.0001
Performance score 1 8.9800657 8.98006572 48.36 0.0001
Error 8 1.4855843 0.18569804
Total 9 10.46565
Model Summary
S R-sq R-sq(adj) R-sq(pred)
0.430926949 85.81% 84.03% 78.41%
Coefficients Term Coef SE Coef T-Value P-Value VIF
Constant 0.2401 0.4985 0.48 0.6429
Performance score 0.0053044 0.0007628 6.95 0.0001 1
Regression Equation
Innovation_Values = 0.2401 + 0.0053044 Performance score
Figure 22: Fitted line plot for linear model
The P-value of the linear model is less than 0.05, however, we noticed some curvature in
the data in the Fitted line plot, the model R2 = 85.81% and S= 0.4309. So in order to get a better
fit for the model, the test will be repeated with an addition of a polynomial term.
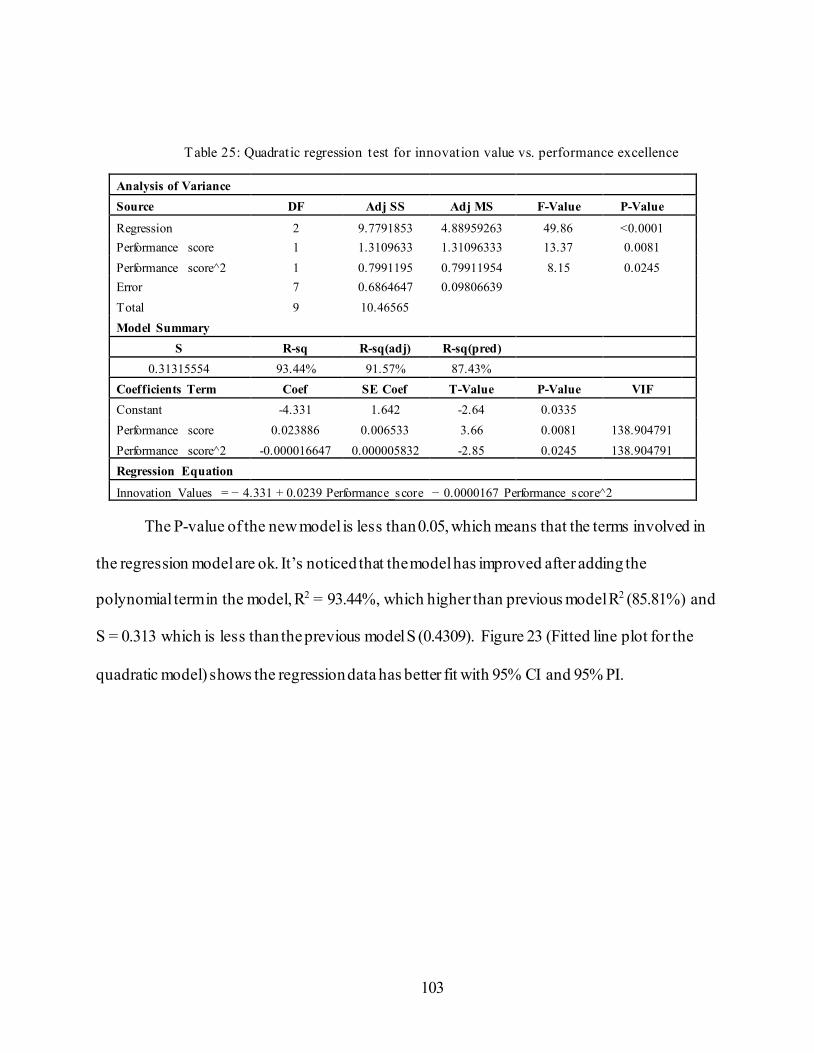
103
Table 25: Quadratic regression test for innovation value vs. performance excellence
Analysis of Variance
Source DF Adj SS Adj MS F-Value P-Value
Regression 2 9.7791853 4.88959263 49.86 <0.0001
Performance score 1 1.3109633 1.31096333 13.37 0.0081
Performance score^2 1 0.7991195 0.79911954 8.15 0.0245
Error 7 0.6864647 0.09806639
Total 9 10.46565
Model Summary
S R-sq R-sq(adj) R-sq(pred)
0.31315554 93.44% 91.57% 87.43%
Coefficients Term Coef SE Coef T-Value P-Value VIF
Constant -4.331 1.642 -2.64 0.0335
Performance score 0.023886 0.006533 3.66 0.0081 138.904791
Performance score^2 -0.000016647 0.000005832 -2.85 0.0245 138.904791
Regression Equation
Innovation_Values = − 4.331 + 0.0239 Performance_score − 0.0000167 Performance_score^2
The P-value of the new model is less than 0.05, which means that the terms involved in
the regression model are ok. It’s noticed that the model has improved after adding the
polynomial term in the model, R2 = 93.44%, which higher than previous model R2 (85.81%) and
S = 0.313 which is less than the previous model S (0.4309). Figure 23 (Fitted line plot for the
quadratic model) shows the regression data has better fit with 95% CI and 95% PI.
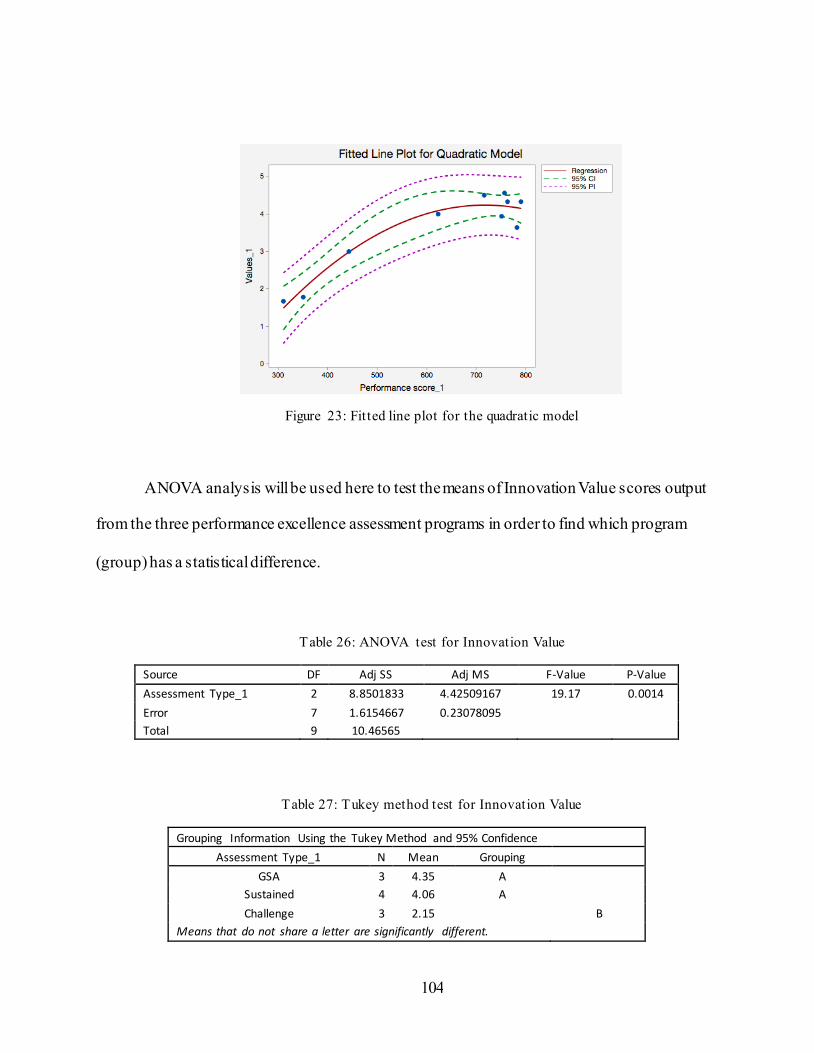
104
Figure 23: Fitted line plot for the quadratic model
ANOVA analysis will be used here to test the means of Innovation Value scores output
from the three performance excellence assessment programs in order to find which program
(group) has a statistical difference.
Table 26: ANOVA test for Innovation Value
Source DF Adj SS Adj MS F-Value P-Value
Assessment Type_1 2 8.8501833 4.42509167 19.17 0.0014
Error 7 1.6154667 0.23078095
Total 9 10.46565
Table 27: Tukey method test for Innovation Value
Grouping Information Using the Tukey Method and 95% Confidence
Assessment Type_1 N Mean Grouping
GSA 3 4.35 A
Sustained 4 4.06 A
Challenge 3 2.15 B
Means that do not share a letter are significantly different.
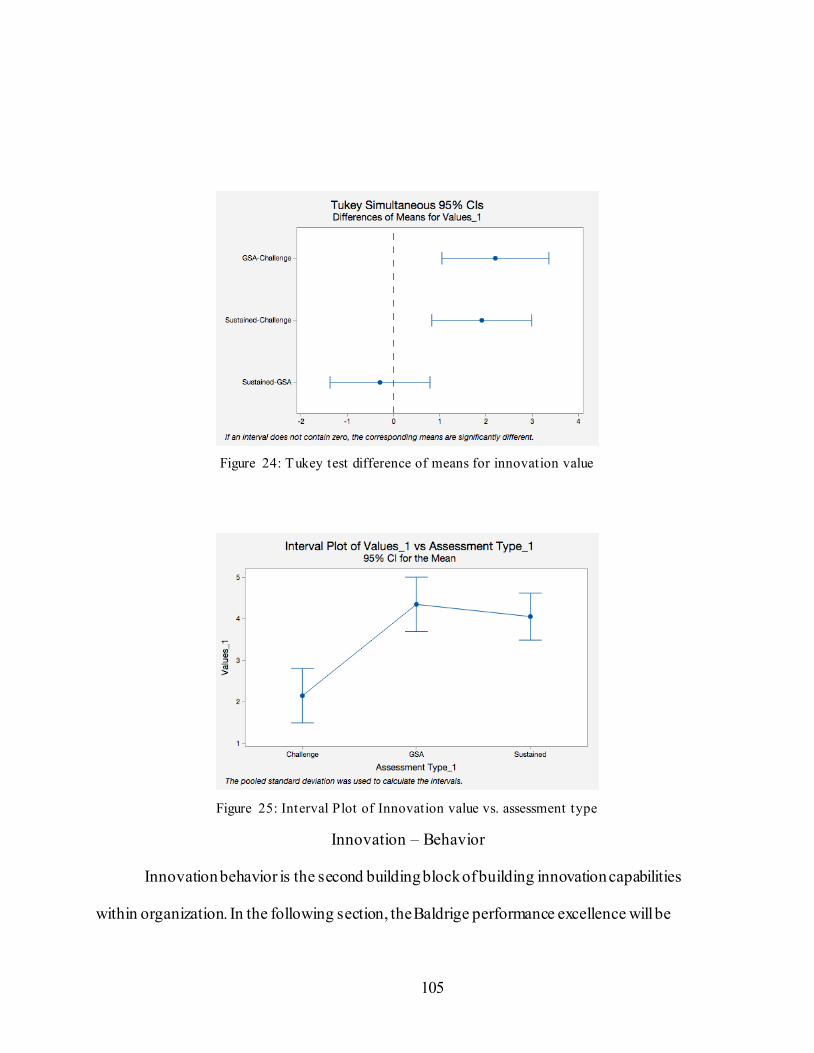
105
Figure 24: Tukey test difference of means for innovation value
Figure 25: Interval Plot of Innovation value vs. assessment type
Innovation – Behavior
Innovation behavior is the second building block of building innovation capabilities
within organization. In the following section, the Baldrige performance excellence will be
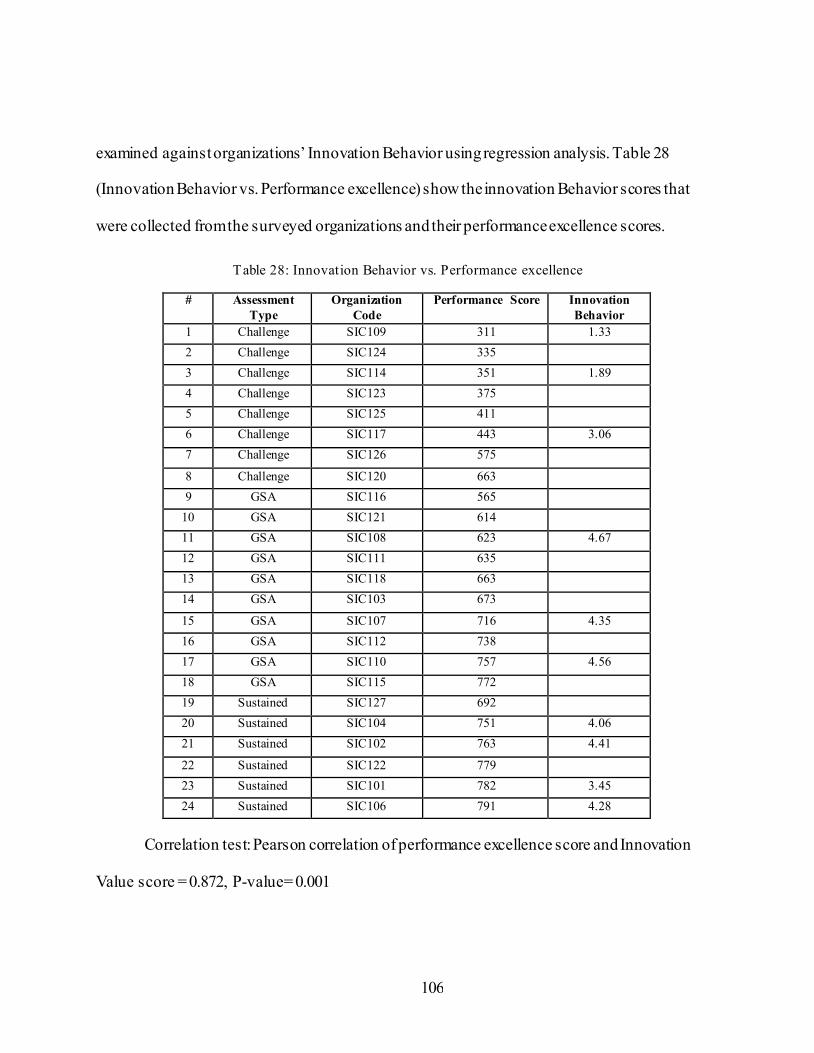
106
examined against organizations’ Innovation Behavior using regression analysis. Table 28
(Innovation Behavior vs. Performance excellence) show the innovation Behavior scores that
were collected from the surveyed organizations and their performance excellence scores.
Table 28: Innovation Behavior vs. Performance excellence
# Assessment
Type
Organization
Code
Performance Score Innovation
Behavior
1 Challenge SIC109 311 1.33
2 Challenge SIC124 335
3 Challenge SIC114 351 1.89
4 Challenge SIC123 375
5 Challenge SIC125 411
6 Challenge SIC117 443 3.06
7 Challenge SIC126 575
8 Challenge SIC120 663
9 GSA SIC116 565
10 GSA SIC121 614
11 GSA SIC108 623 4.67
12 GSA SIC111 635
13 GSA SIC118 663
14 GSA SIC103 673
15 GSA SIC107 716 4.35
16 GSA SIC112 738
17 GSA SIC110 757 4.56
18 GSA SIC115 772
19 Sustained SIC127 692
20 Sustained SIC104 751 4.06
21 Sustained SIC102 763 4.41
22 Sustained SIC122 779
23 Sustained SIC101 782 3.45
24 Sustained SIC106 791 4.28
Correlation test: Pearson correlation of performance excellence score and Innovation
Value score = 0.872, P-value= 0.001
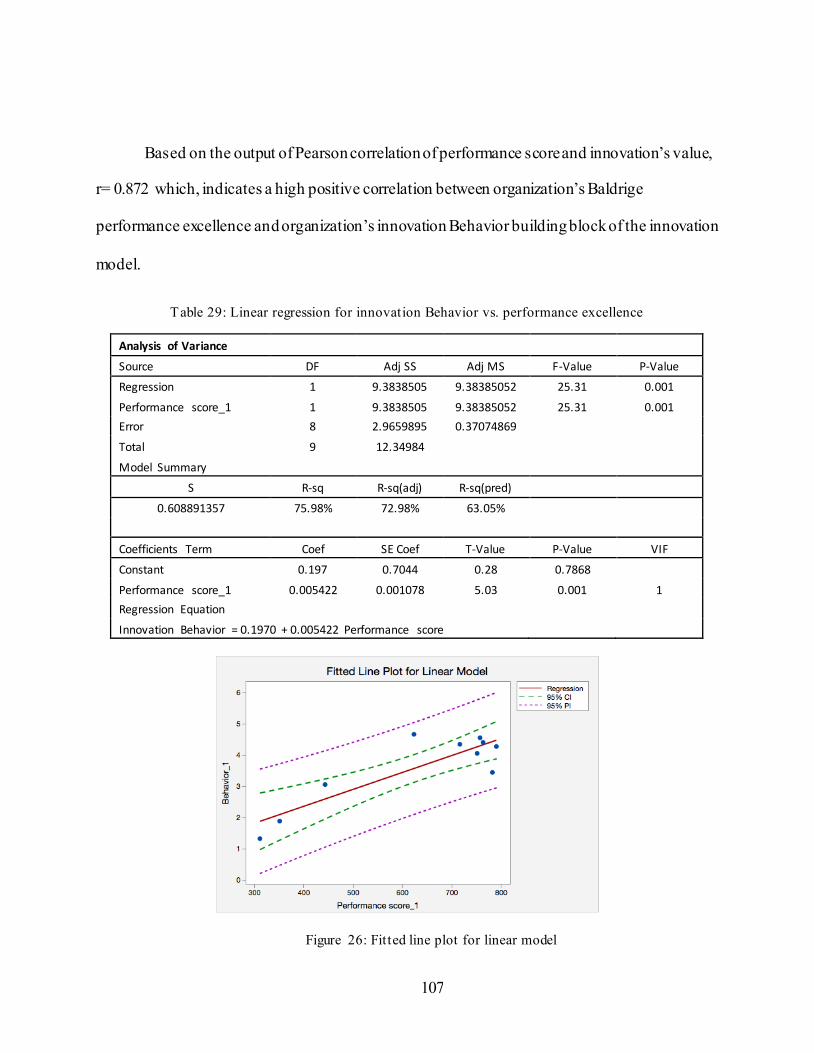
107
Based on the output of Pearson correlation of performance score and innovation’s value,
r= 0.872 which, indicates a high positive correlation between organization’s Baldrige
performance excellence and organization’s innovation Behavior building block of the innovation
model.
Table 29: Linear regression for innovation Behavior vs. performance excellence
Analysis of Variance
Source DF Adj SS Adj MS F-Value P-Value
Regression 1 9.3838505 9.38385052 25.31 0.001
Performance score_1 1 9.3838505 9.38385052 25.31 0.001
Error 8 2.9659895 0.37074869
Total 9 12.34984
Model Summary
S R-sq R-sq(adj) R-sq(pred)
0.608891357 75.98% 72.98% 63.05%
Coefficients Term Coef SE Coef T-Value P-Value VIF
Constant 0.197 0.7044 0.28 0.7868
Performance score_1 0.005422 0.001078 5.03 0.001 1
Regression Equation
Innovation Behavior = 0.1970 + 0.005422 Performance score
Figure 26: Fitted line plot for linear model
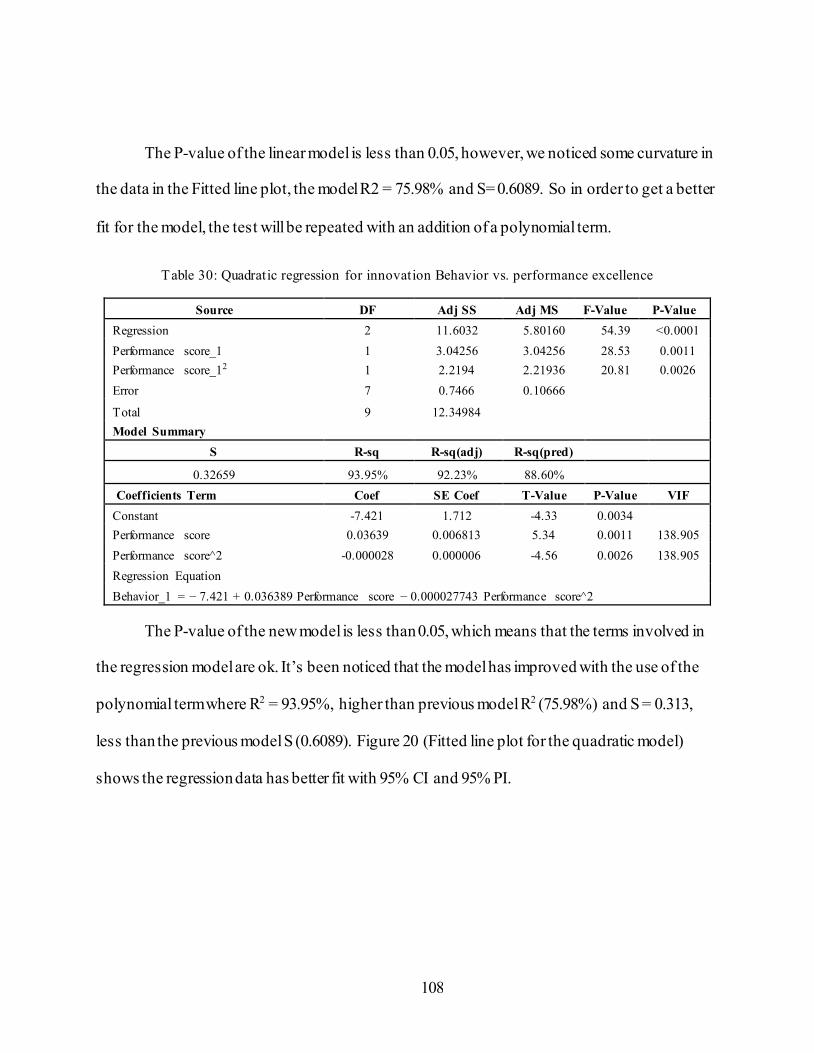
108
The P-value of the linear model is less than 0.05, however, we noticed some curvature in
the data in the Fitted line plot, the model R2 = 75.98% and S= 0.6089. So in order to get a better
fit for the model, the test will be repeated with an addition of a polynomial term.
Table 30: Quadratic regression for innovation Behavior vs. performance excellence
Source DF Adj SS Adj MS F-Value P-Value
Regression 2 11.6032 5.80160 54.39 <0.0001
Performance score_1 1 3.04256 3.04256 28.53 0.0011
Performance score_12 1 2.2194 2.21936 20.81 0.0026
Error 7 0.7466 0.10666
Total 9 12.34984
Model Summary
S R-sq R-sq(adj) R-sq(pred)
0.32659 93.95% 92.23% 88.60%
Coefficients Term Coef SE Coef T-Value P-Value VIF
Constant -7.421 1.712 -4.33 0.0034
Performance score 0.03639 0.006813 5.34 0.0011 138.905
Performance score^2 -0.000028 0.000006 -4.56 0.0026 138.905
Regression Equation
Behavior_1 = − 7.421 + 0.036389 Performance score − 0.000027743 Performance score^2
The P-value of the new model is less than 0.05, which means that the terms involved in
the regression model are ok. It’s been noticed that the model has improved with the use of the
polynomial term where R2 = 93.95%, higher than previous model R2 (75.98%) and S = 0.313,
less than the previous model S (0.6089). Figure 20 (Fitted line plot for the quadratic model)
shows the regression data has better fit with 95% CI and 95% PI.
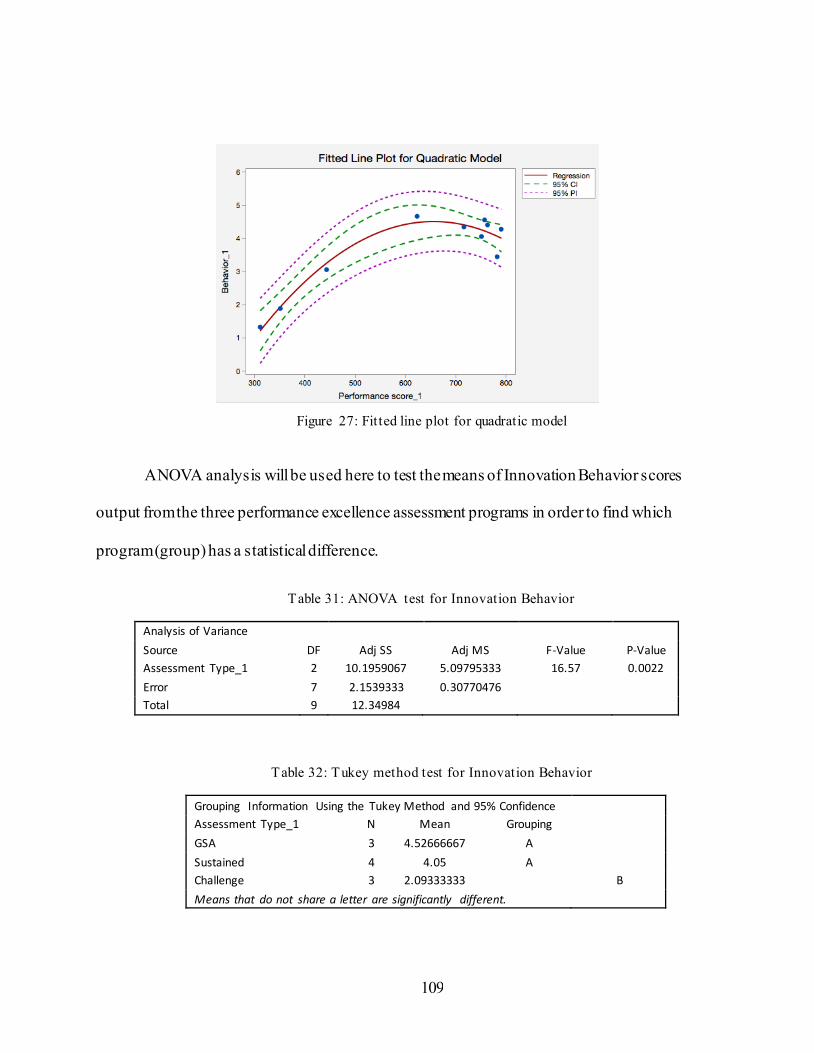
109
Figure 27: Fitted line plot for quadratic model
ANOVA analysis will be used here to test the means of Innovation Behavior scores
output from the three performance excellence assessment programs in order to find which
program (group) has a statistical difference.
Table 31: ANOVA test for Innovation Behavior
Analysis of Variance
Source DF Adj SS Adj MS F-Value P-Value
Assessment Type_1 2 10.1959067 5.09795333 16.57 0.0022
Error 7 2.1539333 0.30770476
Total 9 12.34984
Table 32: Tukey method test for Innovation Behavior
Grouping Information Using the Tukey Method and 95% Confidence
Assessment Type_1 N Mean Grouping
GSA 3 4.52666667 A
Sustained 4 4.05 A
Challenge 3 2.09333333 B
Means that do not share a letter are significantly different.
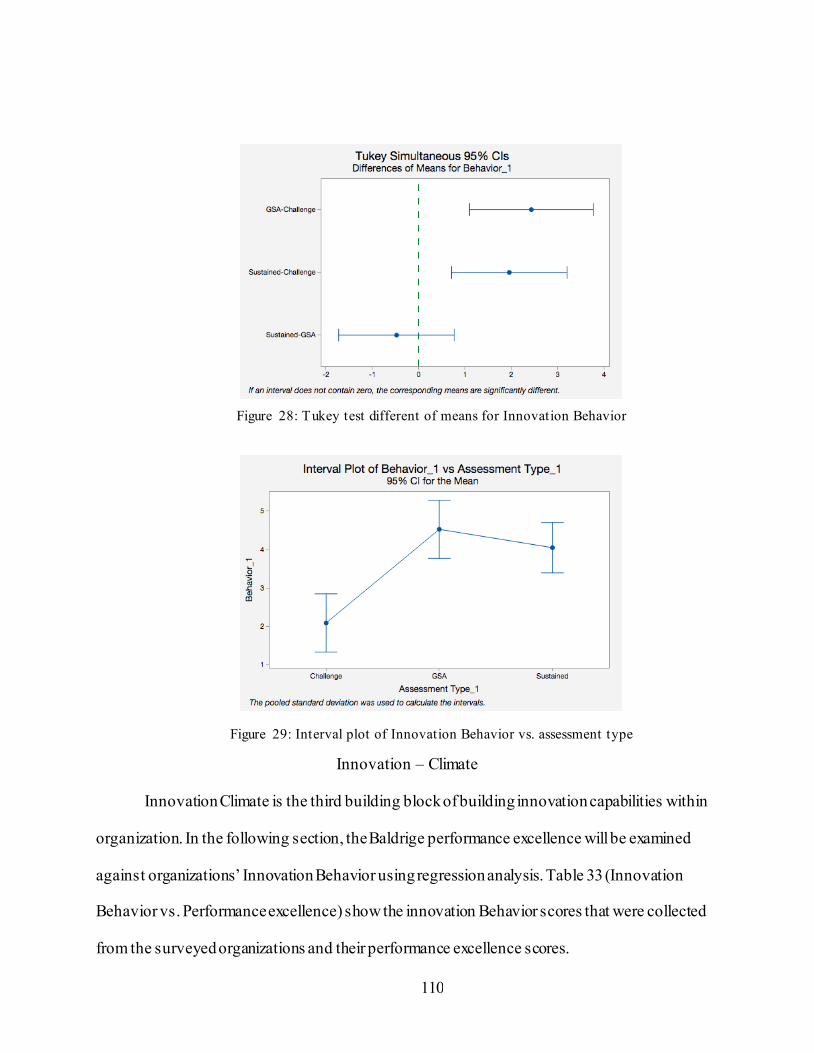
110
Figure 28: Tukey test different of means for Innovation Behavior
Figure 29: Interval plot of Innovation Behavior vs. assessment type
Innovation – Climate
Innovation Climate is the third building block of building innovation capabilities within
organization. In the following section, the Baldrige performance excellence will be examined
against organizations’ Innovation Behavior using regression analysis. Table 33 (Innovation
Behavior vs. Performance excellence) show the innovation Behavior scores that were collected
from the surveyed organizations and their performance excellence scores.
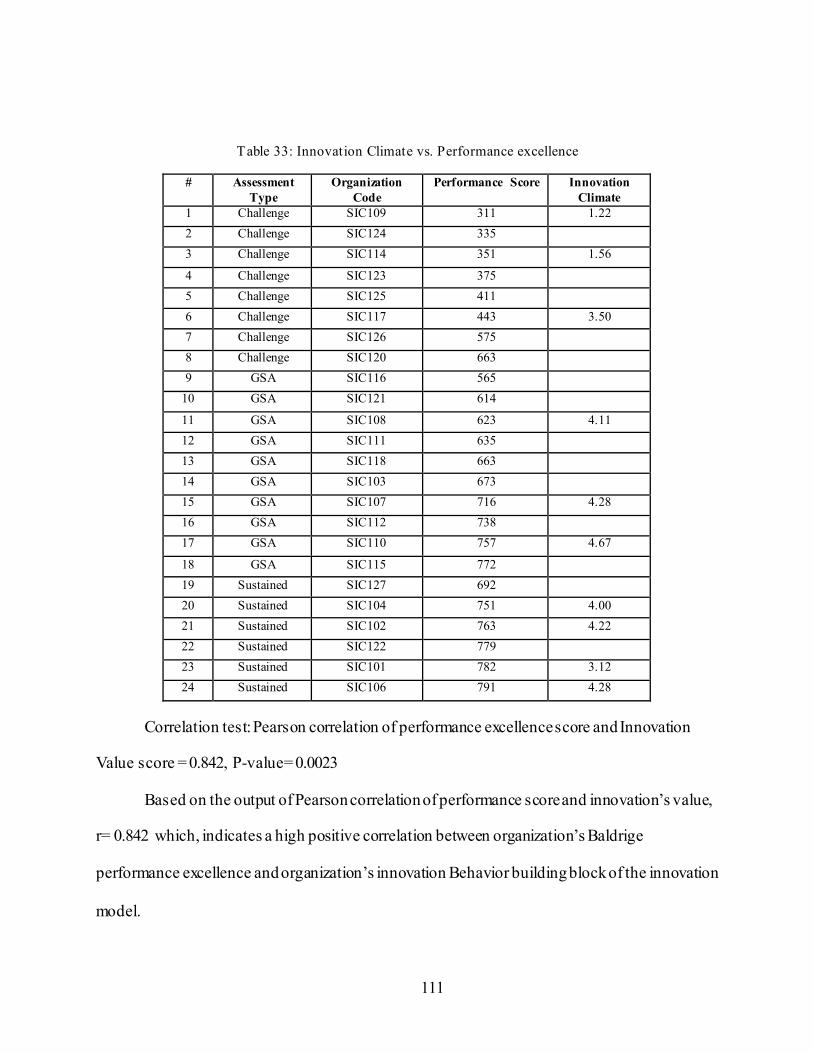
111
Table 33: Innovation Climate vs. Performance excellence
# Assessment
Type
Organization
Code
Performance Score Innovation
Climate
1 Challenge SIC109 311 1.22
2 Challenge SIC124 335
3 Challenge SIC114 351 1.56
4 Challenge SIC123 375
5 Challenge SIC125 411
6 Challenge SIC117 443 3.50
7 Challenge SIC126 575
8 Challenge SIC120 663
9 GSA SIC116 565
10 GSA SIC121 614
11 GSA SIC108 623 4.11
12 GSA SIC111 635
13 GSA SIC118 663
14 GSA SIC103 673
15 GSA SIC107 716 4.28
16 GSA SIC112 738
17 GSA SIC110 757 4.67
18 GSA SIC115 772
19 Sustained SIC127 692
20 Sustained SIC104 751 4.00
21 Sustained SIC102 763 4.22
22 Sustained SIC122 779
23 Sustained SIC101 782 3.12
24 Sustained SIC106 791 4.28
Correlation test: Pearson correlation of performance excellence score and Innovation
Value score = 0.842, P-value= 0.0023
Based on the output of Pearson correlation of performance score and innovation’s value,
r= 0.842 which, indicates a high positive correlation between organization’s Baldrige
performance excellence and organization’s innovation Behavior building block of the innovation
model.
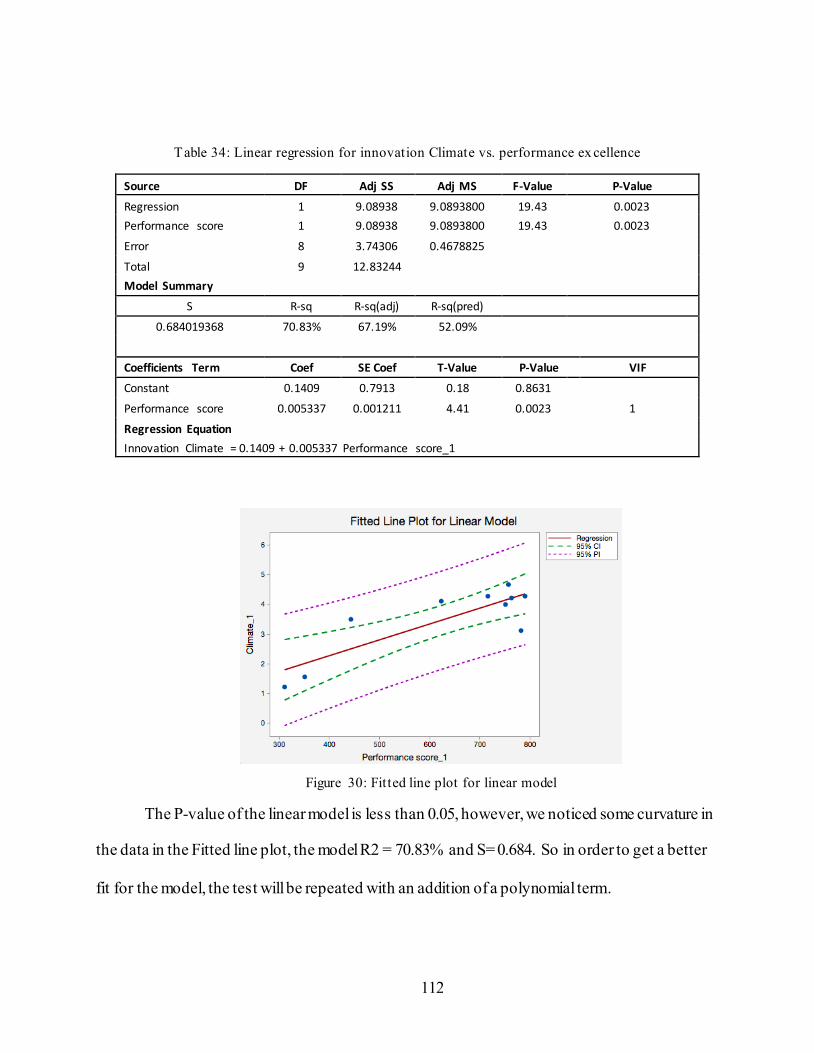
112
Table 34: Linear regression for innovation Climate vs. performance ex cellence
Source DF Adj SS Adj MS F-Value P-Value
Regression 1 9.08938 9.0893800 19.43 0.0023
Performance score 1 9.08938 9.0893800 19.43 0.0023
Error 8 3.74306 0.4678825
Total 9 12.83244
Model Summary
S R-sq R-sq(adj) R-sq(pred)
0.684019368 70.83% 67.19% 52.09%
Coefficients Term Coef SE Coef T-Value P-Value VIF
Constant 0.1409 0.7913 0.18 0.8631
Performance score 0.005337 0.001211 4.41 0.0023 1
Regression Equation
Innovation Climate = 0.1409 + 0.005337 Performance score_1
Figure 30: Fitted line plot for linear model
The P-value of the linear model is less than 0.05, however, we noticed some curvature in
the data in the Fitted line plot, the model R2 = 70.83% and S= 0.684. So in order to get a better
fit for the model, the test will be repeated with an addition of a polynomial term.
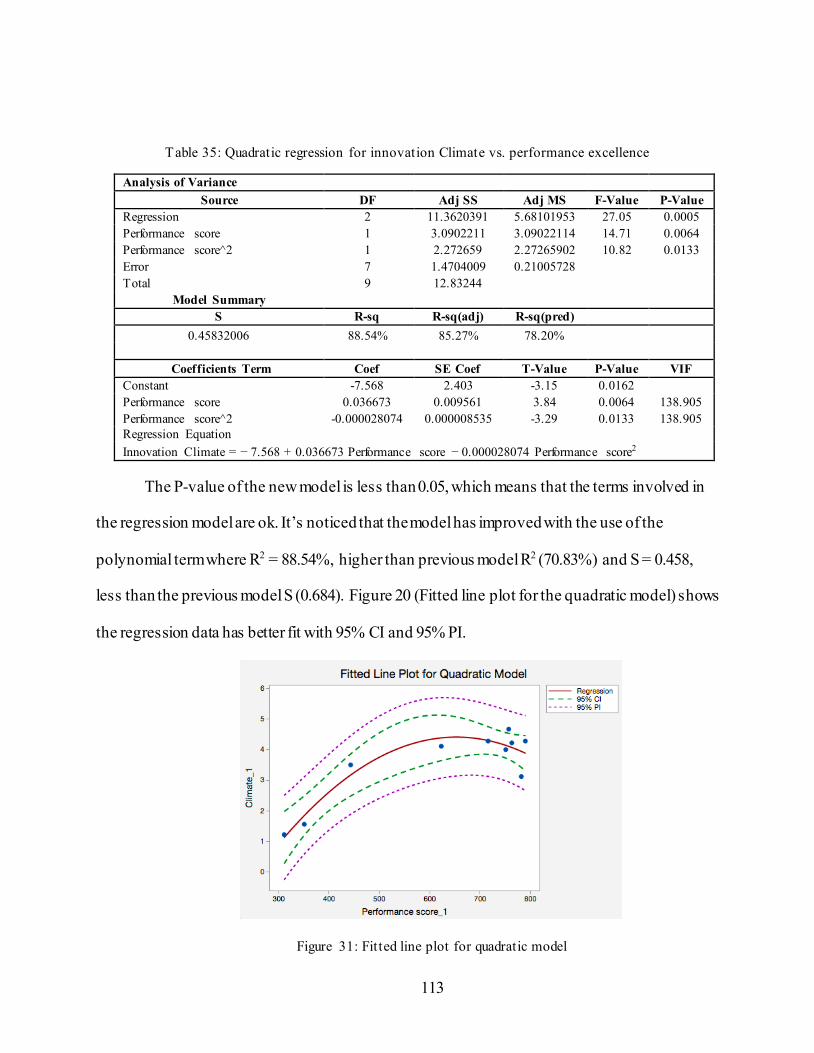
113
Table 35: Quadratic regression for innovation Climate vs. performance excellence
Analysis of Variance
Source DF Adj SS Adj MS F-Value P-Value
Regression 2 11.3620391 5.68101953 27.05 0.0005
Performance score 1 3.0902211 3.09022114 14.71 0.0064
Performance score^2 1 2.272659 2.27265902 10.82 0.0133
Error 7 1.4704009 0.21005728
Total 9 12.83244
Model Summary
S R-sq R-sq(adj) R-sq(pred)
0.45832006 88.54% 85.27% 78.20%
Coefficients Term Coef SE Coef T-Value P-Value VIF
Constant -7.568 2.403 -3.15 0.0162
Performance score 0.036673 0.009561 3.84 0.0064 138.905
Performance score^2 -0.000028074 0.000008535 -3.29 0.0133 138.905
Regression Equation
Innovation Climate = − 7.568 + 0.036673 Performance score − 0.000028074 Performance score2
The P-value of the new model is less than 0.05, which means that the terms involved in
the regression model are ok. It’s noticed that the model has improved with the use of the
polynomial term where R2 = 88.54%, higher than previous model R2 (70.83%) and S = 0.458,
less than the previous model S (0.684). Figure 20 (Fitted line plot for the quadratic model) shows
the regression data has better fit with 95% CI and 95% PI.
Figure 31: Fitted line plot for quadratic model
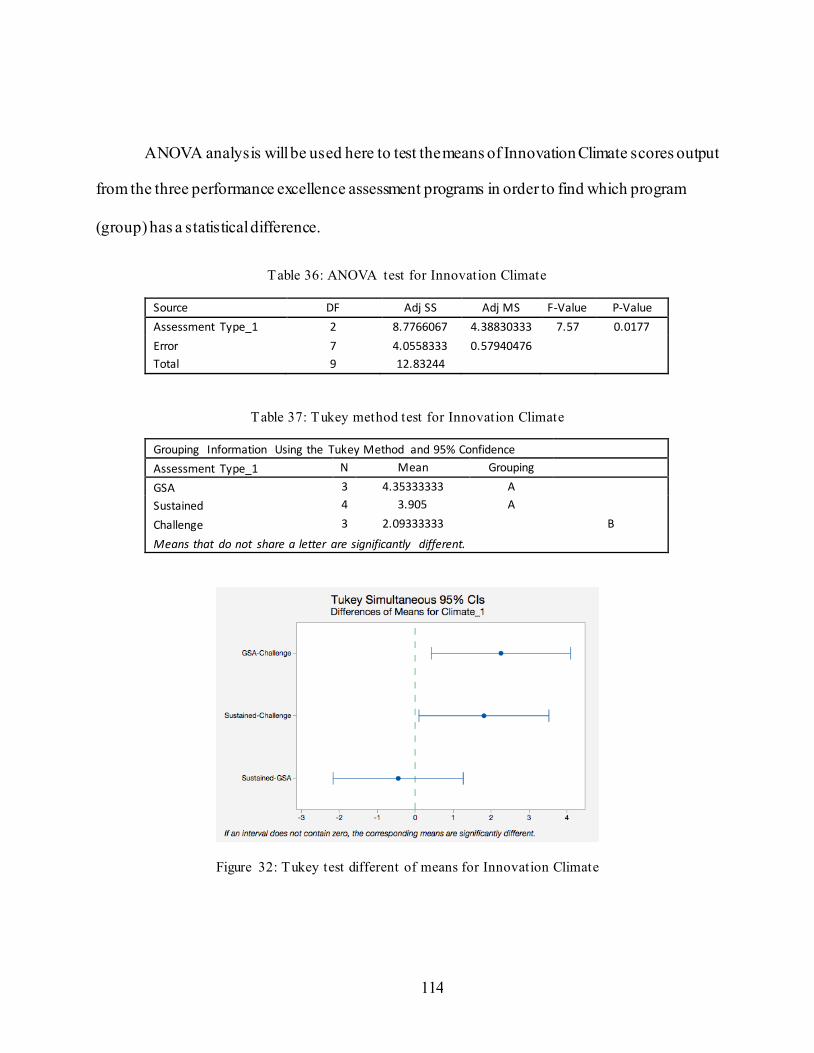
114
ANOVA analysis will be used here to test the means of Innovation Climate scores output
from the three performance excellence assessment programs in order to find which program
(group) has a statistical difference.
Table 36: ANOVA test for Innovation Climate
Source DF Adj SS Adj MS F-Value P-Value
Assessment Type_1 2 8.7766067 4.38830333 7.57 0.0177
Error 7 4.0558333 0.57940476
Total 9 12.83244
Table 37: Tukey method test for Innovation Climate
Grouping Information Using the Tukey Method and 95% Confidence
Assessment Type_1 N Mean Grouping
GSA 3 4.35333333 A
Sustained 4 3.905 A
Challenge 3 2.09333333 B
Means that do not share a letter are significantly different.
Figure 32: Tukey test different of means for Innovation Climate
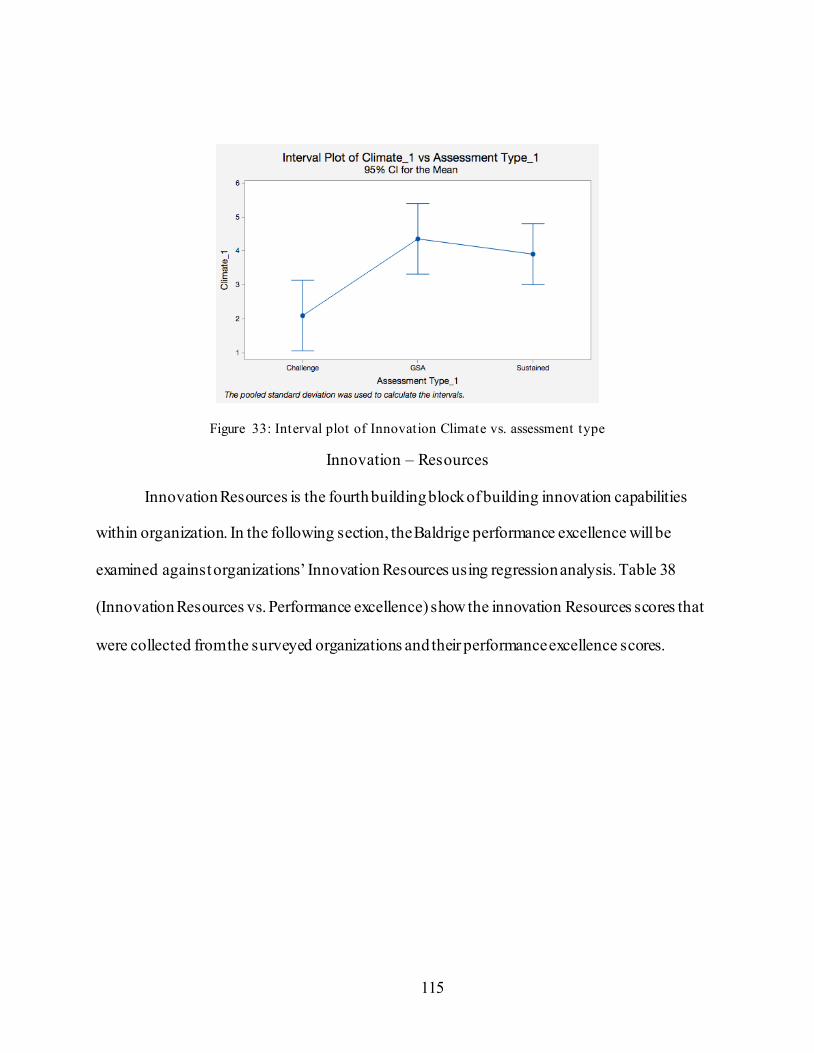
115
Figure 33: Interval plot of Innovation Climate vs. assessment type
Innovation – Resources
Innovation Resources is the fourth building block of building innovation capabilities
within organization. In the following section, the Baldrige performance excellence will be
examined against organizations’ Innovation Resources using regression analysis. Table 38
(Innovation Resources vs. Performance excellence) show the innovation Resources scores that
were collected from the surveyed organizations and their performance excellence scores.
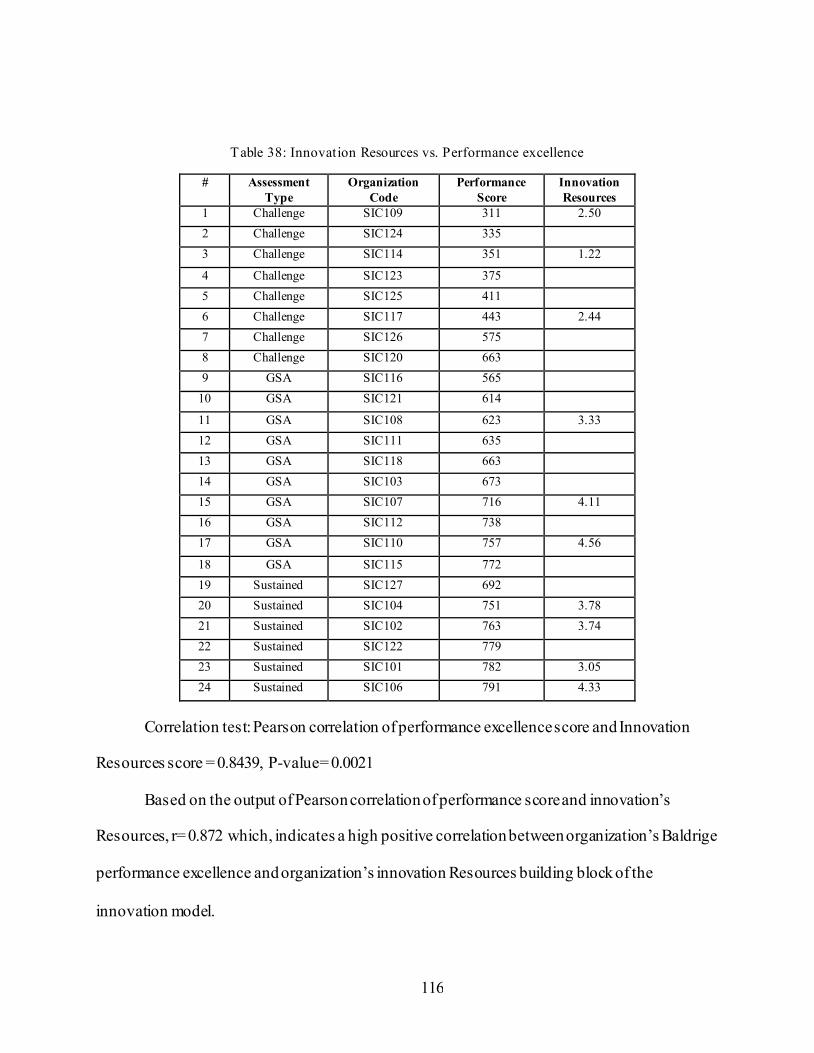
116
Table 38: Innovation Resources vs. Performance excellence
# Assessment
Type
Organization
Code
Performance
Score
Innovation
Resources
1 Challenge SIC109 311 2.50
2 Challenge SIC124 335
3 Challenge SIC114 351 1.22
4 Challenge SIC123 375
5 Challenge SIC125 411
6 Challenge SIC117 443 2.44
7 Challenge SIC126 575
8 Challenge SIC120 663
9 GSA SIC116 565
10 GSA SIC121 614
11 GSA SIC108 623 3.33
12 GSA SIC111 635
13 GSA SIC118 663
14 GSA SIC103 673
15 GSA SIC107 716 4.11
16 GSA SIC112 738
17 GSA SIC110 757 4.56
18 GSA SIC115 772
19 Sustained SIC127 692
20 Sustained SIC104 751 3.78
21 Sustained SIC102 763 3.74
22 Sustained SIC122 779
23 Sustained SIC101 782 3.05
24 Sustained SIC106 791 4.33
Correlation test: Pearson correlation of performance excellence score and Innovation
Resources score = 0.8439, P-value= 0.0021
Based on the output of Pearson correlation of performance score and innovation’s
Resources, r= 0.872 which, indicates a high positive correlation between organization’s Baldrige
performance excellence and organization’s innovation Resources building block of the
innovation model.
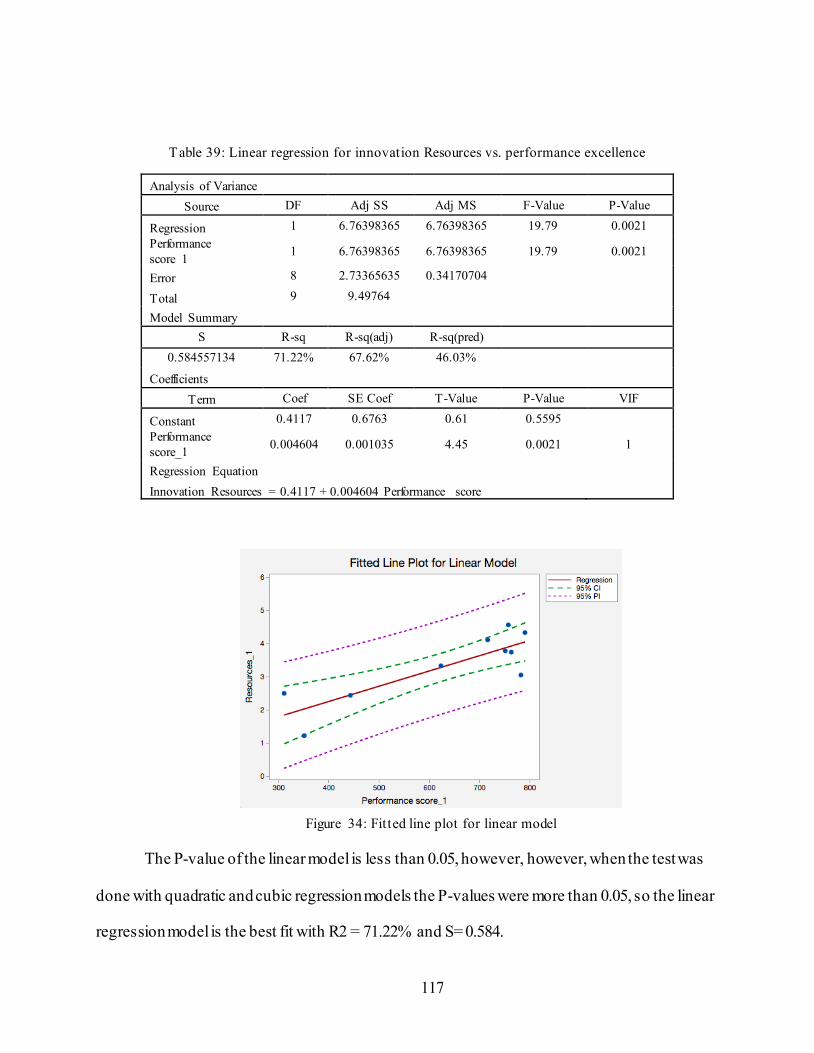
117
Table 39: Linear regression for innovation Resources vs. performance excellence
Analysis of Variance
Source DF Adj SS Adj MS F-Value P-Value
Regression 1 6.76398365 6.76398365 19.79 0.0021
Performance
score_1 1 6.76398365 6.76398365 19.79 0.0021
Error 8 2.73365635 0.34170704
Total 9 9.49764
Model Summary
S R-sq R-sq(adj) R-sq(pred)
0.584557134 71.22% 67.62% 46.03%
Coefficients
Term Coef SE Coef T-Value P-Value VIF
Constant 0.4117 0.6763 0.61 0.5595
Performance
score_1 0.004604 0.001035 4.45 0.0021 1
Regression Equation
Innovation Resources = 0.4117 + 0.004604 Performance score
Figure 34: Fitted line plot for linear model
The P-value of the linear model is less than 0.05, however, however, when the test was
done with quadratic and cubic regression models the P-values were more than 0.05, so the linear
regression model is the best fit with R2 = 71.22% and S= 0.584.
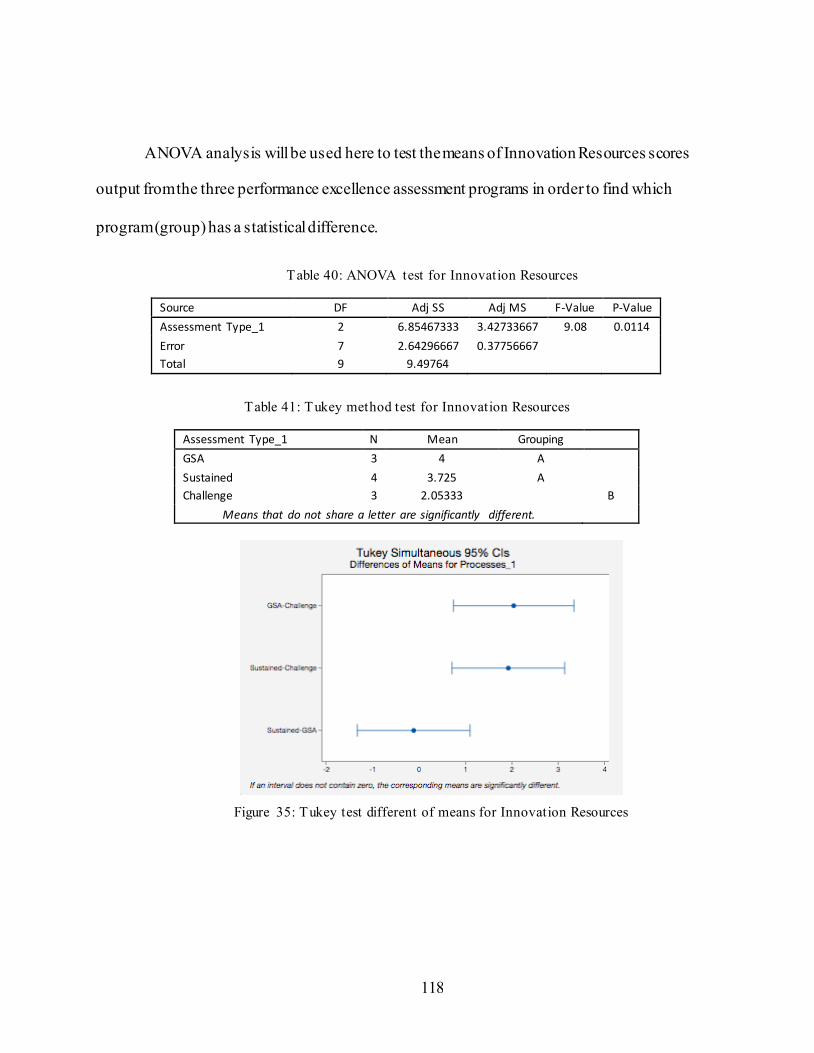
118
ANOVA analysis will be used here to test the means of Innovation Resources scores
output from the three performance excellence assessment programs in order to find which
program (group) has a statistical difference.
Table 40: ANOVA test for Innovation Resources
Source DF Adj SS Adj MS F-Value P-Value
Assessment Type_1 2 6.85467333 3.42733667 9.08 0.0114
Error 7 2.64296667 0.37756667
Total 9 9.49764
Table 41: Tukey method test for Innovation Resources
Assessment Type_1 N Mean Grouping
GSA 3 4 A
Sustained 4 3.725 A
Challenge 3 2.05333 B
Means that do not share a letter are significantly different.
Figure 35: Tukey test different of means for Innovation Resources
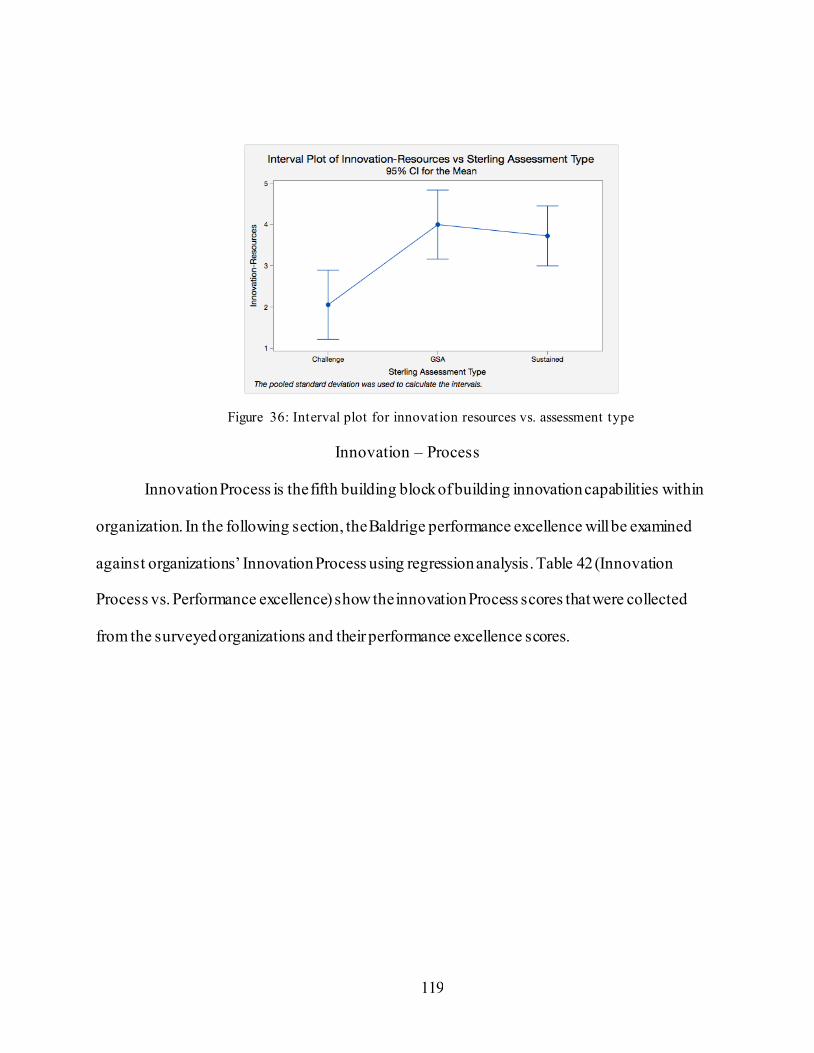
119
Figure 36: Interval plot for innovation resources vs. assessment type
Innovation – Process
Innovation Process is the fifth building block of building innovation capabilities within
organization. In the following section, the Baldrige performance excellence will be examined
against organizations’ Innovation Process using regression analysis. Table 42 (Innovation
Process vs. Performance excellence) show the innovation Process scores that were collected
from the surveyed organizations and their performance excellence scores.

120
Table 42: Innovation process vs. performance excellence
# Assessment
Type
Organization
Code
Performance
Score
Innovation
Process
1 Challenge SIC109 311 1.33
2 Challenge SIC124 335
3 Challenge SIC114 351 1.67
4 Challenge SIC123 375
5 Challenge SIC125 411
6 Challenge SIC117 443 2.11
7 Challenge SIC126 575
8 Challenge SIC120 663
9 GSA SIC116 565
10 GSA SIC121 614
11 GSA SIC108 623 2.89
12 GSA SIC111 635
13 GSA SIC118 663
14 GSA SIC103 673
15 GSA SIC107 716 3.90
16 GSA SIC112 738
17 GSA SIC110 757 4.44
18 GSA SIC115 772
19 Sustained SIC127 692
20 Sustained SIC104 751 3.72
21 Sustained SIC102 763 3.74
22 Sustained SIC122 779
23 Sustained SIC101 782 3.05
24 Sustained SIC106 791 4.00
Correlation test: Pearson correlation of performance excellence score and Innovation
Resources score = 0.932, P-value= 0.0001
Based on the output of Pearson correlation of performance score and innovation’s
Resources, r= 0.932 which, indicates a high positive correlation between organization’s Baldrige
performance excellence and organization’s innovation Resources building block of the
innovation model.
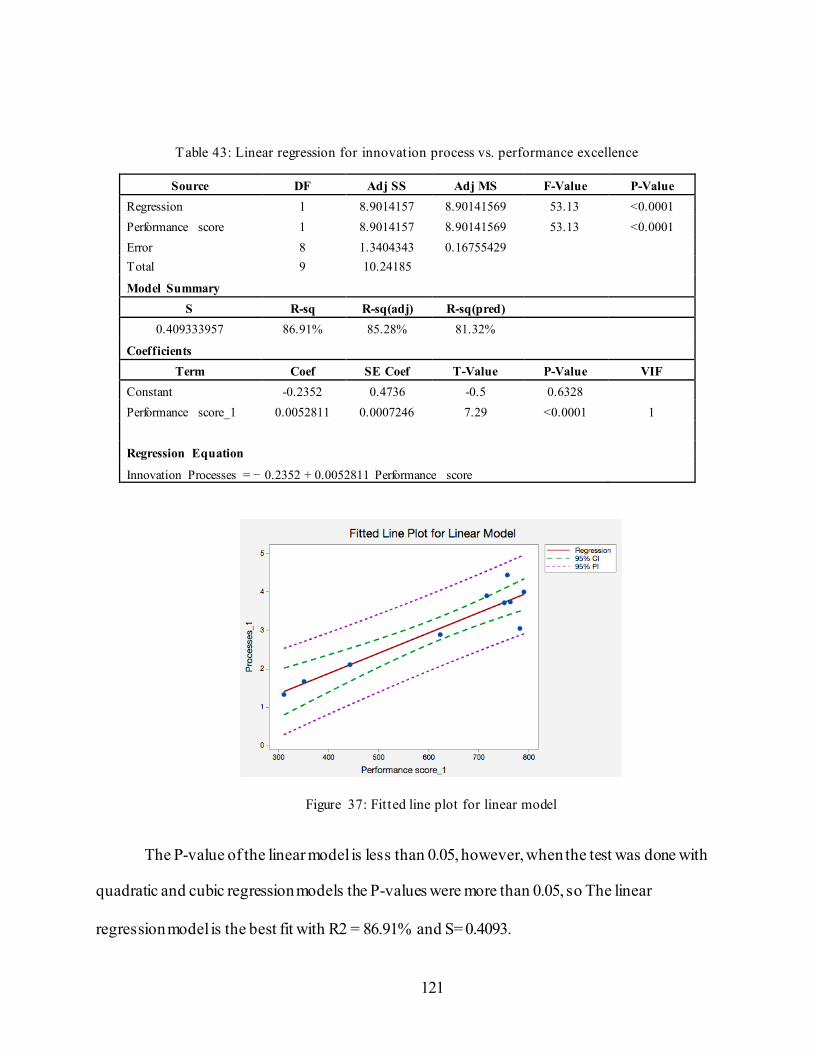
121
Table 43: Linear regression for innovation process vs. performance excellence
Source DF Adj SS Adj MS F-Value P-Value
Regression 1 8.9014157 8.90141569 53.13 <0.0001
Performance score 1 8.9014157 8.90141569 53.13 <0.0001
Error 8 1.3404343 0.16755429
Total 9 10.24185
Model Summary
S R-sq R-sq(adj) R-sq(pred)
0.409333957 86.91% 85.28% 81.32%
Coefficients
Term Coef SE Coef T-Value P-Value VIF
Constant -0.2352 0.4736 -0.5 0.6328
Performance score_1 0.0052811 0.0007246 7.29 <0.0001 1
Regression Equation
Innovation Processes = − 0.2352 + 0.0052811 Performance score
Figure 37: Fitted line plot for linear model
The P-value of the linear model is less than 0.05, however, when the test was done with
quadratic and cubic regression models the P-values were more than 0.05, so The linear
regression model is the best fit with R2 = 86.91% and S= 0.4093.
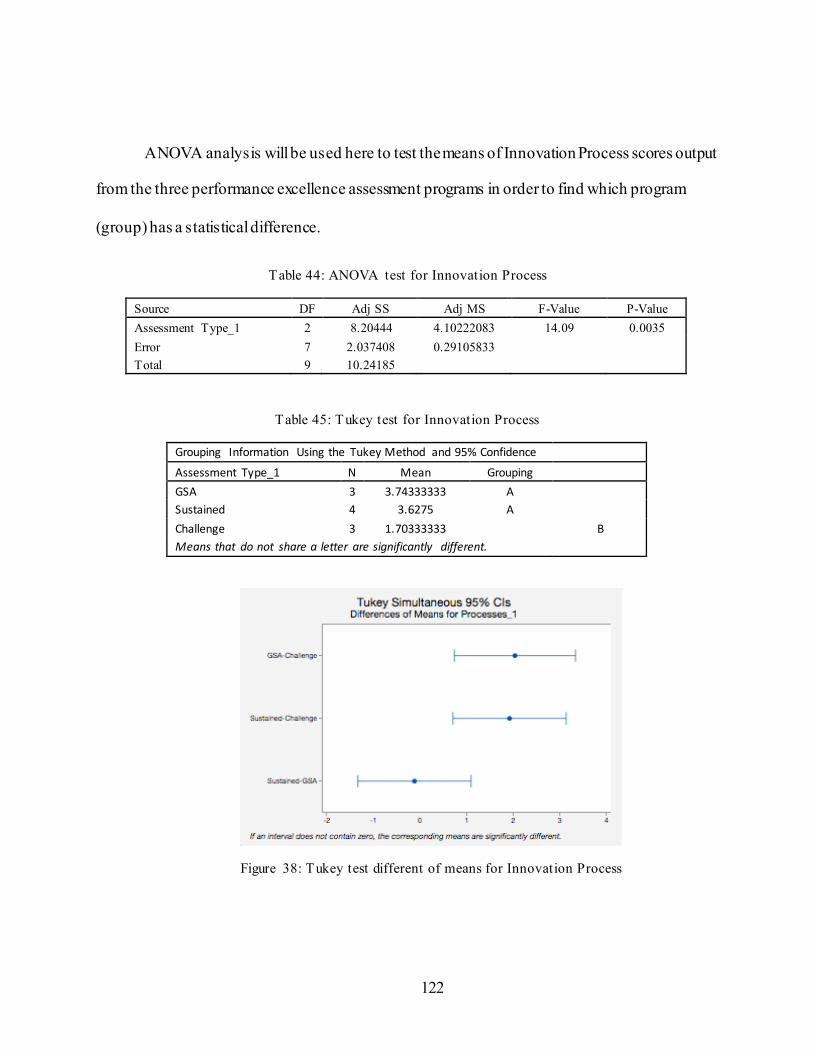
122
ANOVA analysis will be used here to test the means of Innovation Process scores output
from the three performance excellence assessment programs in order to find which program
(group) has a statistical difference.
Table 44: ANOVA test for Innovation Process
Source DF Adj SS Adj MS F-Value P-Value
Assessment Type_1 2 8.20444 4.10222083 14.09 0.0035
Error 7 2.037408 0.29105833
Total 9 10.24185
Table 45: Tukey test for Innovation Process
Grouping Information Using the Tukey Method and 95% Confidence
Assessment Type_1 N Mean Grouping
GSA 3 3.74333333 A
Sustained 4 3.6275 A
Challenge 3 1.70333333 B
Means that do not share a letter are significantly different.
Figure 38: Tukey test different of means for Innovation Process
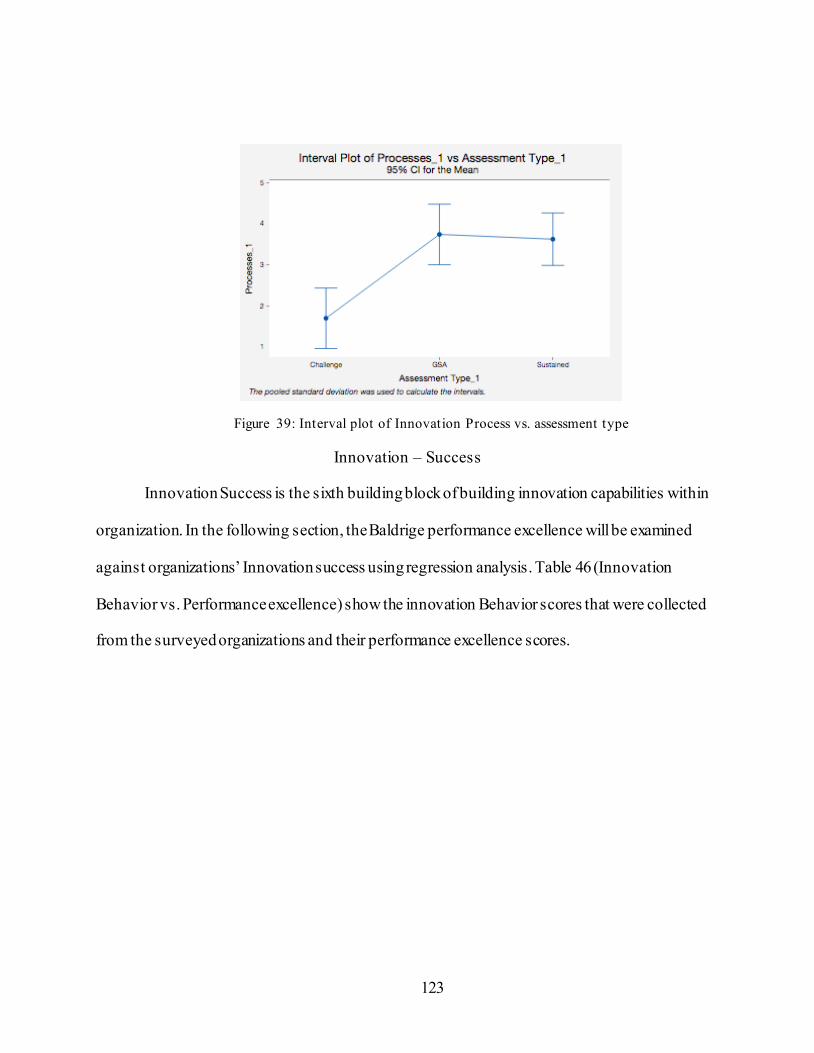
123
Figure 39: Interval plot of Innovation Process vs. assessment type
Innovation – Success
Innovation Success is the sixth building block of building innovation capabilities within
organization. In the following section, the Baldrige performance excellence will be examined
against organizations’ Innovation success using regression analysis. Table 46 (Innovation
Behavior vs. Performance excellence) show the innovation Behavior scores that were collected
from the surveyed organizations and their performance excellence scores.
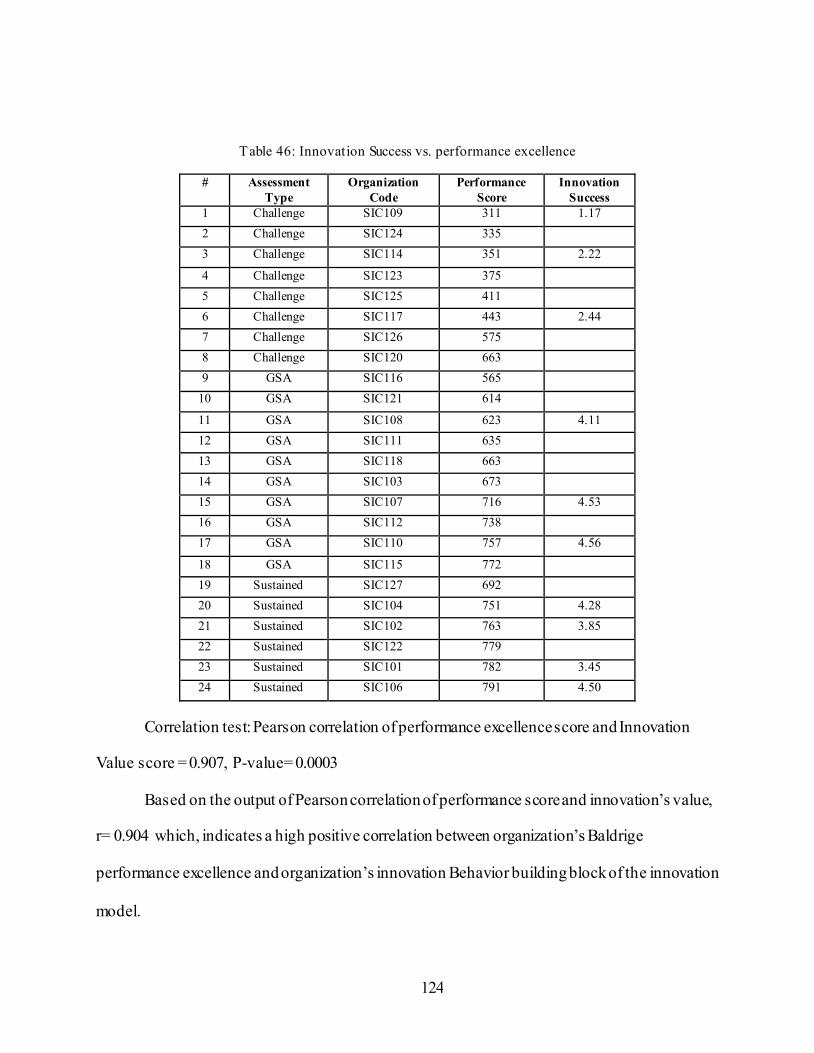
124
Table 46: Innovation Success vs. performance excellence
# Assessment
Type
Organization
Code
Performance
Score
Innovation
Success
1 Challenge SIC109 311 1.17
2 Challenge SIC124 335
3 Challenge SIC114 351 2.22
4 Challenge SIC123 375
5 Challenge SIC125 411
6 Challenge SIC117 443 2.44
7 Challenge SIC126 575
8 Challenge SIC120 663
9 GSA SIC116 565
10 GSA SIC121 614
11 GSA SIC108 623 4.11
12 GSA SIC111 635
13 GSA SIC118 663
14 GSA SIC103 673
15 GSA SIC107 716 4.53
16 GSA SIC112 738
17 GSA SIC110 757 4.56
18 GSA SIC115 772
19 Sustained SIC127 692
20 Sustained SIC104 751 4.28
21 Sustained SIC102 763 3.85
22 Sustained SIC122 779
23 Sustained SIC101 782 3.45
24 Sustained SIC106 791 4.50
Correlation test: Pearson correlation of performance excellence score and Innovation
Value score = 0.907, P-value= 0.0003
Based on the output of Pearson correlation of performance score and innovation’s value,
r= 0.904 which, indicates a high positive correlation between organization’s Baldrige
performance excellence and organization’s innovation Behavior building block of the innovation
model.
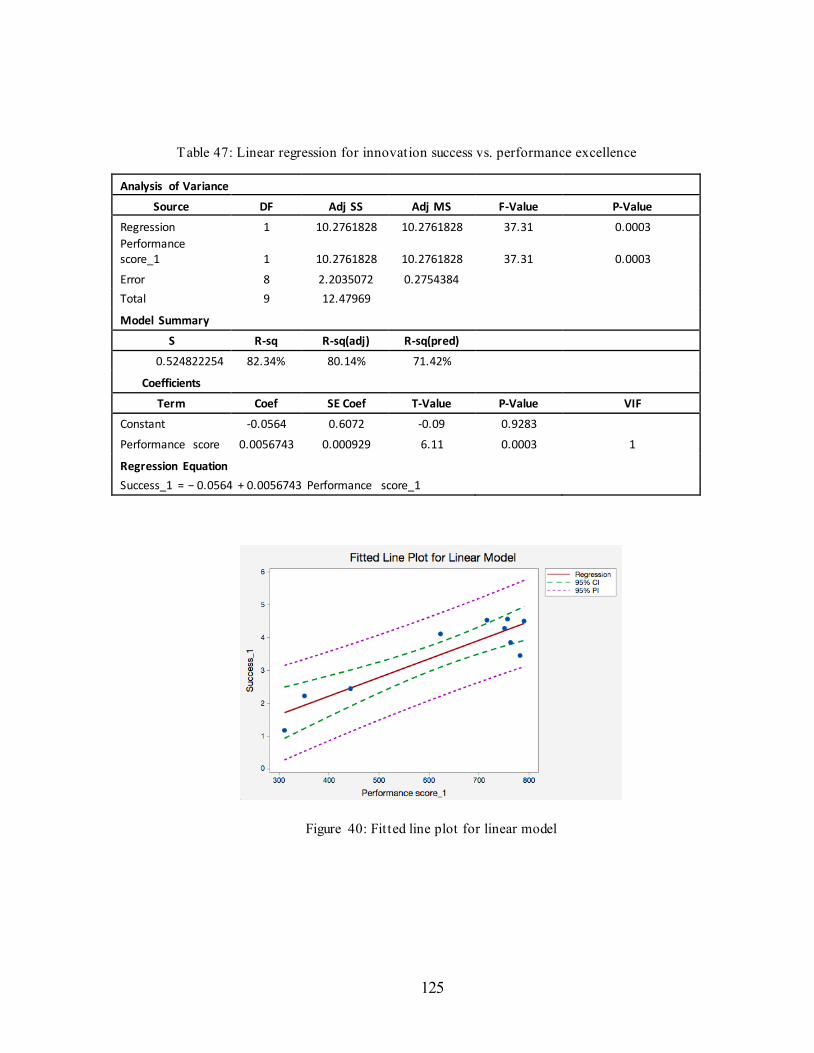
125
Table 47: Linear regression for innovation success vs. performance excellence
Analysis of Variance
Source DF Adj SS Adj MS F-Value P-Value
Regression 1 10.2761828 10.2761828 37.31 0.0003
Performance score_1 1 10.2761828 10.2761828 37.31 0.0003
Error 8 2.2035072 0.2754384
Total 9 12.47969
Model Summary
S R-sq R-sq(adj) R-sq(pred)
0.524822254 82.34% 80.14% 71.42%
Coefficients
Term Coef SE Coef T-Value P-Value VIF
Constant -0.0564 0.6072 -0.09 0.9283
Performance score 0.0056743 0.000929 6.11 0.0003 1
Regression Equation
Success_1 = − 0.0564 + 0.0056743 Performance score_1
Figure 40: Fitted line plot for linear model
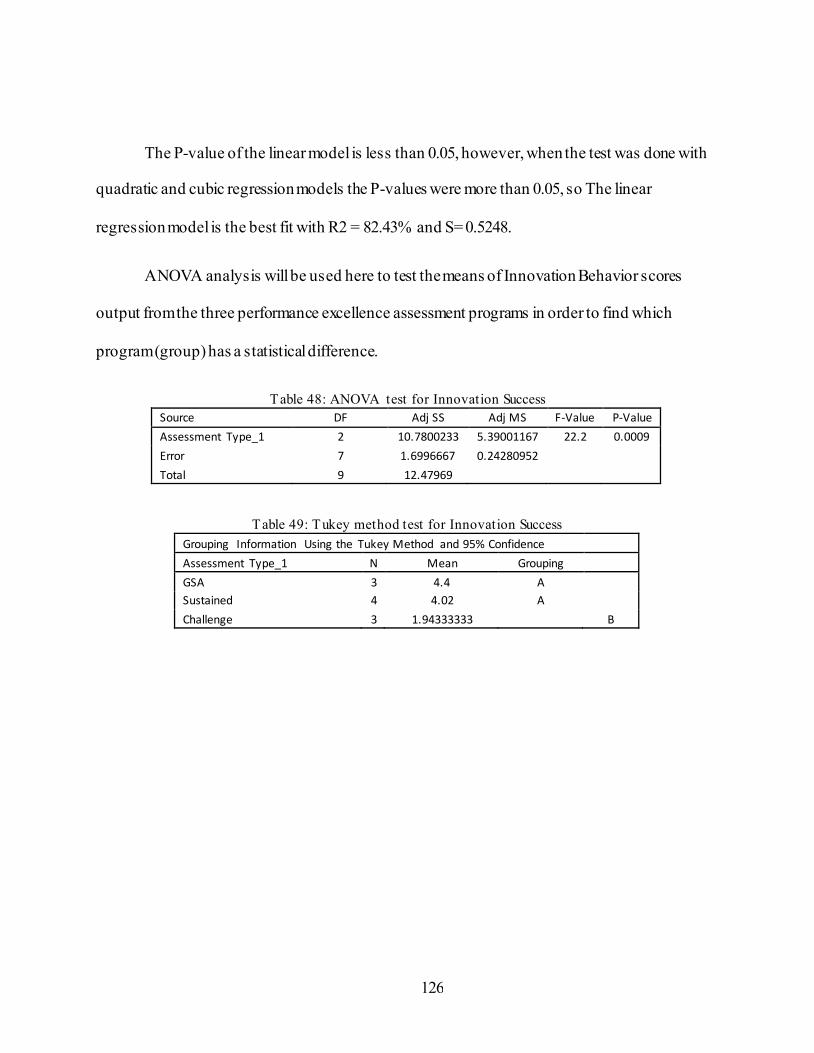
126
The P-value of the linear model is less than 0.05, however, when the test was done with
quadratic and cubic regression models the P-values were more than 0.05, so The linear
regression model is the best fit with R2 = 82.43% and S= 0.5248.
ANOVA analysis will be used here to test the means of Innovation Behavior scores
output from the three performance excellence assessment programs in order to find which
program (group) has a statistical difference.
Table 48: ANOVA test for Innovation Success
Source DF Adj SS Adj MS F-Value P-Value
Assessment Type_1 2 10.7800233 5.39001167 22.2 0.0009
Error 7 1.6996667 0.24280952
Total 9 12.47969
Table 49: Tukey method test for Innovation Success
Grouping Information Using the Tukey Method and 95% Confidence
Assessment Type_1 N Mean Grouping
GSA 3 4.4 A
Sustained 4 4.02 A
Challenge 3 1.94333333 B
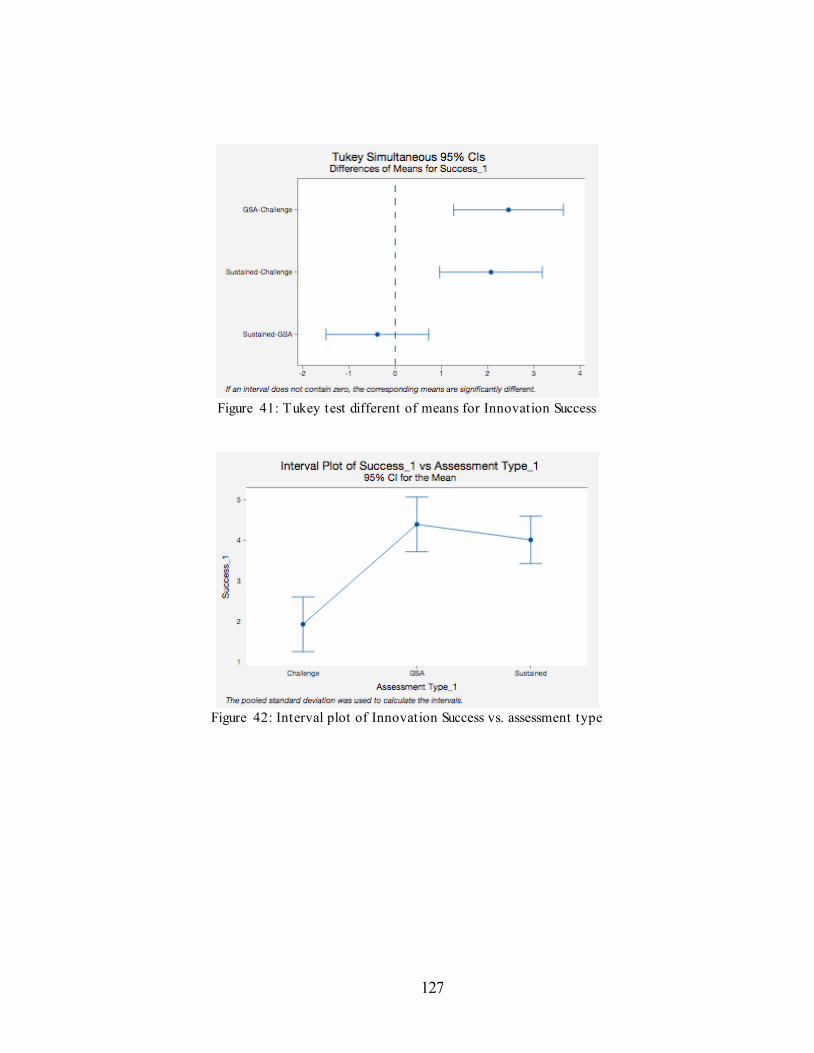
127
Figure 41: Tukey test different of means for Innovation Success
Figure 42: Interval plot of Innovation Success vs. assessment type
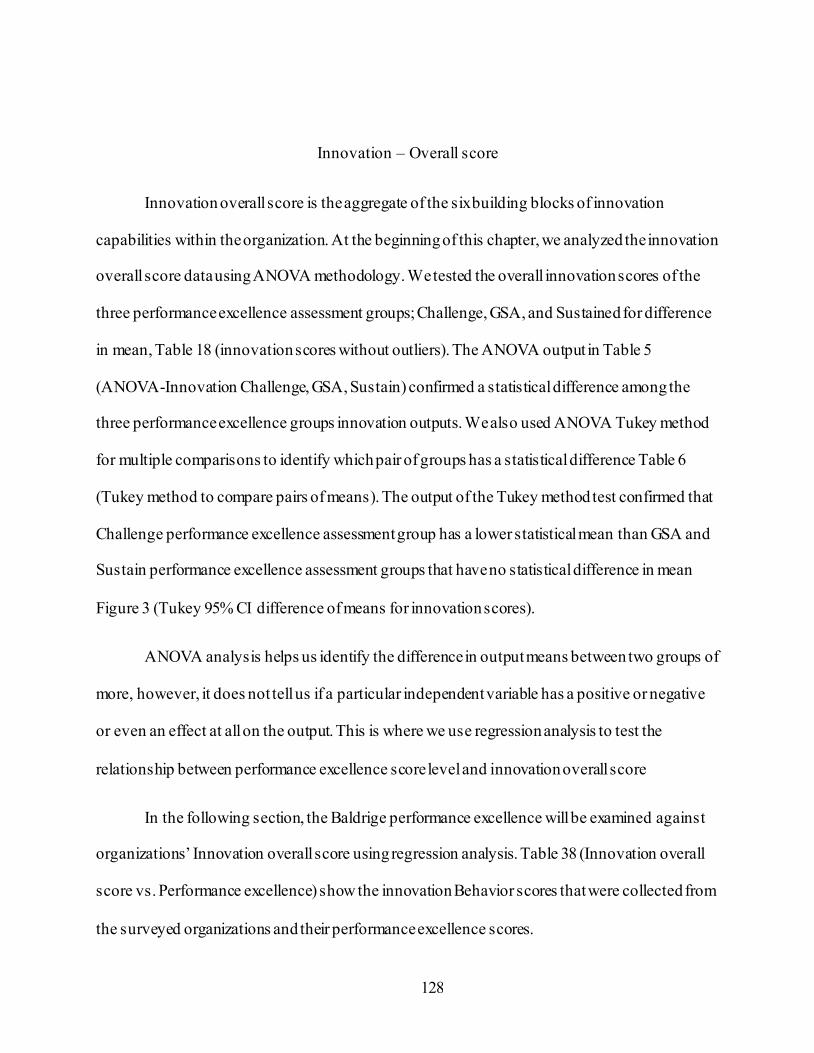
128
Innovation – Overall score
Innovation overall score is the aggregate of the six building blocks of innovation
capabilities within the organization. At the beginning of this chapter, we analyzed the innovation
overall score data using ANOVA methodology. We tested the overall innovation scores of the
three performance excellence assessment groups; Challenge, GSA, and Sustained for difference
in mean, Table 18 (innovation scores without outliers). The ANOVA output in Table 5
(ANOVA-Innovation Challenge, GSA, Sustain) confirmed a statistical difference among the
three performance excellence groups innovation outputs. We also used ANOVA Tukey method
for multiple comparisons to identify which pair of groups has a statistical difference Table 6
(Tukey method to compare pairs of means). The output of the Tukey method test confirmed that
Challenge performance excellence assessment group has a lower statistical mean than GSA and
Sustain performance excellence assessment groups that have no statistical difference in mean
Figure 3 (Tukey 95% CI difference of means for innovation scores).
ANOVA analysis helps us identify the difference in output means between two groups of
more, however, it does not tell us if a particular independent variable has a positive or negative
or even an effect at all on the output. This is where we use regression analysis to test the
relationship between performance excellence score level and innovation overall score
In the following section, the Baldrige performance excellence will be examined against
organizations’ Innovation overall score using regression analysis. Table 38 (Innovation overall
score vs. Performance excellence) show the innovation Behavior scores that were collected from
the surveyed organizations and their performance excellence scores.
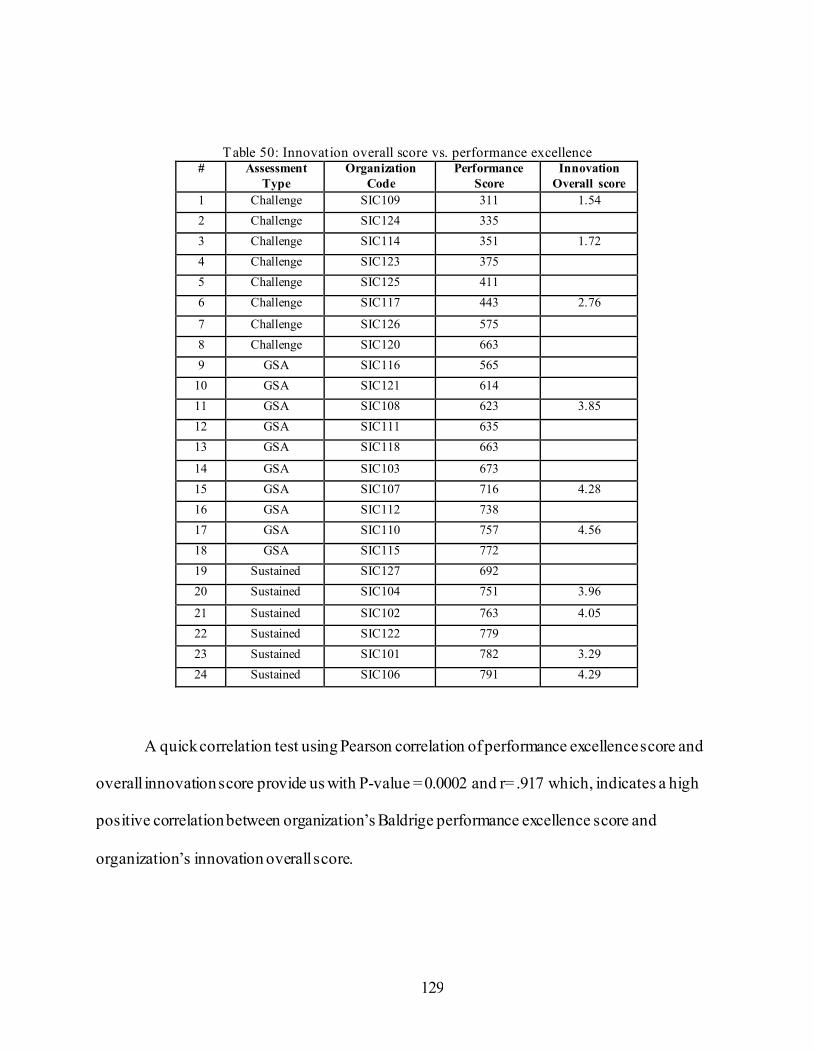
129
Table 50: Innovation overall score vs. performance excellence # Assessment
Type
Organization
Code
Performance
Score
Innovation
Overall score
1 Challenge SIC109 311 1.54
2 Challenge SIC124 335
3 Challenge SIC114 351 1.72
4 Challenge SIC123 375
5 Challenge SIC125 411
6 Challenge SIC117 443 2.76
7 Challenge SIC126 575
8 Challenge SIC120 663
9 GSA SIC116 565
10 GSA SIC121 614
11 GSA SIC108 623 3.85
12 GSA SIC111 635
13 GSA SIC118 663
14 GSA SIC103 673
15 GSA SIC107 716 4.28
16 GSA SIC112 738
17 GSA SIC110 757 4.56
18 GSA SIC115 772
19 Sustained SIC127 692
20 Sustained SIC104 751 3.96
21 Sustained SIC102 763 4.05
22 Sustained SIC122 779
23 Sustained SIC101 782 3.29
24 Sustained SIC106 791 4.29
A quick correlation test using Pearson correlation of performance excellence score and
overall innovation score provide us with P-value = 0.0002 and r= .917 which, indicates a high
positive correlation between organization’s Baldrige performance excellence score and
organization’s innovation overall score.
130
Table 51: Linear regression for innovation overall score vs. performance excellence
Analysis of Variance
Source DF Adj SS Adj MS F-Value P-Value
Regression 1 8.8628528 8.86285275 42.14 0.0002
Performance score 1 8.8628528 8.86285275 42.14 0.0002
Error 8 1.6825472 0.21031841
Total 9 10.5454
Model Summary
S R-sq R-sq(adj) R-sq(pred)
0.458604847 84.04% 82.05% 76.22%
Coefficients
Term Coef SE Coef T-Value P-Value VIF
Constant 0.117 0.5306 0.22 0.831
Performance score 0.0052696 0.0008118 6.49 0.0002 1
Regression Equation
Innovation overall score = 0.1170 + 0.0052696 Performance score
The P-value of the linear model equal 0.0002 which is less than 0.05, the model S=
0.4586 and R2 = 84.04% which means that 84.04% of the variation in innovation capability of an
organization is explained by the change in its performance excellence score.
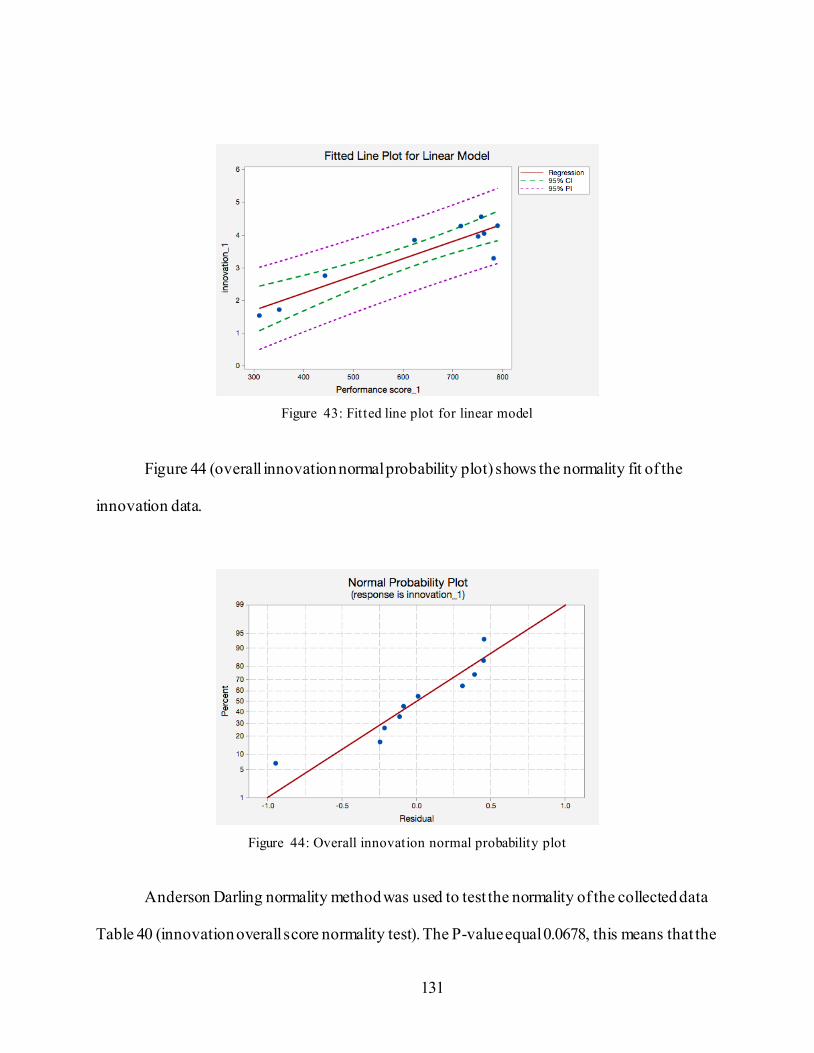
131
Figure 43: Fitted line plot for linear model
Figure 44 (overall innovation normal probability plot) shows the normality fit of the
innovation data.
Figure 44: Overall innovation normal probability plot
Anderson Darling normality method was used to test the normality of the collected data
Table 40 (innovation overall score normality test). The P-value equal 0.0678, this means that the
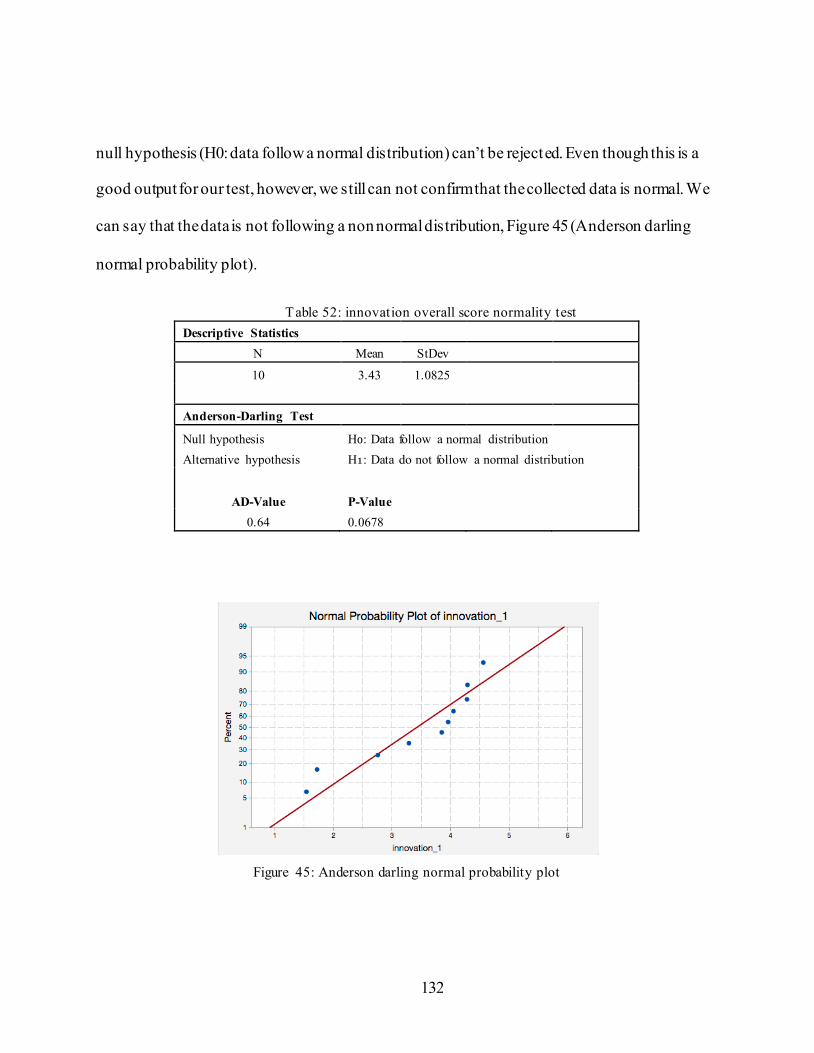
132
null hypothesis (H0: data follow a normal distribution) can’t be rejected. Even though this is a
good output for our test, however, we still can not confirm that the collected data is normal. We
can say that the data is not following a non normal distribution, Figure 45 (Anderson darling
normal probability plot).
Table 52: innovation overall score normality test
Descriptive Statistics
N Mean StDev
10 3.43 1.0825
Anderson-Darling Test
Null hypothesis H₀: Data follow a normal distribution
Alternative hypothesis H₁: Data do not follow a normal distribution
AD-Value P-Value
0.64 0.0678
Figure 45: Anderson darling normal probability plot
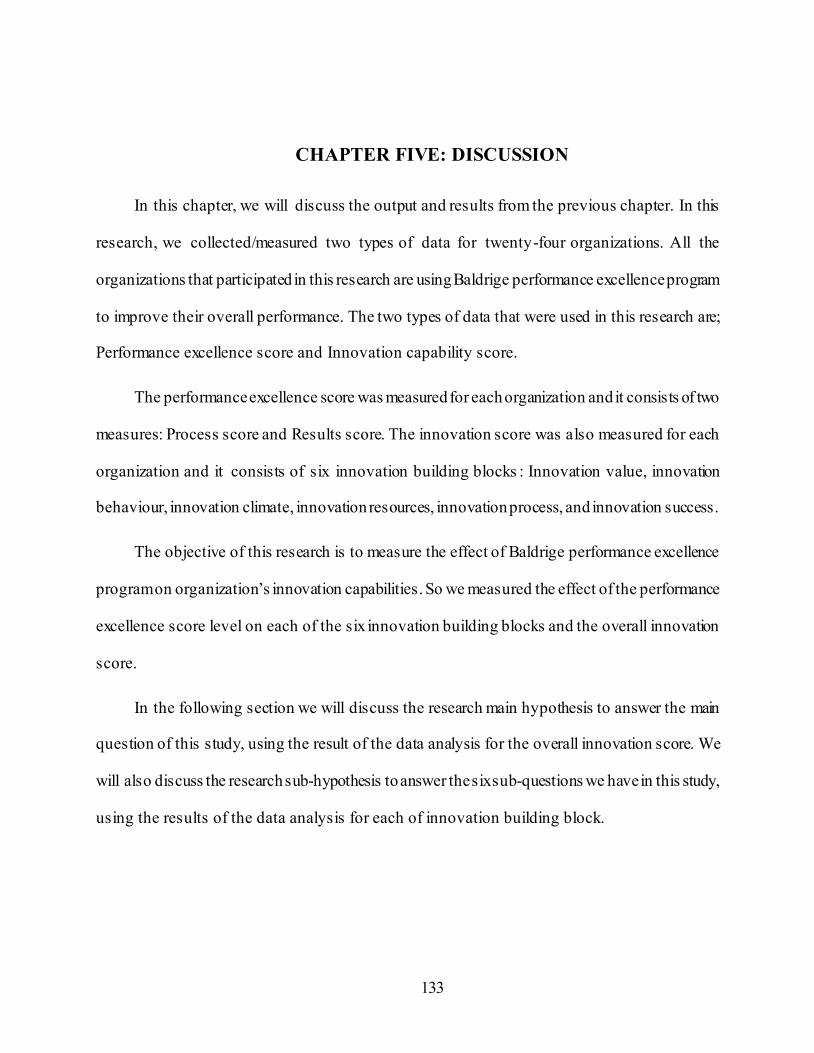
133
CHAPTER FIVE: DISCUSSION
In this chapter, we will discuss the output and results from the previous chapter. In this
research, we collected/measured two types of data for twenty-four organizations. All the
organizations that participated in this research are using Baldrige performance excellence program
to improve their overall performance. The two types of data that were used in this research are;
Performance excellence score and Innovation capability score.
The performance excellence score was measured for each organization and it consists of two
measures: Process score and Results score. The innovation score was also measured for each
organization and it consists of six innovation building blocks : Innovation value, innovation
behaviour, innovation climate, innovation resources, innovation process, and innovation success.
The objective of this research is to measure the effect of Baldrige performance excellence
program on organization’s innovation capabilities. So we measured the effect of the performance
excellence score level on each of the six innovation building blocks and the overall innovation
score.
In the following section we will discuss the research main hypothesis to answer the main
question of this study, using the result of the data analysis for the overall innovation score. We
will also discuss the research sub-hypothesis to answer the six sub-questions we have in this study,
using the results of the data analysis for each of innovation building block.
134
Performance excellence improvement
Before discussing the research main objective results, this study presents an important
finding, which is the confirmation of the positive effect of Baldrige performance excellence
program on organizations overall performance. Performance excellence scores were measured
/collected for twenty-four organizations that implemented one of the three types of Florida
Sterling performance excellence assessment programs; Challenge, GSA, Sustain.
Remember, Challenge assessment program is designed for new organizations that have
no experience with Baldrige program and are in the process of starting their performance
excellence journey. GSA assessment program is designed for more experienced organizations
that mostly went through the Challenge assessment in the past three years and want to further
improve their performance using intensive assessment program. Sustain assessment is for mature
organizations that have done the intensive GSA assessment over the past three years and looking
forward to sustain and keep up with the continuous improvement system in the organization.
Based on ANOVA test that was used in this research, seven organizations conducted the
challenge performance excellence assessment, ten organizations conducted the GSA
performance excellence assessment, and six organizations conducted the Sustain performance
excellence assessment. The results confirm that as the organization go through the different
assessment program; the performance excellence score of the organization gets improved. Figure
46 (Performance Scores Box Plot) shows a positive trend in performance excellence among the
three assessment programs’ groups.
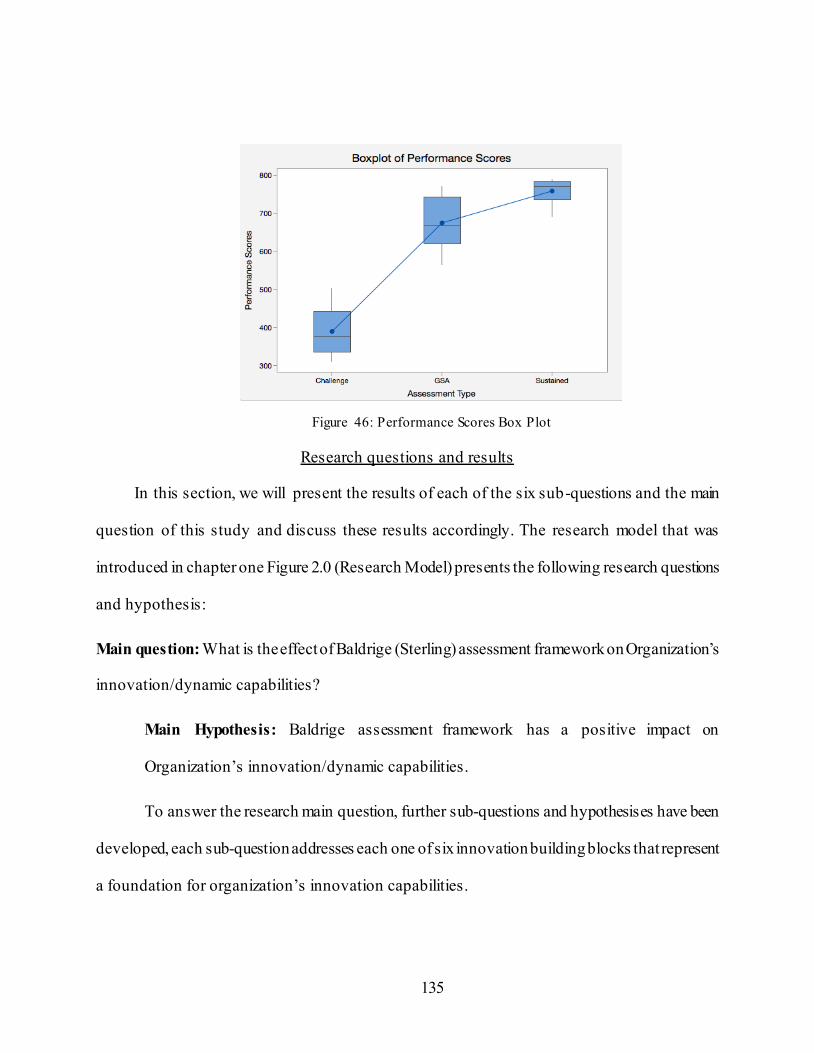
135
Figure 46: Performance Scores Box Plot
Research questions and results
In this section, we will present the results of each of the six sub-questions and the main
question of this study and discuss these results accordingly. The research model that was
introduced in chapter one Figure 2.0 (Research Model) presents the following research questions
and hypothesis:
Main question: What is the effect of Baldrige (Sterling) assessment framework on Organization’s
innovation/dynamic capabilities?
Main Hypothesis: Baldrige assessment framework has a positive impact on
Organization’s innovation/dynamic capabilities.
To answer the research main question, further sub-questions and hypothesises have been
developed, each sub-question addresses each one of six innovation building blocks that represent
a foundation for organization’s innovation capabilities.
136
Sub-question 1: What is the effect of Baldrige assessment framework on Organization’s value for
innovation?
Hypothesis, H1: Baldrige assessment framework has a positive impact on Organization’s
value for innovation.
Sub-question 2: What is the effect of Baldrige assessment framework on Organization’s
behaviour regarding innovation?
Hypothesis, H2: Baldrige assessment framework has a positive impact on Organization’s
behaviour regarding innovation.
Sub-question 3: What is the effect of Baldrige assessment framework on Organization’s
innovation culture?
Hypothesis, H3: Baldrige assessment framework has a positive impact on Organization’s
innovation culture.
Sub-question 4: What is the effect of Baldrige assessment framework on Organization’s
innovation’s resources?
Hypothesis, H4: Baldrige assessment framework has a positive impact on Organization’s
innovation’s resources.
Sub-question 5: What is the effect of Baldrige assessment framework on Organization’s
innovation’s processes?
Hypothesis, H5: Baldrige assessment framework has a positive impact on Organization’s
innovation processes.
137
Sub-question 6: What is the effect of Baldrige assessment framework on Organization’s
innovation measurement?
Hypothesis, H6: Baldrige assessment framework has a positive impact on Organization’s
innovation’s measurement.
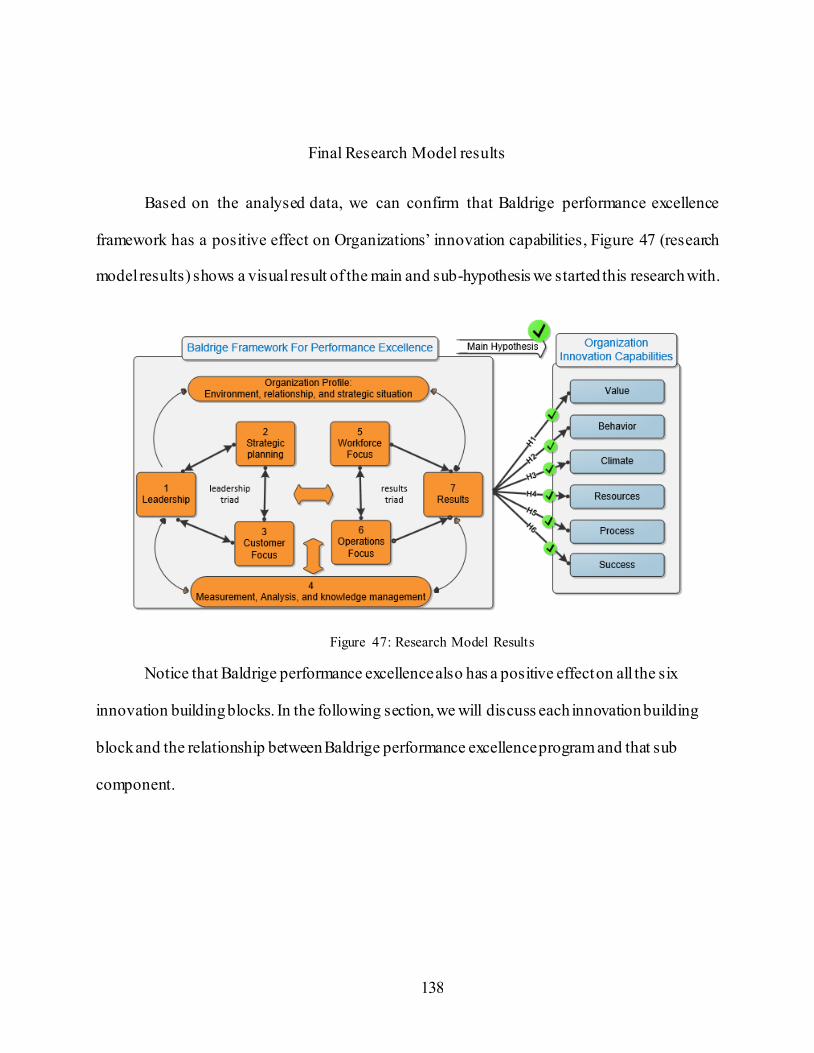
138
Final Research Model results
Based on the analysed data, we can confirm that Baldrige performance excellence
framework has a positive effect on Organizations’ innovation capabilities, Figure 47 (research
model results) shows a visual result of the main and sub-hypothesis we started this research with.
Figure 47: Research Model Results
Notice that Baldrige performance excellence also has a positive effect on all the six
innovation building blocks. In the following section, we will discuss each innovation building
block and the relationship between Baldrige performance excellence program and that sub
component.
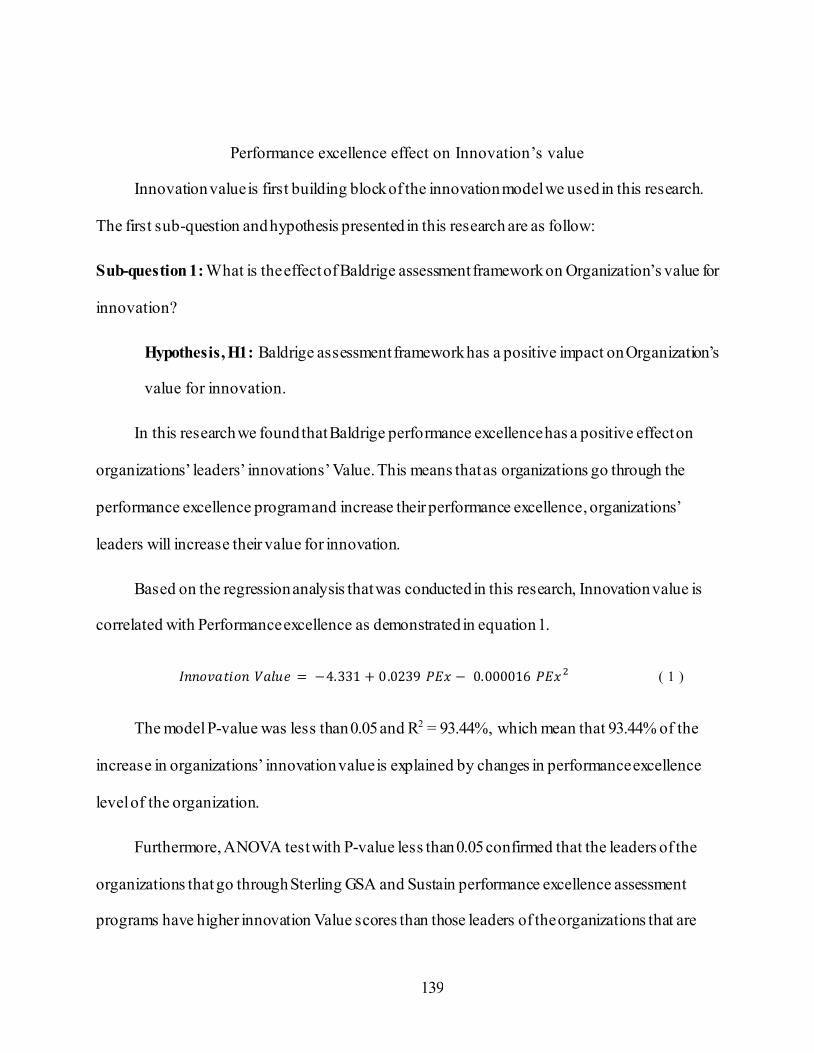
139
Performance excellence effect on Innovation’s value
Innovation value is first building block of the innovation model we used in this research.
The first sub-question and hypothesis presented in this research are as follow:
Sub-question 1: What is the effect of Baldrige assessment framework on Organization’s value for
innovation?
Hypothesis, H1: Baldrige assessment framework has a positive impact on Organization’s
value for innovation.
In this research we found that Baldrige performance excellence has a positive effect on
organizations’ leaders’ innovations’ Value. This means that as organizations go through the
performance excellence program and increase their performance excellence, organizations’
leaders will increase their value for innovation.
Based on the regression analysis that was conducted in this research, Innovation value is
correlated with Performance excellence as demonstrated in equation 1.
𝐼𝑛𝑛𝑜𝑣𝑎𝑡𝑖𝑜𝑛 𝑉𝑎𝑙𝑢𝑒 = −4.331 + 0.0239 𝑃𝐸𝑥 − 0.000016 𝑃𝐸𝑥 2 ( 1 )
The model P-value was less than 0.05 and R2 = 93.44%, which mean that 93.44% of the
increase in organizations’ innovation value is explained by changes in performance excellence
level of the organization.
Furthermore, ANOVA test with P-value less than 0.05 confirmed that the leaders of the
organizations that go through Sterling GSA and Sustain performance excellence assessment
programs have higher innovation Value scores than those leaders of the organizations that are
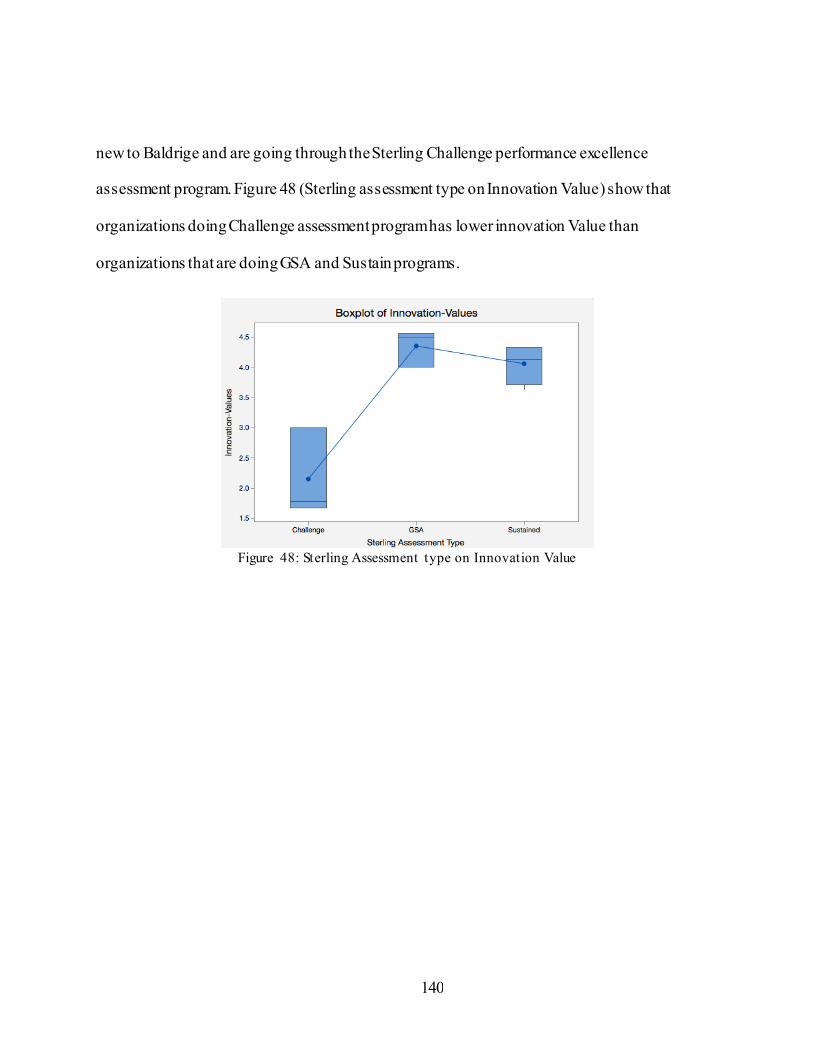
140
new to Baldrige and are going through the Sterling Challenge performance excellence
assessment program. Figure 48 (Sterling assessment type on Innovation Value) show that
organizations doing Challenge assessment program has lower innovation Value than
organizations that are doing GSA and Sustain programs.
Figure 48: Sterling Assessment type on Innovation Value
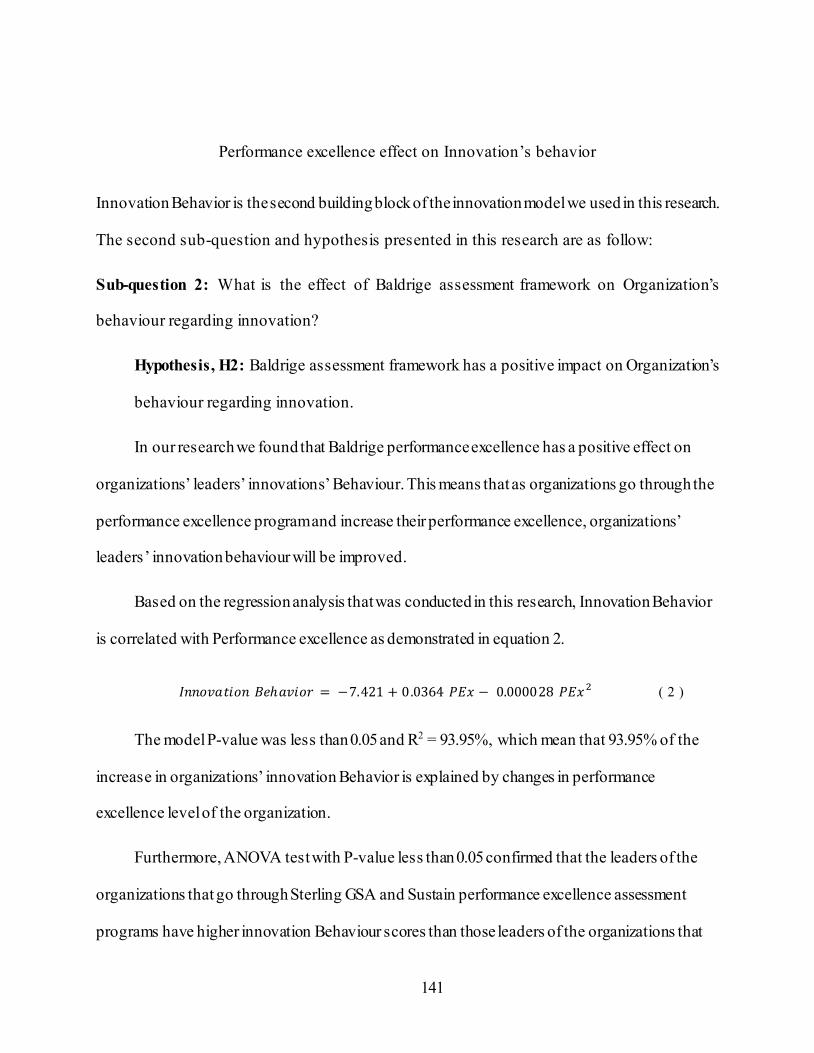
141
Performance excellence effect on Innovation’s behavior
Innovation Behavior is the second building block of the innovation model we used in this research.
The second sub-question and hypothesis presented in this research are as follow:
Sub-question 2: What is the effect of Baldrige assessment framework on Organization’s
behaviour regarding innovation?
Hypothesis, H2: Baldrige assessment framework has a positive impact on Organization’s
behaviour regarding innovation.
In our research we found that Baldrige performance excellence has a positive effect on
organizations’ leaders’ innovations’ Behaviour. This means that as organizations go through the
performance excellence program and increase their performance excellence, organizations’
leaders’ innovation behaviour will be improved.
Based on the regression analysis that was conducted in this research, Innovation Behavior
is correlated with Performance excellence as demonstrated in equation 2.
𝐼𝑛𝑛𝑜𝑣𝑎𝑡𝑖𝑜𝑛 𝐵𝑒ℎ𝑎𝑣𝑖𝑜𝑟 = −7.421 + 0.0364 𝑃𝐸𝑥 − 0.000028 𝑃𝐸𝑥 2 ( 2 )
The model P-value was less than 0.05 and R2 = 93.95%, which mean that 93.95% of the
increase in organizations’ innovation Behavior is explained by changes in performance
excellence level of the organization.
Furthermore, ANOVA test with P-value less than 0.05 confirmed that the leaders of the
organizations that go through Sterling GSA and Sustain performance excellence assessment
programs have higher innovation Behaviour scores than those leaders of the organizations that
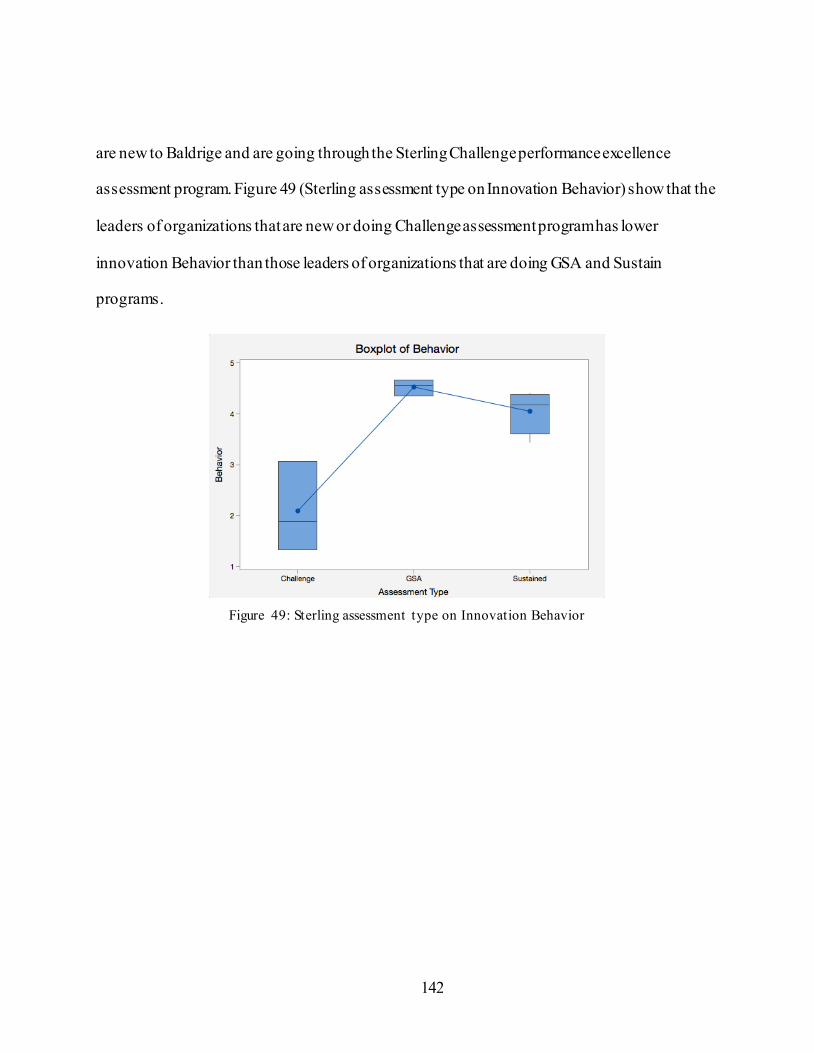
142
are new to Baldrige and are going through the Sterling Challenge performance excellence
assessment program. Figure 49 (Sterling assessment type on Innovation Behavior) show that the
leaders of organizations that are new or doing Challenge assessment program has lower
innovation Behavior than those leaders of organizations that are doing GSA and Sustain
programs.
Figure 49: Sterling assessment type on Innovation Behavior
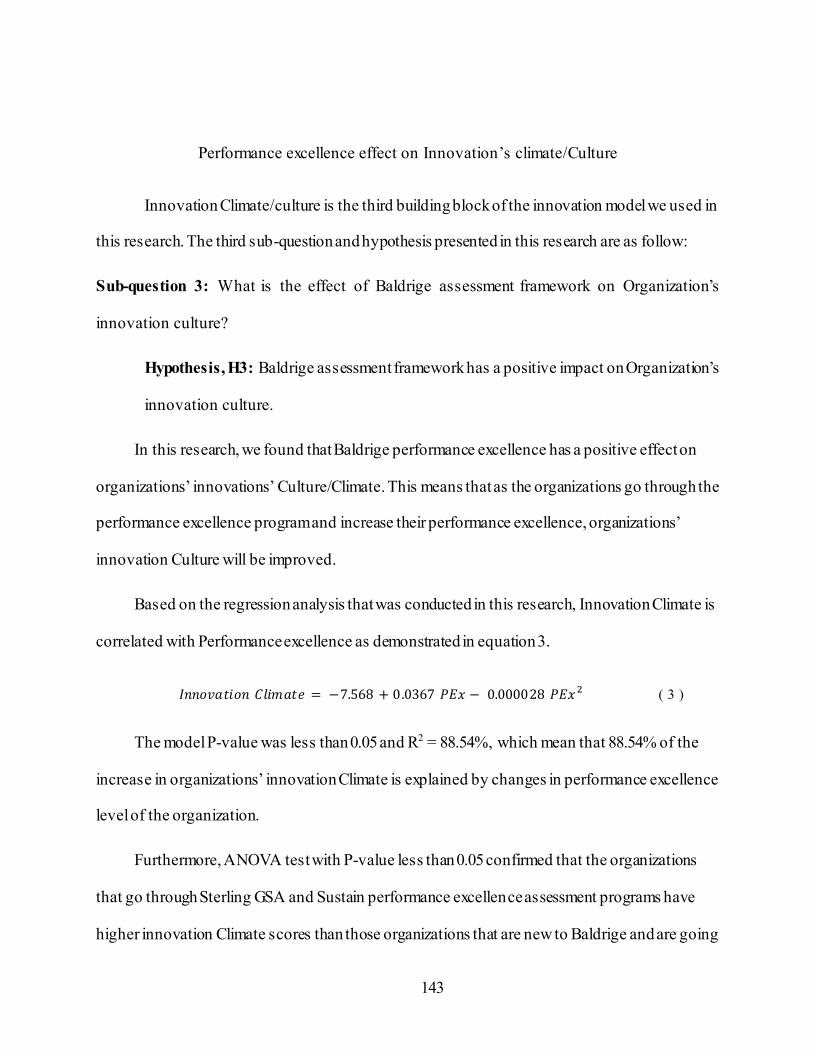
143
Performance excellence effect on Innovation’s climate/Culture
Innovation Climate/culture is the third building block of the innovation model we used in
this research. The third sub-question and hypothesis presented in this research are as follow:
Sub-question 3: What is the effect of Baldrige assessment framework on Organization’s
innovation culture?
Hypothesis, H3: Baldrige assessment framework has a positive impact on Organization’s
innovation culture.
In this research, we found that Baldrige performance excellence has a positive effect on
organizations’ innovations’ Culture/Climate. This means that as the organizations go through the
performance excellence program and increase their performance excellence, organizations’
innovation Culture will be improved.
Based on the regression analysis that was conducted in this research, Innovation Climate is
correlated with Performance excellence as demonstrated in equation 3.
𝐼𝑛𝑛𝑜𝑣𝑎𝑡𝑖𝑜𝑛 𝐶𝑙𝑖𝑚𝑎𝑡𝑒 = −7.568 + 0.0367 𝑃𝐸𝑥 − 0.000028 𝑃𝐸𝑥 2 ( 3 )
The model P-value was less than 0.05 and R2 = 88.54%, which mean that 88.54% of the
increase in organizations’ innovation Climate is explained by changes in performance excellence
level of the organization.
Furthermore, ANOVA test with P-value less than 0.05 confirmed that the organizations
that go through Sterling GSA and Sustain performance excellence assessment programs have
higher innovation Climate scores than those organizations that are new to Baldrige and are going
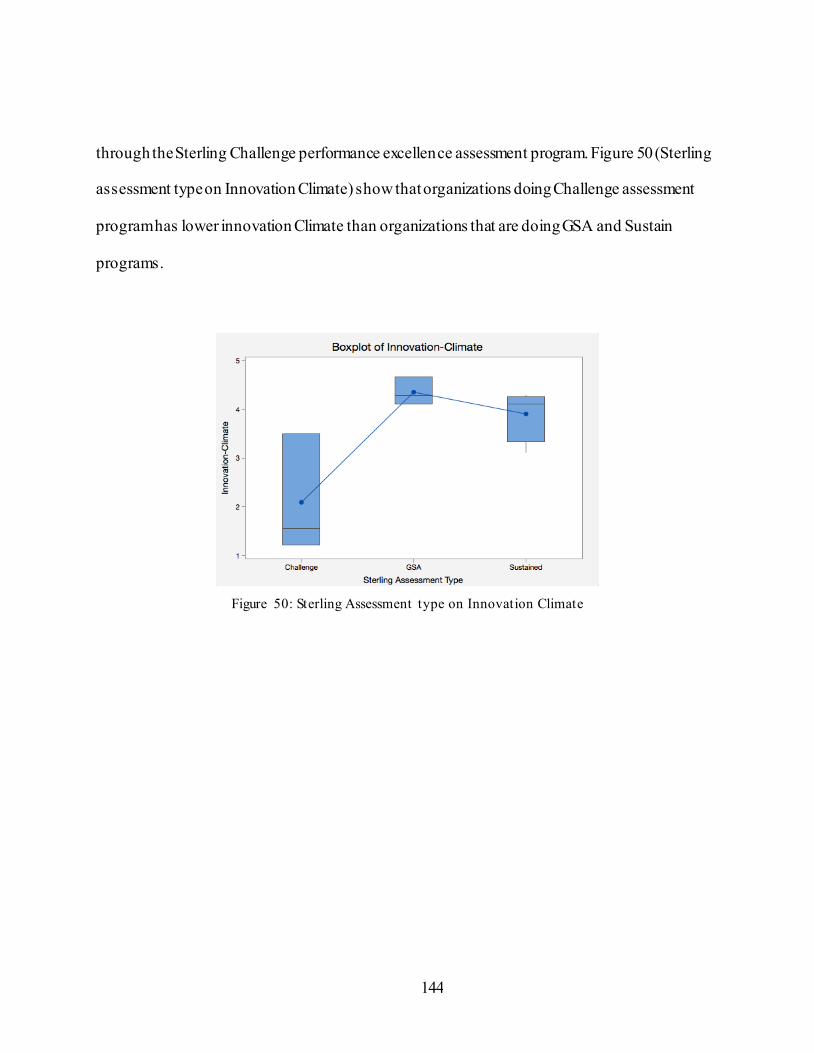
144
through the Sterling Challenge performance excellence assessment program. Figure 50 (Sterling
assessment type on Innovation Climate) show that organizations doing Challenge assessment
program has lower innovation Climate than organizations that are doing GSA and Sustain
programs.
Figure 50: Sterling Assessment type on Innovation Climate
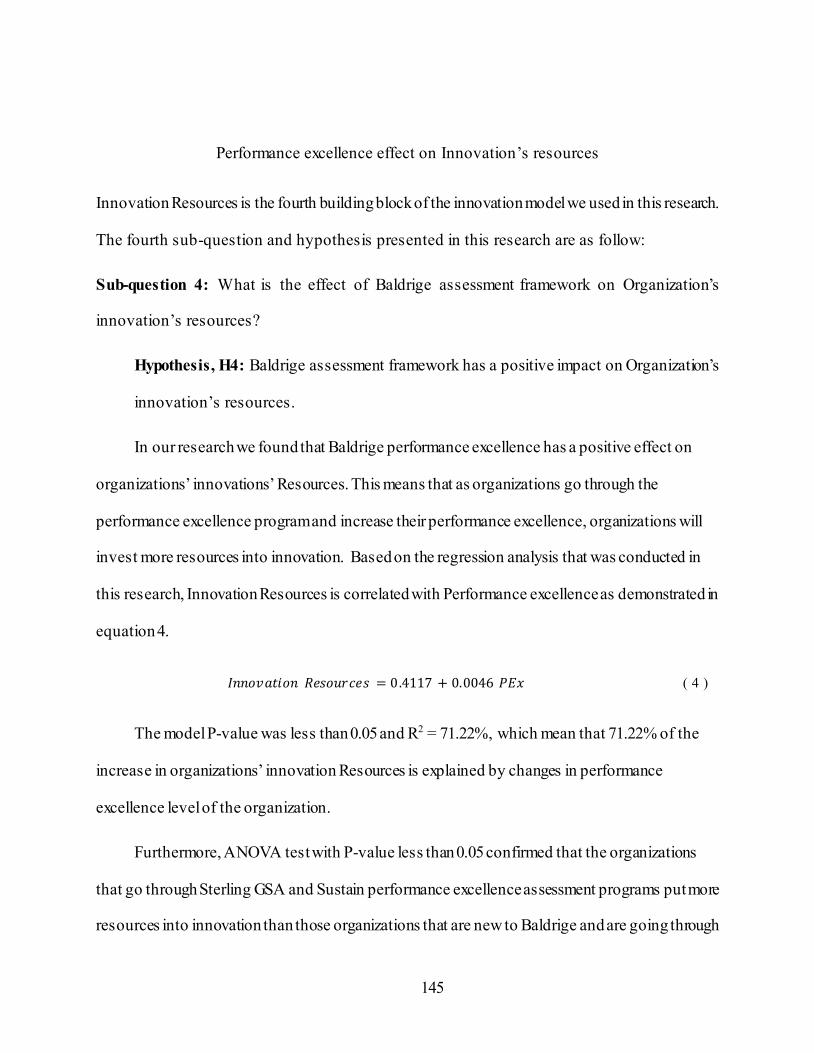
145
Performance excellence effect on Innovation’s resources
Innovation Resources is the fourth building block of the innovation model we used in this research.
The fourth sub-question and hypothesis presented in this research are as follow:
Sub-question 4: What is the effect of Baldrige assessment framework on Organization’s
innovation’s resources?
Hypothesis, H4: Baldrige assessment framework has a positive impact on Organization’s
innovation’s resources.
In our research we found that Baldrige performance excellence has a positive effect on
organizations’ innovations’ Resources. This means that as organizations go through the
performance excellence program and increase their performance excellence, organizations will
invest more resources into innovation. Based on the regression analysis that was conducted in
this research, Innovation Resources is correlated with Performance excellence as demonstrated in
equation 4.
𝐼𝑛𝑛𝑜𝑣𝑎𝑡𝑖𝑜𝑛 𝑅𝑒𝑠𝑜𝑢𝑟𝑐𝑒𝑠 = 0.4117 + 0.0046 𝑃𝐸𝑥 ( 4 )
The model P-value was less than 0.05 and R2 = 71.22%, which mean that 71.22% of the
increase in organizations’ innovation Resources is explained by changes in performance
excellence level of the organization.
Furthermore, ANOVA test with P-value less than 0.05 confirmed that the organizations
that go through Sterling GSA and Sustain performance excellence assessment programs put more
resources into innovation than those organizations that are new to Baldrige and are going through
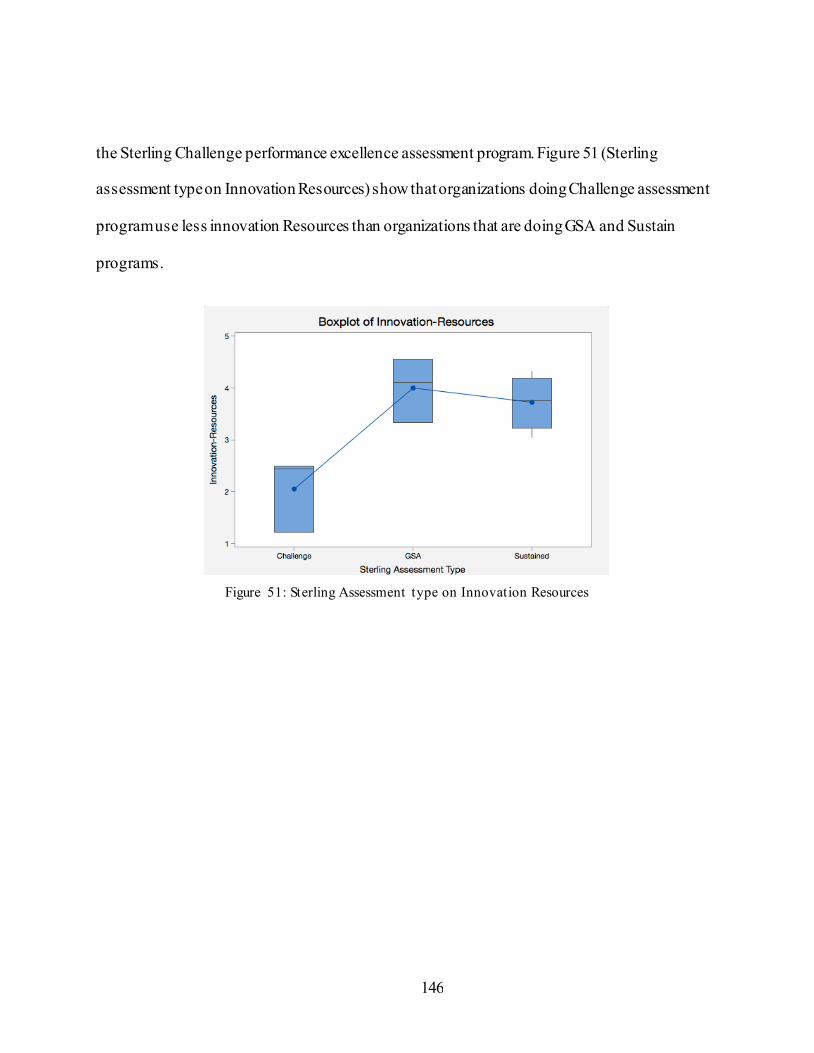
146
the Sterling Challenge performance excellence assessment program. Figure 51 (Sterling
assessment type on Innovation Resources) show that organizations doing Challenge assessment
program use less innovation Resources than organizations that are doing GSA and Sustain
programs.
Figure 51: Sterling Assessment type on Innovation Resources
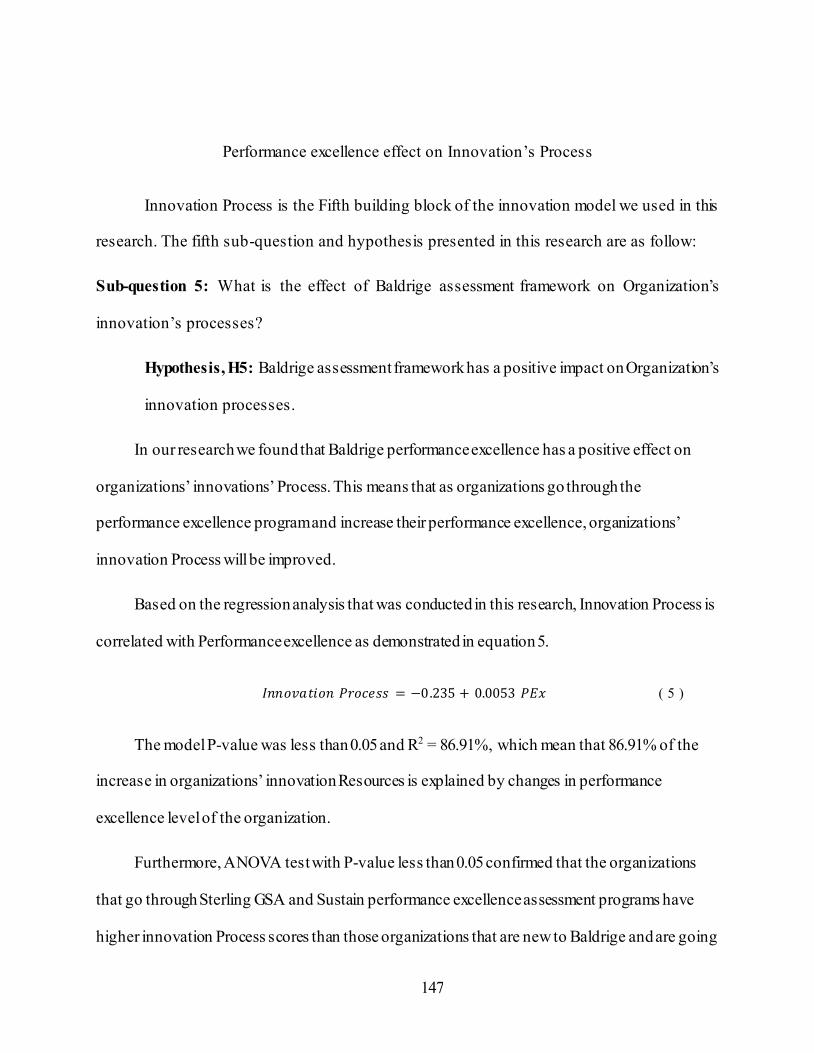
147
Performance excellence effect on Innovation’s Process
Innovation Process is the Fifth building block of the innovation model we used in this
research. The fifth sub-question and hypothesis presented in this research are as follow:
Sub-question 5: What is the effect of Baldrige assessment framework on Organization’s
innovation’s processes?
Hypothesis, H5: Baldrige assessment framework has a positive impact on Organization’s
innovation processes.
In our research we found that Baldrige performance excellence has a positive effect on
organizations’ innovations’ Process. This means that as organizations go through the
performance excellence program and increase their performance excellence, organizations’
innovation Process will be improved.
Based on the regression analysis that was conducted in this research, Innovation Process is
correlated with Performance excellence as demonstrated in equation 5.
𝐼𝑛𝑛𝑜𝑣𝑎𝑡𝑖𝑜𝑛 𝑃𝑟𝑜𝑐𝑒𝑠𝑠 = −0.235 + 0.0053 𝑃𝐸𝑥 ( 5 )
The model P-value was less than 0.05 and R2 = 86.91%, which mean that 86.91% of the
increase in organizations’ innovation Resources is explained by changes in performance
excellence level of the organization.
Furthermore, ANOVA test with P-value less than 0.05 confirmed that the organizations
that go through Sterling GSA and Sustain performance excellence assessment programs have
higher innovation Process scores than those organizations that are new to Baldrige and are going
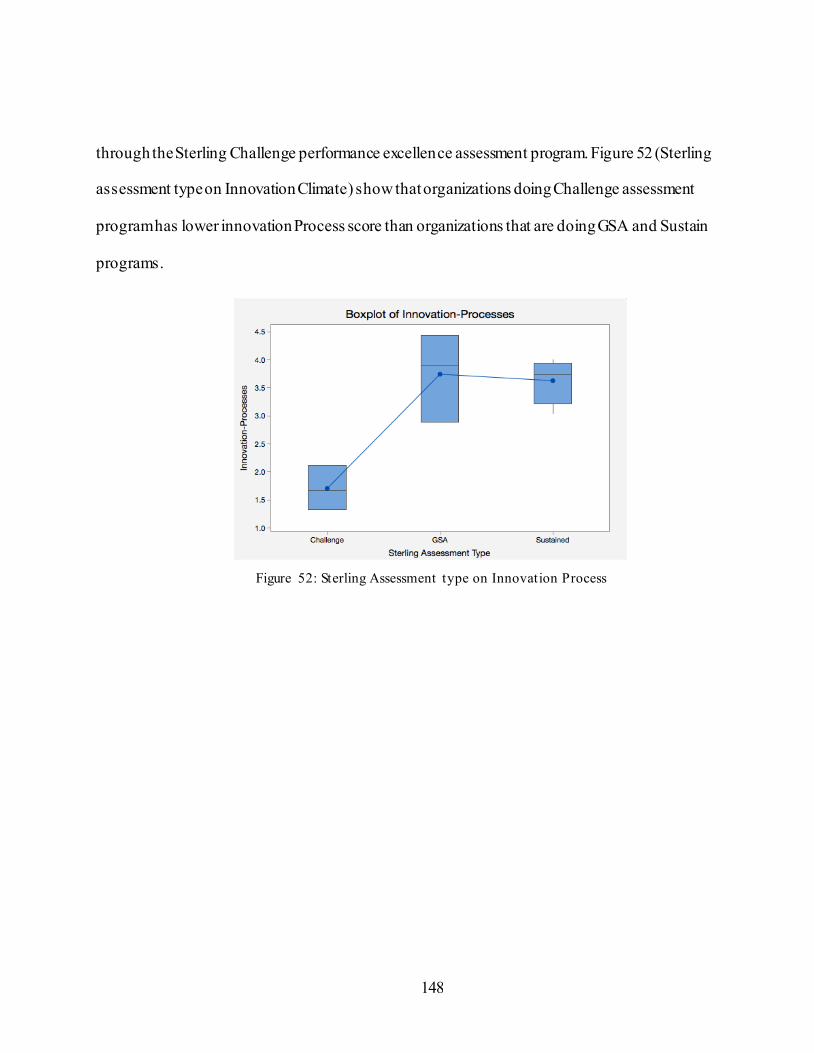
148
through the Sterling Challenge performance excellence assessment program. Figure 52 (Sterling
assessment type on Innovation Climate) show that organizations doing Challenge assessment
program has lower innovation Process score than organizations that are doing GSA and Sustain
programs.
Figure 52: Sterling Assessment type on Innovation Process
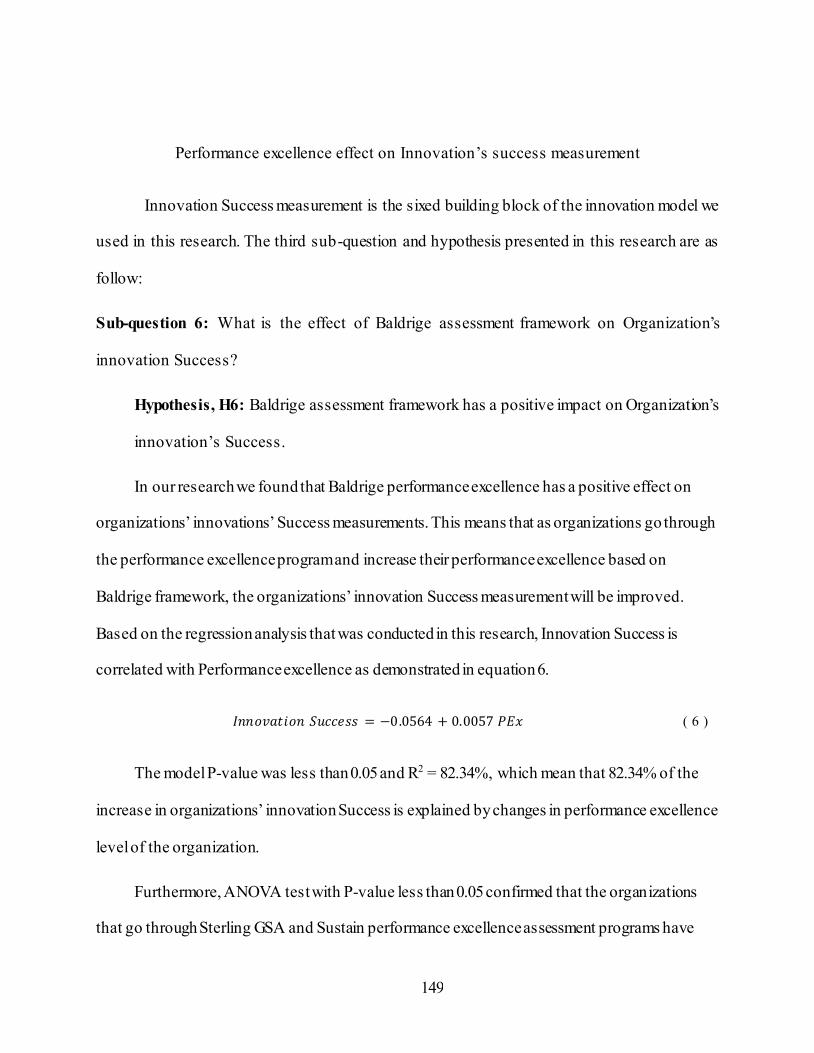
149
Performance excellence effect on Innovation’s success measurement
Innovation Success measurement is the sixed building block of the innovation model we
used in this research. The third sub-question and hypothesis presented in this research are as
follow:
Sub-question 6: What is the effect of Baldrige assessment framework on Organization’s
innovation Success?
Hypothesis, H6: Baldrige assessment framework has a positive impact on Organization’s
innovation’s Success.
In our research we found that Baldrige performance excellence has a positive effect on
organizations’ innovations’ Success measurements. This means that as organizations go through
the performance excellence program and increase their performance excellence based on
Baldrige framework, the organizations’ innovation Success measurement will be improved.
Based on the regression analysis that was conducted in this research, Innovation Success is
correlated with Performance excellence as demonstrated in equation 6.
𝐼𝑛𝑛𝑜𝑣𝑎𝑡𝑖𝑜𝑛 𝑆𝑢𝑐𝑐𝑒𝑠𝑠 = −0.0564 + 0.0057 𝑃𝐸𝑥 ( 6 )
The model P-value was less than 0.05 and R2 = 82.34%, which mean that 82.34% of the
increase in organizations’ innovation Success is explained by changes in performance excellence
level of the organization.
Furthermore, ANOVA test with P-value less than 0.05 confirmed that the organizations
that go through Sterling GSA and Sustain performance excellence assessment programs have
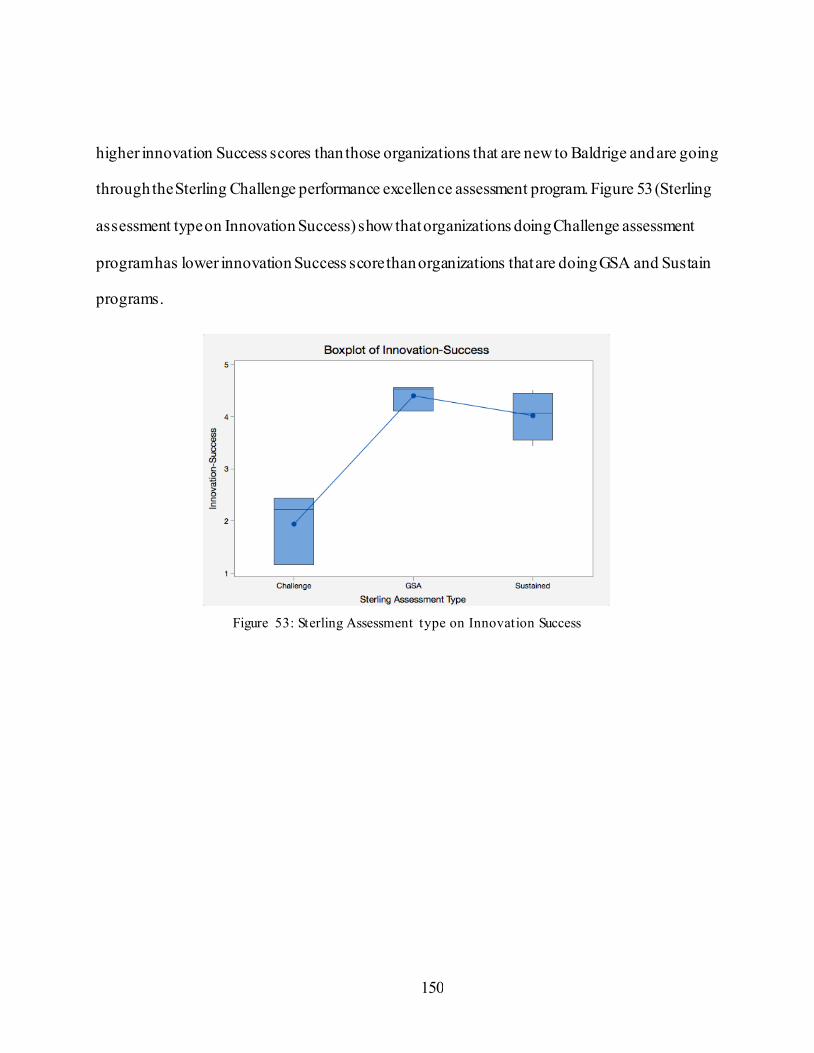
150
higher innovation Success scores than those organizations that are new to Baldrige and are going
through the Sterling Challenge performance excellence assessment program. Figure 53 (Sterling
assessment type on Innovation Success) show that organizations doing Challenge assessment
program has lower innovation Success score than organizations that are doing GSA and Sustain
programs.
Figure 53: Sterling Assessment type on Innovation Success
151
Performance excellence effect on overall Innovation capabilities
Overall Innovation capabilities score is the average score of the six building blocks of the
innovation model we used in this research. The main question and hypothesis presented in this
research are as follow:
Main question: What is the effect of Baldrige (Sterling) assessment framework on Organization’s
innovation/dynamic capabilities?
Main Hypothesis: Baldrige assessment framework has a positive impact on
Organization’s innovation/dynamic capabilities.
The overall innovation capabilities score is calculated based on the average of the six
innovations’ building blocks; innovation Value, innovation behaviour, innovation
culture/Climate, innovation resources, innovation processes, and innovation success. Each
building block addresses three factors, and each factor consists of three elements. A total of 54
questions are used to assess an organization’s innovation capabilities scores. This reflects a 360
assessment to innovation within the organization.
In our research we found that Baldrige performance excellence has a positive effect on the
organizations’ overall innovation’s capabilities. This means that as the organizations increase
their performance excellence based on Baldrige framework, the organizations’ overall innovation
capabilities will be improved.
Based on the regression analysis, organizations’ Innovation’s capabilities is correlated with
Performance excellence as demonstrated in equation 7.
𝐼𝑛𝑛𝑜𝑣𝑎𝑡𝑖𝑜𝑛 𝐶𝑎𝑝𝑎𝑏𝑖𝑙𝑖𝑡𝑖𝑒𝑠 = 0.117 + 0.00527 𝑃𝐸𝑥 ( 7 )
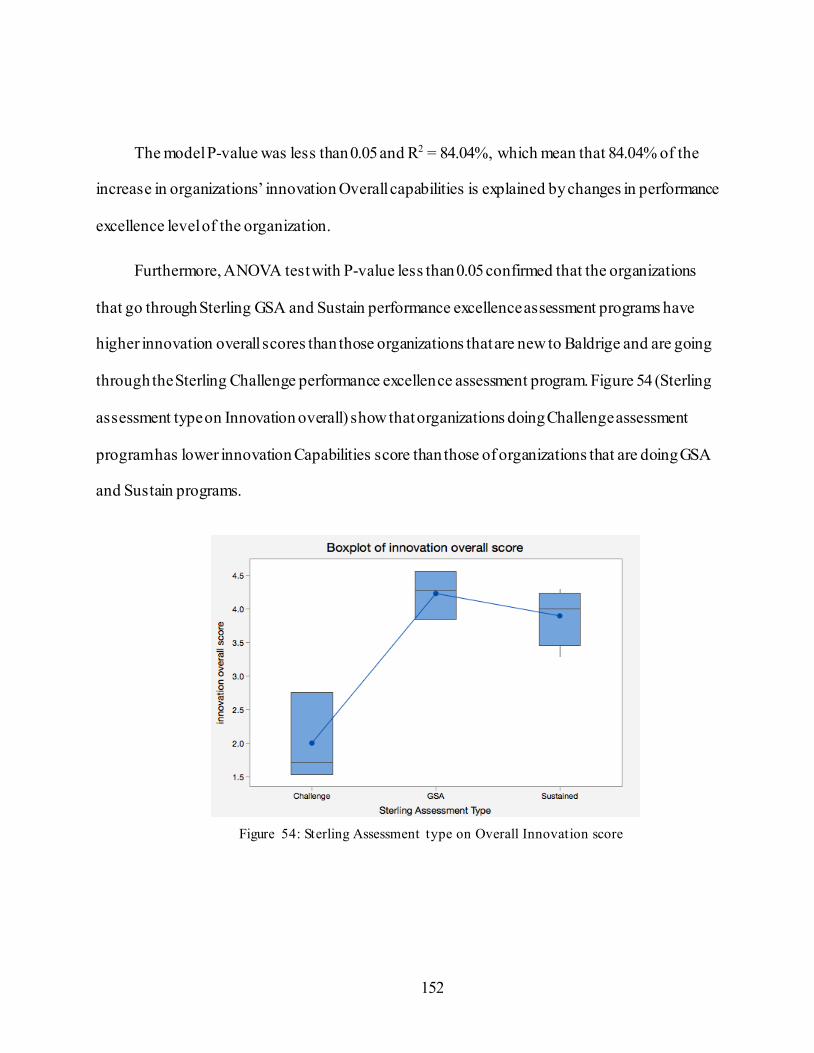
152
The model P-value was less than 0.05 and R2 = 84.04%, which mean that 84.04% of the
increase in organizations’ innovation Overall capabilities is explained by changes in performance
excellence level of the organization.
Furthermore, ANOVA test with P-value less than 0.05 confirmed that the organizations
that go through Sterling GSA and Sustain performance excellence assessment programs have
higher innovation overall scores than those organizations that are new to Baldrige and are going
through the Sterling Challenge performance excellence assessment program. Figure 54 (Sterling
assessment type on Innovation overall) show that organizations doing Challenge assessment
program has lower innovation Capabilities score than those of organizations that are doing GSA
and Sustain programs.
Figure 54: Sterling Assessment type on Overall Innovation score
153
CHAPTER SIX: SUMMARY & CONCLUSIONS
Building innovation and Dynamic capabilities within an organization requires good
understanding and strong believes by leaders in innovation. Those leaders not only need to talk
about and discuss innovation in their meetings, but they also need to show that they truly value
innovation through their behaviors and actions. Leaders’ values for innovation are reflected in
how much of their personal time are dedicated for innovation and are reflected in how much
dollar they spend in innovation projects and efforts.
To instill innovation within organizations, leaders have to make innovation part of the
organization strategy for success. Financial measures should be in place to track revenue from
new innovative products and services that have been developed in the last three years for
example. Customers’ feedback and satisfaction with the organization’s innovation projects
should be measured and tracked. Continuous improvement to innovation process is critical to
increase productivity and efficiency through reducing cycle time and failures. Finally, leaders
should promote creativity, continuous learning and experimentation with new ideas and solutions
to create a culture of entrepreneurship within the organization.
The more value put into innovation, the more impact the leaders will have on people’s
behavior within the organization. Innovation behavior is manifested in how leaders and
employees react towards cannibalizing existing products in favor of new ones. Modeling the
right behavior by leaders translate values into actions that inspire and encourage middle
management and employees to take initiatives, overcome obstacles and continue experimenting
154
with creative ideas. Leaders’ behaviors toward innovation is also reflected in influencing,
coaching, and supporting employees’ creative ideas and innovation efforts.
A culture of innovation is required within the organization in order to create a safe,
learning, and fun environment for employees to search for new opportunities that can be further
tested and then converted into new products, services or business model. Leaders are directly and
solely responsible for building this culture within the organization, Leaders must provide
required resources such as time, money and space for employees to become creative and
innovate. Sharing internal knowledge and providing access to experts and external information
help employees overcome obstacles and continue their innovation efforts.
Once leaders put value in innovation and reflect this in action through providing required
resources and creating a culture that nurture creativity and encourage innovation, then a
systematic process for innovation is required to guide and help employees focus on real
opportunities, test and validate their ideas, then experiment with the solutions and get customers
feedback to further tune and improve the output. Most importantly, kill unworkable ideas as
early as possible to avoid waste and increase efficiency in developing innovation. A clear
process for innovation not only will help employees understand the steps they need to take to test
and validate their ideas, but also help middle management and leaders support the outcome of the
process and provide the means to further develop and market the solution.
Finally, in order to build the required innovation capabilities and continue improving it ,
then hard evidence of the efforts and results must be presented; this is where measurement of the
innovation efforts should take place at different points of the process. Collecting data on the
155
organization’s innovation input, innovation process and innovation output will help
organizations further tune and improve innovation capabilities.
It takes huge efforts and time for leaders to develop the required innovation capabilities
within their organizations. The problem is in the absence of a clear framework that can help the
organization takes the right steps in building the required capabilities . Sometime organizations
lack the proper ordinary/operational capabilities that enable them to perform their current on-
going activities using existing skills and techniques to maintain the status quo of the business,
good operational capabilities enable organizations perform current activities efficiently and
effectively.
Without these basic (ordinary/operational) capabilities in place, it’s hard for
organizations to develop the required advanced capabilities (Dynamic/innovative) for innovation.
Proper Leadership, good strategy development and implementation, Deep understanding of
customers needs, process management and improvement, ability to acquire talents and empower
them, and ability to measure and develop a knowledge management system, all these basic
capabilities are crucial for any business to maintain good performance. Having these basic
capabilities in place will save organizations time and money to invest in developing the required
advance capabilities (Dynamic/innovation) for innovation.
These basic capabilities will also provide the support required for continues innovation.
The more you know your customers the more you can develop innovative solutions for them, the
more you know your employees the more you can utilize their skills, knowledge and creative
ideas, the more you know and continue improve your processes the more innovation can be
156
introduced internally, the more you know how to measure and track your performance the more
efficient the organization will be in innovation.
This dissertation study suggests using Baldrige performance excellence program to help
organizations systematically develop the advanced (innovation/dynamic) capabilities that is
required for innovation.
Baldrige Performance Excellence program consist of a set of assessment criteria that
provides guidance and vehicle for organizational change. Baldrige program help senior
management develop internal improvement system that can be used to target the various
organization’s systems and processes. Organizations use this integrated framework to improve
their Basic (Ordinary/operational) capabilities to become more efficient and effective. The new
updated criteria contain innovation related questions that can help organizations’ leaders
systematically assess current innovation performance and develop the required advanced
(dynamic/innovation) capabilities to improve this performance.
In this research, Twenty-four organizations, that implemented Baldrige Performance
Excellence program, were studied to measure the effect of Baldrige implementation on the
organizations’ innovation/dynamic capabilities. Two types of data measurements were
calculated/collected from the organizations: Performance excellence scores and Innovation
capabilities scores.
These twenty-four organizations worked with Florida Sterling Council, the approved
local state version of the US National Malcolm Baldrige Quality Award program, to implement
the Baldrige performance excellence program.
157
Florida Sterling Council developed several performance excellence assessment programs
based on Baldrige criteria to help organizations in various stages of their performance journey.
Three specific assessment programs were utilized by the twenty-four participating organizations.
These assessment programs are: Sterling Challenge, Sterling GSA, and Sterling Sustained.
Sterling Challenge assessment program is used by new organizations that are new to
Baldrige performance excellence criteria; eight organizations of the twenty-four were
participating in Sterling Challenge assessment program. Sterling GSA assessment program is
used by mature organizations that are familiar with Baldrige performance excellence criteria; ten
organizations of the twenty-four were participating in Sterling GSA assessment program.
Sterling Sustain assessment program is used by more mature organizations that went through
GSA assessment before and are fully familiar with Baldrige performance excellence criteria; six
organizations of the twenty-four were participating in Sterling Sustained assessment program.
In this research, each assessment program was treated as a separate group with the
Challenge assessment program being the control group. ANOVA analysis was used to compare
the mean performance scores of the three different performance excellence assessment programs.
The outcome shows a statistical difference among the three groups, which proof that
implementing Baldrige performance excellence program does improve organization performance
excellence. This improvement targets the basic (operational/ordinary) capabilities that are needed
for effective and efficient operation.
Further to the calculated performance excellence scores for each of the twenty-four
organizations, the innovation capabilities of these organizations were also measured through an
158
online survey. Eleven organizations completed the survey, four from the challenge group, three
from the GSA group and four from the Sustained group. The survey examines six foundational
building blocks for innovation capabilities: Innovation-value, Innovation-Behavior, Innovation-
Culture, Innovation-Resources, Innovation-Process, and Innovation Success. Each of the six
innovation building block consist of three factors and each factor consist of three elements for a
total of fifty-four questions included in this survey.
ANOVA statistical analysis was used to assess the difference of mean innovation
capability score among the three assessment groups with the Challenge group being the control
group. The outcome shows a statistical difference among the three groups, which proof that
implementing Baldrige performance excellence positively impact organization Advanced
(innovation/dynamic) capabilities.
Finally, regression analysis was used to measure the correlation between the
organizations’ performance excellence levels and the different innovation capabilities building
blocks including the overall innovation capability level. This help us further understand the
impact of Baldrige Excellence framework on the different innovation capabilities. The outcome
shows that all six sub-hypotheses were supported and that Baldrige Excellence framework has a
positive impact on all the six-innovation building blocks.
159
Key Findings
Several key findings were reached in this dissertation study that went beyond the scope of
this research, which was focusing on measuring the effect of Baldrige performance excellence
program on Organizations’ dynamic/innovation capabilities. These findings can be summarized
as follow:
Key Finding 1: This dissertation research studied the effect of Baldrige performance
excellence on leaders’ value for innovation. The outcome confirmed that as an organization
continue utilize the Baldrige framework to improve its performance excellence, the leaders’
value for innovation in this organization increases. When the leaders have strong value for
innovation they will focus more on building the required capabilities within their organizations
to become innovative.
Key Finding 2: This dissertation research studied the effect of implementing Baldrige
performance excellence on leaders’ behavior when it comes to innovation. The outcome
confirmed that as an organization continue utilize the Baldrige framework to improve its
performance excellence, the behavior of those leaders improves from being risk avoidance to
become more accommodating to risk and uncertainty that accompanies innovation efforts.
Key Finding 3: This dissertation research studied the effect of implementing Baldrige
performance excellence on organization’s innovation culture. The outcome confirmed that as the
organization continue utilize the Baldrige framework to improve its performance excellence, the
organization will have better culture for innovation. Since the leaders of high performing
organizations have more appreciation for innovation and show positive attitude and behavior
160
towards risks and uncertainties, they will build a safe environment that nurture the
entrepreneurial culture within the organization to help employees take actions, continue learning,
and experimenting with creative ideas.
Key Finding 4: This dissertation research studied the effect of implementing Baldrige
performance excellence on organization’s innovation resources. The outcome confirmed that as
the organization continue utilize the Baldrige framework to improve its performance excellence,
the organization will invest more resources into innovation efforts. The effect of more value,
positive behavior, and better Culture for innovation is reflected on the how leaders invest time
and money in innovation. This will improve how the organization invest in innovation and hence
increase its capabilities in Innovation.
Key Finding 5: This dissertation research studied the effect of implementing Baldrige
performance excellence on organization’s innovation process. The outcome confirmed that as the
organization continue utilize the Baldrige framework to improve its internal processes, the
organization will develop and continue improve its process for innovation. In fact, the ADLI
(Approach, Deploy, Learning, and Integration) four-dimensional assessment model that is part of
Baldrige performance excellence assessment program will help in ensuring that the innovation
process is fully deployed across the organization and fully integrated with the organization goals
and objectives.
Key Finding 6: This dissertation research studied the effect of implementing Baldrige
performance excellence on organization’s innovation success measurement. The outcome
confirmed that as the organization continue utilize the Baldrige framework to improve its
161
measurement system and results, the organization will have better understanding for innovation
outcomes throughout the process and will continue measure its innovation efforts for tuning,
feedback and alignment. Baldrige uses LeTCI four-dimensional assessment model to measure
results will improve how organizations measure their innovation success and benchmark with
leaders in the market.
Key Finding 7: The study also concludes that Baldrige performance excellence does
improve the organizations advanced (dynamic/innovation) capabilities. Organizations innovation
capabilities were assessed at six areas with the focus on leaders’ ability to lead innovation
efforts, also their ability to create the required culture to nurture creative ideas and support
employees with required resources. In this research, organizations with higher performance
excellence scores have higher innovation capabilities measure in all six-innovation building
blocks based on the assessed survey. This means that the more the organizations focus on
implementing Baldrige performance excellence program and improve their performance, the
more capacity “Innovation/dynamic capability” will be developed within these organizations to
innovate.
Key Finding 8: this research study confirmed that implementing Baldrige performance
excellence framework does help improve organizations overall performance. The higher
performance is a direct outcome of improving internal processes and systems and increasing
alignment throughout the organization, which is also reflected on the organization’s results.
Organization that implemented Baldrige performance excellence will have higher capacity to
perform day-to-day work more effectively and efficiently. As mentioned in the literature review,
162
the capacity to do day-to-day work with existing skills and techniques is defined as
operational/ordinary capability, which I defined here as the basic capabilities. This dissertation
study confirmed that Implementing Baldrige performance excellence does improve
organization’s Basic (operational/ordinary) capabilities. This key finding supports pervious
scholars studies that confirms the benefits of implementing Baldrige Excellence Framework.
Most of the studies focused mainly on financial and market outcome from implementing
Baldrige, In this research the focus was on the performance excellence improvement, which
covers the organization processes and their results, financial results is one outcome of many
other outcomes assessed in Baldrige.
With all these key findings, we can conclude that implementing Baldrige performance
excellence program as a framework not only will improve organizations’ basic
(operational/ordinary) capabilities to become more efficient and effective in using its resources,
but it will also help the organizations develop the required advanced (innovation/dynamic)
capabilities systematically and continue improving these capabilities to stay innovative .
Future work
This is a cross sectional study with twenty-four organizations participating in the
research. Perhaps a longitudinal study over the cycle of the performance excellence journey is
needed to focus on each innovation building block and develop continues measures for the effect
of Baldrige performance excellence program on organization’s dynamic/innovation capabilities.
A future work could also focus on developing an innovation performance measurement within
163
the Baldrige Excellence Framework. Which will help organizations better understand and focus
on innovation when their innovation performance is translated into numbers.

164
APPENDIX A: INNOVATION SURVEY QUESTIONNAIRES
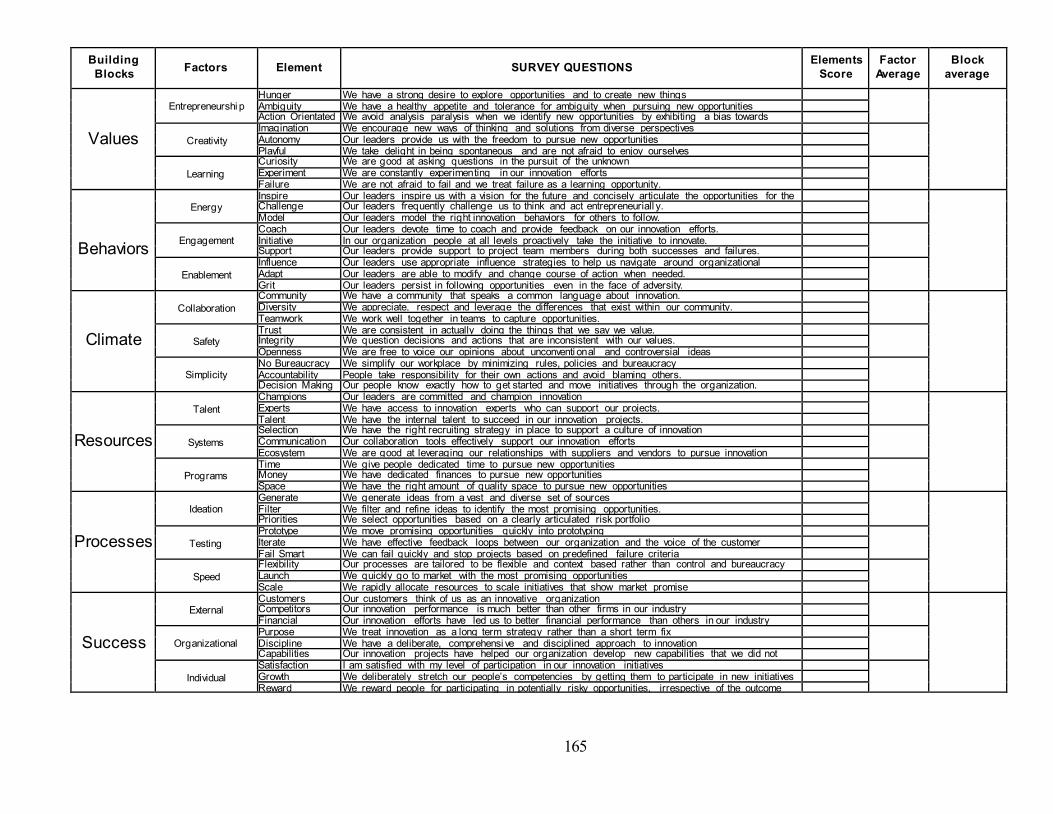
165
Building
Blocks Factors Element SURVEY QUESTIONS
Elements
Score
Factor
Average
Block
average
Values
Entrepreneurshi p
Hunger We have a strong desire to explore opportunities and to create new things
Ambiguity We have a healthy appetite and tolerance for ambiguity when pursuing new opportunities Action Orientated We avoid analysis paralysis when we identify new opportunities by exhibiting a bias towards
action
Creativity
Imagination We encourage new ways of thinking and solutions from diverse perspectives
Autonomy Our leaders provide us with the freedom to pursue new opportunities Playful We take delight in being spontaneous and are not afraid to enjoy ourselves
Learning
Curiosity We are good at asking questions in the pursuit of the unknown
Experiment We are constantly experimenting in our innovation efforts Failure We are not afraid to fail and we treat failure as a learning opportunity.
Behaviors
Energy
Inspire Our leaders inspire us with a vision for the future and concisely articulate the opportunities for the
organisation
Challenge Our leaders frequently challenge us to think and act entrepreneuriall y. Model Our leaders model the right innovation behaviors for others to follow.
Engagement
Coach Our leaders devote time to coach and provide feedback on our innovation efforts. Initiative In our organization people at all levels proactively take the initiative to innovate.
Support Our leaders provide support to project team members during both successes and failures.
Enablement
Influence Our leaders use appropriate influence strategies to help us navigate around organizational
obstacles.
Adapt Our leaders are able to modify and change course of action when needed. Grit Our leaders persist in following opportunities even in the face of adversity.
Climate
Collaboration
Community We have a community that speaks a common language about innovation.
Diversity We appreciate, respect and leverage the differences that exist within our community. Teamwork We work well together in teams to capture opportunities.
Safety
Trust We are consistent in actually doing the things that we say we value. Integrity We question decisions and actions that are inconsistent with our values.
Openness We are free to voice our opinions about unconventi onal and controversial ideas
Simplicity No Bureaucracy We simplify our workplace by minimizing rules, policies and bureaucracy
Accountability People take responsibility for their own actions and avoid blaming others. Decision Making Our people know exactly how to get started and move initiatives through the organization.
Resources
Talent
Champions Our leaders are committed and champion innovation
Experts We have access to innovation experts who can support our projects. Talent We have the internal talent to succeed in our innovation projects.
Systems
Selection We have the right recruiting strategy in place to support a culture of innovation
Communication Our collaboration tools effectively support our innovation efforts Ecosystem We are good at leveraging our relationships with suppliers and vendors to pursue innovation
Programs
Time We give people dedicated time to pursue new opportunities Money We have dedicated finances to pursue new opportunities
Space We have the right amount of quality space to pursue new opportunities
Processes
Ideation
Generate We generate ideas from a vast and diverse set of sources
Filter We filter and refine ideas to identify the most promising opportunities. Priorities We select opportunities based on a clearly articulated risk portfolio
Testing
Prototype We move promising opportunities quickly into prototyping
Iterate We have effective feedback loops between our organization and the voice of the customer Fail Smart We can fail quickly and stop projects based on predefined failure criteria
Speed
Flexibility Our processes are tailored to be flexible and context based rather than control and bureaucracy
based
Launch We quickly go to market with the most promising opportunities Scale We rapidly allocate resources to scale initiatives that show market promise
Success
External
Customers Our customers think of us as an innovative organization
Competitors Our innovation performance is much better than other firms in our industry Financial Our innovation efforts have led us to better financial performance than others in our industry
Organizational
Purpose We treat innovation as a long term strategy rather than a short term fix Discipline We have a deliberate, comprehensi ve and disciplined approach to innovation
Capabilities Our innovation projects have helped our organization develop new capabilities that we did not
have three years ago
Individual
Satisfaction I am satisfied with my level of participation in our innovation initiatives
Growth We deliberately stretch our people’s competencies by getting them to participate in new initiatives Reward We reward people for participating in potentially risky opportunities, irrespective of the outcome

166
APPENDIX B: BALDRIGE ASSESSMENT CRITERIA
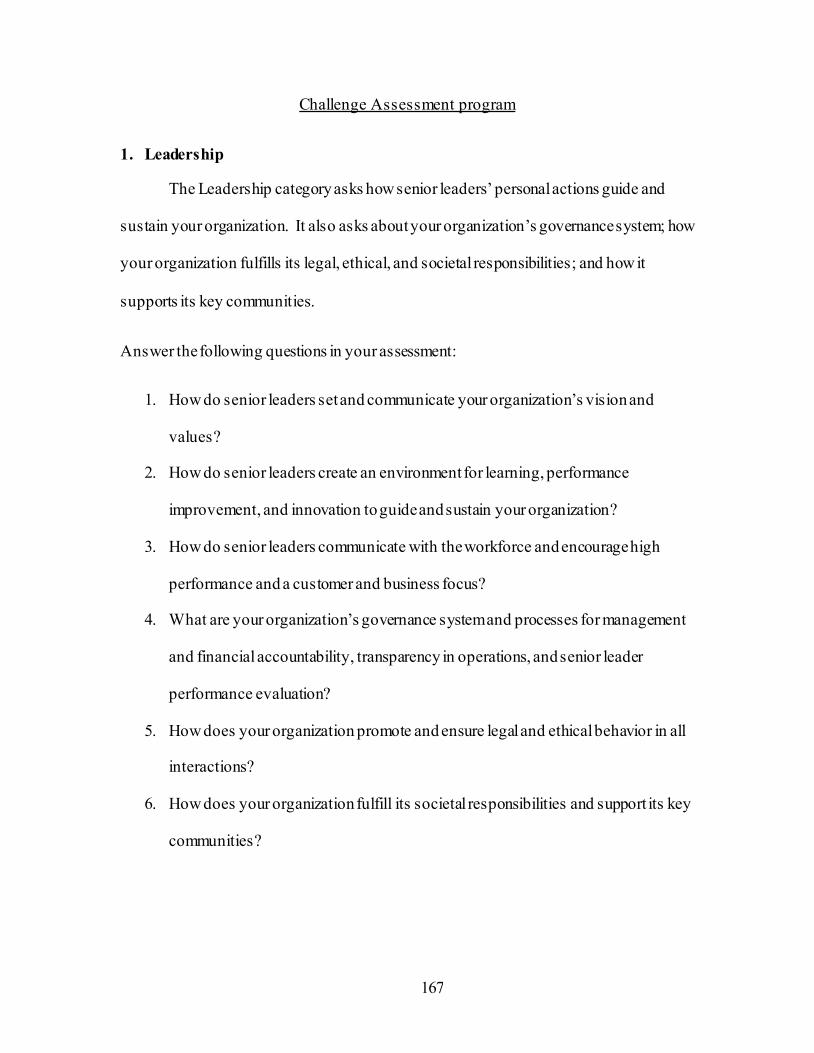
167
Challenge Assessment program
1. Leadership
The Leadership category asks how senior leaders’ personal actions guide and
sustain your organization. It also asks about your organization’s governance system; how
your organization fulfills its legal, ethical, and societal responsibilities; and how it
supports its key communities.
Answer the following questions in your assessment:
1. How do senior leaders set and communicate your organization’s vision and
values?
2. How do senior leaders create an environment for learning, performance
improvement, and innovation to guide and sustain your organization?
3. How do senior leaders communicate with the workforce and encourage high
performance and a customer and business focus?
4. What are your organization’s governance system and processes for management
and financial accountability, transparency in operations, and senior leader
performance evaluation?
5. How does your organization promote and ensure legal and ethical behavior in all
interactions?
6. How does your organization fulfill its societal responsibilities and support its key
communities?
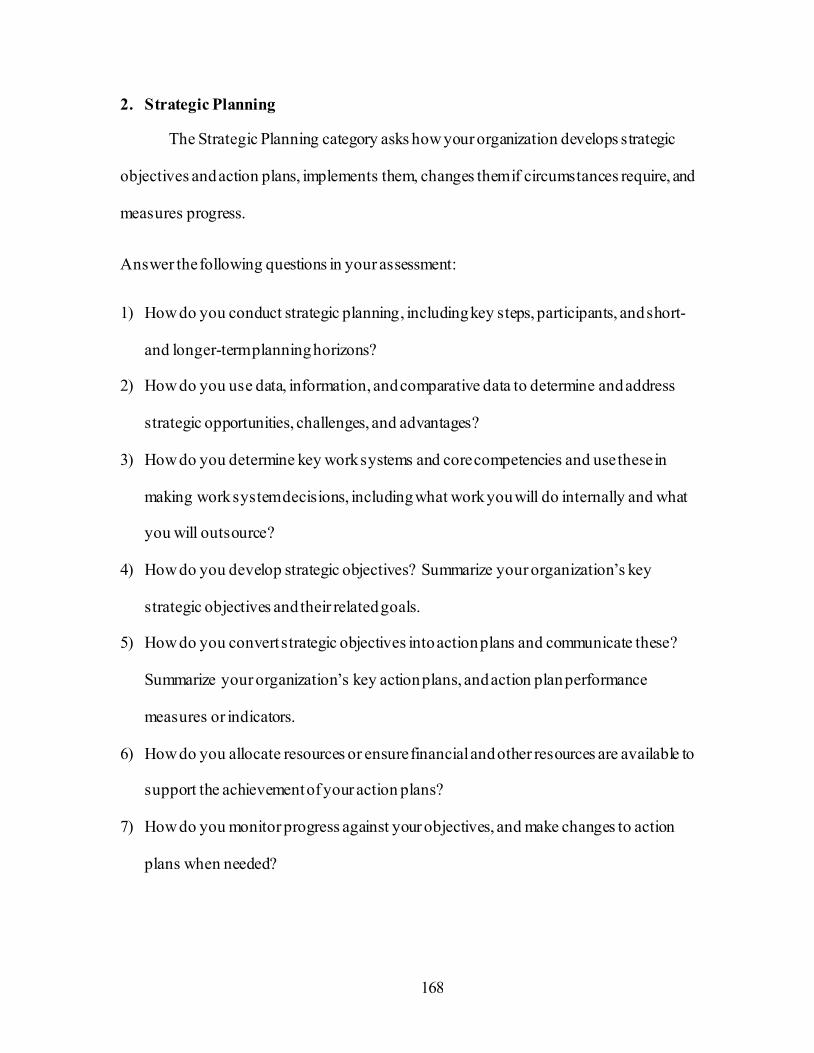
168
2. Strategic Planning
The Strategic Planning category asks how your organization develops strategic
objectives and action plans, implements them, changes them if circumstances require, and
measures progress.
Answer the following questions in your assessment:
1) How do you conduct strategic planning, including key steps, participants, and short-
and longer-term planning horizons?
2) How do you use data, information, and comparative data to determine and address
strategic opportunities, challenges, and advantages?
3) How do you determine key work systems and core competencies and use these in
making work system decisions, including what work you will do internally and what
you will outsource?
4) How do you develop strategic objectives? Summarize your organization’s key
strategic objectives and their related goals.
5) How do you convert strategic objectives into action plans and communicate these?
Summarize your organization’s key action plans, and action plan performance
measures or indicators.
6) How do you allocate resources or ensure financial and other resources are available to
support the achievement of your action plans?
7) How do you monitor progress against your objectives, and make changes to action
plans when needed?
169
3. Customer Focus
The Customer Focus category asks how your organization engages its customers
for long-term marketplace success, including how your organization listens to the voice
of the customer, builds customer relationships, and uses customer information to improve
and to identify opportunities for innovation.
Answer the following questions in your assessment:
How do you listen to the voice of the customer?
How do you determine customer requirements for products/services
and communication methods to support customers?
How do you build and manage customer relationships?
How do you determine customer satisfaction and engagement and
use this information to make improvements?
How do you manage and resolve customer complaints and recover
their confidence?
4. Measurement, Analysis, and Knowledge Management
The Measurement, Analysis, and Knowledge Management category asks how
your organization selects, gathers, analyzes, and manages its data, information, and
knowledge assets; how it learns; and how it manages information technology. The
category also asks how your organization uses review findings to improve its
performance.
Answer the following questions in your assessment:
170
1) How do you measure, analyze, review, and improve performance through the use
of data and information at all levels and in all parts of your organization?
2) What are your key organizational performance measures?
3) How do you select comparative data and use it effectively to support decision-
making?
4) How do you identify internal operations that are high performing and select and
share their best practices with other areas of your organization?
5) How do you build and manage knowledge assets?
6) How do you ensure the quality and availability of needed data, information,
software, and hardware for your workforce, suppliers, partners, collaborators, and
customers and ensure availability in the event of an emergency?
5. Workforce Focus
The Workforce Focus category asks how your organization assesses workforce
capability and capacity needs and builds a workforce environment conducive to high
performance. The category also asks how your organization engages, manages, and
develops your workforce to utilize its full potential in alignment with your organization’s
overall mission, strategy, and action plans.
Answer the following questions in your assessment:
1) How do you manage workforce capability and capacity to accomplish the work of the
organization?
2) How do you recruit, hire, place, and retain new workforce members?
3) How do you maintain a healthy, secure, and supportive work climate?
171
4) How do you engage, compensate, recognize and reward your workforce to achieve
high performance?
5) How do you assess workforce engagement and use the results to achieve higher
performance?
6) How are members of your workforce, including leaders, developed to achieve high
performance?
7) How do you manage effective career progression and succession planning including
the transfer of knowledge from departing or retiring workforce members?
6. Operations Focus
The Operations Focus category asks how your organization designs, manages, and
improves its products, services, and work processes and improves operational
effectiveness to deliver customer value and achieve organizational success and
sustainability.
Answer the following questions in your assessment:
How do you design your products/services and the key work processes that
deliver these, and determine key product/service requirements and key work
process requirements?
How do you manage, measure, and improve key work processes and support
processes to improve performance and reduce variability?
How do you control the overall costs of your operations?
How do you manage supplier performance?
172
How do you provide a safe operating environment and ensure workplace
preparedness for disasters or emergencies?
7. Results
The Results category asks about your organization’s performance and
improvement in all key areas—product and process results, customer-focused results,
workforce-focused results, leadership and governance results, and financial and market
results. The category asks about performance levels relative to those of competitors and
other organizations with similar product offerings.
Provide results that address the following questions in your assessment:
1) What are your organization’s key product/service performance and
process effectiveness and efficiency results? Include processes that
directly serve customers, strategy, and operations (including emergency
preparedness and supply chain management). Segment your results by
product /service offerings, by customer groups and market segments, and
by process types and locations as appropriate. Include appropriate
comparative data.
2) What are your organization’s key customer‐ focused results for customer
satisfaction, dissatisfaction, and engagement? Segment your results by
product/service offerings, customer groups, and market segments, as
appropriate. Include appropriate comparative data.
3) What are your organization’s key workforce‐ focused results for
workforce environment and for your workforce engagement? Segment
173
your results to address the diversity of your workforce and to address
your workforce groups and segments, as appropriate. Include
appropriate comparative data.
4) What are your organization’s key senior leadership and governance
results, including those for fiscal accountability, legal compliance,
ethical behavior, societal responsibility, support of key communities, and
strategy implementation? Segment your results by organizational units,
as appropriate. Include appropriate comparative data.
5) What are your organization’s key financial and marketplace performance
results by market segments or customer groups, as appropriate? Include
appropriate comparative data.
174
GSA Assessment program
1. Leadership
1.1. Senior Leadership: How do your senior leaders lead the organization?
a. Vision, Values, and Mission
1) Vision and Values: How do senior leaders set your organization’s vision
and values? How do senior leaders deploy the vision and values through
your leadership system, to the workforce, to key suppliers and partners,
and to customers and other stakeholders, as appropriate? How do senior
leaders’ personal actions reflect a commitment to those values?
2) Promoting Legal and Ethical Behavior: How do senior leaders’ actions
demonstrate their commitment to legal and ethical behavior? How do they
promote an organizational environment that requires it?
3) Creating a Successful Organization: How do senior leaders’ actions build
an organization that is successful now and in the future? How do they:
create an environment for the achievement of your mission,
improvement of organizational performance, performance leadership,
organizational learning, and learning for people in the workforce;
create a workforce culture that delivers a consistently positive
customer experience and fosters customer engagement;
create an environment for innovation and intelligent risk taking,
achievement of your strategic objectives, and organizational agility;
and
175
participate in succession planning and the development of future
organizational leaders?
b. Communication and Organizational Performance
1) Communication: How do senior leaders communicate with and engage
the entire workforce and key customers? How do they:
encourage frank, two-way communication, including effective use of
social media, when appropriate;
communicate key decisions and needs for organizational change; and
reinforce high performance and a customer and business focus by
taking a direct role in motivating the workforce, including by
participating in reward and recognition programs?
2) Focus on Action: How do senior leaders create a focus on action that
will achieve the organization’s mission? How do senior leaders:
create a focus on action that will improve the organization’s
performance, achieve innovation and intelligent risk taking, and
attain its vision;
identify needed actions; and
in setting expectations for organizational performance, include a
focus on creating and balancing value for customers and other
stakeholders?
1.2. Governance and Societal Responsibilities: How do you govern your
organization and fulfill your societal responsibilities
a. Organizational Governance
176
1) Governance System: How does your organization ensure responsible
Governance? How do you review and achieve the following key aspects of
your Governance system:
Accountability for senior leaders’ actions;
Accountability for strategic plans;
Fiscal accountability;
Transparency in operations;
Selection of governance board members and disclosure policies for them,
as appropriate;
Independence and effectiveness of internal and external audits;
Protection of stakeholder and stockholder interest, as appropriate;
Succession planning for senior leaders?
2) Performance Evaluation: How do you evaluate the performance of your
senior leaders, including the chief executive, and your governance board?
How do you use performance evaluations in determining executive
compensation?
How do your senior leaders and governance board use these performance
evaluations to advance their development and improve both their own
effectiveness as leaders and that of your board and leadership system, as
appropriate?
b. Legal and Ethical Behavior
177
1) Legal and Regulatory Compliance: How do you anticipate and address
public concerns with your products, services, and operations? How do
you:
address any adverse societal impacts of your products, services, and
operations;
anticipate public concerns with your future products, services, and
operations; and
prepare for these impacts and concerns proactively, including through
conservation of natural resources and effective supply chain
management processes, as appropriate?
What are your key compliance processes, measures, and goals for
meeting and surpassing regulatory and legal requirements, as
appropriate? What are your key processes, measures, and goals for
addressing risks associated with your products, services, and
operations?
2) Ethical Behavior: How do you promote and ensure ethical behavior in all
interactions?
What are your key processes and measures or indicators for enabling
and monitoring ethical behavior in your governance structure;
throughout your organization; and in interactions with your workforce,
customers, partners, suppliers, and other stakeholders?
How do you monitor and responds to breaches of ethical behavior?
c. Societal Responsibilities
178
1) Societal Well-Being: How do you consider societal well-being and
benefit as part of your strategy and daily operations? How do you
contribute to societal well-being through your environmental, social, and
economic systems?
2) Community Support: How do you actively support and strengthen your
key communities?
What are your key communities?
How do you identify them and determine areas for organizational
involvement, including areas that leverage your core competencies?
How do your senior leaders, in concert with your workforce,
contribute to improving these communities?
2. Strategic Planning
2.1. Strategy Development: How do you develop your strategy?
a. Strategy Development Process
1) Strategic Planning Process: How do you conduct your strategic planning?
What are your key process steps? Who are the key participants? What are
your short- and longer-term planning horizons? How are they addressed
in the planning process? How does your strategic planning process
address the potential need for:
transformational change and prioritization of change initiatives;
organizational agility; and
operational flexibility?
179
2) Innovation: How does your strategy development process stimulate and
incorporate innovation? How do you identify strategic opportunities?
How do you decide which strategic opportunities are intelligent risks for
pursuing? What are your key strategic opportunities?
3) Strategy Considerations: How do you collect and analyze relevant data
and develop information for your strategic planning process? In this
collection and analysis, how do you include these key elements?
Your strategic challenges and strategic advantages
Risks to your organization’s future success
Potential changes in your regulatory environment
Potential blind spots in your strategic planning process and
information
Your ability to execute the strategic plan
4) Work Systems and Core Competencies: What are your key work
systems? How do you make work system decisions that facilitate the
accomplishment of your strategic objectives? How do you decide which
key processes will be accomplished by external suppliers and partners?
How do those decisions consider your core competencies and the core
competencies of potential suppliers and partners? How do you determine
future organizational core competencies and work systems?
b. Strategic Objectives
1) Key Strategic Objectives: What are your organization’s key strategic
objectives and timetable for achieving them? What are your most
180
important goals for these strategic objectives? What key changes, if any,
are planned in your products and services, customers and markets,
suppliers and partners, and operations?
2) Strategic Objective Considerations: How do your strategic objectives
achieve appropriate balance among varying and potentially competing
organizational need? How do your strategic objectives:
address your strategic challenges and leverage your core
competencies, strategic advantages, and strategic opportunities;
balance short- and longer-term planning horizons; and
consider and balance the needs of all key stakeholders?
2.2. Strategy Implementation: How do you implement your strategy?
a. Action Plan Development and Deployment
1) Action Plans: What are your key short- and longer-term action plans?
What is their relationship to your strategic objectives? How do you
develop your action plans?
2) Action Plan Implementation: How do you deploy your action plans?
How do your deploy your action plans to your workforce and to key
suppliers and partners, as appropriate, to ensure that you achieve your key
strategic objectives? How do you ensure that you can sustain the key
outcomes of your action plans?
3) Resource Allocation: How do you ensure that financial and other
resources are available to support the achievement of your action plans
while you meet current obligations? How do you allocate these resources
181
to support the plans? How do you manage the risks associated with the
plans to ensure your financial viability?
4) Workforce Plans: What are your key workforce plans to support your
short- and longer-term strategic objectives and action plans? How do the
plans address potential impacts on your workforce members and any
potential changes in workforce capability and capacity needs?
5) Performance Measures: What key performance measures or indicators do
you use to track the achievement and effectiveness of your action plans?
How does your overall action plan measurement system reinforce
organizational alignment?
6) Performance Projections: For these key performance measures or
indicators, what are your performance projections for your short- and
longer-term planning horizons? How does your projected performance on
these measures or indicators compare with your projections of the
performance of your competitors or comparable organizations and with
key benchmarks, as appropriate? If there are gaps in performance against
your competitors or comparable organizations, how do you address them?
b. Action Plan Modified:
How do you establish and implement modified action plans if circumstances
require a shift in plans and rapid execution of new plans?
182
3. Customer Focus
3.1. Voice of the Customer: How do you obtain information from your customers?
a. Customer Listening
1) Current Customers: How do you listen to, interact with, and observe
customers to obtain actionable information? How do your listening
methods vary for different customers, customer groups, or market
segments? How do you use social media and web-based technologies to
listen to customers, as appropriate? How do your listening methods vary
across the customer life cycle? How do you seek immediate and
actionable feedback from customers on the quality of products and
services, customer support, and transactions?
2) Potential Customers: How do you listen to potential customers to obtain
actionable information? How do you listen to former customers, potential
customers, and competitor’s customers to obtain actionable information on
your products and services, customer support, and transactions, as
appropriate?
b. Determination of Customer Satisfaction and Engagement
1) Satisfaction, Dissatisfaction, and Engagement: How do you determine
customer satisfaction, dissatisfaction, and engagement? How do your
determination methods differ among your customer groups and market
segments, as appropriate? How do your measurements capture actionable
information to use in exceeding your customers’ expectations and securing
your customers’ engagement for the long term?
183
2) Satisfaction Relative to Competitors: How do you obtain information on
your customers’ satisfaction:
relative to their satisfaction with your competitors; and
relative to the satisfaction of customers of other organizations that
provide similar products and services or to industry benchmarks, as
appropriate?
3.2. Customer Engagement: How do you engage customers by serving their needs
and building relationships?
a. Product Offerings and Customer Support
1) Product/Service Offerings: How do you determine product offerings and
services? How do you:
determine customer and market needs and requirements for product
offerings and services;
identify and adapt product/service offerings to meet the requirements
and exceed the expectations of your customer groups and market
segments; and
identify and adapt product/service offerings to enter new markets, to
attract new customers, and to create opportunities to expand
relationships with current customers, as appropriate?
2) Customer Support: How do you enable customers to seek information and
support? How do you enable them to conduct business with you? What
are your key means of customer support, including your key
184
communication mechanisms? How do they vary for different customers,
customer groups, or market segments? How do you:
determine your customers’ key support requirements; and
deploy these requirements to all people and processes involved in
customer support?
3) Customer Segmentation: How do you determine your customer groups
and market segments? How do you:
use information on customers, markets, and product offerings to
identify current and anticipate future customer groups and market
segments;
consider competitors’ customers and other potential customers and
markets in this segmentation; and
determine which customers, customer groups, and market segments to
emphasize and pursue for business growth?
b. Customer Relationships
1) Relationship Management: How do you build and manage customer
relationships? How do you market, build, and manage relationships with
customers to:
acquire customers and build market share;
manage and enhance your brand image;
retain customers, meet their requirements, and exceed their
expectations in each stage of the customer life cycle; and
increase their engagement with you?
How do you leverage social media to manage and enhance your brand
and to enhance?
185
2) Complaint Management: How do you manage customer complaints?
How do you resolve complaints promptly and effectively? How does your
management of customer complaints enable you to recover your
customers’ confidence, enhance their satisfaction and engagement, and
avoid similar complaints in the future?
4. Measurement, Analysis, and Knowledge Management
4.1. Measurement, Analysis, and Improvement of Organizational Performance: How
do you measure analyze, and then improve organizational performance?
a. Performance Measurement
1) Performance Measures: How do you use data and information to track
daily operations and overall organizational performance? How do you:
select, collect, align, and integrate data and information to use in
tracking daily operations and overall organizational performance; and
track progress on achieving strategic objectives and action plans?
What are your key organizational performance measures, including
key short- and longer-term financial measures? How frequently do
you track these measures?
2) Comparative Data: How do you select and effectively use comparative
data and information? How do you select and effectively use key
comparative data and information to support operational decision making?
3) Customer Data: How do you use voice-of-the-customer and market data
and information? How do you:
186
select and effectively use voice-of-the-customer and market data and
information (including aggregated data on complaints) to build a more
customer-focused culture and to support operational decision making;
and
use data and information gathered through social media, as
appropriate?
4) Measurement Agility, how do you ensure that your performance
measurement system can respond to rapid or unexpected organizational or
external changes?
b. Performance Analysis and Review:
How do you review your organization’s performance and capabilities?
How do you use your key organizational performance measures, as well as
comparative and customer data, in these reviews? What analyses do you
perform to support these reviews and ensure that conclusions are valid? How
do your organization and its senior leaders use these reviews to:
assess organizational success, competitive performance, financial health, and
progress on achieving your strategic objectives and action plans; and
respond rapidly to changing organizational needs and challenges in your
operating environment, including any need for transformational change in
organizational structure and work systems?
How does your governance board review the organization’s performance and
its progress on strategic objectives and action plans, if appropriate?
c. Performance Improvement
187
1) Best Practices: How do you share best practices in your organization?
How do you identify organizational units or operations that are high
performing? How do you identify their best practices for sharing and
implementing them across the organization, as appropriate?
2) Future Performance: How do you project your organization’s future
performance? How do you use findings from performance reviews
(addressed in 4.1b) and key comparative and competitive data in
projecting future performance? How do you reconcile any differences
between these projections of future performance and performance
projections developed for your key action plans (addressed in 2.2a[6])?
3) Continuous Improvement and Innovation: How do you sue findings from
performance reviews (addressed in 4.1b) to develop priorities for
continuous improvement and opportunities for innovation? How do you
deploy these priorities and opportunities:
to work group and functional-level operations; and
when appropriate, to your suppliers, partners, and collaborators to
ensure organizational alignment?
4.2. Knowledge Management, Information, and Information Technology: How do
you manage your organizational knowledge assets, information, and information
technology infrastructure?
a. Organizational Knowledge
188
1) Knowledge Management: How do you manage organizational
knowledge? How do you:
collect and transfer workforce knowledge;
blend and correlate data from different sources to build new
knowledge;
transfer relevant knowledge from and to customers, suppliers, partners,
and collaborators; and
assemble and transfer relevant knowledge for use in your innovation
and strategic planning processes?
2) Organizational Learning: How do you use your knowledge and resources
to embed learning in the way your organization operates?
b. Data, Information, and Information Technology
1) Data and Information Quality: How do you verify and ensure the quality
of organizational data and information? How do you manage electronic
and other data and information to ensure their accuracy and validity;
integrity and reliability; and currency?
2) Data and Information Security: How do you ensure the security of
sensitive or privileged data and information? How do you manage
electronic and other data and information to ensure confidentiality and
only appropriate access? How do you oversee the cybersecurity of your
information systems?
3) Data and Information Availability: How do you ensure the availability of
organizational data and information? How do you make needed data and
189
information available in a user-friendly format and timely manner to your
workforce, suppliers, partners, collaborators, and customers, as
appropriate?
4) Hardware and Software Properties: How do you ensure that hardware and
software are reliable, secure, and user friendly?
5) Emergency Availability: In the event of an emergency, how do you
ensure that hardware and software systems, and data and information
continue to be secure and available to effectively serve customers and
business needs?
5. Workforce Focus
5.1. Workforce Environment: How do you build an effective and supportive
workforce environment?
a. Workforce Capability and Capacity
1) Capability and Capacity: How do you assess your workforce capability
and capacity needs? How do you assess the skills, competencies,
certifications, and staffing levels you need?
2) New Workforce Members: How do you recruit, hire, place, and retain
new workforce members? How do you ensure that your workforce
represents the diverse ideas, cultures, and thinking of your hiring and
customer community?
3) Work Accomplishment: How do you organize and manage your
workforce? How do you organize and manage your workforce to:
accomplish your organization’s work;
190
capitalize on your organization’s core competencies;
reinforce a customer and business focus; and
exceed performance expectations?
4) Workforce Change Management: How do you prepare your workforce for
changing capability and capacity needs? How do you:
manage your workforce, its needs, and your organization’s needs to
ensure continuity, prevent workforce reductions, and minimize the
impact of such reductions, if they become necessary;
prepare for and manage periods of workforce growth; and
prepare your workforce for changes in organizational structure and
work systems, when needed?
b. Workforce Climate
1) Workplace Environment: How do you ensure workplace health, security,
and accessibility for the workforce? What are your performance measures
and improvement goals for your workplace environmental factors? For
your different workplace environments, what significant differences are
there in these factors and their performance measures or targets?
2) Workforce Benefits and Policies: How do you support your workforce via
services, benefits, and policies? How do you tailor these to the needs of a
diverse workforce and different workforce groups and segments? What
key benefits do you offer your workforce?
5.2. Workforce Engagement: How do you engage your workforce to achieve a high-
performance work environment?
191
a. Workforce Engagement and Performance
1) Organizational Culture: How do you foster an organizational culture that
is characterized by open communication, high performance, and an
engaged workforce? How do you ensure that your organizational culture
benefits from the diverse ideas, cultures, and thinking of your workforce?
How do you empower your workforce?
2) Drivers of Engagement: How do you determine the key drivers of
workforce engagement? How do you determine these drivers for different
workforce groups and segments?
3) Assessment of Engagement: How do you assess workforce engagement?
What formal and informal assessment methods and measures do you use
to determine workforce engagement, including satisfaction? How do these
methods and measures differ across workforce groups and segments?
How do you also use other indicators, such as workforce retention,
absenteeism, grievances, safety, and productivity, to assess and improve
workforce engagement?
4) Performance Management: How does your workforce performance
management system support high performance and workforce
engagement? How does it consider workforce compensation, reward,
recognition, and incentive practices? How does it reinforce:
intelligent risk taking to achieve innovation;
a customer and business focus; and
achievement of your action plans?
192
b. Workforce and Leader Development
1) Learning and Development System: How does your learning and
development system support the organization’s needs and the personal
development of your workforce members, managers, and leaders? How
does the system:
address your organization’s core competencies, strategic challenges,
and achievement of short-and longer-term action plans;
support organizational performance improvement, organizational
change, and innovation;
support ethics and ethical business practices;
improve customer focus;
ensure the transfer of knowledge from departing or retiring workforce
members; and
ensure the reinforcement of new knowledge and skills on the job?
2) Leaning and Development Effectiveness: How do you evaluate the
effectiveness and efficiency of your learning and development system?
How do you:
correlate learning and development outcomes with findings from your
assessment of workforce engagement and with key business results
reported in Category 7; and
use the correlations to identify opportunities for improvement in both
workforce engagement and learning and development offerings?
193
3) Career Progression: How do you manage career progression for your
organization? How do you manage career development for your
workforce? How do you carry out succession planning for management
and leadership positions?
6. Operations Focus
6.1. Work Processes: How do you design, manage, and improve your key products
and services and work processes?
a. Product, Service and Process Design
1) Products/Services and Process Requirements: How do you determine key
product/service and work process requirements? What are your
organization’s key work processes? What are the key requirements for
these work processes?
2) Design Concepts: How do you design your products, services, and work
processes to meet requirements? How do you incorporate new
technology, organizational knowledge, product and service excellence,
customer value, and the potential need for agility into these products,
services, and processes?
b. Process Management
1) Process Implementation: How does your day-to-day operation of work
processes ensure that they meet key process requirements? What key
performance measures or indicators and in-process measures do you use to
control and improve your work processes? How do these measures relate
to end-product quality and performance?
194
2) Support Processes: How do you determine your key support processes?
What are your key support processes? How does your day-to-day
operation of these processes ensure that they meet key business support
requirements?
3) Product/Service and Process Improvement: How do you improve your
work processes to improve products/services and performance, enhance
your core competencies, and reduce variability?
c. Innovation Management:
How do you manage for innovation? How do you pursue the strategic
opportunities that you determine are intelligent risks? How do you make
financial and other resources available to pursue these opportunities? How do
you discontinue pursuing opportunities at the appropriate time to enhance
support for higher-priority opportunities?
6.2. Operational Effectiveness: How do you ensure effective management of your
operations? In your response, include answers to the following questions:
a. Process Efficiency and Effectiveness:
How do you control costs of your operations? How do you:
incorporate cycle time, productivity, and other efficiency and effectiveness
factors into your work processes;
prevent defects, service errors, and rework;
minimize warranty costs or customers’ productivity losses, as appropriate;
195
minimize the costs of inspections, tests, and process performance audits,
as appropriate; and balance the need for cost control with the needs of
your customers?
b. Supply Chain Management: How do you manage your supply chain? How do
you:
select suppliers and ensure that they are qualified and positioned to not
only meet operational needs but also enhance your performance and your
customers’ satisfaction;
measure and evaluate your suppliers’ performance;
provide feedback to your suppliers to help them improve; and deal with
poorly performing suppliers?
c. Safety and Emergency Preparedness
1) Safety: How do you provide a safe operating environment? How does
your safety system address accident prevention, inspection, root-cause
analysis of failures, and recovery?
2) Emergency Preparedness: How does your disaster and emergency
preparedness system consider prevention, continuity of operations, and
recovery? How does your disaster and emergency preparedness system
take your reliance on suppliers and partners into account?
7. Results
7.1. Product/Service and process Results: What are your product performance and
process effectiveness results?
196
a. Customer Focused Product and Service Results
What are your results for your products/services and your customer service
processes? What are your current levels and trends in key measures or
indicators of the performance of products and services that are important to
and directly serve your customers? How do these results compare with the
performance of your competitors and other organizations with similar
offerings? How do these results differ by product/service offerings, customer
groups, and market segments, as appropriate?
b. Work Process Effectiveness Results
1) Process Effectiveness and Efficiency: What are your process
effectiveness and efficiency results? What are your current levels and
trends in key measures or indicators of the operational performance of
your key work and support processes, including productivity, cycle time,
and other appropriate measures of process effectiveness, efficiency, and
innovation? How do these results compare with the performance of your
competitors and other organizations with similar processes? How do these
results differ by process types, as appropriate?
2) Emergency Preparedness: What are your emergency preparedness results?
What are your current levels and trends in key measures or indicators of
the effectiveness of your organization’s preparedness for disasters or
emergencies: How do these results differ by location or process type, as
appropriate?
197
c. Supply Chain Management Results
What are your supply chain management results? What are your results for
key measures or indicators of the performance of your supply chain, including
its contribution to enhancing your performance?
7.2. Customer-Focused Results: What are your customer-focused performance
results?
a. Customer-Focused Results
1) Customer Satisfaction: What are your customer satisfaction and
dissatisfaction results? What are your current levels and trends in key
measures or indicators of customer satisfaction and dissatisfaction? How
do these results compare with those of your competitors and other
organizations providing similar products? How do these results differ by
product offerings, customer groups, and market segments, as appropriate?
2) Customer Engagement: What are your customer engagement results?
What are your current levels and trends in key measures or indicators of
customer engagement, including those for building customer
relationships? How do these results compare over the course of your
customer life cycle as appropriate? How do these results differ by product
offerings, customer groups, and market segments, as appropriate?
7.3. Workforce-Focused Results: What are your workforce-focused performance
results?
a. Workforce-Focused Results
198
1) Workforce Capability and Capacity: What are your workforce capability
and capacity result? What are your current levels and trends in key
measures of workforce capability and capacity, including appropriate
skills and staffing levels? How do these results differ by the diversity of
your workforce and by your workforce groups and segments, as
appropriate?
2) Workforce Climate: What are your workforce climate results? What are
your current levels and trends in key measures or indicators of your
workforce climate, including those for workforce health, safety, and
security and workforce services and benefits, as appropriate? How do
these results differ by the diversity of your workforce and by your
workforce groups and segments, as appropriate?
3) Workforce Engagement: What are your workforce engagement results?
What are your current levels and trends in key measures or indicators of
workforce satisfaction and workforce engagement? How do these results
differ by the diversity of your workforce and by your workforce groups
and segments, as appropriate?
4) Workforce Development: What are your workforce and leader
development results? What are your current levels and trends in key
measures or indicators of workforce and leader development? How do
these results differ by the diversity of your workforce and by your
workforce groups and segments, as appropriate?
199
7.4. Leadership and Governance Results: What are your senior leadership and
governance results?
a. Leadership, Governance, and Societal Responsibility Results
1) Leadership: What are your results for senior leaders’ communication and
engagement with the workforce and customers? What are your results for
key measures or indicators of senior leaders; communication and
engagement with the workforce and customers to deploy your vision and
values, encourage two-way communication, and create a focus on action?
How do these results differ by organizational units and customer groups,
as appropriate?
2) Governance: What are your results for governance accountability? What
are your key current findings and trends in key measures or indicators of
governance and internal and external fiscal accountability, as appropriate?
3) Law and Regulation: What are your legal and regulatory results? What
are your results for key measures or indicators of meeting and surpassing
regulatory and legal requirements? How do these results differ by
organizational units, as appropriate?
4) Ethics: What are your results for ethical behavior? What are your results
for key measures or indicators of ethical behavior, breaches of ethical
behavior, and stakeholder trust in your senior leaders and governance?
How do these results differ by organizational units, as appropriate?
5) Society: What are your results for societal responsibility and support of
your key communities? What are your results for key measures or
200
indicators of your fulfillment of your societal responsibilities and support
of your key communities?
b. Strategy Implementation Results
What are your results for the achievement of your organizational strategy and
action plans? What are your results for key measures or indicators of the
achievement of your organizational strategy and action plans? What are your
results for building and strengthening core competencies? What are your
results for taking intelligent risks?
7.5. Financial and Market Results: What are your financial and marketplace
performance results?
a. Financial and Market Results
1) Financial Performance: What are your financial performance results?
What are your current levels and trends in key measures or indicators of
financial performance, including aggregate measures of financial return,
financial viability, and budgetary performance, as appropriate? How do
these results differ by market segments and customer groups, as
appropriate?
2) Marketplace Performance: What are your marketplace performance
results? What are your current levels and trends in key measures or
indicators of marketplace performance, including market share or position,
market and market share growth, and new markets entered, as appropriate?
How do these results differ by market segments and customer groups, as
appropriate?
201
Sustain Assessment program
I. EXECUTIVE SUMMARY
Baseline – Areas to Address
a) Identify the year(s) when the organization was recognized as a role model.
b) What, if anything, is different with respect to the scope of this organization compared
to the award year organization?
c) Briefly summarize key approaches and results that contributed to the organization’s
role model recognition.
d) Briefly summarize significant challenges/opportunities cited in first assessment.
Evidence of Sustained Performance Excellence
a) Summarize the key leadership and management approaches (if any) that have
changed or evolved since the award year.
b) Summarize any awards, achievements, certifications,
re-certifications, and recognition, including significance/relevance, since the
Governor’s Sterling Award.
c) Briefly summarize your analysis of whether the organization has continually
improved and maintained its role model status—or not—based on the current
assessment.
II. SUSTAINING A CULTURE OF PERFORMANCE EXCELLENCE
a) Summarize evidence that indicates this organization will operate in good health two
to five years from now or beyond.
202
b) Summarize any recent improvements to the organization’s governance system that
has reduced systemic risk, increased its ability to handle disruptions, and positioned it
for future growth and/or sustainability.
c) Summarize how and to what extent the organization embraces a culture of continuous
learning. Briefly list any significant, implemented organizational innovations.
d) Summarize any opportunistic decisions that led to strategic organizational
breakthroughs.
e) What progress has the organization made in relation to its strategic actions,
objectives, and goals identified at the time it received the Governor’s Sterling Award?
f) Summarize any potential industry, market, environmental, or regulatory challenges
and/or threats related to future sustainability and any mitigating steps the organization
is taking to address these challenges.
III. KEY ORGANIZATIONAL APPROACHES
a) Summarize 3-5 most significant approach strengths. Include how the organization
specifically addressed opportunities cited in the previous assessment and how its
approaches have continued to evolve and improve since the previous assessment.
b) Summarize 2-3 most significant opportunities for improvement related to the
organization’s approaches.
c) Summarize 3-5 most significant approach strengths. Provide evidence that the
organization specifically addresses Criteria changes that occurred since it achieved
the Governor’s Sterling Award.
203
d) Summarize 2-3 most significant opportunities for improvement related to the
organization’s approaches.
IV. KEY ORGANIZATIONAL RESULTS
a) Summarize 3-5 most significant results strengths. These should be themes focused on
how the organization sustained and/or improved key results since award-year
evaluation. Give focus to new results identified due to changes in organizational
priorities, the industry/sector, and in competitor/comparison performance.
b) Summarize 2-3 most significant opportunities or remaining challenges related to the
organization’s results.
204
APPENDIX C: INNOVATION SURVEY DATA
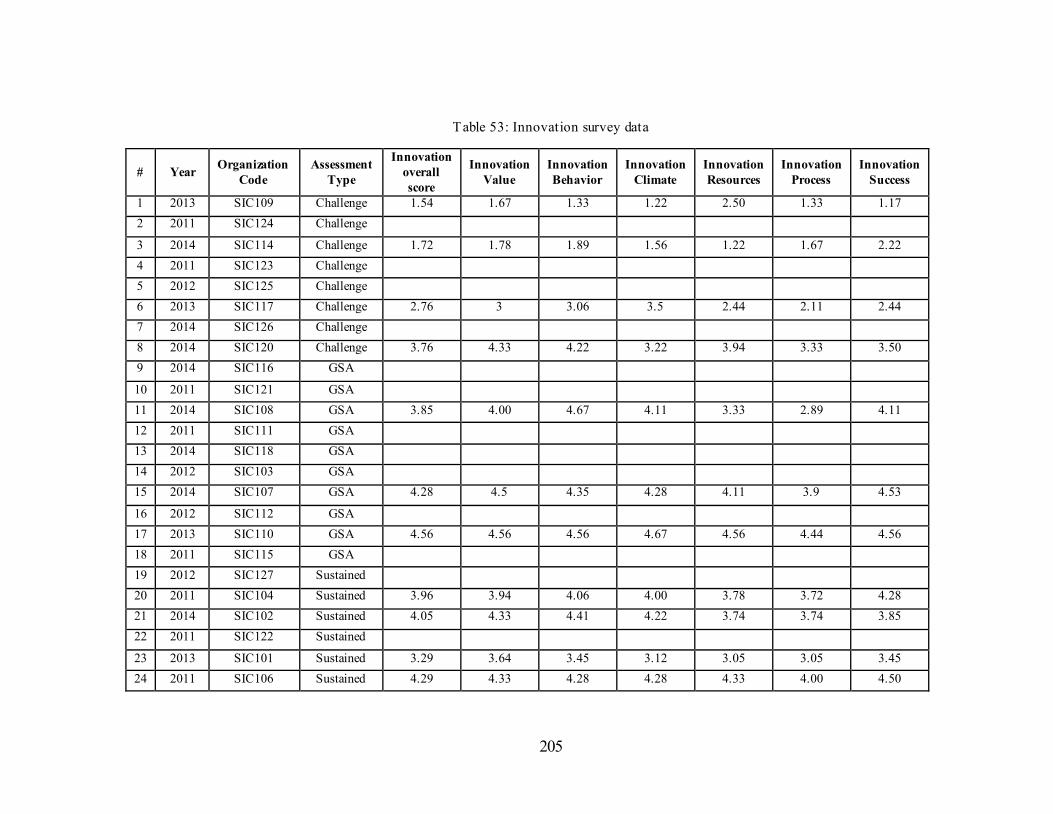
205
Table 53: Innovation survey data
# Year Organization
Code
Assessment
Type
Innovation
overall
score
Innovation
Value
Innovation
Behavior
Innovation
Climate
Innovation
Resources
Innovation
Process
Innovation
Success
1 2013 SIC109 Challenge 1.54 1.67 1.33 1.22 2.50 1.33 1.17
2 2011 SIC124 Challenge
3 2014 SIC114 Challenge 1.72 1.78 1.89 1.56 1.22 1.67 2.22
4 2011 SIC123 Challenge
5 2012 SIC125 Challenge
6 2013 SIC117 Challenge 2.76 3 3.06 3.5 2.44 2.11 2.44
7 2014 SIC126 Challenge
8 2014 SIC120 Challenge 3.76 4.33 4.22 3.22 3.94 3.33 3.50
9 2014 SIC116 GSA
10 2011 SIC121 GSA
11 2014 SIC108 GSA 3.85 4.00 4.67 4.11 3.33 2.89 4.11
12 2011 SIC111 GSA
13 2014 SIC118 GSA
14 2012 SIC103 GSA
15 2014 SIC107 GSA 4.28 4.5 4.35 4.28 4.11 3.9 4.53
16 2012 SIC112 GSA
17 2013 SIC110 GSA 4.56 4.56 4.56 4.67 4.56 4.44 4.56
18 2011 SIC115 GSA
19 2012 SIC127 Sustained
20 2011 SIC104 Sustained 3.96 3.94 4.06 4.00 3.78 3.72 4.28
21 2014 SIC102 Sustained 4.05 4.33 4.41 4.22 3.74 3.74 3.85
22 2011 SIC122 Sustained
23 2013 SIC101 Sustained 3.29 3.64 3.45 3.12 3.05 3.05 3.45
24 2011 SIC106 Sustained 4.29 4.33 4.28 4.28 4.33 4.00 4.50

206
APPENDIX D: PERFORMANCE EXCELLENCE DATA
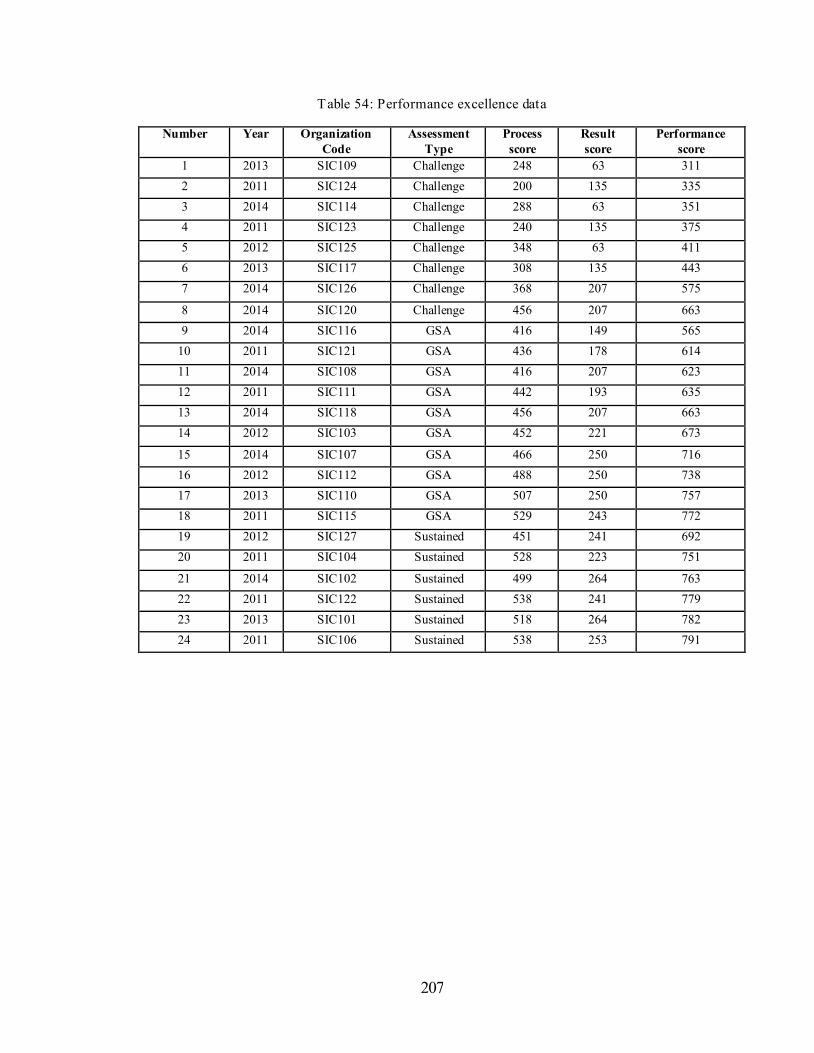
207
Table 54: Performance excellence data
Number Year Organization
Code
Assessment
Type
Process
score
Result
score
Performance
score
1 2013 SIC109 Challenge 248 63 311
2 2011 SIC124 Challenge 200 135 335
3 2014 SIC114 Challenge 288 63 351
4 2011 SIC123 Challenge 240 135 375
5 2012 SIC125 Challenge 348 63 411
6 2013 SIC117 Challenge 308 135 443
7 2014 SIC126 Challenge 368 207 575
8 2014 SIC120 Challenge 456 207 663
9 2014 SIC116 GSA 416 149 565
10 2011 SIC121 GSA 436 178 614
11 2014 SIC108 GSA 416 207 623
12 2011 SIC111 GSA 442 193 635
13 2014 SIC118 GSA 456 207 663
14 2012 SIC103 GSA 452 221 673
15 2014 SIC107 GSA 466 250 716
16 2012 SIC112 GSA 488 250 738
17 2013 SIC110 GSA 507 250 757
18 2011 SIC115 GSA 529 243 772
19 2012 SIC127 Sustained 451 241 692
20 2011 SIC104 Sustained 528 223 751
21 2014 SIC102 Sustained 499 264 763
22 2011 SIC122 Sustained 538 241 779
23 2013 SIC101 Sustained 518 264 782
24 2011 SIC106 Sustained 538 253 791

208
APPENDIX E: IRB HUMAN SUBJECTS PERMISSION
LETTER
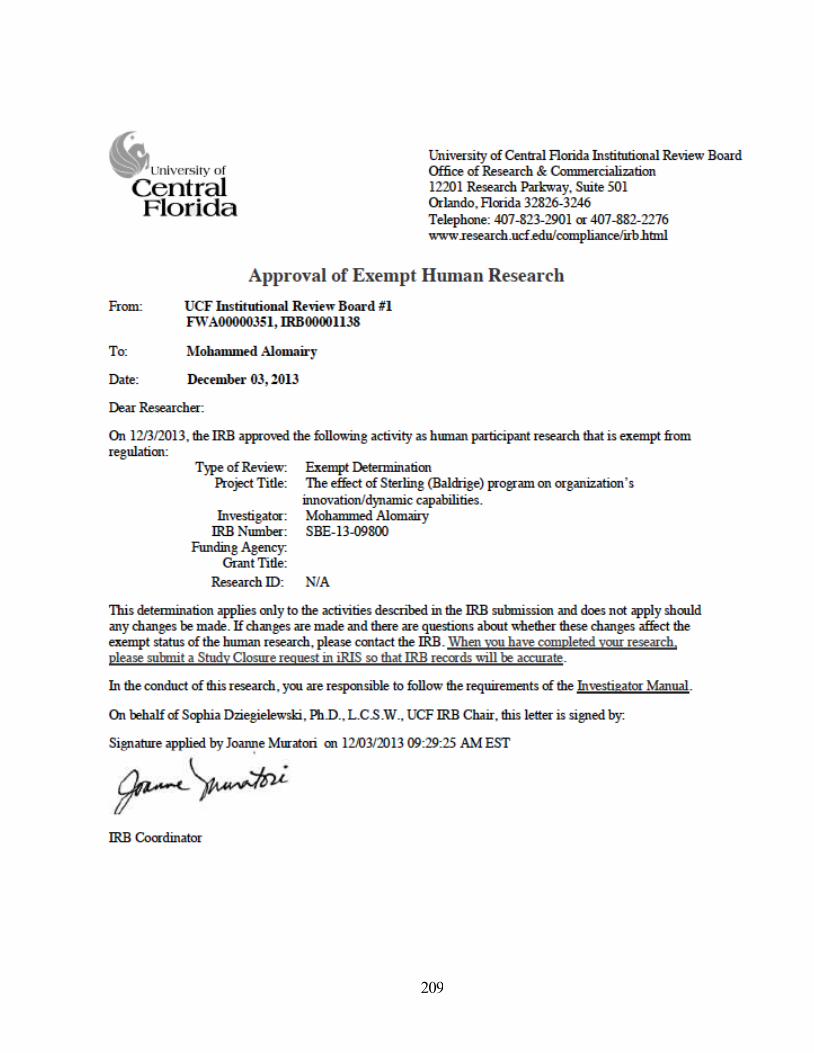
209
210
LIST OF REFERENCES
Alegre, Joaquín, & Chiva, Ricardo. (2008). Assessing the impact of organizational
learning capability on product innovation performance: An empirical test. Technovation, 28(6), 315-326.
Anderson, Philip, & Tushman, Michael L. (1990). Technological discontinuities and
dominant designs: A cyclical model of technological change. Administrative science quarterly, 604-633.
Armbruster, Heidi, Bikfalvi, Andrea, Kinkel, Steffen, & Lay, Gunter. (2008).
Organizational innovation: The challenge of measuring non-technical innovation in large-scale surveys. Technovation, 28(10), 644-657.
Atuahene‐ Gima, Kwaku. (1995). An exploratory analysis of the impact of market orientation on new product performance. Journal of product innovation management, 12(4), 275-293.
Baer, Markus, & Frese, Michael. (2002). Innovation is not enough: Climates for initiative and psychological safety, process innovations, and firm performance. Journal of Organizational Behavior, 24(1), 45-68.
Balachandra, Ravi, & Friar, John H. (1997). Factors for success in R&D projects and new
product innovation: a contextual framework. Engineering Management, IEEE Transactions on, 44(3), 276-287.
Baregheh, A., Rowley, J., & Sambrook, S. (2009). Towards a multidisciplinary definition of innovation. Management decision, 47(8), 1323-1339.
Barney, Jay. (1991). Firm resources and sustained competitive advantage. Journal of management, 17(1), 99-120.
Barney, Jay B. (1986). Strategic Factor Markets: Expectations, Luck, and Business Strategy. Management science, 32(10), 1231-1241. doi: 10.2307/2631697
Barreto, Ilídio. (2010). Dynamic capabilities: A review of past research and an agenda for the future. Journal of management, 36(1), 256-280.
Birkinshaw, Julian, Hamel, Gary, & Mol, Michael J. (2008). Management innovation. Academy of Management Review, 33(4), 825-845.
211
Börjesson, Sofia, & Elmquist, Maria. (2011). Developing Innovation Capabilities: A Longitudinal Study of a Project at Volvo Cars. Creativity and Innovation Management, 20(3), 171-184. doi: 10.1111/j.1467-8691.2011.00605.x
Brenner, Thomas, & Broekel, Tom. (2011). Methodological issues in measuring innovation performance of spatial units. Industry and Innovation, 18(1), 7-37.
Calantone, Roger J, Cavusgil, S Tamer, & Zhao, Yushan. (2002). Learning orientation, firm innovation capability, and firm performance. Industrial Marketing Management, 31(6), 515-524.
Camisón, César, & Villar-López, Ana. (2012). Organizational innovation as an enabler of technological innovation capabilities and firm performance. Journal of Business Research. doi: 10.1016/j.jbusres.2012.06.004
Capon, Noel, Farley, John U, Lehmann, Donald R, & Hulbert, James M. (1992). Profiles
of product innovators among large US manufacturers. Management science, 38(2), 157-169.
Carayannis, Elias G, & Provance, Mike. (2008). Measuring firm innovativeness: towards
a composite innovation index built on firm innovative posture, propensity and performance attributes. International Journal of Innovation and Regional Development, 1(1), 90-107.
Cetindamar, Dilek, Phaal, Robert, & Probert, David. (2009). Understanding technology
management as a dynamic capability: A framework for technology management activities. Technovation, 29(4), 237-246.
Christensen, Clayton M. (1997). The innovator's dilemma: when new technologies cause great firms to fail: Harvard Business Press.
Cohen, Wesley M, & Levinthal, Daniel A. (1990). Absorptive capacity: a new
perspective on learning and innovation. Administrative science quarterly, 128-152.
Cooper, Juett R. (1998). A multidimensional approach to the adoption of innovation. Management decision, 36(8), 493-493.
Crossan, Mary M., & Apaydin, Marina. (2010). A Multi-Dimensional Framework of
Organizational Innovation: A Systematic Review of the Literature. Journal of Management Studies, 47(6), 1154-1191. doi: 10.1111/j.1467-6486.2009.00880.x
Damanpour, F. (1991). Organizational innovation: A meta-analysis of effects of determinants and moderators. Academy of management journal, 555-590.
212
Damanpour, F. (1996). Organizational complexity and innovation: developing and testing multiple contingency models. Management science, 42(5), 693-716.
Damanpour, F., & Aravind, D. (2011). Managerial innovation: Conceptions, processes, and antecedents. Management and Organization Review, 8(2), 423-454.
Damanpour, Fariborz. (2010). An integration of research findings of effects of firm size and market competition on product and process innovations. British Journal of Management, 21(4), 996-1010.
Danneels, E., & Kleinschmidtb, E.J. (2001). Product innovativeness from the firm's
perspective: its dimensions and their relation with project selection and performance. Journal of product innovation management, 18(6), 357-373.
Easterby‐ Smith, Mark, Lyles, Marjorie A, & Peteraf, Margaret A. (2009). Dynamic capabilities: current debates and future directions. British Journal of Management, 20(s1), S1-S8.
Ellonen, Hanna-Kaisa, Wikström, Patrik, & Jantunen, Ari. (2009). Linking dynamic-capability portfolios and innovation outcomes. Technovation, 29(11), 753-762.
Ettlie, John E, Bridges, William P, & O'keefe, Robert D. (1984). Organization strategy and structural differences for radical versus incremental innovation. Management science, 30(6), 682-695.
Evans, James R, & Mai, Feng. (2014). Insights From the Baldrige Award Item-Level Blinded Applicant Scoring Data. Quality Management Journal, 21(2).
Fagerberg, J. (2004). Innovation: a guide to the literature.
Fagerberg, Jan. (2006). Innovation: A Guide to the Literature. doi: 10.1093/oxfordhb/9780199286805.003.0001
Feeny, Simon, & Rogers, Mark. (2003). Innovation and performance: benchmarking Australian firms. Australian Economic Review, 36(3), 253-264.
Francis, Dave, & Bessant, John. (2005). Targeting innovation and implications for capability development. Technovation, 25(3), 171-183.
Freeman, Christopher. (1998). The economics of technical change. Trade, Growth and Technical Change, Cambridge, 16-54.
Frishammar, J., Kurkkio, M., Abrahamsson, L., & Lichtenthaler, U. (2012). Antecedents
and Consequences of Firms' Process Innovation Capability: A Literature Review and a Conceptual Framework.
213
Garcia, R., & Calantone, R. (2003). A critical look at technological innovation typology and innovativeness terminology: a literature review. Journal of product innovation management, 19(2), 110-132.
Garvin, David A. (1991). How the Baldrige Awar Really Works. Harvard business review.
Godin, Benoit. (2002). The rise of innovation surveys: Measuring a fuzzy concept. Canadian Science and Innovation Indicators Consortium, Project on the History and Sociology of S&T Statistics, Paper(16).
González-Alvarez, Nuria, & Nieto-Antolín, Mariano. (2005). Protection and internal transfer of technological competencies: The role of causal ambiguity. Industrial Management & Data Systems, 105(7), 841-856.
Gopalakrishnan, S., & Damanpour, F. (1997). A review of innovation research in
economics, sociology and technology management. Omega, 25(1), 15-28. doi: 10.1016/s0305-0483(96)00043-6
Gopalakrishnan, Shanthi. (2000). Unraveling the links between dimensions of innovation
and organizational performance. The Journal of High Technology Management Research, 11(1), 137-153.
Gunday, Gurhan, Ulusoy, Gunduz, Kilic, Kemal, & Alpkan, Lutfihak. (2011). Effects of innovation types on firm performance. International Journal of Production Economics, 133(2), 662-676. doi: 10.1016/j.ijpe.2011.05.014
Gupta, Anil K, Tesluk, Paul E, & Taylor, M Susan. (2007). Innovation at and across multiple levels of analysis. Organization Science, 18(6), 885-897.
Hansen, Morten T, & Birkinshaw, Julian. (2007). The innovation value chain. Harvard business review, 85(6), 121.
Helfat, Constance E., & Peteraf, Margaret A. (2003). The dynamic resource-based view:
capability lifecycles. Strategic management journal, 24(10), 997-1010. doi: 10.1002/smj.332
Helfat, Constance E., & Winter, Sidney G. (2011). Untangling Dynamic and Operational Capabilities: Strategy for the (N)ever-Changing World. Strategic management journal, 32(11), 1243-1250. doi: 10.1002/smj.955
Hertz, Harry S. (2012). The Impact of Baldrige on Organizational Performance. Journal for Quality & Participation, 35(1), 4-7.
214
Hult, G. Tomas M., Hurley, Robert F., & Knight, Gary A. (2004). Innovativeness: Its antecedents and impact on business performance. Industrial Marketing Management, 33(5), 429-438. doi: 10.1016/j.indmarman.2003.08.015
Hurley, Robert F, & Hult, G Tomas M. (1998). Innovation, market orientation, and organizational learning: an integration and empirical examination. The Journal of Marketing, 42-54.
Jenssen, Jan Inge, & Rand, Trond. (2006). The performance effect of innovation in shipping companies. Maritime Policy & Management, 33(4), 327-343.
Johannessen, J.A., Olsen, B., & Lumpkin, G.T. (2001). Innovation as newness: what is new, how new, and new to whom? European Journal of innovation management, 4(1), 20-31.
Kanter, Rosabeth Moss. (1989). Swimming in newstreams: Mastering innovation dilemmas. California management review, 31(4), 45-69.
Keskin, Halit. (2006). Market orientation, learning orientation, and innovation capabilities in SMEs: An extended model. European Journal of innovation management, 9(4), 396-417.
Kessler, Eric H, & Chakrabarti, Alok K. (1999). Speeding up the pace of new product development. Journal of product innovation management, 16(3), 231-247.
Kleinschmidt, Elko J, & Cooper, Robert G. (1991). The impact of product innovativeness on performance. Journal of product innovation management, 8(4), 240-251.
Lawson, Benn, & Samson, Danny. (2001). Developing innovation capability in
organisations: a dynamic capabilities approach. International Journal of Innovation Management, 5(03), 377-400.
Lee, SM, Rho, B-H, & Lee, S-G. (2003). Impact of Malcolm Baldrige National Quality Award criteria on organizational quality performance. International Journal of Production Research, 41(9), 2003-2020.
Li, Haiyang, & Atuahene‐ Gima, Kwaku. (2002). The adoption of agency business activity, product innovation, and performance in Chinese technology ventures. Strategic management journal, 23(6), 469-490.
Lin, Carol Yeh-Yun, & Chen, Mavis Yi-Ching. (2007). Does innovation lead to
performance? An empirical study of SMEs in Taiwan. Management Research News, 30(2), 115-132. doi: 10.1108/01409170710722955
Link, Albert; Scott, John. (2011). Planning Report 11-2 Economic Evaluation of the Baldrige Performance Excellence Program.
215
Loomba, Arvinder PS, & Johannessen, Thomas B. (1997). Malcolm Baldrige National Quality Award: critical issues and inherent values. Benchmarking for Quality Management & Technology, 4(1), 59-77.
Luk, Chung-Leung, Yau, Oliver HM, Sin, Leo YM, Tse, Alan CB, Chow, Raymond PM, & Lee, Jenny SY. (2008). The effects of social capital and organizational innovativeness in different institutional contexts. Journal of International Business Studies, 39(4), 589-612.
Mazzanti, Massimiliano, Pini, Paolo, & Tortia, Ermanno. (2006). Organizational innovations, human resources and firm performance: The Emilia-Romagna food sector. Journal of Socio-Economics, 35(1), 123-141.
Meyers, Patricia W, & Tucker, Frances Gaither. (1989). Defining roles for logistics
during routine and radical technological innovation. Journal of the Academy of Marketing Science, 17(1), 73-82.
Mol, Michael J, & Birkinshaw, Julian. (2009). The sources of management innovation:
When firms introduce new management practices. Journal of Business Research, 62(12), 1269-1280.
NIST. (2011). Criteria for Performance Excellence (2011/2012).
Nohria, N., & Gulati, R. (1996). Is slack good or bad for innovation? Academy of management journal, 39(5), 1245-1264.
Ortega, María José Ruiz. (2010). Competitive strategies and firm performance:
Technological capabilities' moderating roles. Journal of Business Research, 63(12), 1273-1281.
Powell, Walter W, Koput, Kenneth W, & Smith-Doerr, Laurel. (1996). Interorganizational collaboration and the locus of innovation: Networks of learning in biotechnology. Administrative science quarterly, 116-145.
Publishing, OECD. (2005). The Measurement of Scientific and Technological Activities, Oslo Manual: Guidelines for Collecting and Interpreting Innovation Data : Organisation for Economic Co-operation and Development.
Rao, J. A. Y., & Weintraub, Joseph. (2013). How Innovative Is Your Company's Culture? MIT Sloan Management Review, 54(3), 29-37.
Roberts, E.B. (2007). Managing invention and innovation. Research-Technology Management, 50(1), 35-54.
Robertson, Thomas S. (1967). The process of innovation and the diffusion of innovation. The Journal of Marketing, 14-19.
216
Rogers, E.M. (2002). Diffusion of preventive innovations. Addictive behaviors, 27(6), 989-993.
Rogers, Everett M. (1995). Diffusion of innovations: Simon and Schuster.
Rose, Jerry. (2010). Baldrige is “A Huge Return on Your Investment”.
Rothwell, Roy, & Gardiner, Paul. (1988). Re‐ innovation and robust designs: Producer and user benefits. Journal of Marketing Management, 3(3), 372-387.
Rubera, G., & Kirca, A.H. (2012). Firm Innovativeness and Its Performance Outcomes: A Meta-Analytic Review and Theoretical Integration. Journal of Marketing, 76(3), 130-147.
Schmidt, Jeffrey B, & Calantone, Roger J. (1998). Are really new product development
projects harder to shut down? Journal of product innovation management, 15(2), 111-123.
Schreyögg, Georg, & Kliesch-Eberl, Martina. (2007). How dynamic can organizational capabilities be? Towards a dual-process model of capability dynamization. Strategic management journal, 28(9), 913-933. doi: 10.1002/smj.613
Shapiro, Amram R. (2006). Measuring innovation: Beyond revenue from new products. Research-Technology Management, 49(6), 42-51.
Slappendel, C. (1996). Perspectives on Innovation in Organizations. Organization Studies, 17(1), 107-129. doi: 10.1177/017084069601700105
Smith, KH. (2005). Measuring innovation. Oxford University Press.
Song, X Michael, & Montoya‐ Weiss, Mitzi M. (1998). Critical development activities
for really new versus incremental products. Journal of product innovation management, 15(2), 124-135.
Sorescu, Alina B., & Spanjol, Jelena. (2008). Innovation's Effect on Firm Value and Risk: Insights from Consumer Packaged Goods. Journal of Marketing, 72(2), 114-132.
Srinivasan, Shuba, Pauwels, Koen, Silva-Risso, Jorge, & Hanssens, Dominique. (2009). Product innovations, advertising and stock returns. Journal of Marketing, January.
Stone, Alexandra, Rose, Susan, Lal, Bhavya, & Shipp, Stephanie. (2008). Measuring
innovation and intangibles: A business perspective. Institute for Defense Analysis, Science and Technology Policy Institute, Washington, DC.
217
Subramanian, A., & Nilakanta, S. (1996). Organizational innovativeness: Exploring the relationship between organizational determinants of innovation, types of
innovations, and measures of organizational performance. Omega, 24(6), 631-647. doi: http://dx.doi.org/10.1016/S0305-0483(96)00031-X
Szymanski, David M, Kroff, Michael W, & Troy, Lisa C. (2007). Innovativeness and new product success: insights from the cumulative evidence. Journal of the Academy of Marketing Science, 35(1), 35-52.
Teece, David J, Pisano, Gary, & Shuen, Amy. (1997). Dynamic capabilities and strategic management. Strategic management journal, 18(7), 509-533.
Teece, David J. (2012). Dynamic Capabilities: Routines versus Entrepreneurial Action. Journal of Management Studies, 49(8), 1395-1401. doi: 10.1111/j.1467-6486.2012.01080.x
Thompson, V.A. (1965). Bureaucracy and innovation. Administrative science quarterly, 1-20.
Unit, Economist Intelligence. (2007). Innovation: Transforming the way business creates. London: Economist.
Utterback, James M. (1996). Mastering the dynamics of innovation: Harvard Business Press.
Utterback, James M, & Abernathy, William J. (1975). A dynamic model of process and product innovation. Omega, 3(6), 639-656.
Van de Ven, A.H. (1986). Central problems in the management of innovation. Management science, 32(5), 590-607.
Walker, Richard. (2004). Innovation and Organisational performance: evidence and a research agenda. Advanced Institute of Management Research Paper(002).
Wang, Catherine L, & Ahmed, Pervaiz K. (2004). The development and validation of the organisational innovativeness construct using confirmatory factor analysis. European Journal of innovation management, 7(4), 303-313.
Wang, Chun-hsien, Lu, Iuan-yuan, & Chen, Chie-bein. (2008). Evaluating firm technological innovation capability under uncertainty. Technovation, 28(6), 349-363.
West, M.A., & Anderson, N.R. (1996). Innovation in top management teams. Journal of Applied Psychology; Journal of Applied Psychology, 81(6), 680.
218
Wheelwright, Steven C. (1992). Revolutionizing product development: quantum leaps in speed, efficiency, and quality: Free Press.
Wisner, Joel D, & Eakins, Stan G. (1994). A performance assessment of the US Baldrige
Quality Award winners. International Journal of Quality & Reliability Management, 11(2), 8-25.
Wong, A., Tjosvold, D., & Liu, C. (2009). Innovation by Teams in Shanghai, China: Cooperative Goals for Group Confidence and Persistence*. British Journal of Management, 20(2), 238-251.
Yang, Ching-Chiao, Marlow, Peter B, & Lu, Chin-Shan. (2009). Assessing resources, logistics service capabilities, innovation capabilities and the performance of container shipping services in Taiwan. International Journal of Production Economics, 122(1), 4-20.
Zairi, Mohamed. (1994). Innovation or innovativeness? Results of a benchmarking study. Total Quality Management, 5(3), 27-44.
Zaltman, G., Duncan, R., & Holbek, J. (1973). Innovations and organizations: Wiley.