Embed Size (px)
Citation preview
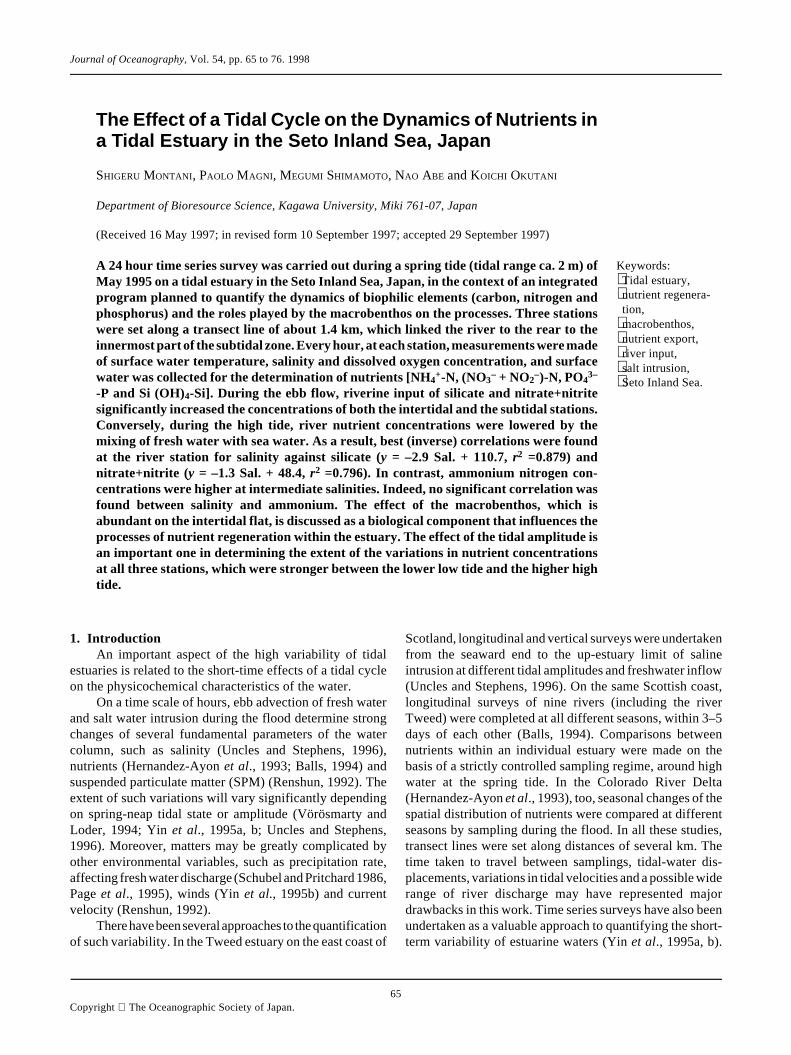
Journal of Oceanography, Vol. 54, pp. 65 to 76. 1998
65Copyright The Oceanographic Society of Japan.
The Effect of a Tidal Cycle on the Dynamics of Nutrients ina Tidal Estuary in the Seto Inland Sea, Japan
SHIGERU MONTANI, PAOLO MAGNI, MEGUMI SHIMAMOTO, NAO ABE and KOICHI OKUTANI
Department of Bioresource Science, Kagawa University, Miki 761-07, Japan
(Received 16 May 1997; in revised form 10 September 1997; accepted 29 September 1997)
A 24 hour time series survey was carried out during a spring tide (tidal range ca. 2 m) ofMay 1995 on a tidal estuary in the Seto Inland Sea, Japan, in the context of an integratedprogram planned to quantify the dynamics of biophilic elements (carbon, nitrogen andphosphorus) and the roles played by the macrobenthos on the processes. Three stationswere set along a transect line of about 1.4 km, which linked the river to the rear to theinnermost part of the subtidal zone. Every hour, at each station, measurements were madeof surface water temperature, salinity and dissolved oxygen concentration, and surfacewater was collected for the determination of nutrients [NH4
+-N, (NO3– + NO2
–)-N, PO43–
-P and Si (OH)4-Si]. During the ebb flow, riverine input of silicate and nitrate+nitritesignificantly increased the concentrations of both the intertidal and the subtidal stations.Conversely, during the high tide, river nutrient concentrations were lowered by themixing of fresh water with sea water. As a result, best (inverse) correlations were foundat the river station for salinity against silicate (y = –2.9 Sal. + 110.7, r2 =0.879) andnitrate+nitrite (y = –1.3 Sal. + 48.4, r2 =0.796). In contrast, ammonium nitrogen con-centrations were higher at intermediate salinities. Indeed, no significant correlation wasfound between salinity and ammonium. The effect of the macrobenthos, which isabundant on the intertidal flat, is discussed as a biological component that influences theprocesses of nutrient regeneration within the estuary. The effect of the tidal amplitude isan important one in determining the extent of the variations in nutrient concentrationsat all three stations, which were stronger between the lower low tide and the higher hightide.
Keywords:⋅Tidal estuary,⋅nutrient regenera-tion,
⋅macrobenthos,⋅nutrient export,⋅ river input,⋅ salt intrusion,⋅Seto Inland Sea.
1. IntroductionAn important aspect of the high variability of tidal
estuaries is related to the short-time effects of a tidal cycleon the physicochemical characteristics of the water.
On a time scale of hours, ebb advection of fresh waterand salt water intrusion during the flood determine strongchanges of several fundamental parameters of the watercolumn, such as salinity (Uncles and Stephens, 1996),nutrients (Hernandez-Ayon et al., 1993; Balls, 1994) andsuspended particulate matter (SPM) (Renshun, 1992). Theextent of such variations will vary significantly dependingon spring-neap tidal state or amplitude (Vörösmarty andLoder, 1994; Yin et al., 1995a, b; Uncles and Stephens,1996). Moreover, matters may be greatly complicated byother environmental variables, such as precipitation rate,affecting fresh water discharge (Schubel and Pritchard 1986,Page et al., 1995), winds (Yin et al., 1995b) and currentvelocity (Renshun, 1992).
There have been several approaches to the quantificationof such variability. In the Tweed estuary on the east coast of
Scotland, longitudinal and vertical surveys were undertakenfrom the seaward end to the up-estuary limit of salineintrusion at different tidal amplitudes and freshwater inflow(Uncles and Stephens, 1996). On the same Scottish coast,longitudinal surveys of nine rivers (including the riverTweed) were completed at all different seasons, within 3–5days of each other (Balls, 1994). Comparisons betweennutrients within an individual estuary were made on thebasis of a strictly controlled sampling regime, around highwater at the spring tide. In the Colorado River Delta(Hernandez-Ayon et al., 1993), too, seasonal changes of thespatial distribution of nutrients were compared at differentseasons by sampling during the flood. In all these studies,transect lines were set along distances of several km. Thetime taken to travel between samplings, tidal-water dis-placements, variations in tidal velocities and a possible widerange of river discharge may have represented majordrawbacks in this work. Time series surveys have also beenundertaken as a valuable approach to quantifying the short-term variability of estuarine waters (Yin et al., 1995a, b).
66 S. Montani et al.
However, less information seems to be available about theeffect of a tidal cycle on short distances, with coordinate andreal-time (not elapsed time) information at different stations.
A task of primary importance when studying nutrientdistributions within an estuary is an evaluation of bothinland inputs and in situ regeneration. Balls (1994) indicatedthat, on rivers along the Scottish East Coast, nutrient con-centrations were related to land use. He reported nitrate +nitrite and phosphate concentrations up to 600 µM and 7 µM,respectively, in river catchments with intensive agricultureand low freshwater input. On the Forth River, Balls (1992)found a broad mid-estuarine maximum of ammonium con-centration during the summer months. This maximum wasattributed to a benthic input from decomposing materials inthe sediment, suggesting that ammonium import by freshwater discharge was less significant than nitrate + nitrite.Also, in a Southern Californian salt marsh, estimations ofthe tidal export of ammonium were often more than 100times higher than estimated loading from stream discharge,and it was independent of loading rates (Page et al., 1995).Possible explanations for ammonium regeneration withinthe marsh were given, such as dissimilatory reduction ofnitrate, microbial ammonification of organic material inmarsh sediments, and excretory products of themacrobenthos.
The present study is part of a long-term, integratedmonitoring program which aims at quantifying the dynamicsof biophilic elements (carbon, nitrogen, phosphorus) in asmall tidal estuary in the Seto Inland Sea, Japan. Within thisprogram we followed, on a monthly basis, the quantitativeseasonal changes of abundance and faunal composition ofthe intertidal and subtidal benthic communities to evaluatethe roles played by the autochtonous macrobenthos in theprocesses.
The first objective of this study was to evaluate theimpact of river runoff and salt intrusion on the nutrientbalance of this estuary during a complete tidal cycle. Sincethis is a mixed-semidiurnal type estuary (with pronounceddifferences between two successive low and high tides) weaimed to quantify the influence of the tidal amplitude on theextent of fresh water intrusion. Our second objective was toverify the sources of the different nutrients: from inland,outside or within the estuary.
2. Materials and MethodsThe survey was carried out during a spring tide of May
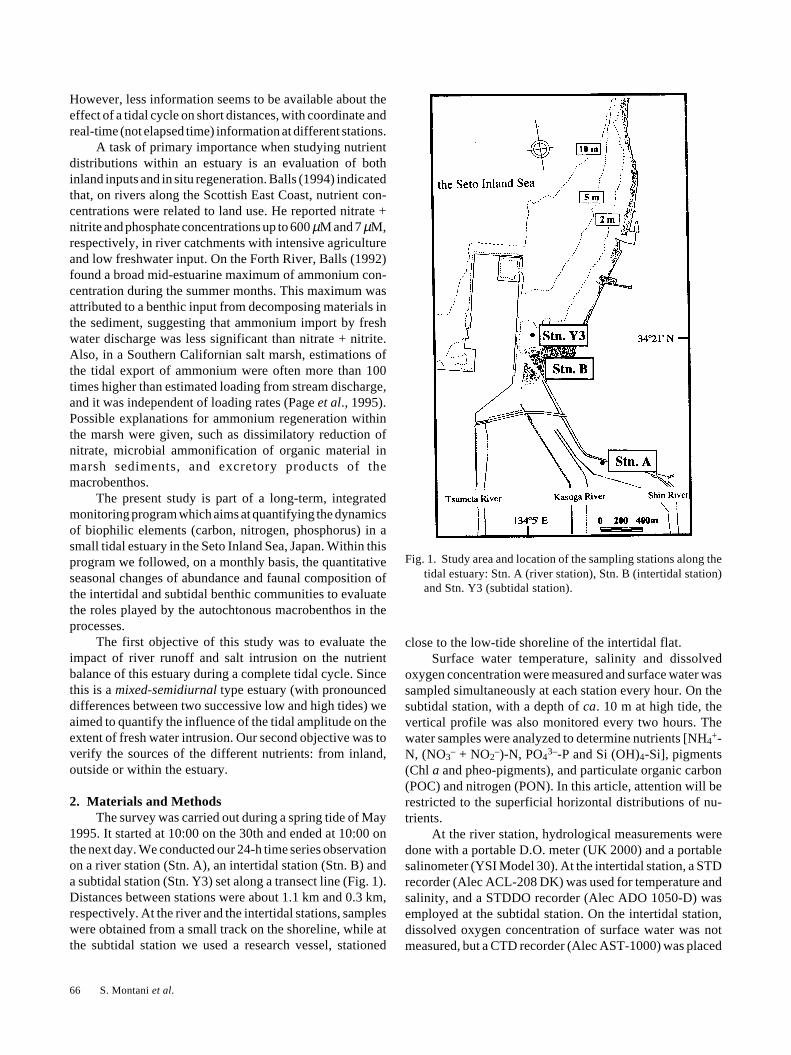
1995. It started at 10:00 on the 30th and ended at 10:00 onthe next day. We conducted our 24-h time series observationon a river station (Stn. A), an intertidal station (Stn. B) anda subtidal station (Stn. Y3) set along a transect line (Fig. 1).Distances between stations were about 1.1 km and 0.3 km,respectively. At the river and the intertidal stations, sampleswere obtained from a small track on the shoreline, while atthe subtidal station we used a research vessel, stationed
close to the low-tide shoreline of the intertidal flat.Surface water temperature, salinity and dissolved
oxygen concentration were measured and surface water wassampled simultaneously at each station every hour. On thesubtidal station, with a depth of ca. 10 m at high tide, thevertical profile was also monitored every two hours. Thewater samples were analyzed to determine nutrients [NH4
+-N, (NO3
– + NO2–)-N, PO4
3–-P and Si (OH)4-Si], pigments(Chl a and pheo-pigments), and particulate organic carbon(POC) and nitrogen (PON). In this article, attention will berestricted to the superficial horizontal distributions of nu-trients.
At the river station, hydrological measurements weredone with a portable D.O. meter (UK 2000) and a portablesalinometer (YSI Model 30). At the intertidal station, a STDrecorder (Alec ACL-208 DK) was used for temperature andsalinity, and a STDDO recorder (Alec ADO 1050-D) wasemployed at the subtidal station. On the intertidal station,dissolved oxygen concentration of surface water was notmeasured, but a CTD recorder (Alec AST-1000) was placed
Fig. 1. Study area and location of the sampling stations along thetidal estuary: Stn. A (river station), Stn. B (intertidal station)and Stn. Y3 (subtidal station).
Nutrient Dynamics in a Tidal Estuary 67
about 10 cm from the bottom sediment.Water samples from the three sampling stations were
brought to the laboratory simultaneously, every 6 h, and,soon after, filtered through Nucleopore filters (pore size: 0.4µm). Nutrient concentrations in the dissolved phase weredetermined in duplicate using a nutrient autoanalyzer(Technicon II) according to the method of Strickland andParsons (1972).
3. Results
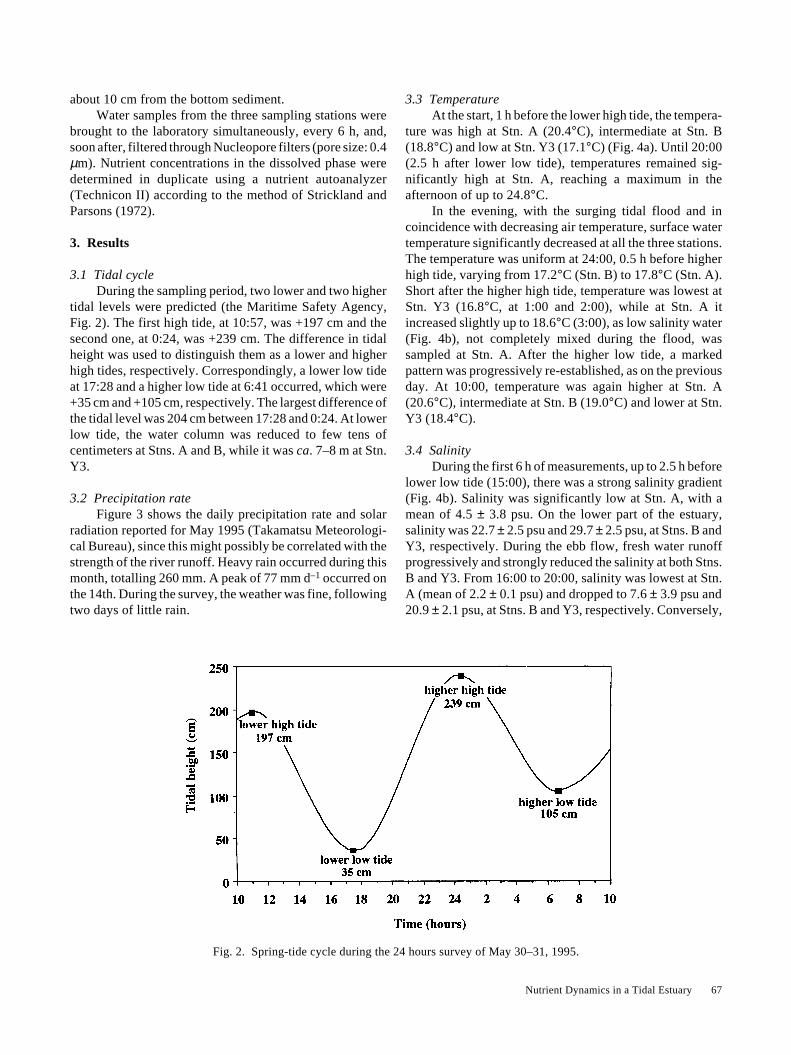
3.1 Tidal cycleDuring the sampling period, two lower and two higher
tidal levels were predicted (the Maritime Safety Agency,Fig. 2). The first high tide, at 10:57, was +197 cm and thesecond one, at 0:24, was +239 cm. The difference in tidalheight was used to distinguish them as a lower and higherhigh tides, respectively. Correspondingly, a lower low tideat 17:28 and a higher low tide at 6:41 occurred, which were+35 cm and +105 cm, respectively. The largest difference ofthe tidal level was 204 cm between 17:28 and 0:24. At lowerlow tide, the water column was reduced to few tens ofcentimeters at Stns. A and B, while it was ca. 7–8 m at Stn.Y3.
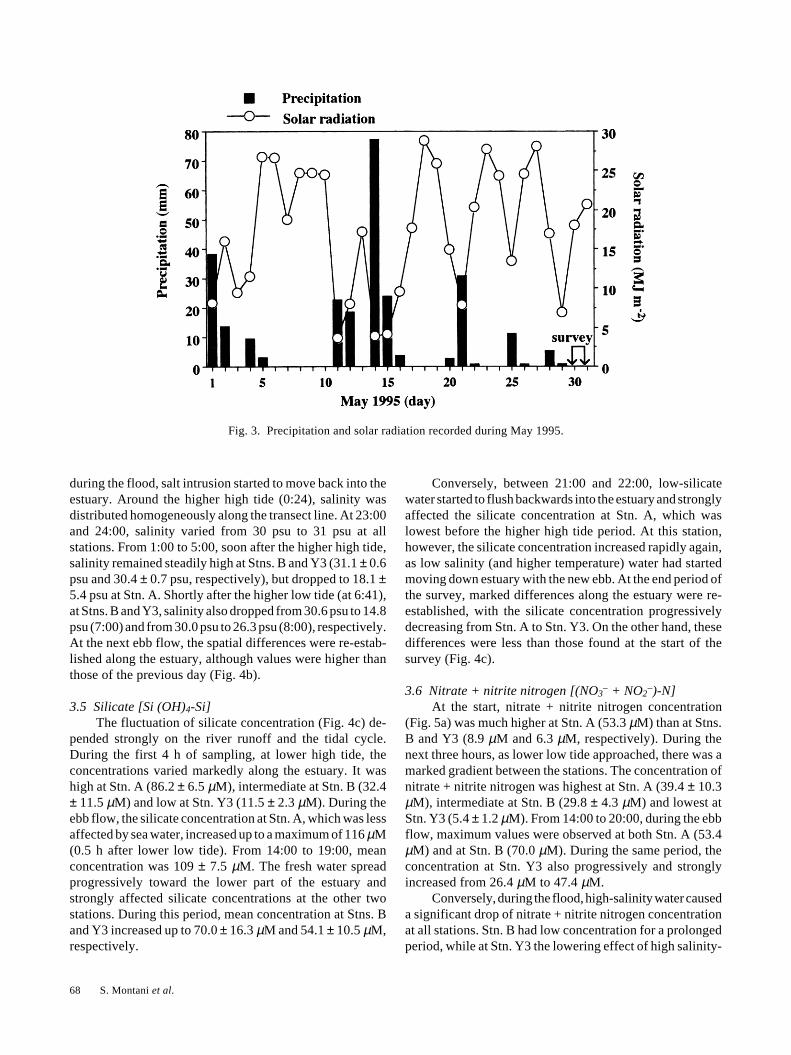
3.2 Precipitation rateFigure 3 shows the daily precipitation rate and solar
radiation reported for May 1995 (Takamatsu Meteorologi-cal Bureau), since this might possibly be correlated with thestrength of the river runoff. Heavy rain occurred during thismonth, totalling 260 mm. A peak of 77 mm d–1 occurred onthe 14th. During the survey, the weather was fine, followingtwo days of little rain.
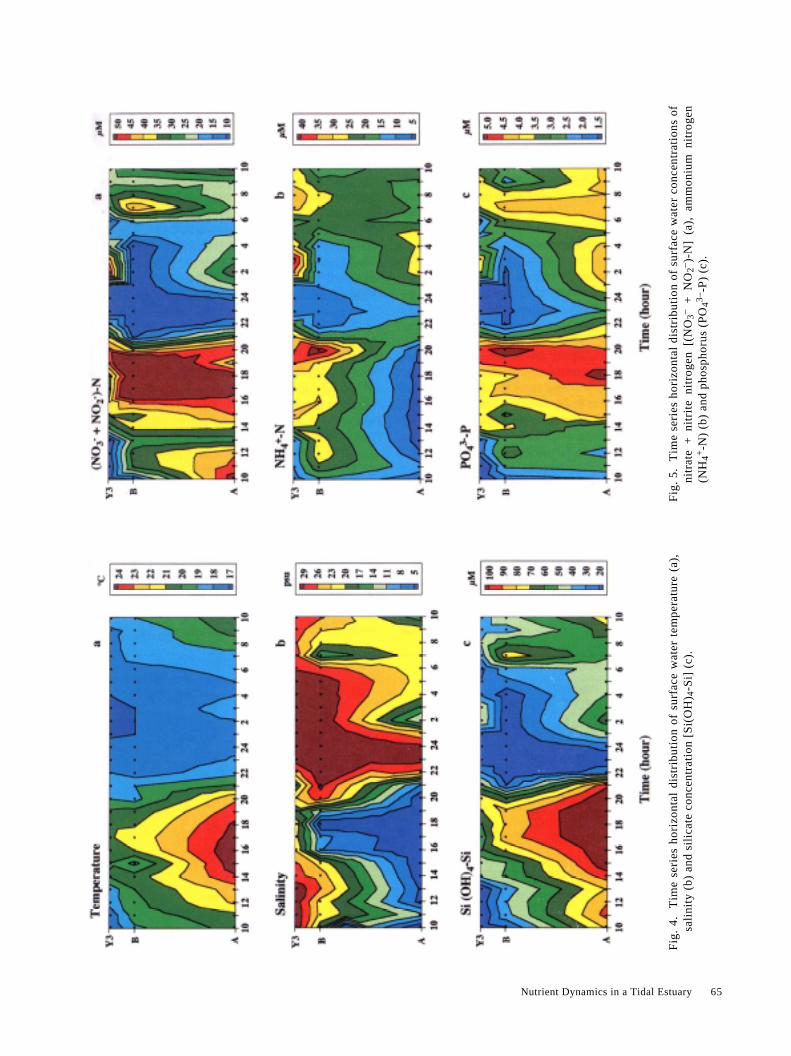
3.3 TemperatureAt the start, 1 h before the lower high tide, the tempera-
ture was high at Stn. A (20.4°C), intermediate at Stn. B(18.8°C) and low at Stn. Y3 (17.1°C) (Fig. 4a). Until 20:00(2.5 h after lower low tide), temperatures remained sig-nificantly high at Stn. A, reaching a maximum in theafternoon of up to 24.8°C.
In the evening, with the surging tidal flood and incoincidence with decreasing air temperature, surface watertemperature significantly decreased at all the three stations.The temperature was uniform at 24:00, 0.5 h before higherhigh tide, varying from 17.2°C (Stn. B) to 17.8°C (Stn. A).Short after the higher high tide, temperature was lowest atStn. Y3 (16.8°C, at 1:00 and 2:00), while at Stn. A itincreased slightly up to 18.6°C (3:00), as low salinity water(Fig. 4b), not completely mixed during the flood, wassampled at Stn. A. After the higher low tide, a markedpattern was progressively re-established, as on the previousday. At 10:00, temperature was again higher at Stn. A(20.6°C), intermediate at Stn. B (19.0°C) and lower at Stn.Y3 (18.4°C).
3.4 SalinityDuring the first 6 h of measurements, up to 2.5 h before
lower low tide (15:00), there was a strong salinity gradient(Fig. 4b). Salinity was significantly low at Stn. A, with amean of 4.5 ± 3.8 psu. On the lower part of the estuary,salinity was 22.7 ± 2.5 psu and 29.7 ± 2.5 psu, at Stns. B andY3, respectively. During the ebb flow, fresh water runoffprogressively and strongly reduced the salinity at both Stns.B and Y3. From 16:00 to 20:00, salinity was lowest at Stn.A (mean of 2.2 ± 0.1 psu) and dropped to 7.6 ± 3.9 psu and20.9 ± 2.1 psu, at Stns. B and Y3, respectively. Conversely,
Fig. 2. Spring-tide cycle during the 24 hours survey of May 30–31, 1995.
68 S. Montani et al.
during the flood, salt intrusion started to move back into theestuary. Around the higher high tide (0:24), salinity wasdistributed homogeneously along the transect line. At 23:00and 24:00, salinity varied from 30 psu to 31 psu at allstations. From 1:00 to 5:00, soon after the higher high tide,salinity remained steadily high at Stns. B and Y3 (31.1 ± 0.6psu and 30.4 ± 0.7 psu, respectively), but dropped to 18.1 ±5.4 psu at Stn. A. Shortly after the higher low tide (at 6:41),at Stns. B and Y3, salinity also dropped from 30.6 psu to 14.8psu (7:00) and from 30.0 psu to 26.3 psu (8:00), respectively.At the next ebb flow, the spatial differences were re-estab-lished along the estuary, although values were higher thanthose of the previous day (Fig. 4b).
3.5 Silicate [Si (OH)4-Si]The fluctuation of silicate concentration (Fig. 4c) de-
pended strongly on the river runoff and the tidal cycle.During the first 4 h of sampling, at lower high tide, theconcentrations varied markedly along the estuary. It washigh at Stn. A (86.2 ± 6.5 µM), intermediate at Stn. B (32.4± 11.5 µM) and low at Stn. Y3 (11.5 ± 2.3 µM). During theebb flow, the silicate concentration at Stn. A, which was lessaffected by sea water, increased up to a maximum of 116 µM(0.5 h after lower low tide). From 14:00 to 19:00, meanconcentration was 109 ± 7.5 µM. The fresh water spreadprogressively toward the lower part of the estuary andstrongly affected silicate concentrations at the other twostations. During this period, mean concentration at Stns. Band Y3 increased up to 70.0 ± 16.3 µM and 54.1 ± 10.5 µM,respectively.
Conversely, between 21:00 and 22:00, low-silicatewater started to flush backwards into the estuary and stronglyaffected the silicate concentration at Stn. A, which waslowest before the higher high tide period. At this station,however, the silicate concentration increased rapidly again,as low salinity (and higher temperature) water had startedmoving down estuary with the new ebb. At the end period ofthe survey, marked differences along the estuary were re-established, with the silicate concentration progressivelydecreasing from Stn. A to Stn. Y3. On the other hand, thesedifferences were less than those found at the start of thesurvey (Fig. 4c).
3.6 Nitrate + nitrite nitrogen [(NO3– + NO2
–)-N]At the start, nitrate + nitrite nitrogen concentration
(Fig. 5a) was much higher at Stn. A (53.3 µM) than at Stns.B and Y3 (8.9 µM and 6.3 µM, respectively). During thenext three hours, as lower low tide approached, there was amarked gradient between the stations. The concentration ofnitrate + nitrite nitrogen was highest at Stn. A (39.4 ± 10.3µM), intermediate at Stn. B (29.8 ± 4.3 µM) and lowest atStn. Y3 (5.4 ± 1.2 µM). From 14:00 to 20:00, during the ebbflow, maximum values were observed at both Stn. A (53.4µM) and at Stn. B (70.0 µM). During the same period, theconcentration at Stn. Y3 also progressively and stronglyincreased from 26.4 µM to 47.4 µM.
Conversely, during the flood, high-salinity water causeda significant drop of nitrate + nitrite nitrogen concentrationat all stations. Stn. B had low concentration for a prolongedperiod, while at Stn. Y3 the lowering effect of high salinity-
Fig. 3. Precipitation and solar radiation recorded during May 1995.
Nutrient Dynamics in a Tidal Estuary 65
Fig
. 4.
T
ime
seri
e s h
oriz
onta
l di
stri
buti
on o
f su
rfa c
e w
a te r
tem
pera
ture
(a )
,sa
l ini
t y (
b) a
nd s
i li c
ate
conc
ent r
ati o
n [S
i (O
H) 4
-Si ]
(c)
.F
ig.
5.
Tim
e se
rie s
hor
izon
tal
dist
ribu
tion
of
surf
a ce
wa t
e r c
onc e
ntra
tion
s of
nit r
ate
+ n
i tri
t e n
i tro
gen
[(N
O3–
+ N
O2– )
-N]
(a),
am
mon
i um
ni t
roge
n(N
H4+
-N)
(b)
and
phos
phor
us (
PO
43–-P
) (c
).
70 S. Montani et al.
water was overcome, from 1:00 to 4:00 (Fig. 5a), by inter-tidal water with a much higher nutrient concentration. AtStn. A, soon after the higher high tide (0:24), low salinitywater (salinity 10.6 psu at 2:00, Fig. 4b) coincided with anincrease in nitrate + nitrite nitrogen concentration up to 33.5µM. During the next ebb flow, the low salinity and highsilicate and nitrate + nitrite nitrogen water mass had moveddown the estuary. This particularly influenced concentra-tions at Stn. B, where nitrate + nitrite nitrogen concentrationincreased up to a peak of 44.4 µM, at 7:00.
At 9:00, nitrate + nitrite nitrogen concentration wasrather homogeneous along the estuary. At 10:00, at the endof the survey, the same distributional pattern as the previousday was present, although to a more limited extent.
3.7 Ammonium nitrogen (NH4+-N)
As Fig. 5b shows, during the first 4 h of sampling,ammonium nitrogen concentration was relatively low andsimilar at Stns. A and Y3, with a mean of 6.9 ± 3.7 µM and9.6 ± 2.0 µM, respectively. By contrast, the concentrationwas significantly higher at Stn. B, with a mean of 23.4 ± 5.7µM. During the ebb flow, fresh water did not lower am-monium concentration at Stn. B. Conversely, intertidalwater strongly affected the concentration at Stn. Y3, whichincreased significantly. From 14:00 to 21:00, mean con-centration was 28.3 ± 7.1 µM and 29.5 ± 4.6 µM, at Stns. Band Y3, respectively. During this period, the ammoniumconcentration at Stn. A was the lowest, as it was in salinity.From 14:00 to 20:00, both salinity and ammonium con-centration at Stn. A were the least, with a mean of 2.3 ± 0.2psu and 3.0 ± 0.8 µM, respectively.
With the new surging flood, high salinity water changed
the nutrient distributional pattern. At Stn. Y3 from 21:00 to23:00, ammonium concentration dropped from 31.7 µM to4.8 µM. At Stn. B from 20:00 to 22:00, it dropped from 43.3µM to 6.9 µM. At Stn. A, ammonium concentration in-creased by intertidal water brought up stream.
After the higher high tide, the influence of sea waterstarted to diminish and concentration increased both at Stn.Y3 and at Stn. B. It also increased further at Stn. A. From6:00, at the higher low tide, the concentration in the lowerpart of the estuary was again higher than those in the upperpart. As with salinity, the limited strength of the higher lowtide gave higher ammonium concentrations than those foundduring the lower low tide.
3.8 Phosphate (PO43–-P)
During the first four hours of sampling, the phosphateconcentration (Fig. 5c) at Stns. A and B was higher than thatat Stn. Y3. Mean concentrations were 2.5 ± 0.4 µM, 2.6 ± 0.7µM and 1.3 ± 0.6 µM, respectively. During the ebb tide, thephosphate concentration increased up to 5.3 µM at Stn. Aand 5.2 at Stn. B (18:00). That increase strongly influencedphosphate concentration at Stn. Y3.
From 21:00–22:00, as the tidal level rose, phosphateconcentration at both Stn. Y3 and Stn. B decreased to thelowest values. At Stn. Y3, 0.5 h before and after the higherhigh tide, the concentration was 1.0 µM. At Stn. B from22:00 to 2:00, phosphate concentration was constant at 1.4µM. But the concentration at Stn. A reduced to a very limitedextent (2.5 µM) for a shorter period. At this station, soonafter midnight, low salinity water lead to an increase inphosphorus concentration until the end of the survey.
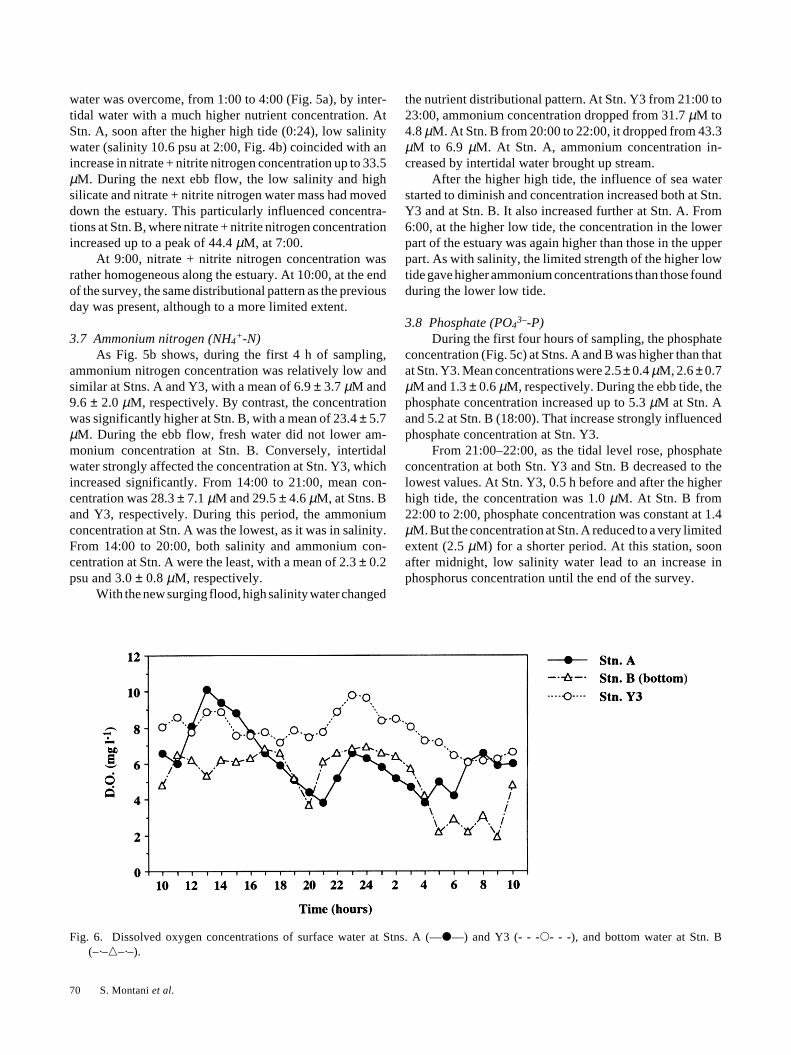
Fig. 6. Dissolved oxygen concentrations of surface water at Stns. A (—�—) and Y3 (- - -�- - -), and bottom water at Stn. B(–·–�–·–).
Nutrient Dynamics in a Tidal Estuary 71
3.9 Dissolved oxygenDissolved oxygen concentration (Fig. 6) varied among
3.8 mg l–1 and 10.1 mg l–1 at Stn. A, among 1.9 mg l–1 and6.9 mg l–1 at Stn. B (ca. 10 cm above the bottom sediment)and among 6.1 mg l–1 and 9.8 mg l–1 at Stn. Y3. A widefluctuation of dissolved oxygen concentration was observedat both Stns. A and B, a more limited one at Stn. Y3. At Stn.A it was highest at 13:00 (10.1 mg l–1) and decreased pro-gressively during the ebb period, with a minimum at 21:00(3.8 mg l–1). At Stn. B from the start to 3:00, near-bottomwater was normoxic (76.0 ± 10.2% of air saturation).However from 4:00 to the next sunrise, a significant drop ofconcentration was observed, with a minimum of 1.9 mg l–1
(23.5% of air saturation) at 9:00 (Fig. 6).
4. Discussion
4.1 Physical parameters and environmental variablesFresh water runoff strongly influenced the superficial
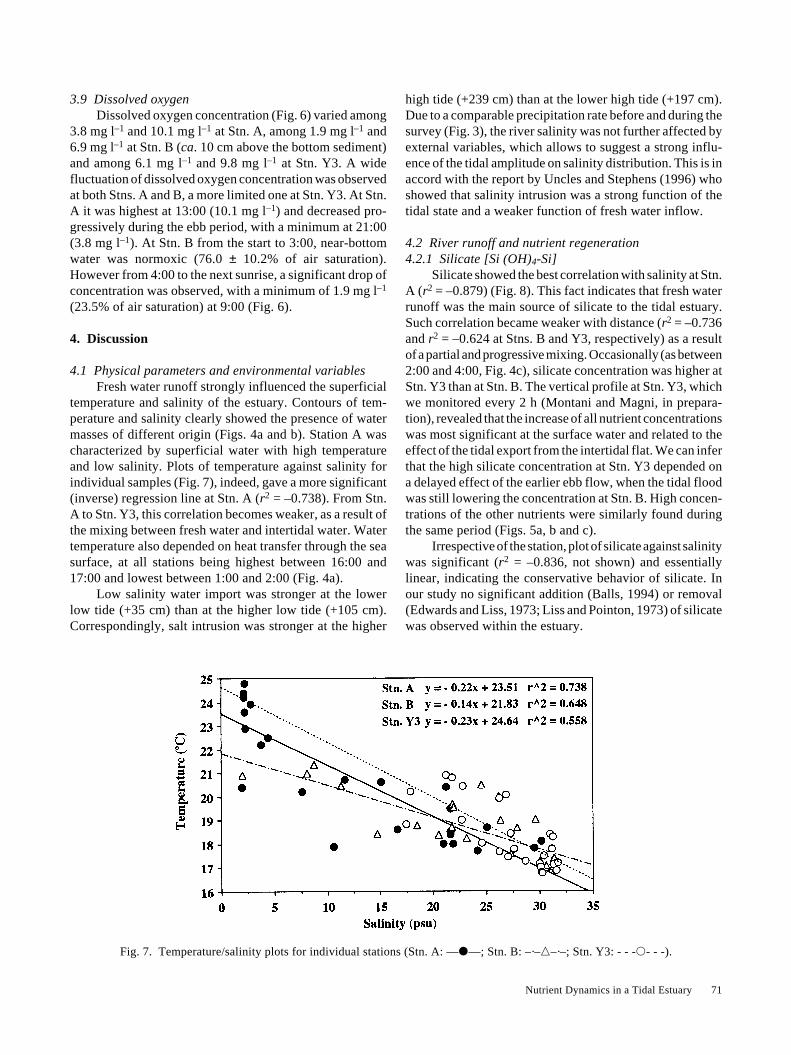
temperature and salinity of the estuary. Contours of tem-perature and salinity clearly showed the presence of watermasses of different origin (Figs. 4a and b). Station A wascharacterized by superficial water with high temperatureand low salinity. Plots of temperature against salinity forindividual samples (Fig. 7), indeed, gave a more significant(inverse) regression line at Stn. A (r2 = –0.738). From Stn.A to Stn. Y3, this correlation becomes weaker, as a result ofthe mixing between fresh water and intertidal water. Watertemperature also depended on heat transfer through the seasurface, at all stations being highest between 16:00 and17:00 and lowest between 1:00 and 2:00 (Fig. 4a).
Low salinity water import was stronger at the lowerlow tide (+35 cm) than at the higher low tide (+105 cm).Correspondingly, salt intrusion was stronger at the higher
high tide (+239 cm) than at the lower high tide (+197 cm).Due to a comparable precipitation rate before and during thesurvey (Fig. 3), the river salinity was not further affected byexternal variables, which allows to suggest a strong influ-ence of the tidal amplitude on salinity distribution. This is inaccord with the report by Uncles and Stephens (1996) whoshowed that salinity intrusion was a strong function of thetidal state and a weaker function of fresh water inflow.
4.2 River runoff and nutrient regeneration4.2.1 Silicate [Si (OH)4-Si]
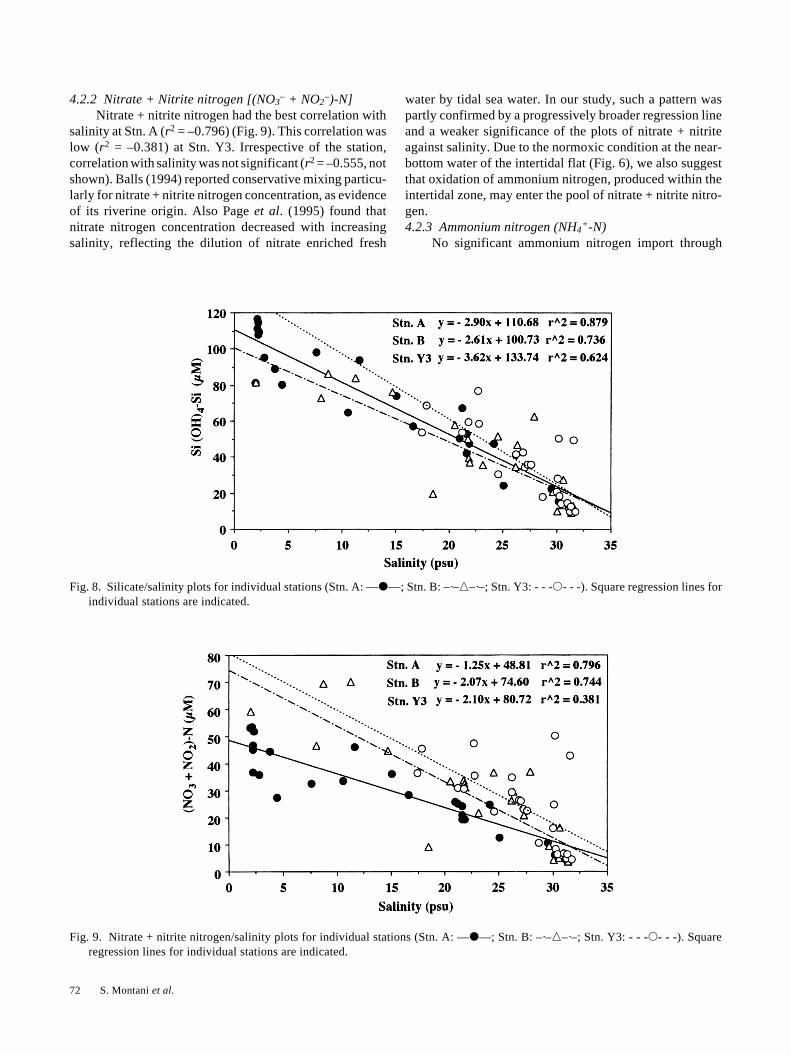
Silicate showed the best correlation with salinity at Stn.A (r2 = –0.879) (Fig. 8). This fact indicates that fresh waterrunoff was the main source of silicate to the tidal estuary.Such correlation became weaker with distance (r2 = –0.736and r2 = –0.624 at Stns. B and Y3, respectively) as a resultof a partial and progressive mixing. Occasionally (as between2:00 and 4:00, Fig. 4c), silicate concentration was higher atStn. Y3 than at Stn. B. The vertical profile at Stn. Y3, whichwe monitored every 2 h (Montani and Magni, in prepara-tion), revealed that the increase of all nutrient concentrationswas most significant at the surface water and related to theeffect of the tidal export from the intertidal flat. We can inferthat the high silicate concentration at Stn. Y3 depended ona delayed effect of the earlier ebb flow, when the tidal floodwas still lowering the concentration at Stn. B. High concen-trations of the other nutrients were similarly found duringthe same period (Figs. 5a, b and c).
Irrespective of the station, plot of silicate against salinitywas significant (r2 = –0.836, not shown) and essentiallylinear, indicating the conservative behavior of silicate. Inour study no significant addition (Balls, 1994) or removal(Edwards and Liss, 1973; Liss and Pointon, 1973) of silicatewas observed within the estuary.
Fig. 7. Temperature/salinity plots for individual stations (Stn. A: —�—; Stn. B: –·–�–·–; Stn. Y3: - - -�- - -).
72 S. Montani et al.
4.2.2 Nitrate + Nitrite nitrogen [(NO3– + NO2
–)-N]Nitrate + nitrite nitrogen had the best correlation with
salinity at Stn. A (r2 = –0.796) (Fig. 9). This correlation waslow (r2 = –0.381) at Stn. Y3. Irrespective of the station,correlation with salinity was not significant (r2 = –0.555, notshown). Balls (1994) reported conservative mixing particu-larly for nitrate + nitrite nitrogen concentration, as evidenceof its riverine origin. Also Page et al. (1995) found thatnitrate nitrogen concentration decreased with increasingsalinity, reflecting the dilution of nitrate enriched fresh
water by tidal sea water. In our study, such a pattern waspartly confirmed by a progressively broader regression lineand a weaker significance of the plots of nitrate + nitriteagainst salinity. Due to the normoxic condition at the near-bottom water of the intertidal flat (Fig. 6), we also suggestthat oxidation of ammonium nitrogen, produced within theintertidal zone, may enter the pool of nitrate + nitrite nitro-gen.4.2.3 Ammonium nitrogen (NH4
+-N)No significant ammonium nitrogen import through
Fig. 9. Nitrate + nitrite nitrogen/salinity plots for individual stations (Stn. A: —�—; Stn. B: –·–�–·–; Stn. Y3: - - -�- - -). Squareregression lines for individual stations are indicated.
Fig. 8. Silicate/salinity plots for individual stations (Stn. A: —�—; Stn. B: –·–�–·–; Stn. Y3: - - -�- - -). Square regression lines forindividual stations are indicated.
Nutrient Dynamics in a Tidal Estuary 73
The bivalves excreted an average of ca. 20 µM gDW–1h–1 (at20°C) of ammonium nitrogen (Magni et al., in preparation),which would result in 1200 µM of ammonium nitrogenm–2h–1 released from the intertidal flat as an excretionproduct on May 30th. This estimation supports our hypothesisabout the possible significant contribution of themacrobenthos on the processes of nutrient regeneration.4.2.4 Phosphate (PO4
3–-P)Balls (1994) showed that conservative mixing of nu-
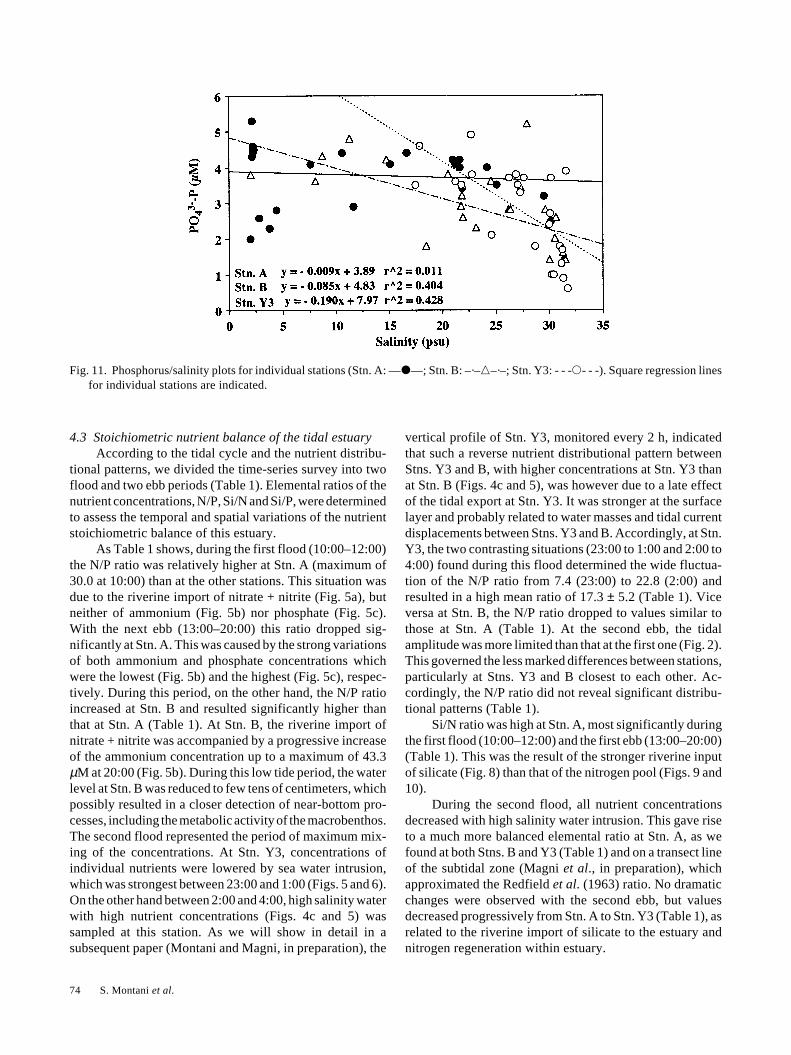
trients, particularly phosphate, was a function of estuarineflushing time, as related to the particle-water interaction andchemical speciation (Froelich, 1988). He found an increaseof phosphate concentration for mid-salinity, followed by aseaward decrease, most evident in turbid and slowly flushedestuaries. For the River Forth (about 40 km long), this factwas attributed to a release from suspended particles orreduced sediments, within the phosphate buffer mechanisms.In our study, we found no significant correlations betweenphosphorus and salinity, but a broad distribution of concen-tration along the salinity gradient (Fig. 11). The shortdistance of our transect line and the coincident samplingtime at individual stations would make the processes ofchemical speciation of phosphate less effective, as indicatedby Balls (1994). We suggest that this biophilic elementshould also be partly regenerated through biological processesof nutrient regeneration on the intertidal flat (Magni et al.,in preparation), and not solely exported by the river runoff.In our laboratory experiments, ca. 5 µM gDW–1 h–1 (at 20°C)of phosphate was excreted by the bivalves, which wouldresult in 300 µM of phosphate m–2h–1 released from theintertidal zone on May 30th.
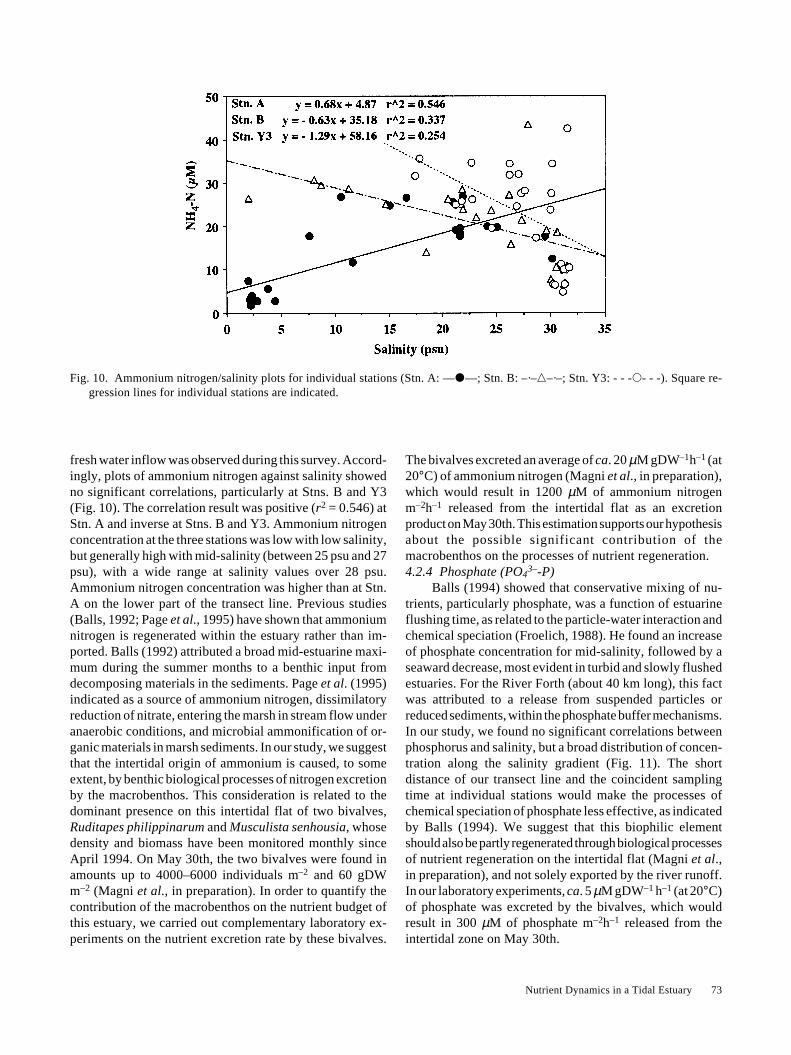
Fig. 10. Ammonium nitrogen/salinity plots for individual stations (Stn. A: —�—; Stn. B: –·–�–·–; Stn. Y3: - - -�- - -). Square re-gression lines for individual stations are indicated.
fresh water inflow was observed during this survey. Accord-ingly, plots of ammonium nitrogen against salinity showedno significant correlations, particularly at Stns. B and Y3(Fig. 10). The correlation result was positive (r2 = 0.546) atStn. A and inverse at Stns. B and Y3. Ammonium nitrogenconcentration at the three stations was low with low salinity,but generally high with mid-salinity (between 25 psu and 27psu), with a wide range at salinity values over 28 psu.Ammonium nitrogen concentration was higher than at Stn.A on the lower part of the transect line. Previous studies(Balls, 1992; Page et al., 1995) have shown that ammoniumnitrogen is regenerated within the estuary rather than im-ported. Balls (1992) attributed a broad mid-estuarine maxi-mum during the summer months to a benthic input fromdecomposing materials in the sediments. Page et al. (1995)indicated as a source of ammonium nitrogen, dissimilatoryreduction of nitrate, entering the marsh in stream flow underanaerobic conditions, and microbial ammonification of or-ganic materials in marsh sediments. In our study, we suggestthat the intertidal origin of ammonium is caused, to someextent, by benthic biological processes of nitrogen excretionby the macrobenthos. This consideration is related to thedominant presence on this intertidal flat of two bivalves,Ruditapes philippinarum and Musculista senhousia, whosedensity and biomass have been monitored monthly sinceApril 1994. On May 30th, the two bivalves were found inamounts up to 4000–6000 individuals m–2 and 60 gDWm–2 (Magni et al., in preparation). In order to quantify thecontribution of the macrobenthos on the nutrient budget ofthis estuary, we carried out complementary laboratory ex-periments on the nutrient excretion rate by these bivalves.
74 S. Montani et al.
4.3 Stoichiometric nutrient balance of the tidal estuaryAccording to the tidal cycle and the nutrient distribu-
tional patterns, we divided the time-series survey into twoflood and two ebb periods (Table 1). Elemental ratios of thenutrient concentrations, N/P, Si/N and Si/P, were determinedto assess the temporal and spatial variations of the nutrientstoichiometric balance of this estuary.
As Table 1 shows, during the first flood (10:00–12:00)the N/P ratio was relatively higher at Stn. A (maximum of30.0 at 10:00) than at the other stations. This situation wasdue to the riverine import of nitrate + nitrite (Fig. 5a), butneither of ammonium (Fig. 5b) nor phosphate (Fig. 5c).With the next ebb (13:00–20:00) this ratio dropped sig-nificantly at Stn. A. This was caused by the strong variationsof both ammonium and phosphate concentrations whichwere the lowest (Fig. 5b) and the highest (Fig. 5c), respec-tively. During this period, on the other hand, the N/P ratioincreased at Stn. B and resulted significantly higher thanthat at Stn. A (Table 1). At Stn. B, the riverine import ofnitrate + nitrite was accompanied by a progressive increaseof the ammonium concentration up to a maximum of 43.3µM at 20:00 (Fig. 5b). During this low tide period, the waterlevel at Stn. B was reduced to few tens of centimeters, whichpossibly resulted in a closer detection of near-bottom pro-cesses, including the metabolic activity of the macrobenthos.The second flood represented the period of maximum mix-ing of the concentrations. At Stn. Y3, concentrations ofindividual nutrients were lowered by sea water intrusion,which was strongest between 23:00 and 1:00 (Figs. 5 and 6).On the other hand between 2:00 and 4:00, high salinity waterwith high nutrient concentrations (Figs. 4c and 5) wassampled at this station. As we will show in detail in asubsequent paper (Montani and Magni, in preparation), the
vertical profile of Stn. Y3, monitored every 2 h, indicatedthat such a reverse nutrient distributional pattern betweenStns. Y3 and B, with higher concentrations at Stn. Y3 thanat Stn. B (Figs. 4c and 5), was however due to a late effectof the tidal export at Stn. Y3. It was stronger at the surfacelayer and probably related to water masses and tidal currentdisplacements between Stns. Y3 and B. Accordingly, at Stn.Y3, the two contrasting situations (23:00 to 1:00 and 2:00 to4:00) found during this flood determined the wide fluctua-tion of the N/P ratio from 7.4 (23:00) to 22.8 (2:00) andresulted in a high mean ratio of 17.3 ± 5.2 (Table 1). Viceversa at Stn. B, the N/P ratio dropped to values similar tothose at Stn. A (Table 1). At the second ebb, the tidalamplitude was more limited than that at the first one (Fig. 2).This governed the less marked differences between stations,particularly at Stns. Y3 and B closest to each other. Ac-cordingly, the N/P ratio did not reveal significant distribu-tional patterns (Table 1).
Si/N ratio was high at Stn. A, most significantly duringthe first flood (10:00–12:00) and the first ebb (13:00–20:00)(Table 1). This was the result of the stronger riverine inputof silicate (Fig. 8) than that of the nitrogen pool (Figs. 9 and10).
During the second flood, all nutrient concentrationsdecreased with high salinity water intrusion. This gave riseto a much more balanced elemental ratio at Stn. A, as wefound at both Stns. B and Y3 (Table 1) and on a transect lineof the subtidal zone (Magni et al., in preparation), whichapproximated the Redfield et al. (1963) ratio. No dramaticchanges were observed with the second ebb, but valuesdecreased progressively from Stn. A to Stn. Y3 (Table 1), asrelated to the riverine import of silicate to the estuary andnitrogen regeneration within estuary.
Fig. 11. Phosphorus/salinity plots for individual stations (Stn. A: —�—; Stn. B: –·–�–·–; Stn. Y3: - - -�- - -). Square regression linesfor individual stations are indicated.
Nutrient Dynamics in a Tidal Estuary 75
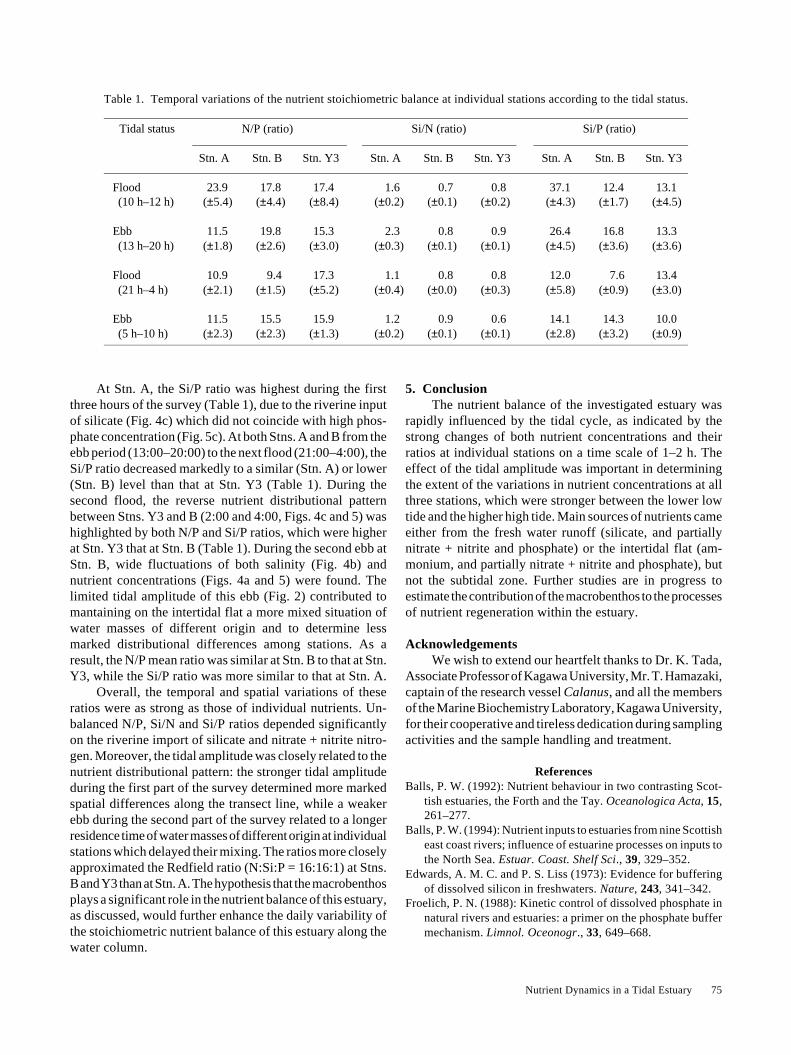
Table 1. Temporal variations of the nutrient stoichiometric balance at individual stations according to the tidal status.
Tidal status N/P (ratio) Si/N (ratio) Si/P (ratio)
Stn. A Stn. B Stn. Y3 Stn. A Stn. B Stn. Y3 Stn. A Stn. B Stn. Y3
Flood 23.9 17.8 17.4 1.6 0.7 0.8 37.1 12.4 13.1(10 h–12 h) (±5.4) (±4.4) (±8.4) (±0.2) (±0.1) (±0.2) (±4.3) (±1.7) (±4.5)
Ebb 11.5 19.8 15.3 2.3 0.8 0.9 26.4 16.8 13.3(13 h–20 h) (±1.8) (±2.6) (±3.0) (±0.3) (±0.1) (±0.1) (±4.5) (±3.6) (±3.6)
Flood 10.9 9.4 17.3 1.1 0.8 0.8 12.0 7.6 13.4(21 h–4 h) (±2.1) (±1.5) (±5.2) (±0.4) (±0.0) (±0.3) (±5.8) (±0.9) (±3.0)
Ebb 11.5 15.5 15.9 1.2 0.9 0.6 14.1 14.3 10.0(5 h–10 h) (±2.3) (±2.3) (±1.3) (±0.2) (±0.1) (±0.1) (±2.8) (±3.2) (±0.9)
At Stn. A, the Si/P ratio was highest during the firstthree hours of the survey (Table 1), due to the riverine inputof silicate (Fig. 4c) which did not coincide with high phos-phate concentration (Fig. 5c). At both Stns. A and B from theebb period (13:00–20:00) to the next flood (21:00–4:00), theSi/P ratio decreased markedly to a similar (Stn. A) or lower(Stn. B) level than that at Stn. Y3 (Table 1). During thesecond flood, the reverse nutrient distributional patternbetween Stns. Y3 and B (2:00 and 4:00, Figs. 4c and 5) washighlighted by both N/P and Si/P ratios, which were higherat Stn. Y3 that at Stn. B (Table 1). During the second ebb atStn. B, wide fluctuations of both salinity (Fig. 4b) andnutrient concentrations (Figs. 4a and 5) were found. Thelimited tidal amplitude of this ebb (Fig. 2) contributed tomantaining on the intertidal flat a more mixed situation ofwater masses of different origin and to determine lessmarked distributional differences among stations. As aresult, the N/P mean ratio was similar at Stn. B to that at Stn.Y3, while the Si/P ratio was more similar to that at Stn. A.
Overall, the temporal and spatial variations of theseratios were as strong as those of individual nutrients. Un-balanced N/P, Si/N and Si/P ratios depended significantlyon the riverine import of silicate and nitrate + nitrite nitro-gen. Moreover, the tidal amplitude was closely related to thenutrient distributional pattern: the stronger tidal amplitudeduring the first part of the survey determined more markedspatial differences along the transect line, while a weakerebb during the second part of the survey related to a longerresidence time of water masses of different origin at individualstations which delayed their mixing. The ratios more closelyapproximated the Redfield ratio (N:Si:P = 16:16:1) at Stns.B and Y3 than at Stn. A. The hypothesis that the macrobenthosplays a significant role in the nutrient balance of this estuary,as discussed, would further enhance the daily variability ofthe stoichiometric nutrient balance of this estuary along thewater column.
5. ConclusionThe nutrient balance of the investigated estuary was
rapidly influenced by the tidal cycle, as indicated by thestrong changes of both nutrient concentrations and theirratios at individual stations on a time scale of 1–2 h. Theeffect of the tidal amplitude was important in determiningthe extent of the variations in nutrient concentrations at allthree stations, which were stronger between the lower lowtide and the higher high tide. Main sources of nutrients cameeither from the fresh water runoff (silicate, and partiallynitrate + nitrite and phosphate) or the intertidal flat (am-monium, and partially nitrate + nitrite and phosphate), butnot the subtidal zone. Further studies are in progress toestimate the contribution of the macrobenthos to the processesof nutrient regeneration within the estuary.
AcknowledgementsWe wish to extend our heartfelt thanks to Dr. K. Tada,
Associate Professor of Kagawa University, Mr. T. Hamazaki,captain of the research vessel Calanus, and all the membersof the Marine Biochemistry Laboratory, Kagawa University,for their cooperative and tireless dedication during samplingactivities and the sample handling and treatment.
ReferencesBalls, P. W. (1992): Nutrient behaviour in two contrasting Scot-
tish estuaries, the Forth and the Tay. Oceanologica Acta, 15,261–277.
Balls, P. W. (1994): Nutrient inputs to estuaries from nine Scottisheast coast rivers; influence of estuarine processes on inputs tothe North Sea. Estuar. Coast. Shelf Sci., 39, 329–352.
Edwards, A. M. C. and P. S. Liss (1973): Evidence for bufferingof dissolved silicon in freshwaters. Nature, 243, 341–342.
Froelich, P. N. (1988): Kinetic control of dissolved phosphate innatural rivers and estuaries: a primer on the phosphate buffermechanism. Limnol. Oceonogr., 33, 649–668.
76 S. Montani et al.
Hernandez-Ayon, J. M., M. S. Galindo-Bect, B. P. Flores-Baezand S. Alvarez-Borrego (1993): Nutrient concentrations arehigh in the turbid waters of the Colorado river Delta. Estuar.Coast. Shelf Sci., 3, 593–602.
Liss P. S. and M. J. Pointon (1973): Removal of dissolved boronand silicon during estuarine mixing of sea and river waters.Geochim. Cosmochim. Acta, 37, 1493–1498.
Page, H. M., R. L. Petty and D. E. Meade (1995): Influence ofwatershed runoff on nutrient dynamics in a southern Californiasalt marsh. Estuar. Coast. Shelf Sci., 41, 163–180.
Redfield, A. C., B. H. Ketchum and F. A. Richard (1963): Theinfluence of organisms on the composition of sea water. p. 26–77. In The Sea, Vol. 2, ed. by M. N. Hill, John Wiley, NewYork.
Renshun, Z. (1992): Suspended sediment transport processes ontidal mud flat in Jiangsu Province, China. Estuar. Coast. ShelfSci., 35, 225–233.
Schubel, R. J. and D. W. Pritchard (1986): Responses of upper
Chesapeake Bay to variations in discharge of the Susquehannariver. Estuaries, 9, 236–249.
Strickland, J. D. H and T. R. Parsons (1972): A Practical handbookof seawater analysis. Bull. Fisher. Res. Board Canada 167, 310pp.
Uncles, R. J. and J. A. Stephens (1996): Salt intrusion in theTweed Estuary. Estuar. Coast. Shelf Sci., 43, 271–293.
Vörösmarty, C. J. and T. C. Loder (1994): Spring-neap tidalcontrasts and nutrient dynamics in a marsh-dominated estu-ary. Estuaries, 17, 537–551.
Yin, K., P. J. Harrison, S. Pond and R. J. Beamish (1995a):Entrainment of nitrate in the Fraser river estuary and itsbiological implications. II. Effects of spring vs. neap tide andriver discharge. Estuar. Coast. Shelf Sci., 40, 529–544.
Yin, K., P. J. Harrison, S. Pond and R. J. Beamish (1995b):Entrainment of nitrate in the Fraser river estuary and itsbiological implications. III. Effects of winds. Estuar. Coast.Shelf Sci., 40, 545–558.