Embed Size (px)
Citation preview

The Effects of Real Gasoline Prices on AutomobileDemand: A Structural Analysis Using Micro Data∗
Lutz Kilian†
University of Michigan and CEPR
Eric R. Sims‡
University of Michigan
April 18, 2006
Abstract
This paper studies the implications of unexpected changes in the real price of gasolineon the prices of used automobiles using an asset pricing model of car valuation. We employa unique data set which combines fuel economy estimates of a large variety of models fromthe US Department of Energy with price data from the National Auto Dealer’s Associationto construct a large panel of automobile prices. Using conventional measures of gasolineprice expectations, we find evidence of vast under-adjustment of car prices to fuel priceshocks. Allowing for behavioral models of expectations formation produces results thatsuggest far more adjustment. We find compelling evidence that positive fuel price surpriseshave a much stronger effect on automobile prices than do decreases. Our empirical resultson the extent of automobile price adjustment provide an upper bound on the strength ofthe effect of changes in real gasoline prices on automobile demand.
Keywords: Gasoline prices; expectations; automobiles; oil price shock; non-linearityJEL Classification Codes: Q43, L62, E32
∗Preliminary and incomplete. Comments and suggestions welcome. This paper is prepared in fulfillment ofthe third year paper requirement of the second author at the University of Michigan Department of Economics.The authors thank James Kahn for providing his data on his previous study of the same topic.
†e-mail: [email protected]‡e-mail: [email protected]

1 Introduction
It is widely believed that one of the key channels by which unanticipated energy price changes
affect real economic activity is through the effect on the demand for energy-intensive durable
goods such as automobiles. Indeed, casual evidence suggests a strong negative association be-
tween both the quantity and fuel economy of automobiles sold and the price of gasoline. The
existence of a causal link from fuel prices to automobile demand is central to theoretical models
of the impact of oil price fluctuations on the real economy. For example, Hamilton (1988) pro-
poses a general equilibrium model in which changes in oil prices can lead to prolonged periods
of high unemployment and low growth. The chief propagation mechanism in the model is that
changes in the price of oil affect the demand for energy-intensive durable goods such as auto-
mobiles. Any change in the demand for such goods necessitates a reallocation of labor across
sectors. To the extent to which labor is imperfectly mobile, changes in the price of energy can
result in sustained unemployment and low real activity if the dollar share of products whose
use depends critically on energy is large and the effect of changes in energy prices on demand
for such goods is strong. Papers by Bernanke (1983) and Bresnahan and Ramey (1993) discuss
additional mechanisms by which changes in energy prices may affect economic activity, both
relying upon a strong effect of changes in energy prices on consumer demand for goods such as
automobiles.1
Notwithstanding the importance of this link for theoretical models, with the exception of
some preliminary evidence by Kahn (1986), there has been no systematic empirical investigation
of the quantitative importance of this link at the micro level.2 In this paper, we will employ
a unique data set to characterize the quantitative effects of unanticipated changes in the real
price of gasoline on used automobile prices. Under the assumption that the market quantity
of used automobile services is fixed and that the forces underlying demand for new and used
automobiles are sufficiently similar, our empirical results on the extent of price adjustment of
used cars will provide an upper bound on the strength of the effect of changes in the real price
of gasoline on the demand for automobiles in general.
We postulate a structural equilibrium model that treats automobiles as assets whose prices
must adjust in response to unanticipated shocks so as to equate rates of return. Unexpected
changes in the real price of gasoline alter expected service flows from owning a car in the model,
1Whereas Hamilton (1988) stresses changes in demand driven by the loss in purchasing power induced byhigher oil prices, Bernanke (1983) stresses that fluctuations in the price of energy may cause agents to delaytheir purchases of long-lived energy-intensive durable goods. A common feature of both Hamilton (1988) andBernanke (1983) is the emphasis on sectoral reallocations from the automobile sector to other sectors. In contrast,Bresnahan and Ramey (1993) emphasize that fluctuations in gasoline prices alter the demand for automobilesof different fuel economy classes, necessitating a costly reallocation of factors among producers of automobiles.
2 For similar analyses using aggregate data, see Blomqvist and Haessel (1978), Duncan (1980), and Barskyand Kilian (2004).
1

thus necessitating a change in automobile prices. The model predicts that positive shocks to
the price of gasoline should depress the price of an automobile proportionately to the change in
expected lifetime operating expenses resulting from the increased cost of gasoline. This implies
that the relative price of fuel efficient cars to “gas guzzlers” should increase following a positive
fuel price shock. This relative price adjustment forms the basis of the analysis in Bresnahan and
Ramey (1993). The model also implies that demand for automobiles will fall across the board,
causing a reallocation of resources across sectors, as in Hamilton (1988). The objective of our
paper is the quantify these effects.
We employ a novel data set to estimate the effects of changes in the real price of gasoline
on automobile prices and demand. Data on the fuel efficiency of virtually every make of car
sold in the United States from 1978 to 1984 are collected from the United States Department
of Energy.3 In all, we have measures of fuel economy for nearly three thousand different vari-
eties of cars produced during the time frame. We painstakingly collected by hand data on the
prices of these cars for ages one through five years from the Used Car Guide published by the
National Auto Dealer’s Association for July of each year from 1979 to 1989, leaving us with ap-
proximately 14,000 observations of car prices across time.4 That we have a panel of automobile
prices across time and models allows us control for the potential simultaneity between automo-
bile demand and gasoline prices. The addition of time dummies permits consistent estimation
by least squares of the effects of variation in gasoline prices that is exogenous with respect to
US automobile demand on automobile prices.
In the baseline specification of the structural equilibrium model, we postulate that agents
treat the most recent value of the price of gasoline as the best predictor of the future. Estimation
results for the baseline regression specification are grossly inconsistent with this assumption. In
particular, we find striking evidence that car prices are unresponsive to unanticipated fuel price
changes, with no evidence of sizeable relative price adjustments between fuel efficient and “gas
guzzling” autos. This finding is extremely robust to alternative assumptions concerning the
life expectancy of autos, discounting of the future, expected total usage, and alternative linear
models of expectations formation.
Given the substantial amount of noise likely present in the monthly series for gasoline prices,
perhaps it is not surprising that a simple random walk model of gasoline price expectations pro-
3 The data on fuel efficiency is available up until the very recent past, and the authors are currently in theprocess of updating and extending their data set to include more recent years. That the data is on all cars soldin the United States means that we also have extensive data on the fuel economy of foreign produced autos.
4Kelley Blue Book produces similar data on used car prices. Our choide of the NADA guide was simplymotivated so as to facilitate comparison to the earlier work of Kahn (1986), who used automobile price datafrom this source.
2

duces counter-intuitive results. A natural conjecture is that agents intentionally ignore some of
the most recent information concerning gasoline prices when forming expectations of the future
as a means of filtering signal from noise, a notion consistent with work by Bernanke (1983).
As such, we allow for several deviations from the baseline specification in which agents fail to
continuously update their information concerning gasoline prices. This may take the form of a
delayed adjustment or of using averages of past gasoline prices to form expectations of the future.
While such specifications do lead to estimated response coefficients larger in magnitude than
in the baseline case, the response is still far smaller than that predicted by the theoretical model.
An alternative hypothesis is that positive fuel prices changes have a stronger effect on auto-
mobile prices than do decreases. This asymmetry hypothesis appeals to the psychological notion
that individuals may be acutely aware of events (such as increases in fuel prices) which adversely
affect them.5 We find broad empirical support for asymmetric specifications. In particular, the
responses of automobile prices to positive changes in the real price of gasoline are far greater in
magnitude than in the baseline case, whereas decreases in the price of gasoline have little or no
effect on prices.
We thus conclude that the effect of changes in the real price of gasoline on the demand for
automobiles is highly asymmetric, with increases in gasoline prices mattering a great deal more
than decreases. That the effect of higher gasoline prices on the demand for automobiles appears
asymmetric is also consistent with evidence that the reduced form relationship between crude
oil prices and real economic activity may be non-linear.6
The remainder of the paper is organized as follows. In Section 2 we highlight some intriguing
reduced form evidence on the relationship between gasoline prices and automobile sales. Sec-
tion 3 introduces the heretofore unutilized data set upon which our empirical analysis is based.
Section 4 presents the theoretical framework and derives the baseline regression specification.
Section 5 presents the empirical results for the baseline model involving simple ARIMA forecast
of the real price of gasoline. In Section 6 we study the same model under a variety of alterna-
tive behavioral assumptions regarding expectations formation. Section 7 offers a comparison to
Kahn’s (1986) previous work on this subject. We conclude in Section 8.
5 See Kahneman and Tversky (1979).6 For example, see Mork (1989) or Hamilton (1996, 2003).
3

2 Motivation
It continues to be an article of faith among the financial press and industry insiders that auto-
mobile demand is particular sensitive to fluctuations in the price of fuel; one need only peruse
the front page or business section of any major newspaper to find myriad articles on the subject
during times of large fluctuations in energy prices.7 Figure 1 confirms this casual impression:
Detrended total auto sales clearly appear to fluctuations in the real price of gasoline.8 Peaks
and troughs of each series are roughly mirror images of one another.
Figure 2 provides further descriptive evidence on the relationship between new automobile
sales and the real price of gasoline. It plots the linearly detrended ratio of light truck sales to
total sales against the demeaned real gasoline price.9 As “light trucks” tend to have lower fuel
economy than do other autos, we might reasonably suspect the composition of new automobile
sales to shift towards more fuel efficient models when gasoline prices are high. This is indeed
roughly the pattern that we see in the data, with the period of the late 1970s and early 1980s
the most dramatic example.
While the aggregated data discussed above are suggestive, it is difficult to gauge the quanti-
tative strength of this relationship. More importantly, plots merely provide a crude measure of
statistical association and cannot necessarily be given a structural or causal interpretation. A
key difficulty in interpreting the apparent statistical association in the plots is the issue of simul-
taneity. Is the demand for automobiles strong because gasoline prices are low, or are gasoline
prices low because the demand for automobiles is weak? This question is impossible to answer
without a structural model.
One approach to uncovering the true effect of fuel price surprises on automobile demand
would be to rely on aggregate data. This approach would require an instrumental variables ap-
proach in order to isolate exogenous variation in gasoline prices. Difficulties with this approach
have been illustrated by Kilian (2006). In this paper, we pursue a different approach by tapping
a previously unused micro data of car prices that dates back to 1978. One advantage of using
micro based data is that it allows us to control for simultaneity directly by adding time dummies
7 A particularly representative piece can be found on CNN’s financial page in the late spring of 2004: http://money.cnn.com/2004/05/13/pf/autos/suv prices/?cnn=yes.
8 For all calculations in the paper, we convert nominal values to real by deflating by the CPI for all urbanconsumers, seasonally adjusted. The choice of the CPI is mainly one of convenience, as it is computed at amonthly frequency as is our price data on used cars. Other methods of deflation, such as the personal consumptionexpenditures deflator from the NIPA accounts, generally lead to real measures with different scaling, but ourresults are insensitive to such transformations.
9 “Light trucks” is a measure inclusive of sport utility vehicles (SUVs) as well as other personal use trucks.The share of light truck sales displays a clear upward secular trend and is hence expressed as the deviation froma linear deterministic time trend.
4

to the regression.
3 Data Description
Beginning in 1978, the US Department of Energy has published detailed reports on the fuel
economy of nearly every make of new car sold in the United States.10 We collected fuel economy
data on 2,780 different models of car for years 1978 through 1984. Table 1 presents summary
statistics on a measure of fuel economy by model year, where the measure of fuel economy is a
weighted average between highway and city miles per gallon.11 Tables 2 and 3 present summary
statistics of fuel economy by model year for “light trucks” and foreign autos, respectively. The
average fuel economy of all autos rests in between twenty and twenty-five miles per gallon for
the sample period under consideration and displays a slight, but noticeable, upward trend across
time. As we would expect, fuel economy of “light trucks” is substantially lower than that for
all autos, while foreign produced cars get significantly more miles per gallon. It is interesting to
note that the observed increase in average measures of fuel economy displays the largest upward
trends in the wake of the extremely high energy prices of 1979-1980.
We match the fuel economy estimates from the Department of Energy with price data on
each model for ages one through five from the National Auto Dealer’s Association Used Car
Price Guide, Midwestern Edition, from July of each year for 1979 through 1989.12 The price
data are constructed as averages of surveys of actual transactions for each model in each time
period under consideration. We collected these price data by hand and were meticulous in ensur-
ing their accuracy. With five price observations per auto, we have a total of 13,900 observations
across models and across time.
This type of data set was not available at the time Kahn (1986) was written. Kahn instead
relied on data from Consumer Reports of select models between 1970-1976. He combines this
10 This data can be downloaded from http://www.fueleconomy.gov/feg/download.shtml. Cars of thesame model but with substantially different characteristics relating to fuel economy are counted as separatecross-sectional observations. For example, a model that is offered with both six and eight cylinder engine optionsis counted as two different models. Options including number of doors and other cosmetic attributes are notcounted as different cross-sectional observations.
11 The weighted average places approximately sixty percent weight on estimates of city miles per gallon andforty percent on highway miles per gallon. The estimates of miles per gallon are from vehicle tests EnvironmentalProtection Agency’s National Vehicle and Fuel Emissions Laboratory and are not factory estimates.
12 It should be noted that not all autos with fuel economy estimates are priced in the used car guide, and not allcars with prices have corresponding fuel economy estimates. We omit from consideration all such non-matchingobservations, which are few in number. The choice of using the July and Midwestern editions is made simplyfor convenience and to provide a natural comparison with the earlier work of Kahn (1986), who also uses theJuly issue. The choice of obtaining price data for autos aged one through five is also arbitrary and reflects acompromise between the desire to have a large data set and the time costs involved with collecting the data.
5

information with price data for 1971-1981. His data set not only fails to include many of the key
oil price shock episodes such as, but it is also limited to approximately thirty models per year,
and is subject to potential sample selection bias. That he only examines models which were
popular enough to be reviewed in Consumer Reports makes it likely that demand for those cars
was relatively strong regardless of changes in gasoline prices. It is also possible that his data
represent an endogenous over-sampling of fuel efficient autos on the part of Consumer Reports
in the wake of the extremely high gasoline prices of the mid 1970s. To the extent possible, below
we will contrast and compare our results to his.
Table 4 gives the nominal and real gasoline prices in July of each year under consideration
and Table 5 lists summary statistics concerning percentage changes in prices for autos of dif-
ferent vintage across time. Table 4 indicates that there was only one very large increase in
real gasoline prices in our sample period, occurring in 1980, and two rather modest real price
increases in 1987 and 1989. The real price of gasoline fell sharply between July of 1985 and
1986, with another significant decrease in 1982. As the model laid out in the next section would
predict, average automobile price decreases are most substantial in 1980 and 1989. Average car
price changes were quite low in magnitude following the stabilization and ensuing decline of real
energy prices in the early 1980s. Curiously, all models exhibit large negative price decreases in
1986, a year in which the real price of gasoline dropped markedly. These summary statistics do
indicate that there does appear to be some response of used car prices to variations in gasoline
prices, although it does not appear uniform and it is difficult to assess just how important the
link between gasoline prices and automobile demand truly is.
Note that we do not examine the effects of gasoline price shocks on new car prices. While the
theoretical model of car valuation developed in the next section does not necessarily preclude
the inclusion of new car prices in the analysis, there are several reasons for focusing solely on the
prices of used cars. Our estimation strategy requires that we have multiple observations on the
price of an automobile across time, necessitating the inclusion of used car prices in the analysis
and eliminating the possibility of an empirical analysis based on new car prices alone. Given
that there are good reasons to believe that the markets for new and used cars are distinctly
different–not the least of which is the well-known “lemons” problem with used automobiles–as
well as the casual observation that the degree of substitutability between new and used cars
is likely low, the assumptions under which our regression equation is derived may be cast into
doubt when both new and used prices are included in the analysis.
There are other mechanical reasons that would further complicate the analysis with new
car prices. While with our data we have price observations on cars at a fixed point in time,
new cars are released at different points throughout the calender year, which would make it
6

difficult to properly ascertain consumers’ expectations of future gasoline prices at the time of
purchase. Furthermore, our price data on used cars comes from surveys of actual transactions,
whereas new car price data is typically in the form of manufacturer’s suggested retail prices,
which are set well in advance of the dates at which actual transactions take place and therefore
likely do not reflect up to date information regarding fuel prices. For these reasons, we have
deliberately chosen to focus the empirical section on used car prices. Nevertheless, our results
on the extent of automobile price responses to changes in the real price of gasoline would very
likely apply equally as well to the market for new cars, and will thus aid us in providing an-
swers to the question of how important energy price shocks are to automobile demand in general.
4 Model
In this section we postulate a partial equilibrium model of automobile pricing that yields an
estimable regression equation with theoretical predictions concerning both the sign and magni-
tude of the response of car prices to unforeseen shocks to the real price of gasoline. The model
treats automobiles as assets which provides a service flow to agents over the course of the life
of the car. The theoretical model is essentially identical to the model used by Kahn (1986),
which in turn is partly based on the hedonic approach to valuation exposited in Rosen (1974)
and Muellbauer (1974). The theoretical model is consistent with a variety of different empirical
specifications. Our baseline empirical specification used in Section 5 encompasses that used by
Kahn. In Section 6 we consider a variety of different empirical specifications.
We make several assumptions concerning the market for autos that we will partially relax in
the empirical section. First, we assume that the market is always in equilibrium, which implies
that prices should respond instantaneously upon the arrival of any new information. Second,
we assume that all cars have a known, finite life span, after which time they no longer provide
any service flow. We assume that agents receive utility only from the service flow of owning
an automobile and not separately from specific cars or specific attributes of cars; this assump-
tion ensures that prices of autos with different attributes adjust so to equate rates of return in
equilibrium.13 Agents take the price of gasoline as given, form expectations concerning future
gasoline prices identically, and have the same rate of time preference, which is assumed to be
constant.
13 In practice, this assumption amounts to assuming that cars with different physical attributes are perfectsubstitutes. This assumption is certainly more reasonable when analyzing used cars separately from new. Itwould seem reasonable to assume that agents receive additional utility from owning a new car which is distinctfrom the service flow provided by the new car. If such were the case, the analysis below would be invalidated;as mentioned in the introduction, this is one of the reasons that we choose to focus solely on used cars. In theempirical section we will allow situations in which the assumption of perfect substitutability between used carsis violated.
7

Let the subscript i denote different automobiles, t time, k the age of a car, and T the known
length of time after which cars no longer provide a service flow. For now, the unit of time is
taken to be a year, though this is not necessary. The vector Zi contain observable characteristics
of an automobile of type i that are assumed time invariant, g denotes the price of a gallon of
gasoline, m stands for mileage per year, and MPGi is a measure of the miles per gallon of an
automobile of type i, which is assumed invariant to both time and age.14 Let Ψ be a function
mapping observable characteristics of autos and usage into the flow benefit of owning a car of
type i. Then the per period net rental, R, of owning an automobile of type i can be written as
benefits less costs:
Ri,k,t = Ψ(Zi,mi,t)− gtmi,t
MPGi
(1)
At the beginning of each period of time agents choose mi,t so as to maximize the per period
net rental. Letting β denote the discount factor and R∗i,k,t the maximized per period net rental,
the assumption that individuals receive utility only over the flow benefit of services from a car
yields an expression in which the price in any period is equal to the discounted expected present
value of future net rentals:
Pi,k,t =T−k∑j=0
βjEtR∗i,k,t+j (2)
The first order condition for the choice of usage, mi,t, is that the marginal benefit of an
extra mile of usage equal the marginal cost, which is simply the price of a gallon of gasoline
divided by the miles per gallon of car i. Provided that the flow benefit is increasing in usage,
the optimal mi,t is a decreasing function of the gasoline price and an increasing function of the
fuel economy of car i. As a first order approximation, however, we can ignore the endogenous
effect on market prices of changes in mi,t resulting from shocks to gasoline prices.15 Thus, for
ease of exposition, we treat mi,t as a fixed constant across time and autos for the remainder
of the theoretical and empirical sections and write the flow benefit of owning a car of type i
as Ψ(Zi,m). This is perhaps a dubious assumption, as casual observation would suggest that
automobile usage does vary significantly with gasoline prices. However, as noted above, any
effects of endogenous changes in usage on automobile prices are of second order importance;
given that our focus is on the response of automobile prices to fuel price shocks and not on the
effect of such shocks on usage, we feel that the assumption of constant usage is appropriate.16
14 In the empirical section we will incorporate very general depreciation structures, which will allow for casesin which the vector of observable characteristics of an automobile is time varying.
15 This is but a straightforward consequence of the envelope theorem. In equilibrium, market prices are afunction of expected future net rentals, which in turn are a function of expected usage and expected real gasolineprices. To a first order approximation, the endogenous response of usage to gasoline price shocks has no effecton market prices.
16 Even under the assumption of fixed usage across time, one might call into question the assumption of the
8

Given the assumption of a constant m, the expression for the price simplifies as follows:
Pi,k,t = Ψ(Zi,m)T−k∑j=0
βj − m
MPGi
T−k∑j=0
βjEtgt+j (3)
Using the definition of the net rental and simplifying, we obtain an expression for the maximized
rental value in any period in terms of observables:
R∗i,k,t =
[T−k∑j=0
βj
]−1 [Pi,k,t +
m
MPGi
T−k∑j=1
βj(Etgt+s − gt)
](4)
A straightforward consequence of the pricing expression (2) is that Et(Pi,k+1,t+1 − Pi,k,t) =1−β
βPi,k,t − 1
βR∗
i,k,t. Using this in conjunction with (4) yields an expression for the expected
change in price between years t and t + 1:
Et(Pi,k+1,t+1 − Pi,k,t) = −[
T−k∑j=0
β−j
]−1
Pi,k,t − m
MPGi
[T−k+1∑
j=1
βj
]−1 T−k∑j=1
βj(Etgt+j − gt) (5)
Expression (5) says that the expected change in the price of an automobile of age k between
periods t and t + 1 is equal to a steady depreciation term which is dependent upon age less
another term which depends upon predictable changes in gasoline prices. The first term reflects
the assumption of a finite life span after which time cars yield no value–it is easy to see that
when a car reaches the end of its life (i.e. k = T ) it is expected to lose 100% of its value.
Furthermore, the steady depreciation term is an increasing function of k; in other words, older
cars are expected to lose more value over the course of a year than are newer cars.17 It should
be noted that there is no physical depreciation in this setup; this results from the assumption
that the characteristics of an automobile over which owners receive utility is time invariant. The
only source of depreciation in the model is the fact that cars have finite life spans–as cars age,
the number of periods over which owners will receive a service flow decreases and hence so too
does the price. This is a strong assumption that is made only for ease of exposition and will be
relaxed in the empirical section.
Under the assumption of that agents form expectations rationally, the actual change in price
between two periods is equal to the expected change in price plus a mean zero error term that
same usage across different types of cars. It is not at all clear that expected usage differs systematically acrossdifferent kinds of cars, and even to the extent to which it does, the differences are likely to be small and thereforehave little or no effect on equilibrium prices.
17 This differs from an analysis of the used car market taking into account adverse selection. In such a setup,the “lemons” problem is more acute for younger cars than for old, and we can thus expect newer cars to depreciatemore quickly than do older cars. See House and Leahy (2004) for more. The depreciation structure employed inthe empirical section will allow for this possibility.
9

is orthogonal to anything known at date t:
Pi,k+1,t+1 − Pi,k,t = Et(Pi,k+1,t+1 − Pi,k,t) + εt+1 (6)
As the main focus of the paper is on the effects of expectational surprises concerning fuel ex-
penses on car prices, we would like a regression equation that explicitly contains such a surprise
term as an explanatory variable. Such an expectational surprise term is part of the rational
expectations error term in (6); using the basic pricing formula, we can include it as follows:
Pi,k+1,t+1 − Pi,k,t = Et(Pi,k+1,t+1 − Pi,k,t)−Xi,k,t+1 + et+1 (7)
Where Xi,k,t+1 is the expectational surprise term defined as follows:18
Xi,k,t+1 =m
MPGi
T−k−1∑j=0
βj(Et+1gt+j+1 − Etgt+j+1)
The error term, e, in expression (7) is no longer a rational expectations error term which is
orthogonal to all variables on the right hand side; this occurs mechanically because there is now
date t + 1 information on the right hand side. For our baseline regression equation, we divide
both sides of (7) by Pi,k,t, which simplify redefines the equation in percentage terms as opposed
to first differences. Defining δk =[∑T−k
j=0 β−j]−1
as the steady depreciation, xi,k,t+1 =Xi,k,t+1
Pi,k,tas
the expectational surprise term divided by Pi,k,t, and wi,k,t as the date t forecastable change in
operating expenses divided by the price as defined in (5), we have the following:
Pi,k+1,t+1 − Pi,k,t
Pi,k,t
= −δk − wi,k,t − xi,k,t+1 + et+1 (8)
As our interest is in the effect of surprise gasoline price changes on automobile prices, for the
empirical section of the paper we impose that δk and wi,k,t have coefficients equal to -1 and
estimate the effect of changes in xi,k,t+1 on car prices as follows:19
Pi,k+1,t+1 − Pi,k,t
Pi,k,t
= −(δk + wi,k,t) + γxi,k,t+1 + et+1 (9)
The model predicts that γ = −1. Given the potential correlation between xi,k,t+1 and the error
term, it will be important to control for factors which may affect car prices and are potentially
correlated with the expectational surprise in gasoline prices. We leave a more thorough discus-
18 This definition of x follows directly from the pricing expression (3).19 Imposing this depreciation structure has no effect on the coefficient estimate of the expectational surprise
term. For our baseline case, the time t forecastable change in gasoline prices is identically zero, and henceimposing its coefficient to be -1 is also innocuous. Even when w is not zero, it is generally sufficiently close tozero that requiring its coefficient to be -1 has essentially no effect on the coefficient estimate of the expectationalsurprise term.
10

sion of this and related issues until the next section.
5 Baseline Empirical Results
Empirical estimation of specification (9) requires explicit assumptions concerning expectations
formation, expected usage, discounting of the future, and life expectancy. These calibrations
will affect, among other things, the scaling of the estimated response coefficient; since we are
interested in the absolute magnitude of the response, it is thus important to choose a calibration
that mimics as closely as possible reality. For our baseline specification, we simply follow the
earlier work of Kahn (1986) in choosing a life expectancy, T , of 10 years; a subjective discount
factor of 0.9524, which corresponds to a yearly discount rate of five percent; and expected usage,
m, of 10,000 miles per year. Such a baseline calibration will facilitate a comparison with Kahn’s
results. Below, we perform a sensitivity analysis using different calibrations.
Perhaps the most crucial calibration to our estimation concerns an assumption regarding
expectations formation.20 The regressor in whose coefficient we are interested is a function of an
unobservable shock to gasoline prices. In order to obtain such a shock series from the data we
must explicitly assume a process for expectations formation. A natural candidate would be to
assume that real gasoline prices follow a random walk; this provides a reasonable statistical fit
and seems to conform well with the casual observation that people likely expect future gasoline
prices to remain at or near their current values. Under this assumption, the unforecastable shock
to gasoline prices between two periods is simply the first difference of prices.21 Furthermore, the
random walk assumption has the nice properties that the change in expectations for all future
dates is constant and simply equal to the period t + 1 shock and that the date t forecastable
change in gasoline prices is identically zero. Table 6 gives the actual measure of the gasoline
price shock used in the estimation under the random walk assumption across time and Figure
3 depicts the shock series graphically.22
20The standard approach in macroeconometrics for dealing with date t+1 expectations on the right hand sideof a regression equation is to make use of the orthogonality condition implied by rational expectations and use aninstrumental variables approach with lagged variables, rather than attempting to explicitly model expectations.That approach will not work in this context. This is because the t + 1 information on the right hand side ofour regression equation in whose coefficient we are interested is a shock, which is by definition uncorrelated withanything dated t or earlier.
21 The random walk assumption is that gt+1 = gt + ut+1. Then the forecast error is simply given by ut+1 =∆gt+1.
22 The shock series is found by taking the difference of our measure of real gasoline prices between July ofsuccessive years, which corresponds to the month in which we observe car prices. Even though we only observecar prices once per year, our estimation does not preclude price adjustment in the intervening months. Thechange in price between July of two years is solely a function of the constant depreciation term and the changein expectations of all future gasoline prices between those dates, regardless of how frequently car prices actuallyadjust.
11

As the expectational shock regressor xi,k,t+1 contains period t + 1 information, extreme care
must be taken to control for factors potentially correlated with it that may also influence the
change in automobile prices between periods t and t+1 in order to obtain a consistent estimate
of the response coefficient. Chief among such factors would be to control for aggregate effects
potentially correlated with the gasoline price shocks which have an independent causal effect
on automobile prices. We accomplish this by including dummy variables for every year but the
first in the sample, 1981 - 1989.23
Another motivation for including time controls is that it allows us to deal with the potential
problem of simultaneity, which we discussed at length earlier. It is likely that there is a sub-
stantial feedback effect between car prices and gasoline prices–when the demand for automobile
services is high, we can expect both car and gasoline prices to rise. Under the assumption that
any such feedback effect only occurs at an aggregate level, the inclusion of time dummies will
control for this simultaneity. The coefficient on the time dummy will capture the aggregate
demand effect on car prices; to the extent to which such a feedback effect is present, the time
dummy will itself be correlated with the change in gasoline prices. We can then consistently
identify the effects of gasoline prices on automobile prices off of the exogenous variation in
gasoline prices that is not explained by the time dummy. With purely aggregate data such an
approach would not be possible–the inclusion of a control for each time period would simply
lead to a perfect fit–and we would have to resort to an instrumental variables approach. That
we have a comprehensive micro data set with both a cross-sectional and time dimension allows
us to circumvent this problem and to control for the simultaneity explicitly.24
We also relax the stringent assumption made in the theory section that there is no physical
depreciation. This is accomplished by including dummy variables for the age of a car as well as
dummy variables for the manufacturer of each car. The inclusion of controls for manufacturer
is meant to account for the fact that some manufacturers simply produce “better” cars that
suffer less physical depreciation than others; the manufacturer controls can also capture taste
shocks for certain classes of automobiles across time. The inclusion of age controls captures the
idea that physical depreciation may not be uniform over the life of a car and also allows for
time varying effects of adverse selection on used car prices.25 Because our regressor of interest,
23 Data for 1980 is, of course, included in the estimation. A year dummy for that year is omitted so to ensurethat the matrix of year dummies is not perfectly collinear with the constant term.
24 If such a feedback effect is indeed present, we would expect upward biased estimates of the response of carprices to fuel price surprises without controlling for the simultaneity. This is in fact what we see. Estimates ofour baseline regression without such controls leads to estimated response coefficients that are significantly morepositive (or less negative) than those which we obtain when controlling for time effects.
25 See House and Leahy (2004) for a further description of the effects of adverse selection in the used carmarket. In particular, these authors demonstrate that the “lemons” problem is more acute for younger cars than
12

xi,k,t+1, depends not only changed gasoline price expectations but also on fuel economy, age, and
lagged price, failing to control for factors such as age and manufacturer which potentially have
an independent effect on the change in car prices and which are potentially correlated with any
of the factors making up the x term will lead to biased coefficient estimates. While we impose
the depreciation structure derived in the theory section, all regressions are estimated with an
unrestricted constant included. The presence of the constant captures physical depreciation and
problems of adverse selection that are uniform across age and manufacturer.
We first estimate the following variant of the theoretically implied specification (9) assuming
continuously updated random walk expectations of real gasoline prices:
Pi,k+1,t+1 − Pi,k,t
Pi,k,t
+ δk = α + γxi,k,t+1 +1989∑
v=1981
θvyv +5∑
k=3
ψkak +
Q∑q=1
φqMq + ei,t+1 (10)
The equation is estimated by pooled least squares with Newey-West standard errors robust to
heteroskedasticity and autocorrelation in parentheses. yv is a year dummy variable, ak is a
dummy variable for age, Mq is a dummy variable for manufacturer, and xi,k,t+1 is defined as
above and measures the increased costs of expected lifetime usage resulting from gasoline price
shocks as a fraction of the lagged real car price. That δk appears on the left hand side simply re-
sults from the fact that we impose the theoretically implied depreciation structure of the model.26
Row (a) of Table 8 gives the estimated response coefficient to fuel price surprises using the
entire sample for the estimation. The coefficient is statistically significant and of the predicted
negative sign, but its magnitude of -0.1096 is substantially below the theoretically predicted
magnitude of -1. In row (b) we attempt to limit the estimation to a more homogeneous class
of cars by eliminating from the sample all trucks and SUVs, foreign cars, and diesel engine
autos, leading to a coefficient estimate that is numerically nearly identical to that obtained from
estimation on the full sample. Row (c) presents the estimated coefficient on the expectational
surprise term from including dummy variables for SUVs and trucks, foreign cars, and diesels.
There, the estimated response coefficient is of the wrong sign but is statistically insignificant
from zero.27
older, which would imply that, other factors held constant, the yearly depreciation of younger cars should begreater than that for older cars.
26 The estimated response coefficient γ is invariant to imposing this depreciation structure.27 We also experimented with interacting both the manufacturer and car type dummy variables with the
time dummies. This results in a large loss in degrees of freedom and does not substantially alter the results.Regressions where the car type dummies were interacted with the expectational surprise term x were alsorun. Such an interaction expansion does not substantially change the estimated response coefficient for the morehomogeneous class of cars; it does appear that foreign cars in particular exhibit a stronger response to unexpectedfuel price shocks, though the response coefficient for foreign cars is still substantially less than -1.
13

To put into perspective just how low the estimated response coefficients from the baseline
regression are, Table 9 presents both the theoretically implied and estimated changes in the
price of two different automobiles in response to $0.25 positive shock to the real price of gaso-
line: both autos are assumed to be two years old with existing price $10,000, and only differ in
that one gets fifteen miles per gallon while the other gets twenty-five. The theoretical model
predicts that the “gas guzzler” should lose more than $1,000 in value (over and above the other
forms of depreciation) and that the more fuel efficient car should depreciate more than $600 in
response to the positive gasoline price shock, implying a change in relative prices of more than
$400. The estimated response coefficient from row (a), meanwhile, predicts absolute declines in
value of roughly ten percent of that predicted by the theoretical model, with a relative price
change of only approximately $50. If the estimated coefficients from the baseline specification
are correct, then car prices are extremely unresponsive to even very large gasoline price shocks.
The empirical finding of vast under-adjustment is inconsistent with the baseline theoreti-
cal model as well as with an explanation of the structural relationship between energy prices
and economic activity relying upon a strong effect of changes in gasoline prices on automobile
demand. Can the empirical findings be reconciled with the theory? To answer this question,
we consider alternatives to the baseline empirical estimation. Rows (d) and (e) of Table 8 give
estimated response coefficients under fixed effects estimation of (10), with (d) being estimated
on the full sample and (e) omitting SUVs and trucks, foreign cars, and diesels. The fixed effects
estimation treats each cross-sectional observation as distinctly different and effectively gives each
its own intercept term.28 This is desirable in the sense that physical depreciation might vary sub-
stantially among different models even produced by the same manufacturer, but it also involves
a substantial loss in degrees of freedom and would tend to exacerbate any errors-in-variables
problem. The estimated response coefficient from the full sample is -0.074 and is statistically
significant, but economically effectively the same as the pooled OLS estimate and still far too
low compared to the theoretical prediction. Limiting ourselves to the more homogeneous class
of cars in row (e) yields response coefficient of -0.288, which is substantially larger than any of
the other baseline estimates, but is still far too low and suggests vast under-adjustment of car
prices to fuel price shocks.
We next consider alternative assumptions concerning expectations formation. While the
random walk assumption seems intuitively reasonable, it is likely that other specifications will
lead to superior out of sample forecasts. Pre-testing of our real gasoline price series is unable
to reject the null of a unit root, and so we impose that the series is integrated of order one and
search for the best fitting ARIMA(p,1,q) model on which to compute forecasts of future gasoline
28 Since fixed effects estimation involves running least squares on mean differenced data, it is not possible toinclude manufacturer or car type (e.g. SUV, foreign, etc.) controls.
14

price shocks. Table 7 presents the Schwartz Information Criterion (SIC) for various different
specifications.29 The SIC favors an IMA(1,2) specification. It should be noted that any of the
ARIMA specification is statistically a better fit than is the random walk. We also experimented
with a GARCH specification of conditional heteroskedascity of the error term. At least one of
the GARCH parameters is statistically significant, but allowing for it has essentially no impact
on the point estimates of the moving average coefficients. Since only the point estimates of
the moving average terms are relevant for forecasts of the conditional mean, explicitly modeling
volatility effectively has no influence on the forecasts and so we do not present separate results
for such a specification. We will return to the GARCH model of volatility in the next section.
The third column of Table 8 presents results from estimation of (10) under the baseline
calibration but under the assumption of an IMA(1,2) model of gasoline price expectations.30
As the data is monthly and the number of moving average coefficients is small, the forecasts
generated from the IMA(1,2) specification do not differ substantially from the random walk
case, in spite of the statistical superiority of the IMA(1,2) model over the random walk. The
estimated coefficients from these regressions are of the same sign and similar magnitude to the
random walk counterparts and again suggest substantial under-response of automobile prices to
fuel price shocks.
Before dismissing the baseline specification we should check for the influence of the cali-
brations of various parameters on our estimation results. The three key calibrations are the
expected usage per year, m, life expectancy of an automobile, T , and the rate at which agents
discount the future. Looking at the expression for x, changes in m represent a pure scaling
effect–doubling the size of m will cut the estimated response coefficient in half. At first glance,
it would appear that the calibrations of T and β are also pure scaling effects; this is, however,
not true, as the x term for each car is a non-linear function of both of these calibrations. De-
creasing either parameter will scale each individual x down, but the scaling effect is asymmetric
depending upon the age of the car in question, and thus the effects of changing the calibrations
on the estimated response coefficient are not immediately clear. In particular, decreasing β (i.e.
increasing the rate at which agents discount the future) or T has much larger effects on the
scale of the x term for newer cars than for old. Another calibration we consider changing is the
measure of fuel economy. Up until this point, we have used the weighted average of highway
and city miles per gallon in the construction of the x term for each car. While this is the
theoretically most appropriate measure, we also consider using the highway miles per gallon,
29 As shown in Inoue and Kilian (2006), the SIC will consistently select the optimal out of sample forecastingmodel under weak conditions.
30 Note that the time t forecastable change in gasoline prices, w, under the IMA(1,2) specification will not beidentically zero as in the random walk case. We impose that this coefficient equals -1 in the estimation. However,the results are not at all sensitive to this requirement.
15

which tends to be on the order of twenty-five percent greater than the weighted average miles
per gallon. Since the measure of fuel economy appears in the denominator of the x expression,
using the highway miles per gallon measure will have an approximate upward scaling effect on
the estimated response coefficients. The motivation for trying this incorrect measure of fuel
economy is essentially behavioral; advertisements for cars typically list highway miles per gallon
if they mention fuel economy at all, as the highway measure of fuel economy looks “better.”
We computed a full grid of discount rates ranging from 0.05 (the baseline case) to 1, ex-
pected usage ranging from 10,000 to 5,000 miles per year, expected life of 10 to 6 years, and
both measures of fuel economy.31 Table 10 presents the estimated response coefficient from OLS
estimation on the full sample (including manufacturer, year, and age controls) under the random
walk expectations assumption for a subset of the different calibrations of m, β = (1 + r)−1, T ,
and the measure of fuel economy. For high levels of life expectancy, the coefficient estimates
are remarkably insensitive to different calibrations of the discount rate. As expected, altering
the calibration of expected usage simply scales up the coefficients. Using the highway miles
per gallon measure of fuel economy also has an approximate scaling effect on the coefficient
estimates, as do different calibrations of life expectancy.
We can see that, using the more sophisticated (and most appropriate) measure of fuel econ-
omy, we only begin to get close to theoretically predicted response coefficient of -1 with the
lowest life expectancy calibration (6 years), extraordinarily high discount rates, and extremely
low levels of expected usage. In particular, using the correct measure of fuel economy with
T = 6, a discount rate between twenty-five and fifty percent, and expected usage of 5,000 miles
per year yields an estimated response coefficient almost exactly equal to -1. None of these cal-
ibrations, however, seems remotely reasonable. Even using the highway miles per gallon, a life
expectancy of six years is still necessary for the coefficient estimates to be consistently greater
than -0.5 in absolute value for reasonable calibrations of the other parameters.
We thus conclude that the baseline model cannot be rationalized for reasonable calibra-
tions of the parameters or assumptions regarding expectations formation. In particular, for
any sensible calibration the estimated response coefficients imply an astounding lack of adjust-
ment of car prices to fuel price shocks which is inconsistent with standard explanation of the
nexus of the energy-macroeconomy relationship. Either individuals are extremely myopic and
do not factor the near future into their decisions or the theory and/or empirical specification
is flawed in a more fundamental sense. In the next section, we consider the role of alternative
31 We do not consider life expectancies less than six years for the mechanical reason that we have data on carprices aged one through five. Going below T = 6 would necessitate eliminating a substantial part of the sampleand would invalidate any comparisons of coefficient estimates across calibrations.
16

behavioral assumptions regarding expectations formation on the estimated response coefficients.
6 Behavioral Alternatives
The empirical results of the previous section resoundingly reject the theoretically predicted mag-
nitude of the response of used car prices to unanticipated shocks to the price of fuel from the
baseline model of automobile pricing. This finding was seen to be robust to reasonable calibra-
tions of the parameters of the model as well as to assumptions concerning expectations formation.
Up to this point, we have assumed that individuals continuously update their expectations
of future gasoline prices using the most recently available information and that the model of ex-
pectations formation is itself linear. In subsection 6.1 we will show that behavioral modifications
which explicity account for the uncertainty and noise present in the most recent information
concerning fuel prices cannot account for the observed under-response of automobile prices to
changes in gasoline prices. While such modifications do lead to larger estimated responses, they
are still far too small to be consistent with standard explanations of the energy-macroeconomy
relationship. In subsection 6.2 we consider a variation of the baseline specification in which
agents use non-linear rules to update their expectations, models with recent behavioral models
of expectations. Under such specifications, we find that increases in the real price of gasoline
appear to have a quantitatively important effect on automobile prices while decreases do not.
6.1 The Role of Uncertainty in Response to Changes in Gasoline
Prices
Up to this point, we have assumed that agents continuously update their expectations of future
gasoline prices, using the most recently available information to form such forecasts. Such an
assumption may be invalid for several reasons. For one, it presumes that there is no delay
in the processing and acquisition of new information. Secondly, and more importantly, it ig-
nores the simple fact that month to month changes in the real price of gasoline likely contain
a substantial amount of noise. That agents fail to continuously update their gasoline price
expectations can be motivated as an attempt to filter away this noise. This approach is mo-
tivated in part by Bernanke (1983). What are the implications for our analysis if agents do
not continuously update their expectations? Will such a modification yield evidence of more
pronounced adjustment of automobile prices to unexpected changes in the real price of gasoline?
While there might be good reason to believe that updating of expectations is not continu-
17

ous, it is not at all clear how to best account for such a phenomena in the context of modeling
expectations. As such, we evaluate a number of alternative models of expectations. To account
for the possibility that there is a delay in the processing of new information, one might presume
that there is a fixed lag between when shocks materialize and when they affect behavior. That
is, automobile prices in July are formed on the basis of expectations of fuel prices conditional on
the information set in some previous month. For our benchmark specification, we assume that
there is a three month lag–that is, automobile prices in July are set based on information from
April of the same year–but our results in this section are not terribly sensitive to this choice of
lag structure. To account for the fact that agents might deliberately ignore some of the most
recent information in attempt to extract signal from noise, we estimate variants of our baseline
regression where we assume that expectations of future gasoline prices in July are set on the
basis of an average of gasoline prices over some previous period of time. While in principle this
should be a weighted average with declining weights, there is no empirical or theoretical guid-
ance on how to construct the weights correctly. Hence we simply compute arithmetic averages.
We consider two variants of “averaging” for expectations formation: one in which the relevant
gasoline price for automobile prices in July is the average over the previous twelve months and
another in which it is the average over the previous three months. Averaging over recent gasoline
prices in forming expectations of future prices can be motivated as an attempt on the part of
agents to filter away the noise present in the monthly series.
Table 11 presents regression results from all three of the above behavioral models concerning
expectations formation, and is organized in the same fashion as Table 8. It is assumed agents
form expectations on the basis of the most recent relevant value of gasoline prices. The second
column, titled ‘April’, corresponds to a three month lag between when shocks are realized and
when they affect the market for autos. Under the random walk assumption, the relevant shock
for July auto prices is then found by taking the first difference of the real gasoline price between
April of the two years. The third and fourth columns of the table correspond to twelve and three
month averages. There, the shock series is found by taking the difference between the average
real price of gasoline from the most recent interval of time less the average over the same inter-
val from the previous year. Figures 4 a, b, and c plot the real gasoline price shock series under
each of the different assumptions concerning the behavioral model of expectations formation. It
should be noted that these three different methods of extracting the real gasoline price shock do
not produce identical results–in particular, the different assumptions imply markedly different
shocks for 1986 and 1987.
The results from the baseline least squares estimation using the full sample are quite similar
to the case of continuously updated expectations for both the three month average and three
month lag expectations, though the absolute magnitude is slightly larger for averaged or lagged
18

expectations assumptions. Using the twelve month average of gasoline prices for expectations
formation leads to a coefficient of -0.24, which is roughly twice the magnitude of the estimated
coefficients under the assumption of continuous updating. That said, it is still a quarter of the
size predicted by the model and still suggests vast under-adjustment.
As was the case with continuously updated expectations, the coefficient estimates for all
three expectations assumptions are smaller in magnitude when we either eliminate SUVs and
trucks, foreign, and diesel autos from the sample or include controls for these characteristics.
Unlike in the continuously updated case, however, these coefficients are all of the theoretically
predicted sign and are, with one exception, statistically significant. Fixed effects estimation does
little to affect the estimated response coefficients for any of the behavioral models of expecta-
tions formation. This evidence suggests that such behavioral models of expectations brings us
closer to the baseline model, but still suggests vast under-adjustment.
Although the results in Table 11 represent some improvement over the baseline specification,
it is still puzzling why the empirical relationship between real gasoline prices and automobile
prices is so weak. This fact motivates the use of a more sophisticated method that accounts
for the fact that the most recent information concerning gasoline prices contains a substantial
amount of noise that is relevant for agent optimization. Specifically, we investigate whether the
response of automobile prices to changes in the real price of gasoline is dependent upon the
conditional volatility of the real gasoline price series.
We posit that the response of the economy to changes in the price of oil should matter less
when the conditional volatility of oil prices is high. Such a hypothesis is appealing on behavioral
grounds and is again consistent with Bernanke (1983): when the conditional volatility of real
oil prices is high, agents might not react very much because the economy is conditionally more
likely to be hit by a relative large shock in the near future. A similar idea has been proposed
in a different context by Lee, Ni, and Ratti (1995), who study the reduced form relationship
between nominal oil prices and real economic activity.
We postulate that agents form expectations of the real gasoline price according to a random
walk model with a GARCH error term.
∆gt = et (11)
et =√
htvt vt ∼ N(0, 1)
ht = α + βe2t−1 + ψht−1
19

Maximum likelihood estimates on monthly data from 1976:01 through 1989:12 yield an insignif-
icant GARCH term (ψ), so we re-estimate the model with just the ARCH term. We find
α̂ = 0.000323 with a Newey-West standard error of (0.000028) and β̂ = 0.684 and a standard
error of (0.121).
We compute the fitted values for the ht series and then define the volatility adjusted real
gasoline price shock series as follows:
∆gVt+1 =
1√
ht+1−√
ht√ht
+ 1
∆gt+1 (12)
The above specification captures the idea that agents will discount fuel price changes when the
conditional volatility of the series is high. If there has been no change in volatility between two
periods (i.e. ht+1 = ht), then the gasoline price shock series is as given before. If there has
been an increase in volatility (i.e. ht+1 > ht), then agents attach a weight less than one to the
observed real gasoline price shock; likewise, if volatility has decreased, agents attach a weight
greater than one to the observed gasoline price shock. This method of weighting is also desirable
in that it preserves the sign of the underlying shock.
We only consider volatility adjustment terms under the baseline assumption that expecta-
tions are updated continuously; since time averaging would tend to mitigate the volatility of
gasoline prices and, in any case, we would not have enough averaged observations to estimate
reliably the ARCH parameter. Table 12 presents the volatility adjustment term for each time
period in which we observe automobile prices. It is found by computing the fitted value of the
ht series in each July and constructing the measure as described above.
Table 13 presents coefficient estimates from regressions using the volatility adjusted measure
of real gasoline price shocks. Estimation is on the full sample and includes controls for manu-
facturer, age, and year. The OLS and fixed effects estimates are nearly identical, statistically
significant, of the correct sign, and are more than twice the absolute magnitude from the base-
line estimates of Table 8. That said, the estimated coefficients of approximately -0.25 are still
quantitatively small and are less than a quarter of that predicted by the baseline model.
In summary, there is some support for the idea in Bernanke (1983) that agents seek to filter
away noise present in the monthly gasoline price series. We find that forecasts based on aver-
ages of recent gasoline prices yield estimated response coefficients that are larger in magnitude
than those found under the baseline estimation. Likewise, explicitly accounting for the role of
volatility in a method similar to Lee, Ni, and Ratti (1995) produces similar results. That said,
20

these estimated response coefficients are still far too low relative to the theoretical prediction of
the baseline model of automobile pricing. At best, there is still evidence of only a weak response
of automobile demand to surprises in gasoline prices.
6.2 Asymmetric Responses of Automobile Prices to Changes in the
Real Price of Gasoline
We have thus established that several behavioral deviations which explicitly account for the
possibility that agents potentially seek to filter away noise in current information do not lead to
estimated coefficients indicating a substantial response of automobile prices to changes in the
real price of gasoline. In this subsection we consider several alternative hypotheses under which
agents’ updating of expectations with respect to changes in the real price of gasoline is non-linear.
It seems natural to conjecture that agents only update their expectations in response to large
changes in real gasoline prices. Such an assumption can be motivated on at least two grounds.
First, it can be taken as an attempt by agents to filter signal from noise; small changes in gasoline
prices likely represent only noise. Secondly, agents might face a fixed cost of re-optimization; for
small changes in gasoline prices, the foregone benefits of failing to update expectations might
be small relative to such costs.
As such, we estimate the following variant of our baseline empirical specification:
Pi,k+1,t+1 − Pi,k,t
Pi,k,t
+ δk = α + γDLxi,k,t+1 +1989∑
v=1981
θvyv +5∑
k=3
ψkak +
Q∑q=1
φqMq + ei,t+1 (13)
Above, DL is a dummy variable equal to one in years in which there were surely large changes
in real gasoline prices and zero otherwise. For our current sample, we set this dummy variable
equal to one in 1980, 1982, and 1986. The regressor term xi,k,t+1 is constructed as before; we
assume that expectations of future gasoline prices are updated continuously and are formed
according to a random walk where the best predictor of future gasoline prices is simply the
current real price. The above specification differs from those in Section 5 only in that we force
the regressor to be zero in years in which changes in real gasoline prices were small. As before,
we include controls for year, age, and manufacturer.
Row (a) of Table 14 presents coefficient estimates and associated robust standard errors for
both least squares and fixed effects estimation of equation (13). These estimates offer an even
more resounding rejection of the theoretically predicted response coefficient than the baseline
specification. Neither estimation method produces estimated response coefficients that differ
21

significantly from zero. There thus appears to be no support for the hypothesis that agents only
revise their expectations in response to large changes in the real price of gasoline.
We next hypothesize that agents respond asymmetrically to increases and decreases in the
real price of gasoline. Such an hypothesis appeals to the psychological notion that individuals
may be acutely aware of events which adversely affect them and may act accordingly.32 As
such, we might expect that the response to increases in gasoline prices is greater in absolute
magnitude than is the response to decreases.33 To test this claim, we estimate specifications
similar to (13). In one case we allow only increases to have an effect on automobile prices, in
another only decreases, and in another we allow both to have an effect and test for the equality
of the response coefficients.
Row (b) of Table 14 presents estimates in which the x regressor term is forced to be zero
for years in which real gasoline prices fell, while row (c) presents results in which the regressor
is forced to be zero for years in which the real price of gasoline rose. The results are striking,
and very clearly suggest that increases in real gasoline prices have a very strong effect on used
automobile prices while decreases do not. The least squares estimated response to increases in
gasoline prices is -0.887 and does not differ significantly from the theoretically predicted mag-
nitude of -1; meanwhile, the estimated response to decreases does not differ significantly from
zero. The fixed effects estimates convey a very similar message. There the estimated response
of used car prices to increases in gasoline prices also does not differ significantly from -1. The
estimated response under fixed effects of used car prices to decreases in the real price of gaso-
line is of an unexpected sign and is statistically significant at the five percent level, but the
magnitude of 0.08 is sufficiently small that we can again reasonably conclude that decreases in
the real price of gasoline do not have important implications on the market for used automobiles.
We also estimate the following specification in order to test formally the equality of coeffi-
cients in response to both decreases and increases in the real price of gasoline:
Pi,k+1,t+1 − Pi,k,t
Pi,k,t
+δk = α+γxi,k,t+1+γIDIxi,k,t+1+1989∑
v=1981
θvyv+5∑
k=3
ψkak+
Q∑q=1
φqMq+ei,t+1 (14)
Here, DI is a dummy variable equal to one if the gasoline price change in a given year is positive
and zero otherwise. The estimated response of automobile prices to gasoline price decreases is
then given by γ, while the response to increases is given by γ + γI .
Table 15 presents coefficient estimates under both least squares and fixed effects estimation
32 See Dahneman and Tversky (1979).33 A similar idea has been explored in Mork (1989).
22

of specification (14) under the assumption of continuous expectations updating as well as the
behavioral models of expectations formation discussed in Section 6.1. A weak test of the asym-
metric response hypothesis would be the null that | γI |>| γ |. A stronger test on the basis of
our theoretical model would be the null that γI = −1 and γ = 0. The OLS estimates of γ and
γI under the assumption of continuously updated expectations satisfy the strong null hypoth-
esis: a Wald test cannot reject the hypothesis that gasoline price decreases do not matter for
automobile prices nor can we reject the null that the response of automobile prices to positive
gasoline price shocks differs from -1. These results are somewhat weakened under the alternative
behavioral assumptions concerning expectations formation: using the three month lag or three
month average expectations we still cannot reject the hypothesis that negative fuel price shocks
do not matter, but the coefficient on gasoline price increases differs significantly from -1, though
its magnitude is far in excess of the results from any of the linear specifications. OLS estimation
using the twelve month average expectations is unable to detect support for the hypothesis of
an asymmetric response: there we find no evidence of an important non-linearity.
The bottom half of Table 15 presents results of the same regressions using fixed effects es-
timation. In every instance, we cannot reject the “weak” version of our asymmetric response
hypothesis: the response coefficient of car prices to positive gasoline price shocks is negative and
larger in magnitude for all assumptions concerning expectations formation than is the response
to decreases. Furthermore, in all four expectations specifications the implied response coeffi-
cient to positive gasoline price shocks either is not statistically significantly different from -1 or
is quantitatively quite close.34 Unfortunately, a curiosity arises that potentially casts doubt on
these results: in three of the four specifications of expectations formation, the response of car
prices to gasoline price decreases is of the wrong sign and is statistically significant under fixed
effects estimation. That being said, these coefficient estimates are quantitatively low: as we saw
in Section 5, response coefficients of these magnitudes (0.1 to 0.2) imply relatively little price
adjustment of automobiles. Hence, while statistically significant, it is up for interpretation as
to whether these positive coefficients carry much economic meaning.
Another possible non-linear specification would be one in which agents only update their
expectations in response to large changes in real gasoline prices but do so in an asymmetric
fashion. Such a specification is similar in spirit to Hamilton’s (2003) non-linear specification
of the reduced form relationship between crude oil prices and real GDP. Constructing the real
gasoline price shock series in such a fashion leads to empirical results quite similar to those of
the more basic asymmetric specification discussed above, and hence we omit these results.
34 By “quantitatively quite close” we mean that the coefficient is sufficiently close to -1 that reasonable changesin the calibration of the other parameters would leave us unable to reject the null hypothesis that the responseto positive shocks differs from -1.
23

We thus generally find strong empirical support for the hypothesis of asymmetric responses:
it is almost certainly the case that positive gasoline price shocks matter significantly more for
automobile pricing than do negative shocks. Furthermore, in several of the specifications we
are unable to reject the null that the response to positive shocks differs from -1; when we can
reject this hypothesis, the implied response coefficient is generally sufficiently close to -1 that
reasonable changes in the pre-specified parameters of the structural model (i.e. discount factor,
mileage, life expectancy) of the model would leave us unable to reject. Depending upon the
estimation strategy, we either find that gasoline price decreases have no effect on automobile
prices or only have small effects of an unexpected sign.
7 Relation to Previous Work
Although we have extended the analysis far beyond Kahn’s original specification, our base-
line specification is essentially unchanged. Nevertheless, our empirical results from the baseline
specification differ substantially from his. One key difference is that Kahn’s data covers the
period from 1970-1976. There is a rich history of data that has become available since the mid
1980s, and we exploit this new data in order to gain a more comprehensive understanding of
the role of changes in the price of real gasoline on automobile demand. A second difference is
that, because of data limitations at the time of his writing, his data set is restricted to a small
set of automobiles that were popular enough to be reviewed in Consumer Reports, opening the
possibility of hidden sample selection issues which we discussed earlier in the paper.
A more likely source of the disparity between results in the two studies concerns the pos-
sibility that changes in the real price of gasoline have a non-linear effect on automobile prices,
a finding for which we find strong empirical support. Kahn’s data focuses on a period of time
in which there were effectively two very large increases in the price of gasoline, one modest
decrease, and very little else, while our data set consists of large fluctuations in both directions
and a general downward trend. As such, imposing linearity on his data results in only a very
small misspecification if the true underlying relationship is non-linear of the type explored in
this paper. In fact, a measure based only on positive gasoline price shocks for Kahn’s sample
period is nearly perfectly collinear with his standard measure used in the linear framework, with
a correlation coefficient of 0.97. Thus it is impossible to test whether or not the response of
automobile prices to positive gasoline price shocks differs from the response to decreases with
his data. That his coefficient estimates are in the vicinity of those we find in response to posi-
tive gasoline price shocks lends credence to the idea that the underlying source of the disparity
between the baseline results in both papers is that the relationship between automobile demand
24

and gasoline prices is non-linear, with positive changes in gasoline prices mattering substantially
more than decreases.
8 Conclusion
To estimate the effect of gasoline price changes on automobile prices, we compiled a unique data
set that combines fuel economy estimates of a large number of automobiles from the United
States Department of Energy with price data on used cars from the National Auto Dealer’s
Association, leaving us with nearly 14,000 price observations across time.35 That we have a
panel of car prices across time and models allows us to control explicitly for the simultaneity
between automobile demand and gasoline prices, thus permitting consistent estimation of the
effect of exogenous changes in gasoline prices on automobile demand without having to resort
to an instrumental variables approach. We used these data to test a structural model of the
effects of gasoline price shocks on car prices building on Kahn (1986). The theoretical model
predicts that market values of automobiles should change in proportion to the expected change
in lifetime operating expenses resulting from shocks to the price of gasoline. As a result, the
prices of relatively fuel efficient autos should rise relative to “gas guzzlers” in response to an
unexpected increase in the real price of gasoline.
In the baseline model we postulated that agents treat the most recent value of the real price
of gasoline as the best predictor of the future. The data do not conform well to the baseline
empirical specification. In particular, we found evidence of vast-under adjustment of automo-
bile prices to gasoline price shocks, a finding which is inconsistent with the predictions of our
model of automobile pricing. We then explored several behavioral modifications of the baseline
specification. We found strong empirical support for the hypothesis that the effects of changes
in the real price of gasoline on automobile prices are non-linear. In particular, a robust finding
is that gasoline price increases have a relatively strong effect on used automobile prices while
decreases do not.
Because our model treats the market quantity of used automobile services as fixed, the price
effects which we identify in response to changes in gasoline prices correspond exactly to a shift
in demand for automobiles. In a more sophisticated framework supply effects might also be
present. As such, we interpret our results on the extent of automobile price adjustment as
providing an upper bound on the effect of changes in real gasoline prices on the demand for
automobiles.
35 The data set only spans models from 1978-1984. As noted earlier, the authors are in the process of updatingthe data set to include the most recent period.
25

A strong effect of changes in energy prices on consumer demand for energy-intensive durable
goods such as automobiles is central to many popular theoretical explanations of the nexus
between changes in energy prices and aggregate real economic activity. Our empirical results
suggest that the effect of changes in the real price of gasoline on the demand for automobiles
is likely asymmetric. In particular, we found that increases in the price of gasoline appear to
have important implications for automobile demand while decreases likely do not. This finding
that the effects of changes in the real price of gasoline on automobile demand appear to be
asymmetric is roughly consistent with aggregate evidence that the reduced form relationship
between crude oil prices and real economic activity may be non-linear.
26
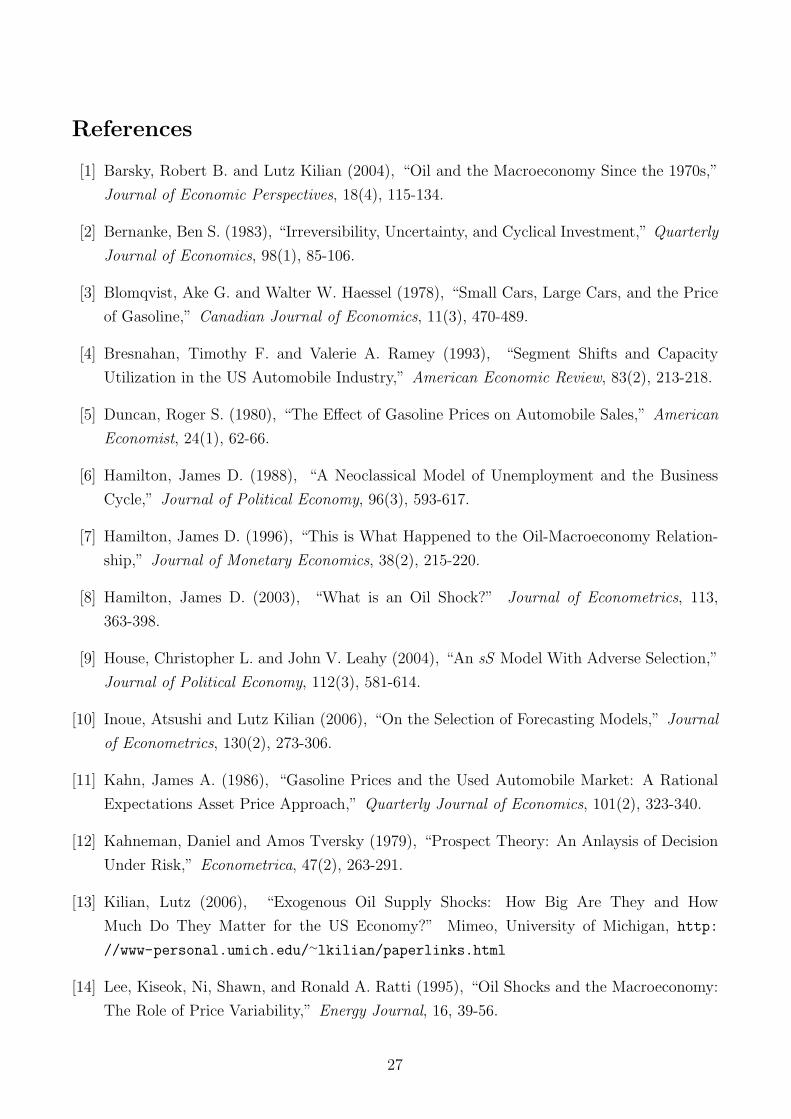
References
[1] Barsky, Robert B. and Lutz Kilian (2004), “Oil and the Macroeconomy Since the 1970s,”
Journal of Economic Perspectives, 18(4), 115-134.
[2] Bernanke, Ben S. (1983), “Irreversibility, Uncertainty, and Cyclical Investment,” Quarterly
Journal of Economics, 98(1), 85-106.
[3] Blomqvist, Ake G. and Walter W. Haessel (1978), “Small Cars, Large Cars, and the Price
of Gasoline,” Canadian Journal of Economics, 11(3), 470-489.
[4] Bresnahan, Timothy F. and Valerie A. Ramey (1993), “Segment Shifts and Capacity
Utilization in the US Automobile Industry,” American Economic Review, 83(2), 213-218.
[5] Duncan, Roger S. (1980), “The Effect of Gasoline Prices on Automobile Sales,” American
Economist, 24(1), 62-66.
[6] Hamilton, James D. (1988), “A Neoclassical Model of Unemployment and the Business
Cycle,” Journal of Political Economy, 96(3), 593-617.
[7] Hamilton, James D. (1996), “This is What Happened to the Oil-Macroeconomy Relation-
ship,” Journal of Monetary Economics, 38(2), 215-220.
[8] Hamilton, James D. (2003), “What is an Oil Shock?” Journal of Econometrics, 113,
363-398.
[9] House, Christopher L. and John V. Leahy (2004), “An sS Model With Adverse Selection,”
Journal of Political Economy, 112(3), 581-614.
[10] Inoue, Atsushi and Lutz Kilian (2006), “On the Selection of Forecasting Models,” Journal
of Econometrics, 130(2), 273-306.
[11] Kahn, James A. (1986), “Gasoline Prices and the Used Automobile Market: A Rational
Expectations Asset Price Approach,” Quarterly Journal of Economics, 101(2), 323-340.
[12] Kahneman, Daniel and Amos Tversky (1979), “Prospect Theory: An Anlaysis of Decision
Under Risk,” Econometrica, 47(2), 263-291.
[13] Kilian, Lutz (2006), “Exogenous Oil Supply Shocks: How Big Are They and How
Much Do They Matter for the US Economy?” Mimeo, University of Michigan, http:
//www-personal.umich.edu/∼lkilian/paperlinks.html
[14] Lee, Kiseok, Ni, Shawn, and Ronald A. Ratti (1995), “Oil Shocks and the Macroeconomy:
The Role of Price Variability,” Energy Journal, 16, 39-56.
27

[15] Mork, Knut A. (1989), “Oil and the Macroeconomy When Prices Go Up and Down: An
Extension of Hamilton’s Results,” Journal of Political Economy, 91, 740-744.
[16] Muellbauer, John. (1974), “Household Producton Theory, Quality, and the ‘Hedonic Tech-
nique,’” American Economic Review, 64(6), 977-994.
[17] Rosen, Harvey S. (1974) “Hedonic Prices and Implicit Markets: Product Differentiation in
Pure Competition,” Journal of Political Economy, 82(1), 34-55.
28

Figure 1: The Demeaned Real Price of Gasoline and Detrended Total New AutoSales in the US, 1976-2005
−6
−4
−2
0
2
4
6
8
Det
rend
ed T
otal
Aut
o S
ales
1976 1981 1986 1991 1996 2001 2005−0.4
−0.2
0
0.2
0.4
0.6
0.8
1
Dem
eane
d R
eal G
asol
ine
Pric
e
Note: With exception of 2005, all ticks are for January of that year (the tick for 2005 is for March). The realgasoline price is expressed in deviations from its mean while the measure of total auto sales is the deviation oftotal sales from a linear time trend. The real gasoline price series is given by the solid line while the linearlydetrended measure of total automobile sales is given by the dashed line.
Date Sources: The data for gasoline prices is the US City Average for regular, unleaded gasoline. It comesfrom the Monthly Energy Review of the US Energy Information Administration and can be found in Table 9.4at http://www.eia.doe.gov/emeu/mer/petro.html. Sales data comes from the Bureau of Economic Analysis’supplemental estimates of motor vehicle sales and can be found at http://www.bea.gov/bea/dn1.htm.
29

Figure 2: The Demaned Real Price of Gasoline and the Detrended Share of LightTruck Sales in the US, 1976-2005
1976 1980 1986 1991 1996 2001 2005−0.1
0
0.1
Det
rend
ed L
ight
Tru
ck S
ales
/ T
otal
Sal
es
−1
0
1
Dem
eane
d R
eal G
asol
ine
Pric
e
Note: With exception of 2005, all ticks are for January of that year. Data sources are the same as in Figure 1.The Light Truck share is given by the dashed line, while the demeaned real gasoline price is the solid line.
30

Figure 3: Real Gasoline Price Shocks Under Random Walk Assumption andContinuous Updating
1980 1981 1982 1983 1984 1985 1986 1987 1988 1989−0.4
−0.3
−0.2
−0.1
0
0.1
0.2
0.3
Year
Rea
l Gas
olin
e P
rice
Sho
ck
Note: All ticks are for July of the year and correspond to Table 6.
31

Figure 4: Real Gasoline Price Shocks Under Random Walk Assumption UsingOutdated or Averaged Expectations
(A) Three Month Lagged
1980 1981 1982 1983 1984 1985 1986 1987 1988 1989−0.4
−0.3
−0.2
−0.1
0
0.1
0.2
0.3
0.4
0.5
Time
Rea
l Gas
olin
e P
rice
Sho
ck
(B) Twelve Month Average
1980 1981 1982 1983 1984 1985 1986 1987 1988 1989−0.2
−0.1
0
0.1
0.2
0.3
0.4
0.5
Time
Rea
l Gas
olin
e P
rice
Sho
ck
32

Figure 4 Continued
(C) Three Month Average
1980 1981 1982 1983 1984 1985 1986 1987 1988 1989−0.3
−0.2
−0.1
0
0.1
0.2
0.3
0.4
Time
Rea
l Gas
olin
e P
rice
Sho
ck
Notes: The three figures above plot the real gasoline price shock series under the three different behavioralassumptions for outdated information sets. Ticks correspond to July of each year.
33

Table 1: Summary Statistics on Fuel Economy for All Models, 1978-1984
Model Year Avg. MPG Med. MPG Std. Dev. Count
1978 21.66 20.19 5.37 3681979 22.82 20.82 5.10 3891980 23.40 22.68 5.34 3611981 24.71 23.88 5.60 3571982 25.98 25.39 6.01 3731983 25.93 25.53 6.12 4501984 26.67 26.00 6.66 483
Table 2: Summary Statistics on Fuel Economy for “Light Trucks”, 1978-1984
Model Year Avg. MPG Med. MPG Std. Dev. Count
1978 17.79 16.89 3.86 471979 18.24 16.40 4.29 231980 18.30 17.05 5.16 411981 19.82 18.64 4.60 401982 20.73 19.77 4.93 591983 20.68 19.65 4.43 1001984 21.32 21.00 5.00 108
Table 3: Summary Statistics on Fuel Economy for Foreign Autos, 1978-1984
Model Year Avg. MPG Med. MPG Std. Dev. Count
1978 24.05 23.35 6.15 1191979 24.45 24.14 5.77 1411980 26.38 25.36 5.75 1201981 28.52 28.47 5.68 1281982 28.67 28.56 5.73 1351983 29.34 28.96 6.28 1471984 29.13 28.00 6.73 164
34

Table 4: Gasoline Prices in July, 1979-1989
Year Nom. Price Real Price
1979 0.949 1.2981980 1.271 1.5361981 1.382 1.5081982 1.331 1.3651983 1.288 1.2891984 1.212 1.1641985 1.242 1.1521986 0.890 0.8131987 0.971 0.8531988 0.967 0.8161989 1.092 0.878
Table 5: Summary Statistics on Percentage Changes in Used Car Prices
Model Year Year Avg. %∆ P Med. %∆ P Std. Dev.
1978 1980 -0.24 -0.23 0.071981 -0.11 -0.13 0.081982 -0.14 -0.15 0.061983 -0.16 -0.16 0.06
1979 1981 -0.12 -0.13 0.061982 -0.14 -0.15 0.061983 -0.16 -0.16 0.061984 -0.13 -0.13 0.06
1980 1982 -0.15 -0.15 0.051983 -0.15 -0.15 0.071984 -0.11 -0.12 0.051985 -0.21 -0.21 0.06
1981 1983 -0.14 -0.14 0.061984 -0.11 -0.10 0.041985 -0.20 -0.20 0.051986 -0.26 -0.26 0.07
1982 1984 -0.10 -0.10 0.041985 -0.18 -0.18 0.041986 -0.23 -0.23 0.061987 -0.16 -0.17 0.06
1983 1985 -0.18 -0.17 0.051986 -0.22 -0.22 0.051987 -0.14 -0.14 0.061988 -0.18 -0.18 0.06
1984 1986 -0.20 -0.20 0.051987 -0.13 -0.12 0.061988 -0.17 -0.17 0.051989 -0.23 -0.23 0.06
35

Table 6: Gasoline Price Shock Series Assuming Random Walk Expectations andContinuous Updating
Date Et+1gt+j − Etgt+j ∀j ≥ 1
July 1980 0.2380July 1981 -0.0280July 1982 -0.1430July 1983 -0.0760July 1984 -0.1250July 1985 -0.0120July 1986 -0.3390July 1987 0.0400July 1988 -0.0370July 1989 0.0620
Table 7: Forecast Model Evaluation
Model SIC
p = 2, q = 2 -4.721p = 1, q = 2 -4.757p = 0, q = 2 −4.793∗
p = 2, q = 1 -4.751p = 1, q = 1 -4.787p = 0, q = 1 -4.791p = 1, q = 0 -4.661p = 2, q = 0 -4.748p = 0, q = 0 -4.283
Notes: The computed SIC is for models of the form: ∆gt+1 = α +∑p
j=1 ρj∆gt+1−j + εt+1 +∑q
k=1 θkεt+1−k.The AIC also chooses the IMA(1,2) specification.
36

Table 8: Baseline Regression Results
ExpectationsRandom Walk IMA(1,2)
Least Squares:(a) γ̂ −0.1096∗∗∗ −0.0423∗
(0.0296) (0.0223)
R2 0.4381 0.4375
N 11,120 11,120
(b) γ̂ −0.1086∗∗ −0.0640∗
(0.0489) (0.0356)
R2 0.5424 0.5422
N 5,485 5,485
(c) γ̂ 0.0109 0.037∗
(0.0296) (0.0219)
R2 0.4877 0.4878
N 11,120 11,120
Fixed Effects:(d) γ̂ −0.074∗∗∗ -0.0098
(0.0345) (0.0247)
R2 0.6437 0.6434
N 11,120 11,120
(e) γ̂ −0.2887∗∗∗ −0.1678∗∗∗
(0.0587) (0.0705)
R2 0.7064 0.7053
N 5,485 5,485
Standard errors robust to heteroskedasticity and autocorrelation are in parentheses. ∗∗∗ denotes statistical signif-icance at the one percent level, ∗∗ at the five percent level, and ∗ at the ten percent level. All least squares resultsinclude controls for year, age, and manufacturer. Fixed effects results include controls for year and age. Rows(a) and (d) present results from estimation on the full sample, while rows (b) and (e) omit from the estimationall foreign autos, SUVs or trucks, and diesel engine autos. Row (c) includes separate controls for foreign autos,SUVs or trucks, and diesel engine autos. The two columns denote the two different expectations formationhypotheses. All results in this table use the baseline calibration of T = 10, m = 10, 000, and β = 0.9524, whichcorresponds to a discount rate of 0.05.
37

Table 9: Theoretical and Estimated Price Effects of a $0.25 Gasoline Price Shock
Car Theoretical ∆P Estimated ∆P
25 MPG -$1,131 -$123
15 MPG -$679 -$74
The above table uses the estimated response coefficient γ from pooled least squares estimation under the randomwalk expectations assumption and baseline calibration on the entire sample to compute the estimated ∆P . Thehypothetical autos are assumed to be of the same age with the same existing price and only differ in gasolineconsumption: one is assumed to get 25 miles per gallon while the other only gets 15.
38

Table 10: Sensitivity Analysis
MPGW MPGH
m r 10 9 8 7 6 10 9 8 7 6
10,000 0.05 -.11 -.15 -.20 -.30 -.43 -.16 -.20 -.28 -.40 -.560.10 -.11 -.15 -.21 -.31 -.46 -.16 -.21 -.29 -.41 -.590.25 -.11 -.14 -.20 -.31 -.49 -.17 -.21 -.29 -.43 -.640.50 -.11 -.14 -.18 -.29 -.52 -.18 -.21 -.28 -.42 -.691.00 -.12 -.13 -.17 -.26 -.51 -.21 -.23 -.28 -.39 -.70
9,000 0.05 -.12 -.16 -.23 -.33 -.48 -.17 -.22 -.31 -.44 -.620.10 -.13 -.16 -.23 -.34 -.50 -.18 -.23 -.31 -.45 -.650.25 -.12 -.16 -.23 -.35 -.54 -.19 -.24 -.32 -.47 -.710.50 -.12 -.15 -.21 -.33 -.58 -.20 -.24 -.31 -.47 -.771.00 -.13 -.15 -.19 -.29 -.57 -.23 -.25 -.30 -.43 -.78
8,000 0.05 -.14 -.18 -.26 -.37 -.54 -.19 -.25 -.35 -.50 -.700.10 -.14 -.18 -.26 -.38 -.56 -.20 -.26 -.35 -.51 -.730.25 -.14 -.18 -.25 -.39 -.61 -.21 -.26 -.36 -.53 -.800.50 -.14 -.17 -.24 -.37 -.65 -.22 -.27 -.35 -.53 -.871.00 -.15 -.17 -.21 -.32 -.64 -.26 -.28 -.34 -.48 -.88
7,000 0.05 -.16 -.21 -.29 -.43 -.61 -.22 -.29 -.40 -.57 -.800.10 -.16 -.21 -.29 -.44 -.64 -.23 -.30 -.40 -.58 -.840.25 -.16 -.20 -.29 -.45 -.70 -.24 -.30 -.41 -.61 -.920.50 -.16 -.19 -.27 -.43 -.74 -.26 -.31 -.40 -.60 -.991.00 -.17 -.19 -.24 -.37 -.73 -.30 -.33 -.39 -.56 -1.00
6,000 0.05 -.18 -.24 -.34 -.50 -.72 -.26 -.34 -.46 -.66 -.940.10 -.18 -.24 -.35 -.51 -.75 -.26 -.34 -.47 -.68 -.980.25 -.18 -.24 -.34 -.52 -.81 -.28 -.35 -.48 -.71 -1.070.50 -.18 -.23 -.31 -.50 -.87 -.30 -.36 -.47 -.70 -1.151.00 -.20 -.22 -.28 -.43 -.85 -.35 -.38 -.46 -.65 -1.17
5,000 0.05 -.22 -.29 -.41 -.60 -.86 -.31 -.40 -.55 -.80 -1.120.10 -.22 -.29 -.41 -.61 -.89 -.32 -.41 -.57 -.82 -1.170.25 -.22 -.29 -.41 -.63 -.98 -.34 -.42 -.58 -.85 -1.290.50 -.21 -.27 -.38 -.60 -1.04 -.36 -.43 -.56 -.84 -1.391.00 -.24 -.27 -.34 -.52 -1.02 -.42 -.46 -.55 -.78 -1.40
Notes: Figures in tables are from OLS estimates of equation (10) using the various different calibrations underthe assumption of continuously updated random walk gasoline price expectations. 10, 9, 8, 7, and 6 refer to lifeexpectancy of autos, T , m is expected total usage, and r is the discount rate. MPGW refers to the weightedaverage miles per gallon while MPGH refers to the highway miles per gallon.
39

Table 11: Behavioral Alternatives: Different Information Sets for Expectations
Information SetApril 12 Month Avg. 3 Month Avg.
Least Squares:(a) γ̂ −0.146∗∗∗ −0.243∗∗∗ −0.159∗∗∗
(0.025) (0.035) (0.028)
R2 0.4396 0.4406 0.4394
N 11,120 11,120 11,120
(b) γ̂ −0.074∗ -0.103 −0.084∗
(0.043) (0.065) (0.047)
R2 0.5423 0.5423 0.5423
N 5,485 5,485 5,485
(c) γ̂ −0.070∗∗∗ −0.116∗∗∗ −0.066∗∗∗
(0.025) (0.037) (0.028))
R2 0.4852 0.4854 0.4851
N 11,120 11,120 11,120
Fixed Effects:(d) γ̂ −0.110∗∗∗ −0.304∗∗∗ −0.125∗∗∗
(0.028) (0.042) (0.031)
R2 0.6445 0.6472 0.6445
N 11,120 11,120 11,120
(e) γ̂ −0.139∗∗∗ −0.351∗∗∗ −0.184∗∗∗
(0.050) (0.083) (0.057)
R2 0.7047 0.7070 0.7051
N 5,485 5,485 5,485
Standard errors robust to heteroskedasticity and autocorrelation are in parentheses. ∗∗∗ denotes statistical sig-nificance at the one percent level, ∗∗ at the five percent level, and ∗ at the ten percent level. All least squaresresults include controls for year, age, and manufacturer. Fixed effects results include controls for year and age.Rows (a) and (d) present results from estimation on the full sample, while rows (b) and (e) omit from the esti-mation all foreign autos, SUVs or trucks, and diesel engine autos. Row (c) includes separate controls for foreignautos, SUVs or trucks, and diesel engine autos. The three columns denote different information sets on whichexpectations are based, and all results assume random walk expectations. The calibration of other parametersis the same as in Table 8.
40

Table 12: Volatility Adjustment Terms
Date AdjustmentJul. 1980 2.827718Jul. 1981 0.762117Jul. 1982 0.507229Jul. 1983 2.3747Jul. 1984 1.135367Jul. 1985 1.043087Jul. 1986 0.663496Jul. 1987 1.388441Jul. 1988 1.113579Jul. 1989 0.96438
Table 13: Response Coefficients With Volatility Adjusted Real Gasoline PriceShock Series
γV
OLS −0.226∗∗∗
(0.023)
FE −0.248∗∗∗
(0.029)
Notes: Estimation is on the full sample assuming continuously updated, random walk gasoline price expec-tations. OLS estimation includes controls for age, year, and manufacturer, while fixed effects (FE) estimatesinclude controls for age and year. Robust standard errors are in parentheses. The volatility adjusted gasoline priceshock series is constructed as described in the text. The other parameters are calibrated as in the baseline model.
41

Table 14: Asymmetric Expectations Updating
Specification γ̂ 95% CI
(a) Large Changes OnlyOLS 0.0065 [-0.054, 0.067]
(0.031)
FE 0.0410 [-0.023, 0.105](0.033)
(b) Increases OnlyOLS −0.887∗∗∗ [-0.712, -1.064]
(0.089)
FE −1.160∗∗∗ [-0.935, -1.386](0.115)
(c) Decreases OnlyOLS -0.001 [-0.063, 0.059]
(0.031)
FE 0.088∗∗ [0.021, 0.156](0.034)
Notes: Estimation is on the full sample. Robust standard errors are in parentheses. Row (a), titled “LargeChanges Only” zeros out all changes in gasoline price expectations except those occurring in the years 1980,1982, and 1986, years in which the real gasoline price very clearly did change substantially. Row (b) zeros out allchanges in gasoline prices except those years in which real gasoline prices increased. Row (c) zeros out all changesin gasoline price expectations except those occurring in years in which the real gasoline price fell. Thus, row (a)considers situations in which agents only update their gasoline price expectations in response to “large” changesin prices, row (b) considers situations in which agents only revise their expectations in response to increases inthe real price of gasoline, and row (c) considers situations in which expectations are revised only in response todecreases in gasoline prices. Conditional on this updating, we assume that expectations are formed according toa random walk.
42

Table 15: Tests for Equality of Coefficients in Asymmetric Updating SpecificationsOLS
Expectations γ γI γ + γI 95% CI γ 95% CI γ + γI
(1) Continuous 0.052∗ −0.959∗∗∗ −0.907∗∗∗ [-0.009, 0.113] [-1.155, -0.764](0.031) (0.099) (0.090)
(2) 3 Month Lag -0.018 −0.479∗∗∗ −0.498 [-0.075, 0.037] [-0.602, -0.395](0.028) (0.063) (0.053)
(3) 12 Month Avg. −0.205∗∗∗ -0.095 −0.299∗∗∗ [-0.295, -0.114] [-0.428, -0.17](0.046) (0.086) (0.0659)
(4) 3 Month Avg. -0.007 −0.608∗∗∗ −0.616∗∗∗ [-0.069, 0.054] [-0.737, -0.498](0.032) (0.072) (0.062)
FE
(1) Continuous 0.247∗∗∗ −1.584∗∗∗ −1.337∗∗∗ [0.179, 0.315] [-1.102, -1.571](0.035) (0.133) (0.119)
(2) 3 Month Lag 0.172∗∗∗ −0.985∗∗∗ −0.813∗∗∗ [0.112, 0.232] [-0.955, -0.672](0.031) (0.085) (0.072)
(3) 12 Month Avg. 0.002 −0.666∗∗∗ −0.664∗∗∗ [-0.120, 0.124] [-0.840, -0.487](0.062) (0.129) (0.089)
(4) 3 Month Avg. 0.183∗∗∗ −1.137∗∗∗ −0.954∗∗∗ [0.116, 0.249] [-1.116, -0.790](0.034) (0.096) (0.083)
Notes: All of the above estimates are from regressions on the full sample of the form:
Pi,k+1,t+1 − Pi,k,t
Pi,k,t+ δk = α + γxi,k,t+1 + γIDIxi,k,t+1 +
1989∑v=1981
θvyv +5∑
k=3
ψkak +Q∑
q=1
φqMq + ei,t+1
DI is a dummy variable equal to 1 if the gasoline price shock is positive and zero otherwise. We assume randomwalk expectations on the basis of different information sets (described in first column) and use the baselinecalibration of Tables 8 and 11 for the other parameters. The second row gives the estimate of γ, which can beinterpreted as the response of car prices to negative fuel price surprises. γ + γI is then the response to positivefuel price surprises. The final two columns of the table give the ninety-five percent confidence intervals for bothestimates. Robust standard errors in parentheses.
43


![Topological Efiects on Minimum Weight Steiner Triangulationsdeloera/MISC/LA... · Topological Efiects on Minimum Weight Steiner Triangulations ... 19, 18, 20, 10] and higher dimensions[7,](https://img.pdfslide.us/doc/110x75/5e8fda2f67843537225cd76d/topological-eiects-on-minimum-weight-steiner-triangulations-deloeramiscla.jpg)