Embed Size (px)
Citation preview
The Effect of a Solid Surface on the Segregation and Melting of SaltHydratesYu Zhang, Emmanuel Anim-Danso, and Ali Dhinojwala*
Department of Polymer Science, The University of Akron, Akron, Ohio 44325-3909, United States
*S Supporting Information
ABSTRACT: Considering the importance of salt and water on earth,the crystallization of salt hydrates next to solid surfaces has importantimplications in physical and biological sciences. Heterogeneous nuclea-tion is driven by surface interactions, but our understanding of hydrateformation near surfaces is limited. Here, we have studied the hydrateformation of three commonly prevalent salts, MgCl2, CaCl2, andNaCl, next to a sapphire substrate using surface sensitive infrared-visible sum frequency generation (SFG) spectroscopy. SFG spectros-copy can detect the crystallization and melting of salt hydrates at theinterface by observing the changes in the intensity and the location ofthe cocrystallized water hydroxyl peaks (3200−3600 cm−1). Theresults indicate that the surface crystal structures of these threehydrates are similar to those in the bulk. For the NaCl solution, thebrine solution is segregated next to the sapphire substrate after the formation of the ice phase. In contrast, the MgCl2 and CaCl2surface hydrate crystals are interdispersed with nanometer-size ice crystals. The nanosize ice crystals melt at much lowertemperatures than bulk ice crystals. For NaCl and MgCl2 solution, the NaCl hydrates prefer to crystallize next to the sapphiresubstrate instead of the ice crystals and MgCl2 hydrates.
■ INTRODUCTION
The formation of salt hydrates is of scientific and technologicalinterest in the areas of energy storage,1,2 biology,3,4 climatology,5
and geology.6−11 The salt hydrates are formed by cooling anaqueous salt solution which leads to phase separation betweenthe salt-rich brine solution and the freezing of water to form ice.Further cooling results in concentrating the brine solution andincreasing the thickness of the ice layer, and eventually in thefreezing of the salt-hydrates near the eutectic concentration.12
The number of water molecules cocrystallized in the hydratecrystal depends on the chemistry of the salt. Hydrate formationand its phase diagram have been studied by measuring thermalproperties,1,2,13 X-ray diffraction,14−17 Raman,18−20 and infraredspectroscopy.21−24 In Raman and IR spectroscopy, theobservation of sharp absorption bands between 3200 and3600 cm−1 has been used to identify the hydrogen-bonding struc-ture of the hydroxyl groups incorporated in the salt hydrates.Although our knowledge of the phase diagram of hydrate
formation in solutions is well established, direct experiments toobserve the formation of salt hydrates near surfaces have notbeen done. The role of ions and mineral nanoparticles onice nucleation have been previously reported, and ions tend tolower the nucleation temperature compared to mineral nano-particles.25−27 However, the nucleation rates are influenced bythe size of the mineral nanoparticles, and the role of surface is stillnot clear. Studying hydrate formation near solid surfaces couldprovide a broader understanding of the role of ions and waterinteractions in controlling heterogeneous nucleation of hydrate
crystals next to solid surfaces. Understanding heterogeneousnucleation is also important in controlling the uniformity ofcrystals, and thus the energy stored and released in phase changematerials for energy applications.1,2,13 The uniformity of hydratecrystals and the segregation of brine next to solid surfaces are alsoimportant for ice adhesion and friction, properties which are veryrelevant in understanding the movement of glaciers formed fromseawater28 and in mitigating ice formation on aircrafts, powerlines, and wind turbine blades. One could also imagine that thesurface segregation of brine may have played an important role insustaining life at low temperatures and has important con-sequences in our understanding the origin of life. In additionto the importance of this problem on earth, where we have anabundance of salt water, it is also becoming increasingly imp-ortant to understand the role of water on other planetary bodies6,29
where hydrates are found as inclusions in mineral layers.We have combined a surface sensitive sum frequency genera-
tion (SFG) technique with a novel design of a low temperatureheating/cooling sample holder to study the formation of salthydrates next to a sapphire surface.30 SFG is a second ordernonlinear optical technique that involves mixing a short-pulsehigh intensity visible laser (ωvis) with a tunable infrared laser(ωIR). Based on the dipole approximation, the SFG signal, atthe sum of ωSFG = ωvis + ωIR, is only generated at interfaces insystems where the bulk is centrosymmetric. By combining SFG
Received: July 5, 2014Published: October 1, 2014
Article
pubs.acs.org/JACS
© 2014 American Chemical Society 14811 dx.doi.org/10.1021/ja5067866 | J. Am. Chem. Soc. 2014, 136, 14811−14820
with a total internal reflection geometry, this technique offersthe ability to study the structure and transition temperature ofmolecules next to a solid interface. The probe depth in SFGexperiments is the distance from the surface to the positionwhere the anisotropic molecular orientation becomes isotropic.Previously, we have demonstrated the use of this approach tomonitor the formation of NaCl hydrate.30 Here, we have studiedthe freezing and melting of three common salt solutions, MgCl2,CaCl2, and NaCl. These three cations (Mg2+, Ca2+, and Na+) areabundant in geological and biological systems and are usedas phase-change materials for energy storage applications.1,2
These three salt solutions also have very different eutectic con-centrations, transition temperatures, and coordination numbersof water molecules in the bulk hydrate crystals. In addition tomeasuring the structure formation, we have also measured thedifferences in surface and bulk transition temperatures for thethree salt solutions and a mixture of salts (NaCl and MgCl2)using identical conditions. Surprisingly, in the case of the mix-ture, the competition between the two ions resulted in thesegregation of the NaCl hydrate next to the sapphire substrate.
■ EXPERIMENTAL SECTIONSample Preparation. The sapphire prisms and cells were
sequentially sonicated for 1 h in different solvents (toluene, acetone,methanol, and deionized water) to remove nonpolar and polar con-taminants. After the solvent treatments, the prisms were rinsed bydeionized water and dried using a slow stream of nitrogen gas. To furtherremove any surface organic residues, the final step involved cleaning thesapphire prisms using air plasma for 4 min. The stainless cells wereheated in an oven at 120 °C for 1 h and cleaned by air plasma for 2 minbefore the experiments. Ultrapure water (18.2 MΩ/cm from aMilliporefiltration system) was used in these experiments. X-ray photoelectronspectroscopy (XPS) was used to verify that the adventitious hydro-carbons signals were less than 5%, and the SFG spectra of blank sapphireprisms were checked to make sure that there were no spectral fea-tures between 2750 and 3000 cm−1, indicating minimal hydrocarboncontamination on the sapphire surface. The salt solutions with differentconcentrations were prepared using NaCl (purity ≥99%, anhydrous,powder, purchased from Fisher Scientific), MgCl2 (purity ≥98%,anhydrous, powder, purchased from Sigma-Aldrich), or CaCl2 (purity≥97%, anhydrous, powder, purchased from Sigma-Aldrich). The SFGspectra collected for NaCl baked at 538 °C for 2 h were not affected bythis additional heating step. For MgCl2, we used activated carbon forpurification, followed by filtration, and this also did not affect the SFGresults.SFG Measurements. The SFG experiments were performed using
a picosecond Spectra Physics laser system with a ∼3.5 μJ tunable IRbeam (2000−3800 cm−1, 1 ps pulse width, 1 kHz repetition rate, and adiameter of 100−200 μm) and a ∼70 μJ visible beam (800 nm wave-length, 1 ps pulse width, 1 kHz repetition rate, and a diameter of 1mm).30,31
The IR beam energy used in this work had a negligible effect on the laserheating of the ice or hydrate. The measured transition temperature of iceinto water at the surface occurred at 0 °C.31 The SFG measurementsinvolved spatial and temporal overlap of the two laser beams on thesample. A motorized, computer-controlled delay stage was used toensure that the temporal delay was maintained while scanning IRfrequencies from 2800 to 3800 cm−1. We have used a total-internal-reflection (TIR) geometry with an equilateral 60° sapphire prism and a16° incident angle with respect to the surface normal to probe thesapphire−brine and sapphire−hydrate interface.32,33 The total internalreflection angle depends on the refractive index of brine (critical angle∼16°) and hydrate (critical angle ca. −2° to ∼10°), and also therefractive index varies as a function of wavelength. However, we havefixed the incident angle in this experiment because of the windows usedfor the vacuum cell. We estimate that for 2700 cm−1, the SFG intensitywill be ∼53% of the value at 4200 cm−1 for the water−sapphire system.Nevertheless, the hydrate peaks are relatively sharp and the spectral
features will not be affected by the changes in the critical angle as afunction of wavenumber. We have estimated the thickness of the brineand salt hydrate layers as follows: For 0.1 M solutions at eutectictemperatures, the thickness is ∼25 μm for MgCl2 brine, ∼7 μm forMgCl2 hydrate, ∼20 μm for CaCl2 brine, ∼12 μm for CaCl2 hydrate,∼14 μm for NaCl brine, and ∼5 μm for NaCl hydrate. The refractiveindices of brine and ice/water are very similar and for the conditionsused here, we are primarily probing the sapphire−brine interface. Forhydrates, it is possible that for 16° incident angle, we may have SFGsignals from both sapphire/hydrate and hydrate/ice interfaces.However, because of absorption/scattering by the thick hydrate layers,we anticipate the SFG signals to be dominated by the sapphire/hydrateinterface. The results for NaCl hydrate experiments support thishypothesis because we do not observe ice peaks after the formation ofthe NaCl hydrate crystals.30 Because of these reasons, we have assumedthat the SFG signals are generated from the sapphire/hydrate inter-face rather than the hydrate/ice interface. The incident angle of thevisible beam was 1−2° lower than that of the IR beam. The SFG signalswere collected using a photomultiplier tube connected to a 0.5 mspectrometer. We have collected SFG spectra using both PPP(p-polarized SFG output, p-polarized visible input, and p-polarized IRinput) and SSP (s-polarized SFG output, s-polarized visible input, and p-polarized IR input) polarizations. The SSP and PPP polarizationsprovide complementary information which can be used to provideinformation on the orientation of molecules at the interface. Because ofthe similarity in the SSP and PPP spectra for hydrate and brine solutions,for pure hydrates, PPP spectra are shown in the paper, and the SSPspectra are shown in Supporting Information (Figure S1−S2). ALorentzian fitting function was used to fit all the SFG spectra.31,33 Thepeak position provides the chemical identity of the interfacial molecules,and the amplitude strength is proportional to the concentration and theorientation of the interfacial molecules.
∑χω ω
∝ +− − Γ
IA
iq
q qSFG eff,NR
IR
2
(1)
where Aq,ωq, and Γq are the amplitude, angular frequency, and dampingconstant of the qth vibrational resonance. χeff,NR describes the non-resonant contribution.
Heating and Cooling Cell. Water condensation is one of thebiggest challenges in low temperature measurements; we have designeda vacuum cell (pressure of 0.13 Torr) to house the sapphire prisms toreduce water condensation. The salt solution was sealed in the innerchamber with a sapphire prism on one side and a customized tem-perature stage (Instec Inc.) on the other side. A steel dome was designedwith CaF2 windows to allow the passage of the visible and IR inputbeams and the SFG output beam. The pure hydrate experiments wereconducted using a rate of 5 °C/min with 30min equilibration time every5 °C change in temperature in cooling, and 0.5 °C/min with 30 minequilibration time every degree change in temperature in heating. Forthe mixtures of the NaCl and MgCl2, we used a rate of 1 °C/min with10 min equilibration time between every degree change in temperaturein the slow cooling cycle, 0.5 °C/min with 30 min equilibration timeevery degree change in temperature in the heating cycle, and 5 °C/minwith 5 min equilibrium time every 10 °C change in temperature in thefast cooling cycle. The details of the experimental cell were provided inprevious publications.30,31
Reflectivity Measurements. The reflectivity of the helium−neon(He−Ne) beam (632.8 nm wavelength) was measured to determinethe phase transition temperatures of the bulk salt solutions.34 Thesemeasurements were performed in a total internal reflection geometryusing the SFG sample cell. Similar heating rates and equilibration timeused in the SFG experiments are also used for reflectivity experiments.The changes in the reflected intensity depend on the changes in therefractive index during melting of the hydrates. By using the sapphire/brine two-layer system and the refractive indices of brine, sapphire, andhydrates, we have calculated the critical angle necessary for thesemeasurements. When the temperature is higher than Tm, the criticalangle for the liquid is very different from the crystals and we expect asharp change in the intensity upon melting. On the basis of these
Journal of the American Chemical Society Article
dx.doi.org/10.1021/ja5067866 | J. Am. Chem. Soc. 2014, 136, 14811−1482014812
calculations, we have used the incident angles with respect to the surfacenormal of the prism face of ∼11° for 22 wt % NaCl, 30 wt % CaCl2solutions, and ∼9° for 20 wt % MgCl2 solution. These incident angleswere chosen based on the critical angles of the CaCl2 brine, NaClhydrate, and MgCl2 hydrate. The concentrations for all the solutionswere around the eutectic point, to prevent formation of ice and phaseseparation between the ice and brine region. At eutectic concentrations,we expect a direct transition from aqueous solution to salt hydrates.A diode detector (brand, Newport; model, 820-SL-01) was used tomeasure the reflected intensity. We have used the bulk melting temp-erature of hydrate (Supporting Information, Table S2)12 to calibrate thetemperature of the SFG cell. The bulk melting temperatures weremeasured by monitoring the changes in the reflected intensity of theHe−Ne laser beam. In addition, we have taken advantage of the sharpchanges in the IR absorption spectra as a function of temperature tomeasure the bulk melting temperatures (Supporting Information,Figures S4−S7). Both IR and He−Ne measurements probe transitiontemperatures corresponding to a depth of few micrometers. Acalibration curve (Supporting Information, Figure S3) was used toobtain corrected temperatures and to accurately calculate the surfacetransition temperatures measured using SFG.Results and Discussion. The sketch of the phase diagram for
MgCl2, CaCl2, and NaCl is shown in Figure 1. The eutectic con-
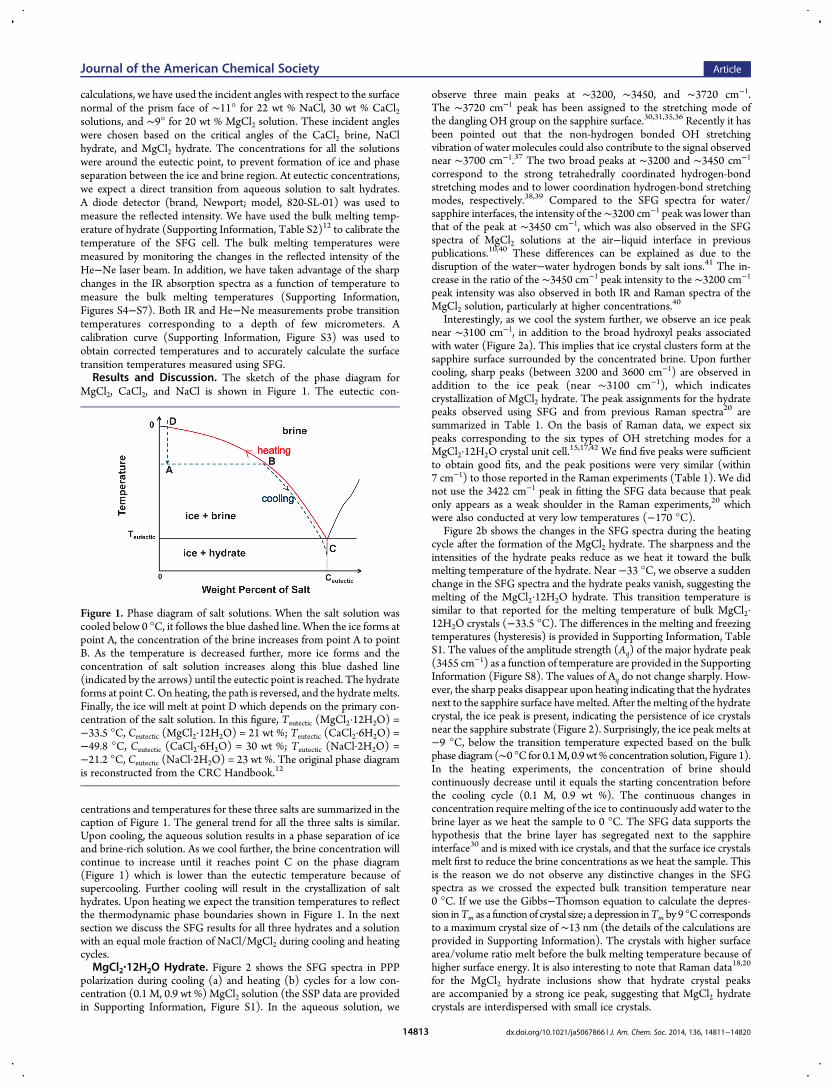
centrations and temperatures for these three salts are summarized in thecaption of Figure 1. The general trend for all the three salts is similar.Upon cooling, the aqueous solution results in a phase separation of iceand brine-rich solution. As we cool further, the brine concentration willcontinue to increase until it reaches point C on the phase diagram(Figure 1) which is lower than the eutectic temperature because ofsupercooling. Further cooling will result in the crystallization of salthydrates. Upon heating we expect the transition temperatures to reflectthe thermodynamic phase boundaries shown in Figure 1. In the nextsection we discuss the SFG results for all three hydrates and a solutionwith an equal mole fraction of NaCl/MgCl2 during cooling and heatingcycles.MgCl2·12H2O Hydrate. Figure 2 shows the SFG spectra in PPP
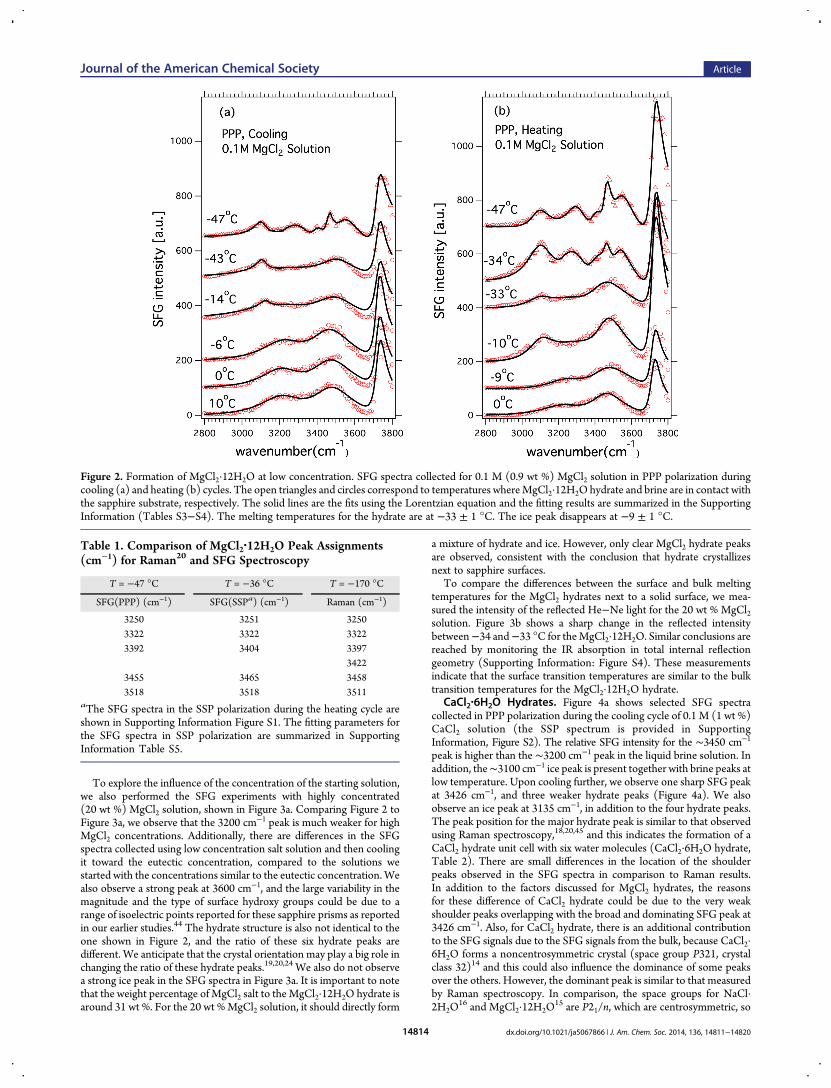
polarization during cooling (a) and heating (b) cycles for a low con-centration (0.1 M, 0.9 wt %) MgCl2 solution (the SSP data are providedin Supporting Information, Figure S1). In the aqueous solution, we
observe three main peaks at ∼3200, ∼3450, and ∼3720 cm−1.The ∼3720 cm−1 peak has been assigned to the stretching mode ofthe dangling OH group on the sapphire surface.30,31,35,36 Recently it hasbeen pointed out that the non-hydrogen bonded OH stretchingvibration of water molecules could also contribute to the signal observednear ∼3700 cm−1.37 The two broad peaks at ∼3200 and ∼3450 cm−1
correspond to the strong tetrahedrally coordinated hydrogen-bondstretching modes and to lower coordination hydrogen-bond stretchingmodes, respectively.38,39 Compared to the SFG spectra for water/sapphire interfaces, the intensity of the∼3200 cm−1 peak was lower thanthat of the peak at ∼3450 cm−1, which was also observed in the SFGspectra of MgCl2 solutions at the air−liquid interface in previouspublications.10,40 These differences can be explained as due to thedisruption of the water−water hydrogen bonds by salt ions.41 The in-crease in the ratio of the ∼3450 cm−1 peak intensity to the ∼3200 cm−1
peak intensity was also observed in both IR and Raman spectra of theMgCl2 solution, particularly at higher concentrations.
40
Interestingly, as we cool the system further, we observe an ice peaknear ∼3100 cm−1, in addition to the broad hydroxyl peaks associatedwith water (Figure 2a). This implies that ice crystal clusters form at thesapphire surface surrounded by the concentrated brine. Upon furthercooling, sharp peaks (between 3200 and 3600 cm−1) are observed inaddition to the ice peak (near ∼3100 cm−1), which indicatescrystallization of MgCl2 hydrate. The peak assignments for the hydratepeaks observed using SFG and from previous Raman spectra20 aresummarized in Table 1. On the basis of Raman data, we expect sixpeaks corresponding to the six types of OH stretching modes for aMgCl2·12H2O crystal unit cell.15,17,42 We find five peaks were sufficientto obtain good fits, and the peak positions were very similar (within7 cm−1) to those reported in the Raman experiments (Table 1). We didnot use the 3422 cm−1 peak in fitting the SFG data because that peakonly appears as a weak shoulder in the Raman experiments,20 whichwere also conducted at very low temperatures (−170 °C).
Figure 2b shows the changes in the SFG spectra during the heatingcycle after the formation of the MgCl2 hydrate. The sharpness and theintensities of the hydrate peaks reduce as we heat it toward the bulkmelting temperature of the hydrate. Near −33 °C, we observe a suddenchange in the SFG spectra and the hydrate peaks vanish, suggesting themelting of the MgCl2·12H2O hydrate. This transition temperature issimilar to that reported for the melting temperature of bulk MgCl2·12H2O crystals (−33.5 °C). The differences in the melting and freezingtemperatures (hysteresis) is provided in Supporting Information, TableS1. The values of the amplitude strength (Aq) of the major hydrate peak(3455 cm−1) as a function of temperature are provided in the SupportingInformation (Figure S8). The values of Aq do not change sharply. How-ever, the sharp peaks disappear upon heating indicating that the hydratesnext to the sapphire surface havemelted. After themelting of the hydratecrystal, the ice peak is present, indicating the persistence of ice crystalsnear the sapphire substrate (Figure 2). Surprisingly, the ice peak melts at−9 °C, below the transition temperature expected based on the bulkphase diagram (∼0 °C for 0.1M, 0.9wt% concentration solution, Figure 1).In the heating experiments, the concentration of brine shouldcontinuously decrease until it equals the starting concentration beforethe cooling cycle (0.1 M, 0.9 wt %). The continuous changes inconcentration require melting of the ice to continuously add water to thebrine layer as we heat the sample to 0 °C. The SFG data supports thehypothesis that the brine layer has segregated next to the sapphireinterface30 and is mixed with ice crystals, and that the surface ice crystalsmelt first to reduce the brine concentrations as we heat the sample. Thisis the reason we do not observe any distinctive changes in the SFGspectra as we crossed the expected bulk transition temperature near0 °C. If we use the Gibbs−Thomson equation to calculate the depres-sion inTm as a function of crystal size; a depression inTm by 9 °Ccorrespondsto a maximum crystal size of ∼13 nm (the details of the calculations areprovided in Supporting Information). The crystals with higher surfacearea/volume ratio melt before the bulk melting temperature because ofhigher surface energy. It is also interesting to note that Raman data18,20
for the MgCl2 hydrate inclusions show that hydrate crystal peaksare accompanied by a strong ice peak, suggesting that MgCl2 hydratecrystals are interdispersed with small ice crystals.
Figure 1. Phase diagram of salt solutions. When the salt solution wascooled below 0 °C, it follows the blue dashed line. When the ice forms atpoint A, the concentration of the brine increases from point A to pointB. As the temperature is decreased further, more ice forms and theconcentration of salt solution increases along this blue dashed line(indicated by the arrows) until the eutectic point is reached. The hydrateforms at point C. On heating, the path is reversed, and the hydrate melts.Finally, the ice will melt at point D which depends on the primary con-centration of the salt solution. In this figure, Teutectic (MgCl2·12H2O) =−33.5 °C, Ceutectic (MgCl2·12H2O) = 21 wt %; Teutectic (CaCl2·6H2O) =−49.8 °C, Ceutectic (CaCl2·6H2O) = 30 wt %; Teutectic (NaCl·2H2O) =−21.2 °C, Ceutectic (NaCl·2H2O) = 23 wt %. The original phase diagramis reconstructed from the CRC Handbook.12
Journal of the American Chemical Society Article
dx.doi.org/10.1021/ja5067866 | J. Am. Chem. Soc. 2014, 136, 14811−1482014813
To explore the influence of the concentration of the starting solution,we also performed the SFG experiments with highly concentrated(20 wt %) MgCl2 solution, shown in Figure 3a. Comparing Figure 2 toFigure 3a, we observe that the 3200 cm−1 peak is much weaker for highMgCl2 concentrations. Additionally, there are differences in the SFGspectra collected using low concentration salt solution and then coolingit toward the eutectic concentration, compared to the solutions westarted with the concentrations similar to the eutectic concentration. Wealso observe a strong peak at 3600 cm−1, and the large variability in themagnitude and the type of surface hydroxy groups could be due to arange of isoelectric points reported for these sapphire prisms as reportedin our earlier studies.44 The hydrate structure is also not identical to theone shown in Figure 2, and the ratio of these six hydrate peaks aredifferent. We anticipate that the crystal orientation may play a big role inchanging the ratio of these hydrate peaks.19,20,24 We also do not observea strong ice peak in the SFG spectra in Figure 3a. It is important to notethat the weight percentage of MgCl2 salt to the MgCl2·12H2O hydrate isaround 31 wt %. For the 20 wt %MgCl2 solution, it should directly form
a mixture of hydrate and ice. However, only clear MgCl2 hydrate peaksare observed, consistent with the conclusion that hydrate crystallizesnext to sapphire surfaces.
To compare the differences between the surface and bulk meltingtemperatures for the MgCl2 hydrates next to a solid surface, we mea-sured the intensity of the reflected He−Ne light for the 20 wt % MgCl2solution. Figure 3b shows a sharp change in the reflected intensitybetween−34 and−33 °C for theMgCl2·12H2O. Similar conclusions arereached by monitoring the IR absorption in total internal reflectiongeometry (Supporting Information: Figure S4). These measurementsindicate that the surface transition temperatures are similar to the bulktransition temperatures for the MgCl2·12H2O hydrate.
CaCl2·6H2O Hydrates. Figure 4a shows selected SFG spectracollected in PPP polarization during the cooling cycle of 0.1 M (1 wt %)CaCl2 solution (the SSP spectrum is provided in SupportingInformation, Figure S2). The relative SFG intensity for the ∼3450 cm−1
peak is higher than the ∼3200 cm−1 peak in the liquid brine solution. Inaddition, the∼3100 cm−1 ice peak is present together with brine peaks atlow temperature. Upon cooling further, we observe one sharp SFG peakat 3426 cm−1, and three weaker hydrate peaks (Figure 4a). We alsoobserve an ice peak at 3135 cm−1, in addition to the four hydrate peaks.The peak position for the major hydrate peak is similar to that observedusing Raman spectroscopy,18,20,45 and this indicates the formation of aCaCl2 hydrate unit cell with six water molecules (CaCl2·6H2O hydrate,Table 2). There are small differences in the location of the shoulderpeaks observed in the SFG spectra in comparison to Raman results.In addition to the factors discussed for MgCl2 hydrates, the reasonsfor these difference of CaCl2 hydrate could be due to the very weakshoulder peaks overlapping with the broad and dominating SFG peak at3426 cm−1. Also, for CaCl2 hydrate, there is an additional contributionto the SFG signals due to the SFG signals from the bulk, because CaCl2·6H2O forms a noncentrosymmetric crystal (space group P321, crystalclass 32)14 and this could also influence the dominance of some peaksover the others. However, the dominant peak is similar to that measuredby Raman spectroscopy. In comparison, the space groups for NaCl·2H2O
16 and MgCl2·12H2O15 are P21/n, which are centrosymmetric, so
Figure 2. Formation of MgCl2·12H2O at low concentration. SFG spectra collected for 0.1 M (0.9 wt %) MgCl2 solution in PPP polarization duringcooling (a) and heating (b) cycles. The open triangles and circles correspond to temperatures whereMgCl2·12H2O hydrate and brine are in contact withthe sapphire substrate, respectively. The solid lines are the fits using the Lorentzian equation and the fitting results are summarized in the SupportingInformation (Tables S3−S4). The melting temperatures for the hydrate are at −33 ± 1 °C. The ice peak disappears at −9 ± 1 °C.
Table 1. Comparison of MgCl2·12H2O Peak Assignments(cm−1) for Raman20 and SFG Spectroscopy
T = −47 °C T = −36 °C T = −170 °C
SFG(PPP) (cm−1) SFG(SSPa) (cm−1) Raman (cm−1)
3250 3251 32503322 3322 33223392 3404 3397
34223455 3465 34583518 3518 3511
aThe SFG spectra in the SSP polarization during the heating cycle areshown in Supporting Information Figure S1. The fitting parameters forthe SFG spectra in SSP polarization are summarized in SupportingInformation Table S5.
Journal of the American Chemical Society Article
dx.doi.org/10.1021/ja5067866 | J. Am. Chem. Soc. 2014, 136, 14811−1482014814
we do not expect the bulk to contribute to the SFG signals in these twocrystals.Figure 4b shows selected SFG spectra during the heating cycle after
the formation of the CaCl2 hydrates. The values of Aq for the 3426 cm−1
peak as a function of temperature are provided in the SupportingInformation (Figure S9). The values of Aq continue to decrease in theheating cycle, and near −51 °C we observe a sharp change in themagnitude of Aq. The gradual decrease in Aq before the melting
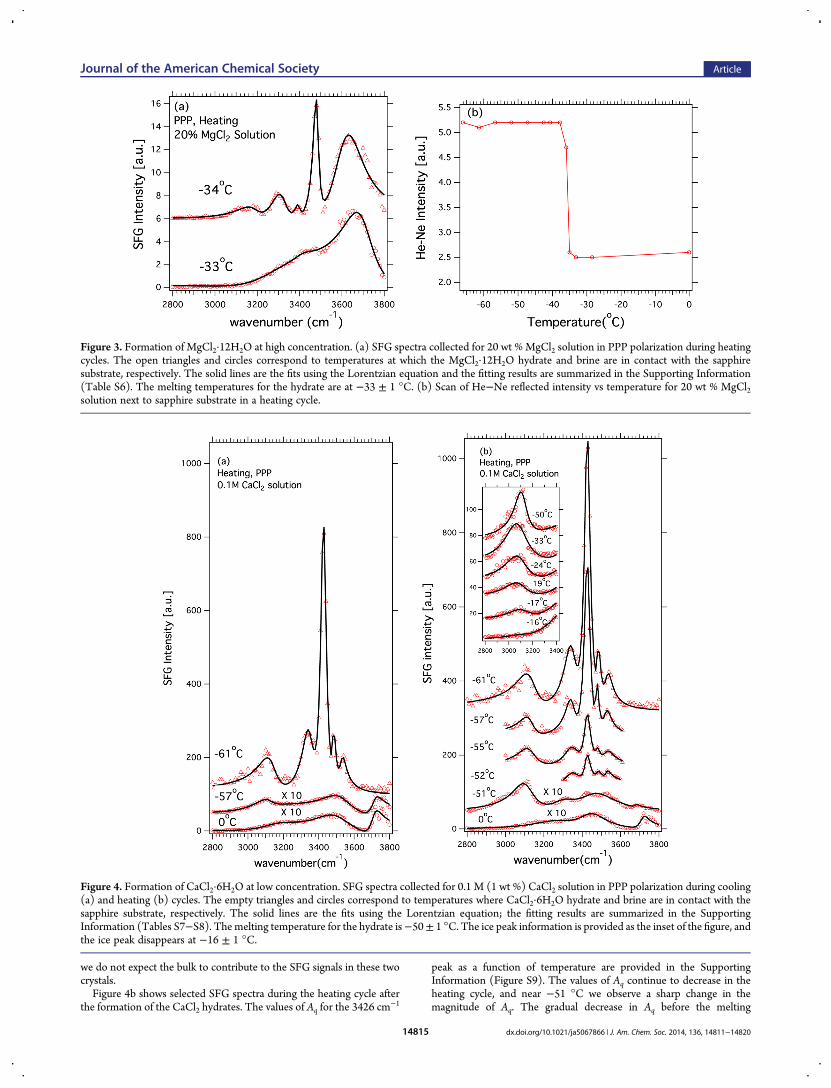
Figure 3. Formation of MgCl2·12H2O at high concentration. (a) SFG spectra collected for 20 wt % MgCl2 solution in PPP polarization during heatingcycles. The open triangles and circles correspond to temperatures at which the MgCl2·12H2O hydrate and brine are in contact with the sapphiresubstrate, respectively. The solid lines are the fits using the Lorentzian equation and the fitting results are summarized in the Supporting Information(Table S6). The melting temperatures for the hydrate are at −33 ± 1 °C. (b) Scan of He−Ne reflected intensity vs temperature for 20 wt % MgCl2solution next to sapphire substrate in a heating cycle.
Figure 4. Formation of CaCl2·6H2O at low concentration. SFG spectra collected for 0.1 M (1 wt %) CaCl2 solution in PPP polarization during cooling(a) and heating (b) cycles. The empty triangles and circles correspond to temperatures where CaCl2·6H2O hydrate and brine are in contact with thesapphire substrate, respectively. The solid lines are the fits using the Lorentzian equation; the fitting results are summarized in the SupportingInformation (Tables S7−S8). Themelting temperature for the hydrate is−50± 1 °C. The ice peak information is provided as the inset of the figure, andthe ice peak disappears at −16 ± 1 °C.
Journal of the American Chemical Society Article
dx.doi.org/10.1021/ja5067866 | J. Am. Chem. Soc. 2014, 136, 14811−1482014815
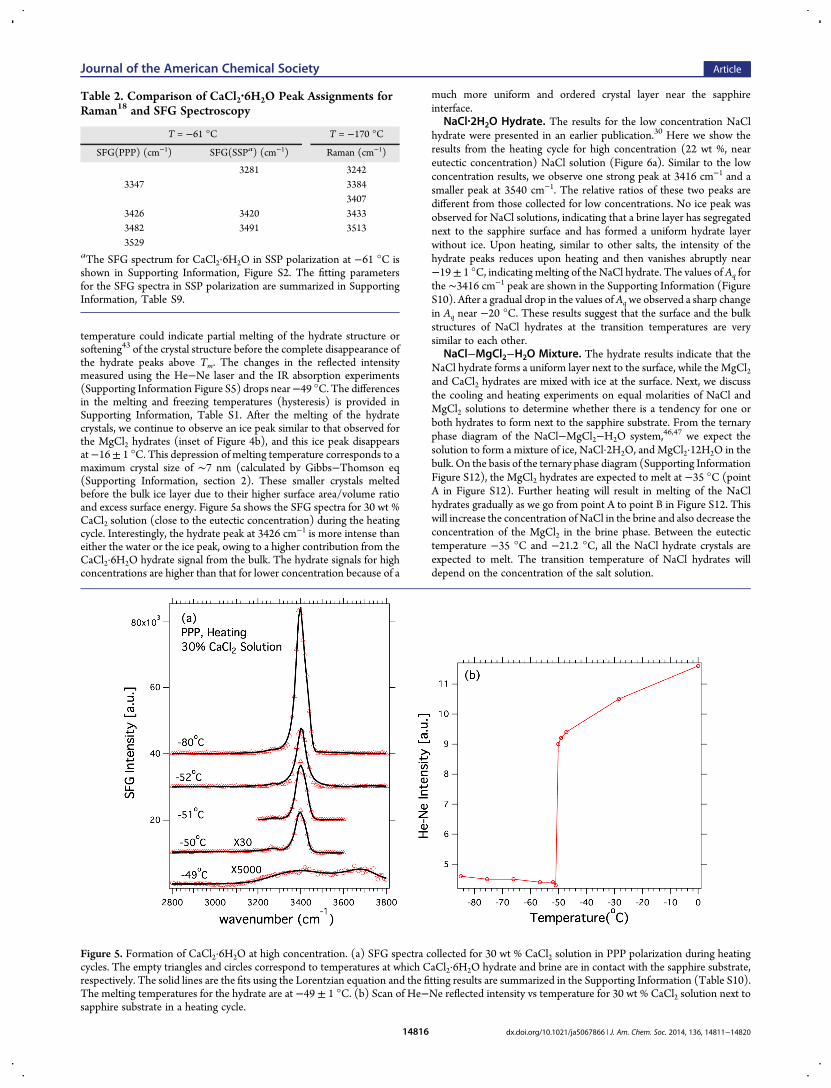
temperature could indicate partial melting of the hydrate structure orsoftening43 of the crystal structure before the complete disappearance ofthe hydrate peaks above Tm. The changes in the reflected intensitymeasured using the He−Ne laser and the IR absorption experiments(Supporting Information Figure S5) drops near−49 °C. The differencesin the melting and freezing temperatures (hysteresis) is provided inSupporting Information, Table S1. After the melting of the hydratecrystals, we continue to observe an ice peak similar to that observed forthe MgCl2 hydrates (inset of Figure 4b), and this ice peak disappearsat−16± 1 °C. This depression of melting temperature corresponds to amaximum crystal size of ∼7 nm (calculated by Gibbs−Thomson eq(Supporting Information, section 2). These smaller crystals meltedbefore the bulk ice layer due to their higher surface area/volume ratioand excess surface energy. Figure 5a shows the SFG spectra for 30 wt %CaCl2 solution (close to the eutectic concentration) during the heatingcycle. Interestingly, the hydrate peak at 3426 cm−1 is more intense thaneither the water or the ice peak, owing to a higher contribution from theCaCl2·6H2O hydrate signal from the bulk. The hydrate signals for highconcentrations are higher than that for lower concentration because of a
much more uniform and ordered crystal layer near the sapphireinterface.
NaCl·2H2O Hydrate. The results for the low concentration NaClhydrate were presented in an earlier publication.30 Here we show theresults from the heating cycle for high concentration (22 wt %, neareutectic concentration) NaCl solution (Figure 6a). Similar to the lowconcentration results, we observe one strong peak at 3416 cm−1 and asmaller peak at 3540 cm−1. The relative ratios of these two peaks aredifferent from those collected for low concentrations. No ice peak wasobserved for NaCl solutions, indicating that a brine layer has segregatednext to the sapphire surface and has formed a uniform hydrate layerwithout ice. Upon heating, similar to other salts, the intensity of thehydrate peaks reduces upon heating and then vanishes abruptly near−19± 1 °C, indicating melting of the NaCl hydrate. The values of Aq forthe ∼3416 cm−1 peak are shown in the Supporting Information (FigureS10). After a gradual drop in the values ofAqwe observed a sharp changein Aq near −20 °C. These results suggest that the surface and the bulkstructures of NaCl hydrates at the transition temperatures are verysimilar to each other.
NaCl−MgCl2−H2O Mixture. The hydrate results indicate that theNaCl hydrate forms a uniform layer next to the surface, while the MgCl2and CaCl2 hydrates are mixed with ice at the surface. Next, we discussthe cooling and heating experiments on equal molarities of NaCl andMgCl2 solutions to determine whether there is a tendency for one orboth hydrates to form next to the sapphire substrate. From the ternaryphase diagram of the NaCl−MgCl2−H2O system,46,47 we expect thesolution to form a mixture of ice, NaCl·2H2O, and MgCl2·12H2O in thebulk. On the basis of the ternary phase diagram (Supporting InformationFigure S12), the MgCl2 hydrates are expected to melt at −35 °C (pointA in Figure S12). Further heating will result in melting of the NaClhydrates gradually as we go from point A to point B in Figure S12. Thiswill increase the concentration of NaCl in the brine and also decrease theconcentration of the MgCl2 in the brine phase. Between the eutectictemperature −35 °C and −21.2 °C, all the NaCl hydrate crystals areexpected to melt. The transition temperature of NaCl hydrates willdepend on the concentration of the salt solution.
Table 2. Comparison of CaCl2·6H2O Peak Assignments forRaman18 and SFG Spectroscopy
T = −61 °C T = −170 °C
SFG(PPP) (cm−1) SFG(SSPa) (cm−1) Raman (cm−1)
3281 32423347 3384
34073426 3420 34333482 3491 35133529
aThe SFG spectrum for CaCl2·6H2O in SSP polarization at −61 °C isshown in Supporting Information, Figure S2. The fitting parametersfor the SFG spectra in SSP polarization are summarized in SupportingInformation, Table S9.
Figure 5. Formation of CaCl2·6H2O at high concentration. (a) SFG spectra collected for 30 wt % CaCl2 solution in PPP polarization during heatingcycles. The empty triangles and circles correspond to temperatures at which CaCl2·6H2O hydrate and brine are in contact with the sapphire substrate,respectively. The solid lines are the fits using the Lorentzian equation and the fitting results are summarized in the Supporting Information (Table S10).The melting temperatures for the hydrate are at −49 ± 1 °C. (b) Scan of He−Ne reflected intensity vs temperature for 30 wt % CaCl2 solution next tosapphire substrate in a heating cycle.
Journal of the American Chemical Society Article
dx.doi.org/10.1021/ja5067866 | J. Am. Chem. Soc. 2014, 136, 14811−1482014816
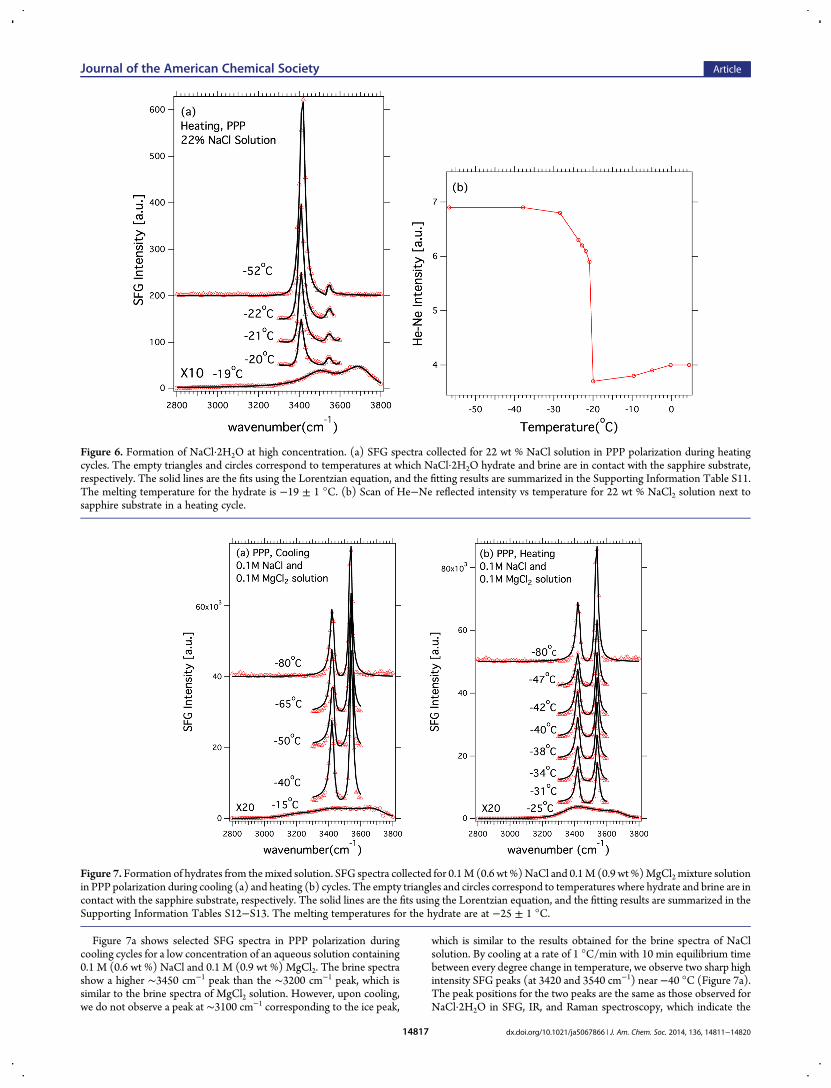
Figure 7a shows selected SFG spectra in PPP polarization duringcooling cycles for a low concentration of an aqueous solution containing0.1 M (0.6 wt %) NaCl and 0.1 M (0.9 wt %) MgCl2. The brine spectrashow a higher ∼3450 cm−1 peak than the ∼3200 cm−1 peak, which issimilar to the brine spectra of MgCl2 solution. However, upon cooling,we do not observe a peak at ∼3100 cm−1 corresponding to the ice peak,
which is similar to the results obtained for the brine spectra of NaClsolution. By cooling at a rate of 1 °C/min with 10 min equilibrium timebetween every degree change in temperature, we observe two sharp highintensity SFG peaks (at 3420 and 3540 cm−1) near −40 °C (Figure 7a).The peak positions for the two peaks are the same as those observed forNaCl·2H2O in SFG, IR, and Raman spectroscopy, which indicate the
Figure 6. Formation of NaCl·2H2O at high concentration. (a) SFG spectra collected for 22 wt % NaCl solution in PPP polarization during heatingcycles. The empty triangles and circles correspond to temperatures at which NaCl·2H2O hydrate and brine are in contact with the sapphire substrate,respectively. The solid lines are the fits using the Lorentzian equation, and the fitting results are summarized in the Supporting Information Table S11.The melting temperature for the hydrate is −19 ± 1 °C. (b) Scan of He−Ne reflected intensity vs temperature for 22 wt % NaCl2 solution next tosapphire substrate in a heating cycle.
Figure 7. Formation of hydrates from themixed solution. SFG spectra collected for 0.1M (0.6 wt %)NaCl and 0.1M (0.9 wt %)MgCl2mixture solutionin PPP polarization during cooling (a) and heating (b) cycles. The empty triangles and circles correspond to temperatures where hydrate and brine are incontact with the sapphire substrate, respectively. The solid lines are the fits using the Lorentzian equation, and the fitting results are summarized in theSupporting Information Tables S12−S13. The melting temperatures for the hydrate are at −25 ± 1 °C.
Journal of the American Chemical Society Article
dx.doi.org/10.1021/ja5067866 | J. Am. Chem. Soc. 2014, 136, 14811−1482014817
formation of NaCl·2H2O at the sapphire surface. Interestingly, theintensity ratio of the two peaks observed for the mixture is different fromthe NaCl·2H2O hydrate intensity ratio in the NaCl solution, whichsuggests differences in the orientation of the hydrate crystals,20 formedfrom the NaCl-MgCl2 solution and a single component NaCl solutionnext to the sapphire surface. When we cool the system further downto −80 °C, the spectra remain the same and we do not observe MgCl2hydrate peaks in the SFG spectra. The intensity of the NaCl hydratepeaks observed in the SFG spectra for the mixture and the NaCl solutionare comparable, which indicates that a uniform layer of the NaCl hydratehas formed next to the sapphire surface.
Figure 7b shows the SFG spectra during the heating cycle after theformation of the salt hydrates. The intensity of both peaks decreasesslightly, and the intensities of two NaCl hydrate peaks become morecomparable upon heating. We observe a gradual decrease in SFGintensity of the NaCl hydrate and then amuch sharper decrease in theAq
of theNaCl hydrate peak at−25 °C (Supporting Information Figure S11).The sharp drop in Aq at −25 °C suggests that melting of the NaClhydrates proceeds from the bulk and then finally the surface.Interestingly, the melting of the salt hydrates is at a slightly lower tem-perature than that expected from the pure NaCl phase diagram (−21 °C)due to the influence of the MgCl2 brine phase.
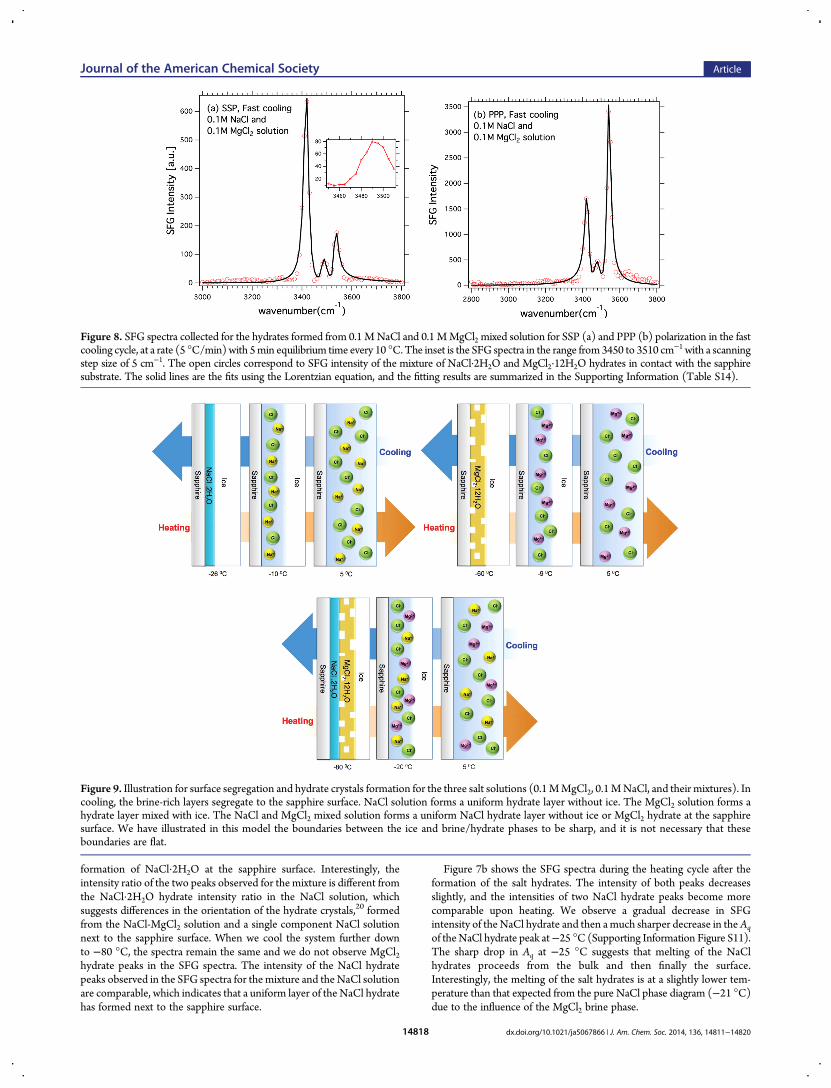
Figure 8. SFG spectra collected for the hydrates formed from 0.1 MNaCl and 0.1 MMgCl2 mixed solution for SSP (a) and PPP (b) polarization in the fastcooling cycle, at a rate (5 °C/min)with 5min equilibrium time every 10 °C.The inset is the SFG spectra in the range from3450 to 3510 cm−1 with a scanningstep size of 5 cm−1. The open circles correspond to SFG intensity of the mixture of NaCl·2H2O and MgCl2·12H2O hydrates in contact with the sapphiresubstrate. The solid lines are the fits using the Lorentzian equation, and the fitting results are summarized in the Supporting Information (Table S14).
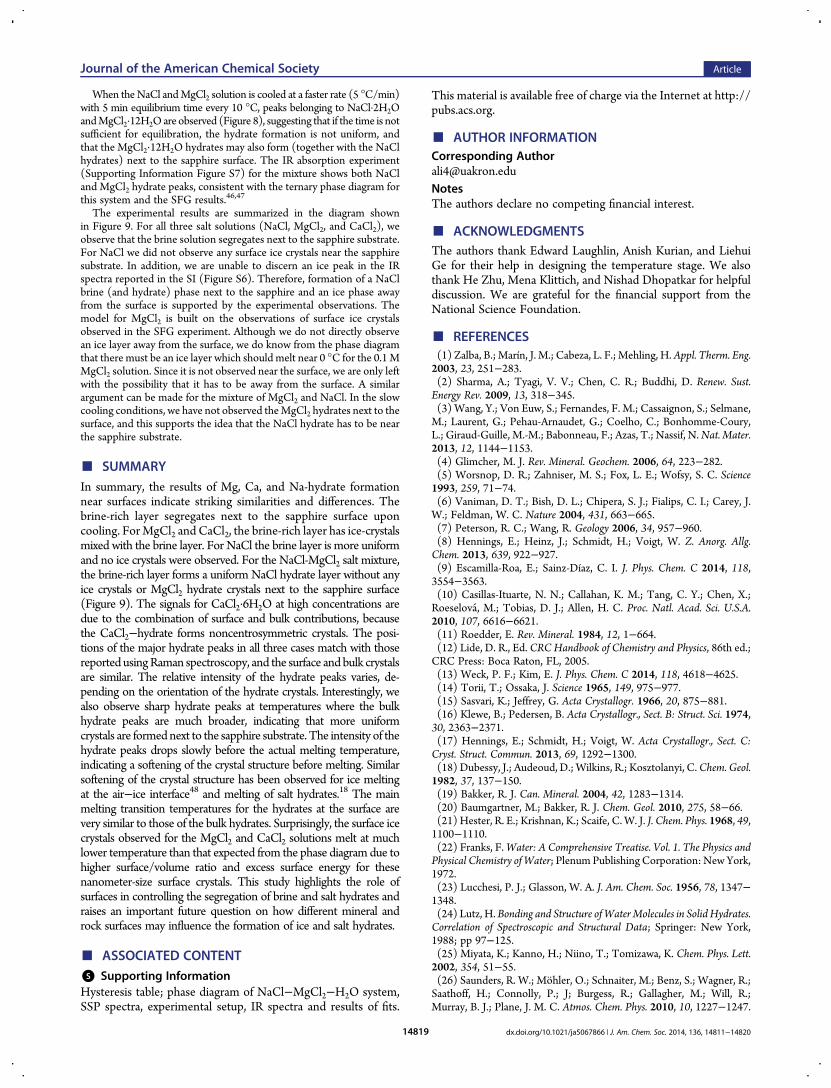
Figure 9. Illustration for surface segregation and hydrate crystals formation for the three salt solutions (0.1MMgCl2, 0.1MNaCl, and their mixtures). Incooling, the brine-rich layers segregate to the sapphire surface. NaCl solution forms a uniform hydrate layer without ice. The MgCl2 solution forms ahydrate layer mixed with ice. The NaCl and MgCl2 mixed solution forms a uniform NaCl hydrate layer without ice or MgCl2 hydrate at the sapphiresurface. We have illustrated in this model the boundaries between the ice and brine/hydrate phases to be sharp, and it is not necessary that theseboundaries are flat.
Journal of the American Chemical Society Article
dx.doi.org/10.1021/ja5067866 | J. Am. Chem. Soc. 2014, 136, 14811−1482014818
When theNaCl andMgCl2 solution is cooled at a faster rate (5 °C/min)with 5 min equilibrium time every 10 °C, peaks belonging to NaCl·2H2OandMgCl2·12H2O are observed (Figure 8), suggesting that if the time is notsufficient for equilibration, the hydrate formation is not uniform, andthat the MgCl2·12H2O hydrates may also form (together with the NaClhydrates) next to the sapphire surface. The IR absorption experiment(Supporting Information Figure S7) for the mixture shows both NaCland MgCl2 hydrate peaks, consistent with the ternary phase diagram forthis system and the SFG results.46,47
The experimental results are summarized in the diagram shownin Figure 9. For all three salt solutions (NaCl, MgCl2, and CaCl2), weobserve that the brine solution segregates next to the sapphire substrate.For NaCl we did not observe any surface ice crystals near the sapphiresubstrate. In addition, we are unable to discern an ice peak in the IRspectra reported in the SI (Figure S6). Therefore, formation of a NaClbrine (and hydrate) phase next to the sapphire and an ice phase awayfrom the surface is supported by the experimental observations. Themodel for MgCl2 is built on the observations of surface ice crystalsobserved in the SFG experiment. Although we do not directly observean ice layer away from the surface, we do know from the phase diagramthat there must be an ice layer which should melt near 0 °C for the 0.1MMgCl2 solution. Since it is not observed near the surface, we are only leftwith the possibility that it has to be away from the surface. A similarargument can be made for the mixture of MgCl2 and NaCl. In the slowcooling conditions, we have not observed theMgCl2 hydrates next to thesurface, and this supports the idea that the NaCl hydrate has to be nearthe sapphire substrate.
■ SUMMARYIn summary, the results of Mg, Ca, and Na-hydrate formationnear surfaces indicate striking similarities and differences. Thebrine-rich layer segregates next to the sapphire surface uponcooling. ForMgCl2 and CaCl2, the brine-rich layer has ice-crystalsmixed with the brine layer. For NaCl the brine layer is more uniformand no ice crystals were observed. For the NaCl-MgCl2 salt mixture,the brine-rich layer forms a uniform NaCl hydrate layer without anyice crystals or MgCl2 hydrate crystals next to the sapphire surface(Figure 9). The signals for CaCl2·6H2O at high concentrations aredue to the combination of surface and bulk contributions, becausethe CaCl2−hydrate forms noncentrosymmetric crystals. The posi-tions of the major hydrate peaks in all three cases match with thosereported usingRaman spectroscopy, and the surface andbulk crystalsare similar. The relative intensity of the hydrate peaks varies, de-pending on the orientation of the hydrate crystals. Interestingly, wealso observe sharp hydrate peaks at temperatures where the bulkhydrate peaks are much broader, indicating that more uniformcrystals are formednext to the sapphire substrate. The intensity of thehydrate peaks drops slowly before the actual melting temperature,indicating a softening of the crystal structure before melting. Similarsoftening of the crystal structure has been observed for ice meltingat the air−ice interface48 and melting of salt hydrates.18 The mainmelting transition temperatures for the hydrates at the surface arevery similar to those of the bulk hydrates. Surprisingly, the surface icecrystals observed for the MgCl2 and CaCl2 solutions melt at muchlower temperature than that expected from the phase diagram due tohigher surface/volume ratio and excess surface energy for thesenanometer-size surface crystals. This study highlights the role ofsurfaces in controlling the segregation of brine and salt hydrates andraises an important future question on how different mineral androck surfaces may influence the formation of ice and salt hydrates.
■ ASSOCIATED CONTENT
*S Supporting InformationHysteresis table; phase diagram of NaCl−MgCl2−H2O system,SSP spectra, experimental setup, IR spectra and results of fits.
This material is available free of charge via the Internet at http://pubs.acs.org.
■ AUTHOR INFORMATIONCorresponding [email protected] authors declare no competing financial interest.
■ ACKNOWLEDGMENTSThe authors thank Edward Laughlin, Anish Kurian, and LiehuiGe for their help in designing the temperature stage. We alsothank He Zhu, Mena Klittich, and Nishad Dhopatkar for helpfuldiscussion. We are grateful for the financial support from theNational Science Foundation.
■ REFERENCES(1) Zalba, B.; Marín, J. M.; Cabeza, L. F.; Mehling, H. Appl. Therm. Eng.2003, 23, 251−283.(2) Sharma, A.; Tyagi, V. V.; Chen, C. R.; Buddhi, D. Renew. Sust.Energy Rev. 2009, 13, 318−345.(3) Wang, Y.; Von Euw, S.; Fernandes, F. M.; Cassaignon, S.; Selmane,M.; Laurent, G.; Pehau-Arnaudet, G.; Coelho, C.; Bonhomme-Coury,L.; Giraud-Guille, M.-M.; Babonneau, F.; Azas, T.; Nassif, N.Nat. Mater.2013, 12, 1144−1153.(4) Glimcher, M. J. Rev. Mineral. Geochem. 2006, 64, 223−282.(5) Worsnop, D. R.; Zahniser, M. S.; Fox, L. E.; Wofsy, S. C. Science1993, 259, 71−74.(6) Vaniman, D. T.; Bish, D. L.; Chipera, S. J.; Fialips, C. I.; Carey, J.W.; Feldman, W. C. Nature 2004, 431, 663−665.(7) Peterson, R. C.; Wang, R. Geology 2006, 34, 957−960.(8) Hennings, E.; Heinz, J.; Schmidt, H.; Voigt, W. Z. Anorg. Allg.Chem. 2013, 639, 922−927.(9) Escamilla-Roa, E.; Sainz-Díaz, C. I. J. Phys. Chem. C 2014, 118,3554−3563.(10) Casillas-Ituarte, N. N.; Callahan, K. M.; Tang, C. Y.; Chen, X.;Roeselova, M.; Tobias, D. J.; Allen, H. C. Proc. Natl. Acad. Sci. U.S.A.2010, 107, 6616−6621.(11) Roedder, E. Rev. Mineral. 1984, 12, 1−664.(12) Lide, D. R., Ed. CRC Handbook of Chemistry and Physics, 86th ed.;CRC Press: Boca Raton, FL, 2005.(13) Weck, P. F.; Kim, E. J. Phys. Chem. C 2014, 118, 4618−4625.(14) Torii, T.; Ossaka, J. Science 1965, 149, 975−977.(15) Sasvari, K.; Jeffrey, G. Acta Crystallogr. 1966, 20, 875−881.(16) Klewe, B.; Pedersen, B. Acta Crystallogr., Sect. B: Struct. Sci. 1974,30, 2363−2371.(17) Hennings, E.; Schmidt, H.; Voigt, W. Acta Crystallogr., Sect. C:Cryst. Struct. Commun. 2013, 69, 1292−1300.(18) Dubessy, J.; Audeoud, D.; Wilkins, R.; Kosztolanyi, C.Chem. Geol.1982, 37, 137−150.(19) Bakker, R. J. Can. Mineral. 2004, 42, 1283−1314.(20) Baumgartner, M.; Bakker, R. J. Chem. Geol. 2010, 275, 58−66.(21) Hester, R. E.; Krishnan, K.; Scaife, C.W. J. J. Chem. Phys. 1968, 49,1100−1110.(22) Franks, F.Water: A Comprehensive Treatise. Vol. 1. The Physics andPhysical Chemistry ofWater; Plenum Publishing Corporation: New York,1972.(23) Lucchesi, P. J.; Glasson, W. A. J. Am. Chem. Soc. 1956, 78, 1347−1348.(24) Lutz, H. Bonding and Structure ofWaterMolecules in Solid Hydrates.Correlation of Spectroscopic and Structural Data; Springer: New York,1988; pp 97−125.(25) Miyata, K.; Kanno, H.; Niino, T.; Tomizawa, K. Chem. Phys. Lett.2002, 354, 51−55.(26) Saunders, R. W.; Mohler, O.; Schnaiter, M.; Benz, S.; Wagner, R.;Saathoff, H.; Connolly, P.; J; Burgess, R.; Gallagher, M.; Will, R.;Murray, B. J.; Plane, J. M. C. Atmos. Chem. Phys. 2010, 10, 1227−1247.
Journal of the American Chemical Society Article
dx.doi.org/10.1021/ja5067866 | J. Am. Chem. Soc. 2014, 136, 14811−1482014819

(27) Atkinson, J. D.; Murray, B. J.; Woodhouse, M. T.; Whale, T. F.;Baustian, K. J.; Carslaw, K. S.; O’Sullivan, D.; Malkin, T. L.Nature 2013,498, 355−358.(28) Paterson, W. The Physics of Glaciers; Butterworth-Heinemann:Oxford, UK, 1994.(29) McCord, T. B.; Hansen, G. B.; Hibbitts, C. A. Science 2001, 292,1523−1525.(30) Anim-Danso, E.; Zhang, Y.; Dhinojwala, A. J. Am. Chem. Soc.2013, 135, 8496−8499.(31) Anim-Danso, E.; Zhang, Y.; Alizadeh, A.; Dhinojwala, A. J. Am.Chem. Soc. 2013, 135, 2734−2740.(32) Lobau, J.; Wolfrum, K. J. Opt. Soc. Am., B 1997, 14, 2505−2512.(33) Gautam, K.; Schwab, A.; Dhinojwala, A.; Zhang, D.; Dougal, S.;Yeganeh, M. Phys. Rev. Lett. 2000, 85, 3854.(34) Nanjundiah, K.; Dhinojwala, A. Langmuir 2013, 29, 12168−12175.(35) Zhang, L.; Tian, C.; Waychunas, G. A.; Shen, Y. R. J. Am. Chem.Soc. 2008, 130, 7686−7694.(36) Sung, J.; Shen, Y. R.; Waychunas, G. A. J. Phys.: Condens. Matter2012, 24, 124101.(37) Boulesbaa, A.; Borguet, E. J. Phys. Chem. Lett. 2014, 5, 528−533.(38) Du, Q.; Freysz, E.; Shen, Y. R. Phys. Rev. Lett. 1994, 72, 238−241.(39) Shen, Y. R.; Ostroverkhov, V. Chem. Rev. 2006, 106, 1140−1154.(40) Allen, H. C.; Casillas-Ituarte, N. N.; Sierra-Hernandez, M. R.;Chen, X.; Tang, C. Y. Phys. Chem. Chem. Phys. 2009, 11, 5538−5549.(41) Callahan, K. M.; Casillas-Ituarte, N. N.; Xu, M.; Roeselova, M.;Allen, H. C.; Tobias, D. J. J. Phys. Chem. A 2010, 114, 8359−8368.(42) Falk, M.; Knop, O.Water in Crystalline Hydrates Aqueous Solutionsof Simple Nonelectrolytes; Springer: New York, 1973; pp 55−113.(43) Lindemann, F. A. Phys. Z. 1910, 11, 609−612.(44) Hsu, P. Y.; Dhinojwala, A. Langmuir 2012, 28, 2567−2573.(45) Baumgartner, M.; Bakker, R. J. Chem. Geol. 2009, 265, 335−344.(46) Dubois, M.; Marignac, C. Econ. Geol. 1997, 92, 114−119.(47) Bakker, R. J.; Baumgartner, M. Centr. Eur. J. Geosci. 2012, 4, 225−237.(48) Wei, X.; Miranda, P. B.; Shen, Y. Phys. Rev. Lett. 2001, 86, 1554−1557.
Journal of the American Chemical Society Article
dx.doi.org/10.1021/ja5067866 | J. Am. Chem. Soc. 2014, 136, 14811−1482014820