Embed Size (px)
Citation preview

NetworkPhysics.com 1
Ripe 46 Amsterdam, The Netherlands
September 2003Silvia Veronese
The Ecosystem of The Ecosystem of Computer NetworksComputer Networks

NetworkPhysics.com 2
Agenda
• Today’s IT challenges • Introduction to Network Flow Analysis• Nature of Network Congestion• Case Studies • Q&A

NetworkPhysics.com 3
IT Challenge: The 3 C’s• Complexity
– Sheer number of devices– Outsourced networks &
services– Management silos– Network of networks
• Change– Economic & business
change– Drives need for business
agility– Business ecosystem
• Cost– Reducing capex & opex
while meeting business goals
– Spend less, manage more
Enterprise LAN
Corporate ServersAnd VPN
Corporate Users
Sales Office(s)
MPLS VPNDSL/T1
Branch Office(s)
WANFrame Relay / T1
T3 or OC3WAN
RemoteOffice
Network(s)
T3 or OC3Multi-homed?
Web Services
Internet
CustomersPublic Internet Road Warriors
SSL VPNDSL/Dial-UpExtranet
Business PartnersIP Sec VPN
DSL/T1
IT Goals• Reduce complexity• Enable change• Manage costs

NetworkPhysics.com 4
Device-Based Management Can’t Manage 3 C’s
• Escalating capex: add/change services > add/change management
• Point tools proliferate: single purpose probes, fragmented managementCost
• Fear of network transitions: network performance anxiety
• Hard-wired device mgmt: breaks down w/ networks changes, migrations, movesChange
• Management silos: too much finger pointing across teams, too little answers
• Blind spots: can’t see or manage Internet, 3rd party networks, outsourced servicesComplexity
Traditional Device-based Management Problems

NetworkPhysics.com 5
Flow-Based Management, Business Relevance
• Complexity: Monitor end-to-end regardless of underlying complexity• Change: Dynamically adapt to network changes• Cost: Consolidate management to reduce cost
Manage actual network traffic flows, instead of devices
Deliver object-relevant management of the most dynamic & complex networks
Network Flow

NetworkPhysics.com 6
What are Network Flows?Network Traffic Flows 101
• Flows = TCP, UDP connections– End-to-end, Layer 4– Source, destination– Application or service port
• Flows capture: – All traffic, all the time
• Non-invasive: no agents, no SNMP, no polling, no synthetic transactions
• Inspect TCP, UDP flows in real-time to monitor performance, response time, utilization
Network Traffic Flows 101
• Flows = TCP, UDP connections– End-to-end, Layer 4– Source, destination– Application or service port
• Flows capture: – All traffic, all the time
• Non-invasive: no agents, no SNMP, no polling, no synthetic transactions
• Inspect TCP, UDP flows in real-time to monitor performance, response time, utilization
Locate problems in the network using only what you can observe at !
You are here

NetworkPhysics.com 7
What is Flow-Based Management?
NetworkPhysics.com 8
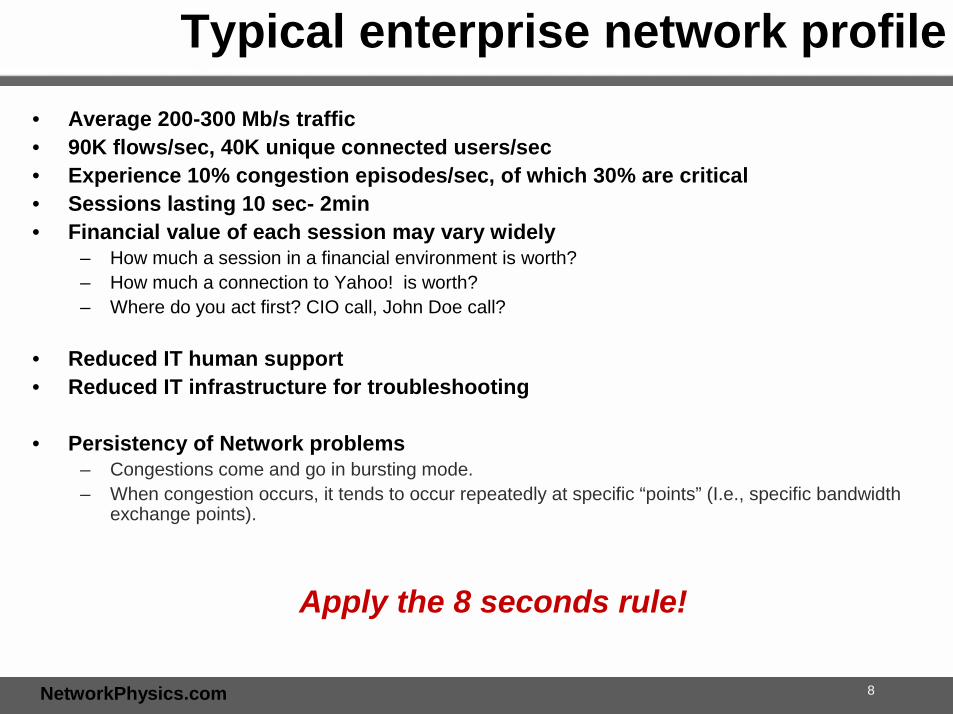
Typical enterprise network profile • Average 200-300 Mb/s traffic• 90K flows/sec, 40K unique connected users/sec• Experience 10% congestion episodes/sec, of which 30% are critical• Sessions lasting 10 sec- 2min• Financial value of each session may vary widely
– How much a session in a financial environment is worth? – How much a connection to Yahoo! is worth?– Where do you act first? CIO call, John Doe call?
• Reduced IT human support• Reduced IT infrastructure for troubleshooting
• Persistency of Network problems– Congestions come and go in bursting mode.– When congestion occurs, it tends to occur repeatedly at specific “points” (I.e., specific bandwidth
exchange points).
Apply the 8 seconds rule!

NetworkPhysics.com 9
Today’s challenges of intelligent data management
• Real Time Data Acquisition– Data is heterogeneous by nature. Patterns are fractal in nature and
happen at all dimensions(packets, connections, flows)
• Loss-less data compression. – How can the system retain the information while reducing the size?– Effective pre-processing is the key to statistical accuracy and
resolution.
• Optimized clustering – Average customer network will generate 90K convers/sec. In
addition route, configuration, lookup information have to be correlated to the conversations in real-time
• Pattern identification– How do you close the gap between data generation and data
comprehension?– What is the most appropriate data model ?
Accuracy relies on statistics: more traffic is better

NetworkPhysics.com 10
What can we see?
IP packetheaders
source IP addressdestination IP addressTTL (time-to-live)TOS (type-of-service):
TCP, UDP, ICMP, etc.…
TCP segmentheaders
Source, port numberDestination, port numberFlags:
SYNFINACKRST
…
Data e.g., HTTP stuff(we note the total size, in bytes)
What can’t we see?
Where packets have been
Where packets were delayed
Where packets got dropped
WHERE,WHERE,WHERE?

NetworkPhysics.com 11
Extensive Suite of Metrics
• Throughput Metrics• Inbound TCP Throughput (Mbps)• Inbound TCP Traffic (MB)• Inbound Packet Throughput (pps)• Inbound Packet Traffic (packets)• Inbound Throughput (Mbps)• Inbound Traffic (MB)• Outbound TCP Throughput (Mbps)• Outbound TCP Traffic (MB)• Outbound Packet Throughput (pps)• Outbound Packet Traffic (MB)• Outbound Throughput (Mbps)• Outbound Traffic (MB)• Connection Rate (#/s)• Connection Payload (KB)
• Congestion Metrics• Outbound Retrans (MB)• Outbound Packet Retrans (packets)• Outbound Retrans Rate (Mbps)• Outbound Packet Retrans Rate (pps)• Outbound Packet Loss (%)• Total Congestion Time (min)• Lossless Network Transfer Time
• AS Metrics• Trans-ISP RTT (ms)• ISP Peering Point RTT (ms)• Associated AS• Associate AS Description• Associated AS Information
• Response Metrics• Time to First Byte (ms)• Network Transfer Time (ms)• Server Response Time (ms)• Connection Duration (sec)• Round Trip Time (ms)
• Client Metrics• Time to Live (Hops)• Client Reset Rate (#/s)• Timeout Rate (#/s)• Client Request Rate (#/s)• Information (Hostname)
For each IP address, subnet, business group, Autonomous System, Server, Client, etc.

NetworkPhysics.com 12
Architecture
• Passive monitoring
• Does not require any network modification
• Does not rely on MIBs or other parameter polling mechanism
• Only one device is needed - does not require agents
• Collects data all the time - real-time and historical
• Database is included for long term analysis – Data is
persistently stored.
• Includes a BGP Speaker, AS lookup, TCP/ICMP traceroutes
• Web server + Java app for data browsing

NetworkPhysics.com 13
Business-Relevant Visibility
• Feature: Business groups– Business level visibility
through data aggregation
• Business critical apps– SAP, Exchange
• Important business units– London, Burbank– Building 170, 154
• Business networks– Internet, Internal
• Specific server farms– Mainframe, SF L/R/C
Virtualized: to maintain business service visibility regardless of network complexity

NetworkPhysics.com 14
Baselining Application Usage
• Streaming services – Real– Windows Media Player
• Gaming apps– Operation Flashpoint– Quake III– Medal of Honor
• Standard Services – http– email– ftp
• Peer-to-peer (P2P) apps– Fasttrack-based apps
(KazaA, Grokster, Morpheus)– Gnutella
• Internal Application Usage
• Ports required for Firewall• Determine which applications may need to be prioritized through the VPN• Size of Internet Connection

NetworkPhysics.com 15
Baselining All Users
• Security– Detailed list of the subnets that
need to allowed through the firewall.
• Internet Connection– Understand who is using the
network and how much– May want to migrate remote
offices with less traffic first!• Network Responsiveness
– Understand response times for remote offices as a baseline to measure VPN performance

NetworkPhysics.com 16
• Feature: Response time composition analysis
• Troubleshoot SAP performance problems
– Isolate largest contributor to SAP response time delays
• Monitor SAP usage trends month-to-month
• Identify major SAP application response time delays
Application Response Time AnalysisUnifying: across management silos, across disparate management systems

NetworkPhysics.com 17
AS Information: Insight Into The Cloud
• For each 1st, 2nd, and Last AS, we provide a unique set of statistics– Utilization– End-to-End performance – Transit and peering latency
• Only available by correlating Flows, BGP, and TracerouteInformationEnterprise LAN
Corporate ServersAnd VPN
Corporate Users
T3 or OC3Multi-homed
Web Services
ISP A1st AS
ISP B1st AS
ISP C2nd AS
ISP D2nd AS
ISP E2nd AS
ISP F2nd AS
Sales Office(s)MPLS VPN
DSL/T1
ExtranetBusiness Partners
IP Sec VPN
CustomersPublic Internet
ISP HLast AS ISP I
Last ASISP G
Last AS

NetworkPhysics.com 18
Measuring Service Provider Performance
• Measure effectiveness of remote office and directly connected ISP’s
• Thresholding can be used to alert users to any SLA violations.
• Validate efficiencies of ISP peers
• Grade performance of multiple ISP’s

NetworkPhysics.com 19
Troubleshooting Inside the Cloud
• Graphical network route analysis pinpoints hidden bottlenecks
• Identifies destinations with critical performance issues
• Measures hop-by-hop delay metrics to localize network latency problems
Virginia
London
London
London
Virginia
External
Local
Local
Local
Local

NetworkPhysics.com 20
MS Blaster WormDetect the infection Where did it start?
Who is affected?

NetworkPhysics.com 21
Conclusions• This is an interesting, but challenging problem (hardware and software)• Capturing meaningful data is hard• Make sense of them is even harder!
CREDITS• SLAC (Stanford Linear Accelerator Center)• Yahoo!• Cisco• Stanford and U. of Utah, DOE, DOD, National Labs. • Staff of Network Physics
• We are looking for data/test sites and collaborators