Embed Size (px)
Citation preview

The Economy of Gloucestershire
1. Global economic setting1
In 2015, global economic activity remained subdued. Growth in emerging market
and developing economies, while still accounting for over 70 percent of global
growth, declined for the fifth consecutive year, while a modest recovery
continued in advanced economies. Three key transitions continue to influence
the global outlook:
- the gradual slowdown and rebalancing of economic activity in China
away from investment and manufacturing toward consumption and
services,
- lower prices for energy and other commodities, and
- a gradual tightening in monetary policy in the United States in the context
of a resilient U.S. recovery as several other major advanced economy
central banks continue to ease monetary policy.
Global growth is therefore projected at 3.4 percent in 2016 and 3.6 percent in
2017.
2. Gloucestershire Economy
Gloucestershire has a prosperous and resilient economy set within a highly
attractive natural environment, which offers a high standard of living for local
residents. The County is predominantly rural with two urban centres that serve as
the main business and commercial heartland. The urban settlements are
complemented by vibrant market towns that act as valuable employment hubs
and key providers of services. The development of the County has been strongly
influenced by connectivity to the Midlands and South West via the M5 corridor
and to London and the South East via the M4 corridor.
The total output of the Gloucestershire economy was approximately £14.82 billion
in 2014, representing 12% of the value of output in the South West and 1% of the
UK economy. According to latest figures, GVA per head in Gloucestershire was
£24,342, slightly below the UK (£24,958) but above the South West average
(£22,324).
1 World Economic Outlook Update Jan 2016EO
http://www.imf.org/external/pubs/ft/weo/2016/update/01/
2 Regional Gross Value Added (Income Approach), 1997 to 2014
http://www.ons.gov.uk/ons/datasets-and-tables/index.html?content-type=Dataset&edition=tcm%3A77-
388336

The health of the Gloucestershire labour market which deteriorated after the
recession in line with national trends has recovered gradually to a position of
strength reflected in the period Oct 2014 to Sep 2015 by an employment rate3 of
79%, well above the national average of 73%. The corresponding unemployment
rates have consequently reduced. Although worklessness may be less of a
challenge than in other parts of the country there are however, still issues at
County level that relate to youth unemployment and long term unemployment.
There are around 27,5004 businesses in the County supporting a well-qualified
and highly skilled employed workforce of 293,9005 people6. The occupational
structure in the County reflects this high level of qualification and skill base with a
higher than average proportion of professional occupations than at the regional
and national level. Attrition rates are notably low with 83% of residents in
Gloucestershire also working in the County.
There is a positive entrepreneurial culture in Gloucestershire, and businesses
starting up have very high survival rates. The County also ranks highly in terms
of the proportion of employment in ‘export intensive’ sectors including both
manufacturing and tradeable services.
Both manufacturing and health are significant sectors in the County. Other major
sectors include public administration and defence (e.g GCHQ), education,
construction and retail.
Employment growth is predicted in the health, business administration and
support services, construction, accommodation and food services and the
Mining, quarrying and utilities sector.
The characteristics of the job vacancies advertised reflect the demand across a
range sectors indicating a healthy balance across industrial activities in the
County.
The Strategic Economic Plan sets out ambitious plans to accelerate economic
growth by focusing on key drivers of productivity and supporting growth in high
value sectors7. They include the nuclear-based power generation industry, high
tech manufacturing particularly relating to Aerospace and precision engineering
and medical instruments and Knowledge intensive services including the finance
and insurance sectors; the ICT sector (particularly digital media) and businesses
in professional, scientific and technical activities.
While these sectors provide a focus, Gloucestershire will also offer a supportive
environment for all businesses to move up the value chain regardless of which
sector they are in. For example, there are opportunities for productivity growth in
3 Annual Population Survey, Oct 2014-Sep 2015 ONS Crown Copyright Reserved.
4 UK Business Counts – Enterprises 2015, ONS Crown Copyright Reserved
5 Annual Population Survey, Oct 2014-Sep 2015 ONS Crown Copyright Reserved..
6 Includes employees and self employed
7 Strategic Economic Plan, GFirst

agriculture through agri-tech which has been identified by government as one of
‘eight great technologies’ needed to address the increasing demand for more
efficient food production and land management.
The relatively high proportion of residents who work at or from home may also be
an indication of how advancement in modern technology has enabled a wide
range of businesses to function efficiently in rural areas and to the positive
relationship that exists between businesses and how they interact with the
sensitivities of the high quality landscape and environment of the area.
Maintaining economic growth in light of global and local issues such as the
ageing workforce, retention of young qualified people, skill shortages in certain
sectors and matching of skill supply and demand within a highly influential global
activity will present many challenges to future economy of Gloucestershire.
2.1 Employment
The number of employees8 in Gloucestershire has increased by 12,300 or 5%
over the last five years to a total of 276,6009 by 2014.
The annual growth rates relating to the number of employees between 2009 and
2014 in the County are depicted in Table 1. Apart from a blip between 2010 and
2011 annual growth rates have been positive resulting in an annual average
growth rate of 0.9% over the period which was higher than the regional and
slightly below the national average.
Table 1: Annual growth rates of number of employees in Gloucestershire, the
South West and Great Britain from 2009 to 201410
Regarding employment status, the ratio of full-time to part-time employees in
2014 was 67% to 33% respectively as shown in Table 2.
8 This figure is based on the number of employees and does not include self employed. 9 Business Register and Employment Survey,2010-2014,ONS Crown Copyright Reserved.
10 Ibid.
Gloucestershire South West Great Britain
2009-2010 1.7 -1.3 -0.2
2010-2011 -2.4 -2.0 0.0
2011-2012 1.1 -0.3 0.6
2012-2013 0.9 1.5 1.3
2013-2014 3.3 3.9 3.2
Average annual growth rate 2009-2014 0.9 0.4 1.0
Annual growth rate %Year

Table 2: Gloucestershire: Employment status 201411
* These figures exclude farm agriculture (SIC subclass 01000).
A further 50,20012 people were self-employed in the County between 2014 and
2015.
2.2 Employment by industrial sector
2.2.1 Past: 2010-2014
Figure 1 presents the industrial sectors in terms of their size, growth and local
concentration13.
The Health sector is the largest in terms of employees accounting for some 14%
or 39,000 of the total number of employees. Hospital activities account for the
largest number of employees spread across the numerous hospitals in the
County as well as residential care. This locally concentrated sector has
experienced an annual average growth rate of 3% which is represented by
almost a 20% growth in the number of employees.
The Manufacturing sector is the second largest sector with 35,000 employees
equating to 13% of the total number of employees which is well above the
regional and national figures indicating that the sector is the most locally
concentrated of all the sectors. The computer, electronic and optical products,
fabricated metal products, manufacture of machinery and equipment, aerospace,
rubber and plastics and food products sub sectors account for the highest
number of employees. Despite the sector experiencing a decline since the
previous year most of the above sub sectors did exhibit growth.
Retail, the third largest sector in terms of employees as shown in Figure 2
despite experiencing decline over the last five years is important not only in
terms of a tourist attraction but as an important retail centre for the surrounding
areas.
11 Ibid. 12
Annual Population Survey July 2014-July 2015, ONS Crown Copyright Reserved 13 Location quotients (LQ) are used for identifying an industry that is concentrated in a region. A
simple ratio has been used to compare the share of local employment in an industry to the share of
GB employment in that industry. A LQ of <1 indicates the local area is less concentrated than GB for
an industrial activity, and a value >1 indicates the local area has a higher concentration of
employment in the industrial activity relative to GB.
Number % Number %
2010 173,200 64.4 95,700 35.6 268,900
2011 164,400 62.6 98,100 37.4 262,500
2012 167,900 63.2 97,600 36.8 265,500
2013 176,100 65.8 91,700 34.2 267,800
2014 184,400 66.7 92,200 33.3 276,600
Year
Gloucestershire
P/TTotal*
F/T

The Education sector is also large as shown in Figure 2 and well represented
from primary through to higher education levels. The County boasts a number of
well established and respected schools, colleges and two universities, however,
not unexpectedly this sector has suffered decline in employee numbers mainly in
the primary and secondary sub sectors.
The number of employees in the Business administration and support services
sector has grown over the last five years and is dominated by the recruitment
agency activities, general cleaning of building activities, general business support
and private security activities.
The Professional, scientific & technical sector is significant in terms of employees
as shown in Figure 2, locally concentrated and shown growth as a result of
activities relating particularly to management and technical consultancies,
architectural activities and head offices located within the County.
The Accommodation & food services sector which is related to the tourism
industry is not unsurprisingly important to Gloucestershire. The growth in the
number of employees in the hotels, restaurants and pubs has been slightly
outpaced by take away food shops and event catering activities.
The Construction sector has undergone growth in terms of number of employees
over the last five years which is likely to be the result of the post-recession
recovery in both the commercial and domestic building industry and associated
activities
The Finance & insurance sector although a comparatively small sector in
Gloucestershire has a degree of local concentration. It has however, undergone
decline that not unsurprisingly relates to the banking, building society and non-
life insurance sub sectors.
The Information & communication sector despite a negative annual average
growth over the last five years has shown some growth in since 2013 particularly
relating to the business and domestic software development and computer
consultancy and other related activities which also account for most of the
employees in this sector.
The Mining, quarrying and utilities sector is important to Gloucestershire a
potentially large employer relating to nuclear power generation. Two technical
offices associated with Horizon and EDF have been established in the County
and as the likelihood of nuclear power station new build draws near the number
of associated employees is likely to increase.
The Public administration and defence sector is also important in the County.
Decline in the number of employees is however, inevitable in light of the central
government cuts.

Although the Agriculture, forestry & fishing sector14 appears small and has shown
a decline in terms of employment it is an important sector in Gloucestershire.
According to the June 2013 statistics from Defra15 the sector accounted for a
total labour force of about 6,200 people in the County which was a 1% increase
on the 2010 figure.
With the effects of the recession and having to cope with vagaries of the industry,
farmers needed to improve the profitability of their farms and face the prospect of
providing a non-farming income which they have successfully managed through
various forms of diversification and specialisation with enterprises such as the re-
introduction of rare breeds, organic farming, biomass production, farm open days
and other tourism related activities in order to maintain their livelihood.
The Arts, entertainment & recreation sector important to the County but is not
well represented in terms of the number of employees as much of this sector is
made up of self employed workers etc. that are not recorded by the Business
Register and Employment Survey.
14 The Business Register and Employment Survey cannot easily measure agricultural employment and
therefore data regarding this sector is incomplete.
15 Structure of the agricultural industry in England and UK at June 2013, Defra
https://www.gov.uk/government/statistical-data-sets/structure-of-the-agricultural-industry-in-england-
and-the-uk-at-june

Figure 1: A comparison of industrial sectors in terms of growth, size and
specialisation in Gloucestershire1617
Figure 2: The proportion of employees by broad industrial sector 2014:
Gloucestershire1819
16 Business Register and Employment Survey 2010-2014, ONS Crown Copyright Reserved. 17 The Agriculture, forestry & fishing industrial sector is not wholly represented by the BRES data.
Agriculture, forestry & fishing
Manufacturing
Construction
Transport & storage (inc postal) Information & communication
Property
Professional, scientific & technical
Business administration & support services
Public administration & defence Education
Health
Motor trades Mining, quarrying & utilities
Arts, entertainment & recreation
Retail
Financial & insurance
Other services
Accommodation & food services
Wholesale
0.0
0.5
1.0
1.5
2.0
2.5
-15% -10% -5% 0% 5% 10% 15% 20%
Index o
f specia
lisatio
n (
Locatio
n Q
uotie
nt)
Average Annual Growth Rate (2010-2014)
Broad industrial sectors in terms of Growth, Size and Specialisation: Gloucestershire
14
13
98
87
7
5 54
3 3 32 2 2 2 2
00
2
4
6
8
10
12
14
16
% o
f to
tal e
mp
loye
es
Proportion of employees by broad industrial sector 2014: Gloucestershire
Gloucestershire South West Great Britain
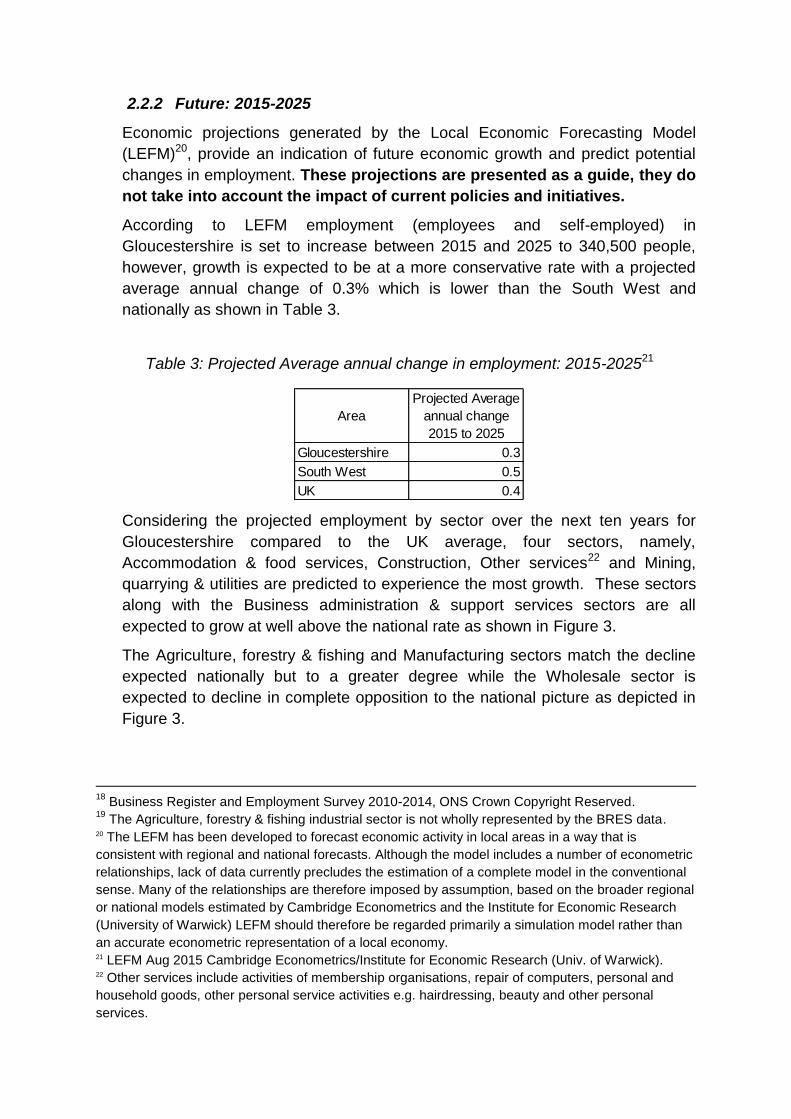
2.2.2 Future: 2015-2025
Economic projections generated by the Local Economic Forecasting Model
(LEFM)20, provide an indication of future economic growth and predict potential
changes in employment. These projections are presented as a guide, they do
not take into account the impact of current policies and initiatives.
According to LEFM employment (employees and self-employed) in
Gloucestershire is set to increase between 2015 and 2025 to 340,500 people,
however, growth is expected to be at a more conservative rate with a projected
average annual change of 0.3% which is lower than the South West and
nationally as shown in Table 3.
Table 3: Projected Average annual change in employment: 2015-202521
Considering the projected employment by sector over the next ten years for
Gloucestershire compared to the UK average, four sectors, namely,
Accommodation & food services, Construction, Other services22 and Mining,
quarrying & utilities are predicted to experience the most growth. These sectors
along with the Business administration & support services sectors are all
expected to grow at well above the national rate as shown in Figure 3.
The Agriculture, forestry & fishing and Manufacturing sectors match the decline
expected nationally but to a greater degree while the Wholesale sector is
expected to decline in complete opposition to the national picture as depicted in
Figure 3.
18
Business Register and Employment Survey 2010-2014, ONS Crown Copyright Reserved. 19
The Agriculture, forestry & fishing industrial sector is not wholly represented by the BRES data. 20 The LEFM has been developed to forecast economic activity in local areas in a way that is
consistent with regional and national forecasts. Although the model includes a number of econometric
relationships, lack of data currently precludes the estimation of a complete model in the conventional
sense. Many of the relationships are therefore imposed by assumption, based on the broader regional
or national models estimated by Cambridge Econometrics and the Institute for Economic Research
(University of Warwick) LEFM should therefore be regarded primarily a simulation model rather than
an accurate econometric representation of a local economy. 21 LEFM Aug 2015 Cambridge Econometrics/Institute for Economic Research (Univ. of Warwick). 22 Other services include activities of membership organisations, repair of computers, personal and
household goods, other personal service activities e.g. hairdressing, beauty and other personal
services.
Gloucestershire 0.3
South West 0.5
UK 0.4
Area
Projected Average
annual change
2015 to 2025

Figure 3: Projected change in employment in Gloucestershire and the United
Kingdom from 2015 to 201523
2.3 Businesses
The number of businesses in Gloucestershire increased by 8% in the last five
years as shown in Table 4 amounting to 27,540 businesses in 201524. This
growth however, is below the regional average and less than the national
average by some 6%.
Table 4: Growth in the number of businesses from 2010 to 201525
Much in accordance with the national structure the majority of businesses (76%)
are small, employing up to four people. There are however, a number of larger
businesses employing between 50 and 99 people as shown in Table 5.
23 LEFM Aug 2015, Cambridge Econometrics/Institute for Employment Research (Univ. of Warwick). 24
UK Business Counts – Enterprises 2015, ONS Crown Copyright Reserved. 25 Ibid.
-18
-13
-9
-7
-5
-2
1
13
3
4
5
8
8
8
11
14
15
19
-20 -15 -10 -5 0 5 10 15 20
Agriculture, forestry & fishing
Wholesale
Manufacturing
Property
Education
Public administration & defence
Transport & storage (inc postal)
Motor trades
Arts, entertainment & recreation
Retail
Professional, scientific & technical
Financial & insurance
Information & communication
Health
Business administration & support services
Mining, quarrying & utilities
Other services
Construction
Accommodation & food services
% change in employment 2015-2025
Projected change in employment by broad industrial sector 2015-2025Gloucestershire and United Kingdom
UK Gloucestershire
Area %
Gloucestershire 8.1
South West 9.3
Great Britain 13.5
Growth in number of
businesses 2010-2015
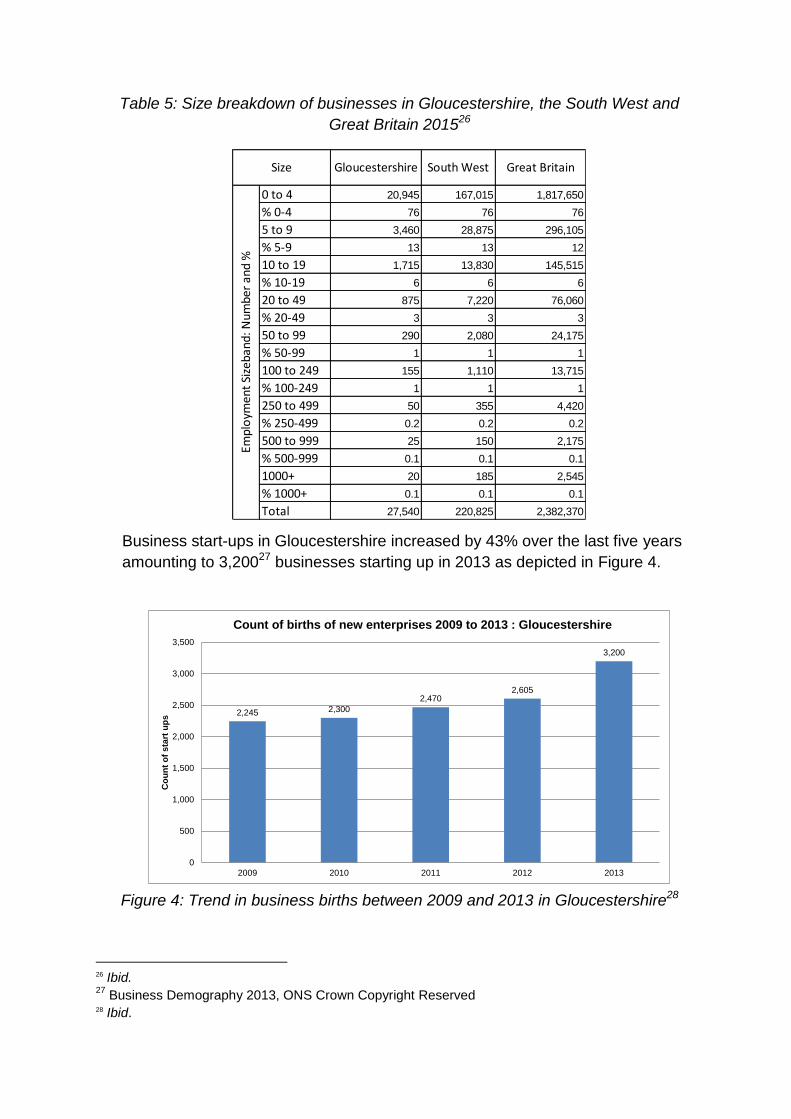
Table 5: Size breakdown of businesses in Gloucestershire, the South West and
Great Britain 201526
Business start-ups in Gloucestershire increased by 43% over the last five years
amounting to 3,20027 businesses starting up in 2013 as depicted in Figure 4.
Figure 4: Trend in business births between 2009 and 2013 in Gloucestershire28
26 Ibid. 27
Business Demography 2013, ONS Crown Copyright Reserved 28 Ibid.
0 to 4 20,945 167,015 1,817,650
% 0-4 76 76 76
5 to 9 3,460 28,875 296,105
% 5-9 13 13 12
10 to 19 1,715 13,830 145,515
% 10-19 6 6 6
20 to 49 875 7,220 76,060
% 20-49 3 3 3
50 to 99 290 2,080 24,175
% 50-99 1 1 1
100 to 249 155 1,110 13,715
% 100-249 1 1 1
250 to 499 50 355 4,420
% 250-499 0.2 0.2 0.2
500 to 999 25 150 2,175
% 500-999 0.1 0.1 0.1
1000+ 20 185 2,545
% 1000+ 0.1 0.1 0.1
Total 27,540 220,825 2,382,370
Gloucestershire South West Great Britain
Empl
oym
ent
Size
ban
d: N
umbe
r an
d %
Size
2,245 2,300
2,4702,605
3,200
0
500
1,000
1,500
2,000
2,500
3,000
3,500
2009 2010 2011 2012 2013
Co
un
t o
f sta
rt u
ps
Count of births of new enterprises 2009 to 2013 : Gloucestershire

One year and three year survival rates were higher than the national average as
shown in Table 6.
Table 6: Business survival rates from birth in 201029
2.4 Unemployment
The Claimant Count30 is a measure of the number of people who are
unemployed and claiming benefits. From 1996 until the recent introduction of
Universal Credit, this was based on the number of people claiming Jobseeker’s
Allowance. However, since its introduction some unemployment benefit
claimants will be claiming Universal Credit instead. To reflect this change, the
Claimant Count has been expanded to include people claiming Jobseeker's
Allowance (JSA) plus those who claim Universal Credit and who are out of work.
The decreasing trend seen in the last thirty years in the number of people
claiming JSA in Gloucestershire has been continued under the Claimant Count
measure.
It is evident from Figure 5 that the unemployment claimant rate for
Gloucestershire has closely followed the regional rate and although both mirror
the national trend they are some 1% below it. The County rate has generally
declined since April 2013 to 1.1% representing 4,280 people in March 201631.
29 Ibid. 30
For more information please refer to ONS website. 31
Job Seekers Allowance, ONS Crown Copyright Reserved.
1 Year % 2 Year % 3 Year %
Gloucestershire 88.7 74.6 60.4
South West 88.1 74.2 59.9
Great Britain 86.7 72.5 57.1
AreaSurvival rates from birth in 2010

Figure 5: Unemployment claimant rate Jan 2014 to Dec 2015: Gloucestershire,
South West and United Kingdom32
Table 7: Ward claimant rate above County average33
32 Ibid. 33 Ibid.
0.0
0.5
1.0
1.5
2.0
2.5
3.0
3.5
4.0%
of
wo
rkin
g a
ge
po
pu
lati
on
Claimant rate: Apr 2013- Mar 2016: Gloucestershire, South West and United Kingdom
United Kingdom South West Gloucestershire
District Ward Rate
Lansdown 1.2
Swindon Village 1.2
St Paul's 1.3
St Peter's 1.3
Springbank 1.4
St Mark's 2.0
Hesters Way 2.1
Oakley 2.1
Cotswold Watermoor 2.1
Awre 1.2
Littledean and Ruspidge 1.2
Bream 1.3
Alvington, Aylburton and West Lydney 1.4
Lydbrook and Ruardean 1.4
Newland and St Briavels 1.4
Coleford East 1.5
Newent Central 1.6
Coleford Central 2.0
Cinderford West 2.3
Cinderford East 2.5
Lydney East 2.5
Barnwood 1.3
Tuffley 1.8
Kingsholm and Wotton 2.2
Moreland 2.3
Matson and Robinswood 2.8
Podsmead 3.4
Barton and Tredworth 3.5
Westgate 3.8
Cainscross 1.2
Valley 1.4
Central 1.7
Slade 1.9
Tewkesbury Town with Mitton 1.3
Northway 1.6
Tewkesbury Prior's Park 2.8
Cheltenham
Forest of Dean
Gloucester
Stroud
Tewkesbury

There were thirty six wards (of 146) with claimant rates above the County
average as shown inTable 7. They range from All Saints, Lansdown, Swindon
Village, Awre, Cainscross and Littledean and Ruspidge with 1.2% to Westgate
with 3.8%.
The situation relating to those 18-24 year olds claiming unemployment benefits in
Gloucestershire is generally one of improvement from 2013 to 2016 with the
number of claimants falling from 2,575 to 935 people. However, Figure 6 shows
there has been an increase in young claimants since November 2015.
Figure 6: 18-24 year old claimant count34
The number of 16 to 18 year olds Not in Education, Employment or Training
(NEETs) in Gloucestershire as depicted in Figure 7 has decreased over the last
five years to 427 people in May 2016.
34 Ibid.
0
500
1,000
1,500
2,000
2,500
3,000
Nu
mb
er
of
cla
ima
nts
18-24 year old claimant count April 2013-March 2016

Figure 7: Number of 16-18 year olds Not in Education, Employment or Training
(NEETs) in Gloucestershire: 2011 to 201635
2.5 Qualifications and occupation
It is evident from Table 8 that in Gloucestershire some 30% of the resident
population aged 16 and over had Level 4 qualifications and above in 2011 which
was well above the national average of 27%. At the other end of the scale those
with No qualification accounted for 20% of the resident population over 16 which
was some 3% below the national average and amounted to 96,000 people.
35 Prospects.
0
200
400
600
800
1000
1200
May 2011 May 2012 May 2013 May 2014 May 2015 May 2016
Nu
mb
er
of
NE
ET
s
Number of 16-18 yr olds Not in Education, Employment or Training (NEETs): Gloucestershire: 2011 to 2016

Table 8: Level of qualification of residents aged 16 and over comparison 201136
Professional occupations feature highly in Gloucestershire and in addition to the
Skilled trades occupations equated to a third of the resident employed population
in 2011 as shown in Figure 8.
The Managers, directors and senior officials account for a higher proportion of
the resident based employment in the County compared to the regional and
national averages.
The occupational structure of Gloucestershire not only reflects the high skill
needs of its industrial base but also the importance of skilled trades to the
balance of the economy.
36
Census of Population 2011: LC5102EW - Highest level of qualification by age, ONS Crown
Copyright Reserved:
Level 1: 1-4 O Levels/CSE/GCSEs (any grades), Entry Level, Foundation Diploma, NVQ Level 1,
Foundation GNVQ,Basic/Essential Skills;
Level 2: 5+ O Level (Passes)/CSEs (Grade 1)/GCSEs (Grades A*-C), School Certificate, 1 A Level/ 2-
3 AS Levels/VCEs, Intermediate/Higher Diploma, Welsh Baccalaureate Intermediate Diploma, NVQ
level 2, Intermediate GNVQ, City and Guilds Craft, BTEC First/General Diploma, RSA Diploma;
Level 3: 2+ A Levels/VCEs, 4+ AS Levels, Higher School Certificate, Progression/Advanced Diploma,
Welsh Baccalaureate Advanced Diploma, NVQ Level 3; Advanced GNVQ, City and Guilds Advanced
Craft, ONC, OND, BTEC National, RSA Advanced Diploma;
Level 4 and above: Degree (for example BA, BSc), Higher Degree (for example MA, PhD, PGCE),
NVQ Level 4-5, HNC, HND, RSA Higher Diploma, BTEC Higher level, Foundation degree (NI),
Professional qualifications (for example teaching, nursing, accountancy);
Other qualifications: Vocational/Work-related Qualifications, Foreign Qualifications (not stated/level
unknown).
Gloucestershire England and Wales
No qualifications 19.6 22.7
Level 1 qualifications 13.5 13.3
Level 2 qualifications 16.0 15.3
Apprenticeship 4.0 3.6
Level 3 qualifications 12.6 12.3
Level 4 qualifications and above 29.9 27.2
Other qualifications 4.3 5.7
Total 490,233 45,496,780
Level of qualification of residents aged 16 and over: % of total

Figure 8: Occupation as a proportion of total employment 2011: Gloucestershire,
South West and England and Wales37
In terms of the projected growth of occupational employment over the next ten
years, as outlined in Figure 9, the expected increase in Managers, directors and
senior officials follows the national projection although at a higher rate for
Gloucestershire which points not only to the continuing growth in businesses but
also the already high proportion of these occupations in the County. The
projected increase in employment in the Caring, leisure and other services
occupations is undoubtedly an indication of the growing demands of an ageing
population.
It is evident from Figure 9 that the Professional and Associate professional
occupations are projected to grow at a much lower rate than the UK while
Skilled trades and Process, plant and machine operatives are expected to
increase in opposition to the national picture.
The Administrative and secretarial occupations however, are expected to decline
in line with the UK trend.
37 Census of Population 2011: LC6112EW - Occupation by age, ONS Crown Copyright Reserved.
17
13 12 1212
109
87
0
5
10
15
20
Professionaloccupations
Skilled tradesoccupations
Administrativeand secretarial
occupations
Associateprofessionaland technicaloccupations
Managers,directors and
senior officials
Elementaryoccupations
Caring, leisureand otherservice
occupations
Sales andcustomerservice
occupations
Process, plantand machine
operatives
Occupation as a proportion of total resident employment 2011: Gloucestershire, South West and England and Wales
Gloucestershire South West England and Wales

Figure 9: Projected change in occupational employment 2015-2025:
Gloucestershire & UK38
2.6 Vacancies
The data used in Figure 10 are provided by Labour Insight, an interactive tool
which delivers real time access to job vacancies from a comprehensive range of
sources including job boards, employer sites, newspapers, public agencies etc.
Data extraction and analysis technologies mine and code data from each job
listing to provide analysis on industries, occupations, skills and qualifications.
The tool will inevitably not capture all vacancies.
Figure 10 shows the trend in new vacancies for each month from January to
October 2015. The number of new vacancies presents an overall increasing
trend from 3,485 vacancies in January to 5,502 in October.
38 LEFM Aug 2015, Cambridge Econometrics/Institute for Economic Research (Univ. of Warwick).
-20 -10 0 10 20
Administrative and secretarial occupations
Sales and customer service occupations
Elementary occupations
Skilled trades occupations
Professional occupations
Process, plant and machine operatives
Associate professional and technical occupations
Caring, leisure and other service occupations
Managers, directors and senior officials
% change in employment by occupation
Projected change in occupational employment 2015-2025: Gloucestershire and UK
UK Gloucestershire

Figure 10: Trend in job vacancies in Gloucestershire in 201539
The top twenty occupations identified from a total of 51,800 job vacancies
advertised over the first ten months of 2015 are shown in Figure 11. Vacancies
related to a number of highly skilled occupations including Information
Technology indicating the importance and variation in these requirements across
all sectors of industry. The demand for Chefs points to the key role played by the
Accommodation and food services sector with its links to tourism. The
Administrative occupations are also an indication of the need for these roles
across all sectors and finally the demand for Nursing occupations reflects the
increasing importance of the Care sector in the County.
39 Labour Insight.
0
1,000
2,000
3,000
4,000
5,000
6,000
7,000
Jan Feb Mar Apr May Jun Jul Aug Sep Oct
Nu
mb
er
of
va
ca
nc
ies
Trend in the number of vacancies Jan-Oct 2015: Gloucestershire

Figure 11: Top occupations advertised in Gloucestershire in 201540
2.7 Commuting to Work
In 2011, of the 240,320 residents aged 16 and over in Gloucestershire who
commuted to work in 2011, some 83.1% equating to 199,735 people worked
within the County as shown in Table 9.
Table 9: Commuting to Work within Gloucestershire 201141
In addition 40,585 (16.9%) residents commuted out of Gloucestershire to work.
Some 42% of Gloucestershire commuters travelled to the rest of the South West,
24% commuted to the West Midlands region, 13% went to the South East region
and remaining work destinations were in Wales and London.Figure 12 provides
40 Ibid. 41 Census of Population 2011: WU01UK - Location of usual residence and place of work by sex, ONS
Crown Copyright Reserved.
0 1 2 3 4 5 6 7 8
Programmers and software development professionals
Chefs
Other administrative occupations n.e.c.
Nurses
IT business analysts, architects and systems designers
Web design and development professionals
Business sales executives
Managers and proprietors in other services n.e.c.
IT and telecommunications professionals n.e.c.
IT user support technicians
Management consultants and business analysts
Care workers and home carers
Managers and directors in retail and wholesale
Customer service occupations n.e.c.
Sales and retail assistants
IT operations technicians
Sales accounts and business development managers
Design and development engineers
Sales related occupations n.e.c.
Cleaners and domestics
% of total vacancies
Top 20 Occupations advertised in 2015: Gloucestershire
Cheltenham Cotswold Forest of Dean Gloucester Stroud Tewkesbury Gloucestershire
29,462 1,768 311 4,454 1,191 6,313 43,499
1,487 16,221 147 796 957 687 20,295
1,073 329 15,379 4,036 467 1,646 22,930
5,057 948 1,054 29,407 4,699 7,053 48,218
1,947 2,334 283 5,492 23,998 1,791 35,845
8,293 873 464 5,457 946 12,915 28,948
47,319 22,473 17,638 49,642 32,258 30,405 199,735
Workplace Destination
Resident Origin
Gloucestershire
Cheltenham
Cotswold
Forest of Dean
Gloucester
Stroud
Tewkesbury

more detail and shows the most common district of work for residents who
commute to work outside of the County. South Gloucestershire was the most
common destination accounting for 13.8% of the total, this was followed by
Bristol and Swindon accounting for 8.8% and 8.7% respectively.
Figure 12: Commuting to work outside of Gloucestershire – main flows42
Of those 38,148 (16.7%) workers who commuted in to the County, nearly 40%
came from the West Midlands region, 35% from the rest of the South West
region, and the rest mainly from Wales and the South east region. Figure 13
provides more detail and shows the most common district of residence for
workers who live outside of the County. Wychavon was the most common district
of residence accounting for 13.1% of the total, this was followed by South
Gloucestershire and Herefordshire accounting for 9.1% and 8.1% respectively.
42
Ibid.
15.0 10.0 5.0 0.0
Stratford-on-Avon
Westminster,City of London
West Oxfordshire
Monmouthshire
Wychavon
Herefordshire, County of
Wiltshire
Swindon
Bristol, City of
South Gloucestershire
% of commuters who work outside of the county
Commuting to work outside of Gloucestershire
40,585 (16.9%) Gloucestershire residents work outside of the County
Glo
uc
es
ters
hire

Figure 13: Commuting to work in Gloucestershire from outside of the County – main
flows43
Overall there is a net outward flow from Gloucestershire amounting to 2,437
people as shown Table 10.
Table 10: Number of workers commuting in or out of Gloucestershire districts
201144
2.8 Work at home
In addition to those who commuted to work in 2011 there were another 38,200
people who worked at home in Gloucestershire equating to 13% of those
43
Ibid. 44 Ibid.
0.0 2.0 4.0 6.0 8.0 10.0 12.0 14.0
Stratford-on-Avon
Worcester
Monmouthshire
Malvern Hills
Bristol, City of
Swindon
Wiltshire
Herefordshire, County of
South Gloucestershire
Wychavon
% of commuters who live outside of the county
Commuting to work from outside of Gloucestershire
38,148 (16.7%) Gloucestershire workers reside outside of the County
Glo
uceste
rsh
ire
Commuting to work Total outward Total inward Net
Cheltenham district 19,782 24,148 4,366
Cotswold district 13,820 15,709 1,889
Forest of Dean district 14,627 6,015 -8,612
Gloucester district 23,617 26,131 2,514
Stroud district 20,526 13,287 -7,239
Tewkesbury district 20,566 25,211 4,645
Gloucestershire (includes offshore installation & outside UK) 40,585 38,148 -2,437

employed residents aged 16 and over as shown in Table 11, this represents an
increase of 2% since 2001.
The comparatively high proportion of those working at home coupled with the
relatively large number of self employed are perhaps an indication of how the
nature of the industrial structure of the County combined with improvements in
communication and other technological advances have enabled businesses to
locate and function much more efficiently in the more rural areas of the County.
Table 11: Proportion of residents in employment who work at home 201145
45 Census of Population 2011: WU01UK - Location of usual residence and place of work by sex, ONS
Crown Copyright Reserved.
District
Work mainly at
or from home
Number
Work mainly at or from
home as % of residents
aged 16+ in employment
Cheltenham district 6,199 10
Cotswold district 8,268 20
Forest of Dean district 5,618 14
Gloucester district 4,439 7
Stroud district 8,353 14
Tewkesbury district 5,331 13
Gloucestershire 38,208 13