Embed Size (px)
Citation preview

The Economics of the Belt and Road Initiative
Michele Ruta
Astana, Kazakhstan
October 4, 2018
Roadmap
I. The Belt and Road Initiative (BRI)
II. Connectivity gaps in BRI economies
III. Assessing the economic effects of the BRI
IV. Conclusion
2

I. The Belt and Road Initiative

The Belt and Road Initiative: What is it?
4
• The BRI is an ambitious
effort to improve regional
cooperation and
connectivity on a trans-
continental scale
• The BRI consists primarily
of the Silk Road Economic
Belt and the New Maritime
Silk Road, with 6 economic
corridors being identified
• For this study, we focus on
71 economies located along
the Belt and Road• BRI economies account for
over 30% of global GDP,
60% of population, 40% of
world trade, and 75% of
known energy reserves

The Belt and Road Initiative: Challenges and Opportunities
5
Opportunities Challenges• Improving cross-border infrastructure and
their management;
• Reducing trade costs, improving trade rules,
boosting trade flows and GVC participation;
• Improving investment climate and boosting
cross-border investment;
• Improving growth, employment and
poverty reduction;
• Developing lagging and isolated regions.
• Ensuring that investment is efficient, in
the face of high uncertainty;
• Coordinating infrastructure investments,
lack of data and transparency;
• Managing environmental, social and
governance risks;
• Ensuring openness and transparency in
public procurement;
• Sustaining public debt.

II. Connectivity gaps in BRI economies

BRI Trade Landscape
7
The share of BRI exports in global exports increased from 21% in 1995 to
37% in 2015 driven by a surge in global value chains
Source: Boffa (2018)
But large disparities
persist across regions
and countries
A gravity model shows
that BRI economies
under-trade with each
other by 30%0 5 10 15 20 25
South Asia
Middle East and North Africa
Europe and Central Asia
East Asia and Pacific
Exports (% of World exports)
BRI share in global exports
2015 1995

Infrastructure Gaps
8
There are substantial transport and energy infrastructure gaps in
developing economies
- Mckinsey (2016) finds that the world needs $3.3 trillion in infrastructure annually; according
to ADB (2016), developing Asia only requires $1.7 trillion per year in infrastructure
BRI economies’ average score of
perceived quality of transport
infrastructure is 2.7 out of 5,
pointing to important gaps
But large differences:• 3 of the bottom 20 performers are
BRI (Afghanistan, Bhutan, Iraq)
• As are 3 of the top 20 performers
(Hong Kong SAR, Singapore, UAE)
Data Source: World Bank, Logistic Performance Indicator (LPI), 2018.

Policy Gaps
9
Border delays and trade policy barriers are significant in BRI economies
Data Source: WB Doing Business Survey, 2013.
0 5 10 15
G7
East Asia and Pacific
Europe and Central Asia
Middle East and North Africa
Sub-Saharan Africa
South Asia
percent
MFN Applied Average Tariffs in BRI and G7 countries, 2016
Simple average
Data Source: TRAINS (WITS).
0 100 200 300
G7
Europe and Central Asia
East Asia and Pacific
Middle East and North Africa
South Asia
Sub-Saharan Africa
Border compliance (hours)
Time to Import in BRI countries against G7
Time to import

III. Economic effects of the BRI:
opportunities and risks
11
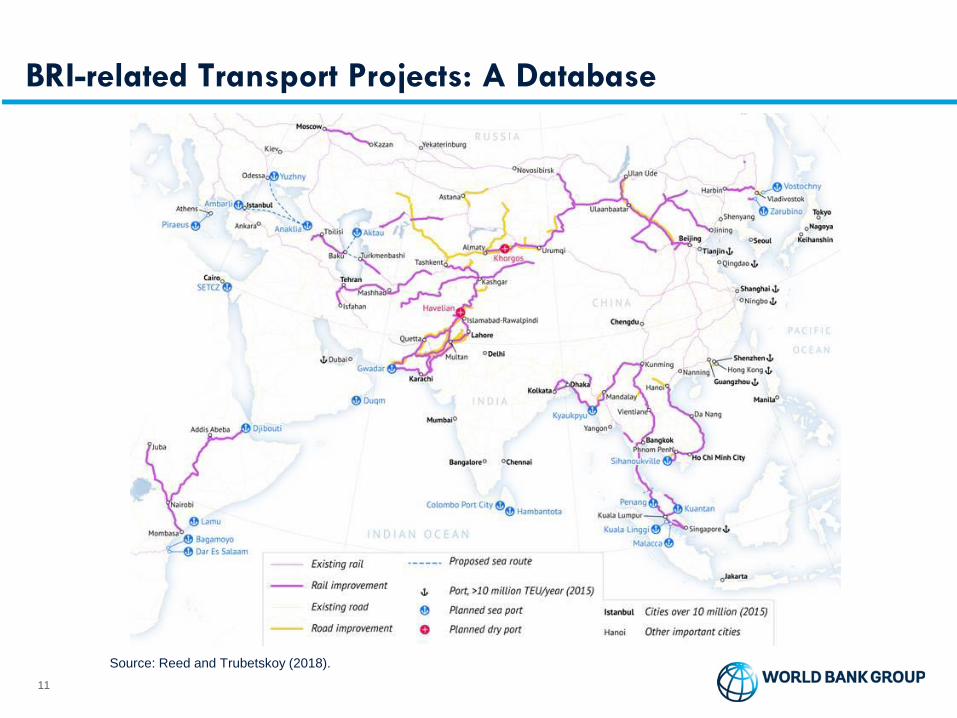
BRI-related Transport Projects: A Database
Source: Reed and Trubetskoy (2018).
BRI and Time to Trade
12
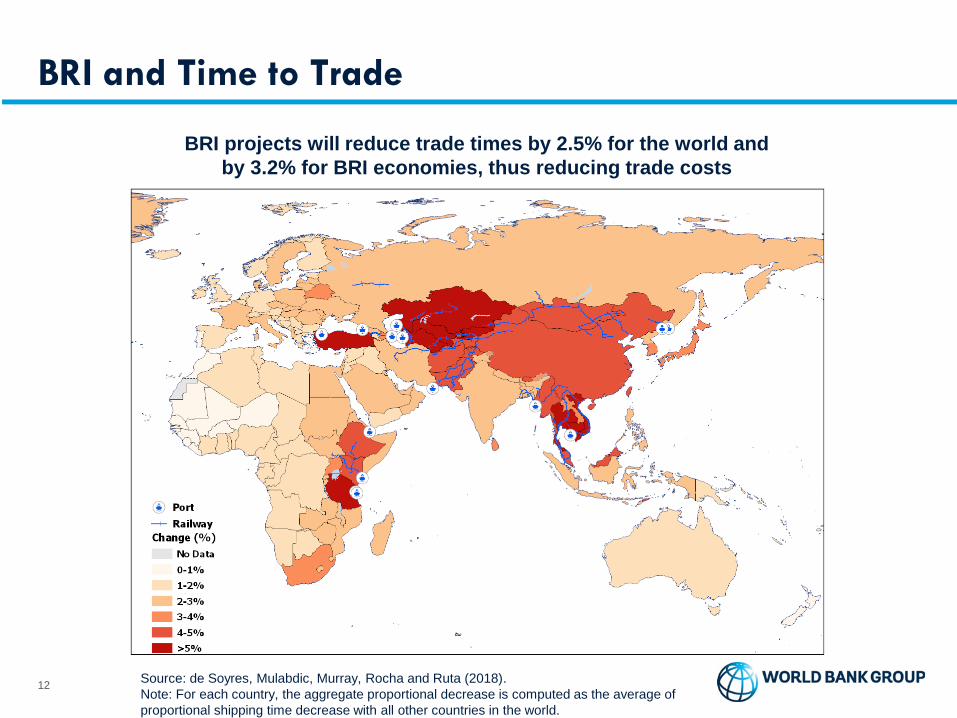
BRI projects will reduce trade times by 2.5% for the world and
by 3.2% for BRI economies, thus reducing trade costs
Source: de Soyres, Mulabdic, Murray, Rocha and Ruta (2018).
Note: For each country, the aggregate proportional decrease is computed as the average of
proportional shipping time decrease with all other countries in the world.
Trade Effects: A Gravity Analysis
13
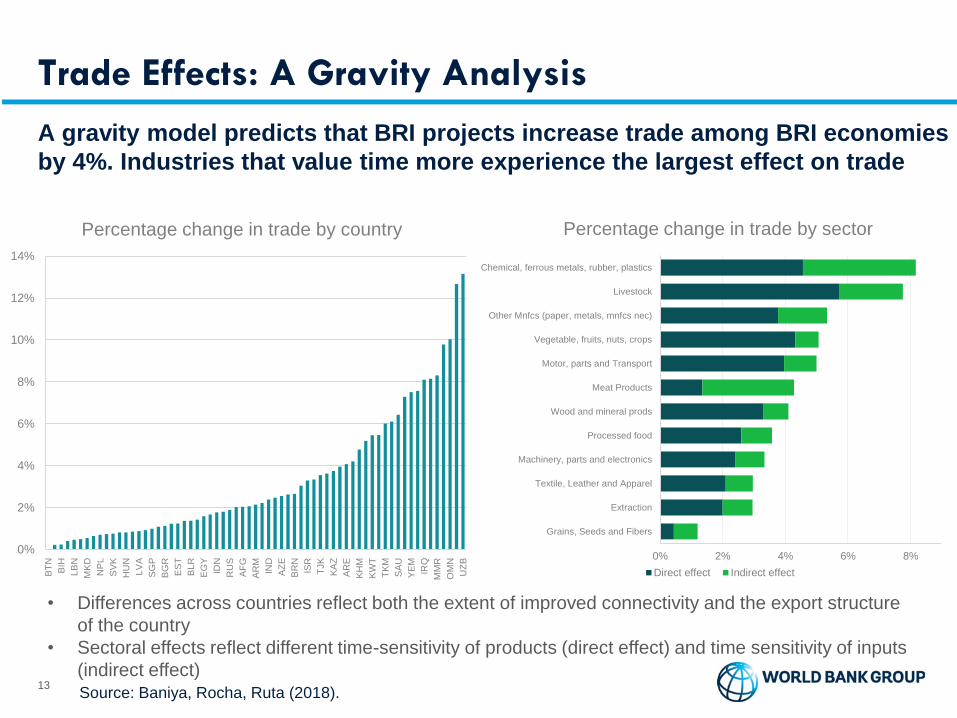
A gravity model predicts that BRI projects increase trade among BRI economies
by 4%. Industries that value time more experience the largest effect on trade
Source: Baniya, Rocha, Ruta (2018).
• Differences across countries reflect both the extent of improved connectivity and the export structure
of the country
• Sectoral effects reflect different time-sensitivity of products (direct effect) and time sensitivity of inputs
(indirect effect)
0%
2%
4%
6%
8%
10%
12%
14%
BT
N
BIH
LB
N
MK
D
NP
L
SV
K
HU
N
LV
A
SG
P
BG
R
ES
T
BL
R
EG
Y
ID
N
RU
S
AF
G
AR
M
IN
D
AZ
E
BR
N
IS
R
TJK
KA
Z
AR
E
KH
M
KW
T
TK
M
SA
U
YE
M
IR
Q
MM
R
OM
N
UZ
B
Percentage change in trade by country
0% 2% 4% 6% 8%
Grains, Seeds and Fibers
Extraction
Textile, Leather and Apparel
Machinery, parts and electronics
Processed food
Wood and mineral prods
Meat Products
Motor, parts and Transport
Vegetable, fruits, nuts, crops
Other Mnfcs (paper, metals, mnfcs nec)
Livestock
Chemical, ferrous metals, rubber, plastics
Percentage change in trade by sector
Direct effect Indirect effect
-1.0 0.0 1.0 2.0 3.0 4.0 5.0
World
BRI Area
percent
Impact of Infrastructure improvement on BRI economies on trade
Infrastructure improvement Reduced border delays
Reduced preferential tariffs
Welfare Effects: A General Equilibrium Analysis
14
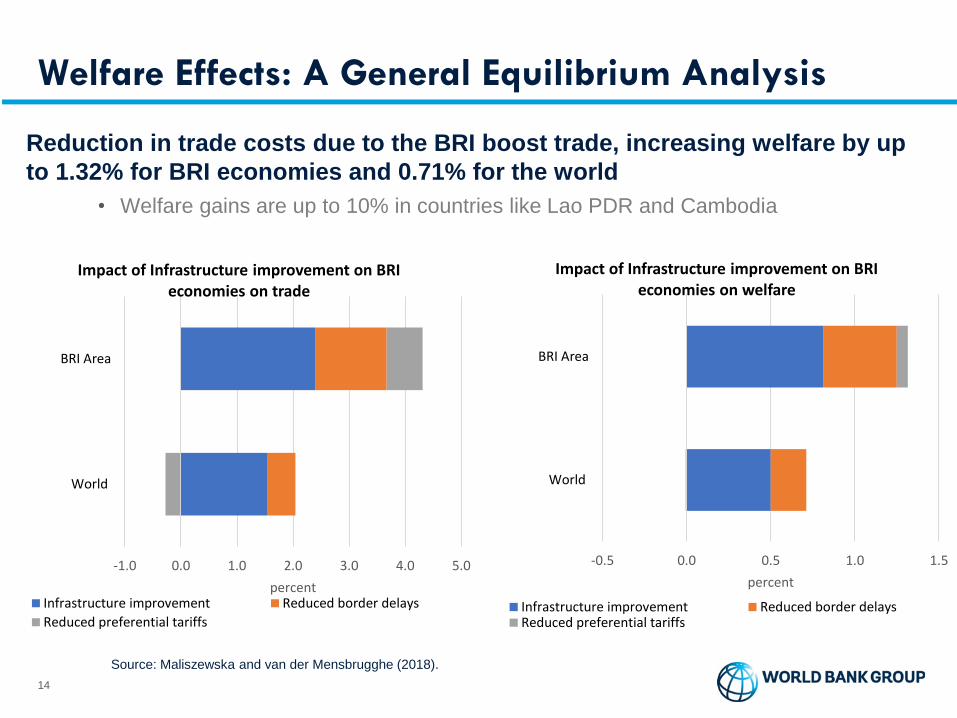
Reduction in trade costs due to the BRI boost trade, increasing welfare by up
to 1.32% for BRI economies and 0.71% for the world
• Welfare gains are up to 10% in countries like Lao PDR and Cambodia
Source: Maliszewska and van der Mensbrugghe (2018).
-0.5 0.0 0.5 1.0 1.5
World
BRI Area
percent
Impact of Infrastructure improvement on BRI economies on welfare
Infrastructure improvement Reduced border delaysReduced preferential tariffs

Other Effects
Results from a structural trade model
15
And from analysis of growth through FDI
Source: Chen (2018).
Source: Chen (2018).
0.0 0.5 1.0 1.5 2.0 2.5 3.0 3.5
Lower middle income
High income
Upper middle income
Low income
percent
BRI transport projects on GDP of BRI economies through trade
Estimated effect on GDP
-0.05 0 0.05 0.1 0.15 0.2 0.25 0.3 0.35 0.4
High income
Upper middle income
Lower middle income
Low income
percent
BRI transport projects on GDP growth of BRI economies through FDI
Estimated effect on GDP growth
Source: De Soyres, Mulabdic, Ruta (2018).
Effects of the BRI are larger when accounting for within country/region
efficiency gains and impact through increased FDI
Fiscal Risks
16
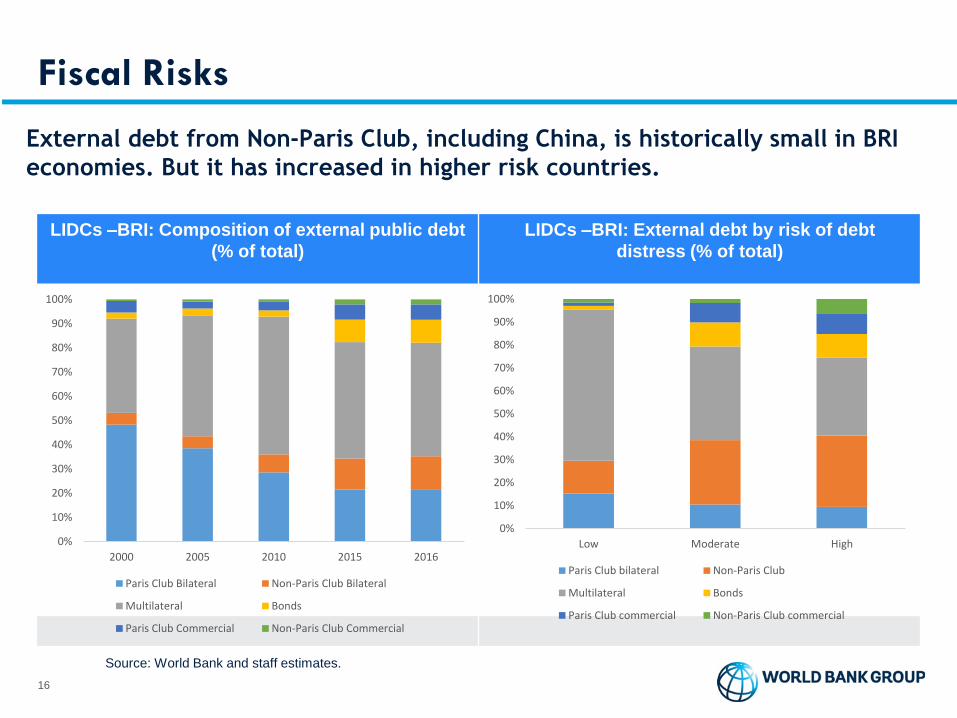
External debt from Non-Paris Club, including China, is historically small in BRI
economies. But it has increased in higher risk countries.
Source: World Bank and staff estimates.
BRI LICDs' Public and Publicly Guaranteed Debt of the General Government (in percent of GDP)
LIDCs –BRI: Composition of external public debt
(% of total)
LIDCs –BRI: External debt by risk of debt
distress (% of total)
0%
10%
20%
30%
40%
50%
60%
70%
80%
90%
100%
2000 2005 2010 2015 2016
Paris Club Bilateral Non-Paris Club Bilateral
Multilateral Bonds
Paris Club Commercial Non-Paris Club Commercial
0%
10%
20%
30%
40%
50%
60%
70%
80%
90%
100%
Low Moderate High
Paris Club bilateral Non-Paris Club
Multilateral Bonds
Paris Club commercial Non-Paris Club commercial

Conclusions
17
BRI will potentially have a large effect on trade and welfare for many
countries▪ All countries in the world experience a decrease in trade costs
▪ Not all sectors/countries will gain but potential aggregate effect is largely positive
But many policy barriers still remain in place. Potential gains of BRI
would be enlarged by complementary reforms▪ Need to reduce border delays, trade barriers and FDI restrictions
▪ But also boost investor protection, open public procurement, ensure private sector
participation
Economic and non-economic risks associated to BRI projects need to be
managed▪ Public debt sustainability, governance, environmental and social concerns
▪ Coordination problems, lack of data, poor transparency magnify these challenges

THANK YOU!
For more information, visit:
https://www.worldbank.org/en/topic/regional-integration
18