Embed Size (px)
Citation preview
DI
SC
US
SI
ON
P
AP
ER
S
ER
IE
S
Forschungsinstitut zur Zukunft der ArbeitInstitute for the Study of Labor
The Economics of International Differences in Educational Achievement
IZA DP No. 4925
May 2010
Eric A. HanushekLudger Woessmann

The Economics of International
Differences in Educational Achievement
Eric A. Hanushek Hoover Institution, Stanford University,
CESifo and NBER
Ludger Woessmann University of Munich, Ifo Institute,
CESifo and IZA
Discussion Paper No. 4925 May 2010
IZA
P.O. Box 7240 53072 Bonn
Germany
Phone: +49-228-3894-0 Fax: +49-228-3894-180
E-mail: [email protected]
Any opinions expressed here are those of the author(s) and not those of IZA. Research published in this series may include views on policy, but the institute itself takes no institutional policy positions. The Institute for the Study of Labor (IZA) in Bonn is a local and virtual international research center and a place of communication between science, politics and business. IZA is an independent nonprofit organization supported by Deutsche Post Foundation. The center is associated with the University of Bonn and offers a stimulating research environment through its international network, workshops and conferences, data service, project support, research visits and doctoral program. IZA engages in (i) original and internationally competitive research in all fields of labor economics, (ii) development of policy concepts, and (iii) dissemination of research results and concepts to the interested public. IZA Discussion Papers often represent preliminary work and are circulated to encourage discussion. Citation of such a paper should account for its provisional character. A revised version may be available directly from the author.
IZA Discussion Paper No. 4925 May 2010
ABSTRACT
The Economics of International Differences in Educational Achievement*
An emerging economic literature over the past decade has made use of international tests of educational achievement to analyze the determinants and impacts of cognitive skills. The cross-country comparative approach provides a number of unique advantages over national studies: It can exploit institutional variation that does not exist within countries; draw on much larger variation than usually available within any country; reveal whether any result is country-specific or more general; test whether effects are systematically heterogeneous in different settings; circumvent selection issues that plague within-country identification by using system-level aggregated measures; and uncover general-equilibrium effects that often elude studies in a single country. The advantages come at the price of concerns about the limited number of country observations, the cross-sectional character of most available achievement data, and possible bias from unobserved country factors like culture. This chapter reviews the economic literature on international differences in educational achievement, restricting itself to comparative analyses that are not possible within single countries and placing particular emphasis on studies trying to address key issues of empirical identification. While quantitative input measures show little impact, several measures of institutional structures and of the quality of the teaching force can account for significant portions of the large international differences in the level and equity of student achievement. Variations in skills measured by the international tests are in turn strongly related to individual labor-market outcomes and, perhaps more importantly, to cross-country variations in economic growth. JEL Classification: I20, O40, O15, H40, H52, J24, J31, P50 Keywords: human capital, cognitive skills, international student achievement tests,
education production function Corresponding author: Ludger Woessmann ifo Institute for Economic Research at the University of Munich Poschingerstr. 5 81679 Munich Germany E-mail: [email protected]
* We are grateful to participants at the Handbook of the Economics of Education conference at CESifo in Munich in September 2009 for valuable discussion and comments. Woessmann gratefully acknowledges the support and hospitality provided by the W. Glenn Campbell and Rita Ricardo-Campbell National Fellowship of the Hoover Institution, Stanford University, as well as support by the Pact for Research and Innovation of the Leibniz Association. Hanushek has been supported by the Packard Humanities Institute. Lukas Haffert provided capable research assistance.

The Economics of International Differences in Educational Achievement
Eric A. Hanushek, Ludger Woessmann
April 23, 2010
1. Introduction...............................................................................................................................1 1.1 Unique Advantages of Cross-Country Data on Cognitive Skills.........................................3 1.2 Concerns with the Use of Cross-Country Data on Cognitive Skills....................................4 1.3 Scope of this Analysis..........................................................................................................5
2. Economic Motivation................................................................................................................6
3. International Tests of Educational Achievement...................................................................7 3.1 Overview of Available International Testing and Participation ..........................................7 3.2 Validity of International Sampling and Testing...................................................................9
4. Determinants of International Educational Achievement ..................................................11 4.1 International Evidence on Education Production Functions..............................................11 4.2 Student and Family Background........................................................................................14 4.3 School Inputs .....................................................................................................................17
4.3.1 Evidence across Countries .......................................................................................17 4.3.2 Evidence within Different Countries ........................................................................19
4.4 Institutions..........................................................................................................................24 4.4.1 Accountability...........................................................................................................25 4.4.2 Autonomy..................................................................................................................26 4.4.3 Competition from Private Schools ...........................................................................27 4.4.4 Tracking ...................................................................................................................31 4.4.5 Pre-primary Education System ................................................................................33 4.4.6 Additional Results ....................................................................................................34
4.5 Conclusions on the Determinants of International Educational Achievement ..................34
5. Economic Consequences of International Educational Achievement ................................35 5.1 Cognitive Skills and Individual Labor-Market Outcomes.................................................35 5.2 Cognitive Skills and the Distribution of Economic Outcomes..........................................40 5.3 Cognitive Skills and Macroeconomic Growth...................................................................41
5.3.1 Aggregate Measures of Cognitive Skills ..................................................................42 5.3.2 Evidence on the Role of Cognitive Skills in Economic Growth ...............................44 5.3.3 Causation in a Cross-Country Framework..............................................................47 5.3.4 Expanding Country Samples by Regional Tests from Developing Countries ..........49 5.3.5 Basic Skills, Top Performance, and Growth ............................................................51 5.3.6 IQ Models .................................................................................................................51
5.4 Conclusions on the Economic Impact of Differences in Cognitive Skills.........................53
6. Conclusion and Outlook .........................................................................................................53
References.....................................................................................................................................55

1
“If custom and law define what is educationally allowable within a nation, the educational systems beyond one’s national boundaries
suggest what is educationally possible.”
Arthur W. Foshay (1962) on the first pilot study of international student achievement
1. Introduction
Virtually all nations of the world today realize the research and policy value of student performance data that come from testing the cognitive skills of students. While there is wide variation across nations in testing – differing by subject matter, grade level, purpose, and quality of testing – the idea of assessing what students know as opposed to how long they have been in school has diffused around the world, in part at the instigation of international development and aid agencies. Somewhat less known is that comparative cross-national testing has been going on for a long time. Nations participated in common international assessments of mathematics and science long before they instituted national testing programs. These common international assessments provide unique data for understanding both the importance of various factors determining achievement and the impact of skills on economic and social outcomes.
International consortia were formed in the mid-1960s to develop and implement comparisons of educational achievement across nations. Since then, the math, science, and reading performance of students in many countries have been tested on multiple occasions using (at each occasion) a common set of test questions in all participating countries. By 2010, three major international testing programs are surveying student performance on a regular basis: the Programme for International Student Assessment (PISA) testing math, science, and reading performance of 15-year-olds on a three-year cycle since 2000, the Trends in International Mathematics and Science Study (TIMSS) testing math and science performance (mostly) of eighth-graders on a four-year cycle since 1995, and the Progress in International Reading Literacy Study (PIRLS) testing primary-school reading performance on a five-year cycle since 2001. In addition, regional testing programs have produced comparable performance information for many countries in Latin America and Sub-Saharan Africa, and international adult literacy surveys have produced internationally comparable data on the educational achievement of adults.
In a variety of cases, these international assessments actually substitute for national testing. The international testing provides information on educational outcomes where otherwise only small, unrepresentative samples of outcome data are available. Indeed, the simplest of international comparisons has spurred not only governmental attention but also immense public interest as is vividly documented by the regular vigorous news coverage and public debate of the outcomes of the international achievement tests in many of the participating countries. For example, the results of the first PISA study made headlines on the front pages of tabloids and more serious newspapers alike: the Frankfurter Allgemeine Zeitung (Dec. 4, 2001) in Germany titled “Abysmal marks for German students”, Le Monde (Dec. 5, 2001) in France titled “France, the mediocre student of the OECD class”, and The Times (Dec. 6, 2001) in England titled “Are we not such dunces after all?”

2
These international assessments, which are generally embedded within a larger survey of individual and school attributes, are ultimately valuable in providing direct measures of human capital. The idea that individual skills are important in a wide variety of economic and social circumstances is generally captured under the blanket term of human capital. Since the influential work of Schultz (1961), Becker (1964), and Mincer (1970), the concept of human capital has pervaded many economic analyses.1 But the challenge has consistently been to find explicit measures that could be used in empirical analysis. Simply identifying, for example, differences in the labor-market outcomes for individuals as human capital does not provide a useful empirical structure. The invention of Mincer (1970, 1974) was to pursue the empirical power of defining human capital in terms of school attainment, an easily measured factor that almost certainly related to skill development and human capital. This idea has subsequently dominated most thinking about human capital such that school attainment is often taken virtually as a synonym for human capital.
The fundamental problem with this development is that it very frequently ignores other elements of skill development that will generally be related to school attainment. For example, a large body of work, generally under the rubric of educational production functions, focuses on the concomitant influence of families in the skill development of children. Moreover, much of the concern about governmental investments in schooling, particularly in developed countries, focuses on issues of differential quality. Both of these factors and other omitted elements are very likely to be related to the school attainment of individuals.2 While there has been considerable research aimed at getting consistent estimates of the rate of return to school attainment, little of this has addressed issues of systematic omitted determinants of human capital.3
Much of our motivation for the analysis described in this paper comes from the conclusion that cognitive skills, identified by test scores such as those incorporated into the international assessments, are good measures of relevant skills for human capital. Thus, in looking at the impacts of human capital on economic outcomes, instead of attempting to identify all of the relevant determinants of differences in individual or aggregate skills, we simply begin with measures of cognitive skills as our indication of human capital. Along the way, however, we also discuss the alternatives to this along with providing evidence about the appropriateness of different measures.
The research based on the international assessments goes in two different directions: research designed to understand the underlying determinants of cognitive skills and research focused on the consequences of skill differences. Our purpose here is to review and evaluate both lines of research employing international assessments.
1 As traced by Kiker (1968), the antecedents of human capital analysis go much farther back including Petty (1676 [1899]) and Smith (1979), but the idea went dormant with the arguments against it at the beginning of the 20th Century by Alfred Marshall (1898). 2 For general discussions of these issues, see Hanushek (2002) and Hanushek and Woessmann (2008). For the quality-attainment relationship, see Hanushek, Lavy, and Hitomi (2008). 3 For an evaluation of alternative approaches to estimation of returns to schooling, see Card (1999, 2001). The interpretation of such estimates as an internal rate of return is discussed in Heckman, Lochner, and Todd (2006, 2008). The more general interpretation of the determinants of human capital is found in Hanushek and Woessmann (2008) and Hanushek and Zhang (2009) along with the discussion below.
3
1.1 Unique Advantages of Cross-Country Data on Cognitive Skills International achievement data, developed and refined over the past half century, were not
collected to support any specific economic research agenda. But, as we shall discuss below, there are a number of research and policy agendas that are uniquely amenable to analysis because of the existence of such data. Indeed, it is somewhat peculiar to have a handbook chapter focus on specific data as opposed to issues of economic methodology or substantive research and policy areas. We argue, however, that such data have made it possible for economists to address a range of fundamental questions that previously resisted satisfactory analysis. And, because the extent and nature of international achievement data still remain largely unknown, it is important to evaluate the advantages and disadvantages of these data in understanding a variety of significant research and policy questions.
In terms of understanding the determinants of educational achievement, the international data have at least six unique advantages over research restricted to single countries or states. First, the data permit exploitation of variation that only exists across countries. For example, systematic institutional variation between countries as found with differences in the competitiveness and flexibility of teacher labor markets, forms of accountability systems, the extent of a private school sector, or the structure of student tracking simply does not exist within most countries. Or, the existence of central exit exams is a national characteristic in nearly all countries, so that the effect of central exams cannot be estimated using national data in these countries unless their status changes over time. The lack of within-country institutional variation makes an empirical identification of the impact of many institutional features of school systems impossible when using national datasets.
Second, even where within-country variation exists, variations across countries in key institutional factors and in characteristics of the schools and population are frequently much larger than those found within any country. From an analytical viewpoint, using such international variation generally implies increased statistical power to detect the impact of specific factors on student outcomes.
Third, the international achievement data based on the same data collection process provides an opportunity to examine comparable estimates of the determinants and consequences of educational achievement for a diverse set of countries. Such research can thus throw light on whether a result is truly country-specific, applies more generally, or is simply a spurious result from a particular within-country sample.
Fourth, and related to the previous point, international evidence can identify systematic heterogeneity in effects that differ across countries. For example, such comparative research can delve into why class-size effects on achievement are heterogeneous across countries, perhaps leading to deeper insights about, say, the interaction between curriculum or teacher training and classroom processes.
Fifth, even where within-country variation exists, for example, in the case of public and private schools operating within the same system, comparisons of student achievement are often subject to severe selection problems. Students who choose to attend a private school may differ along both observable and unobservable dimensions from students taught in neighborhood public schools. While it is possible to control for some differences in student, family, and school characteristics when estimating the effects of institutional structures, thereby comparing students who are observationally equivalent, such estimates may still suffer from selection on unobserved

4
characteristics. By aggregating the institutional variables to the country level, it is possible to circumvent these selection problems – in effect measuring the impact of, for example, the share of students in a country attending private schools on student achievement in the country as a whole. Such cross-country evidence will not be biased by standard issues of selection at the individual level.
Sixth, uncovering general equilibrium effects is often impossible in a single country but sometimes feasible across countries. For example, the presence of private schools may influence the behavior of nearby public schools with which they compete for students. As a result, simple comparisons of private and public schools may miss an important part of the effects of greater private involvement in education. Aggregated measures of the institutional feature can solve the problem: By comparing the average performance of systems with larger and smaller shares of private schools, the cross-country approach captures any systemic effect of competition from private schools.
Research into the consequences of differences in cognitive skills has similar advantages. For example, while the implications of human capital development for macroeconomic outcomes – including, importantly, economic growth – can potentially be investigated with time-series data for individual countries, historical data are effectively limited to school attainment with no information on the cognitive skills that we emphasize here. On the other hand, variations in cognitive skills across different economies can, as we describe below, effectively get at such fundamental questions. Similarly, investigating whether features of the structure of economic activity affect the individual returns to skills is very difficult within a single economy with interlocking labor and product markets.
1.2 Concerns with the Use of Cross-Country Data on Cognitive Skills With these research advantages also come concerns and disadvantages. Three stand out.
First, the relevant variations are frequently limited by the number of countries with both assessment and other common data. Second, even though each of the assessments collects substantial amounts of ancillary survey information at the individual level, virtually all are single cross-sectional designs with no ability to track individuals.4 Third, there is frequently a concern that unmeasured “cultural” factors are important in various processes of interest. Each of these make the identification and estimation of cross-country models difficult and limit the range of analyses currently possible.
Further, while not specific to this cross-country work, some inherently difficult data and modeling problems also remain. The focus of this chapter is measures of educational achievement – skills that are expressed in test scores – rather than quantitative measures of educational attainment. For reasons of availability, the focus of our skill measurement is just on cognitive skills, opening up possible concerns about other skills such as non-cognitive skills. The systematic measurement of such skills has yet to be possible in international comparisons. Furthermore, the research covered refers to basic general skills that are generally learned through the end of secondary school, leaving aside programs of higher education and specific vocational skills. Apart from data availability, this focus is also dictated by a need for international
4 Recent work in a few countries has built within-country follow-ups into the PISA testing; see Section 5.1 below.
5
comparability where measures of any quality aspects of higher education are generally unavailable.5
1.3 Scope of this Analysis The standards of evidence throughout empirical economics have changed in recent years,
sometimes dramatically. The character of change also enters directly into our consideration of cross-country analyses. The analytical designs employed in the cross-country analyses we discuss have developed over time in a way that parallels much of the related micro-econometric work within individual countries. The initial publications of comparative tests across nations by the organizations that conducted the different studies tended to report bivariate associations. Subsequent analyses performed multiple regressions in the form of educational production functions and cross-country growth regressions that tried to address the most obvious perils of bias from intervening factors by adding corresponding control variables. While initial studies estimated international educational production functions at the aggregate country level, subsequent studies exploited the full variation of the international micro data.
More recently, several studies have started to employ econometric techniques such as instrumental-variable, regression-discontinuity, differences-in-differences, and different sorts of fixed-effects specifications in order to come closer to identification of causal relationships in the international data on educational achievement. This applies both to the identification of causal effects within countries and to the challenge of overcoming possible bias from unobserved country heterogeneity – e.g., in terms of cultural differences – in cross-country estimation. While these developments are far from complete at this time, we emphasize the issues of identification and interpretation in much of the discussion below.
We limit the coverage of this chapter to studies that make cross-country comparisons. Based on this criterion, we cover only studies that estimate the same specification for different countries or estimate a cross-country specification. Studies that use the international survey data for analysis within a single country will be referenced only insofar as they are directly relevant for the internationally comparative approach.
The next section provides a brief economic motivation to frame the subsequent discussions. Section 3 gives an overview and critical assessment of the different available international datasets on educational achievement. Section 4 surveys the literature on the determinants of international educational achievement, covering both evidence within different countries and evidence across countries and covering family background, school resources, and institutional structures as three groups of possible determinants. Section 5 surveys the literature on the economic consequences of international educational achievement, covering both individual
5 A couple of attempts have been made to analyze differences among universities, but these are generally limited. There are academic rankings of the world’s research universities by the Institute of Higher Education, Shanghai Jiao Tong University, based on measures of university research (for 2007, see http://ed.sjtu.edu.cn/rank/2007/ARWU2007TOP500list.htm accessed January 12, 2008). A 2007 professional ranking by the Ecole des mines de Paris considered graduates who were CEOs at Global Fortune 500 countries (see http://www.ensmp.fr/Actualites/PR/EMP-ranking.html accessed January 12, 2008). Neither would appear to provide very general measures of higher education outcomes in different countries, and each also is subject to the same concerns that human capital is developed in more places than just schools.
6
labor-market outcomes and macroeconomic growth. The final section presents some overall conclusions along with a discussion of how the data and research could be improved.
2. Economic Motivation
A wide variety of analyses motivate the discussions here. They are most easily described as models falling under the rubric of human capital, although that nomenclature has become so widely used that it does not provide any clear description.
In general terms, the literature reviewed in Section 5 thinks of economic outcomes as determined by human capital – or relevant skills – and a variety of other factors. The canonical case, which we deal with extensively here, is where the economic outcome is individual labor-market earnings. (More generally, relying on some underlying models of markets, earnings might reflect the productivity of individuals in that labor market). This simple view is expressed by:
(1) O H Xγ β ε= + +
where O is the outcome of interest, H is human capital, X is a vector of other determinants of the outcome, and ε is a stochastic term. In the standard labor-market view of earnings determination, everything is measured at the individual worker level, O is simply individual earnings, and X includes such things as labor-market experience of the worker, gender, and health status.
The empirical issue is how to measure human capital, or H. Almost without comment, it is now commonplace simply to substitute school attainment, S, for human capital and to proceed with estimation of the underlying model. This approach is reinforced by the ubiquitous availability of measures of school attainment, a common addition to population censuses, household surveys, and other specialized data collections in nations around the world.
Assuming that school attainment is a measure of human capital, however, requires a series of strong assumptions, ones that conflict with other well-developed lines of research. Most relevant, analyses of educational production functions have considered the outcomes of schools within a broader model of production. Specifically, these models identify skills as being affected by a range of factors including family inputs (F), the quality and quantity of inputs provided by schools (qS), individual ability (A), and other relevant factors (Z) which include labor-market experience, health, and so forth as in:
(2) ( )H F qS A Zλ φ η α ν= + + + +
The schooling term combines both school attainment (S) and its quality (q).
Human capital is, however, not directly observed. To be verifiable, it is necessary to specify the measurement of H. Estimating versions of equation (2), the literature reviewed in Section 4 concentrates on the cognitive-skills component of human capital and considers measuring H with test-score measures of mathematics, science, and reading achievement. The use of measures of cognitive skills has a number of potential advantages. First, achievement captures variations in the knowledge and ability that schools strive to produce and thus relate the putative outputs of schooling to subsequent economic success. Second, by emphasizing total outcomes of education, these models incorporate skills from any source – families, schools, and ability.

7
Third, by allowing for differences in performance among students with differing quality of schooling (but possibly the same quantity of schooling), they open the investigation of the importance of different policies designed to affect the quality aspects of schools.
The implications of this perspective for the estimation of equation (1) are immediately obvious. Estimation that incorporated just school attainment (S) would yield biased estimates of the impact of human capital except in the most unlikely event that S is actually uncorrelated with the other determinants of skills.
The issues are perhaps most relevant when considering aggregate outcomes. In considering the impact of human capital on aggregate output or on economic growth, comparing a year of schooling across countries implies assuming that the learning per year is equivalent, say, from Hong Kong to South Africa. Few people would think that is a reasonable assumption.
We investigate the value of international measures of achievement for the analysis of both equations (1) and (2). For some estimation and analysis, international data are clearly not needed. For example, the extensive study of educational production functions has for the most part been conducted entirely within countries. Our focus here is very specific. We wish to consider analyses that are not possible within single countries or that provide extended analytical possibilities when put in an international framework. For example, as we discuss later, a variety of educational institutions are constant within individual countries – such as the use of early tracking systems – and thus are not susceptible to analysis within individual countries. Alternatively, understanding differences in economic growth across countries requires reliable cross-country data.
3. International Tests of Educational Achievement
The beginning of international testing was a series of meetings in the late 1950s and early 1960s when a group of academics met to design an international testing program.6 An exploratory study in testing mathematics, reading comprehension, geography, science, and non-verbal ability was conducted in 1959-1962 (cf. Foshay (1962)). This led to the first major international test in 1964 when twelve countries participated in the First International Mathematics Study (FIMS). This and a series of subsequent assessments were conducted in a set of nations voluntarily participating in a cooperative venture developed by the International Association for the Evaluation of Educational Achievement (IEA). The continuing IEA efforts have been more recently matched by an on-going testing program from the Organisation for Economic Co-operation and Development (OECD).
3.1 Overview of Available International Testing and Participation
These international testing programs, and related ones that we discuss below, are marked by some common elements. They involve a group of voluntarily participating countries that each pay for their participation and administer their own assessments (according to agreed-upon protocols and sampling schemes). Since they involve individual country policy decisions to participate, the set of participating countries has differed across time and even across subparts of
6 See “A Brief History of IEA” at http://www.iea.nl/brief_history_of_iea.html [accessed August 23, 2009].
8
specific testing occasions. Additionally, the different tests differ somewhat in their focus and intended subject matter. For example, the IEA tests, of which the most recent version is the Trends in International Mathematics and Science Study (TIMSS), are developed by international panels but are related to common elements of primary and secondary school curriculum, while the OECD tests (Programme in International Student Assessment, or PISA) are designed to measure more applied knowledge and skills.7 The range of subject matters tested varies across time, with assessments in math and science being supplemented by reading tests.8 Third, until recent testing, little effort has been made to equate scores across time. Finally, the testing has been almost exclusively cross-sectional in nature, not following individual students’ change in achievement.9
Along with the assessments of cognitive skills, extensive contextual information and student background data have been provided by related surveys. The motivation for this is using the international databases to address a variety of policy issues relevant to the participating countries.
The IEA and OECD tests have the broadest coverage and have also adapted regular testing cycles. Table 1 provides an account of their major international tests with an indication of age (or grade level) of testing, subject matter, and participating countries. By 2007, there were 15 testing occasions, most of which include subparts based upon subject and grade level.10
The major IEA and OECD testing programs have expanded dramatically in terms of participating countries. While only 29 countries participated in these testing programs through 1990, a total of 96 countries have participated by 2007. Three additional countries participated in 2009, and another three additional countries plan to participate in 2011, raising the total number of countries ever participating in one of these international tests to 102. Only the United States participated in all 15 testing occasions, but an additional 17 countries participated in ten or more different assessments. Figure 1 shows the histogram of participation on the IEA or OECD tests between 1964-2007, divided by OECD and other countries. From this figure, it is clear that the depth of coverage is much greater for developed than for developing countries. Further, much of the participation in one or two different test administrations occurs after 2000. On the other hand, those countries participating eight or more times have now accumulated some information on intertemporal patterns of performance with testing going back to the early 1990s or before.
At the same time, a number of more idiosyncratic tests, some on a regional basis, have also been developed. These tests have been more varied in their focus, development, and quality. And they have in general been used much less frequently in analytical work. Table 2 provides
7 A separate analysis of coverage and testing can be found in Neidorf, Binkley, Gattis, and Nohara (2006). 8 There have also been some other studies of foreign languages, civic education, and information technology. These have involved smaller samples of countries and in general have not been repeated over time. We do not include these in our discussions, in part because they have not been analyzed very much. 9 The Second International Mathematics Study (SIMS) of the IEA did have a one-year follow-up of individual students that permitted some longitudinal, panel information, but this design was not repeated. Recent innovations have permitted development of panel data by individual countries. 10 See Mullis, Martin, Kennedy, and Foy (2007), Mullis, Martin, and Foy (2008), and Organisation for Economic Co-operation and Development (2007) for details on the most recent cycle of the three major ongoing international testing cycles.

9
basic information on these additional assessments, although most of the remaining portion of this chapter concentrates on the information from tests in Table 1. Of the ten additional testing occasions, six are regional tests for Latin America (ECIEL, LLECE, SERCE) or Africa SACMEQ I and II, PASEC). As discussed below, the IEA and OECD tests may be too difficult for many students in the developing countries of Latin America and Africa, thus providing unreliable information about performance variations. These regional examinations use tests that are more appropriate to the countries of the region.
The remaining assessments and surveys cover a broader set of countries but are somewhat different in focus from those in Table 1. The International Assessment of Educational Progress (IAEP) I and II are tests constructed to mirror the National Assessment of Educational Progress (NAEP) that has been used in the United States since 1970 and that aligns to the United States school curriculum, which may limit international comparability. The International Adult Literacy Survey (IALS) and the Adult Literacy and Life Skills Survey (ALLS) have a very different structure involving sampling of adults in the workforce.11 The IALS survey data in particular have been used in a variety of studies about the consequences of education and cognitive skills (and will be discussed below in that context).
Given the different test designs, can results be compared across countries? And can the different tests be aggregated? Interestingly, the TIMSS tests with their curricular focus and the PISA tests with their real-world application focus are highly correlated at the country level. For example, the correlation coefficients between the TIMSS 2003 tests of 8th graders and the PISA 2003 tests of 15-year-olds across the 19 countries participating in both are 0.87 in math and 0.97 in science, and they are 0.86 in both math and science across the 21 countries participating both in the TIMSS 1999 tests and the PISA 2000/02 tests. There is also a high correlation at the country level between the curriculum-based student tests of TIMSS and the practical literacy adult examinations of IALS (Hanushek and Zhang (2009)). Tests with very different foci and perspectives tend to be highly related, suggesting that they are measuring a common dimension of skills. As discussed below, the consistency lends support to aggregating different student tests for each country in order to develop comparable achievement measures. It is also encouraging when thinking of these tests as identifying fundamental skills included in “human capital.”
As an example of the different international tests, Table 3 provides comparative information on country performance on the major worldwide tests of math at the lower secondary level. The more recent tests have been normed to have a mean of 500 and standard deviation of 100. But, because the group of countries going into the norm differs and because there is no attempt to equate scores across time, it is not possible to say that a country with an average of 510 in one year and 515 in another has improved or not. We return to this issue below.
3.2 Validity of International Sampling and Testing The available international tests of educational achievement are not without criticism. In
particular, despite the stringent technical standards and extensive efforts of quality assurance by the international testing organizations (e.g., Organisation for Economic Co-operation and
11 The OECD has currently also embarked on a new endeavor, the Programme for the International Assessment of Adult Competencies (PIAAC), which will update and expand the adult testing, in terms of both the scope of the test and the number of participating countries. This assessment is scheduled to be administered in 2011.

10
Development (2009)), in principle differences in sample selectivity across countries clearly have the potential to undermine the validity of specific country rankings on the tests. While critics of international educational comparisons argue that results may be influenced by differences in the extent to which countries adequately sample their entire student populations (e.g., Rotberg (1995); Prais (2003)), others disagree with the view that sample selection is a major source of bias in international achievement comparisons (e.g., Baker (1997); Adams (2003)).
In any case, the extent to which such sample selection affects results of econometric analyses that use the international test score data (rather than just leading to mismeasurement of country mean performance) depends on whether it is idiosyncratic or systematic and on the extent to which it is correlated both with (conditional) outcomes and determinants of the analyses. If sample selectivity is idiosyncratic, it simply introduces classical measurement error that works against finding statistically significant associations.12 The same is true if sample selectivity is persistent across time but orthogonal to the (conditional) variable whose association with test scores is of interest. Only if it is correlated with the error term of the estimation equation does systematic sample selectivity introduce bias to econometric analyses.13
In order to test the extent to which this is true, Hanushek and Woessmann (2010b) draw on detailed information on sampling quality provided in the more recent international tests and estimate whether international differences in sample selection affect the outcomes of typical economic analyses. They show that countries having more schools and students excluded from the targeted sample (e.g., because of intellectual or functional disabilities or limited proficiency in the test language), having schools and students who are less likely to participate in the test (e.g., because of unwillingness to participate or absence on the testing day), and having higher overall school enrollment at the relevant age level indeed tend to perform better on the international tests. However, accounting for this sample selectivity does not affect the results of standard growth regressions and education production functions. This finding implies that the international variation in selectivity of student samples is not systematically related to the associations of interest in the economic analyses reviewed in this chapter.
The tests included in our analyses have been devised in an international cooperative process between all participating countries with the intent of making the assessments independent of the culture or curriculum in any particular country. Yet, another criticism that is sometimes raised against international comparisons of student achievement is that test items may be culturally biased or inappropriate for specific participating countries (e.g., Hopmann, Brinek, and Retzl (2007)). Adams, Berezner, and Jakubowski (2010) show that overall country rankings are remarkably consistent when countries are compared using just those PISA-2006 items that
12 The importance of this will be lessened in applications that use averages of performance across several tests, since the error variance is reduced by averaging. 13 Studies such as Hanushek and Woessmann (2009a) that include country fixed effects deal with possible bias from systematic sampling errors by removing time-invariant factors for each country. They also show that changes in enrollment rates over time are uncorrelated with trends in test scores, diluting worries that differential changes in enrollment bias the results of economic analyses using test scores.

11
representatives of each specific country had initially expressed to be of highest priority for inclusion, and presumably most appropriate for their own school system.14
The summary is that international testing is now well-established and broadly accepted. The assessments, particularly in Table 1, plus their corresponding survey information form the basis for the cross-country analyses discussed here.
4. Determinants of International Educational Achievement
In reviewing the economic literature on international educational achievement, this section focuses on its determinants and the next section on its consequences. After a brief introduction to the estimation of international education production functions, this section covers student background, school inputs, and institutional structures of the education system as three groups of factors determining achievement. Note that the analysis is weighted toward developed countries, largely mirroring the time pattern of participation where developing countries have until very recently participated infrequently. At the same time, since most international analyses of the determination of achievement rely just on the cross-sectional data, it might be expected that this balance will change in the near future.
4.1 International Evidence on Education Production Functions As is the case in the majority of the literature on educational production, the basic model
underlying the literature on determinants of international educational achievement resembles some form of the education production function:
(3) eAaIaRaFaaT +++++= 43210
which basically is a version of our equation (2) applied to students currently in school. Here, T is the outcome of the educational production process as measured, e.g., by test scores of mathematics, science, and reading achievement. The vector F captures facets of student and family background characteristics, R is a vector of measures of school resources, I are institutional features of schools and education systems, and A is individual ability.
When estimating equation (3) within different countries, studies based on international data face the same methodological challenges as studies restricted to a specific country (see Hanushek (1979, 2002) and Todd and Wolpin (2003) for key issues in empirical identification of education production functions). The fundamental challenge is that most inputs in the education production function are likely not to be exogenous in a statistical sense. Leading concerns derive from omitted variables, selection, and reverse causation. A key candidate of an omitted variable is student ability A, most dimensions of which tend to go unmeasured and are likely correlated with other inputs in important ways. An additional concern for research on most of the international tests is their cross-sectional structure which does not allow for panel or value-added estimations, so that temporally prior inputs are usually unobserved. School inputs will often be
14 From the opposite perspective, the IAEP comparisons (not employed here) were built on tests directly taken from the assessments used in the United States, but the results from these comparisons did not alter the low ranking of U.S. students (see Lapointe, Mead, and Phillips (1989)).

12
the outcome of choices of parents, administrators, and schools that are correlated with the error term of the production function. The same is true for some institutional characteristics. Given this substantial scope for endogeneity bias, least-squares estimates of equation (3) need to be interpreted with great care, even when they control for a large set of observable input factors. This has led to the development of more elaborate techniques that try to draw on exogenous variation in the variables of interest.
In the following review of the literature, we will refer to the more descriptive studies only briefly and mostly focus on studies trying to address the key identification issues. There is, however, one specific aspect about making cross-country comparisons of estimates obtained from performing the same estimation in different countries, though: If one is willing to make the assumption that any bias is constant across countries, then a cross-country comparison of estimates is feasible, even if interpretation of the size of each estimate is not.
The main challenges change when it comes to studies estimating cross-country associations. As discussed in the introduction to this chapter, there are both unique advantages and specific concerns with using cross-country data to estimate the determinants of educational achievement. At the most general level, cross-country estimation is able to get around the most pressing concerns of bias from selection but introduces new kinds of omitted variable concerns. Within-country variation is often subject to severe selection problems: For example, students who choose to attend a private school may differ along both observable and unobservable dimensions from students taught in neighborhood public schools. While many observable characteristics are often controlled for in econometric analyses, thereby comparing students who are observationally equivalent, within-country estimates may still suffer from selection on unobserved characteristics.15 In cross-country analyses, one can aggregate the institutional variable of interest up to the country level, thereby circumventing the selection problem. In effect, the cross-country analysis then measures the impact of, for example, the share of students in a country attending private schools on student achievement in the country as a whole. Such cross-country analysis cannot be biased by standard issues of selection at the individual level, as patterns of sorting cancel out at the system level.
The main cost to this – apart from the limited degrees of freedom at the country level – is that unobserved heterogeneity at the country level may introduce new forms of omitted variable bias. For example, cultural factors such as “Asian values” may remain unobserved in the econometric model and correlate both with student outcomes and relevant inputs in the education production function. Education systems – and societies more generally – may also differ in other important dimensions unobserved by the researcher. To address such concerns, the main results of cross-country studies should be checked for robustness to including obvious correlates of the cultural factors as control variables at the country level. Another robustness check is to draw only on variation within major world regions by including regional (continental) fixed effects. More fundamentally, some cross-country studies have started to adopt new techniques directly developed to address such issues of identification in particular contexts, and these studies will be the main focus of the following review.
15 There is, for example, an extensive literature within the U.S. on private school choice and the potential problems with student selection (see, for example, Coleman and Hoffer (1987); Coleman, Hoffer, and Kilgore (1981); Neal (1997); Altonji, Elder, and Taber (2005)).

13
Early studies that employ the international student achievement tests to estimate similar education production function within different countries include Heyneman and Loxley (1983) and Toma (1996). Early studies using the cross-country variation of international tests to estimate international education productions on country-level observations include Bishop (1997), Hanushek and Kimko (2000), and Lee and Barro (2001). The first economic study to make use of the vast potential of the international micro data on students’ achievement, family background, and school inputs and of the broad array of institutional differences that exists across countries to estimate extensive multivariate cross-country education production functions is Woessmann (2003b). While still subject to the prior issues of cross-country identification, employing the rich student-level data on background factors allows to hold constant a large set of observable factors usually unavailable in national datasets.
Table 4 presents an example estimation of an international education production function.16 Using student-level data for 29 OECD countries from the 2003 cycle of the PISA test of 15-year-olds, the model expresses individual student achievement in math as a function of large set of input factors. While this is a basic model that does not fully exploit the potential of the international data, the model specification already documents the rich set of background factors available from the student and school background questionnaires. Moreover, the international data display wide variation in many of the potential inputs to achievement, thus allowing for more precise estimation of any effects. At the individual level, the factors include student characteristics such as age, gender, immigration, and preprimary educational attendance and family-background measures such as socio-economic status, parental occupation, family status, and the number of books in the home. At the school level, the model includes resource measures such as class size and shortage of materials, instruction time, teacher education, community location, and institutional factors such as a set of measures of teacher monitoring and student assessment, different dimensions of school autonomy, and their interaction with accountability measures. At the country level, this basic model includes a country’s GDP per capita, educational expenditure per student, and the institutional factors of external exit exams, share of privately operated schools, and average government funding of schools.
While the cross-sectional nature of this estimation allows for a descriptive interpretation only, it is worth noting that many measures of students’ individual and family background are systematically related to their achievement, as are several measures of the institutional structure of the school system. By contrast, the point estimate on class size, the classical measure of quantitative school inputs, is counterintuitive,17 and the estimates on the more qualitative school inputs, while positive, are more limited than the background and institutional estimates. The model accounts for 39 percent of the achievement variation at the student level and for 87 percent at the country level. That is, while unobserved factors such as ability differences are important at the individual level, the model is able to account statistically for most of the between-country variation in academic achievement. These basic result patterns are broadly common to all studies of international education production functions estimated on the different
16 See Woessmann, Luedemann, Schuetz, and West (2009) for additional background and robustness analyses. 17 The coefficient on country-level spending is very small. While it is statistically significant, identification here comes from a very particular margin, as the correlation between spending and per-capita GDP (whose coefficient is negative here) in this model is as high as 0.93. Other studies tend to find a significant positive coefficient on GDP per capita, but not on spending. See below for more extensive discussion.

14
international student achievement tests.18 We will now discuss the literature on each of the three groups of determinants – student and family background, school inputs, and institutions – in greater detail.
4.2 Student and Family Background The results of the international education production function just presented show strong
associations of educational achievement with many measures of student and family background. Given the importance of learning and child development outside school, family inputs have long been viewed as a leading input in educational production. As a consequence, consideration of measures of family background is generally taken as the most rudimentary quality standard when analyzing effects of school inputs (cf. Hanushek (2002)). But the effects of different measures of student and family background are generally seen as having important interest in their own right, not least because they provide an indication of the equality of opportunity of children with different backgrounds (see the chapter by Björklund and Salvanes (2010)). When using international student achievement data to estimate the same basic specification in different countries, measures of equality of opportunity can be compared across countries for several dimensions such as social background, ethnicity and immigrant status, and gender. Moreover, estimates of how strongly student achievement depends on family background provide an indication of intergenerational mobility of a society. We first discuss evidence derived from estimation within different countries and follow with evidence across countries.
Figure 2 depicts an example, based on Schuetz, Ursprung, and Woessmann (2008), of using international data to generate comparable estimates of the association between family background and educational achievement in different countries. By combining the 1995 TIMSS test with its 1999 repeat study, the study can draw on micro data for over 325,000 students from a total of 54 countries. For the OECD countries, the figure depicts the coefficient on books available in the student’s household in a student-level regression predicting the average 8th-grade test score in math and science disaggregated by country. By controlling for the immigration status of student, mother, and father interacted with family background (as well as age, gender, and family status), the multivariate analysis ensures that the estimates are not driven by cross-country differences in the immigrant population, but reflect socio-economic differences in the non-migrant population of each country.
The number of books in the students’ home is used as a proxy for socio-economic background not only because cross-country comparability and data coverage are superior to such indicators as parental education, but also because books at home are the single most important predictor of student performance in most countries (Woessmann (2003b, 2008)). The sociological literature suggests books at home as a powerful proxy for the educational, social, and economic background of the students’ families. Furthermore, Schuetz, Ursprung, and Woessmann (2008) corroborate the cross-country validity of the books-at-home variable by showing that the association between household income and books at home does not vary significantly between the six countries for which both income and books measures are available in the PIRLS dataset. At the same time, it is important to be clear about the interpretation. The consistency of the estimates across studies is not meant to imply that books in the home per se
18 See Aghion et al. (2007) and Aghion (2008) for an example of an international education production function in higher education, using university rankings based on the Shanghai research ranking (see above).

15
are causally related to achievement and that providing more books to families would raise student performance. Books in the home proxy systematic differences in parenting, home education, and home resources that are presumed to be causally related to performance. In other words, the specific measures are not causally related to achievement even if the underlying concept is.19
The association between the family-background measure and student achievement is statistically significant at the 1 percent level in every country in Figure 2. The size of the estimates indicates how much students’ test scores, measured in percentage points of an international standard deviation, increase when raising the number of books at home by one category. For example, in England the difference in educational achievement between children of families with more than two bookcases of books and children of families with only very few books at home (the two extremes of the five available categories) is 1.15 standard deviations, or more than three times what students on average learn during a whole school year.20 While the estimated family-background effect differs substantially across countries, the socio-economic difference equals roughly one grade-level equivalent even in France, the OECD country with the lowest estimate. The United States falls in the top quarter of the most unequal OECD countries, whereas Canada belongs to the group of most equal countries. By estimating the same association in 54 countries, the study provides an index of inequality of educational opportunity that permits comparisons of the intergenerational educational mobility across countries. Obviously, specific country results may be sensitive to the specific background measure and TIMSS dataset. On the other hand, analytical results on the cross-country association of education policies with equality of opportunity are consistent when using an index of socio-economic status as an alternative background measure and when estimated with the PISA dataset (Woessmann, Luedemann, Schuetz, and West (2009)).
Table 5 provides a detailed overview of studies using international tests to estimate the association between several student background measures and educational achievement in different countries. Education production functions that include several measures of student and family background in a way comparable across countries have been estimated for groups of countries in East Europe (Ammermueller, Heijke, and Woessmann (2005)), East Asia (Woessmann (2005a)), West Europe and the United States (Woessmann (2008) using TIMSS, Peterson and Woessmann (2007) using PISA), and Latin America (Woessmann (2010a)). Special attention to the relative performance of students with immigration background in different countries is given in Entorf and Minoiu (2005) and Schnepf (2007). Zimmer and Toma (2000) and Ammermueller and Pischke (2009) focus on effects of peers’ background on student achievement in different countries. Bedard and Dhuey (2006) and Sprietsma (2010) analyze the effect of relative school starting age. Wolter and Coradi Vellacott (2003) look at sibling rivalry in different countries. Jenkins, Micklewright, and Schnepf (2008) calculate measures of between-school social segregation in different countries. In each case, these studies make use of the cross-country structure of the data to compare the size of the association of the specific background measure with student achievement across countries. In general, the studies find that
19 A similar interpretation but in a different context can be seen from the use of family income to proxy behavior and family outcomes (cf. Mayer (1997)). A similar point about the causal impact of parental education is made by Black, Devereux, and Salvanes (2005). 20 On these tests, one grade-level equivalent equals roughly 35 percent of a standard deviation (see Schuetz, Ursprung, and Woessmann (2008)).

16
educational achievement differs substantially by student and family background within the separate countries, but also that there is substantial variation in the influence of families across countries. Section 4.4 below will review studies that relate such measures of equity of educational achievement to institutional differences in the education systems across countries.
When estimating the association between socio-economic background and economic achievement, the literature has been generally interested in overall associations, irrespective of their origin. Methodologically, most of the cross-country literature on background effects so far is thus descriptive in nature. At the same time, not much headway has been made on the underlying causal mechanisms, such as the relative roles of nature and nurture in these associations. However, lacking obvious reasons to assume that natural transmission differs across countries, cross-country comparisons can be interpreted in terms of differences in the extent to which societies achieve more or less equal educational opportunities. Differences in the estimates across countries can thus still be correlated with different national features to estimate relevant policy parameters (see below).
As the studies covered in Table 6 testify, the strong association between students’ socio-economic background and their educational achievement is also confirmed in cross-country studies, estimated both at the country level (Lee and Barro (2001)) and at the student level (Woessmann (2003b) using TIMSS, Fuchs and Woessmann (2007) using PISA).21 (Table 6 reports results on family backgrounds and school inputs together because most studies estimating cross-country associations deal with both at the same time.) On more particular subjects, Gunnarsson, Orazem, and Sánchez (2006) use variation across Latin American countries in the LLECE test to estimate the effect of child labor on student achievement. They exploit cross-country variation in truancy regulations to identify exogenous variation in the opportunity cost of children’s time in a cross-country instrumental variable model. McEwan and Marshall (2004) and Ammermueller (2007) perform decomposition analyses of the variation between two countries to estimate the extent that family-background measures can account for achievement difference between Cuba and Mexico and between Finland and Germany, respectively.
For questions of specific background factors, the literature has also used more elaborate identification techniques. For example, Bedard and Dhuey (2006) use the variation created by national cutoff dates for school enrollment to derive exogenous variation in relative school starting ages. The relative school starting age assigned by national cutoff date is consequently used as an instrument for the actual relative school starting age of the students.22 Zimmer and Toma (2000) make use of the specific structure of the SIMS study that included a one-year follow-up to estimate value-added models when analyzing peer effects. More rudimentarily, Woessmann (2010a) draws on retrospective reports on pre-school performance by parents in the PIRLS study to estimate quasi-value-added models. In estimating peer effects, Ammermueller and Pischke (2009) assume that classes within primary schools are randomly formed and
21 Jürges and Schneider (2004) employ a two-step approach to first estimate country fixed effects and then relate them to country-level measures in TIMSS. 22 This strategy identifies effects of relative maturity at school entry. Leuven, Lindahl, Oosterbeek, and Webbink (2010) is a study of the effect of absolute age at starting school. Bedard and Dhuey (2006) also indicate that the cross-country pattern of results suggests that relative age effects may be less persistent in countries with limited ability-differentiated learning groups during the primary grades. We will discuss the topic of tracking below.

17
accordingly employ school fixed effects estimation. They also address measurement error issues by instrumenting the parent-reported variable by the same variable reported by the student.
In sum, measures of student and family background prove to be key factors in international education production functions. A significant association of students’ academic achievement with the socio-economic background of their families is evident in all countries around the world. The variation in this association across countries, however, suggests that differences in education policies might be an important element in differences in equality of opportunity, a topic to which we return below.23
4.3 School Inputs When moving from family to school determinants of educational achievement, the topic
most intensively researched are the inputs available in schools (Hanushek (2006)). As exemplified in the international education production function shown in Table 4, measures of school inputs include expenditure per student, class size, availability of instructional material, and teacher characteristics. The studies reviewed in Table 6 reveal that in general, the cross-country association of student achievement with resources tends to be much weaker than with socio-economic backgrounds.
4.3.1 Evidence across Countries
When looking across countries, the most straightforward starting point is the simple association between the aggregate financial measure of average expenditure per student and average achievement. Figure 3 presents the international association between cumulative spending per student from age 6 to 15 and the average math achievement of 15-year-olds on the 2003 PISA test. Without considering the strong outliers of Mexico and Greece, there is no association between spending levels and average achievement across countries.24 At the most basic level, countries with high educational spending appear to perform at the same level as countries with low expenditures.
This picture has been evident in many other waves of the different international achievement tests (e.g., Woessmann (2002), Section 3.2, for the 1995 TIMSS test). Furthermore, in most cases the lack of a significant positive cross-country association between expenditure per student and educational achievement holds up when numerous other determining factors such as family background and school features (including instruction time) are accounted for in a regression framework. Hanushek and Kimko (2000) and Lee and Barro (2001) perform country-level regressions using different tests and Woessmann (2003b) and Fuchs and Woessmann (2007)
23 While our focus is on the effects of cognitive skills, other related work has delved into cross-country differences in participation in higher education and its relationship to family background (see, for example, Orr, Schnitzer, and Frackmann (2008)). The transition into higher education has at the same time been shown to be closely related to student achievement. 24 With the two outliers, there is a weak positive association as long as other effects are ignored. Taken literally, the full-sample association suggests that $60,000 per student in additional expenditure (a quadrupling of spending in the low spending countries) is associated with about a half standard deviation improvement in scores. However, once a country’s GDP per capita is controlled for, the cross-country association between student achievement and expenditure loses statistical significance and even turns negative, suggesting that the bivariate association is driven by the omitted factor of average socio-economic status.

18
perform student-level microeconometric regressions using TIMSS 1995 and PISA 2000, respectively.
As discussed above, such cross-sectional analysis has to be interpreted cautiously, even when controlling for a large set of factors. There may be reverse causality, and unobserved country differences – e.g., cultural traits or institutional and political factors – may be correlated with both inputs and outcomes. As a first step to address such worries, one can look at within-country variation over time (Table 7). By looking at changes in inputs and outcomes, one can rule out unobserved level effects. Thus, Gundlach, Woessmann, and Gmelin (2001) calculate changes in expenditure and achievement for individual OECD countries from 1970-1994, and Gundlach and Woessmann (2001) for individual East Asian countries from 1980-1994.25
The results, depicted in Figure 4, suggest that educational expenditure per student has increased substantially in real terms in all considered OECD countries between the early 1970s and the mid-1990s, and in all considered East Asian countries except the Philippines between the early 1980s and the mid-1990s.26 Yet, comparing test scores over the same time intervals suggests that no substantial improvement in average student achievement has occurred in any of these countries. Combining the time-series evidence on resources and achievement, it is fair to conclude that substantial increases in real school expenditure per student did not lead to improvements in student outcomes in most of the sampled OECD and East Asian countries. In fact, the experience of many countries is much bleaker than what had been termed the “productivity collapse in schools” in the United States (Hanushek (1997)).27
Apart from the aggregate expenditure measure, the cross-country variation has also been used to analyze specific resource inputs in cross-sectional analysis (see Table 6 for details). Expenditure per student is an encompassing measure of school inputs which considers not only personnel costs but also material costs. But international comparisons of expenditure may be hampered by the problem of choosing an appropriate exchange rate (Figure 3 uses conversion by purchasing power parities). Because personnel costs make up more than three quarters of total expenditure in nearly all countries, class size lends itself particularly well as a non-monetary input measure for international comparisons which determines a large part of total expenditure. However, using class size instead of expenditure per student yields the same general picture as in Figure 3. Regression analyses that control for family background measures come to similar results. At the country level, Lee and Barro (2001) find a positive effect of smaller student-
25 Achievement data from the international tests at the two respective points in time are linked using U.S. longitudinal achievement data. Increases in educational expenditure are adjusted not only for average inflation, but also for the so-called “Baumol effect” of increasing costs in service sectors with constant productivity. Three different approaches of calculating price deflators for the schooling sector that account for this effect are averaged in the depiction of Figure 4. For details, see Gundlach, Woessmann, and Gmelin (2001), Gundlach and Woessmann (2001), and Woessmann (2002), Section 3.3. 26 Gundlach and Woessmann (2001) show that the resource expansion in the East Asian countries mostly results from government decisions to raise the number of teachers per student. 27 One potential explanation for this bivariate longitudinal pattern might of course be that students’ family background might have deteriorated on average. Students may increasingly be lacking many of the basic capabilities required for a successful education and may thus be increasingly expensive to educate. Such effects may play a significant role in countries with a large inflow of immigrant students or with rising levels of poverty. But on average, parents in the considered countries have been enjoying higher incomes and better education over time, and the number of children per family has declined. Hence by the later periods, children may actually start schooling with better basic capabilities than before. These issues, however, await thorough econometric analysis.

19
teacher ratios, but Hanushek and Kimko (2000) find no such relationship.28 However, country-level analysis may suffer from aggregation bias (Hanushek, Rivkin, and Taylor (1996)), as Fertig and Wright (2005) show that the probability of finding statistically significant and correctly signed class-size effects increases with the level of aggregation. Student-level analyses that use data on the actual size of the class of the tested students, rather than ratios of teachers to students at some level, tend to find counterintuitive signs of the coefficient on class size that are often statistically significant (e.g., Woessmann (2003b); Fuchs and Woessmann (2007); Table 4 above).
The latter studies also take indicators of the shortage of instructional material, usually reported by school principals, into account. Shortage of material tends to be negatively associated with student outcomes. Measures of instruction time also tend to be significantly related to achievement. By contrast, in multivariate analyses the availability of computers at school is not related to student outcomes, and intensive computer use is negatively related to test scores (Fuchs and Woessmann (2004)).
In the student-level studies, measures of teacher education tend to show positive associations with student achievement in cross-country analyses. Drawing on information from teacher background questionnaires in TIMSS, Woessmann (2003b) finds positive associations of student achievement with teacher experience and female gender and a negative one with teacher age. In their country-level analysis, Lee and Barro (2001) find a positive effect of teacher salary levels. Similarly, Woessmann (2005b) reports a significant positive coefficient on a country-level measure of teacher salary when added to an international student-level regression. Dolton and Marcenaro-Gutierrez (2010) pool country-level data from international tests in 1995-2006 to show that teacher salaries – both when measured in absolute terms and relative to wages in each country – are positively associated with student achievement, even after controlling for country fixed effects.
In sum, the general pattern of the cross-country analyses suggests that quantitative measures of school inputs such as expenditure and class size cannot account for the cross-country variation in educational achievement. By contrast, several studies tend to find positive associations of student achievement with the quality of instructional material and the quality of the teaching force. While these cross-country associations reveal to what extent different input factors can descriptively account for international differences in student achievement, studies that focus more closely on the identification of causal effects have reverted to using the within-country variation in resources and achievement. This literature is most advanced for the estimation of class-size effects. In the following, we discuss three approaches that have been suggested to estimate causal class-size effects on international data: a combination of school fixed effects with instrumental variables, a regression discontinuity approach that makes use of variation stemming from maximum class-size rules, and a subject fixed effects approach.
4.3.2 Evidence within Different Countries
The initial within-country studies, reviewed in Table 7, have used conventional least-squares techniques to focus on developing countries and their comparison to developed countries, a
28 Using country-level data for data envelopment analysis, Afonso and St. Aubyn (2006) find indications of substantial inefficiencies in the use of teachers per student in most countries.

20
particular advantage of using international data. Relying on data from early international tests, Heyneman and Loxley (1983) suggested that school resources tend to be more closely related to student achievement in developing countries than in developed countries. Hanushek and Luque (2003) did not corroborate this conclusion using the more recent TIMSS data. Michaelowa (2001) uses the regional PASEC data to provide conventional evidence for five countries in Francophone Sub-Saharan Africa.29
The problem with such conventional estimates is that resources in general, and class sizes in particular, are not only a cause but also a consequence of student achievement or of unobserved factors related to student achievement. Many features may lead to the joint and simultaneous determination of class size and student achievement, making class size endogenous to student achievement. For example, schools may reduce class sizes for poorly performing students and policymakers may design compensatory funding schemes for schools with large shares of students from poor backgrounds (see West and Woessmann (2006) for international evidence). In both cases, class sizes are allocated in a compensatory manner, biasing the class-size coefficient upwards. In contrast, policymakers may also have high-performing students taught in special small classes to support elite performance. Likewise, parents who particularly care for the education of their children may both make residential choices to ensure that their children are taught in schools with relatively small classes and support their children in many other ways, leading them to be relatively high performers. In these cases, class sizes are allocated in a reinforcing manner, biasing the class-size coefficient downwards. In short, parents, teachers, schools, and administrators all make choices that might give rise to a non-causal association between class size and student achievement even after controlling extensively for family background. Conventional estimates of class-size effects may thus suffer from endogeneity bias, the direction of which is ambiguous a priori.
To identify causal class-size effects, two quasi-experimental strategies have been applied to the international test data (cf. Woessmann (2005b)). The first quasi-experimental approach draws on exogenous variation in class size caused by natural fluctuations in the size of subsequent student cohorts of a school (similar to Hoxby (2000)). In this case, the quasi-experiment results from the idea that natural fluctuations in student enrollment lead to variations in average class size in two adjacent grades in the same school. Natural birth fluctuations around the cut-off date that splits students into different grade levels occur randomly. Therefore, they lead to variation in class size that is driven neither by students’ educational achievement nor by other features that might jointly affect class size and student achievement.
Woessmann and West (2006) develop a variant of this identification strategy that exploits specific features of the TIMSS database. The sampling design of the first TIMSS study, which tested a complete 7th-grade class and a complete 8th-grade class in each school, enables them to use only the variation between two adjacent grades in individual schools. This strategy aims to exclude biases from nonrandom between-school and within-school sorting through a combination of school fixed effects and instrumental variables using grade-average class sizes as instruments. The rationale of this approach is as follows. Any between-school sorting is eliminated in a first step by controlling for school fixed effects, restricting the analysis solely to
29 Using PIRLS data, Woessmann (2010a) estimates a quasi-value-added model, controlling for retrospective information on pre-school performance, for primary-school students in two Latin American and several comparison countries.
21
variation within individual schools. Within schools, the allocation of students to different classes in a grade may also be non-random. Within-school sorting is filtered out in a second step by instrumenting actual class size by the average class size in the relevant grade in each school. Within-school variation in class size is thus used only insofar as it is related to variation in average class size between the 7th and 8th grade of a school. The identifying assumption is that such variation is not affected by student sorting but reflects random fluctuations in birth-cohort size between the two grades in the catchment area of each school. Thus, causal class-size effects are identified by relating differences in the relative achievement of students in 7th and 8th grade within individual schools to that part of the between-grade difference in class size in the school that reflects between-grade differences in average class size.
Figure 5 illustrates the basic intuition behind this identification strategy for the example of math achievement in Singapore. The top panel indicates that class-average test scores are positively associated with class size, as is the case in most countries – likely reflecting ability sorting of students between and within schools. The middle panel plots the achievement difference between the 7th-grade and 8th-grade class in each school against the same grade difference in class size, which is equivalent to including school fixed effects in a regression framework. Overcoming effects of between-school sorting by removing any difference in overall achievement levels between schools, the size of the positive correlation is reduced substantially, but remains statistically significant. The reduction suggests that poorly performing students tend to be sorted into schools with smaller classes in Singapore. The final step of the identification strategy, illustrated in the bottom panel, additionally eliminates any effects of within-school sorting by using only that part of the between-grade variation in actual class sizes that can be predicted by variation in grade-average class sizes. The picture suggests that class size has no causal effect on student achievement in math in Singapore. Rather, weaker students seem to be consistently placed in smaller classes, both between and within schools.
Woessmann and West (2006) implement this identification strategy in microeconometric estimations of education production functions for 11 countries around the world.30 In line with Figure 5, their results suggest that conventional estimates of class-size effects tend to be severely biased. They find sizable beneficial effects of smaller classes in Greece and Iceland, but reject the possibility of even small effects in four countries and of large beneficial effects in an additional four countries. Additional specification tests support the identifying assumption that students and teachers are not systematically sorted between grades within individual schools. There are no systematic differences at all in the observable characteristics of students or teachers between the two grades in schools in which one of the two adjacent grades has substantially larger average class sizes than the other; there are no systematic differences in the estimated class-size effects between expanding, stable, and contracting schools; and there are no systematic differences in the estimated class-size effects between countries where 7th grade is the first grade of a particular school and countries where it is not so that grade-average class sizes might have been adjusted based on schools’ experience with the particular students.
The basic pattern of results is corroborated by a second quasi-experimental identification strategy based on rule-induced discontinuities. Following the study by Angrist and Lavy (1999)
30 Additional evidence based on the same identification strategy for countries in West Europe, East Europe, and East Asia is presented in Woessmann (2005b), Ammermueller, Heijke, and Woessmann (2005), and Woessmann (2005a), respectively.

22
for Israel, Woessmann (2005b) exploits the fact that many countries have maximum class-size rules that induce a nonlinear association between the number of students in a grade of a school and average class size. In particular, the association has sharp discontinuities at multiples of the maximum class size that can be exploited to identify variation in class sizes that is exogenous to student achievement. The TIMSS data suggest that 10 West European school systems implement national maximum class-size rules reasonably strictly and with enough sharpness to enable an empirical implementation of this instrumental variable strategy.31 In all 10 countries, results from identification by rule-induced discontinuities rule out the possibility of large causal class-size effects in lower secondary school. The only statistically significant, but small estimates are, again, in Iceland and, marginally, in Norway.
Woessmann (2005b) shows that these results are robust to several specification tests. Some models control for peer effects, in terms of the mean achievement and family background of each student’s classmates, to exclude bias from peer sorting. Controlling for any continuous association between grade enrollment and student achievement by adding enrollment in the specific grade and its squared term as additional controls does not lead to substantive changes in results. When applying the specification to a discontinuity sample of students whose grade enrollment is within a margin of plus or minus 5 or 6 students of the rule-based discontinuities, so that identification does not come from observations far off the discontinuities, the instrument gets weak in about half the countries, while results remain robust in the other half. Excluding especially large schools in each country (of a size three or four times the maximum class size) does not lead to a substantive change in results.32
However, as discussed by Woessmann (2005b), some reservations remain with this regression-discontinuity identification strategy (cf. also Urquiola and Verhoogen (2009)). In particular, intentional exploitations of the rule by systematic between- and within-school choices might lead to remaining endogeneity in the rule discontinuity approach. Thus, it is possible that parents and schools “play the system”: parents particularly keen to ensure low class sizes for their children may make their enrollment decisions – and school principals their acceptance decisions – on the basis of expected class size, and those decisions may be related to student achievement. Still, in the end both quasi-experimental identification strategies come to a very similar pattern of results. Moreover, the source of the potentially remaining biases differs in the two cases, adding confidence that any remaining bias in each strategy is of second-order magnitude.
Both identification strategies reach the conclusion that class size is not a major force in shaping achievement in lower secondary school in any of the countries considered. There is no single country for which any of the specifications showed a statistically significant and large class-size effect. In every case where one of the methods leads to a reasonably precise estimate, a large effect size can be ruled out with considerable statistical confidence. There is only one country, Iceland, where results create confidence that a causal class-size effects exists. However, in both specifications the estimates are relatively small and estimated precisely enough to reject the possibility of a large effect.
31 The ten West European school systems that employ maximum class-size rules are: Denmark, France, Germany, Greece, Iceland, Ireland, Norway, Spain, Sweden, and Switzerland. 32 The size of the induced discontinuity in class size is smaller when grade enrollment is larger.

23
The unique value of cross-country research, however, lies in analyses of whether the cross-country differences in estimated class-size effects are systematically related to underlying features of the school systems. Such analyses can improve our understanding of the particular circumstances under which class sizes matter or not. Although causal class-size effects are small at best in all the countries considered, there are still differences across countries. The international evidence shows that the estimated effect size does not vary systematically for children from differing family backgrounds or for countries with different levels of average achievement, economic development, average class size, or educational spending (Woessmann and West (2006); Woessmann (2005b)). But the existence of class-size effects is systematically associated with the salary and education level of the teaching force. In both studies, class-size effects were detected only in countries with relatively low teacher salaries and education. The pattern is similar within countries in which the education level of teachers varies. In these countries, the estimated class-size effect tends to be larger in classes that are taught by teachers with lower education. Interpreting average teacher salary and teacher education as proxies for average teacher quality, the results suggest that relatively capable teachers do as well when teaching large classes as when teaching small classes. By contrast, less capable teachers do not seem to be up to the job of teaching large classes, while doing reasonably well in small classes. Consequently, the pattern of international effect heterogeneity suggests that class-size effects occur only when the quality of the teaching force is relatively low.
A third approach to the identification of causal class-size effects tries to avoid bias from non-random sorting of students by using variation within individual students. If the same student is taught two different academic subjects in differently sized classes, the within-student between-subject variation can be used for identification (cf. Dee (2005); Dee and West (2008)). The inclusion of student fixed effects, implemented by differencing across subjects, effectively excludes bias from subject-invariant student, family, and school characteristics, observable and unobservable. Unobserved characteristics that vary by subject and are correlated with class size, such as subject-specific fast-track or enrichment classes or teacher characteristics, could, however, still bias this research design. Altinok and Kingdon (2009) implement this identification strategy to estimate class-size effects in up to 45 countries using TIMSS 2003 data, which provide test scores in math and science for each student. Their results provide little support for class-size effects, with only few countries showing significant and sizeable positive effects of smaller classes. Analyzing the cross-country variation in class-size effects, they confirm that class-size effects are larger where teacher qualifications are lower, and also find indication of larger class-size effects in developing countries.
Beyond class-size effects, Ammermueller and Dolton (2006) use the same cross-subject identification strategy to estimate the effect of teacher-student gender interaction in England and the United States using TIMSS and PIRLS data. In most specifications (with the exception of one in England), they find little evidence of a significant effect of the interaction between student and teacher gender on student achievement. Schwerdt and Wuppermann (2009) use the same cross-subject identification with student fixed effects to identify the effects of teaching practices on TIMSS data in the United States. At a more descriptive level, Bratti, Checchi, and Filippin (2008) use the PISA data to estimate the association of student achievement with cooperative and competitive attitudes towards learning at the individual and school level.
All in all, the international evidence on the role of school inputs in educational production provides little confidence that quantitative measures of expenditure and class size are a major

24
driver of student achievement, across and within countries. Studies using different methods to identify causal class-size effects consistently find no strong effects of class size in most countries. The cross-country pattern suggests that class size is a relevant variable only in settings with low teacher quality. Descriptive evidence suggests that measures of the quality of inputs and, in particular, teachers are more closely related to student outcomes. However, research in this area awaits more work to identify the underlying causal links.
4.4 Institutions Motivated by the poor results on school inputs, research has increasingly focused on
whether non-resource institutional features of school systems affect student outcomes. In this topic, the particular opportunity of cross-country research comes into play: The chief advantage of the international comparative approach stems from its ability to exploit the substantial variation in national education policies across countries (cf. Woessmann (2007b)). By contrast, within-country studies are usually restricted to analysis of much more limited variation in institutional structure. Moreover, by drawing on wider and long-established institutional variation between countries, the international approach can capture general-equilibrium effects of institutional settings, which will not necessarily be the case when a specific educational reform is introduced only on a small scale, or only very recently. Such long-term general-equilibrium effects are usually the ones that economic theory stresses as being particularly important, because persistent institutional changes will alter incentives and thus behavior. By changing prices, available alternatives and competitive pressures for other market participants will have effects on market outcomes beyond the people specifically treated.
Since cross-country studies can address the most obvious issues of selection into treatment by using average measures of institutions at the systemic level, the main challenge for the identification of causal effects lies in unobserved country heterogeneity. Institutions may be correlated with other, unobserved country characteristics that are related to student achievement. While still in its infancy, several methods have been developed to address this problem, tailored to specific worries related to each specific institution. As will be discussed below, the range includes fixed effects for world regions to eliminate the most basic cultural differences; within-country identification where different education systems exist within one country (holding constant differences in language, legal structures, and cultures); differences-in-differences models that identify effects from changes between grades within each country; and the use of historical instruments that gave rise to arguably exogenous variation in institutional structures today.
The following review is structured around five institutional features that have attracted the most attention in the international literature so far: accountability measures, school autonomy, competition and private involvement, school tracking, and the pre-primary education system. It closes with more explorative studies into education beyond the school level and less formal, cultural features of societies. Table 8-10 provide details on the individual studies analyzing institutional features. Table 8 reports evidence within different countries and the other two tables report cross-country evidence. Given that different institutional features tend to be related both to the level and to the equity of outcomes, Table 9 focuses on achievement levels, and Table 10 on the equity of achievement.

25
4.4.1 Accountability
Analyses of the impact of curriculum-based external exit exam (CBEEE) systems illustrates the unique power of international production function estimates to address important policy-relevant issues.33 By signaling student achievement to potential employers on the labor market and institutions of higher education, external school-leaving exams increase students’ rewards for learning as well as parents’ scope for monitoring the education process, so that they can be understood as an accountability devise. (See Bishop (2006) for a discussion of the underlying theoretical concepts).
Students in countries that have external exit-exam systems very consistently perform significantly and substantially better on the international student achievement tests than students in countries without external exit-exam systems (see Table 9). Using country-level data, John Bishop has shown this for the 1991 IAEP math, science, and geography tests (Bishop (1995), section 4), the 1991 SIRS reading test (Bishop (1999)), the 1995 TIMSS math and science tests (Bishop (1997)), and the PISA 2000 reading, math, and science tests (Bishop (2006), section 3). Microeconometric cross-country analyses that extensively control for family-background and school-input factors at the student level have confirmed this result for the 1995 TIMSS tests (Woessmann (2001, 2003b)), the 1999 TIMSS-Repeat tests (Woessmann (2003a)), the 2000 PISA tests (Woessmann (2005c); Fuchs and Woessmann (2007)), and the 2003 PISA tests (Woessmann, Luedemann, Schuetz, and West (2009); see Table 4). Taken as a whole, the existing cross-country evidence suggests that the effect of external exit exams on student achievement may well be larger than a whole grade-level equivalent, or between 20 and 40 percent of a standard deviation of the respective international tests.34
Beyond external exit exams, student achievement in PISA 2000 is also positively associated with teachers’ monitoring of student progress by regular standardized tests (Fuchs and Woessmann (2007)). Richer data on additional accountability mechanisms available in PISA 2003 (documented in Table 4) reveal positive associations of student achievement with accountability measures aimed at teachers, such as internal and external monitoring of teacher lessons, and with accountability measures aimed at schools, such as assessments used to compare them to district or national achievement (Woessmann, Luedemann, Schuetz, and West (2009)).
Given the cross-sectional nature of identification, possible unobserved country heterogeneity related to the existence of external exit exams is a concern. To exclude the possibility that external exit exams just capture general cultural features of different world regions, Woessmann (2003a) shows that results are robust to a regional fixed effects specification that controls for indicators of nine world regions. To ensure that the results do not capture other features of centralization, results also prove robust to including controls for the centralization of school curricula and textbook approval, the share of central government financing, and ethno-linguistic fractionalization as a proxy for the homogeneity of a country’s population.
33 We concentrate on accountability for achievement that comes through exit exams, because understanding this topic requires analyses spanning jurisdictions with and without such institutions, making it a natural topic for use of international assessments. Of course, many analyses of accountability systems in general have proceeded within individual countries; see Hanushek and Raymond (2004) and Figlio and Loeb (2010). 34 Schneeweis (2010) finds that across countries, central exit exams are negatively related to the achievement gap between migrants and natives.

26
Substantial cultural biases are also ruled out by the fact that the same positive association between central exams and student achievement is found within countries where some regions have external exam systems and other not. Such cross-regional studies exist for Canadian provinces (Bishop (1997)), German states (Jürges, Schneider, and Büchel (2005); Woessmann (2010b)), and U.S. states (Bishop, Moriarty, and Mane (2000). Woessmann (2010b) even shows that the estimated size of the effect of external exit exams does not differ significantly between the sample of German states and the sample of OECD countries. To probe causality further, Jürges, Schneider, and Büchel (2005) apply a differences-in-differences approach to the German TIMSS 1995 data that exploits the fact that in some secondary-school tracks, the states with central exit exams have them in math but not in science, finding smaller but still substantial effects.35
Woessmann (2005c) exploits the student-level variation within each country to analyze whether external-exam effects are heterogeneous along several dimensions in quantile regressions and interacted specifications. Results using the TIMSS, TIMSS-Repeat, and PISA tests suggest that the effect tends to increase with student ability but does not differ with most family-background measures. It increases during the course of secondary education and with regular standardized examination. Furthermore, as discussed below, the effects of external exams are complementary to several dimensions of school autonomy.
4.4.2 Autonomy
Another institutional feature that is sometimes argued to exert positive effects on student outcomes is school autonomy, because local decision-makers tend to have superior information. On the other hand, in decision-making areas where their interests are not strictly aligned with improving student achievement, local decision-makers may act opportunistically unless they are held accountable for the achievement of their students (see Woessmann (2005c) for a discussion in a principal-agent framework).
The school background questionnaires of the international tests allow deriving measures of school autonomy in several different decision-making areas. The general pattern of results (cf. Table 9) is that students perform significantly better in schools that have autonomy in process and personnel decisions (Woessmann (2003b); Fuchs and Woessmann (2007); Woessmann, Luedemann, Schuetz, and West (2009)). These decisions include such areas as deciding on the purchase of supplies and on budget allocations within schools, hiring and rewarding teachers (within a given budget), and choosing textbooks, instructional methods, and the like. Similarly, students perform better if their teachers have both incentives and the possibility to select appropriate teaching methods. By contrast, school autonomy in budget formation and teacher autonomy over the subject matter to be covered in class – two decision-making areas that are likely subject to substantial opportunism but little superior local knowledge – are negatively associated with student achievement.
The international evidence also points to a significant interaction of the effect of school autonomy with the extent of accountability in the school system (as previously found in Table 4).
35 This approach assumes that there are no spillovers between achievement in math and in science. Jürges and Schneider (2010) find positive effects of central exit exams on student achievement, but negative effects on self-reported student attitudes toward math, across German states.

27
In some areas, autonomy is negatively associated with student achievement in systems that do not have external exit exams, but the association turns positive when combined with external-exam systems. Reflecting coefficient estimates from a student-level international education production function using the combined TIMSS and TIMSS-Repeat data, Figure 6 depicts school autonomy over teacher salaries as one such example. School autonomy over teacher salaries is negatively associated with student achievement in systems without external exams. However, in line with the arguments above, the average level of student achievement is higher in systems with external exams. But what is more, the association between school autonomy and student achievement turns completely around in systems with external exams: Salary autonomy of schools is positively associated with student achievement in external-exam systems. The estimates in Figure 6 are expressed in percentages of a standard deviation on the international test scores, suggesting that the achievement difference between the best and worst institutional setting amounts to three quarters of a standard deviation, a huge effect compared to other educational interventions. Evidence from PISA 2000 corroborates this interaction pattern (Fuchs and Woessmann (2007)). Similar positive interactions between external exams and school autonomy have also been found for such decision-making areas as school autonomy in determining course content and teacher influence on resource funding, among others (see Woessmann (2005c) for details).
In light of economic theory, this pattern of results is intuitively appealing. It indicates that local autonomy can lead to worse student outcomes if schools do not face incentives to focus attention on these outcomes. By contrast, when external exams hold schools accountable for student achievement, school autonomy leads to better outcomes. However, methodologically the existing empirical evidence on school autonomy is descriptive and awaits additional work that tries to more explicitly identify exogenous variation in school autonomy.36
4.4.3 Competition from Private Schools
A third institutional feature that has been researched using international data is the relative performance of publicly and privately operated schools and the competition introduced by the latter. (For a general overview of school competition, see Hoxby (2003) and Rouse and Barrow (2009)).
A first approach is to estimate differences in student achievement between public and private schools in each country, after controlling extensively for student and school background information. The PISA school background questionnaire provides specific school-level information on public versus private management and financing. Public school management is defined as schools managed directly or indirectly by a public education authority or governing board appointed by government or elected by public franchise, whereas private school management is defined as schools managed directly or indirectly by a non-government organization, for example churches, trade unions, or businesses. The share of public funding of each school is reported as the percentage of total school funding coming from government sources (at different levels), as opposed to such private contributions as fees and donations.
36 At the level of higher education, Aghion et al. (2007) and Aghion (2008) provide descriptive evidence that university autonomy is associated with better outcomes in terms of research rakings.

28
Looking across all countries (Table 8), private school management tends to be positively associated with student achievement, with a difference to publicly operated schools of 16-20 percent of an international standard deviation in the three subjects in PISA 2000 (Fuchs and Woessmann (2007)). A similar result is found in PISA 2003 (Woessmann, Luedemann, Schuetz, and West (2009)). The pattern is not uniform across countries, however, as revealed when estimating the effect within countries (Woessmann (2009b)). Toma (1996) (see also Toma (2005)) similarly estimates the effect of private school operation in five countries using the 1981 SIMS, noting that the positive effect of private provision is independent of whether the countries tend to finance the schools publicly or not. Estimating the effect of private school operation in eight countries in PISA 2000, Vandenberghe and Robin (2004) find positive effects only in some countries, but they do not account for differences in the source of school funding. Using the same database and distinguishing between privately operated schools that do and do not depend on government funding, Corten and Dronkers (2006) find a positive association of the achievement of students with low socio-economic status with private government-dependent schools, but no significant differences between public and private-independent schools. Dronkers and Robert (2008) find that the better performance of government-dependent private schools can be accounted for by a better school climate.
Using school-level variation of public-private operation in a pooled sample of countries, Woessmann, Luedemann, Schuetz, and West (2009) find positive interactions between private school operation and the average extent of autonomy that schools have in a country. Privately operated schools perform better if schools in the system are autonomous in formulating the budget and in staffing decisions, suggesting that the incentives created by parental choice of private schools work particularly well if (private and public) schools in the system have autonomy to respond to the parental demands. Furthermore, they show that the association of student achievement with two measures of external accountability – the monitoring of teacher lessons by external inspectors and assessment-based comparisons of schools to national performance – is stronger in privately operated schools than in publicly operated schools. Private schools may thus benefit particularly from the accountability created by external inspection and performance comparisons with other schools.
Given the problem of non-random selection into private versus public schools within a country, these results based on micro-level variations within countries should be interpreted with caution. While many features of self-selection will be held constant by the extensive family-background controls that most of the studies contain, possible unobserved student heterogeneity may still raise concerns of selection bias. Because issues of self-selection cancel out at the country level, the cross-country estimation approach provides the possibility to address selection concerns by measuring private schooling as a share at the country level. In addition, in contrast to most within-country studies, studies that measure private-school shares at the country level are able to capture general-equilibrium effects that may arise from private competition. If the existence of private alternatives exerts competitive pressure on nearby public schools, both private and public schools may perform at a higher level due to larger private shares. Consequently, there may be important effects of private schools at the system level even if there is no performance difference between private and public schools at the school level.
Studies that include country-level measures of private school operation (Table 9) consistently find a strong positive association with student achievement (see Woessmann (2003b) for TIMSS 1995; Woessmann (2009b) for PISA 2000; and Woessmann, Luedemann,

29
Schuetz, and West (2009) for PISA 2003). At the same time, the measure of private funding shares available in PISA is negatively associated with student achievement. This pattern is depicted in Figure 7 and Table 4, which show that students in countries that combine relatively high shares of private operation with relatively high shares of public funding perform highest among the different operation-funding combinations, while students in countries that combine public operation with private funding perform lowest. On average, the difference between the countries at the first and ninth decile on the international distribution – 60 percentage points in terms of private operation and 45 percentage points in terms of government funding – can account for roughly 0.35 standard deviations in educational achievement each.
The results point towards the importance of distinguishing between the operation and funding dimensions of private involvement. Without public funding, poor families may be constrained in their choices because they do not have the financial means to opt for private schooling. In this case, public funding may help families to exert their choices in terms of privately managed schools. The fact that public funding is positively associated with student achievement may thus also point to positive performance effects of school choice and competition. This line of reasoning is consistent with evidence in Woessmann (2009b) showing that at the school level, the advantage of privately operated schools over publicly operated schools is particularly strong in countries with large shares of public funding. It is also in line with the finding of Woessmann, Luedemann, Schuetz, and West (2009), who show that students in countries where public funding is equalized between privately and publicly operated schools perform significantly better than students in countries where privately operated schools receive less government funding than publicly operated schools. Thus, a level playing field between public and private schools in terms of government funding may be an important ingredient for the competitive effects of private schools to emerge.
Beyond choice created by private schools, Woessmann, Luedemann, Schuetz, and West (2009) do not find significant associations on average of student achievement with proxies for choice among public schools, such as the share of students in a country who do not attend their school because it is the local school and who report that they attend their school because it is better than alternatives. But within urban areas where there are schools to choose from, reduced local attendance and increased choice of better schools are associated with better student achievement. Using sub-national regional variation in PISA 2003, Sprietsma (2008) finds a positive association of student achievement with the regional average of students reporting to attend their school because it is known to be a good school, which is interpreted as a measure of quality-based school choice.
Combining German state-level data with data for OECD countries, Woessmann (2010b) shows that the association of private school shares with student achievement is not statistically different between the sample of German states and the sample of OECD countries. The result suggests that the international finding is not driven by major cultural differences between countries.
But there are additional challenges to causal identification of the effect of private competition. Omitted variables may be correlated with both the extent of private schooling and student achievement, such as factors related to the demand for private schooling or institutional or policy factors that affect its supply. Moreover, even well-controlled comparisons of countries or regions with small and large private sectors will be biased to the extent that low-quality public schools increase demand for private schooling as a substitute. To address these concerns, West

30
and Woessmann (forthcoming) develop an instrumental variable identification that exploits the fact that resistance of the Catholic Church to the state schooling emerging in the 19th century has repercussions for the size of the private school sector today. This historical source of variation can be used as a natural experiment to identify exogenous variation in private school competition. The instrumental-variable specification uses the share of Catholics in 1900 – interacted with an indicator for Catholicism not being the state religion, as Catholics had no need to opt out of the state school system if the Church could control it – as an instrument for current private-school shares. The historical nature of the instrument allows controlling directly for any effect that the current Catholic share has on student achievement.
Estimating richly controlled student-level international education production functions on the PISA 2003 data, West and Woessmann (forthcoming) confirm a significant positive effect of the share of privately operated schools on student achievement in math, science, and reading. The fact that the current share of Catholics, a control in some of their model, is negatively related to student achievement suggests that distinctive cultural features of traditionally Catholic countries are unlikely to be driving the results. The validity of the identification is additionally corroborated by the fact that Catholic shares are historically related to lower literacy and lower GDP per capita. To account for other possible channels through which the historical prevalence of Catholicism might be related to student outcomes today, the models also control for current GDP per capita and educational spending per student. Additional specification tests show that other current outcomes that might be conceived to be related to historical Catholicism, such as the decentralization of school policy decision-making, public social spending, and income inequality, are in fact uncorrelated with historical Catholic shares. West and Woessmann (forthcoming) also show that much of the positive effect of private school shares accrues to students in public schools. This suggests that the overall effect is not simply due to privately operated schools being more effective, but rather reflects general-equilibrium effects of private competition. Finally, private competition is also found to reduce educational expenditure per student in the system, so that the better educational outcomes are obtained at lower cost.
As the overview in Table 10 shows, a topic that emerged only relatively recently in the international literature is the question to which extent institutional features of the school systems can account for differences in the equity (rather than level) of student achievement across countries. A consistent pattern in this literature is that shares of privately operated schools and shares of public funding are not only associated with higher levels of student achievement, but also with a reduced dependence of student achievement on socio-economic background. This has been shown both for the books-at-home indicator of family background in TIMSS and TIMSS-Repeat (Schuetz, Ursprung, and Woessmann (2008)) and for an index of socio-economic background in PISA 2003 (Woessmann, Luedemann, Schuetz, and West (2009), chapter 7).37 In addition, Woessmann, Luedemann, Schuetz, and West (2009) find that a higher difference between private and public schools in the share of government funding is negatively associated not only with average student achievement, but also with equality of educational opportunity.
37 Ammermueller (2005) finds a negative association of the share of private schools with his measure of equality of opportunity, but this may be due to the fact that the model does not control for public versus private funding of schools.

31
4.4.4 Tracking
Another institutional feature of school systems that has been discussed mostly in terms of the equity of student outcomes is tracking. Here, tracking is meant to refer to the placement of students into different school types, hierarchically structured by performance. Such school placement policies are variously called tracking, streaming, ability grouping, or selective (as opposed to comprehensive) schooling. From a theoretical viewpoint, the effects of educational tracking are controversial: Depending on the nature of peer effects assumed, homogeneous classes may contribute to optimal learning situations for all students through focused curricula and adequate progress, or weaker groups may be systematically disadvantaged if they are separated early on.38 Countries differ widely in the age at which they first track children into different types of schools. In the majority of OECD countries, tracking takes place at the age of 15 or 16, with no tracking until grade 9 or 10. In contrast, some countries undertake the first tracking at the age of 10. Again, this international variation lends itself particularly well to analyze the effects of the institutional feature of tracking (cf. Woessmann (2009a)).
Hanushek and Woessmann (2006) develop an international differences-in-differences approach to identify the causal effect of early tracking in a cross-country setting (cf. Table 10). The basic idea starts with the fact that in all countries, students are taught in a uniform school type for the first four years of schooling. Therefore, a comparison of the change in educational inequality between 4th grade and the end of lower-secondary school between countries with and without early tracking can provide information on possible impacts of tracking. The analysis takes out the general level of inequality and considers only the change in inequality that occurs after 4th grade to determine the effect of early tracking. This method basically involves an investigation of the relationship depicted in Figure 8. The figure shows the inequality in reading achievement in 4th grade (in PIRLS) and at age 15 (in PISA 2003) for all countries that participated in both studies, measuring educational inequality by the standard deviation in student test scores. The essence of the analysis is to compare the change in inequality that occurs from primary to lower-secondary school between countries with and without educational tracking during this period. When looking at the change between the achievement dispersion in PIRLS and PISA, that part of the inequality measured at the end of lower-secondary school that already existed in 4th grade is eliminated. The change is indicated by the lines that connect the two points of each country. For countries with early tracking, solid connecting lines are used, while dashed lines indicate countries without early tracking. It is clearly visible that nearly all black solid lines point upwards whereas nearly all red dashed lines point downwards: In countries with early tracking, inequality increases systematically, whereas it decreases in countries without tracking.
Hanushek and Woessmann (2006) confirm this graphic depiction in country-level econometric estimates based on a differences-in-differences approach: The difference between countries with and without early tracking is investigated in terms of the difference in inequality between primary and lower-secondary school. The results show that early tracking systematically increases the inequality of student achievement. In total, their analyses take into account eight pairs of tests in primary and secondary schools, combining a total of 176 country
38 Here we concentrate entirely on tracking that occurs between schools, i.e., where children are sorted into separate schools. Many countries of the world, including the U.S., pursue tracking within schools but not generally across schools. For more on within-school tracking, see Betts (2010).

32
observations. In contrast to the results on inequality, the results on achievement levels are less clear. But there is little evidence that early tracking increases the achievement level. To the contrary, in the most comprehensive model there is a marginally significant negative effect of early tracking on the average achievement level. When evaluating achievement at different percentiles of the performance distribution, not even for the best 5 percent of students is there a positive effect of early tracking.
While this investigation considers the dispersion of student achievement, Schuetz, Ursprung, and Woessmann (2008) investigate the more direct measure of inequality of opportunity outlined above: the extent to which individual student achievement depends on the family background of the student. At a more descriptive level, the effect of early tracking on equity is identified by the interaction of the country-level measure of early tracking with the student-level measure of family background in a student-level model with country fixed effects. The measure of inequality of opportunity familiar from Figure 2 above is found to be significantly smaller, the later the tracking age of students. If tracking is postponed by four years, for example, the impact of family background on student achievement is smaller by one quarter of the entire impact of the family background averaged across the OECD countries. In a model without country fixed effects, the association between early tracking and the average achievement level is statistically insignificant and negative.
The same association between tracking and equality of opportunity is found in a related study using PISA 2003 data (Woessmann, Luedemann, Schuetz, and West (2009), chapter 7). Using the Index of Economic, Social, and Cultural Status (ESCS) provided by the PISA study as an alternative measure for family background, the qualitative results are the same: The association between test scores and family background is significantly smaller, the higher the age of first tracking. This association is depicted in Figure 9: In countries with earlier tracking, the achievement difference between children with different socio-economic backgrounds is considerably larger. As the figure reveals, this effect arises primarily from the fact that children with low socio-economic status in countries without early tracking perform considerably better. At the same time, children from families with a relatively high socio-economic status perform at approximately the same level. Accordingly, the effect of later tracking on the average achievement level is again positive, albeit not statistically significant.
In terms of the equity effects, Ammermueller (2005) reports similar results for the number of school types (rather than the age of first tracking) based on the international PIRLS and PISA data. Waldinger (2006) uses a combination of the approach of Hanushek and Woessmann (2006) and Schuetz, Ursprung, and Woessmann (2008) and tends to find statistically insignificant results, but this may be largely due to limited degrees of freedom in samples of only 8-14 countries and a less informative tracking measure. Brunello and Checchi (2007) use the international approach described here for results beyond school age, finding that tracking increases the effect of family background on earnings in the labor market. Using a similar approach, Schneeweis (2010) finds some indication that an index of between-school social segregation, presumably partly caused by early tracking, is positively associated with the achievement gap between migrants and natives across countries.
Using system-level data, Woessmann (2010b) pools German states (most of which track after 4th grade, but some of which track after 6th grade) with OECD countries in a sample of 42-54 observations. Results indicate that the negative association between early tracking and the measure of inequality of educational opportunity (the slope of the socio-economic gradient) is

33
statistically indistinguishable between the sample of German states and the sample of OECD countries. This shows that the cross-country association cannot be accounted for by such country-level omitted factors as differences in culture, language, or legal background.
4.4.5 Pre-primary Education System
The fact, discussed above, that student achievement is strongly associated with family background is suggestive of the idea that learning in the formative years before formal schooling is important for ultimate academic achievement. Consequently, student achievement towards the end of compulsory school is not only related to features of the school system, but also to pre-school education (see the conceptual discussion in Cunha, Heckman, Lochner, and Masterov (2006) and Blau and Currie (2006) for a general review of the empirical literature). In line with this reasoning, Schuetz, Ursprung, and Woessmann (2008) find a positive association of student achievement in 8th grade (in TIMSS and TIMSS-Repeat) with the usual duration of the pre-school cycle in a country.
Schuetz (2009) uses the individual-level information on pre-primary attendance available in PISA 2003 to show that pre-primary attendance is positively associated with achievement at age 15 in most countries. She goes on to exploit the fact that the size of this association varies substantially across countries. Estimating a cross-country student-level specification with country fixed effects and interactions between individual pre-primary attendance and country-level indicators of the quality of pre-primary education, she finds that the achievement gap between students who did and did not attend pre-primary education is positively associated with country-level measures of per-student spending in pre-primary education, of the share of pre-primary institutions being privately operated, and of the training level and relative pay of pre-primary teachers. Thus, indicators of institutions and structural quality of pre-primary education systems can account for variation in the estimated coefficients on pre-primary attendance across countries. While the study is descriptive in the sense that individual pre-primary attendance may not be conditionally random, the estimators of interest are unbiased by selection decisions as long as the selection process is the same in all countries. In this sense, under the assumption that that enrollment in pre-primary education follows the same rules in all countries, interacted specification can be interpreted as an international differences-indifferences approach.
In terms of equity, using the interacted specification described above, Schuetz, Ursprung, and Woessmann (2008) show that the association between socio-economic background and 8th-grade student achievement is negatively related to the duration of pre-primary education in a country. Furthermore, the thus measured equality of educational opportunity follows an inverted U-shaped relationship with pre-school enrollment: The association between the books-at-home measure of socio-economic background and TIMSS student achievement increases up to a pre-primary enrollment rate of 60 percent in a country and decrease beyond that threshold. This result pattern may indicate that initially, children who are otherwise advantaged attend pre-primary education. Only once most of a country’s children attend pre-primary institutions does pre-primary attendance increase equality of educational opportunity for children from lower socio-economic backgrounds. Using a similar approach to focus on equality of educational opportunity between native and migrant children, Schneeweis (2010) finds that the migrant achievement gap is negatively associated with pre-primary enrollment across countries.

34
4.4.6 Additional Results
Apart from the five institutions discussed so far – accountability, autonomy, competition, tracking, and pre-primary system – descriptive studies have also looked beyond school age and into less formal institutional settings of societies. Cascio, Clark, and Gordon (2008) focus on the education system beyond the school level by observing age profiles of literacy into adulthood using the IALS adult achievement test. They show that countries with higher university graduation rates have larger literacy gains into adulthood. Guiso, Monte, Sapienza, and Zingales (2008) show a negative country-level association of the achievement gap between boys and girls in PISA 2003 with several indicators of a gender-equal culture such as indices of cultural attitudes towards women, female economic activity, and women’s political empowerment. These suggestive findings warrant further rigorous testing.
4.5 Conclusions on the Determinants of International Educational Achievement The economic literature on determinants of international differences in educational
achievement has applied two main approaches. The first approach exploits the cross-country variation for identification of cross-country associations. The second approach estimates the same association within different countries in order to enhance understanding of whether a factor’s importance differs systematically in different settings. Part of the existing work is descriptive in nature, estimating the association of student achievement with certain factors after controlling for the rich set of possible inputs into educational production available in the international background data. But quasi-experimental work has been developed to identify some of the underlying causal mechanisms both in the cross-country and in the within-country approach.
On family background and school inputs, the international results tend to mirror the existing national evidence on educational production. Many dimensions of students’ family background are important factors for their educational achievement. At the same time, it is hard to find evidence of substantial positive effects of most resource inputs, in particular class sizes and expenditure levels. Among school inputs, there is somewhat more indication of positive effects of measures capturing teacher quality, such as (in an international setting) teacher education. A particular opportunity of the international research is that it can unveil whether certain effects differ systematically across countries, such as class-size effects or the equality of educational achievement for students with different family or migration backgrounds. For example, the international pattern suggests that significant class-size effects are only present in systems with relatively low teacher quality. This result raises the cost-effectiveness question of whether student achievement is best served by reducing class size or by increasing the low teacher quality even in the countries where class-size effects are present.
The second particular opportunity of the international research is the substantial institutional variation that exists across countries. The international evidence on education production functions suggests that schools matter for student outcomes, but not so much in terms of traditional inputs. Instead the impact of schools comes through teacher quality and institutional structures that determine incentives. Institutional features of school systems can account for a substantial part of the cross-country variation in student achievement. In the school system, institutions that tend to be associated with higher achievement levels include accountability measures like external exit exams, school autonomy in process and personnel decisions (if

35
combined with accountability), private-school competition, and public financing. Later tracking, public funding, and private operation are systematically related to the equality of student outcomes. While some of the evidence is descriptive, convincing causal identification has been developed that support the results on external exit exams, private-school competition, and tracking. Also beyond the school system, institutions of the pre-school and post-school education systems are related to international differences in educational achievement. In particular, more extensive pre-primary education systems relate to more equalized student achievement for children from different family and migration backgrounds, and measures of pre-primary quality tend to be related to the size of the pre-primary effect.
As more and more countries participate in the international tests, the opportunities grow for future research on the determinants of international educational achievement. With the additional variation, the international research will be able to draw on more experience with different institutions and start to analyze additional specific features beyond the broad concepts of institutional structures analyzed so for. There is also considerable scope for future research to advance identification in quasi-experimental research settings. Furthermore, as more regular tests with reasonable comparability over time become available, a panel structure of international tests emerges that provides longitudinal information within countries. This will allow future research to exploit educational reforms in different countries over time. A limiting factor remains the lack of individual-level panel data in the international tests.
5. Economic Consequences of International Educational Achievement
Turning to the economic consequences of educational achievement, the international achievement data permit several types of studies that are impossible when relying on skill information for a single country. First, at the individual level it is possible to investigate whether the translation of skills into earnings differs across a range of countries. While there are many studies of schooling and earnings within individual countries, it is impossible to make reliable comparisons across countries without common skill measures for the different countries. And without such comparisons, it is not possible to understand how economic institutions and market forces affect the returns to skills. Second, it is impossible to understand fully how these same forces enter into the determination of earnings distributions of countries. While it is possible to trace the evolution of the income and earnings distributions over time within a country, it is very difficult to understand how differences in the structure of the country’s economy enter into the observed distributional outcomes. Finally, effects of labor-force skills on aggregate economic outcomes essentially demand cross-country data so that outcomes can be related to varying structures. Work on each of these areas is evaluated in the subsequent sections.
5.1 Cognitive Skills and Individual Labor-Market Outcomes
Evaluating the impact of cognitive skills on individual earnings has always been difficult because of data availability issues. Most work in earnings determination has relied just on school attainment – in large part because individual earnings and school attainment are frequently collected together in population censuses. Thus, for example, the world survey of Psacharopoulos and Patrinos (2004) provides estimates of basic Mincer earnings functions for 98

36
separate countries.39 But it is much less common to measure both cognitive skills and labor-market outcomes within the same survey.40 Cognitive skills are typically measured for students in school, and thus generally before any labor-market outcomes can be observed. The most common joint measurement of skills and wages comes from panel data that covers both schooling periods and subsequent labor-market experiences, and these are invariably available for just individual countries.41
One innovation in international surveys is to sample adults of different ages instead of using a school-based or cohort-based design. The first international survey of this type was the International Adult Literacy Survey (IALS), a set of surveys and tests given to 20 countries between 1994 and 1998. This focus was very different than the school-based international tests because it considered a labor force centered survey that covered adults (age 16-65). The tests employed were also unique, covering several functional areas including: Prose Literacy – the knowledge and skills needed to understand and use information from texts including editorials, news stories, poems, and fiction; Document Literacy – the knowledge and skills required to locate and use information contained in various formats, including job applications, payroll forms, transportation schedules, maps, tables, and graphics; and Quantitative Literacy – the knowledge and skills required to apply arithmetic operations, either alone or sequentially, to numbers embedded in printed materials, such as balancing a checkbook, calculating a tip, completing an order form, or determining the amount of interest on a loan from an advertisement. They were designed to be very practical.42
All of the existing comparative analyses rely on data from the IALS survey (Table 11).43 By linking labor-market outcomes to comparably measured cognitive skills, direct international comparisons and analyses are possible.44
39 The model of earnings determination by Mincer (1970, 1974) relates the logarithm of earnings to years of schooling, potential experience, potential experience squared, and possibly other control variables; see equation (4) below. The coefficient on school attainment is frequently interpreted as the rate of return to a year of schooling, although this interpretation is challenged by Heckman, Lochner, and Todd (2006, 2008). In our analysis below, we do not interpret the common estimates as a rate of return but instead simply think of them as the earnings gradient that is associated with schooling or higher cognitive skills. 40 We focus exclusively on cognitive skills, although others have pointed to the role of non-cognitive skills. Non-cognitive skills, while seldom precisely defined, include a variety of interpersonal dimensions including communications ability, team work skills, acceptance of social norms, and the like. Along such a line, Samuel Bowles and Herbert Gintis and more recently James Heckman and his co-authors have argued that non-cognitive skills are very important for earnings differences. The early work along these lines includes Bowles and Gintis (1976) and Bowles, Gintis, and Osborne (2001). This is extended in a variety of ways in Cunha, Heckman, Lochner, and Masterov (2006) and Heckman, Stixrud, and Urzua (2006). Nonetheless, no consistent international data have been available on non-cognitive skills. 41 Because of our focus on international comparative analyses, we do not review the work related to individual countries. For a review of the role of cognitive skills on earnings determination within individual countries, see Hanushek and Woessmann (2008). 42 The tests on the IALS surveys are identified as being very practical, but they have been shown to be closely related to the PISA scores for individuals. For individual performance on the prose literacy scale, the correlation with PISA is 0.85 (Yamamoto (2002)). 43 The follow-on Adult Literacy and Life Skills Survey (ALLS), conducted in 2002-06, has not been used, in part because only five countries participated. A second follow-up by the OECD, the Programme for the International Assessment of Adult Competencies (PIAAC), promises an expansion of participating countries when it is initially administered in 2011.

37
The clearest example of the possibilities can be found in Leuven, Oosterbeek, and Ophem (2004). They consider a simple question of whether underlying supply and demand for skills could explain the pattern of observed wage differentials in countries. This work was partly motivated by an earlier study by Blau and Kahn (1996), which suggested that returns to school attainment across countries did not reflect supply and demand conditions. Leuven, Oosterbeek, and Ophem (2004) use the skill measures from the IALS survey for 14 countries. By comparing the relative demand for skill categories across industries in each country to the aggregate supply of these skill groups, they find that wage patterns are indeed consistent with a simple supply-demand model, at least for lower and intermediate skill categories. This analysis highlights the necessity of having cross-country information to address questions about overall economic structures.
The typical international study of individual earnings emulates wage determination models employed in studies of individual economies, although here the interpretation becomes more difficult because of concerns about quality differentials. By far the most common model of individual earnings is the “Mincer earnings model”, which can be thought of as a specialized form of equation (1). In this, the standard estimation model takes the form:
(4) 20 1 2 3 4y b b S b Exp b Exp b W υ= + + + + +
where Exp is labor-market experience, W is a vector of other measured factors affecting incomes, and y is labor-market earnings, typically measured in logarithms. One can think of this as estimating equation (1) where S is simply substituted as the measure of human capital (H). But, according to equation (2), the estimated return to a year of schooling (b1) is biased through the correlation of S with F, A, and any omitted elements of Z; examples of such correlation would be predicted in standard optimizing models of the choice of years of schooling (e.g., Card (1999); Glewwe (2002)). Recognizing this, significant attention has concentrated on ability bias arising from the correlation of school attainment with A and from other selection effects having to do with families and ability (see Card (1999)).
One set of typical estimates of earnings models adds test-score measures to the Mincer model in equation (4) explicitly to control for ability differences. The international versions of these can be found in Denny, Harmon, and Redmond (2000) and Denny, Harmon, and O’Sullivan (2004). Their focus is largely on how inclusion of IALS test scores in equation (4) alters the estimates of b1.
The second issue beyond general concerns about omitted variables bias in equation (4) is that most formulations of Mincer models assume that school quality is either constant or can be captured by addition of direct measures of school quality such as school resources in equation (4). One extended version is to assume that cognitive skills is a measure of school quality – leading to estimating models that either add cognitive skills to equation (4) or interact cognitive skills with school attainment.
But both approaches neglect the importance of non-school influences on cognitive skills, particularly from the family. These factors have been well documented within the literature on
44 Other researchers have used single-country samples from IALS to investigate labor-market issues, but we do not include them in our evaluation of the cross-country uses of the data. See, for example, Oosterbeek (1998), McIntosh and Vignoles (2001), and Edin and Gustavsson (2008).

38
education production functions, and recognition of them provides the backdrop for the formulation in equation (2).45 If the vector of other factors, W, in the earnings model includes the relevant other influences on human capital from equation (2), the estimate of b1 would be simply φγ (as long as school quality is constant).46 Unfortunately, rich information about other determinants of skills outside of school attainment is seldom available, because this requires data about factors contemporaneous with schooling and long before observed labor-market data are available. While a number of ingenious approaches have been used, including for example exploiting the common experiences of twins, it is seldom plausible to conclude that the other factors in equation (2) have been adequately controlled, leading to the interpretation of b1 as the combined influence of school and correlated but omitted other influences.47 As such, b1 is a reduced-form coefficient that will give biased estimates of the potential impact from a policy designed to change school attainment alone.
An alternative conceptual approach is simply to take the measure of cognitive skills as a direct measure of human capital. While this appears similar in some ways to the classic estimation of Mincer equations except that cognitive skills (C) are employed instead of school attainment (S), it has some potential advantages, because it implicitly subsumes the various (unmeasured) determinants of human capital in equation (2).
This suggests the following modification of equation (4), which is a reduced-form equation that combines influences of cognitive factors through the channels of C and S:
(5) ' ' ' ' 2 ' '0 1 2 3 4 5 'y b b S b Exp b Exp b W b C υ= + + + + + +
In this formulation, estimation of equation (5) with the inclusion of C yields an implication that the coefficient on S (i.e., '
1b ) would reflect the impact of human capital differences that are not captured by C.48 Yet, for the same reasons discussed previously, '
1b would not be simply φγ . It is still biased by other omitted determinants of C, such as the family, described in equation (2).
It is important to note, nonetheless, that finding a direct effect of schooling on earnings to be zero ( '
1 0b = ) after conditioning on cognitive skills is not the same as saying that school attainment does not matter. It merely says that the impact of school comes entirely through the
45 See, for example, the discussion in Hanushek (1979). 46 While equation (2) highlights measurement error and its sources, the historical treatment has concentrated almost exclusively on simple misreporting of years of schooling, as opposed to potential omitted variables bias from neglecting (correlated) components of the true skill differences contained in H. See, for example, Ashenfelter and Krueger (1994). In our context, simple survey errors in S are a relatively small part of the measurement errors and omissions in specifying human capital. 47 In terms of equation (2), studies using schooling and income differences of twins (see Card (1999)) assume that school quality differences are relatively unimportant or unsystematic so that quantity of schooling, S, is the central object. Then, if ability, family circumstances, and other factors affecting skills are relatively constant across twins, differences in schooling can be related to differences in earnings to obtain an unbiased estimate of γ. Of course, the key question remaining is why S differs across otherwise identical twins who presumably face identical investment payoffs. Other instrumental variable approaches have also been introduced to deal with the endogeneity of schooling, but they frequently will suffer if human capital evolves from non-school factors as in equation (2). 48 Heckman and Vytlacil (2001) go further to argue that it is not possible to separate school attainment and achievement because they are so highly correlated. The importance of this depends, however, on the specific data samples and questions being investigated.

39
impact on cognitive skills, so that schooling that does not raise cognitive skills is not productive. In general, the impact of school attainment is:
(6) ' '1 5/ ( / )y S b b C S∂ ∂ = + ∂ ∂
What does this mean in an international context? First, as discussed previously, it does not make much sense to combine the estimates of earnings models across countries, because it is inappropriate to assume that the rate of learning during a year of school is the same across countries. It also implies that it is difficult to compare international returns to school attainment, since the estimated returns are dependent on country-specific elements including school quality, the importance of other determinants of skills, and the rewards for differing levels of schooling.
The pattern of returns to cognitive skills across countries can be seen from estimating equation (5) for the sample of countries in the IALS survey. Hanushek and Zhang (2009) provide estimates of '
5b for 13 separate countries, which exhibit wide variation, as shown in Figure 10. Each standard deviation of test performance is associated with almost 20 percent higher annual earnings in the U.S. but less than 5 percent in Sweden and is actually insignificantly different from zero in Poland. (Note, however, that the Polish survey was conducted in 1994, and its economy had yet to adjust completely from the fall of communism).
The IALS survey permits direct investigation of the importance of omitted factors from equation (2) when estimating Mincer models. Obtaining unbiased estimates of the return to school attainment within different countries has consumed considerable attention, but little work has actually combined the determinants of achievement with the estimation of equation (4). Figure 11 illustrates the impact on estimated schooling parameters from including information about an individual’s family background and cohort-specific measures of health and ability.49 From this figure, it is apparent that the average returns to attainment fall significantly (from 0.071 to 0.044) while the variation across countries is also lessened considerably. These adjustments are also more significant than is typical in the literature concerned with the estimation of returns to schooling (Card (1999)).
The study of substantive economic policy issues is also aided by having international data for individuals with comparable skills. In work consistent with the discussion here, Kahn (2004) takes cognitive skills measured by IALS test scores as a consistent measure of human capital and focuses directly on inter-country differences in immigrants. His comparison of the labor-market employment rates of immigrants in four different developed countries shows variations in labor-market assimilation (that largely remain unexplained). In a second international study, Kahn (2007) defines skill categories of workers by the IALS cognitive-skills tests in order to look at the distributional impacts of varying employment protection laws across countries – a subject that cannot be easily researched within countries because of the uniformity of the laws within a country. He finds that low-skill workers are pushed from permanent jobs to temporary jobs by more stringent employment protection laws.50
49 One element of the analysis in Hanushek and Zhang (2009) is the adjustment of school attainment for variations in school quality over time (for each country separately). They find that many countries have had significant changes in quality (generally improvements in quality) over time, but the U.S. is an exception to this. 50 Similar impacts are also seen for youth and for immigrants in the seven countries analyzed (Canada, Finland, Italy, the Netherlands, Switzerland, the United Kingdom and the United States).

40
Finally, while it is too early to see the full range of possibilities, some individual countries have followed earlier PISA test takers or have merged data from PISA with other existing data such as that from country registers. These studies, because they build on either the PISA-2000 or the PISA-2003 data and have relatively short transitions since age 15 when the students were tested, have looked largely at school transitions and movements into first jobs.51 A common finding of these studies is that performance on the international tests is predictive of entry into higher education. Nevertheless, since these have been the uncoordinated work of individual countries, there is neither consistent data outside of PISA nor any commitments to continue these datasets into the future. Thus, these uses appear to be idiosyncratic to individual countries and do not easily support cross-country analyses.
5.2 Cognitive Skills and the Distribution of Economic Outcomes
One implication of the impact of cognitive skills on individual earnings is that the distribution of those skills in the economy will have a direct effect on the distribution of income. Cognitive skills by themselves do not of course determine the full distribution, because other factors such as labor-market institutions, taxes, and the like enter. But the importance of skills is becoming increasingly evident.
Very suggestive evidence on the impact of skills on the income distribution comes from Nickell (2004). Nickell, using the IALS data, considers how differences in the distribution of incomes across countries are affected by the distribution of skills and by institutional factors including unionization and minimum wages. While union coverage is statistically significant, he concludes that “the bulk of the variation in earnings dispersion is generated by skill dispersion” (page C11).52
The impact of the skill distribution across countries is shown dramatically in Figure 12 which is derived from a simple comparison of the dispersion of wages and the dispersion of prose literacy scores (each measured as the ratio of the 90th to the 10th percentile). The tight pattern around the regression line reflects a simple correlation of 0.85 (which is not affected by including the other institutional factors).
There are of course many reasons to be concerned about this aggregate descriptive comparison, and other authors have pursued more systematic analysis of the variation in earnings using the micro data. Table 12 lists three existing studies that contrast the distribution of earnings in the U.S. with that in one or more other countries and that employ IALS data to define the underlying distribution of skills. Blau and Kahn (2005) provide the most comprehensive study where the U.S. is compared to nine other countries, and earnings are decomposed following the general approach of Juhn, Murphy, and Pierce (1993). They reach two general
51 See, for example, studies in Canada (Knighton and Bussière (2006); Bushnik, Barr-Telford, and Bussière (2004)), Denmark (Jensen and Andersen (2006); Humlum, Kleinjans, and Nielsen (2010)), and Switzerland (Bertschy, Cattaneo, and Wolter (2009)). Follow-up data collection is also being developed in Australia and in the Czech Republic, although analyses using these data are currently unavailable. See also the summary of databases and analyses in Organisation for Economic Co-operation and Development (2007), p. 300. 52 De Gregorio and Lee (2002) find a (somewhat weaker) positive association between inequality in years of schooling and income inequality.

41
conclusions that provide a useful link to the previous analyses of earnings determination.53 First, variations in cognitive skills are indeed a component of the observed earnings distribution, explaining 3-13 percent of variations in earnings depending on gender and the specific distributional measure, but they are not the dominant determinant. Second, differences in prices, i.e., the rewards to differences in skills, explain a considerably larger part of the observed variation: 28-55 percent.
The results of the decomposition into skills and prices by Blau and Kahn (2005) are consistent with the relatively small explanatory power of skills in the more restricted analyses of Freeman and Schettkat (2001) and Devroye and Freeman (2001) and lead to questions about how to interpret Figure 12. The argument of Nickell (2004) is that skill distributions and not labor-market institutions are the dominant determinant of earnings variations, but this conflicts with the analyses of micro data from the same survey.
The reconciliation of Figure 12 with the micro analyses is straightforward at one level. The results from the previous section described differences in returns to cognitive skills and school attainment (Figures 10 and 11). These prior results show vividly that the prices of skills vary widely across countries. Moreover, there is a strong positive association of the estimated returns for cognitive skills in Figure 10 and the magnitude of test-score inequalities in Figure 12. Thus, the skill differences and the price differences reinforce each other to yield that almost linear relationship of skill variations and earnings variations in Figure 12.
The deeper question revolves around what aspects of labor markets lead to these price differences, which in turn appear so important in explaining earnings distributions. The analysis of Leuven, Oosterbeek, and Ophem (2004) focused on how the relative supplies and demands for skills were key, while Blau and Kahn (2005) suggest that other institutional features of the labor markets may be as important if not more important.54 Moreover, the variations in skills themselves may feed back into the character of the labor market and the observed skill prices.
These analyses underscore the value of expanding the international component of various investigations of labor markets. The role of supply and demand conditions, of market institutions, and of governmental policy in determining skill prices and distributional issues remains a rather open and fertile ground for further investigation – and it has obvious ramifications for a variety of actively discussed governmental policies.
5.3 Cognitive Skills and Macroeconomic Growth
Macroeconomists have long been interested in the factors that contribute to the growth of nations. Economists have considered the process of economic growth for much of the last 100
53 A third conclusion of Blau and Kahn (2005) is the suggestion that a significant effect of school attainment (while also conditioning on cognitive skills) in their statistical analysis introduces some question about the use of cognitive skills as the only index of human capital as done by Leuven, Oosterbeek, and Ophem (2004). 54 Note that Nickell (2004) attempted to address the issue of other institutional features with simple cross-country regressions that added unionization and minimum-wage restrictions and concluded that it was just the skill distribution that was important. In the formulation of Leuven, Oosterbeek, and Ophem (2004) or of Blau and Kahn (2005), however, the linear model would be inappropriate since the returns to skills are themselves a function of features of the labor market, including possibly the employment restrictions.

42
years, but most studies remained as theory with little empirical work.55 Over the past two decades, economists linked analysis much more closely to empirical observations and in the process rediscovered the importance of growth.
Human capital has been a central focus of much of the recent growth modeling, and it is a standard element of any empirical work. The empirical macroeconomic literature focusing on cross-country differences in economic growth has overwhelmingly employed measures related to school attainment, or years of schooling, to test the predictions of growth models.56 Initial analyses employed school enrollment ratios (e.g., Barro (1991); Mankiw, Romer, and Weil (1992); Levine and Renelt (1992)) as proxies for the human capital of an economy. An important extension by Barro and Lee (1993, 2001) was the development of internationally comparable data on average years of schooling for a large sample of countries and years, based on a combination of census and survey data.
The vast literature of cross-country growth regressions has tended to find a significant positive association between quantitative measures of schooling and economic growth.57 But, average years of schooling are a particularly incomplete and potentially misleading measure of education for comparing the impacts of human capital on the economies of different countries. It implicitly assumes that a year of schooling delivers the same increase in knowledge and skills regardless of the education system. For example, a year of schooling in Peru is assumed to create the same increase in productive human capital as a year of schooling in Japan. Additionally, this measure assumes that formal schooling is the primary (sole) source of education and, again, that variations in non-school factors – such as included in equation (2) – have a negligible effect on education outcomes and human capital. This neglect of cross-country differences in the quality of education and in the strength of family, health, and other influences is probably the major drawback to employing such attainment measures of schooling. It also highlights the potential role for using the international data on cognitive skills described in section 3 above.
The empirical inconsistencies arising from explaining growth with school attainment are well-described in Pritchett (2004, 2006). In simplest terms, positive trends in schooling attainment around the world and especially in developing countries have not been matched by changes in growth rates, suggesting problems with either the underlying conceptual model or with the measurement of human capital.
5.3.1 Aggregate Measures of Cognitive Skills A clear way to deal with the human capital measurement issues is to introduce information
from the international achievement tests, paralleling the use of the cognitive-skills measures in the IALS surveys in analyzing patterns of earnings determination. There are two issues that are
55 For an account of the historical development, see Barro and Sala-i-Martin (2004). The associated empirical work concentrated on within-country analyses such as Solow (1957), Jorgenson and Griliches (1967), or Denison (1985). A concise review of alternative models and the associated empirical testing can be found in Hanushek and Woessmann (2008). 56 The earliest studies used adult literacy rates (e.g., Azariadis and Drazen (1990); Romer (1990)) but these data cover a limited number of countries and are error prone. 57 For extensive reviews of the literature, see, e.g., Topel (1999), Temple (2001), Krueger and Lindahl (2001), Sianesi and Van Reenen (2003), and Pritchett (2006).

43
important in developing suitable data for macroeconomic analyses. First, each of the testing situations is a separate activity with no general attempt to provide common scaling. Second, the relevant feature for considering growth is clearly the skills of the labor force of a nation, but the international tests described previously provide data on the current school population.
The aggregation of prior test information to create a composite for each country involves empirical calibration.58 To understand the basic approach, we sketch the approach in Hanushek and Woessmann (2009a) that was used to produce the score aggregates in the final column of Table 3 and that enters into several of the recent cross-country analyses.59
As shown in Table 1, there are data from international student achievement tests on twelve major international testing occasions before 2005. The individual testing situations contain separate tests in different subjects and at different age groups. These testing occasions yield 36 separate test-subject-age observations, each providing internationally comparable performance data for between 11 and 45 participating countries. Most of the tests were conducted by the IEA, with the exception of the OECD-conducted PISA tests. Hanushek and Woessmann (2009a) describe in detail a methodology for making the separate testing data comparable, which we sketch here.
The methodology involves adjusting both the level of test performance and the variation of test performance through two data transformations. Because the United States has both participated in all of the international tests and has maintained its own longitudinal testing (the National Assessment of Educational Progress, or NAEP), the U.S. international performance over time can be calibrated to this external standard – thus benchmarking each of the separate international tests to a comparable level. This provides a relative comparison of countries taking each test over time, but it is also necessary to establish the variance on the tests so that direct compatibility of countries taking different tests can be established. The calibration of the dispersion of the tests relies on holding the score variance constant within a group of countries with stable education systems (defined in terms of secondary school attendance rates) over time. For this, Hanushek and Woessmann (2009a) use the thirteen OECD countries who had half or more students completing upper secondary education around the beginning of international testing in the 1970s as the “stable” country group, and standardize variances to their group performance on the 2000 PISA tests.
These two normalizations of the separate test data provide the basis for comparing and aggregating the available test data. The simple average of the transformed mathematics and science scores over all the available international tests in which a country participated provides the most straightforward combination of the data. The test instruments yield a total of 77 countries, indicated in the final column of Table 3, that have ever participated in any of the
58 Empirical scaling as described here relies upon information about the overall distribution of scores on each test to compare national responses. This contrasts with the psychometric approach to scaling that calls for calibrating tests through use of common elements on each test. More recent testing, such as the PISA tests by the OECD, are constructed so that they can be consistent over time through using common questions to link tests in different years. A few of the available studies use data from a single testing occasion and thus do not have to aggregate scores; see Lee and Lee (1995), Coulombe, Tremblay, and Marchand (2004), and Coulombe and Tremblay (2006). 59 This construction builds on earlier attempts to develop consistent aggregates as found in Hanushek and Kimko (2000) and Barro (2001). Altinok and Murseli (2007) present a different approach but the details are unclear.

44
twelve international student achievement tests in mathematics and science through 2003.60 We scale scores to a mean of 500 with a student-level standard deviation of 100 among the OECD countries (the same scale currently used by PISA).
This procedure of averaging performance over a forty year period is meant to provide a consistently measured proxy for the educational performance of the whole labor force, because the basic objective is not to measure the skills of students but to obtain an index of the skills of the workers in a country. If the quality of schools and skills of graduates are roughly constant over time, this averaging is appropriate and uses the available information to obtain the most reliable estimate of skills. If on the other hand there is changing performance, this averaging will introduce measurement error of varying degrees over the sample of economic data. (The analysis in Hanushek and Woessmann (2009a) shows some variation over time, but its importance will clearly depend on the analytical approach and questions – a subject discussed below).
The precise scaling on the transformed metric is of course subject to considerable noise, in particular for the early tests and for countries performing far below the international mean. The tests are usually not developed to provide reliable estimates of performance in the tails of the achievement distribution, which would be relevant for very poorly performing countries. However, the rough pattern across countries of overall performance should not be severely affected by the re-scaling.
5.3.2 Evidence on the Role of Cognitive Skills in Economic Growth Empirical analyses building on aggregate measures of cognitive skills have reached
dramatically different conclusions than most of the prior growth analysis built on school attainment measures of human capital. Table 13 displays the range of studies that have considered the impacts of cognitive skills. On the whole, these contributions to empirical growth research demonstrate that better measures of human capital alter the assessment of the role of education and knowledge in the process of economic development dramatically.
Using the data from the international student achievement tests through 1991 to build a measure of labor force quality, Hanushek and Kimko (2000) – first released as Hanushek and Kim (1995) – find a statistically and economically significant positive effect of the cognitive skills on economic growth in 1960-1990 that dwarfs the association between quantity of schooling and growth.61 Thus, even more than in the case of education and individual earnings,
60 The latest rounds of PISA results, conducted in 2006 and released in December 2007 and in 2009 for release in December 2010, are not contained in our aggregations which were developed to analyze growth over the 1960-2000 period. There are five countries participating in PISA 2006 that had never participated on a previous international test. Likewise, the 2006 round of the PIRLS primary-school reading test includes three additional participants without prior international achievement data. 61 Their estimates employ a statistical model that relates annual growth rates of real GDP per capita to the measure of cognitive skills, years of schooling, the initial level of income, and a wide variety of other control variables (including in different specifications the population growth rates, political measures, openness of the economies, and the like). Hanushek and Kimko (2000) find that adding the international achievement test measures to a base specification including only initial income and educational quantity boosts the variance in GDP per capita among the 31 countries in their sample that can be explained by the model from 33 to 73 percent. The effect of years of schooling is greatly reduced by including cognitive skills, leaving it mostly insignificant in alternative specifications. At the same time, adding the other factors leaves the effects of cognitive skills basically unchanged. Their basic formulation is also applied in much of the work described below.

45
ignoring differences in cognitive skills very significantly misses the true importance of education for economic growth. Their estimates suggest that one country-level standard deviation higher test performance would yield around one percentage point higher annual growth rates. (The country-level standard deviation is roughly equivalent to half of the individual-level standard deviation on the PISA scale).
Table 13 provides short descriptions of the array of currently available models of cognitive skills and economic growth. This area is rapidly expanding, but it is valuable to assess where it currently stands.
The most current picture in Hanushek and Woessmann (2008, 2009a) expands the international student achievement tests from 31 countries in Hanushek and Kimko (2000) to 50 countries and uses more recent data on economic growth that extends the modeling to the longer time period (1960-2000).62 The basic result is reported in column (2) of Table 14 and depicted graphically in Figure 13. After controlling for the initial level of GDP per capita and for years of schooling, the test-score measure of math and science skills features a statistically significant effect on the growth in real GDP per capita for 1960-2000.63 According to this specification, test scores that are larger by one standard deviation (measured at the student level across all OECD countries in PISA) are associated with an average annual growth rate in GDP per capita that is two percentage points higher over the whole 40-year period. This quantitative result is virtually identical to that in Hanushek and Kimko (2000).
When cognitive skills are added to a model that just includes initial income and years of schooling (column (1) of Table 14), the share of variation in economic growth explained by the model (the adjusted R2) jumps from 0.25 to 0.73. As shown in the top of Figure 14, quantity of schooling is statistically significantly related to economic growth in a specification that does not include the measure of cognitive skills, but the association between years of schooling and growth turns insignificant and its marginal effect is reduced to close to zero once cognitive skills are included in the model (see the bottom of Figure 14). In other words, school attainment has no independent effect over and above its impact on cognitive skills. The result remains the same when the measure of years of schooling refers to the average between 1960 and 2000, rather than the initial 1960 value (column (3) of Table 14). In the different specifications, there is evidence for conditional convergence in the sense that countries with higher initial income tend to grow more slowly over the subsequent period.
Several intervening studies have since found very similar results (see Table 13). Another early contribution, by Lee and Lee (1995), found an effect size similar to Hanushek and Kimko
62 While more countries have test data, fifty are included in the analyses of economic growth. Twenty-five countries are not included in the growth database due to lack of data on economic output or because they drop out of the sample for a standard exclusion criterion in growth analyses (fifteen former communist countries, three countries for which oil production is the dominant industry, two small countries, three newly created countries, and two further countries lacking early output data). Two further countries (Nigeria and Botswana) turn out to be strong outliers in the growth regressions and are therefore dropped from the sample (see Hanushek and Woessmann (2009a)). The source of the income data is version 6.1 of the Penn World Tables (cf. Heston, Summers, and Aten (2002)), and the data on years of schooling is an extended version of the Cohen and Soto (2007) data which is developed from Barro and Lee (1993, 2001). 63 Another recent set of international tests has focused on reading. While the reliability of these measures is an issue, consideration of them in addition to or instead of the math and science tests does not change the basic results (see Hanushek and Woessmann (2009a)).

46
(2000) using data from the 1970-71 First International Science Study on the participating 17 countries, also leaving quantitative measures of education with no significant effect on growth. Using a more encompassing set of international tests, Barro (2001) also finds that, while both the quantity of schooling and test scores matter for economic growth, measured cognitive skills are much more important. Employing the measure of cognitive skills developed by Hanushek and Kimko (2000) in a development accounting framework, Woessmann (2002, 2003c) finds that the share of cross-country variation in levels of economic development attributable to international differences in human capital rises dramatically when cognitive skills are taken into account. Building on Gundlach, Rudman, and Woessmann (2002), this work analyzes output per worker in 132 countries in 1990. The variation that can be attributed to international differences in human capital rises from 21 percent to 45 percent once the international achievement measures are taken into account, and to over 60 percent in samples with reasonable data quality.
Extensions of the measure of Hanushek and Kimko (2000) and its imputation in Woessmann (2003c) are also used in the cross-country growth regressions by Bosworth and Collins (2003) and in the cross-country industry-level analysis by Ciccone and Papaioannou (2009). Both also find that measured cognitive skills strongly dominate any effect of schooling quantity on growth.64 Coulombe and Tremblay (2006) use test-score data from the International Adult Literacy Survey (see Section 5.1 above) in a panel of 14 OECD countries, confirming the result that the test-score measure outperforms quantitative measures of education.65 Jamison, Jamison, and Hanushek (2007) extend the Hanushek and Kimko (2000) analysis by using the mathematics component of the transformed and extended tests in Hanushek and Woessmann (2009a), replicating and strengthening the previous results by using test data from a larger number of countries, controlling for a larger number of potentially confounding variables, and extending the time period of the analysis. Using the panel structure of their growth data, they suggest that cognitive skills seem to improve income levels mainly though speeding up technological progress, rather than shifting the level of the production function or increasing the impact of an additional year of schooling.66
The collection of existing studies strongly suggests that cognitive skills are closely related to the long-run growth rates for countries. While there is some variation, the existing studies also indicate a consistency in the quantitative magnitude of effects. Simulation exercises show that this magnitude means that relatively small improvements in the skills of a nation’s labor force can have very large effects on long-run economic well-being (Hanushek and Woessmann (2010a)).
64 Note that Bosworth and Collins (2003) cannot distinguish the effect of cognitive skills from the effect of quality of government institutions. The analysis in Hanushek and Woessmann (2008) shows, however, that they can be separated when we use our new measure of cognitive skills that also extends the country sample by several additional data points on international test scores. 65 Additional details of this study can be found in Coulombe, Tremblay, and Marchand (2004). 66 A novel element of the work by Jamison, Jamison, and Hanushek (2007) is investigation of the impact of cognitive skills on changes in health outcomes across countries, which can be taken as another indicator of the welfare on nations. They find that cognitive skills have a strong impact on the decline of infant mortality rates.

47
5.3.3 Causation in a Cross-Country Framework Work on cross-country growth analysis has been plagued by legitimate questions about
whether any truly causal effects have been identified, or alternatively whether the estimated statistical analyses simply pick up a correlation without causal meaning. Perhaps the easiest way to see the problems is early discussion of how sensitive estimated growth relationships were to the precise factors that were included in the statistical work and to the country samples and time periods of the analyses (Levine and Renelt (1992); Levine and Zervos (1993)). The sensitivity of the estimated models provided prima facie evidence that various factors were omitted from many of the analyses.
Whether or not the impact of cognitive skills is a causal relationship is indeed a very important issue from a policy standpoint. It is essential to know that, if a country managed to improve its achievement in some manner, it would see a commensurate improvement in its long-run growth rate. Said differently, if the estimates simply reflect other factors that are correlated with test scores, a change in test scores may have little or no impact on the economy (unless the other factors also changed). Indeed, analysis of prior estimates of school attainment have been identified as possibly reflecting reverse causality; i.e., improved growth leads to more schooling rather than the reverse (Bils and Klenow (2000)).
It is difficult to develop conclusive tests of causality issues within the limited sample of countries included in the analysis. Nonetheless, Hanushek and Woessmann (2009a) provide initial analyses of the issue of causality between cognitive skills and growth. That study pursues a number of different approaches to ruling out major factors that could confound the results and that could lead to incorrect conclusions about the potential impact. While none of the approaches addresses all of the important issues and while each approach fails to be conclusive for easily recognized reasons, the combination of approaches eliminates a number of common concerns about the identification of a causal relationship.
First, in an extensive investigation of alternative model specifications, different measures of cognitive skills, various groupings of countries, and specific sub-periods of economic growth, the consistency of the alternative estimates – both in terms of quantitative impacts and statistical significance – indicate a robustness of estimates that is uncommon to most cross-country growth modeling. These specifications consider the timing of tests and growth in detail.67 To tackle the most obvious reverse-causality issues, one specification separates the timing of the analysis by estimating the effect of scores on tests conducted until the early 1980s on economic growth in 1980-2000. In this analysis, available for a smaller sample of countries only, test scores pre-date the growth period. Results are even stronger than using the measure based on all tests.68 In addition, reverse causality from growth to test scores is also unlikely because of the results of education production functions, discussed above, that indicate additional resource in the school
67 For example, Ramirez, Luo, Schofer, and Meyer (2006) suggest that if one looks at the recent period (1980-2000) and also drops the East Asian countries, math and science is no longer significant. However, Hanushek and Woessmann (2009a) show that the coefficient on test scores is virtually the same in their basic results as when the sample is restricted to 1980-2000 and dropping East Asian countries. Their study, which relies on the cognitive skills measures from Hanushek and Kimko (2000), is likely to suffer from a combination of measurement issues and small sample problems. 68 Similarly, the studies by Altinok (2007) and Appleton, Atherton, and Bleaney (2008) use initial test scores to predict subsequent growth in a panel framework, confirming significant growth effects of cognitive skills.

48
system (which might become affordable with increased growth) do not relate systematically to improved test scores.
The only substantial effect on the estimates is the inclusion of various measures of economic institutions (security of property rights and openness of the economy). Including measures of economic institutions, suggested for example by Acemoglu, Johnson, and Robinson (2005), does lead to a reduction in the estimated impact of cognitive skills by about one third. However, as Glaeser, La Porta, Lopez-de-Silanes, and Shleifer (2004) argue, there is a good case that human capital causes better institutions as opposed to the opposite. Thus, one could consider the estimate with institutional measures as a lower bound on any achievement effects. This estimate remains highly significant and very substantial. Furthermore, in the sample of OECD countries, where there is more limited variation in these broad institutions, the reduction is much smaller at 15 percent, and the institutional measures do not enter significantly.69
Second, an instrumental variable specification traces the impact on growth of just the variations in achievement that arise from the previously identified institutional characteristics of each country’s school system (exit examinations, autonomy, and private schooling).70 This estimated impact is essentially the same as reported in the OLS regressions, lending support both to the causal impact of more cognitive skills and to the conclusion that schooling policies can have direct economic returns.
Third, one major concern is that countries with good economies also have good school systems – implying that those that grow faster because of the basic economic factors also have high achievement. To deal with this, immigrants to the U.S. who have been educated in their home countries are compared to those educated just in the U.S. Since it is the single labor market of the United States, any differences in labor-market returns associated with cognitive skills cannot arise because of differences in the economies of their home country. Looking at labor-market returns, the cognitive skills seen in the immigrant’s home country lead to higher incomes – but only if the immigrant was educated at home. Immigrants from the same home country schooled in the U.S. receive no return to home-country quality. This difference-in-differences approach rules out the possibility that test scores simply reflect cultural factors or economic institutions of the home country.71 It also provides further support to the potential role of schools to change the cognitive skills of citizens in economically meaningful ways.
Finally, perhaps the toughest test of causality is reliance on how changes in test scores over time lead to changes in growth rates, thereby eliminating possible bias from any time-invariant country-specific economic and cultural factors. Figure 15 relates the gains in test scores over
69 Hanushek and Woessmann (2008) also find a positive interaction between cognitive skills and institutional measures, suggesting that good institutional quality and good cognitive skills can reinforce each other in advancing economic development. 70 The statistical analysis employs an instrumental variable strategy that relies upon changes in achievement induced by school structure. Its major limitation is that the instruments tend to be weak, given the small number of countries that is included. 71 Two potential problems arise in this analysis. First, it just looks at labor-market returns for individuals and not the aggregate impact on the economy of achievement differences. Second, those who migrate at a young enough age to be educated in the U.S. might differ from those who migrate at later ages; while effects of the migration age that are the same across countries are held constant in the regression, cross-country differences in age-migration patterns that are related to the quality of the home-country education system would affect the results.

49
time to the gains in growth rates over time, revealing a consistent and strong positive association.72 As with the other approaches, this analysis must presume that the pattern of achievement changes has been occurring over a long time, because it is not the achievement of school children but the skills of workers that count. Nonetheless, the consistency of the patterns and the similarities of magnitudes of the estimates to the basic growth models is striking (see Hanushek and Woessmann (2009a)).
Again, each approach to providing a deeper look at the issue of causation is subject to some real uncertainty. The simple conclusion from the combined evidence is that differences in cognitive skills lead to economically significant differences in economic growth. Nonetheless, further investigations of the causal structure of growth relationships provide an obvious field for further research. The approach in Hanushek and Woessmann (2009a) is to employ standard microeconomic approaches to the investigation of causation in the context of cross-country models. Alternative approaches could provide additional information. Similarly, expanded data samples or different model specifications may prove useful.
5.3.4 Expanding Country Samples by Regional Tests from Developing Countries A limiting factor in some of the prior analyses is the size of the samples, which in turn is
dictated by past participation in the international testing programs. This issue is especially important when looking at developing countries and at different economic regions of the world. Latin America, for example, has been a perennial concern because of its low growth and its inability to show continued development, but Latin American countries are very lightly represented in the prior testing programs.
While progress has been made, disappointment has been growing with Latin American development strategies built on schooling because expansion of school attainment has not guaranteed improved economic conditions (Easterly (2001)). In 1960, adult school attainment in Latin America was surpassed only by OECD countries and was significantly ahead of East Asia, Sub-Saharan Africa, and the Middle East and North Africa (MENA) region. Still, economic growth in Latin America since 1960 has lagged so much behind growth in East Asia and MENA that Latin American income per capita, which was considerably above the other three regions in 1960, has by now been overtaken by East Asia and MENA, leaving only Sub-Saharan Africa behind.
The poor growth performance of Latin America despite its relatively high initial schooling level remains a puzzle by conventional thinking. While economic research on Latin American growth has given much attention to institutional and financial factors (e.g., Edwards, Esquivel, and Márquez (2007) or Fernández-Arias, Manuelli, and Blyde (2005)), the basic puzzle remains unresolved.
72 Only 12 OECD countries have participated in international tests over a long enough period to provide the possibility of looking at trends in test performance over more than 30 years. The analysis simply considers a regression of test scores on time for countries with multiple observations (allowing for student age and subject of tests). The trends in growth rates are determined in a similar manner: annual growth rates are regressed on a time trend. The plot provides the pattern of slopes in the test regression to slopes in the growth-rate regression. Hanushek and Woessmann (2009a) consider more complicated statistical relationships, but the overall results hold up.

50
To compare countries within the region, Hanushek and Woessmann (2009b) make use of regional measures of cognitive skills that were designed specifically for Latin American countries. Regional achievement tests from the Laboratorio Latinoamericano de Evaluación de la Calidad de la Educación (LLECE) were conducted in 1997 and in 2006 (see Table 2). Together, the two tests cover all sixteen Latin American countries usable in analyses of national growth, which is an important expansion compared to the seven Latin American countries that ever participated in a worldwide test. Neither of the two tests is perfect for such analyses, because they measure performance just in early grades and because both are very recent. Nonetheless, these regional tests offer the possibility of explaining the large differences in growth among the countries of Latin America.
Their results using the regional test data support the important role of cognitive skills in understanding Latin American growth. These test scores are statistically and quantitatively significant in predicting economic growth differences in intra-regional growth regressions. They increase the explanatory power of standard growth models considerably and render the effect of years of schooling insignificant. Also in Latin America, schooling appears relevant for economic growth only insofar as it actually raises the knowledge that students gain as depicted in tests of cognitive skills.
Hanushek and Woessmann (2009b) also splice the regional test information into the worldwide tests discussed above. Results of the worldwide regressions extended to 59 countries confirm the consistent effect of cognitive skills. They can even resolve the Latin American growth puzzle: The poor growth performance of Latin American countries can be fully accounted for by their poor performance on student achievement tests.
This analysis suggests that an even wider set of student assessments – those included in Table 2 – can be usefully employed to understand fundamentals of the aggregate economies. The expansion of sampling, in this case to regional economies with limited participation in past tests, permits more detailed analysis than previously possible.
While part of the sampling problem is automatically being dealt with through the continued expansion from new countries added to the PISA and TIMSS programs, other issues of the appropriateness of those tests and of the ancillary survey data suggest that these other data sets should not be neglected. For example, sub-Saharan Africa is only minimally included in prior testing. Furthermore, the worldwide tests may simply be too difficult for the typical student in many countries in Latin America and sub-Saharan Africa. Because test efficiency requires the international assessments to focus testing time on discriminating performance in the vicinity of the international mean, there may not be sufficient test questions that reliably distinguish performance at the level of many developing countries. This limits the power of these tests in discriminating performance at low levels and makes intra-regional comparisons in these regions unreliable. Splicing regional tests into the worldwide tests therefore provides a viable option to expand international analysis to countries far below the mean of OECD countries.73
73 The value of regional testing programs could also be expanded substantially by ensuring that the assessments included specific linking questions with PISA and/or TIMSS. This practice would permit each country to ascertain where it stands in the world achievement rankings.

51
5.3.5 Basic Skills, Top Performance, and Growth The modeling efforts to date have concentrated most attention on mean achievement and on
the implications of overall differences in human capital. However, this sidesteps important questions facing education officials in many countries. Some argue in favor of elitist school systems which focus on the top performers as potential future managers of the economy and drivers of innovation. This approach, for example, appears to match the historic policies of India, with a set of premier engineering schools coexisting with a large illiterate population. Others favor more egalitarian school systems to ensure well-educated masses that will be capable of implementing established technologies. This approach would coincide with development policies such as the Education for All initiative (UNESCO (2005)) that concentrate on raising the skills of all to minimal levels. Do these choices have a discernible effect on aggregate economic performance?
To capture these differences in the distributional patterns of the test-score performance in different countries, Hanushek and Woessmann (2009a) use the micro data from each of the international assessments to calculate measures of the share of students in each country who reach at least basic skills as well as those who reach superior performance levels. Specifically, they use performance of at least 400 test-score points on the PISA international scale – one standard deviation below the OECD mean – as the threshold of basic literacy and numeracy and one standard deviation above the OECD as the measure of superior performance. They then employ these alternative measures of skill distribution instead of mean performance in their cross-country growth models.
Their analysis suggests that both measures of the test-score distribution are significantly related to economic growth, either when entered individually or jointly. Both the basic-skill and the top-performing dimensions of educational performance appear separately important for growth.
These early results, however, still leave open a series of analytical and policy questions. For example, while these models indicate the relative impacts of improving the different levels of performance, policies built upon these would have to use other information about the costs or feasibility of changing people at the different skill levels.
5.3.6 IQ Models An alternative perspective is that IQ differences among nations are driving the results
described previously. The potential difference from the preceding analysis is the common view that IQs are fixed and not subject to schooling or environmental influences. If true, this would suggest both that IQ measures might more accurately represent the relevant cognitive skills and the analytics of them might be less prone to the types of identification issues discussed. This fixed-factor view, often related to ideas of the high degree of heritability of IQs, of course is not the uniform view of researchers in the area. Indeed, in the economics literature, Goldberger and Manski (1995) and Heckman (1995) have clear analyses showing that families and schools have

52
strong effects on measured IQ.74 Thus, the most reasonable interpretation of IQ studies is that they apply an alternative measure of cognitive skills to the international assessments previously described.
All studies of the economic impacts of IQ are based on the international IQ scores compiled by Lynn and Vanhanen (2002, 2006).75 They have assembled data from specific national samples using a variety of measurement instruments. The earliest work by Weede and Kämpf (2002) mimics that of the work described previously (see Table 15). Similar to the analyses of cognitive skills, IQ differences have a strong and significant effect on growth rates even allowing for differences in school attainment. Jones and Schneider (2006) provide a series of robustness analyses, similar to Sala-i-Martin, Doppelhofer, and Miller (2004) with the addition of the Lynn and Vanhanen (2002) measures of IQ. They demonstrate that the IQ has a strong predictive power with economic growth. They also show that the measures are very strongly correlated with the labor-force quality measures of Hanushek and Kimko (2000). Ram (2007) estimates models similar to the augmented neoclassical production functions of Mankiw, Romer, and Weil (1992). The general conclusion is that school attainment appears less relevant when IQ measures (again from Lynn and Vanhanen (2002)) are included in the analysis. Finally, Jones and Schneider (2010) use IQ measures of skills to account for variations in immigrant wages, similar to the analyses of Hanushek and Kimko (2000) and Hanushek and Woessmann (2009a). They conclude that IQ is a powerful predictor of wages and, relatedly, that it explains a significant portion of earnings differences across countries.
The real question with these analyses is what exactly is being measured. The underlying IQ scores by country come from an idiosyncratic collection of national data that relies on specialized samples for specific cohorts and subsets of the population.76 Thus, the question that arises is how much measurement error there is in an underlying skill dimension. Hunt and Wittmann (2008) provide a direct analysis (albeit in terms of the level of GDP per capita) of the empirical value of IQ scores versus PISA scores. They conclude that PISA scores are better predictors of GDP per capita than the Lynn and Vanhanen (2002) measures of IQ. Lynn and Mikk (2007, 2009) confirm the very high correlations between IQ scores and either TIMSS or
74 Much of this recent discussion in the economics literature came in response to Herrnstein and Murray (1994), who argued that the labor-market relationships to relatively fixed IQ measures had strong implications for social policy. Much of the discussion is, of course, outside of economics. While there is ongoing controversy to how genetics and environment are seen as influencing IQ (see, for example, the exchange by Rose (2009) and Ceci and Williams (2009)), it is clear that environment can have substantial impact on measured IQ (e.g., Turkheimer et al. (2003)). Another source of discussion is the so-called “Flynn effect” where political scientist James Flynn noted that IQ scores had been rapidly rising in many nations around the world over the 20th Century. For discussions of this, see Dickens and Flynn (2001) and Flynn (2007), both of which argue that aggregate societal factors can affect the measured national data. 75 Their analyses of economic outcomes relate the level of GDP per capita to IQ scores. It is difficult to see these analyses in level form as identifying the impact of skills. Their data series, however, have been used extensively in other analyses. 76 As Hunt and Wittmann (2008) point out, concerns with the data include that values for the majority of countries are derived from an unclearly specified method drawing on data from nearby countries and that most data points are not derived from representative samples. For example, the value for Ethiopia is based on the IQ scores of a highly selected group that had emigrated to Israel, and the value for Equatorial Guinea, the lowest IQ estimate in the data, refers to a group of children in a home for the developmentally disabled in Spain.

53
PISA scores. More importantly, this analysis questions whether the simple relationships estimated in Lynn and Vanhanen (2002) are causal (as Lynn and Vanhanen (2002) assert).
The conclusion from the various models of the impact of national IQ scores on economic outcomes is that IQ provides another potential measure of cognitive skills. If accurate, the Lynn and Vanhanen IQ data provide for a considerable expansion of the sample sizes, reaching 113 nations (Lynn and Vanhanen (2006), Appendix 1). Nonetheless, most of the analyses would suggest that this measure is noticeably more error prone than the international test data stressed here. Additionally, rather than capturing innate differences, they are amenable to family and school influences – opening a similar set of identification issues as discussed here (but not addressed in these analyses).
5.4 Conclusions on the Economic Impact of Differences in Cognitive Skills
The international data on the individual returns to cognitive skills begin to paint an interesting picture of the value of human capital in the labor market – a picture going beyond the common but misleading view that only schooling attainment matters. First, while labor markets in a broad set of countries clearly reward individuals with higher skill as measured by assessments of math and science, the rewards do appear to vary significantly across countries. The underlying determinants of these differential rewards remain an important but unanswered question. Second, variations in skills within countries have clear impacts on the distribution of incomes. Here again, while the facts are relatively clear, the interaction of skills and rewards – which is a fundamental determinant of the distributional outcomes – is much less understood.
The results of growth modeling that employ measures of national cognitive skills strongly suggest that the basic human capital model is very relevant for aggregate outcomes. Variations in skills measured by international math and science tests are strongly related to variations in economic growth, and they solve many of the difficult measurement problems with the more traditional school attainment measures.
At the same time, there are many issues to be addressed in future work. Clearly the limitations of having just cross-country variations for a limited number of countries raise uncertainties with the results. Most importantly, given the myriad of differences among nations, confirming any causal impact is difficult. Each of these issues is high on the research agenda, particularly given the rapid expansion of test information from expanded new testing opportunities.
6. Conclusion and Outlook
The economic literature on international educational achievement has expanded our understanding of the determinants and economic consequences of international educational achievement tremendously. Considering that, with few antecedents, this literature is only a decade old, it has clearly covered a lot of ground and made remarkable progress. In doing so, it has exploited the possibilities opened up by the international data to raise fundamental questions, ones not amenable to any simple within-country analysis. For example, this work highlights the crucial role of educational achievement in understanding the vast international differences in economic well-being. It also begins to suggest some key factors that account for the immense international differences in educational achievement.
54
At the same time, by the very nature of the limited degrees of freedom in cross-country identification, it can mostly reveal broad patterns. At the very least, a lot of the details of specific implementation issues related to any policy application obviously must be left for national approaches.
Given its infancy, there is obviously still considerable scope for future advances in the economic literature on international evidence on educational achievement. Clear directions forward include exploring further the institutional variation and making more use of regional information, yielding larger numbers of independent observations. Interesting extensions could also go beyond general schooling to cover topics in vocational and higher education.
A topic unexplored by economists is also the international tests in non-traditional subjects, such as foreign languages, civic education, and information technology. More generally, some of the rich background information contained in the international studies could be explored further, and part of it may provide information on relevant non-cognitive skills. For example, recent work by Falck and Woessmann (2010) attempts to derive measures of entrepreneurial intentions from the international background data, and chapter 6 in Woessmann, Luedemann, Schuetz, and West (2009) explores such measures of non-cognitive outcomes as student morale and commitment, non-disruptive behavior, disciplinary climate, and tardiness. Further information on non-cognitive skills may be derived from the international background questionnaires. As a more distant outlook, international testing of non-cognitive skills would be an obvious challenge.
Methodologically, further exploration of quasi-experimental settings in the international data should be high on the agenda. When analyzing determinants of educational achievement, building panel datasets from the more extensively emerging international tests could help in this regard and allow the evaluation of educational reforms in different countries.
In the more distant future, it is tempting to envision what research will be able to do with the sort of achievement data that will be available in 20 to 30 years from now. The number of participating countries is as high as 57 in both PISA 2006 and TIMSS 2007, and more than 60 countries are currently planning to participate in the next PISA and TIMSS cycles. With these sets of comparable achievement data for extensive samples of countries being linked to subsequent economic growth, and with the emerging long panels of regular achievement data for large samples of countries, the outlook for future research in the economics of international differences in educational achievement is clearly bright.

55
References
Acemoglu, Daron, Simon Johnson, and James A. Robinson. 2005. "Institutions as a fundamental cause of long-run growth." In Handbook of Economic Growth, edited by Philippe Aghion and Steven N. Durlauf. Amsterdam: North Holland: 385-472.
Adams, Raymond J. 2003. "Response to 'Cautions on OECD's recent educational survey (PISA)'." Oxford Review of Education 29, no. 3: 377-389.
Adams, Raymond J., Alla Berezner, and Maciej Jakubowski. 2010. "Analysis of PISA 2006 preferred items ranking using the percentage correct method." OECD Education Working Paper 46. Paris: Organisation for Economic Co-operation and Development.
Afonso, António, and Miguel St. Aubyn. 2006. "Cross-country efficiency of secondary education provision: A semi-parametric analysis with non-discretionary inputs." Economic Modelling 23, no. 3: 476-491.
Aghion, Philippe. 2008. "Higher education and innovation." Perspektiven der Wirtschaftspolitik 9, Special Issue: 28-45.
Aghion, Philippe, Mathias Dewatripont, Caroline M. Hoxby, Andreu Mas-Colell, and André Sapir. 2007. Why reform Europe’s universities? Bruegel Policy Brief 2007/04. Brussels: Bruegel.
Altinok, Nadir 2007. "Human capital quality and economic growth." IREDU Working Paper DT 2007/1. Université de Bourgogne: Institute for Research in Education (IREDU).
Altinok, Nadir, and Geeta Kingdon. 2009. "New evidence on class size effects: A pupil fixed effects approach." CSAE Working Paper WPS/2009-16. Oxford: Centre for the Study of African Economies, University of Oxford.
Altinok, Nadir, and Hatidje Murseli. 2007. "International database on human capital quality." Economics Letters 96, no. 2 (August): 237-244.
Altonji, Joseph G., Todd E. Elder, and Christopher R. Taber. 2005. "Selection on observed and unobserved variables: Assessing the effectiveness of Catholic schools." Journal of Political Economy 113, no. 1 (February): 151-184.
Ammermueller, Andreas. 2007. "PISA: What makes the difference? Explaining the gap in test scores between Finland and Germany." Empirical Economics 33, no. 2: 263-287.
Ammermueller, Andreas 2005. "Educational opportunities and the role of institutions." ZEW Discussion Paper 05-44. Mannheim: Centre for European Economic Research.
Ammermueller, Andreas, and Peter Dolton. 2006. "Pupil-teacher gender interaction effects on scholastic outcomes in England and the USA." ZEW Discussion Paper 06-060. Mannheim: Centre for European Economic Research.

56
Ammermueller, Andreas, Hans Heijke, and Ludger Woessmann. 2005. "Schooling quality in Eastern Europe: Educational production during transition." Economics of Education Review 24, no. 5: 579-599.
Ammermueller, Andreas, and Jörn-Steffen Pischke. 2009. "Peer effects in European primary schools: Evidence from the Progress in International Reading Literacy Study." Journal of Labor Economics 27, no. 3: 315-348.
Angrist, Joshua D., and Victor Lavy. 1999. "Using Maimondides' rule to estimate the effect of class size on scholastic achievement." Quarterly Journal of Economics 114, no. 2 (May): 533-575.
Appleton, Simon, Paul Atherton, and Michael Bleaney. 2008. "International school test scores and economic growth." Credit Research Paper 08/04. University of Nottingham: Centre for Research in Economic Development and International Trade.
Ashenfelter, Orley, and Alan B. Krueger. 1994. "Estimates of the economic return to schooling from a new sample of twins." American Economic Review 84, no. 5 (December): 1157-1173.
Azariadis, Costas, and Allan Drazen. 1990. "Threshold externalities in economic development." Quarterly Journal of Economics 105, no. 2: 501-526.
Baker, David P. 1997. "Surviving TIMSS: Or, everything you blissfully forgot about international comparisons." Phi Delta Kappan 79, no. 4 (December): 295-300.
Barro, Robert J. 1991. "Economic growth in a cross section of countries." Quarterly Journal of Economics 106, no. 2 (May): 407-443.
———. 2001. "Human capital and growth." American Economic Review 91, no. 2: 12-17.
Barro, Robert J., and Jong-Wha Lee. 1993. "International comparisons of educational attainment." Journal of Monetary Economics 32, no. 3 (December): 363-394.
———. 2001. "International data on educational attainment: Updates and implications." Oxford Economic Papers 53, no. 3 (July): 541-563.
Barro, Robert J., and Xavier Sala-i-Martin. 2004. Economic growth. Second ed. Cambridge, MA: The MIT Press.
Becker, Gary S. 1964. Human capital: A theoretical and empirical analysis, with special reference to education. First Edition ed. New York, NY: National Bureau of Economic Research.
Bedard, Kelly, and Elizabeth Dhuey. 2006. "The persistence of early childhood maturity: International evidence of long-run age effects." Quarterly Journal of Economics 121, no. 4: 1437-1472.

57
Bertschy, Kathrin, M. Alejandra Cattaneo, and Stefan C. Wolter. 2009. "PISA and the transition into the labour market." LABOUR: Review of Labour Economics and Industrial Relations 23, Special Issue: 111-137.
Betts, Julian. 2010. "The economics of tracking in education." In Handbook of the Economics of Education, edited by Eric A. Hanushek, Stephen Machin, and Ludger Woessmann. Amsterdam: Elsevier: forthcoming.
Bils, Mark, and Peter J. Klenow. 2000. "Does schooling cause growth?" American Economic Review 90, no. 5 (December): 1160-1183.
Bishop, John H. 1995. "The impact of curriculum-based external examinations on school priorities and student learning." International Journal of Educational Research 23, no. 8: 653-752.
———. 1997. "The effect of national standards and curriculum-based examinations on achievement." American Economic Review 87, no. 2: 260-264.
———. 1999. "Are national exit examinations important for educational efficiency?" Swedish Economic Policy Review 6, no. 2: 349-398.
———. 2006. "Drinking from the fountain of knowledge: Student incentive to study and learn -- Externalities, information problems, and peer pressure." In Handbook of the Economics of Education, edited by Eric A. Hanushek and Finis Welch. Amsterdam: North Holland: 909-944.
Bishop, John H., Joan Y. Moriarty, and Ferran Mane. 2000. "Diplomas for learning, not seat time: The impact of New York Regents examinations." Economics of Education Review 19, no. 4: 333-349.
Björklund, Anders, and Kjell G. Salvanes. 2010. "Education and family background: Mechanisms and policies." In Handbook of the Economics of Education, edited by Eric A. Hanushek, Stephen Machin, and Ludger Woessmann. Amsterdam: Elsevier: forthcoming.
Black, Sandra E., Paul J. Devereux, and Kjell G. Salvanes. 2005. "Why the apple doesn't fall far: Understanding intergenerational transmission of human capital." American Economic Review 95, no. 1 (March): 437-449.
Blau, David M., and Janet Currie. 2006. "Pre-school, day care, and after-school care: Who’s minding the kids?" In Handbook of the Economics of Education, edited by Eric A. Hanushek and Finis Welch. Amsterdam: North-Holland: 1163-1278.
Blau, Francine D., and Lawrence M. Kahn. 1996. "International differences in male wage inequality: Institutions versus market forces." Journal of Political Economy 104, no. 4 (August): 791-837.

58
———. 2005. "Do cognitve test scores explain higher US wage inequality?" Review of Economics and Statistics 87, no. 1 (February): 184-193.
Bosworth, Barry P., and Susan M. Collins. 2003. "The empirics of growth: An update." Brookings Papers on Economic Activity 2003, no. 2: 113-206.
Bowles, Samuel, and Herbert Gintis. 1976. Schooling in capitalist America: Educational reform and the contradictions of economic life. New York: Basic Books.
Bowles, Samuel, Herbert Gintis, and Melissa Osborne. 2001. "The determinants of earnings: A behavioral approach." Journal of Economic Literature 39, no. 4 (December): 1137-1176.
Bratti, Massimiliano, Daniele Checchi, and Antonio Filippin. 2008. "Should you compete or cooperate with your schoolmates?" IZA Discussion Paper 3599. Bonn: Institute for the Study of Labor.
Brunello, Giorgio, and Daniele Checchi. 2007. "Does school tracking affect equality of opportunity? New international evidence." Economic Policy 22, no. 52: 781-861.
Bushnik, Tracey, Lynn Barr-Telford, and Patrick Bussière. 2004. In and out of high school: First results from the second cycle of the Youth in Transition Survey. Ottawa: Statistics Canada.
Card, David. 1999. "The causal effect of education on earnings." In Handbook of Labor Economics, edited by Orley Ashenfelter and David Card. Amsterdam: North-Holland: 1801-1863.
———. 2001. "Estimating the return to schooling: Progress on some persistent econometric problems." Econometrica 69, no. 5 (September): 1127-1160.
Cascio, Elizabeth, Damon Clark, and Nora Gordon. 2008. "Education and the age profile of literacy into adulthood." Journal of Economic Perspectives 22, no. 3: 47-70.
Ceci, Stephen J., and Wendy M. Williams. 2009. "Should scientists study race and IQ? Yes: The scientific truth must be pursued." Nature 457 (February 12): 788-789.
Ciccone, Antonio, and Elias Papaioannou. 2009. "Human capital, the structure of production, and growth." Review of Economics and Statistics 91, no. 1: 66-82.
Coleman, James S., and Thomas Hoffer. 1987. Public, Catholic, and private schools: The importance of community. New York: Basic Books.
Coleman, James S., Thomas Hoffer, and Sally Kilgore. 1981. "Questions and answers: Our response." Harvard Educational Review 51, no. 4 (November): 526-544.
Corten, Rense, and Jaap Dronkers. 2006. "School achievement of pupils from the lower strata in public, private government-dependent and private government-independent schools: A

59
cross-national test of the Coleman-Hoffer thesis." Educational Research and Evaluation 12, no. 2: 179-208.
Coulombe, Serge, and Jean-François Tremblay. 2006. "Literacy and growth." Topics in Macroeconomics 6, no. 2: Article 4.
Coulombe, Serge, Jean-François Tremblay, and Sylvie Marchand. 2004. Literacy scores, human capital and growth across fourteen OECD countries. Ottawa: Statistics Canada.
Cunha, Flavio, James J. Heckman, Lance Lochner, and Dimitriy V. Masterov. 2006. "Interpreting the evidence on life cycle skill formation." In Handbook of the Economics of Education, edited by Eric A. Hanushek and Finis Welch. Amsterdam: Elsevier: 697-812.
De Gregorio, José, and Jong-Wha Lee. 2002. "Education and income inequality: New evidence from cross-country data." Review of Income and Wealth 48, no. 3: 395-416.
Dee, Thomas S. 2005. "A teacher like me: Does race, ethnicity, or gender matter?" American Economic Review 95, no. 2: 158-165.
Dee, Thomas, and Martin West. 2008. "The non-cognitive returns to class size." NBER Working Paper 13994. Cambridge, MA: National Bureau of Economic Research (May).
Denison, Edward F. 1985. Trends in American economic growth, 1929-1982. Washington, D.C.: The Brookings Institution.
Denny, Kevin, Colm Harmon, and Vincent O’Sullivan. 2004. "Education, earnings and skills: A multi-country comparison." IFS Working Paper 04/08. London: Institute for Fiscal Studies.
Denny, Kevin, Colm Harmon, and Sandra Redmond. 2000. "Functional literacy, educational attainment and earnings: Evidence from the International Adult Literacy Survey." IFS Working Paper 00/09. London: Institute for Fiscal Studies.
Devroye, Dan, and Richard B. Freeman. 2001. "Does inequality in skills explain inequality in earnings across advanced countries?" NBER Working Paper 8140. Cambridge, MA: National Bureau of Economic Reserach.
Dickens, William T., and James R. Flynn. 2001. "Heritability estimates versus large environmental effects: The IQ paradox resolved." Psychological Review 108, no. 2: 346-369.
Dolton, Peter, and Oscar D. Marcenaro-Gutierrez. 2010. "If you pay peanuts do you get monkeys? A cross country analysis of teacher pay and pupil performance." Mimeo. London: Royal Holloway College, University of London.

60
Dronkers, Jaap, and Péter Robert. 2008. "Differences in scholastic achievement of public, private government-dependent, and private independent schools: A cross-national analysis." Educational Policy 22, no. 4: 541-577.
Easterly, William. 2001. The elusive quest for growth: An economist's adventures and misadventures in the tropics. Cambridge, MA: The MIT Press.
Edin, Per-Anders, and Magnus Gustavsson. 2008. "Time out of work and skill depreciation." Industrial and Labor Relations Review 61, no. 2: 163-180.
Edwards, Sebastian, Gerardo Esquivel, and Graciela Márquez, eds. 2007. The decline of Latin American economies: Growth, institutions, and crises. Chicago, IL: University of Chicago Press.
Entorf, Horst, and Nicoleta Minoiu. 2005. "What a difference immigration policy makes: A comparison of PISA scores in Europe and traditional countries of immigration." German Economic Review 6, no. 3: 355-376.
Falck, Oliver, and Ludger Woessmann. 2010. "School competition and students’ entrepreneurial intentions: International evidence using historical Catholic roots of private schooling." Program on Education Policy and Governance Working Paper PEPG 10-01. Cambridge, MA: Harvard University.
Fernández-Arias, Eduardo, Rodolfo Manuelli, and Juan S. Blyde, eds. 2005. Sources of growth in Latin America: What is missing? Washington, DC: Inter-American Development Bank.
Fertig, Michael, and Robert E. Wright. 2005. "School quality, educational attainment and aggregation bias." Economic Letters 88, no. 1: 109-114.
Figlio, David, and Susanna Loeb. 2010. "School accountability." In Handbook of the Economics of Education, edited by Eric A. Hanushek, Stephen Machin, and Ludger Woessmann. Amsterdam: Elsevier: forthcoming.
Flynn, James R. 2007. What is intelligence?: Beyond the Flynn effect. Cambridge, UK: Cambridge University Press.
Foshay, Arthur W. 1962. "The background and the procedures of the twelve-country study." In Educational achievement of thirteen-year-olds in twelve countries: Results of an international research project, 1959-61, edited by Arthur W. Foshay, Robert L. Thorndike, Fernand Hotyat, Douglas A. Pidgeon, and David A. Walker. Hamburg: Unesco Institute for Education.
Freeman, Richard B., and Ronald Schettkat. 2001. "Skill compression, wage differentials, and employment: Germany versus the US." Oxford Economic Papers 53, no. 3: 583-603.

61
Fuchs, Thomas, and Ludger Woessmann. 2004. "Computers and student learning: Bivariate and multivariate evidence on the availability and use of computers at home and at school." Brussels Economic Review 47, no. 3/4: 359-385.
———. 2007. "What accounts for international differences in student performance? A re-examination using PISA data." Empirical Economics 32, no. 2-3: 433-462.
Glaeser, Edward L., Rafael La Porta, Forencio Lopez-de-Silanes, and Andrei Shleifer. 2004. "Do institutions cause growth?" Journal of Economic Growth 9, no. 3: 271-303.
Glewwe, Paul. 2002. "Schools and skills in developing countries: Education policies and socioeconomic outcomes." Journal of Economic Literature 40, no. 2 (June): 436-482.
Goldberger, Arthur S., and Charles F. Manski. 1995. "Review article: The bell curve by Herrnstein and Murray." Journal of Economic Literature 33, no. 2: 762-776.
Guiso, Luigi, Ferdinando Monte, Paola Sapienza, and Luigi Zingales. 2008. "Culture, math, and gender." Science 320, no. 5880: 1164-1165.
Gundlach, Erich, Desmond Rudman, and Ludger Woessmann. 2002. "Second thoughts on development accounting." Applied Economics 34, no. 11: 1359-1369.
Gundlach, Erich, and Ludger Woessmann. 2001. "The fading productivity of schooling in East Asia." Journal of Asian Economics 12, no. 3: 401-417.
Gundlach, Erich, Ludger Woessmann, and Jens Gmelin. 2001. "The decline of schooling productivity in OECD countries." Economic Journal 111, no. 471 (May): C135-C147.
Gunnarsson, Victoria, Peter F. Orazem, and Mario A. Sánchez. 2006. "Child labor and school achievement in Latin America." World Bank Economic Review 20, no. 1: 31-54.
Hanushek, Eric A. 1979. "Conceptual and empirical issues in the estimation of educational production functions." Journal of Human Resources 14, no. 3 (Summer): 351-388.
———. 1997. "The productivity collapse in schools." In Developments in School Finance, 1996, edited by William J. Fowler, Jr. Washington, DC: National Center for Education Statistics: 185-195.
———. 2002. "Publicly provided education." In Handbook of Public Economics, edited by Alan J. Auerbach and Martin Feldstein. Amsterdam: Elsevier: 2045-2141.
———. 2006. "School resources." In Handbook of the Economics of Education, edited by Eric A. Hanushek and Finis Welch. Amsterdam: North Holland: 865-908.
Hanushek, Eric A., and Dongwook Kim. 1995. "Schooling, labor force quality, and economic growth." NBER Working Paper 5399. Cambridge, MA: National Bureau of Economic Research (December).

62
Hanushek, Eric A., and Dennis D. Kimko. 2000. "Schooling, labor force quality, and the growth of nations." American Economic Review 90, no. 5 (December): 1184-1208.
Hanushek, Eric A., Victor Lavy, and Kohtaro Hitomi. 2008. "Do students care about school quality? Determinants of dropout behavior in developing countries." Journal of Human Capital 1, no. 2 (Spring): 69-105.
Hanushek, Eric A., and Javier A. Luque. 2003. "Efficiency and equity in schools around the world." Economics of Education Review 22, no. 5 (August): 481-502.
Hanushek, Eric A., and Margaret E. Raymond. 2004. "The effect of school accountability systems on the level and distribution of student achievement." Journal of the European Economic Association 2, no. 2-3 (April-May): 406-415.
Hanushek, Eric A., Steven G. Rivkin, and Lori L. Taylor. 1996. "Aggregation and the estimated effects of school resources." Review of Economics and Statistics 78, no. 4 (November): 611-627.
Hanushek, Eric A., and Ludger Woessmann. 2006. "Does educational tracking affect performance and inequality? Differences-in-differences evidence across countries." Economic Journal 116, no. 510 (March): C63-C76.
———. 2008. "The role of cognitive skills in economic development." Journal of Economic Literature 46, no. 3 (September): 607-668.
———. 2009a. "Do better schools lead to more growth? Cognitive skills, economic outcomes, and causation." NBER Working Paper 14633. Cambridge, MA: National Bureau of Economic Research (January).
———. 2009b. "Schooling, cognitive skills, and the Latin American growth puzzle." NBER Working Paper 15066. Cambridge, MA: National Bureau of Economic Research (June).
———. 2010a. The high cost of low educational performance: The long-run economic impact of improving PISA outcomes. Paris: Organisation for Economic Cooperation and Development.
———. 2010b. "Sample selectivity and the validity of international student achievement tests in economic research." NBER Working Paper 15867. Cambridge, MA: National Bureau of Economic Research (March).
Hanushek, Eric A., and Lei Zhang. 2009. "Quality-consistent estimates of international schooling and skill gradients." Journal of Human Capital 3, no. 2 (Summer): 107-143.
Heckman, James J. 1995. "Lessons from the bell curve." Journal of Political Economy 103, no. 5 (October): 1091-1120.
Heckman, James J., Lance J. Lochner, and Petra E. Todd. 2006. "Earnings functions, rates of return and treatment effects: The Mincer equation and beyond." In Handbook of the

63
Economics of Education, edited by Eric A. Hanushek and Finis Welch. Amsterdam: North Holland: 307-458.
———. 2008. "Earnings functions and rates of return." Journal of Human Capital 2, no. 1 (Spring): 1-31.
Heckman, James J., Jora Stixrud, and Sergio Urzua. 2006. "The effects of cognitive and noncognitive abilities on labor market outcomes and social behavior." Journal of Labor Economics 24, no. 3 (July): 411-482.
Heckman, James J., and Edward Vytlacil. 2001. "Identifying the role of cognitive ability in explaining the level of and change in the return to schooling." Review of Economics and Statistics 83, no. 1 (February): 1-12.
Herrnstein, Richard J., and Charles A. Murray. 1994. The bell curve: Intelligence and class structure in American life. New York: Free Press.
Heyneman, Stephen P., and William Loxley. 1983. "The effect of primary school quality on academic achievement across twenty-nine high and low income countries." American Journal of Sociology 88, no. 6 (May): 1162-1194.
Hopmann, Stefan Thomas, Gertrude Brinek, and Martin Retzl, eds. 2007. PISA zufolge PISA: Hält PISA, was es verspricht? / PISA according to PISA: Does PISA keep what it promises? Vienna: LIT Verlag.
Hoxby, Caroline M. 2003. "School choice and school competition: Evidence from the United States." Swedish Economic Policy Review 10, no. 3: 9-65.
Hoxby, Caroline Minter. 2000. "The effects of class size on student achievement: New evidence from population variation." Quarterly Journal of Economics 115, no. 3 (November): 1239-1285.
Humlum, Maria K., Kristin J. Kleinjans, and Helena S. Nielsen. 2010. "An economic analysis of identity and career choice." Economic Inquiry, forthcoming.
Hunt, Earl, and Werner Wittmann. 2008. "National intelligence and national prosperity." Intelligence 36, no. 1: 1-9.
Jamison, Eliot A., Dean T. Jamison, and Eric A. Hanushek. 2007. "The effects of education quality on mortality decline and income growth." Economics of Education Review 26, no. 6 (December): 772-789.
Jenkins, Stephen P., John Micklewright, and Sylke V. Schnepf. 2008. "Social segregation in secondary schools: How does England compare with other countries?" Oxford Review of Education 34, no. 1: 21-38.

64
Jensen, Torben Pilegaard, and Dines Andersen. 2006. "Participants in PISA 2000 – four years later." In Northern Lights on PISA 2003. Copenhagen: Nordic Council of Ministers: 239-248.
Jones, Garett, and W. Joel Schneider. 2006. "Intelligence, human capital, and economic growth: A bayesian averaging of classical estimates (BACE) approach." Journal of Economic Growth 11, no. 1: 71-93.
———. 2010. "IQ in the production function: Evidence from immigrant earnings." Economic Inquiry, forthcoming.
Jorgenson, Dale W., and Zvi Griliches. 1967. "The explanation of productivity change." Review of Economic Studies 34, no. 3 (July): 249-282.
Juhn, Chinhui, Kevin M. Murphy, and Brooks Pierce. 1993. "Wage inequality and the rise in returns to skill." Journal of Political Economy 101, no. 3 (June): 410-442.
Jürges, Hendrik, and Kerstin Schneider. 2004. "International differences in student achievement: An economic perspective." German Economic Review 5, no. 3: 357-380.
———. 2010. "Central exit examinations increase performance... but take the fun out of mathematics." Journal of Population Economics 23, no. 2: 497-517.
Jürges, Hendrik, Kerstin Schneider, and Felix Büchel. 2005. "The effect of central exit examinations on student achievement: Quasi-experimental evidence from TIMSS Germany." Journal of the European Economic Association 3, no. 5: 1134-1155.
Kahn, Lawrence M. 2004. "Immigration, skills and the labor market: International evidence." Journal of Population Economics 17, no. 3: 501-534.
———. 2007. "The impact of employment protection mandates on demographic temporary employment patterns: International microeconomic evidence." Economic Journal 117, no. 521: F333-F356.
Kiker, B. F. 1968. Human capital: In retrospect. Columbia, SC: University of South Carolina.
Knighton, Tamara, and Patrick Bussière. 2006. "Educational outcomes at age 19 associated with reading ability at age 15." Culture, Tourism and the Centre for Education Statistics Research papers Ottawa: Statistics Canada (June).
Krueger, Alan B., and Mikael Lindahl. 2001. "Education for growth: Why and for whom?" Journal of Economic Literature 39, no. 4 (December): 1101-1136.
Lapointe, Archie E., Nancy A. Mead, and Gary W. Phillips. 1989. A world of differences: An international assessment of mathematics and science. Princeton, NJ: Educational Testing Service.

65
Lee, Doo Won, and Tong Hun Lee. 1995. "Human capital and economic growth: Tests based on the international evaluation of educational achievement." Economics Letters 47, no. 2: 219-225.
Lee, Jong-Wha, and Robert J. Barro. 2001. "Schooling quality in a cross-section of countries." Economica 68, no. 272: 465-488.
Leuven, Edwin, Mikael Lindahl, Hessel Oosterbeek, and Dinand Webbink. 2010. "Expanding schooling opportunities for 4-year-olds." Economics of Education Review 29, no. 3: 319-328.
Leuven, Edwin, Hessel Oosterbeek, and Hans van Ophem. 2004. "Explaining international differences in male skill wage differentials by differences in demand and supply of skills." Economic Journal 114, no. 495 (April): 466–486.
Levine, Ross, and David Renelt. 1992. "A sensitivity analysis of cross-country growth regressions." American Economic Review 82, no. 4 (September): 942-963.
Levine, Ross, and Sara J. Zervos. 1993. "What we have learned about policy and growth from cross-country regressions?" American Economic Review 83, no. 2 (May): 426-430.
Lynn, Richard, and Jaan Mikk. 2007. "National differences in intelligence and educational attainment." Intelligence 35, no. 2 (March/April): 115-121.
———. 2009. "National IQs predict educational attainment in math, reading and science across 56 nations." Intelligence 37, no. 3 (May/June): 305-310.
Lynn, Richard, and Tatu Vanhanen. 2002. IQ and the wealth of nations. Westport, CT: Praeger Publishers.
———. 2006. IQ and global inequality. Augusta, GA: Wahington Summit Publishers.
Mankiw, N. Gregory, David Romer, and David Weil. 1992. "A contribution to the empirics of economic growth." Quarterly Journal of Economics 107, no. 2 (May): 407-437.
Marshall, Alfred. 1898. Principles of economics. Vol. 1. London: Macmillan and Company.
Mayer, Susan E. 1997. What money can't buy: Family income and children's life chances. Cambridge, MA: Harvard University Press.
McEwan, Patrick J., and Jeffery H. Marshall. 2004. "Why does academic achievement vary across countries? Evidence from Cuba and Mexico." Education Economics 12, no. 3: 205-217.
McIntosh, Steven, and Anna Vignoles. 2001. "Measuring and assessing the impact of basic skills on labor market outcomes." Oxford Economic Papers 53, no. 3: 453-481.

66
Michaelowa, Katharina. 2001. "Primary education quality in francophone Sub-Saharan Africa: Determinants of learning achievement and efficiency considerations." World Development 29, no. 10: 1699-1695.
Mincer, Jacob. 1970. "The distribution of labor incomes: a survey with special reference to the human capital approach." Journal of Economic Literature 8, no. 1 (March): 1-26.
———. 1974. Schooling, experience, and earnings. New York: NBER.
Mullis, Ina V. S., Michael O. Martin, and Pierre Foy. 2008. TIMSS 2007 international mathematics report: Findings from IEA’s Trends in International Mathematics and Science Study at the fourth and eighth grades. Chestnut Hill, MA: TIMSS & PIRLS International Study Center, Lynch School of Education, Boston College.
Mullis, Ina V.S., Michael O. Martin, Ann M. Kennedy, and Pierre Foy. 2007. PIRLS 2006 international report: IEA’s Progress in International Reading Literacy Study in primary schools in 40 countries. Chestnut Hill, MA: TIMSS & PIRLS International Study Center, Lynch School of Education, Boston College.
Neal, Derek. 1997. "The effect of Catholic secondary schooling on educational attainment." Journal of Labor Economics 15, no. 1, Part 1 (January): 98-123.
Neidorf, Teresa S., Marilyn Binkley, Kim Gattis, and David Nohara. 2006. Comparing mathematics content in the National Assessment of Educational Progress (NAEP), Trends in International Mathematics and Science Study (TIMSS), and Program for International Student Assessment (PISA) 2003 assessments. Washington: National Center for Education Statistics (May).
Nickell, Stephen. 2004. "Poverty and worklessness in Britain." Economic Journal 114, no. 494 (March): C1-C25.
Oosterbeek, Hessel 1998. "Unravelling supply and demand factors in work-related training." Oxford Economic Papers 50, no. 2: 266-283.
Organisation for Economic Co-operation and Development. 2007. PISA 2006: Science competencies for tomorrow’s world. Vol. 1 – Analysis. Paris: OECD.
———. 2009. PISA 2006 technical report. Paris: OECD.
Orr, Dominic, Klaus Schnitzer, and Edgar Frackmann. 2008. Social and economic conditions of student life in Europe: Synopsis of indicators, Final report, Eurostudent III 2005–2008. Bielefeld, Germany: W. Bertelsmann Verlag GmbH & Co.
Peterson, Paul E., and Ludger Woessmann. 2007. "Introduction: Schools and the equal opportunity problem." In Schools and the Equal Opportunity Problem, edited by Ludger Woessmann and Paul E. Peterson. Cambridge, MA: MIT Press: 3-27.
67
Petty, Sir William. 1676 [1899]. "Political arithmetic." In The economic writings of Sir William Petty, edited by Charles Henry Hull. Cambridge, UK: Cambridge University Press: 233-313.
Prais, Sig J. 2003. "Cautions on OECD's recent educational survey (PISA)." Oxford Review of Education 29, no. 2 (June): 139-163.
Pritchett, Lant. 2004. "Access to education." In Global Crises, Global Solutions, edited by Björn Lomborg. Cambridge: Cambridge University Press: 175-234.
———. 2006. "Does learning to add up add up? The returns to schooling in aggregate data." In Handbook of the Economics of Education, edited by Eric A. Hanushek and Finis Welch. Amsterdam: North Holland: 635-695.
Psacharopoulos, George, and Harry A. Patrinos. 2004. "Returns to investment in education: a further update." Education Economics 12, no. 2 (August): 111-134.
Ram, Rati. 2007. "IQ and economic growth: Further augmentation of Mankiw-Romer-Weil model." Economics Letters 94, no. 1: 7-11.
Ramirez, Francisco, Xiaowei Luo, Evan Schofer, and John Meyer. 2006. "Student achievement and national economic growth." American Journal of Education 113(November): 1-29.
Romer, Paul. 1990. "Human capital and growth: Theory and evidence." Carnegie-Rochester Conference Series on Public Policy 32: 251-286.
Rose, Steven. 2009. "Should scientists study race and IQ? No: Science and society do not benefit." Nature 457 (February 12): 787-788.
Rotberg, Iris C. 1995. "Myths about test score comparisons." Science 270, no. 5241 (December 1): 1446-1448.
Rouse, Cecilia Elena, and Lisa Barrow. 2009. "School vouchers and student achievement: Recent evidence and remaining questions." Annual Review of Economics 1: 17-42.
Sala-i-Martin, Xavier, Gernot Doppelhofer, and Ronald I. Miller. 2004. " Determinants of long-term growth: A Bayesian Averaging of Classical Estimates (BACE) approach." American Economic Review 94, no. 4 (September): 813-835.
Schneeweis, Nicole. 2010. "Educational institutions and the integration of migrants." Journal of Population Economics, forthcoming.
Schnepf, Sylke V. 2007. "Immigrants’ educational disadvantage: An Examination across ten countries and three surveys." Journal of Population Economics 20, no. 3: 527-545.
Schuetz, Gabriela. 2009. "Does the quality of pre-primary education pay off in secondary school? An international comparison using PISA 2003." Ifo Working Paper 68. Munich: Ifo Institute for Economic Research.

68
Schuetz, Gabriela, Heinrich W. Ursprung, and Ludger Woessmann. 2008. "Education policy and equality of opportunity." Kyklos 61, no. 2: 279-308.
Schultz, Theodore W. 1961. "Investment in human capital." American Economic Review 51, no. 1 (March): 1-17.
Schwerdt, Guido, and Amelie C. Wuppermann. 2009. "Is traditional teaching really all that bad? A within-student between-subject approach." CESifo Working Paper 2634. Munich: CESifo.
Sianesi, Barbara, and John Van Reenen. 2003. "The returns to education: Macroeconomics." Journal of Economic Surveys 17, no. 2: 157-200.
Smith, Adam. 1979. An inquiry into the nature and causes of the wealth of nations. Oxford: Clarendon Press.
Solow, Robert M. 1957. "Technical change and the aggregate production function." Review of Economics and Statistics 39, no. 3 (August): 312-320.
Sprietsma, Maresa. 2008. "Regional school choice and school selectivity: How do they relate to student performance? Evidence from PISA 2003." European Journal of Comparative Economics 5, no. 2: 133-156.
———. 2010. "The effect of relative age in the first grade of primary school on long-term scholastic results: International comparative evidence using PISA 2003." Education Economics 18, no. 1: 1-32.
Temple, Jonathan. 2001. "Growth effects of education and social capital in the OECD countries." OECD Economic Studies 33: 57-101.
Todd, Petra E., and Kenneth I. Wolpin. 2003. "On the specification and estimation of the production function for cognitive achievement." Economic Journal 113, no. 485 (February): F3-33.
Toma, Eugenia F. 1996. "Public funding and private schooling across countries." Journal of Law and Economics 39, no. 1: 121-148.
———. 2005. "Private schools in a global world: 2004 presidential address." Southern Economic Journal 71, no. 4: 693-704.
Topel, Robert. 1999. "Labor markets and economic growth." In Handbook of Labor Economics, edited by Orley Ashenfelter and David Card. Amsterdam: Elsevier: 2943-2984.
Turkheimer, Eric, Andreana Haley, Mary Waldron, Brian D'Onofrio, and Irving I. Gottesman. 2003. "Socioeconomic status modifies heritability of IQ in young children." Psychological Science 14, no. 6 (November): 623-628.

69
UNESCO. 2005. Education for all: The quality imperative, EFA Global Monitoring Report. Paris: UNESCO.
Urquiola, Miguel, and Eric Verhoogen. 2009. "Class-size caps, sorting, and the regression-discontinuity design." American Economic Review 99, no. 1 (March): 179-215.
Vandenberghe, Vincent, and Stephane Robin. 2004. "Evaluating the effectiveness of private education across countries: A comparison of methods." Labour Economics 11, no. 4: 487-506.
Waldinger, Fabian. 2006. "Does tracking affect the importance of family background on students’ test scores?" Mimeo. London: London School of Economics.
Weede, Erich, and Sebastian Kämpf. 2002. "The impact of intelligence and institutional improvements on economic growth." Kyklos 55, no. 3: 361-380.
West, Martin R., and Ludger Woessmann. 2006. "Which school systems sort weaker students into smaller classes? International evidence." European Journal of Political Economy 22, no. 4: 944-968.
———. forthcoming. "'Every Catholic child in a Catholic school': Historical resistance to state schooling, contemporary school competition, and student achievement." Economic Journal.
Woessmann, Ludger. 2001. "Why students in some countries do better: International evidence on the importance of education policy." Education Matters 1, no. 2 (Summer): 67-74.
———. 2002. Schooling and the quality of human capital. Berlin: Springer.
———. 2003a. "Central exit exams and student achievement: International evidence." In No child left behind? The politics and practice of school accountability, edited by Paul E. Peterson and Martin R. West. Washington, D.C.: Brookings Institution Press: 292-323.
———. 2003b. "Schooling resources, educational institutions, and student performance: The international evidence." Oxford Bulletin of Economics and Statistics 65, no. 2: 117-170.
———. 2003c. "Specifying human capital." Journal of Economic Surveys 17, no. 3: 239-270.
———. 2005a. "Educational production in East Asia: The impact of family background and schooling policies on student performance." German Economic Review 6, no. 3: 331-353.
———. 2005b. "Educational production in Europe." Economic Policy 20, no. 43: 446-504.
———. 2005c. "The effect heterogeneity of central examinations: evidence from TIMSS, TIMSS-Repeat and PISA." Education Economics 13, no. 2 (June): 143 - 169.
———. 2007a. "International evidence on expenditure and class size: A review." In Brookings Papers on Education Policy 2006/2007. Washington D.C.: Brookings: 245-272.

70
———. 2007b. "International evidence on school competition, autonomy and accountability: A review." Peabody Journal of Education. 82, no. 2-3: 473-497.
———. 2008. "How equal are educational opportunities? Family background and student achievement in Europe and the United States." Zeitschrift für Betriebswirtschaft 78, no. 1: 45-70.
———. 2009a. "International evidence on school tracking: A review." CESifo DICE Report - Journal for Institutional Comparisons 7, no. 1: 26-34.
———. 2009b. "Public-private partnerships and student achievement: A cross-country analysis." In School choice international: Exploring public-private partnerships, edited by Rajashri Chakrabarti and Paul E. Peterson. Cambridge, MA: MIT Press: 13-45.
———. 2010a. "Families, schools, and primary-school learning: Evidence for Argentina and Colombia in an international perspective." Applied Economics, forthcoming.
———. 2010b. "Institutional determinants of school efficiency and equity: German states as a microcosm for OECD countries." Jahrbücher für Nationalökonomie und Statistik / Journal of Economics and Statistics 230, no. 2: 234-270.
Woessmann, Ludger, Elke Luedemann, Gabriela Schuetz, and Martin R. West. 2009. School accountability, autonomy, and choice around the world. Cheltenham, UK: Edward Elgar.
Woessmann, Ludger, and Martin R. West. 2006. "Class-size effects in school systems around the world: Evidence from between-grade variation in TIMSS." European Economic Review 50, no. 3: 695-736.
Wolter, Stefan C., and Maja Coradi Vellacott. 2003. "Sibling rivalry for parental resources: A problem for equity in education? A six-country comparison with PISA data." Swiss Journal of Sociology 29, no. 3: 377-398.
Yamamoto, Kentaro. 2002. "Estimating PISA students on the IALS prose literacy scale." Mimeo. Princeton, NJ: Educational Testing Service (Summer).
Zimmer, Ron W., and Eugenia F. Toma. 2000. "Peer effects in private and public schools across countries." Journal of Policy Analysis and Management 19, no. 1 (Winter): 75-92.

Figure 1: Participation in international student achievement tests of IEA and OECD through 2007
0
5
10
15
20
1 2 3 4 5 6 7 8 9 10 11 12 13 14 15Number of tests participated (1964-2007)
Num
ber o
f cou
ntrie
s
OECDnon-OECD
Notes: Number of tests in which a country has participated in the following 15 IEA and OECD tests: FIMS, FISS, FIRS, SIMS, SISS, SIRS, TIMSS, TIMSS-Repeat, PISA 2000/02, PIRLS, TIMSS 2003, PISA 2003, PIRLS 2006, PISA 2006, TIMSS 2007. Total number of participating countries: 96.

Figure 2: Family-background effects in different countries
8.3
9.8
10.4
11.0
11.4
11.8
13.5
14.015.1
15.3
16.8
16.8
17.0
17.5
19.2
20.0
20.8
21.2
21.5
22.5
22.8
23.023.1
24.0
24.8
25.6
25.8
27.0
28.8
0 5 10 15 20 25 30
France
Canada
Portugal
Belgium, Flemish
Iceland
T urkey
Japan
Finland
Denmark
Spain
Switzerland
Belgium, French
Netherlands
Italy
Greece
Norway
Austria
Sweden
Australia
Czech Rep.
New Zealand
Ireland
USA
Slovak Rep.
Korea
Germany
Hungary
Scotland
England
Notes: Coefficient estimates from a student-level regression within each country of the mean of math and science performance in the TIMSS-95 and TIMSS-Repeat international tests on books at home, which is a categorical variable with five categories. Regressions control for age, gender, family status, student born in country, mother born in country, father born in country, interactions between the three immigration variables and books, and a dummy for the second test cycle. All estimates are statistically significantly different from zero at the 1 percent level. Source: Based on Schuetz, Ursprung, and Woessmann (2008), Table 3.

Figure 3: Expenditure per student and student achievement across countries
350
400
450
500
550
0 10000 20000 30000 40000 50000 60000 70000 80000
Math performance in PISA 2003
Cumulative educational expenditure per student
Mexico
Belgium
Iceland
FranceSweden
SwitzerlandDenmark
AustriaNorway
USA
ItalyPortugal
Spain
Korea
GermanyIreland
Czech Rep.
HungaryPoland
Slovak Rep.
Greece
Finland
NetherlandsCanada
Japan
Australia
R 2 = 0.15
R 2 = 0.01
Notes: Association between average math achievement in PISA 2003 and cumulative expenditure on educational institutions per student between age 6 and 15, in US dollars, converted by purchasing power parities. Dark line: regression line for full sample. Light line: regression line omitting Mexico and Greece. Source: Woessmann (2007a).

Figure 4: Change in expenditure per student and in student achievement over time
70
80
90
100
110
0 1 2 3 4 5 6 7Change in educational expenditure (percent per year)
AUS
FRAGBR
BEL
JPN
DEU
SWE
NLD ITAUSA
Change in student performance(base year=100)
KOR
THAHKG
SGP
PHL
NZL
Notes: Data for OECD countries refer to 1970-1994, data for East Asian countries to 1980-1994. Change in student performance: students’ average educational performance in math and science in 1994 relative to base year. Change in educational expenditure: average annual rate of change in real educational expenditure per student in percent. Country abbreviations: Australia (AUS), Belgium (BEL), France (FRA), Germany (DEU), Hong Kong (HKG), Italy (ITA), Japan (JPN), Netherlands (NLD), Philippines (PHL), Singapore (SGP), South Korea (KOR), Sweden (SWE), Thailand (THA), United Kingdom (GBR), United States (USA). Source: Based on Gundlach, Woessmann, and Gmelin (2001) and Gundlach and Woessmann (2001).

Figure 5: Identifying class-size effects: Singapore as an illustrative example
R 2 = 0.40400
450
500
550
600
650
700
750
0 10 20 30 40 50
(a) A
ll cl
asse
s
Class size
Test score
× Seventh grade o Eighth
T = 435.94 + 5.47 S (0.41)
R 2 = 0.14-100
-50
0
50
100
150
200
250
-20 -10 0 10 20 30
(b) G
rade
diff
eren
ce
Class size
Test score
T = 29.63 + 2.69 S (0.58)
R 2 = 0.00-100
-50
0
50
100
150
200
250
-20 -10 0 10 20 30
(c) G
rade
diff
eren
ce, i
nstru
men
ted
Class size
Test score
T = 53.03 - 0.23 S (0.97)
Source: Woessmann (2007a).

Figure 6: External exams, school autonomy, and student achievement across countries
No
Yes
No
Yes
55.5
76.2
23.7
0.00
10
20
30
40
50
60
70
80
Central exams
School autonomy over teacher salaries
Math performance in TIMSS/TIMSS-R test scores (relative to lowest category)
Notes: Performance difference between the four categories relative to the lowest category which is set equal to zero. Based on a cross-country student-level multiple regression using the combined TIMSS and TIMSS-Repeat micro databases that extensively controls for family background, school inputs, and other institutional features. Source: Woessmann (2005c).

Figure 7: Private operation, public funding, and student achievement across countries
lowhigh
low
high
33.9
70.9
0.0
36.9
0
10
20
30
40
50
60
70
80
Average share of government
funding
Share of privately operated schools
Math performance in PISA test scores (relative to lowest
category)
Notes: Performance difference between the four categories relative to the lowest category which is set equal to zero. Based on a cross-country student-level multiple regression using the PISA 2003 micro database that extensively controls for family background, school inputs, and other institutional features. “Low” and “high” refer to the 1st and 9th decile on the international distribution of the two variables (0% and 60% in the case of private operation and 55% and 100% in the case of government funding). Source: Woessmann, Luedemann, Schuetz, and West (2009).

Figure 8: Educational inequality in primary and secondary school
Canada
Germany
Iceland
Latvia
Canada
Czech Rep.
Czech Rep.France
Germany
Greece
Greece
Hong Kong
Hong Kong
HungaryHungary
Iceland
Italy
Italy
Latvia
Netherlands
Netherlands
New Zealand
New ZealandNorway
Norway
Russian Fed.
Russian Fed.Slovak Rep. Slovak Rep.
Sweden
Sweden
Turkey
Turkey
United States
United States
-15.0
-10.0
-5.0
0.0
5.0
10.0
15.0
20.0
PIRLS (Primary school) PISA 2003 (Secondary school)
Notes: Dispersion of student achievement measured as standard deviation of test scores in primary school (PIRLS) in comparison to lower-secondary school (PISA 2003), in both cases measured as difference to the international mean of national standard deviations in each test. The lines indicate the change in performance dispersion from primary to lower-secondary school. The black solid lines indicate school systems that track their students into different school types before the age of 16, while the red dashed lines refer to those school systems that do not track their students by this age. Source: Based on Hanushek and Woessmann (2006).
•–––• Tracked •- - -• Not tracked
Standard deviation

Figure 9: Tracking and socio-economic status in PISA
lowhigh
fifteen (at least)
ten0.0
59.4
21.7
57.6
0
10
20
30
40
50
60
Notes: Performance difference between the four categories relative to the lowest category which is set equal to zero. Based on a cross-country student-level multiple regression using the PISA 2003 micro database that extensively controls for family background, school inputs, and other institutional features. Low and high socio-economic status correspond to the 25th and 75th percentile of the PISA ESCS index, respectively. Source: Based on Woessmann, Luedemann, Schuetz, and West (2009).
Socio-economic status
Performance in PISA 2003 test scores (relative to lowest category)
Age of first tracking
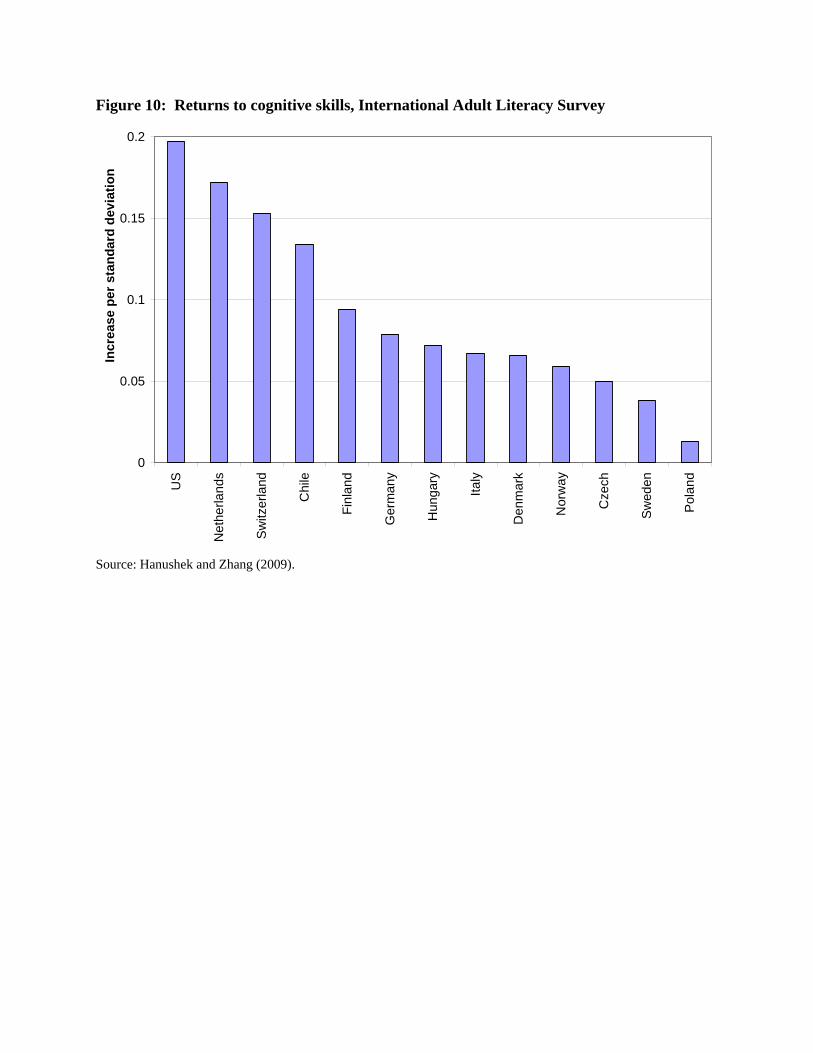
Figure 10: Returns to cognitive skills, International Adult Literacy Survey
0
0.05
0.1
0.15
0.2
US
Net
herla
nds
Sw
itzer
land
Chi
le
Finl
and
Ger
man
y
Hun
gary
Italy
Den
mar
k
Nor
way
Cze
ch
Swed
en
Pol
and
Incr
ease
per
sta
ndar
d de
viat
ion
Source: Hanushek and Zhang (2009).

Figure 11: Impact of controlling for family inputs and ability on returns to schooling
0
0.02
0.04
0.06
0.08
0.1
0.12
Chi
le US
Pola
nd
Ger
man
y
Italy
Cze
ch
Switz
erla
nd
Den
mar
k
Hun
gary
Swed
en
Nor
way
Net
herla
nds
Finl
and
Returns to Quality-adjusted Schooling Returns Accounting for Family Inputs and Ability
Source: Hanushek and Zhang (2009).

Figure 12: Inequality of test scores and earnings
1.5
2.0
2.5
3.0
3.5
4.0
4.5
1.3 1.5 1.7 1.9
FIN
Earnings inequality
Test score inequality
DEN
USACAN
UK
SWI
IRE
AUS
BELSWE
GER
NET
NOR
Notes: Measure of inequality is the ratio of ninth decile to first decile in both cases; test performance refers to prose literacy in the International Adult Literacy Survey. Source: Based on Nickell (2004).

Figure 13: Cognitive skills and economic growth
Notes: Added-variable plot of a regression of the average annual rate of growth (in percent) of real GDP per capita in 1960-2000 on the initial level of real GDP per capita in 1960, average years of schooling in 1960, and average test scores on international student achievement tests. Source: Hanushek and Woessmann (2008).

Figure 14: Years of schooling and economic growth without and with test-score controls
Notes: Added-variable plot of a regression of the average annual rate of growth (in percent) of real GDP per capita in 1960-2000 on the initial level of real GDP per capita in 1960 and average years of schooling in 1960. The bottom panel additionally controls for average test scores on international student achievement tests, whereas the top panel does not. Source: Based on Hanushek and Woessmann (2008).

Figure 15: Trends in educational achievement and trends in growth rates
Notes: Scatter plot of trend in the growth rate of GDP per capita from 1975 to 2000 against trend in test scores for countries whose test scores range back before 1972. Source: Own depiction based on the database derived in Hanushek and Woessmann (2009a).

Table 1: International tests of educational achievement: IEA and OECD student achievement tests
Abbr. Study Year Region Subject Agea,b Countriesc Organiz.d Scalee
1 FIMS First International Mathematics Study 1964 World Math 13,FS 11 IEA PC 2 FISS First International Science Study 1970-71 World Science 10,14,FS 14,16,16 IEA PC 3 FIRS First International Reading Study 1970-72 World Reading 13 12 IEA PC 4 SIMS Second International Mathematics Study 1980-82 World Math 13,FS 17,12 IEA PC 5 SISS Second International Science Study 1983-84 World Science 10,13,FS 15,17,13 IEA PC 6 SIRS Second International Reading Study 1990-91 World Reading 9,13 26,30 IEA IRT
7 TIMSS Third International Mathematics and Science Study 1994-95 World Math/Science 9(3+4), 13(7+8),FS 25,39,21 IEA IRT
8 TIMSS-Repeat TIMSS-Repeat 1999 World Math/Science 13(8) 38 IEA IRT 9 PISA 2000/02 Programme for International Student Assessment 2000+02 OECD+W. Math/Scie./Read. 15 31+10 OECD IRT 10 PIRLS Progress in International Reading Literacy Study 2001 World Reading 9(4) 34 IEA IRT 11 TIMSS 2003 Trends in Internat. Mathematics and Science Study 2003 World Math/Science 9(4),13(8) 24,45 IEA IRT 12 PISA 2003 Programme for International Student Assessment 2003 World Math/Scie./Read. 15 40 OECD IRT 13 PIRLS 2006 Progress in International Reading Literacy Study 2006 World Reading >9.5(4) 39 IEA IRT 14 PISA 2006 Programme for International Student Assessment 2006 World Math/Scie./Read. 15 57 OECD IRT
15 TIMSS 2007 Trends in Internat. Mathematics and Science Study 2007 World Math/Science >9.5(4), > 13.5(8) 35,48 IEA IRT
Notes: a. Grade in parentheses where grade level was target population. b. FS = final year of secondary education (differs across countries). c. Number of participating countries that yielded internationally comparable performance data. d. Conducting organization: International Association for the Evaluation of Educational Achievement (IEA); Organisation for Economic Co-operation and Development (OECD). e. Test scale: percent-correct formal (PC); item-response-theory proficiency scale (IRT).

Table 2: International tests of educational achievement: Additional testing
Abbr. Study Year Region Subject Agea,b Countriesc Organiz.d Scalee
1 ECIEL Programa de Estudios Conjuntos para la Integración Económica Latinoamericana 1975-76 Latin Ame. Reading/Science (1, 4, 6, FS) 7 ECIEL PC
2 IAEP-I International Assessment of Educational Progress I 1988 OECD Math/Science 13 6 IAEP PC 3 IAEP-II International Assessment of Educational Progress II 1990-91 World Math/Science 10,14/9,13 13,19/13,18 IAEP PC
4 IALS International Adult Literacy Survey 1994-98 World Prose/Document/ Quantit. Literacy 16-65 20 OECD IRT
5 SACMEQ I Southern and Eastern Africa Consortium for Monitoring Educational Quality 1995-98 Sou.+East.
Africa Math/Reading (6) 7 IIEP/ SACMEQ
6 PASEC Programme d’Analyse des Systèmes Educatifs des Pays de la CONFENEM
1996+98 +2001
Franc. Sub- Sah. Africa Math/Reading (2),(5) 6 CONFE-
NEM PC
7 LLECE Primer Estudio Internacional Comparativo 1997 Latin Ame. Math/Reading (3),(4) 11 LLECE IRT
8 SACMEQ II Southern and Eastern Africa Consortium for Monitoring Educational Quality
1999-2004
Sou.+East. Africa Math/Reading (6) 14 SACMEQ
/IIEP
9 ALLS Adult Literacy and Life Skills Survey 2002-06 OECD Prose/Document Liter./Numeracy 16-65 5 OECD IRT
10 SERCE Segundo Estudio Regional Comparativo Explicativo 2006 Latin America Math/Scie./Read. (3),(6)/(6)/
(3),(6) 16/9/16 LLECE IRT
Notes: a. Grade in parentheses where grade level was target population. b. FS = final year of secondary education (differs across countries). c. Number of participating countries that yielded internationally comparable performance data. d. Conducting organization: Estudos Conjuntos de Integraçâo Ecônomica da América Latina (ECIEL); International Assessment of Educational Progress (IAEP); Organisation for Economic Co-operation and Development (OECD); UNESCO International Institute for Educational Planning (IIEP); Southern and Eastern Africa Consortium for Monitoring Educational Quality (SACMEQ); Conférence des Ministres de l’Éducation des Pays ayant le Français en Partage (CONFENEM); Laboratorio Latinoamericano de Evaluación de la Calidad de la Educación (LLECE). e. Test scale: percent-correct formal (PC); item-response-theory proficiency scale (IRT).

Table 3: Performance on selected international student achievement tests
Code Country FIMS 1964
SIMS 1980-82
TIMSS 1995
TIMSS-Repeat 99
PISA 2000/02
TIMSS 2003
PISA 2003
PISA 2006
TIMSS 2007 cognitivea
ALB Albania 381 378.5 DZA Algeria 387 ARG Argentina 388 381 392.0 ARM Armenia 478 499 442.9 AUS Australia 27.0 530 525 533 505 524 520 496 509.4 AUT Austria 539 515 506 505 508.9 AZE Azerbaijan 476 BHR Bahrain 401 398 411.4 BEL Belgium 43.4 52.8 546 558 520 537 529 520 504.1 BIH Bosnia and Herzegovina 456 BWA Botswana 366 364 357.5 BRA Brazil 334 356 370 363.8 BGR Bulgaria 540 511 430 476 413 464 478.9 CAN Canada 50.9 527 531 533 532 532 527 503.8 CHL Chile 392 384 387 411 404.9 CHN China 493.9 COL Colombia 385 370 380 415.2 HRV Croatia 467 CYP Cyprus 474 476 459 465 454.2 CZE Czech Rep. 564 520 498 516 510 504 510.8 DNK Denmark 502 514 514 513 496.2 EGY Egypt 406 391 403.0 SLV El Salvador 340 EST Estonia 531 515 519.2 FIN Finland 37.7 48.2 520 536 544 548 512.6 FRA France 30.0 53.5 538 517 511 496 504.0 GEO Georgia 410 DEU Germany 36.3 509 490 503 504 495.6 GHA Ghana 276 309 360.3 GRC Greece 484 447 445 459 460.8 HKG Hong Kong-China 49.9 588 582 560 586 550 547 572 519.5
(continued on next page)

Table 3 (continued)
Code Country FIMS 1964
SIMS 1980-82
TIMSS 1995
TIMSS-Repeat 99
PISA 2000/02
TIMSS 2003
PISA 2003
PISA 2006
TIMSS 2007 cognitivea
HUN Hungary 54.6 537 532 488 529 490 491 517 504.5 ISL Iceland 487 514 515 506 493.6 IND India 428.1 IDN Indonesia 403 367 411 360 391 397 388.0 IRN Iran, Islamic Rep. 428 422 411 403 421.9 IRL Ireland 527 503 503 501 499.5 ISR Israel 46.1 45.6 522 466 433 496 442 463 468.6 ITA Italy 479 457 484 466 462 480 475.8 JPN Japan 46.0 63.5 605 579 557 570 534 523 570 531.0 JOR Jordan 428 424 384 427 426.4 KAZ Kazakhstan KOR Korea, Rep. 607 587 547 589 542 547 597 533.8 KWT Kuwait 392 354 404.6 KGZ Kyrgyzstan 311 LVA Latvia 493 505 463 508 483 486 480.3 LBN Lebanon 433 449 395.0 LIE Liechtenstein 514 536 525 512.8 LTU Lithuania 477 482 502 486 506 477.9 LUX Luxembourg 37.9 446 493 490 464.1 MAC Macao-China 527 525 526.0 MKD Macedonia 447 381 435 415.1 MYS Malaysia 519 508 474 483.8 MLT Malta 488 MEX Mexico 387 385 406 399.8 MDA Moldova, Rep. 469 460 453.0 MNE Montenegro 399 MAR Morocco 337 387 381 332.7 NLD Netherlands 30.6 58.1 541 540 536 538 531 511.5 NZL New Zealand 46.4 508 491 537 494 523 522 497.8 NGA Nigeria 33.4 415.4 NOR Norway 503 499 461 495 490 469 483.0
(continued on next page)

Table 3 (continued)
Code Country FIMS 1964
SIMS 1980-82
TIMSS 1995
TIMSS-Repeat 99
PISA 2000/02
TIMSS 2003
PISA 2003
PISA 2006
TIMSS 2007 cognitivea
OMN Oman 372 PSE Palestinian Nat. Auth. 390 367 406.2 PER Peru 292 312.5 PHL Philippines 345 378 364.7 POL Poland 470 490 495 484.6 PRT Portugal 454 454 466 466 456.4 QAT Qatar 318 307 ROU Romania 482 472 475 415 461 456.2 RUS Russian Fed. 535 526 478 508 468 476 512 492.2 SAU Saudi Arabia 332 329 366.3 SRB Serbia 477 437 435 486 444.7 SGP Singapore 643 604 605 593 533.0 SVK Slovak Rep. 547 534 508 498 492 505.2 SVN Slovenia 541 530 493 504 501 499.3 ZAF South Africa 354 275 264 308.9 ESP Spain 487 476 485 480 482.9 SWZ Swaziland 33.9 439.8 SWE Sweden 21.9 43.5 519 510 499 509 502 491 501.3 CHE Switzerland 545 529 527 530 514.2 SYR Syrian Arab Rep. 395 TWN Taiwan (Chinese Taipei) 585 585 549 598 545.2 THA Thailand 42.7 522 467 432 417 417 441 456.5 TUN Tunisia 448 410 359 365 420 379.5 TUR Turkey 429 423 424 432 412.8 UKR Ukraine 462 GBR United Kingdom 32.9 48.8 502 496 529 498 495 500 495.0 USA United States 25.4 46.0 500 502 493 504 483 474 508 490.3 URY Uruguay 422 427 430.0 ZWE Zimbabwe 410.7
Notes: All scores refer to the mathematics test in lower secondary school. (FIMS, SIMS: age 13; TIMSS: grade 8; PISA: age 15). a. Average score on all international tests 1964-2003 in math and science, primary through end of secondary school (Hanushek and Woessmann (2009a)).

Table 4: An example of an international education production function: PISA 2003
Coef. Std. err.
STUDENT CHARACTERISTICS Age (years) 17.593*** (1.101) Female -17.360*** (0.639) Preprimary education (more than 1 year) 5.606*** (0.703) School starting age -3.863*** (0.505) Grade repetition in primary school -35.794*** (1.410) Grade repetition in secondary school -34.730*** (1.646) Grade 7th grade -47.184*** (4.068) 8th grade -28.009*** (2.239) 9th grade -12.486*** (1.337) 11th grade -6.949*** (2.062) 12th grade 7.030 (4.826) Immigration background First generation student -9.047*** (1.544) Non-native student -9.040*** (1.644) Language spoken at home Other national dialect or language -23.736*** (2.849) Foreign language -8.381*** (1.665)
FAMILY BACKGROUND
Living with Single mother or father 19.349*** (1.842) Patchwork family 21.272*** (2.032) Both parents 27.432*** (1.829) Parents’ working status Both full-time -2.479* (1.325) One full-time, one half-time 6.744*** (1.063) At least one full time 13.753*** (1.173) At least one half time 8.416*** (1.133) Parents’ job Blue collar high skilled 0.431 (0.970) White collar low skilled 2.864*** (0.933) White collar high skilled 8.638*** (0.988) Books at home 11-25 books 5.554*** (0.978) 26-100 books 22.943*** (1.009) 101-200 books 32.779*** (1.117) 201-500 books 49.834*** (1.219) More than 500 books 51.181*** (1.399) Index of Economic, Social and Cultural Status (ESCS) 18.114*** (0.524) GDP per capita (1,000 $) -1.890* (1.060)
(continued on next page)

Table 4 (continued)
Coef. Std. err.
SCHOOL INPUTS
School’s community location Town (3,000-100,000) 3.226* (1.531) City (100,000-1,000,000) 10.782*** (1.890) Large city with > 1 million people 7.895*** (2.378) Educational expenditure per student (1,000 $) 1.174*** (0.405) Class size (mathematics) 1.474*** (0.067) Shortage of instructional materials Not at all -10.180*** (2.576) Strongly 6.720*** (1.300) Instruction time (minutes per week) 0.035*** (0.005) Teacher education (share at school) Fully certified teachers 9.715*** (3.422) Tertiary degree in pedagogy 6.573*** (2.010)
INSTITUTIONS
Choice Private operation 57.585*** (8.355) Government funding 81.839*** (22.327) Accountability External exit exams 25.338* (10.054) Assessments used to decide about students’ retention/promotion 12.185*** (1.631) Monitoring of teacher lessons by principal 4.557*** (1.343) Monitoring of teacher lessons by external inspectors 3.796*** (1.415) Assessments used to compare school to district/national performance 2.134* (1.259) Assessments used to group students -6.065*** (1.301) Autonomy and its interaction with accountability Autonomy in formulating budget -9.609*** (2.178) External exit exams x Autonomy in formulating budget 9.143*** (3.119) Autonomy in establishing starting salaries -8.632*** (3.251) External exit exams x Autonomy in establishing starting salaries 5.868 (3.980) Autonomy in determining course content 0.175 (1.907) External exit exams x Autonomy in determining course content 3.224 (2.858) Autonomy in hiring teachers 20.659*** (2.249) External exit exams x Autonomy in hiring teachers -28.935*** (3.365)
Students 219,794 Schools 8,245 Countries 29 R2 (at student level) 0.390 R2 (at country level) 0.872
Notes: Dependent variable: PISA 2003 international mathematics test score. Least-squares regressions weighted by students’ sampling probability. The models additionally control for imputation dummies and interaction terms between imputation dummies and the variables. Robust standard errors adjusted for clustering at the school level in parentheses (clustering at country level for all country-level variables, which are private operation, government funding, external exit exams, GDP per capita, and expenditure per student). Significance level (based on clustering-robust standard errors): *** 1 percent, ** 5 percent, * 10 percent. Source: Own calculations based on Woessmann, Luedemann, Schuetz, and West (2009), who provide additional background details.

Table 5: Within-country studies on student background and educational achievement
Study Dataset Countries Topic of investigation
Measure(s) of student background
Measure of achievement
Estimation method Results
Zimmer and Toma (2000) SIMS
Belgium, France, New Zealand, Canada, U.S.
Peer effects in private and public schools
Peers’ mean test score, share of high-/ low-ability students in classroom
Math, age 13-14
Value-added, country and school-type fixed effects
Positive peer effect; gains from high-quality peers stronger for low-ability students; mixed results on school types
Ammermueller, Heijke, and Woessmann (2005)
TIMSS
Czech Rep., Hun-gary, Latvia, Lithu-ania, Slovak Rep., Slovenia, Romania
Educational production in transition countries
Immigration, family status, parental educa-tion, books at home, community location
Math + science, grade 7+8
Cross-section WCRLR
Substantial effects of family background; larger in more (Czech Rep., Slovak Rep., Hungary, Slovenia) than in less advanced group (Lithuania, Latvia, Romania)
Woessmann (2005a) TIMSS
Hong Kong, Japan, Singapore, South Korea, Thailand; France, Spain, U.S.
Educational production in East Asian countries
Immigration, family status, parental educa-tion, books at home, community location
Math (+ science), grade 7+8
Cross-section WCRLR
Strong family-background effects in Korea and Singapore; more equitable outcomes in Hong Kong and Thailand
Woessmann (2008) TIMSS 17 West European
countries + U.S.
Educational production in West Europe
Books at home, paren-tal education, immigra-tion, family status, community location
Math (+ science), grade 7+8
Cross-section WCRLR, quantile regression
Strong associations; aggregate size similar in Europe and U.S.; France, Flem. Belgium most equitable; Britain, Germany least; equity unrelated to mean performance
Bedard and Dhuey (2006)
TIMSS, TIMSS-R
10 for grade 3+4, 18 for grade 7+8
Effects of re-lative school starting age
Relative age Math + science, grade 3+4 + 7+8
IV (instrument: age assigned by cutoff date)
Significant and sizeable effects of relative school starting age on performance at ages 9 and 13
Wolter and Coradi Vellacott (2003)
PISA
Belgium, Canada, Finland, France, Germany, Switzerland
Sibling rivalry
No. of siblings, ISEI, parental education + employment, immigra-tion + family status
Reading, age 15
Cross-section WCRLR
Effects of number of siblings relevant in all six countries, but to a different extent; effects concentrated in sub-group low-SES families
Schuetz, Ursprung, and Woessmann (2008)
TIMSS, TIMSS-R 54 countries Equality of
opportunity Books at home Mean math + science, grade 8
Cross-section WCRLR
Significant family-background effect in all countries; considerable variation; large effects in Britain, Hungary, Germany; relatively small effects in France, Canada
Peterson and Woessmann (2007)
PISA France, Germany, Great Britain, U.S.
Equality of opportunity
Books at home, paren-tal job + employment, immigration status, family status
Math, age 15 Cross-section WCRLR
Family background strongly linked to educational performance; largest in Germany and U.S., slightly smaller in Great Britain, even smaller in France
(continued on next page)
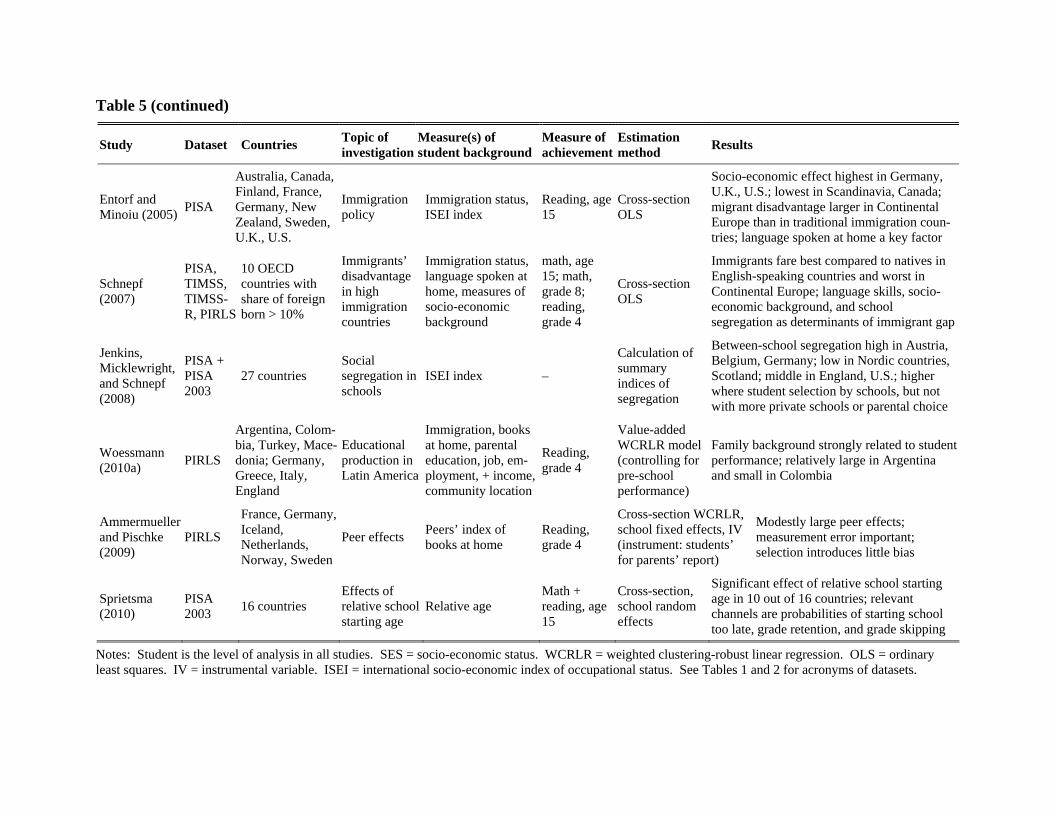
Table 5 (continued)
Study Dataset Countries Topic of investigation
Measure(s) of student background
Measure of achievement
Estimation method Results
Entorf and Minoiu (2005) PISA
Australia, Canada, Finland, France, Germany, New Zealand, Sweden, U.K., U.S.
Immigration policy
Immigration status, ISEI index
Reading, age 15
Cross-section OLS
Socio-economic effect highest in Germany, U.K., U.S.; lowest in Scandinavia, Canada; migrant disadvantage larger in Continental Europe than in traditional immigration coun-tries; language spoken at home a key factor
Schnepf (2007)
PISA, TIMSS, TIMSS-R, PIRLS
10 OECD countries with share of foreign born > 10%
Immigrants’ disadvantage in high immigration countries
Immigration status, language spoken at home, measures of socio-economic background
math, age 15; math, grade 8; reading, grade 4
Cross-section OLS
Immigrants fare best compared to natives in English-speaking countries and worst in Continental Europe; language skills, socio-economic background, and school segregation as determinants of immigrant gap
Jenkins, Micklewright, and Schnepf (2008)
PISA + PISA 2003
27 countries Social segregation in schools
ISEI index –
Calculation of summary indices of segregation
Between-school segregation high in Austria, Belgium, Germany; low in Nordic countries, Scotland; middle in England, U.S.; higher where student selection by schools, but not with more private schools or parental choice
Woessmann (2010a) PIRLS
Argentina, Colom-bia, Turkey, Mace-donia; Germany, Greece, Italy, England
Educational production in Latin America
Immigration, books at home, parental education, job, em-ployment, + income, community location
Reading, grade 4
Value-added WCRLR model (controlling for pre-school performance)
Family background strongly related to student performance; relatively large in Argentina and small in Colombia
Ammermueller and Pischke (2009)
PIRLS
France, Germany, Iceland, Netherlands, Norway, Sweden
Peer effects Peers’ index of books at home
Reading, grade 4
Cross-section WCRLR, school fixed effects, IV (instrument: students’ for parents’ report)
Modestly large peer effects; measurement error important; selection introduces little bias
Sprietsma (2010)
PISA 2003 16 countries
Effects of relative school starting age
Relative age Math + reading, age 15
Cross-section, school random effects
Significant effect of relative school starting age in 10 out of 16 countries; relevant channels are probabilities of starting school too late, grade retention, and grade skipping
Notes: Student is the level of analysis in all studies. SES = socio-economic status. WCRLR = weighted clustering-robust linear regression. OLS = ordinary least squares. IV = instrumental variable. ISEI = international socio-economic index of occupational status. See Tables 1 and 2 for acronyms of datasets.

Table 6: Cross-country studies on student background, school inputs, and educational achievement
Study Dataset No. of countries
Level of analysis
Topic of investigation Measure of inputs Measure of
achievement Estimation method Results
Hanushek and Kimko (2000)
FIMS, FISS, SIMS, SISS, IAEP-I,+II
70 country-cohorts Country
Production of student achievement
Student-teacher ratios, expenditure, adult schooling
Math + science Cross-section OLS
Positive effect of education of parents on student performance; no effects of school resources
Lee and Barro (2001)
FIMS, FISS, FIRS, SIMS, SISS, SIRS, IAEP-I,+II
58 Country Determinants of schooling quality
Student-teacher ratios, spending per student, teacher salaries, length of school year
Math, science + reading, repetition + dropout rates
Panel SUR regression, fixed effects
Strong relation between family background and school outcomes; positive and significant impact of school resources
Woessmann (2003b) TIMSS 39 Student
Effects on student performance
18 background measures, 12 resources + teachers, 26 institutional
Math + science Cross-section WCRLR
Strong effects of family background and institutional arrangements; far more important than resources
Jürges and Schneider (2004)
TIMSS 23 Student, country
Sources of student achievement
14 groups of student, teacher, class, school measures, 2 national
Math Cross-section OLS, IV, kernel density
Positive effects of family background, teacher characteristics, and school resources
McEwan and Marshall (2004) LLECE 2 (Cuba,
Mexico) Student Explaining Cuban-Mexican gap
Parental education, books at home, school, teacher + peer characteristics
Math + Spanish Blinder-Oaxaca decomposition
30% of achievement gap explained; family and peer characteristics play a role, school characteristics not
Fertig and Wright (2005) PISA 30 Student Class-size
effects Class size Reading Cross-section OLS
Class-size estimates get negative and significant only at high aggregation levels, indicating aggregation bias
Gunnarsson, Orazem, and Sánchez (2006)
LLECE 10 Student Effects of child labor
Intensity of working outside the home
Math + language, grade 3+4
Cross-section, IV
Significant negative effect of child labor on student achievement
Afonso and St. Aubyn (2006) PISA 2003 25 Country Efficiency of
expenditure Teachers per students, time spent in school
Avg. of math, reading, science, problem solving
DEA, Tobit, bootstrap
Substantial inefficiencies in most coun-tries; non-discretionary inputs (GDP and parental education) account for large part
Fuchs and Woessmann (2007)
PISA 31 Student Effects on student performance
13 groups of student measures, 5 resources + teachers, 10 institutional, interactions
Math, science, + reading
Cross-section WCRLR, IV
Background, resources, teachers, and esp. institutions all significantly associated with achievement; models account for >85% of between-country variation
Ammermueller (2007) PISA 2000 2 (Finland,
Germany) Student Explaining Finish-German gap
Parents’ education, books at home, teacher characteristics
Reading
Oaxaca-Blinder, Juhn-Murphy-Pierce decomposition
Finish-German gap not explained by different backgrounds; Finland uses resources more efficiently
Dolton and Marcenaro-Gutierrez (2010)
TIMSS+R +03, PISA +03 +06
39 Country Effects of teacher pay
Teacher salaries (absolute, relative), other teacher variables
Math, science + reading
Panel with country fixed effects
Absolute and relative teacher salary positively related to achievement
Notes: SUR = seemingly unrelated regression. WCRLR = weighted clustering-robust linear regression. OLS = ordinary least squares. IV = instrumental variable. DEA = data envelopment analysis. See Tables 1 and 2 for acronyms of datasets.

Table 7: Within-country studies on school inputs and educational achievement
Study Dataset Countries Level of analysis
Topic of investigation
Measure of school inputs
Measure of achievement
Estimation method Results
Heyneman and Loxley (1983)
FISS, ECIEL, national datasets
29 countries Student
Educational production in low-income countries
Up to 20 measures, differing by dataset
Science (math in few countries), primary school
Cross-section analysis of variance explained by sets of measures
School and teacher quality predominant influence on student learning; resources more closely related to student performance in developing countries
Michaelowa (2001) PASEC
Burkina Faso, Cameroon, Cote d’Ivoire, Mada-gascar, Senegal
Student
Educational production in Francophone Sub-Saharan Africa
Teacher, class-room, and school characteristics, national expendi-ture per student
Mean of math + French, grade 5
HLM, pooled across countries
Many measures, such as textbooks and teacher education, significantly associated with student performance; no positive association with smaller classes
Gundlach, Woessmann, and Gmelin (2001)
FIMS, FISS, SIMS, SISS, TIMSS
11-17 OECD countries Country
Change in schooling productivity in OECD countries
Expenditure per student
Math + science, different grades
Longitudinal measurement of skills and expenditures
Real expenditure per student increased substantially in most countries in 1970-1994; student performance remained constant at best; productivity decline larger in many countries than in U.S.
Gundlach and Woessmann (2001)
SIMS, SISS, TIMSS
Hong Kong, Japan, Singapore, South Korea, Philippines, Thailand
Country
Change in schooling productivity in East Asia
Expenditure per student
Math + science, different grades
Longitudinal measurement of skills and expenditures
Real expenditure per student increased substantially in most countries in 1980-1994, mostly due to decrease in student-teacher ratios; student performance did not change substantially
Hanushek and Luque (2003)
TIMSS 37 countries Class-room
Effects of class size and teacher characteristics
Class size, teacher experience and education
Math, ages 9+13 Cross-section OLS
Limited evidence of effects of school inputs; cross-country differences hard to explain systematically; no evidence of stronger effects in developing countries
Woessmann and West (2006)
TIMSS 11 countries Student Class-size effects Class size
Math + science, grades 7+8
Cross-section WCRLR, school fixed effects (using between-grade variation), IV
Sizable beneficial effects of smaller classes rejected in 8 countries; only in Greece, Iceland; noteworthy effects only in countries with low teacher salaries; conventional estimates severely biased
(continued on next page)

Table 7 (continued)
Study Dataset Countries Level of analysis
Topic of investigation
Measure of school inputs
Measure of achievement Estimation method Results
Woessmann (2005b) TIMSS
17 West European + U.S.
Student Class-size effects
Class size (shortage of materials, instruction time)
Math, grades 7+8
Cross-section WCRLR, school fixed effects, IV, RD
No statistically and economically significant class-size effect in any country; small statistically significant effects only in Iceland, Norway, Spain
Ammermueller, Heijke, and Woessmann (2005)
TIMSS 7 East Euro-pean (see Table 5)
Student
Educational production in transition countries
Class size, shortage of materials
Math + science, grades 7+8
Cross-section WCRLR, school fixed effects, IV
No causal class-size effects; in some countries, positive association with teacher experience and education and with sufficient reported materials
Woessmann (2005a) TIMSS
5 East Asian + 3 (see Table 5)
Student Class-size effects in East Asia
Class size, shortage of materials, teacher background
Math (+ science), grades 7+8
Cross-section WCRLR, school fixed effects, IV
No causal class-size effects; not much evidence of positive association with other school inputs
Ammermueller and Dolton (2006)
TIMSS/ R/2003, PIRLS
England, U.S. Student
Student-teacher gender interaction
Teacher gender
Math + scie-nce, grades 4+8; reading, grade 4
Cross-section WCRLR, student fixed effects (across subjects)
Some evidence of positive interaction effects of student and teacher gender in 8th-grade math in England in 2003, but not U.S. and most other specifications
Woessmann (2010a) PIRLS
2 Latin Ame-rican + 6 (see Table 5)
Student
Educational production in Latin America
Class size, instructional time, shortage of materials or staff
Reading, grade 4
Value-added WCRLR model (controlling for pre-school performance)
No consistent evidence of association between student performance and schools’ resource endowments
Bratti, Checchi, and Filippin (2008)
PISA 2003 24 countries Student
Cooperative vs. competi-tive learning approach
OECD index of students’ reports of cooperative and competitive attitudes towards learning
Math, age 15
Pooled cross-section CRLR with country fixed effects, quantile regressions
Positive association with individual competitive learning attitude (higher in comprehensive systems) and with school-average cooperative learning attitude (higher in tracked systems)
Altinok and Kingdon (2009)
TIMSS 2003
33-45 countries Student Class-size
effects Differences in class size across subjects
Math + science, grade 8
Cross-section WCRLR, school and student fixed effects (across subjects), IV
Few class-size effects; small significant negative effects only in 10 countries, positive in 6; larger in developing countries and with low teacher quality
Notes: WCRLR = weighted clustering-robust linear regression. HLM = hierarchical linear model. OLS = ordinary least squares. IV = instrumental variable. RD = regression discontinuity. See Tables 1 and 2 for acronyms of datasets.
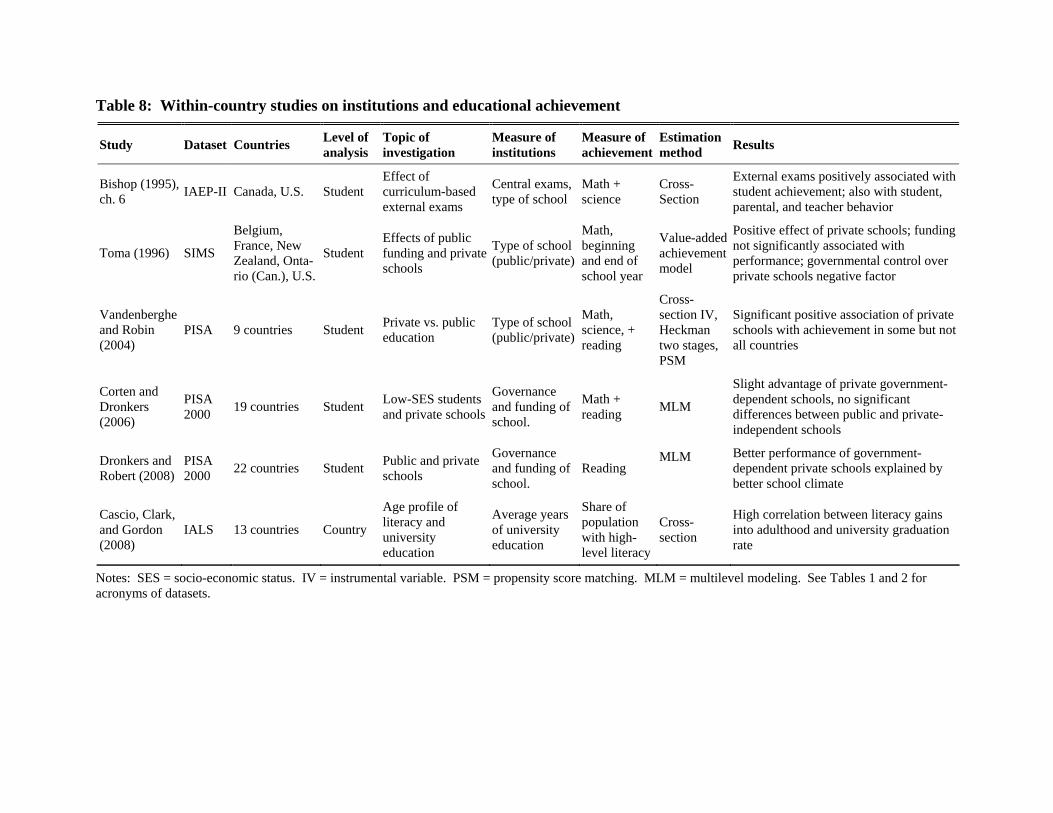
Table 8: Within-country studies on institutions and educational achievement
Study Dataset Countries Level of analysis
Topic of investigation
Measure of institutions
Measure of achievement
Estimation method Results
Bishop (1995), ch. 6 IAEP-II Canada, U.S. Student
Effect of curriculum-based external exams
Central exams, type of school
Math + science
Cross-Section
External exams positively associated with student achievement; also with student, parental, and teacher behavior
Toma (1996) SIMS
Belgium, France, New Zealand, Onta-rio (Can.), U.S.
Student Effects of public funding and private schools
Type of school (public/private)
Math, beginning and end of school year
Value-added achievement model
Positive effect of private schools; funding not significantly associated with performance; governmental control over private schools negative factor
Vandenberghe and Robin (2004)
PISA 9 countries Student Private vs. public education
Type of school (public/private)
Math, science, + reading
Cross-section IV, Heckman two stages, PSM
Significant positive association of private schools with achievement in some but not all countries
Corten and Dronkers (2006)
PISA 2000 19 countries Student Low-SES students
and private schools
Governance and funding of school.
Math + reading MLM
Slight advantage of private government-dependent schools, no significant differences between public and private-independent schools
Dronkers and Robert (2008)
PISA 2000 22 countries Student Public and private
schools
Governance and funding of school.
Reading MLM
Better performance of government-dependent private schools explained by better school climate
Cascio, Clark, and Gordon (2008)
IALS 13 countries Country
Age profile of literacy and university education
Average years of university education
Share of population with high-level literacy
Cross-section
High correlation between literacy gains into adulthood and university graduation rate
Notes: SES = socio-economic status. IV = instrumental variable. PSM = propensity score matching. MLM = multilevel modeling. See Tables 1 and 2 for acronyms of datasets.

Table 9: Cross-country studies on institutions and levels of educational achievement
Study Dataset No. of countries
Level of analysis
Topic of investigation
Measure of institutions
Measure of achievement
Estimation method Results
Bishop (1995), ch 4 IAEP-II 15-21 Country Effects of CBEEE CBEEE
Math, science, + geography
Cross-section OLS
Student achievement and teacher salaries higher in CBEEE countries; differences in qualifications and spending not significant
Bishop (1997)
TIMSS, IAEP-II
39, Canada
Country, School Effects of CBEEE CBEEE Math +
science Cross-section OLS
Large effect of CBEEE on student achievement; effects on parent, teacher, administrator behavior
Woessmann (2003b) TIMSS 39 Student Effects on student
performance Seven different categories
Math + science
Cross-section WCRLR
Large effects of institutional arrangements such as external exit exams, school autonomy, and private competition; far more important than resources
Woessmann (2003a)
TIMSS+ TIMSS-R
39, 38 (54) Student Effects of central
exit exams Central exit exams
Math + science
Cross-section WCRLR
Performance of students higher in systems with central exams; positive interaction with autonomy
Woessmann (2005c)
TIMSS+ TIMSS-R + PISA
39, 38 (54), 32 Student
Heterogeneity of central exam effect
Central exit exams, school autonomy
Math + science
Cross-section WCRLR, quantile regr.
Substantial heterogeneity of central exam effects along student, school, and time dimension
Bishop (2006), ch. 3 PISA 41 Country Effects of MCE
and CBEEE CBEEE Math, science + reading
Cross-section OLS
Positive effects of CBEEE on student achievement; do not affect school attendance
Fuchs and Woessmann (2007)
PISA 31 Student Effects on student performance
CBEEE, autonomy, private schools
Math, science, + reading
Cross-section WCRLR, IV
Institutional variation accounts for a quarter of between-country achievement variation; external exams interact positively with autonomy; positive effect of private operation
Sprietsma (2008)
PISA 2003 8 Student
School choice, school selectivity, and student performance
School choice, schools’ student selection
Math, reading + science
Cross-section, MLM, quantile regression
Regional intensity of school choice and school selectivity positively related to student achievement; similar effect for low and high performing students
Woessmann (2009b) PISA 29 Student
Public vs. private school funding and operation
Private operation and funding
Math + reading
Cross-section WCRLR
Negative effects of public operation on student achievement; positive effect of public funding
Woessmann, Luedemann, Schuetz, and West (2009), ch. 2-6
PISA 2003 29, 37 Student
Accountability, autonomy, and choice
Several measu-res of accoun-tability, auto-nomy, choice
Math +science
Cross-section WCRLR
Positive effects of several accountability measures on student performance and on role of autonomy; positive effects of share of privately operated schools and of government funding
(continued on next page)

Table 9 (continued)
Study Dataset No. of countries
Level of analysis
Topic of investigation
Measure of institutions
Measure of achievement Estimation method Results
West and Woessmann (forthcoming)
PISA 2003 29 Student
Effect of competition from private schools on student achievement
Share of privately operated schools
Math, science, + reading
Cross-section WCRLR, IV (instrumenting private school share by historical Catholic share)
Positive causal effect of share of privately operated schools on student achievements, negative effect on costs
Schuetz (2009)
PISA 2003 38 Student
Effect of pre-pri-mary education on later educational achievement
Characteristics of pre-primary education system
Math Cross-section WCRLR, country fixed effects, (DiD)
Positive association of pre-primary attendance with test scores; systematically stronger in countries with higher spending, larger shares of privately managed institutions, and higher training and relative pay of educators in pre-primary system
Notes: CBEEE = curriculum based external exit exams. MCE = minimum competency exams. WCRLR = weighted clustering-robust linear regression. OLS = ordinary least squares. IV = instrumental variable. MLM = multilevel modeling. DiD = differences in differences. See Tables 1 and 2 for acronyms of datasets.

Table 10: Cross-country studies on institutions and equity of educational achievement
Study Dataset No. of countries
Level of analysis
Topic of investigation
Measure of institutions
Measure of achievement
Measure of equity
Estimation method Results
Hanushek and Woessmann (2006)
PISA, PIRLS, TIMSS
45 Country Early tracking and inequality Age of first tracking Math, science,
+ reading Standard deviation in test scores
Pooled data, DiD
Significant effect of early tracking on inequality; no clear effect on mean performance
Schuetz, Ursprung, and Woessmann (2008)
TIMSS+ TIMSS-R 54 Student,
country Equality of opportunity
Age of first tracking, pre-school enroll-ment and duration
Mean math + science
Dependence of test scores on books at home
Cross-section WCRLR, country fixed effects
Late tracking and pre-school duration reduce impact of family background; inverted U-shaped effect of pre-school enrollment; no tradeoff with efficiency
Ammermueller (2005)
PISA, PIRLS 14 Student
Institutions and educational opportunities
Number of school types, instruction time, private school share, autonomy
Reading
Dependence of test scores on student background variables
Pooled data, WCRLR, DiD
Significant negative effect of number of school types and share of private schools on equality of opportunity; positive effect of instruction time
Brunello and Checchi (2007)
IALS, PISA 2003 17, 32 Student
School tracking and equality of opportunity
Age of first selection, length of tracking, share of vocational education
Competences and other indicators
Dependence of test scores on parental education; coeffi-cient of variation in test scores
Cohort study, OLS, probit, multinomial logit
Mixed results; tracking reinforces family-background effects on formal education but weakens them on learning on the job
Waldinger (2006)
PISA +2003, TIMSS, PIRLS
8-14 (DiD), 29 (cross-section)
Student Tracking and family background
Grade of first tracking Math + reading
Dependence of test scores on parental background variables
Pooled cross-section data, DiD
Tracking does not increase impact of family background after controlling for pre-tracking differences; but small samples
Guiso, Monte, Sapienza, and Zingales (2008)
PISA 2003 32-37 Student/ Country
Gender differences
Cultural attitudes, female political empowerment
Math + reading Gender gap in test scores Cross-section Girls’ lag in math eliminated in
more gender-equal societies
Schneeweis (2010)
TIMSS, TIMSS-R, +2003, PISA +2003
62, 167 country-years
Student/ Country
Educational institutions and integration of migrants
Ethnic segregation, pre-primary enroll-ment, school starting age, instruction time, external exams
Math + scienceUnexplained test score gap of immigrants
Blinder-Oaxa-ca decomposi-tion, pooled WLS, country fixed effects
Institutions account for 20% of immigrant disadvantage; esp. pre-primary education, young school starting age, low classroom segregation, instruction time
Woessmann, Luedemann, Schuetz, and West (2009), ch. 7
PISA 2003 27 Student
Accountability, autonomy, and choice
Several measures of accountability, auto-nomy, choice, and tracking
Math Dependence of test scores on PISA index of ESCS
Cross-section WCRLR
Public funding, private operation, and later tracking reduce impact of family background; accountability measures mostly equity-neutral
Notes: ESCS = economic, social, and cultural status. WCRLR = weighted clustering-robust linear regression. OLS = ordinary least squares. DiD = differences in differences. See Tables 1 and 2 for acronyms of datasets.

Table 11: Studies on cognitive skills and individual labor-market outcomes
Study Countries Topic of investigation
Measure of achievement
Measure of labor-market outcome
Estimation method Results
Denny, Harmon, and Redmond (2000)
Great Britain, Ireland, Northern Ireland
Impact of functional literacy on earnings
Prose, document, and quantitative literacy
Hourly earnings
Cross-section log-linear maximum likelihood
Literacy has a role, but formal education dominant factor in determining earnings; positive interaction between literacy and years of schooling in Great Britain
Denny, Harmon, and O’Sullivan (2004)
21 countries
Impact of years of schooling and basic skills on earnings
Mean of prose, document, and quantitative literacy
Hourly earnings
Cross-section log-linear OLS
Skills have significant effect on earnings, highest in English-speaking countries; excluding skill measures significantly biases return to years of schooling upwards
Leuven, Oosterbeek, and Ophem (2004)
15 countries
International differences in skill wage differences
Mean of prose, document, and quantitative literacy
Differing ear-nings concepts, mostly gross annual
Demand and supply analysis, cross-section
Model of skill supply and demand successfully explains cross-country differences in wage differentials between skill groups
Kahn (2004)
Canada, New Zealand, Switzerland, U.S.
Skills of immigrants and employment
Mean of prose, document, and quantitative literacy
Employment probability Cross-section
Immigrants had lower cognitive skills than natives in each country, largest gaps in U.S., small in Canada and New Zealand; controlling for skills, male immigrants in U.S. no less likely to be employed than natives, while other immigrants less likely to be employed
Kahn (2007)
Canada, Finland, Italy, Netherlands, Switzerland, U.K., U.S.
Impact of employment protection laws on employment
Mean of prose, document, and quantitative literacy
Permanent or temporary job
Cross-section, differences-in-differences multinomial logit
Controlling for skill levels, employment protection laws do not interact with probability to have a job, but decrease probability to have a permanent rather than temporary job for low-skilled workers
Hanushek and Zhang (2009) 13 countries
Returns to years education after adjusting for school quality
Quality-adjusted years of schooling; mean of prose, document, and quantitative literacy
Annual earnings from employment
Cross-section log-linear OLS
Cognitive skills and quality-adjusted years of schooling both have significant positive effects on earnings; returns to quality-adjusted education higher than traditional Mincer estimate, but bias more than offset by accounting for non-school influences
Notes: IALS is the dataset used in all studies. OLS = ordinary least squares.

Table 12: Studies on cognitive skills and distribution of labor-market outcomes
Study Countries Topic of investigation
Measure of achievement
Measure of labor-market outcome
Estimation method Results
Freeman and Schettkat (2001)
Germany, U.S.
Skill compression and wage distribution
Quantitative literacy (numeracy)
Income, employment
Cross-section log-linear OLS
More compressed distribution of skills in Germany explains only modest proportion of higher wage compression compared to U.S.
Devroye and Freeman (2001)
Germany, Netherlands, Sweden, U.S.
Inequality in skills and inequality in earnings
Mean of prose, document, and quantitative literacy
Annual earnings
Cross-section log-linear OLS
Skill inequality explains only small part of cross-country differences in inequality
Blau and Kahn (2005) 9 countries
Inequality of skills and inequality of earnings
Mean of prose, document, and quantitative literacy
Weekly earnings
Cross-section, Juhn-Murphy-Pierce decomposition
Greater skill dispersion in U.S. plays a part in explaining higher wage inequality, but relatively modest
Notes: IALS is the dataset used in all studies. OLS = ordinary least squares.

Table 13: Studies on cognitive skills and macroeconomic growth
Study Dataset No. of countries
Topic of investigation
Measure of achievement
Measure of macro-economic outcome Estimation method Results
Hanushek and Kimko (2000)
FIMS, FISS, SIMS, SISS, IAEP-I, IAEP-II
31 (projected to 80)
Effect of labor-force quality on growth
Average score of all tests, math + science, different age levels
Growth rate of real GDP per capita, 1960-90
Cross-section growth regressions with different controls
Strong and robust effect of quality of labor force on growth; strong increase in explained growth variance; school quantity tends to lose significance
Lee and Lee (1995) FISS 17
Effect of education on growth
Science, secondary school
Growth rate of real GDP per worker, 1970-85
Cross-section growth regressions, controlling for initial GDP
Significant effect of student achievement score on growth rate, ratio of physical investment to GDP, and lower fertility rate
Barro (2001)
FIMS, FISS, FIRS, SIMS, SISS, SIRS, IAEP-I, IAEP-II
23-43 Effect of education on growth
Average score of all tests, math, science + reading, different age levels
Growth rate of real GDP per capita, 1965-95 (10-year averages)
10-year-interval panel regressions by 3SLS with lagged instru-ments (but scores as single cross-section, not instrumented), with several controls
Significant effect of test scores, esp. science, on growth; quality of schooling much more important than quantity
Gundlach, Rudman, and Woessmann (2002)
Hanushek and Kimko (2000), with extended imputations
(131)
Accounting for differences in level of development
Average score of all tests, math + science, different age levels
Output per worker, 1990
Development accounting (covariance decomposition)
Quality-adjusted measure of human capital accounts for 45% of variation in output per worker in global sample, and for whole variation in OECD sample
Woessmann (2003c)
Hanushek and Kimko (2000), with extended imputations
29 (-132)
Comparison of different measures of human capital
Average score of all tests, math + science, different age levels
Output per worker, 1990
Development accounting (covariance decomposition)
Quality-adjusted human capital accounts for 60% of variation in output per worker in 64-country sample with non-imputed data
Bosworth and Collins (2003)
Hanushek and Kimko (2000), with extended projections
31, projected to 84
Determinants of economic growth
Average score of all tests, math + science, different age levels
Log change in real output per worker, 1960-2000
Cross-section growth regressions with several controls
Significant effect of educational quality on growth, but sensitive to conditioning on quality of government institutions
(continued on next page)

Table 13 (continued)
Study Dataset No. of countries
Topic of investigation
Measure of achievement
Measure of macro-economic outcome Estimation method Results
Coulombe and Tremblay (2006)
IALS 14 Effect of literacy scores on growth
Synthetic time series of literacy of labor-market entrants 1960-1995, derived from age distribution of IALS test; prose, document, and quantitative literacy, mean and separately
Growth rate of real GDP per capita/ worker, 1960-95 (5-year averages)
5-year-interval panel regressions with country (and time) fixed effects and different controls; test scores instrumented by years of schooling in some specifications
Significant effect of literacy scores on growth; outperform years of schooling; stronger effect of women’s than men’s literacy
Ramirez, Luo, Schofer, and Meyer (2006)
Hanushek and Kimko (2000) 38
Student achievement and growth
Average score of all tests, math + science, different age levels
Growth rate of real GDP per capita, 1970-90 and 1980-2000
Cross-section growth regressions with controls
Some effects of achievement on growth, but sensitive to East Asian countries and time period
Hanushek and Woessmann (2008)
FIMS, FISS, FIRS, SIMS, SISS, SIRS, TIMSS, TIMSS-R, PISA, PIRLS, TIMSS 2003, PISA 2003
50 Effect of cognitive skills on growth
Average score of all tests, math + science, different age levels; also, share of students reaching thresholds
Growth rate of real GDP per capita, 1960-2000
Cross-section growth regressions with different controls
Strong and robust effect of cognitive skills on growth, both in developing and developed countries; positive interaction with economic institutions; strong increase in explained variance; years of schooling lose significance; separate effects of low- and high-achievers
Jamison, Jamison, and Hanushek (2007)
Hanushek and Woessmann (2008)
43-54
Effect of education quality on growth
Average score of all tests, math, different age levels
Growth rate of real GDP per capita, 1960-2000; infant mortality rates, 1960-2000
Cross-section growth regressions with different controls; HLM of 10-year interval panel level model (but time-invariant test scores)
Mechanism by which education affects per-capita income is likely through increasing rate of technological progress; significant effect of education quality on rate of decline in infant mortality
Altinok (2007)
FIMS, FISS, SIMS, SISS, IAEP-I+II, TIMSS/-R+ 2003, LLECE, PASEC, PISA+ 2003, SACMEQ
“Approx. 120”
Effect of schooling quality on growth
Math + science, secondary school, averaged and as panel
Growth rate of real GDP per capita, 1965-2005 (10-year averages)
10-year-interval panel regressions with time fixed effects and different controls, OLS with country fixed effects and GMM
Positive effect of schooling quality on growth in panel framework with large number of countries
(continued on next page)

Table 13 (continued)
Study Dataset No. of countries
Topic of investigation
Measure of achievement
Measure of macro-economic outcome Estimation method Results
Ciccone and Papaioannou (2009)
Hanushek and Kimko (2000), as extended in Bosworth and Collins (2003)
21-41
Effect of education on structure of production
Average score of all tests, math + science, different age levels
Growth rate of value added and employment at country-industry level, 1980-1999
Cross-section growth regressions at industry level with country and industry fixed effects, effects identified by interaction with industry-level schooling intensity
Positive interaction between schooling quality and industry-level schooling intensity in predicting industry growth, indicating that countries with greater schooling quality shifted production structure to schooling-intensive industries; effect stronger in open economies
Appleton, Atherton, and Bleaney (2008)
FIMS, FISS, FIRS, SIMS, SISS, SIRS, IAEP-I+II, TIMSS/-R
24-41
Effect of schooling quality on growth
Average math, science + reading, as panel
Growth rate of real GDP per capita over differing 5-year periods between 1960 (?) and 2004
Growth regressions using lagged test scores, with controls, pooled cross-section; country fixed effects
Significant effect of lagged test scores on subsequent 5-year growth, quantitatively smaller than in averaged long-run models
Hanushek and Woessmann (2009a)
Hanushek and Woessmann (2008)
50-52 Causal effect of cognitive skills on growth
Average score of all tests, math + science (jointly + separately, also reading), different age levels; also, share of students reaching thresholds
Growth rate of real GDP per capita, 1960-2000 and sub-periods
Cross-section growth regressions with different controls; IV and LIML (instru-menting test scores by institutional features of school systems); DiD comparing earnings of home-educated to U.S.-educated immigrants in U.S.; model in changes over time
Remarkably stable association between cognitive skills and growth across specifications, time periods, and country samples; IV and DiD models confirm causality: significant growth effects of cognitive skills that stem from institutional features of school systems; home-country cognitive skills affect earnings of U.S. immigrants; effect of change in cognitive skills over time on change in growth paths
Hanushek and Woessmann (2009b)
LLECE, SERCE, Hanushek and Woessmann (2008)
59, 16 Latin American countries
Reasons for disappointing growth in Latin America
Average score of different tests, math + science, different age levels; math + reading, grades 4+6
Growth rate of real GDP per capita, 1960-2000
Cross-section growth regressions with several controls
Low cognitive skills account for poor Latin American growth in global perspective; significant effect of cognitive skills measured by regional tests on intra-regional growth variation
Notes: GDP = gross domestic product. HLM = hierarchical linear model. GMM = general method of moments. IV = instrumental variable. LIML = limited information maximum likelihood. DiD = differences in differences. See Tables 1 and 2 for acronyms of datasets.

Table 14: Cognitive skills versus years of schooling in growth regressions
(1) (2) (3)a (4)b (5)c Cognitive skills 1.980 1.975 1.666 1.239
(9.12) (8.28) (5.09) (4.12) Years of schooling 1960 0.369 0.026 0.024 0.047 -0.049
(3.23) (0.34) (0.78) (0.54) (0.66) GDP per capita 1960 -0.379 -0.302 -0.298 -0.255 -0.310 (4.24) (5.54) (6.02) (3.12) (5.73) No. of countries 50 50 50 50 45 R2 (adj.) 0.252 0.728 0.728 0.706 0.797
Notes: Dependent variable: average annual growth rate in GDP per capita, 1960-2000. Regressions include a constant. Test scores are average of math and science, primary through end of secondary school, all years (divided by 100). t-statistics in parentheses. a. Measure of years of schooling refers to the average between 1960 and 2000. b. Specification includes dummies for the eight world regions depicted in Figure 1. c. Specification includes additional controls for openness, property rights, fertility, and tropical location. Source: Hanushek and Woessmann (2009a).
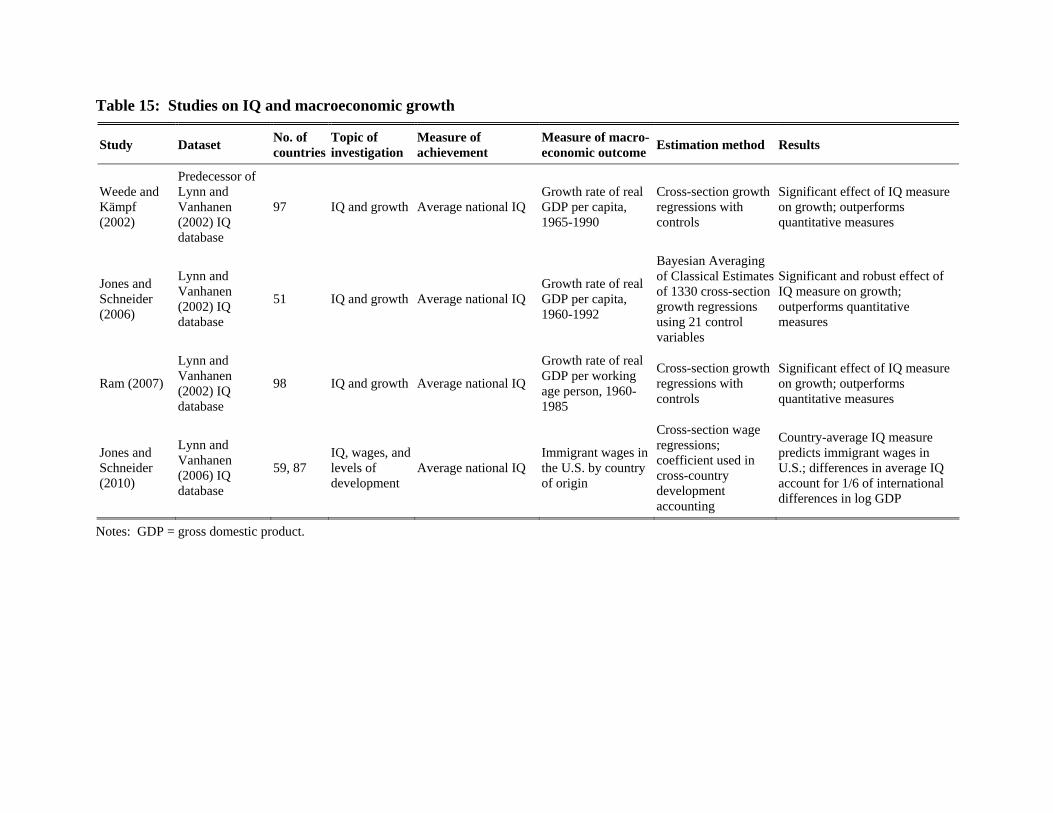
Table 15: Studies on IQ and macroeconomic growth
Study Dataset No. of countries
Topic of investigation
Measure of achievement
Measure of macro-economic outcome Estimation method Results
Weede and Kämpf (2002)
Predecessor of Lynn and Vanhanen (2002) IQ database
97 IQ and growth Average national IQ Growth rate of real GDP per capita, 1965-1990
Cross-section growth regressions with controls
Significant effect of IQ measure on growth; outperforms quantitative measures
Jones and Schneider (2006)
Lynn and Vanhanen (2002) IQ database
51 IQ and growth Average national IQ Growth rate of real GDP per capita, 1960-1992
Bayesian Averaging of Classical Estimates of 1330 cross-section growth regressions using 21 control variables
Significant and robust effect of IQ measure on growth; outperforms quantitative measures
Ram (2007)
Lynn and Vanhanen (2002) IQ database
98 IQ and growth Average national IQ
Growth rate of real GDP per working age person, 1960-1985
Cross-section growth regressions with controls
Significant effect of IQ measure on growth; outperforms quantitative measures
Jones and Schneider (2010)
Lynn and Vanhanen (2006) IQ database
59, 87 IQ, wages, and levels of development
Average national IQ Immigrant wages in the U.S. by country of origin
Cross-section wage regressions; coefficient used in cross-country development accounting
Country-average IQ measure predicts immigrant wages in U.S.; differences in average IQ account for 1/6 of international differences in log GDP
Notes: GDP = gross domestic product.