Embed Size (px)
Citation preview
The Economics of Climate Change in Brazil: Costs and Opportunities
Technical coordinators: Sergio Margulis (Banco Mundial) e Carolina Burle Schmidt Dubeux (COPPE/UFRJ).
Coordinators for sector-specific topics: Alisson Barbieri (CEDEPLAR/UFMG), Alexandre Szklo (COPPE/UFRJ),
Bernardo Baeta Neves Strassburg (Instituto GAEA e Universidade de East Anglia), Carlos Azzoni (FEA/USP), Eduardo Assad (EMBRAPA), Eduardo Haddad (FEA/USP),
Emílio La Rovere (COPPE/UFRJ), Eneas Salati (FBDS), Hilton Pinto (UNICAMP), José Feres (IPEA), José Marengo (CCST/INPE), Paulo Cesar Rosman (UFRJ),
Paulo Moutinho (IPAM), Robert Schneider (consultor), Roberto Schaeffer (COPPE/UFRJ) e Ulisses Confalonieri (FIOCRUZ).
Chairmain of the Advisory Council and General Coordinator: Jacques Marcovitch (FEA/USP).
Advisory Council: Carlos Afonso Nobre (ABC/INPE), Carlos Henrique de Brito Cruz (FAPESP),
Carlos Roberto Azzoni (FEA/USP), Fábio Feldmann (FPMC), Francisco de Assis Leme Franco (MF), Israel Klabin (FBDS),
Jacques Marcovitch (USP), José Domingos Gonzalez Miguez (MCT), José Goldemberg (IEE/USP), Luciano Coutinho (BNDES),
Luiz Gylvan Meira Filho (IEA/USP), Luís Manuel Rebelo Fernandes (FINEP), Luiz Pinguelli Rosa (COPPE/UFRJ – FBMC), Marcio Pochmann (IPEA),
Marco Antonio Zago (CNPq), Marcos Sawaya Jank (UNICA), Pedro Leite da Silva Dias (LNCC/CNPq/MCT), Sérgio Barbosa Serra (MRE),
Suzanna Kahn Ribeiro (MMA/SMCQ), Temistocles Marcelos (FBOMS) e Thelma Krug (IAI).
The bibliographical references for each study can be found under “References” at the end of this publication. The full version of the report on the study The Economics of Climate in Brazil is available from www.economiadoclima.org.br
The economics of climate change in Brazil: costs and opportunities / technical coordinators Sergio Margulis and Carolina Burle Schmidt Dubeux ; general coordinator Jacques Marcovitch – São Paulo: FEA/USP, 2011. 84 p.
Includes bibliographical references. ISBN 978-85-61522-03-2
1. Economic development - Environmental aspects - Brazil 2. Sustainability - Brazil 3. Change climate - Brazil 4. Regional economics - Brazil 5. Public policies - Brazil I. Margulis, Sergio. II. Dubeux, Carolina Burle Schmidt. III. Marcovitch, Jacques. CDD – 333.7
Cataloging in Publication Data Prepared by Technical Processing Section - SBD/FEAUSP
The Economics of Climate Change in Brazil:
Costs and Opportunities
TECHNICAL COORDINATORS Sergio Margulis & Carolina Burle Schmidt Dubeux
GENERAL COORDINATOR Jacques Marcovitch
FEAUSPSao Paulo
2011
LOSE
VSKY
PAV
EL/S
HUTT
ERST
OCK
This study is inspired in the Stern Report (UK), which conducted a comprehensive economic analysis of the climate change issue at global level. Conceived by
research institutions working in this field, the principles which guided the study are scientific method, freedom of thought and the search for consensus through dialogue among all its authors, reviewers and members of the Advisory Council. Because this is a pioneer study, its results should be considered as preliminary
approaches to a complex topic and inputs to the debate.
Acknowledgements
The authors are indebted to countless people for their valuable contributions that made this study possible. The authors would like to thank all of these people for their firm
support that helped this project come to fruition.
Alan Charlton, Ana Carsalade, André Nassar, Christophe de Gouvello, Christopher Taylor, Cristiane Fontes, David Corderi, Daniel Bradley, Dimitri Zenghelis, Dorte Verner, Eduardo
Sousa, Eustáquio Reis, Ines Iwashita, Iran Magno, James Keough, James Warren Evans, John Briscoe, José Eli da Veiga, Laura Tuck , Luciana Carrijo, Marcia Guimarães, Marcia Sumire, Mark Lundel, Miranda Munro, Nicholas Stern, Octavio Tourinho,
Osvaldo Soliano Pereira, Peter Collecot, Ronaldo Seroa da Motta, Stephanie Al-Qaq, and Thatyanne Moreira.
Any errors and omissions that may remain in this work are, of course, the sole responsibility of the authors.
www.economiadoclima.org.br
4
EXECUTIVE SUMMARY
1 INTRODUCTION
2 CLIMATE SCENARIOS IN BRAZIL
3 ENVIRONMENTAL, ECONOMIC AND SOCIAL IMPACTS 3.1 Water resources 3.2 Energy3.3 Agricultural production 3.4 Land use patterns3.5 Biodiversity in the Amazon3.6 Coastal zone 3.7 North East region
4 ADAPTING TO CLIMATE CHANGE 4.1 Agricultural sector
4.2 Energy sector4.3 Coastal zone
5 MACROECONOMIC ANALYSIS
6 EMISSION REDUCTIONS 6.1 Reduction of deforestation in the Brazilian Amazon and its opportunity costs 6.2 Biofuels 6.2.1 Biofuel scenarios 6.2.2 Economic aspects of sugarcane expansion 6.2.3 Socio-environmental aspects of expansion of sugarcane crops 6.3 Effects of taxation on carbon emissions in the economy 6.4 Energy sector
7 CONCLUSIONS AND RECOMMENDATIONS
ANNEX
REFERENCES
6
11
19
23
43
51
57
73
80
81
Contents
www.economiadoclima.org.br
5
Executive summaryThe climate transition estimated by the Intergovernmental Panel on Climate Change (IPCC) will affect the world’s natural resources, economy and societies in a scale that is yet unknown. The study Economia das Mudanças do Clima no Brasil – EMCB (The Economics of Climate Change in Brazil) is a pioneering initiative to analyse and quantify the impact of climate change on the Country’s development agenda. Without a minimum knowledge base on these trends, no tools are available to decision-makers to identify the most severe and pressing risks and to assess and implement the most effective prevention and adaptation measures in terms of costs and benefits.
For the first time in Brazil, a large interdisciplinary team, comprised primarily of scientists and economists from leading research institutions in the Country, was brought together to develop projections for various sectors. The starting point was computational models that provided projections on future behaviour of the climate within the national territory, including aspects such as temperature and rainfall levels. These projections were fed into models to simulate some strategic segments of the economy, and they translated the expected impacts on each sector into economic terms according to two potential future climate trends developed by the IPCC – scenarios A2 and B2.
These IPCC climate trends are based on the hypothetical future behaviour of the global economy. This study makes an attempt, to the extent possible, to simulate the future behaviour of the Brazilian economy that is consistent with the same hypotheses made by IPCC in relation to the global economy. The scenarios that were generated for the Brazilian economy are called A2-BR, which was simulated with and without climate change according to IPCC’s A2 climate scenario; and scenario B2-BR, which was also simulated with and without climate change according to IPCC’s B2 climate scenario. They represent future trends for the Brazilian economy assuming that the world will evolve globally according to IPCC’s (economic) assumptions contained in climate scenario A2 and climate scenario B2 [1].
Although the climate-related problems associated to global warming are long term issues, the year 2050 was used as the basis for simulations, thus excluding the most serious effects on productivity and growth, which will be felt more intensely in the second half of the 21st century. This was necessary because the uncertainties involved – mainly macro-economic uncertainties – were still very significant and the database did not support longer-term projections. Some of the sector-specific analyses, however, go beyond 2050. In addition to this time constraint, the simulations in this study focused on the average behaviour of the variables. This was due to the difficulty in using the models to obtain adequate renditions of the uncertainties involved in extreme climate change situations.
This summary lists the main results obtained from this pioneering study, followed by recommended public policies. Some of the main conclusions are that the worst effects of climate change will affect the North and North East regions, i.e., the poorest regions in Brazil, and that the cost of inaction today means the exacerbation of regional and income inequalities.
Macro-economic perspective It is estimated that, without climate change,
Brazil’s GDP will be R$15.3 trillion (currency value as of 2008) under scenario A2-BR in 2050, and R$16 trillion under scenario B2-BR. When the impact of climate change is factored in, these GDP figures are reduced by 0.5% and 2.3%, respectively.
Brought forward to the present value at an annual discount rate of 1%, these losses would be between R$719 billion and R$3.6 trillion, which would be equivalent to wasting at least one whole year of growth over the coming 40 years.
Either with or without climate change, the GDP is always higher under B2-BR than under A2-BR. This means that according to the cleaner trend
[1] The distinction between climate scenarios and socio-
economic scenarios is an important one. Although the
majority of studies refer to the behaviour of the domestic economy as scenarios A2 and B2, there is no such thing as a
single behaviour for the domestic economy under the each one of
the global economic scenarios. The global economy could follow an
A2 trend and Brazil could follow a trend that is more akin to B2. Even
as this study has attempted to make domestic trends consistent
with global trends, it seems to make sense to maintain terms A2
and B2 to refer strictly to global climate scenarios A2 and B2, and
to use the terms scenarios A2-BR and B2-BR to refer to economic
and climate scenarios when these are applied to the case of Brazil.
provided by scenario B2-BR the economy will grow more, not less. Under both scenarios, poverty increases due to climate change, but this increase is virtually negligible.
There is supposed to be an annual average loss for Brazilian citizens ranging from R$534 (US$291) to R$1,603 (US$874) in 2050. The current value in 2008 of reductions in consumption accrued by 2050 is supposed to be between R$6,000 and R$18,000, thus accounting for 60% to 180% of the current annual per capita consumption.
Regional perspectives
The Amazon and the North East region are
6
www.economiadoclima.org.br
Executive Summary | The Economics of Climate Change in Brazil
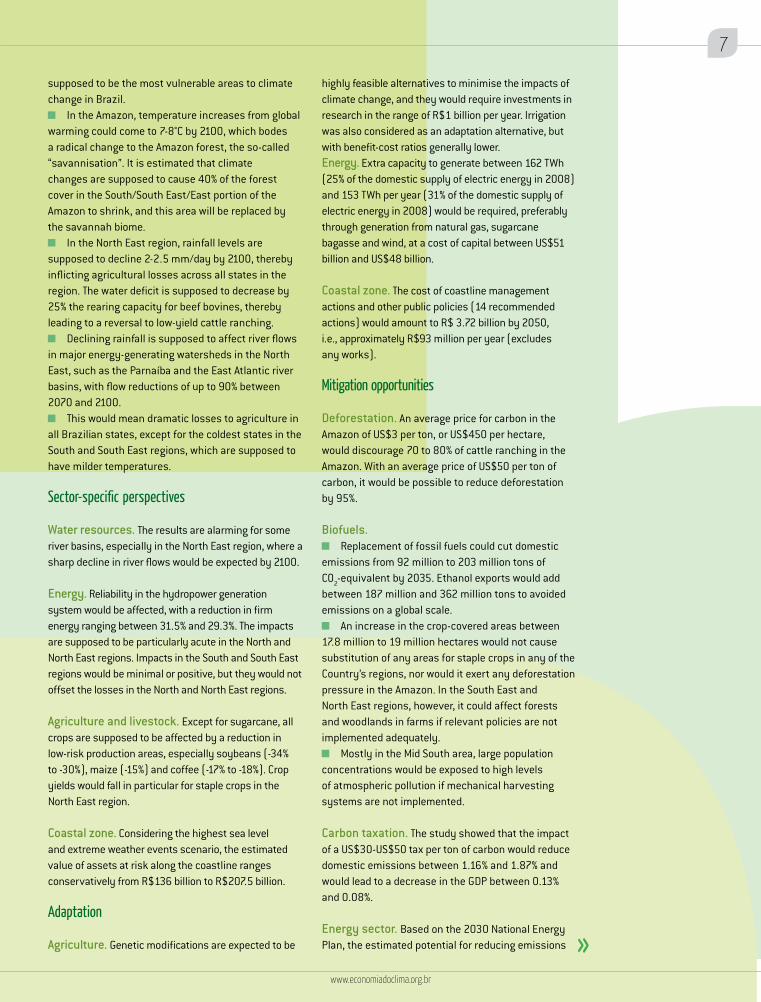
supposed to be the most vulnerable areas to climate change in Brazil.
In the Amazon, temperature increases from global warming could come to 7-8°C by 2100, which bodes a radical change to the Amazon forest, the so-called “savannisation”. It is estimated that climate changes are supposed to cause 40% of the forest cover in the South/South East/East portion of the Amazon to shrink, and this area will be replaced by the savannah biome.
In the North East region, rainfall levels are supposed to decline 2-2.5 mm/day by 2100, thereby inflicting agricultural losses across all states in the region. The water deficit is supposed to decrease by 25% the rearing capacity for beef bovines, thereby leading to a reversal to low-yield cattle ranching.
Declining rainfall is supposed to affect river flows in major energy-generating watersheds in the North East, such as the Parnaíba and the East Atlantic river basins, with flow reductions of up to 90% between 2070 and 2100.
This would mean dramatic losses to agriculture in all Brazilian states, except for the coldest states in the South and South East regions, which are supposed to have milder temperatures.
Sector-specific perspectives
Water resources. The results are alarming for some river basins, especially in the North East region, where a sharp decline in river flows would be expected by 2100.
Energy. Reliability in the hydropower generation system would be affected, with a reduction in firm energy ranging between 31.5% and 29.3%. The impacts are supposed to be particularly acute in the North and North East regions. Impacts in the South and South East regions would be minimal or positive, but they would not offset the losses in the North and North East regions.
Agriculture and livestock. Except for sugarcane, all crops are supposed to be affected by a reduction in low-risk production areas, especially soybeans (-34% to -30%), maize (-15%) and coffee (-17% to -18%). Crop yields would fall in particular for staple crops in the North East region.
Coastal zone. Considering the highest sea level and extreme weather events scenario, the estimated value of assets at risk along the coastline ranges conservatively from R$136 billion to R$207.5 billion.
Adaptation
Agriculture. Genetic modifications are expected to be
highly feasible alternatives to minimise the impacts of climate change, and they would require investments in research in the range of R$1 billion per year. Irrigation was also considered as an adaptation alternative, but with benefit-cost ratios generally lower.Energy. Extra capacity to generate between 162 TWh (25% of the domestic supply of electric energy in 2008) and 153 TWh per year (31% of the domestic supply of electric energy in 2008) would be required, preferably through generation from natural gas, sugarcane bagasse and wind, at a cost of capital between US$51 billion and US$48 billion.
Coastal zone. The cost of coastline management actions and other public policies (14 recommended actions) would amount to R$ 3.72 billion by 2050, i.e., approximately R$93 million per year (excludes any works).
Mitigation opportunities
Deforestation. An average price for carbon in the Amazon of US$3 per ton, or US$450 per hectare, would discourage 70 to 80% of cattle ranching in the Amazon. With an average price of US$50 per ton of carbon, it would be possible to reduce deforestation by 95%.
Biofuels. Replacement of fossil fuels could cut domestic
emissions from 92 million to 203 million tons of CO2-equivalent by 2035. Ethanol exports would add between 187 million and 362 million tons to avoided emissions on a global scale.
An increase in the crop-covered areas between 17.8 million to 19 million hectares would not cause substitution of any areas for staple crops in any of the Country’s regions, nor would it exert any deforestation pressure in the Amazon. In the South East and North East regions, however, it could affect forests and woodlands in farms if relevant policies are not implemented adequately.
Mostly in the Mid South area, large population concentrations would be exposed to high levels of atmospheric pollution if mechanical harvesting systems are not implemented.
Carbon taxation. The study showed that the impact of a US$30-US$50 tax per ton of carbon would reduce domestic emissions between 1.16% and 1.87% and would lead to a decrease in the GDP between 0.13% and 0.08%.
Energy sector. Based on the 2030 National Energy Plan, the estimated potential for reducing emissions
7
www.economiadoclima.org.br
this modelling be incorporated into the newly created research networks, such as the Brazilian Network for Global Climate Change Research (Rede CLIMA) and the National Institute for Climate Change Science and Technology, which include the majority of EMCB’s research teams.
Limitations of this studyThe pioneering nature of this study entails
a number of limitations that must be taken into account when reviewing its results. There are five key limitations:
Use of a single global climate model on which the sector-specific and economic analyses were based. This decision was made in view of the level of knowledge available when the study was launched through simulations of probability distribution functions for several parameters, and INPE’s experience with the downscaling of global models.
The deterministic approach of the study, i.e., explicit omission of the risk and uncertainty and emphasis on expected average values, with a restricted focus on the immediate costs of minor temperature changes for a limited set of measurable impacts.
The fact that the estimated values for future rainfall according to the various climate models do not agree whether it is a plus or a minus (i.e., an increase or a decrease), which poses a limitation on projections on the future climate and its potential economic impacts.
The incomplete technical information database available, from future climate models and projections of future climate to ecological and socio-economic data, including economic valuation. In the case of more complex sectors, or when the technical knowledge is limited (such as biodiversity and coastal zones), the analyses and economic valuation are of a preliminary nature.
The omission of long-term technological changes due to missing scenarios and analyses on which projections would be based; a decision that was due to the early stage of models and technical constraints to link all models, from climate variation projections to its socio-economic impacts.
This study focuses on the national level, and local analyses and impacts on institutional, legal and cultural aspects have been left for future studies. Social analyses were limited to the results from the macroeconomic analysis and only partially from the various chapters on specific sectors. In addition, this study chose not to estimate the impacts of climate change on infrastructure, and even less so on adaptation alternatives; these aspects will be addressed in future studies, and they represent significant costs.
would be 1,8 Gtons of CO2, accumulated in the 2010-2030 period. With a discount rate of 8% per year, the estimated cost would be negative, i.e., there would be a gain, or benefit, of US$34 billion by 2030, which is equivalent to US$13 per ton of CO2.
Priority actions
The potential costs and risks of climate change for Brazil are significant and would have a greater effect on the poor populations in the North and North East regions, so social protection policies in these regions must be enhanced.
It is both possible and necessary to match ambitious growth targets to reductions of greenhouse gas emissions in order to ensure access to markets that favour low carbon emission goods in their lifecycles.
Climate change should be considered in government policies for the environmental sector, including emission and sequestration of greenhouse gases in the licensing process both in the case of the brown environmental agenda (pollution) and the green agenda (agricultural and related sectors) – transport, housing, agriculture and industrial sectors.
Ensuring that the energy matrix remains clean by investing in the various highly profitable energy efficiency options.
At present, the primary recommendation is to stop deforestation in the Amazon. Deforestation causes significant changes to local and regional climates, and could result in an estimated loss of up to 38% of species and 12% of environmental services by 2100.
Enhancing technical knowledge on the issue by developing climate models, models that translate expected changes in climate into physical impacts on the various sectors of the economy and provide more effective mitigation and adaptation.
Investing in cutting-edge agricultural research, particularly in genetic modification of cultivars.
Developing more studies to identify the nature of and measure the risks of extreme events beyond 2050 and 2100.
Finally, it should be pointed out that, especially as a result of the national debate on the stance that Brazil should adopt in international negotiations, there has been a lively discussion of scenarios that take into account the great potential for mitigation in the Country as it seeks to switch into a low-carbon economy.
Some call this “Brazil, the Environmental Powerhouse”. The modelling baseline described herein will help develop a number of different economic, social and climatic/environmental scenarios that incorporate the mitigation measures to be tested. Therefore, it is recommended for the near future that
8
www.economiadoclima.org.br
Executive Summary | The Economics of Climate Change in Brazil
9
www.economiadoclima.org.br
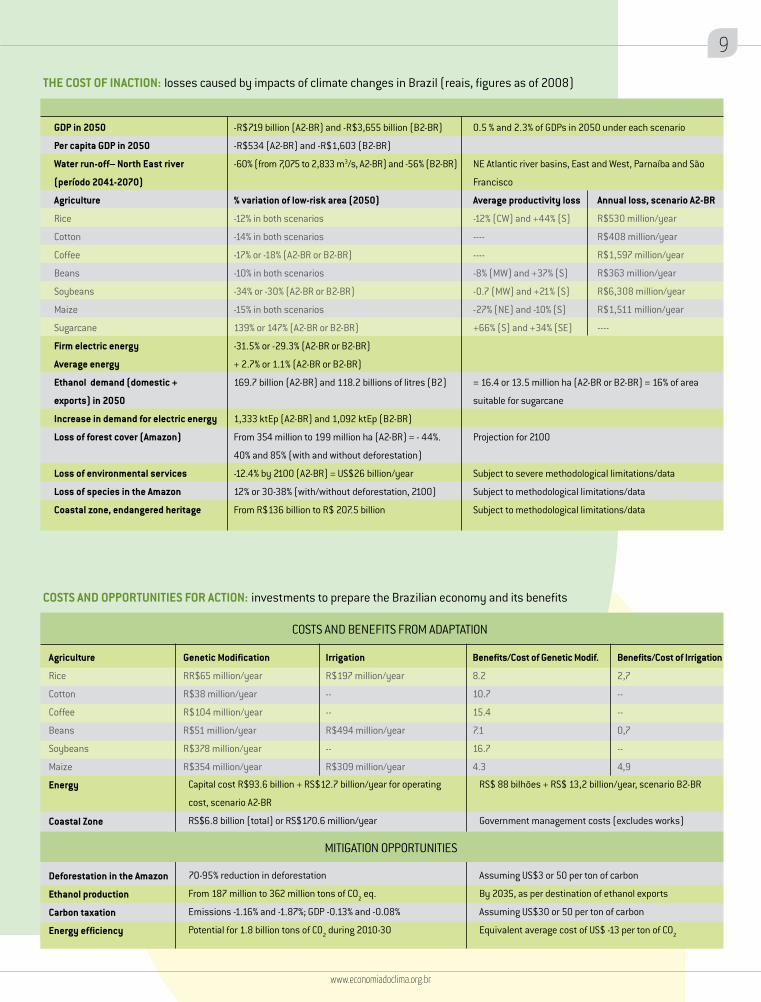
COSTS AND OPPORTUNITIES FOR ACTION: investments to prepare the Brazilian economy and its benefits
Agriculture
Rice
Cotton
Coffee
Beans
Soybeans
Maize
Energy
Coastal Zone
Deforestation in the Amazon
Ethanol production
Carbon taxation
Energy efficiency
COSTS AND BENEFITS FROM ADAPTATION
MITIGATION OPPORTUNITIES
Genetic Modification
RR$65 million/year
R$38 million/year
R$104 million/year
R$51 million/year
R$378 million/year
R$354 million/year
Irrigation
R$197 million/year
--
--
R$494 million/year
--
R$309 million/year
Benefits/Cost of Genetic Modif.
8.2
10.7
15.4
7.1
16.7
4.3
Benefits/Cost of Irrigation
2,7
--
--
0,7
--
4,9
Capital cost R$93.6 billion + RS$12.7 billion/year for operating
cost, scenario A2-BR
RS$6.8 billion (total) or RS$170.6 million/year
70-95% reduction in deforestation
From 187 million to 362 million tons of CO2 eq.
Emissions -1.16% and -1.87%; GDP -0.13% and -0.08%
Potential for 1.8 billion tons of CO2 during 2010-30
RS$ 88 bilhões + RS$ 13,2 billion/year, scenario B2-BR
Government management costs (excludes works)
Assuming US$3 or 50 per ton of carbon
By 2035, as per destination of ethanol exports
Assuming US$30 or 50 per ton of carbon
Equivalent average cost of US$ -13 per ton of CO2
THE COST OF INACTION: losses caused by impacts of climate changes in Brazil (reais, figures as of 2008)
GDP in 2050
Per capita GDP in 2050
Water run-off– North East river
(período 2041-2070)
Agriculture
Rice
Cotton
Coffee
Beans
Soybeans
Maize
Sugarcane
Firm electric energy
Average energy
Ethanol demand (domestic +
exports) in 2050
Increase in demand for electric energy
Loss of forest cover (Amazon)
Loss of environmental services
Loss of species in the Amazon
Coastal zone, endangered heritage
-R$719 billion (A2-BR) and -R$3,655 billion (B2-BR)
-R$534 (A2-BR) and -R$1,603 (B2-BR)
-60% (from 7,075 to 2,833 m3/s, A2-BR) and -56% (B2-BR)
% variation of low-risk area (2050)
-12% in both scenarios
-14% in both scenarios
-17% or -18% (A2-BR or B2-BR)
-10% in both scenarios
-34% or -30% (A2-BR or B2-BR)
-15% in both scenarios
139% or 147% (A2-BR or B2-BR)
-31.5% or -29.3% (A2-BR or B2-BR)
+ 2.7% or 1.1% (A2-BR or B2-BR)
169.7 billion (A2-BR) and 118.2 billions of litres (B2)
1,333 ktEp (A2-BR) and 1,092 ktEp (B2-BR)
From 354 million to 199 million ha (A2-BR) = - 44%.
40% and 85% (with and without deforestation)
-12.4% by 2100 (A2-BR) = US$26 billion/year
12% or 30-38% (with/without deforestation, 2100)
From R$136 billion to R$ 207.5 billion
0.5 % and 2.3% of GDPs in 2050 under each scenario
NE Atlantic river basins, East and West, Parnaíba and São
Francisco
Average productivity loss
-12% (CW) and +44% (S)
----
----
-8% (MW) and +37% (S)
-0.7 (MW) and +21% (S)
-27% (NE) and -10% (S)
+66% (S) and +34% (SE)
= 16.4 or 13.5 million ha (A2-BR or B2-BR) = 16% of area
suitable for sugarcane
Projection for 2100
Subject to severe methodological limitations/data
Subject to methodological limitations/data
Subject to methodological limitations/data
Annual loss, scenario A2-BR
R$530 million/year
R$408 million/year
R$1,597 million/year
R$363 million/year
R$6,308 million/year
R$1,511 million/year
----
ALBE
RT H
. TEI
CH/S
HUTT
ERST
OCK

CHAPTER 1
Introduction
The non specialised literature on the causes and consequences of climate change can be misleading at times. The roots of the problem and the required measures to mitigate it involve all countries and are fun-damentally associated to GHG emissions. These include fossil fuels, renewable sources and energy efficiency issues, international agreements, emission taxation, changes in consumer behaviour and habits, etc.
The emission reduction of one ton of CO2 could come from either Sweden or Ethio-pia: the benefits are identical and shared by all countries. Therefore, the core mitiga-
MITIGATION AND ADAPTATION
is mainly due to man’s actions, the rich world is mostly liable for the problem to start with, which is further compounded by the fact that these very GHG emissions have stoked economic growth in the rich world. It is therefore fair that the developing nations, too, have the opportunity to make use of per capita emissions at the same levels as the developed world. The challenge is precisely resolving this ‘unfair’ equation: ensuring that developing countries have the equitable right to growth without increasing GHG concentrations in the atmosphere.
Hence, it is critical and urgent that all countries seek a consensus that is not only technically and politically feasible, but also equitable. However, economic studies that support the decision-making process at domestic and international levels are necessary. Therefore, this is the primary objective of this study.
B. Objectives and scope of this study
The purpose of this study is to conduct an economic assessment of the impacts of climate change in Brazil. Considering the various scenarios for this phenomenon, Brazil’s main economic and social vulnerabilities are identified, as well as cost-effective strategies to cope with the risks associated to these scenarios. A fundamental issue discussed here is the extent to which global warming has an influence on the Country’s
IntroductionThe primary purpose of this study is to assess the extent to which climate change has an influence on Brazil’s development agenda. It was launched in mid-2007 as a joint initiative of the British Embassy in Brazil, the Brazilian Academy of Science and Brazil’s public institutions that joined the study. Once the conceptual framework was established, specialists from 11 institutions started to collaborate under the technical co-ordination of two specialists. Five technical workshops and four consultation meetings with the Advisory Council were held over the course of the 24 months during which the study was developed (see Annex).
A. Background
The climate changes brought by global warming are a social problem of utmost importance to Brazil. The notion that these are “issues to be addressed by the rich countries” – because they caused these issues and therefore they must solve them – is an inaccurate rendition of the principle of common but differentiated responsibility enshrined in the UN Convention on Climate Change. It is increasingly improbable that its impacts can be avoided simply through mitigation efforts by the richest nations since the annual emissions by some developing countries such as China, India and Brazil are now higher than those of several developed economies (in absolute terms, but not on a per capita basis).
Global warming is an issue that will primarily affect the poorest (and therefore most vulnerable) populations, and there is just very little time to opt for inaction. The economic aspect of this problem is discussed in this study.
The two latest reports by the IPCC (2001 and 2007) and many other recent scientific papers state that climate change is an unequivocal fact and is primarily caused by man. A number of scientific and climate modelling breakthroughs have taken place since 2001 that have made it possible to adjust estimates on an ongoing basis. IPCC’s Fourth Assessment Report (AR4, 2007) provides an extreme variation between 1.1°C and 6.4°C (4°C on average) by the end of the 21st century, using the 1990 average as a reference. In addition to temperature increases, changes are expected in rainfall patterns, although these projections are more difficult and remain extremely uncertain.
Because there is increasing agreement today that the increase in greenhouse gas (GHG) concentrations
12
www.economiadoclima.org.br
Introduction | The Economics of Climate Change in Brazil
tion strategy is a cost-effectiveness one: in ideal terms, the entire world should seek the cheapest way of reducing emissions of any GHG volumes, regardless of country and source.
On the other hand, the inevitability of cli-mate change forces all countries to seek indi-vidual adaptation strategies. Differently from mitigation, both the costs and benefits from adaptation actions accrue to every country. Brazil’s decision to make massive or small in-vestments in adaptation does not affect any other countries in principle. In sum, the is-sues here are of a different nature; the costs
and benefits apply differently to the various countries, and the incentives to prioritise a specific problem are also distinct.
Adaptation is not a substitute for mitiga-tion since there are clear limits on what it can achieve. Global efforts should undoubtedly focus on mitigation. As a matter of responsi-bility in view of the exorbitant costs involved, however, the international community should also aid the poorest countries to develop their own adaptation strategies and fund or finance their priority actions.
Despite some inherent differences, miti-gation and adaptation do bear a relationship:
the efforts made toward solving one problem attenuate the need to act with regard to the other. In practice, in these early stages of un-derstanding and assessing global warming it is reasonable that issues are addressed independently and without dismissing joint and complementary action opportunities. Perhaps the best example is provided by the forestry sector, where reforestation is both a mitigation and an adaptation measure: the growing forests absorb CO
2 (mitigation) while helping maintain environmental ser-vices, which generally enhances resiliency to climate shocks (adaptation).
development agenda, given that Brazil has large areas covered by forests and the agriculture sector contributes a significant share to the GDP and exports.
The study’s overall objectives are as follows: To bring together the main research institutions to
look at the problem from a multidisciplinary perspective; To use the existing local knowledge as an input to the
economic analysis of the likely impacts of climate change in Brazil;
To contribute to the debate on the steps that Brazil should take regarding climate change, based on sound technical and economic analyses;
To support development and implementation of public policies in Brazil, as well as to establish positions for international negotiations that are consistent with the Country’s interests while optimising its contributions to address a shared global problem.
The specific objectives are: To conduct an economic assessment of the likely
impacts of different climate change scenarios in Brazil; To assess the likely social and regional impacts of
different climate change scenarios; To identify cost-effective mitigation actions and their
potential benefits at local and national levels; To identify adaptation strategies for selected sectors
and to assess their costs and benefits; To conduct an economic, social and environmental
analysis of the potential for biofuels in Brazil, particularly sugarcane, in terms of the opportunities for gasoline replacement and exportation to international markets;
To assess economic opportunities for the Amazon region in terms of emission reductions, benefits from avoided deforestation and trade-offs between local, national and global interests.
C. Describing the issue: challenges in this study
Uncertainty and risk. The regional climate models point to a risk of “savannisation” of a sizeable portion of the Amazon, more intense and frequent droughts in the North East region, heavy rainfalls and floods in coastal and urban areas in the South East and South regions, and significant reductions in the hydropower generation potential in the North, Mid-West and North East regions. This is, however, just a part of the problem. Countless uncertainties are involved in the modelling of the impacts of climate change, especially when the 20-50 year planning timeframe is extrapolated.
Economic assessment of climate changes and the policies to address them depend on information that is not yet available. The uncertainty associated to the science of climate and climate projections has a substantial influence on economic analyses and the policy-making process. This uncertainly, however, should not be a reason for inaction; rather, it should be the opposite: it simply increases the cost of inaction.
Action-related decisions regarding climate change are subject to two types of risks: (i) not acting now and encountering an unforeseen impact in the future, and (ii) opting for a preventative action now that proves to be unnecessary in the future. Because the climate change-related risk to which we are exposed involves survival of human beings and the planet, it seems to make sense that preventative actions are a priority whenever possible.
Insofar as resources are scarcer in poor nations, however, incentives to invest in prevention and preparation for climate change are less significant than in rich countries, where the risks of overinvestment are smaller. Most social problems have been solved in
www.economiadoclima.org.br
13
the more developed nations, and their population has achieved a satisfactory level of quality of life. In the least developed countries, issues such as poverty eradication and attainment of a minimum level of health and food safety take priority over climate change when a decision of where to invest needs to be made.
Discontinuities. Many of the problems and impacts have a strong level of discontinuity, i.e., events show a certain tendency until it is suddenly discontinued and the take on an extreme behaviour. Agriculture is a typical example: for many crops, a gradual increase in the average temperature of 2-3°C causes a gradual decrease in productivity that can be greatly mitigated through irrigation, enhanced genetics and other practices. From approximately 3°C, however, it is physiologically impossible to step in the process, regardless of the technology, and this is simply because the plant cannot stand higher temperatures.
Irreversibility. The third aspect, which is related to discontinuity, is irreversibility. In the case of agriculture, if temperatures turned out to return to historical levels, production would be viable again. Savannisation of the Amazon, loss of biodiversity and ecosystems, and the rise in sea levels, however, are irreversible events that are catastrophic to a large extent.
Inaction. Because greenhouse gases remain in the atmosphere for a long time, even if all man-caused emissions could be removed instantly the human kind would still face a certain level of global warming. Additionally, decisions to invest in infrastructure, transportation, urban planning, land use planning, and technologies have an impact on the potential speed of adaptation and change since their effects are applicable for decades. The decision to build a coal-fired thermal power plant today implies that it will hardly be decommissioned before the end of its life, i.e., 20 to 30 years, which means that it will be burning coal and releasing greenhouse gases during its entire life. The decision to build and pave roads spurs consumers to purchase automobiles, and businesses are encouraged to make arrangements for lorry transportation instead of using collective transport systems and other lower-emission alternatives. In sum, several climate phenomena and several decisions made in the present have implications in the very long term and little or nothing can be done to revert these.
Physical and economic modelling. No study can accurately approach the uncertainties involved in climate change, but this is not a justification for ignoring them. By using ‘only’ deterministic models that measure a fixed set of projections, one would be overlooking a considerable portion of the picture. Even so, before attempting to consider all possible risks, it is important to understand the likely implications of global warming based on the most probable average expectations. The tools to assess these impacts are already available.
The first step in this approach is designed to provide a better understanding of the threats posed by climate to a country by accurately measuring what is known today with a high level of certainty: the short term costs of minor temperature changes over a limited set of measurable impacts, in general at market prices. An illustration is provided of what Brazil could look like in the future according to the ‘intermediary’ case expected. The results provided are very alarming, and they are generally underestimations of absolute costs. Future valuation and cost-benefit analyses. From the economic point of view, analysing the implications of global warming in any given country involves two major issues. The first issue refers to the difficulty in valuing
AN INNOVATIVE APPROACH
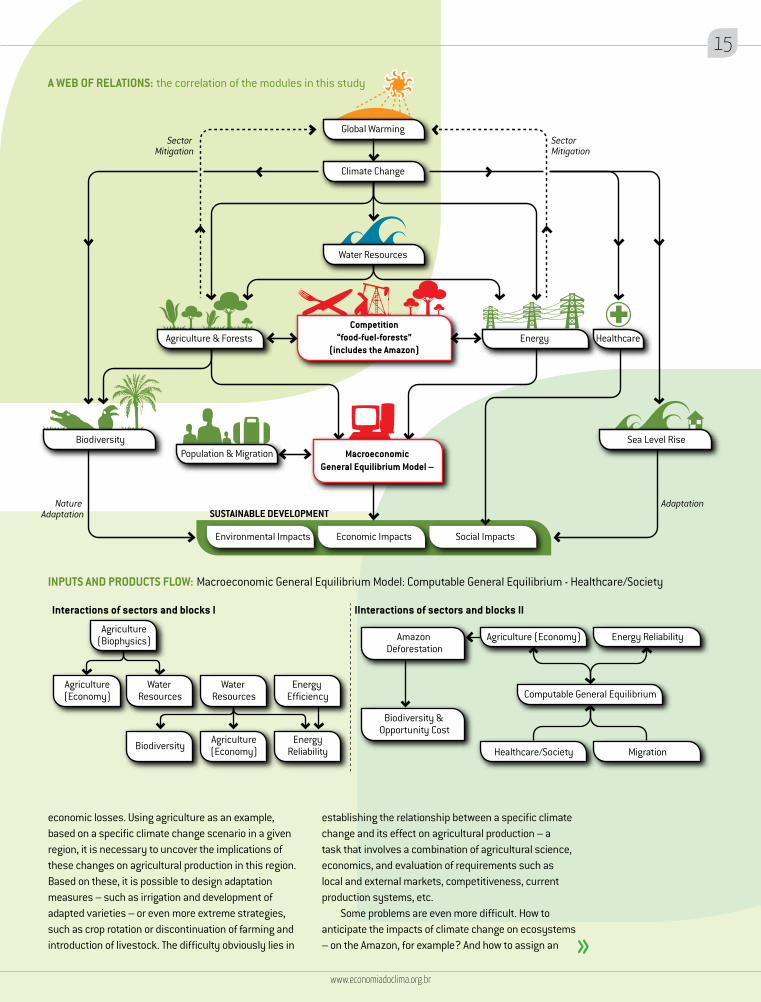
The great methodological challenge in this study is to establish a link between future climate projections and business sectors and several en-vironmental and socio-economic features at local and regional levels. Additionally, a level of aggre-gation or disaggregation of analyses that makes this study relevant and a faithful reflection of the ‘local’ reality at a minimum must be established, and it must also be feasible from the perspective of information and data handling. This is a critical issue in a study that involves a myriad of indus-tries with very diverging natures. Hence, this study attempts to reconcile the macroeconomic perspective (which supposedly integrates sector-specific analyses in an aggregate fashion) with an industry – or microeconomic – perspective. Sector-specific studies seek to include climate variables and analyse their economic effects on the individual sectors, while at national level a macroeconomic model brings together cross-sector analyses and climate variables.
The overall analysis framework can be found in the “Inputs and Products Flow” diagram, whi-ch lays out the relationships between climate changes, business activities and natural resour-ces, in addition to impacts on sustainable deve-lopment goals.
14
www.economiadoclima.org.br
Introduction | The Economics of Climate Change in Brazil14
www.economiadoclima.org.br
Global WarmingSector
Mitigation
Nature Adaptation
Adaptation
Water Resources
Competition“food-fuel-forests”
(includes the Amazon)
Climate Change
Population & MigrationSea Level Rise
SUSTAINABLE DEVELOPMENT
Economic ImpactsEnvironmental Impacts Social Impacts
Biodiversity
Agriculture & Forests Energy Healthcare
Sector Mitigation
Macroeconomic General Equilibrium Model –
A WEB OF RELATIONS: the correlation of the modules in this study
Biodiversity & Opportunity Cost
Agriculture (Economy)
Computable General Equilibrium
Energy Reliability
Interactions of sectors and blocks I IInteractions of sectors and blocks II
Healthcare/Society Migration
Amazon Deforestation
Agriculture(Biophysics)
Agriculture(Economy)
Water Resources
Water Resources
Energy Efficiency
Biodiversity Agriculture(Economy)
EnergyReliability
INPUTS AND PRODUCTS FLOW: Macroeconomic General Equilibrium Model: Computable General Equilibrium - Healthcare/Society
economic losses. Using agriculture as an example, based on a specific climate change scenario in a given region, it is necessary to uncover the implications of these changes on agricultural production in this region. Based on these, it is possible to design adaptation measures – such as irrigation and development of adapted varieties – or even more extreme strategies, such as crop rotation or discontinuation of farming and introduction of livestock. The difficulty obviously lies in
establishing the relationship between a specific climate change and its effect on agricultural production – a task that involves a combination of agricultural science, economics, and evaluation of requirements such as local and external markets, competitiveness, current production systems, etc.
Some problems are even more difficult. How to anticipate the impacts of climate change on ecosystems – on the Amazon, for example? And how to assign an
www.economiadoclima.org.br
15
economic value to potential losses? How to consider the impacts on the poorest populations? Which economic criteria should be used to select from choices of actions that involve a great deal of uncertainty?
The second predicament refers to future valuations. Climate change will become more severe over the course of time, but many of the decisions should be made at the present time. Though backwashes should not increase significantly over the coming decade, it is paramount that current housing and infrastructure construction projects along the coastline include adaptation measures to extreme events associated to rise of the sea level. And the required resources must also be available now, and not in a few decades. However, any benefits will only be realised in at least 30 years. Hence, there is an asymmetry between costs and benefits. Our children and grandchildren will be the ones to reap the benefits, but we are the ones to incur the costs.
This study is divided in five sections, which are laid out in this publication as follows:
Chapter 2: Climate scenarios in Brazil
This chapter describes the physical process triggered by global warming and outlines future climate scenarios. The key question is: “What should we expect for temperature and rainfall variations and changes across the various regions in Brazil?” The results provided by the models are used to develop temperature and rainfall scenarios, among other parameters. All other chapters are based on the data generated by the National Institute for Space Research (INPE), except in the case of analyses of the costal zone and biodiversity.
Chapter 3: Environmental, economic and social impacts
Based on future climate projections, changes are translated into specific physical results. The key question in this section is: “Given the climate change projections, what should we expect in terms of economic, social and environmental impacts?” This section covers the sector-specific analyses and models that link temperature and rainfall variations to specific changes in economic sectors (sometimes called ‘dose-response’ relations). It consists of bottom-top thematic and sector models (partial equilibrium), where impacts and potential responses to climate change are considered from a micro-economic perspective: water resources; agricultural production; land use patterns; energy sector; biodiversity and its services; and the coastal zone. It also includes a summary analysis of the impacts on the North East region, which is particularly affected. Other sectors – notably urban infrastructure – were left out in order to limit the scope of the study.
Chapter 4: Adapting to climate change
The literature on technical and economic analyses regarding adaptation is quite limited, differently from the literature on mitigation, so the discussion of this matter is still at an early stage. The sectors for which some adaptation alternatives were analysed are: (i) agriculture, (ii) energy and (iii) coastal zones. Insofar as possible, the costs involved in these measures are compared to the resulting benefits (damage reduction).
Chapter 5: Macroeconomic analysis
It provides an integrated assessment of the impacts caused by climate change on the Brazilian economy and on the various regions of Brazil, especially in terms of temperature and rainfall. It also looks at the impacts of adaptation policies in Brazil, and how they interact with other macroeconomic factors. The core modelling consists of a computable general equilibrium model (CGE) that can consistently relate to other study models, notably energy demand and supply models, land use and agricultural production. In turn, these are integrated to climate models.
Chapter 6: Emissions reduction
This chapter discusses the main options available to the Country to contribute to the global effort to reduce emissions, focusing primarily on the following: (i) emission reduction costs in the Amazon region; (ii) impact of biofuels in reducing both domestic emissions and emissions by other countries; and (iii) charging a fee on carbon emissions as a mitigation instrument and its impacts on the economy. The fourth item – energy efficiency – is a key one, and it was the topic of a study by the World Bank in partnership with the Brazilian Government. The team in charge of conducting this study included the team who wrote the chapters on energy of the present study.
D. Limitations
This study is a preliminary approach for the analysis of global climate changes from an economic viewpoint. The study looks at a portion of the risk spectrum associated to climate change in Brazil. In spite of its limitations, which are common in studies of this sort that have the same overall objectives, it is a relevant contribution to approach climate change and outline public policies in this area.
The first limitation was that it used only a single global climate model on which the sector and economic analyses were based. This was a deliberate decision when the study was outlined in October 2007, and this was based on the knowledge on simulations for probability distribution
16
www.economiadoclima.org.br
Introduction | The Economics of Climate Change in Brazil
FRON
TPAG
E/SH
UTTE
RSTO
CK
functions regarding a variety of parameters available at the time. In addition, INPE’s experience with downscaling global models was also limited.
The second limitation is the deterministic approach, i.e., explicit omission of risk and uncertainty. As mentioned earlier, a basic characteristic of global climate change is an increase in climate phenomena oscillations coupled with potential extreme events. This preliminary approach employs expected average values, and focuses on what is currently known with a high degree of certainty, i.e., immediate costs from minor temperature changes over a limited set of measurable impacts. Future studies should focus on low-probability, very high-impact events.
The third limitation is of a technical nature and affects similar studies on this topic – the future rainfall estimates by the various climate models do not agree even on their sign (a plus or a minus), i.e., increases or decreases in rainfall. This greatly limits future climate projections and, as a result, potential economic impact projections and decisions regarding steps to be taken.
The fourth limitation is associated to the incomplete technical database available. This involves issues from future climate models and projections to data and
knowledge on the chain of ecological and socio-economic events, including economic valuation. In the case of more complex sectors, or when the technical knowledge is more restricted, such as in the case of biodiversity and coastal zones, the analyses and economic valuation are of a preliminary nature.
Finally, non consideration of technological changes that may take place in the long run should be mentioned, and this is due to the lack of scenarios and analyses on which projections could be based. This decision was due to the early stage of models and technical constraints to link all models, from climate variation projections to its socio-economic impacts.
In sum, this study focuses on the national level, and local analyses and impacts on institutional, legal and cultural aspects have been left for future studies. With regard to social analyses, these were limited to the results from the macroeconomic analysis and only partially from the various chapters on specific sectors. In addition, this study chose not to estimate the impacts of climate change on infrastructure, and even less son on adaptation alternatives. These are areas that point to future research since they involve significant economic costs.
www.economiadoclima.org.br
17

DR. M
ORLE
Y REA
D/SH
UTTE
RSTO
CK
CHAPTER 2
Climate scenarios in Brazil
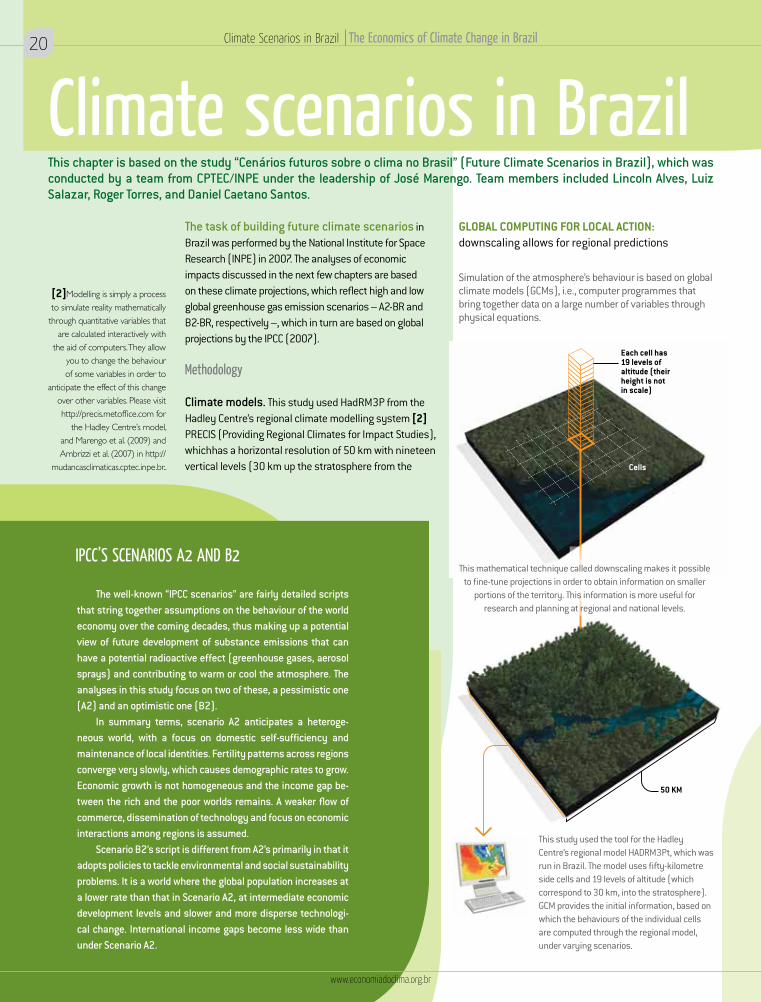
The well-known “IPCC scenarios” are fairly detailed scripts that string together assumptions on the behaviour of the world economy over the coming decades, thus making up a potential view of future development of substance emissions that can have a potential radioactive effect (greenhouse gases, aerosol sprays) and contributing to warm or cool the atmosphere. The analyses in this study focus on two of these, a pessimistic one (A2) and an optimistic one (B2).
In summary terms, scenario A2 anticipates a heteroge-neous world, with a focus on domestic self-sufficiency and maintenance of local identities. Fertility patterns across regions converge very slowly, which causes demographic rates to grow. Economic growth is not homogeneous and the income gap be-tween the rich and the poor worlds remains. A weaker flow of commerce, dissemination of technology and focus on economic interactions among regions is assumed.
Scenario B2’s script is different from A2’s primarily in that it adopts policies to tackle environmental and social sustainability problems. It is a world where the global population increases at a lower rate than that in Scenario A2, at intermediate economic development levels and slower and more disperse technologi-cal change. International income gaps become less wide than under Scenario A2.
IPCC’S SCENARIOS A2 AND B2
50 KM
Cells
Each cell has 19 levels of altitude (their height is not in scale)
Climate scenarios in BrazilGLOBAL COMPUTING FOR LOCAL ACTION: downscaling allows for regional predictions
The task of building future climate scenarios in Brazil was performed by the National Institute for Space Research (INPE) in 2007. The analyses of economic impacts discussed in the next few chapters are based on these climate projections, which reflect high and low global greenhouse gas emission scenarios – A2-BR and B2-BR, respectively –, which in turn are based on global projections by the IPCC (2007).
Methodology
Climate models. This study used HadRM3P from the Hadley Centre’s regional climate modelling system [2] PRECIS (Providing Regional Climates for Impact Studies), whichhas a horizontal resolution of 50 km with nineteen vertical levels (30 km up the stratosphere from the
[2]Modelling is simply a process to simulate reality mathematically
through quantitative variables that are calculated interactively with
the aid of computers. They allow you to change the behaviour of some variables in order to
anticipate the effect of this change over other variables. Please visit http://precis.metof!ce.com for
the Hadley Centre’s model, and Marengo et al. (2009) and Ambrizzi et al. (2007) in http://
mudancasclimaticas.cptec.inpe.br..
Simulation of the atmosphere’s behaviour is based on global climate models (GCMs), i.e., computer programmes that bring together data on a large number of variables through physical equations.
This mathematical technique called downscaling makes it possible to fine-tune projections in order to obtain information on smaller
portions of the territory. This information is more useful for research and planning at regional and national levels.
This study used the tool for the Hadley Centre’s regional model HADRM3Pt, which was run in Brazil. The model uses fifty-kilometre side cells and 19 levels of altitude (which correspond to 30 km, into the stratosphere). GCM provides the initial information, based on which the behaviours of the individual cells are computed through the regional model, under varying scenarios.
This chapter is based on the study “Cenários futuros sobre o clima no Brasil” (Future Climate Scenarios in Brazil), which was conducted by a team from CPTEC/INPE under the leadership of José Marengo. Team members included Lincoln Alves, Luiz Salazar, Roger Torres, and Daniel Caetano Santos.
20
www.economiadoclima.org.br
Climate Scenarios in Brazil |The Economics of Climate Change in Brazil
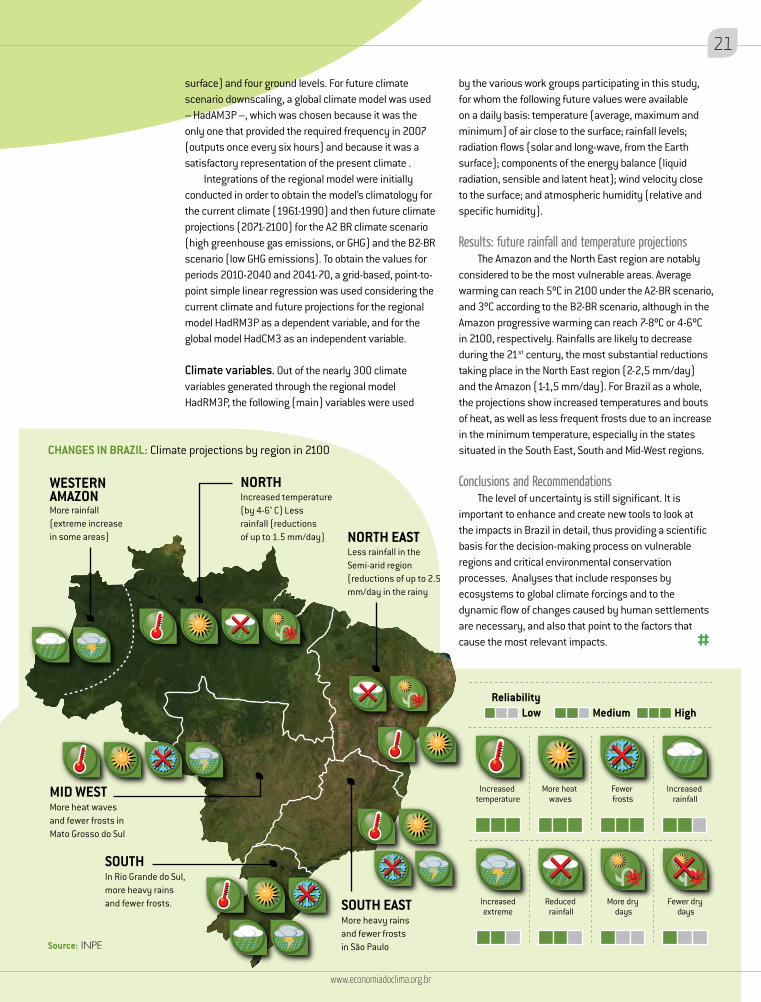
More rainfall(extreme increasein some areas)
Increased temperature (by 4-6° C) Lessrainfall (reductions of up to 1.5 mm/day)
Less rainfall in the Semi-arid region (reductions of up to 2.5 mm/day in the rainy
More heat waves and fewer frosts inMato Grosso do Sul
In Rio Grande do Sul,more heavy rains and fewer frosts.
More heavy rains and fewer frostsin São Paulo
NORTH EAST
NORTHWESTERNAMAZON
SOUTH EAST
MID WEST
SOUTH
ReliabilityLow Medium High
Increased temperature
More heat waves
Fewer frosts
Increased rainfall
Increased extreme
Reduced rainfall
More dry days
Fewer dry days
Source: INPE
surface) and four ground levels. For future climate scenario downscaling, a global climate model was used – HadAM3P –, which was chosen because it was the only one that provided the required frequency in 2007 (outputs once every six hours) and because it was a satisfactory representation of the present climate .
Integrations of the regional model were initially conducted in order to obtain the model’s climatology for the current climate (1961-1990) and then future climate projections (2071-2100) for the A2 BR climate scenario (high greenhouse gas emissions, or GHG) and the B2-BR scenario (low GHG emissions). To obtain the values for periods 2010-2040 and 2041-70, a grid-based, point-to-point simple linear regression was used considering the current climate and future projections for the regional model HadRM3P as a dependent variable, and for the global model HadCM3 as an independent variable.
Climate variables. Out of the nearly 300 climate variables generated through the regional model HadRM3P, the following (main) variables were used
CHANGES IN BRAZIL: Climate projections by region in 2100
by the various work groups participating in this study, for whom the following future values were available on a daily basis: temperature (average, maximum and minimum) of air close to the surface; rainfall levels; radiation flows (solar and long-wave, from the Earth surface); components of the energy balance (liquid radiation, sensible and latent heat); wind velocity close to the surface; and atmospheric humidity (relative and specific humidity).
Results: future rainfall and temperature projectionsThe Amazon and the North East region are notably
considered to be the most vulnerable areas. Average warming can reach 5ºC in 2100 under the A2-BR scenario, and 3ºC according to the B2-BR scenario, although in the Amazon progressive warming can reach 7-8ºC or 4-6ºC in 2100, respectively. Rainfalls are likely to decrease during the 21st century, the most substantial reductions taking place in the North East region (2-2,5 mm/day) and the Amazon (1-1,5 mm/day). For Brazil as a whole, the projections show increased temperatures and bouts of heat, as well as less frequent frosts due to an increase in the minimum temperature, especially in the states situated in the South East, South and Mid-West regions.
Conclusions and RecommendationsThe level of uncertainty is still significant. It is
important to enhance and create new tools to look at the impacts in Brazil in detail, thus providing a scientific basis for the decision-making process on vulnerable regions and critical environmental conservation processes. Analyses that include responses by ecosystems to global climate forcings and to the dynamic flow of changes caused by human settlements are necessary, and also that point to the factors that cause the most relevant impacts.
www.economiadoclima.org.br
21

LUCH
SCHE
N/SH
UTTE
RSTO
CK
CHAPTER 3
Environmental, economic and social impacts
Environmental, economic and social impacts
The key question that runs through the subsections in this chapter is: “Given the climate change
projections, what should we expect in terms of economic, social and environmental impacts?” From
this question derive the sector-specific analyses and models that link temperature and rainfall
variations to specific changes in the various economic sectors (sometimes called ‘dose-response’
relations). Topics covered include: water resources; agricultural production; land use patterns;
energy sector; biodiversity and its services; and the coastal zone.
24
www.economiadoclima.org.br
Environmental, Economic and Social Impacts | The Economics of Climate Change in Brazil
CARL
OS N
ETO/
SHUT
TERS
TOCK
Scenario B2-BR
Water surpluses (flows) (m3/s)
ANA Scenario A2-BR
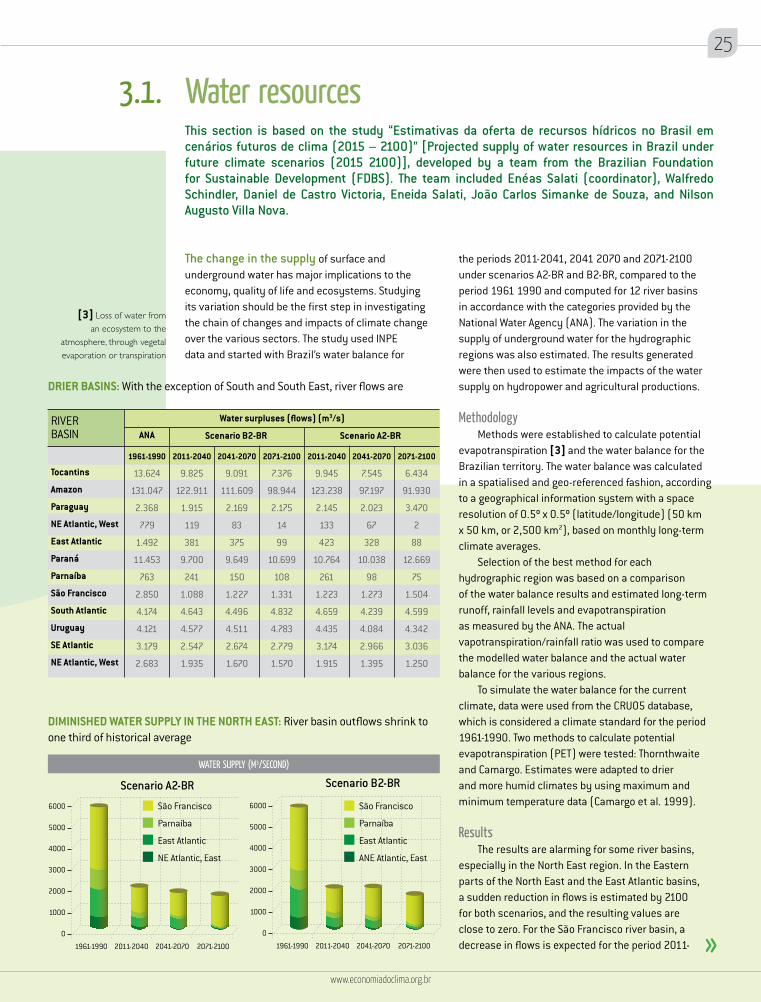
DRIER BASINS: With the exception of South and South East, river flows are
RIVER BASIN
Tocantins
Amazon
Paraguay
NE Atlantic, West
East Atlantic
Paraná
Parnaíba
São Francisco
South Atlantic
Uruguay
SE Atlantic
NE Atlantic, West
2011-2040
9.945
123.238
2.145
133
423
10.764
261
1.223
4.659
4.435
3.174
1.915
2011-2040
9.825
122.911
1.915
119
381
9.700
241
1.088
4.643
4.577
2.547
1.935
1961-1990
13.624
131.047
2.368
779
1.492
11.453
763
2.850
4.174
4.121
3.179
2.683
2041-2070
7.545
97.197
2.023
67
328
10.038
98
1.273
4.239
4.084
2.966
1.395
2041-2070
9.091
111.609
2.169
83
375
9.649
150
1.227
4.496
4.511
2.674
1.670
2071-2100
6.434
91.930
3.470
2
88
12.669
75
1.504
4.599
4.342
3.036
1.250
2071-2100
7.376
98.944
2.175
14
99
10.699
108
1.331
4.832
4.783
2.779
1.570
3.1. Water resources
[3] Loss of water from an ecosystem to the
atmosphere, through vegetal evaporation or transpiration
This section is based on the study “Estimativas da oferta de recursos hídricos no Brasil em cenários futuros de clima (2015 – 2100)” [Projected supply of water resources in Brazil under future climate scenarios (2015 2100)], developed by a team from the Brazilian Foundation for Sustainable Development (FDBS). The team included Enéas Salati (coordinator), Walfredo Schindler, Daniel de Castro Victoria, Eneida Salati, João Carlos Simanke de Souza, and Nilson Augusto Villa Nova.
the periods 2011-2041, 2041 2070 and 2071-2100 under scenarios A2-BR and B2-BR, compared to the period 1961 1990 and computed for 12 river basins in accordance with the categories provided by the National Water Agency (ANA). The variation in the supply of underground water for the hydrographic regions was also estimated. The results generated were then used to estimate the impacts of the water supply on hydropower and agricultural productions.
MethodologyMethods were established to calculate potential
evapotranspiration [3] and the water balance for the Brazilian territory. The water balance was calculated in a spatialised and geo-referenced fashion, according to a geographical information system with a space resolution of 0.5º x 0.5º (latitude/longitude) (50 km x 50 km, or 2,500 km2), based on monthly long-term climate averages.
Selection of the best method for each hydrographic region was based on a comparison of the water balance results and estimated long-term runoff, rainfall levels and evapotranspiration as measured by the ANA. The actual vapotranspiration/rainfall ratio was used to compare the modelled water balance and the actual water balance for the various regions.
To simulate the water balance for the current climate, data were used from the CRU05 database, which is considered a climate standard for the period 1961-1990. Two methods to calculate potential evapotranspiration (PET) were tested: Thornthwaite and Camargo. Estimates were adapted to drier and more humid climates by using maximum and minimum temperature data (Camargo et al. 1999).
ResultsThe results are alarming for some river basins,
especially in the North East region. In the Eastern parts of the North East and the East Atlantic basins, a sudden reduction in flows is estimated by 2100 for both scenarios, and the resulting values are close to zero. For the São Francisco river basin, a decrease in flows is expected for the period 2011-
DIMINISHED WATER SUPPLY IN THE NORTH EAST: River basin outflows shrink to one third of historical average
WATER SUPPLY (M3/SECOND)
4000
3000
2000
1000
0
6000
5000
1961-1990 2011-2040 2041-2070 2071-2100
4000
3000
2000
1000
0
6000
5000
1961-1990 2011-2040 2041-2070 2071-2100
São Francisco
Parnaíba
East Atlantic
NE Atlantic, East
São Francisco
Parnaíba
East Atlantic
ANE Atlantic, East
Scenario B2-BRScenario A2-BR
The change in the supply of surface and underground water has major implications to the economy, quality of life and ecosystems. Studying its variation should be the first step in investigating the chain of changes and impacts of climate change over the various sectors. The study used INPE data and started with Brazil’s water balance for
www.economiadoclima.org.br
25
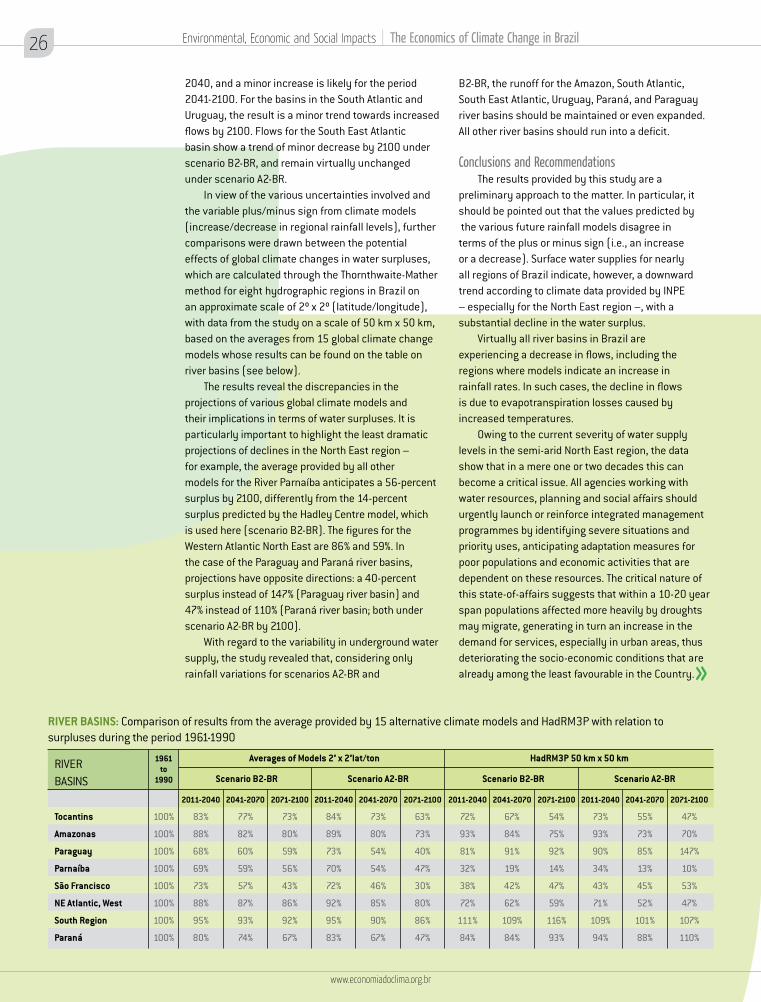
RIVER BASINS: Comparison of results from the average provided by 15 alternative climate models and HadRM3P with relation to surpluses during the period 1961-1990
Scenario B2-BR Scenario B2-BRScenario A2-BR
Averages of Models 2° x 2°lat/ton HadRM3P 50 km x 50 km
Scenario A2-BRRIVER BASINS
Tocantins
Amazonas
Paraguay
Parnaíba
São Francisco
NE Atlantic, West
South Region
Paraná
2011-2040
84%
89%
73%
70%
72%
92%
95%
83%
2011-2040
73%
93%
90%
34%
43%
71%
109%
94%
2011-2040
83%
88%
68%
69%
73%
88%
95%
80%
1961to
1990
100%
100%
100%
100%
100%
100%
100%
100%
2011-2040
72%
93%
81%
32%
38%
72%
111%
84%
2041-2070
73%
80%
54%
54%
46%
85%
90%
67%
2041-2070
55%
73%
85%
13%
45%
52%
101%
88%
2041-2070
77%
82%
60%
59%
57%
87%
93%
74%
2041-2070
67%
84%
91%
19%
42%
62%
109%
84%
2071-2100
63%
73%
40%
47%
30%
80%
86%
47%
2071-2100
47%
70%
147%
10%
53%
47%
107%
110%
2071-2100
73%
80%
59%
56%
43%
86%
92%
67%
2071-2100
54%
75%
92%
14%
47%
59%
116%
93%
2040, and a minor increase is likely for the period 2041-2100. For the basins in the South Atlantic and Uruguay, the result is a minor trend towards increased flows by 2100. Flows for the South East Atlantic basin show a trend of minor decrease by 2100 under scenario B2-BR, and remain virtually unchanged under scenario A2-BR.
In view of the various uncertainties involved and the variable plus/minus sign from climate models (increase/decrease in regional rainfall levels), further comparisons were drawn between the potential effects of global climate changes in water surpluses, which are calculated through the Thornthwaite-Mather method for eight hydrographic regions in Brazil on an approximate scale of 2º x 2º (latitude/longitude), with data from the study on a scale of 50 km x 50 km, based on the averages from 15 global climate change models whose results can be found on the table on river basins (see below).
The results reveal the discrepancies in the projections of various global climate models and their implications in terms of water surpluses. It is particularly important to highlight the least dramatic projections of declines in the North East region – for example, the average provided by all other models for the River Parnaíba anticipates a 56-percent surplus by 2100, differently from the 14-percent surplus predicted by the Hadley Centre model, which is used here (scenario B2-BR). The figures for the Western Atlantic North East are 86% and 59%. In the case of the Paraguay and Paraná river basins, projections have opposite directions: a 40-percent surplus instead of 147% (Paraguay river basin) and 47% instead of 110% (Paraná river basin; both under scenario A2-BR by 2100).
With regard to the variability in underground water supply, the study revealed that, considering only rainfall variations for scenarios A2-BR and
B2-BR, the runoff for the Amazon, South Atlantic, South East Atlantic, Uruguay, Paraná, and Paraguay river basins should be maintained or even expanded. All other river basins should run into a deficit.
Conclusions and RecommendationsThe results provided by this study are a
preliminary approach to the matter. In particular, it should be pointed out that the values predicted by the various future rainfall models disagree in terms of the plus or minus sign (i.e., an increase or a decrease). Surface water supplies for nearly all regions of Brazil indicate, however, a downward trend according to climate data provided by INPE – especially for the North East region –, with a substantial decline in the water surplus.
Virtually all river basins in Brazil are experiencing a decrease in flows, including the regions where models indicate an increase in rainfall rates. In such cases, the decline in flows is due to evapotranspiration losses caused by increased temperatures.
Owing to the current severity of water supply levels in the semi-arid North East region, the data show that in a mere one or two decades this can become a critical issue. All agencies working with water resources, planning and social affairs should urgently launch or reinforce integrated management programmes by identifying severe situations and priority uses, anticipating adaptation measures for poor populations and economic activities that are dependent on these resources. The critical nature of this state-of-affairs suggests that within a 10-20 year span populations affected more heavily by droughts may migrate, generating in turn an increase in the demand for services, especially in urban areas, thus deteriorating the socio-economic conditions that are already among the least favourable in the Country.
26
www.economiadoclima.org.br
Environmental, Economic and Social Impacts | The Economics of Climate Change in Brazil

www.economiadoclima.org.br
27PA
VEL
CHEI
KO/S
HUTT
ERST
OCK
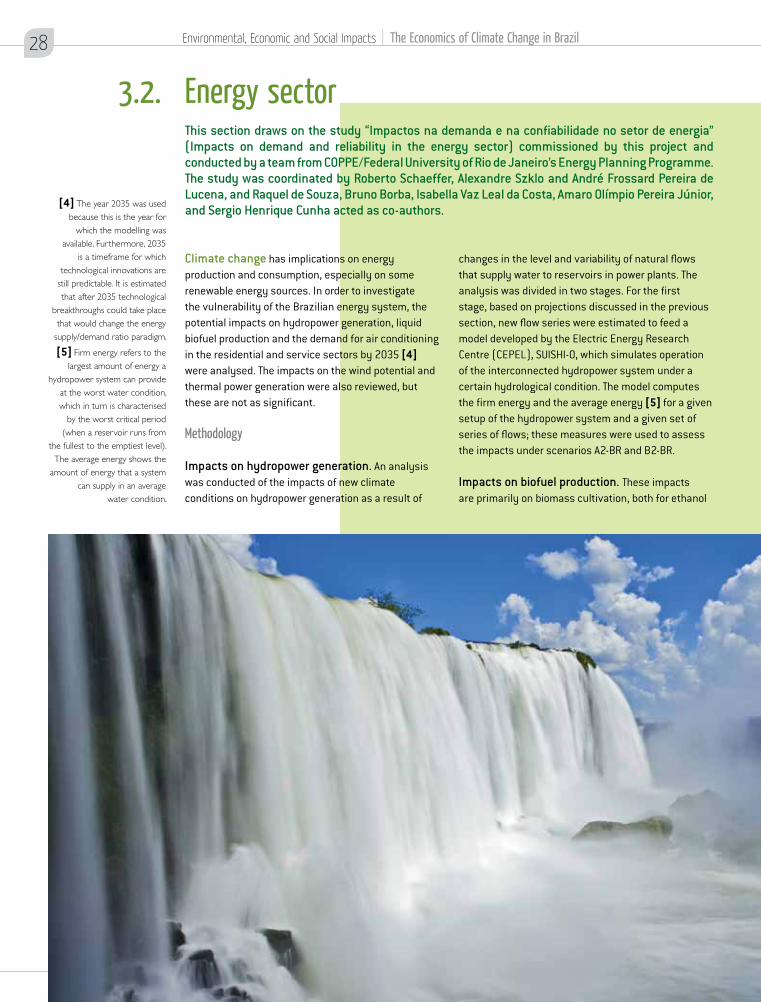
3.2. Energy sectorThis section draws on the study “Impactos na demanda e na confiabilidade no setor de energia” (Impacts on demand and reliability in the energy sector) commissioned by this project and conducted by a team from COPPE/Federal University of Rio de Janeiro’s Energy Planning Programme. The study was coordinated by Roberto Schaeffer, Alexandre Szklo and André Frossard Pereira de Lucena, and Raquel de Souza, Bruno Borba, Isabella Vaz Leal da Costa, Amaro Olímpio Pereira Júnior, and Sergio Henrique Cunha acted as co-authors.
changes in the level and variability of natural flows that supply water to reservoirs in power plants. The analysis was divided in two stages. For the first stage, based on projections discussed in the previous section, new flow series were estimated to feed a model developed by the Electric Energy Research Centre (CEPEL), SUISHI-O, which simulates operation of the interconnected hydropower system under a certain hydrological condition. The model computes the firm energy and the average energy [5] for a given setup of the hydropower system and a given set of series of flows; these measures were used to assess the impacts under scenarios A2-BR and B2-BR.
Impacts on biofuel production. These impacts are primarily on biomass cultivation, both for ethanol
Climate change has implications on energy production and consumption, especially on some renewable energy sources. In order to investigate the vulnerability of the Brazilian energy system, the potential impacts on hydropower generation, liquid biofuel production and the demand for air conditioning in the residential and service sectors by 2035 [4] were analysed. The impacts on the wind potential and thermal power generation were also reviewed, but these are not as significant.
Methodology
Impacts on hydropower generation. An analysis was conducted of the impacts of new climate conditions on hydropower generation as a result of
[4] The year 2035 was used because this is the year for
which the modelling was available. Furthermore, 2035
is a timeframe for which technological innovations are
still predictable. It is estimated that after 2035 technological
breakthroughs could take place that would change the energy
supply/demand ratio paradigm.
[5] Firm energy refers to the largest amount of energy a
hydropower system can provide at the worst water condition, which in turn is characterised
by the worst critical period (when a reservoir runs from
the fullest to the emptiest level). The average energy shows the
amount of energy that a system can supply in an average
water condition.
28
www.economiadoclima.org.br
Environmental, Economic and Social Impacts | The Economics of Climate Change in Brazil
production and biodiesel production. Section 3.3 below provides a projection of the evolution of lands suitable for sugarcane production and other oil seeds (soybeans and sunflower), according to scenarios A2-BR and B2-BR. Based on this study and on industrial productivity figures, an analysis was performed of the potential for new climate conditions to constrain fulfilment of the demand estimated for biofuels in Brazil.
Impacts on the demand for electricity. In order to project the impact on the demand for the energy used in air conditioning in the residential and services sectors, the expansion in consumption was estimated from both increased average temperatures (performance coefficient effect) and increased use due to warm days becoming more frequent (degree-days effect).
Results
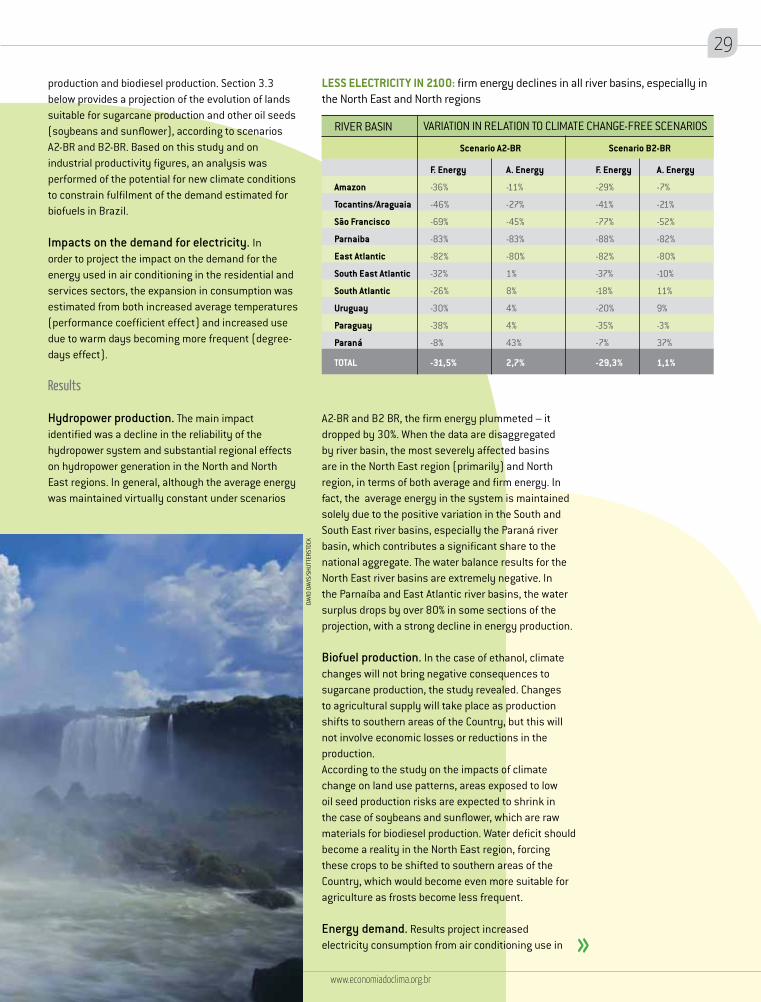
Hydropower production. The main impact identified was a decline in the reliability of the hydropower system and substantial regional effects on hydropower generation in the North and North East regions. In general, although the average energy was maintained virtually constant under scenarios
A2-BR and B2 BR, the firm energy plummeted – it dropped by 30%. When the data are disaggregated by river basin, the most severely affected basins are in the North East region (primarily) and North region, in terms of both average and firm energy. In fact, the average energy in the system is maintained solely due to the positive variation in the South and South East river basins, especially the Paraná river basin, which contributes a significant share to the national aggregate. The water balance results for the North East river basins are extremely negative. In the Parnaíba and East Atlantic river basins, the water surplus drops by over 80% in some sections of the projection, with a strong decline in energy production.
Biofuel production. In the case of ethanol, climate changes will not bring negative consequences to sugarcane production, the study revealed. Changes to agricultural supply will take place as production shifts to southern areas of the Country, but this will not involve economic losses or reductions in the production. According to the study on the impacts of climate change on land use patterns, areas exposed to low oil seed production risks are expected to shrink in the case of soybeans and sunflower, which are raw materials for biodiesel production. Water deficit should become a reality in the North East region, forcing these crops to be shifted to southern areas of the Country, which would become even more suitable for agriculture as frosts become less frequent.
Energy demand. Results project increased electricity consumption from air conditioning use in
LESS ELECTRICITY IN 2100: firm energy declines in all river basins, especially in the North East and North regions
RIVER BASIN
Amazon
Tocantins/Araguaia
São Francisco
Parnaiba
East Atlantic
South East Atlantic
South Atlantic
Uruguay
Paraguay
Paraná
TOTAL
VARIATION IN RELATION TO CLIMATE CHANGE-FREE SCENARIOS
Scenario A2-BR Scenario B2-BR
F. Energy
-36%
-46%
-69%
-83%
-82%
-32%
-26%
-30%
-38%
-8%
-31,5%
A. Energy
-11%
-27%
-45%
-83%
-80%
1%
8%
4%
4%
43%
2,7%
F. Energy
-29%
-41%
-77%
-88%
-82%
-37%
-18%
-20%
-35%
-7%
-29,3%
A. Energy
-7%
-21%
-52%
-82%
-80%
-10%
11%
9%
-3%
37%
1,1%
www.economiadoclima.org.br
29
DAVI
D DA
VIS/
SHUT
TERS
TOCK
be seriously considered for these regions with a view to preparing them to cope with these impacts.
Reliability of the electricity generation system will depend on an expanded installed capacity, which may be idle for long periods of time. The energy sector should seek a more diversified range of generation options that cover not only operating and institutional aspects, but also a diversified energy matrix in order to reduce dependency on a single source of energy. In addition to natural gas-based energy, wind energy and bagasse-based energy can be useful alternatives, even as gas energy provides the advantage of greater operating flexibility.
the residential and services sectors due to higher temperatures. Under the worst-case scenario, the increase will be around 6% (residential sector) and 5% (services sector).
Conclusions and RecommendationsThe most relevant impact is loss of reliability in
hydropower generation as the result of a combination of adverse climate effects and a significant dependency on this resource in Brazil. The North and North East which are the least developed regions in the Country, are projected to be the most vulnerable,. Therefore, additional socio-economic policies should
30
www.economiadoclima.org.br
Environmental, Economic and Social Impacts | The Economics of Climate Change in Brazil
MIC
HAEL
HIE
BER/
SHUT
TERS
TOCK
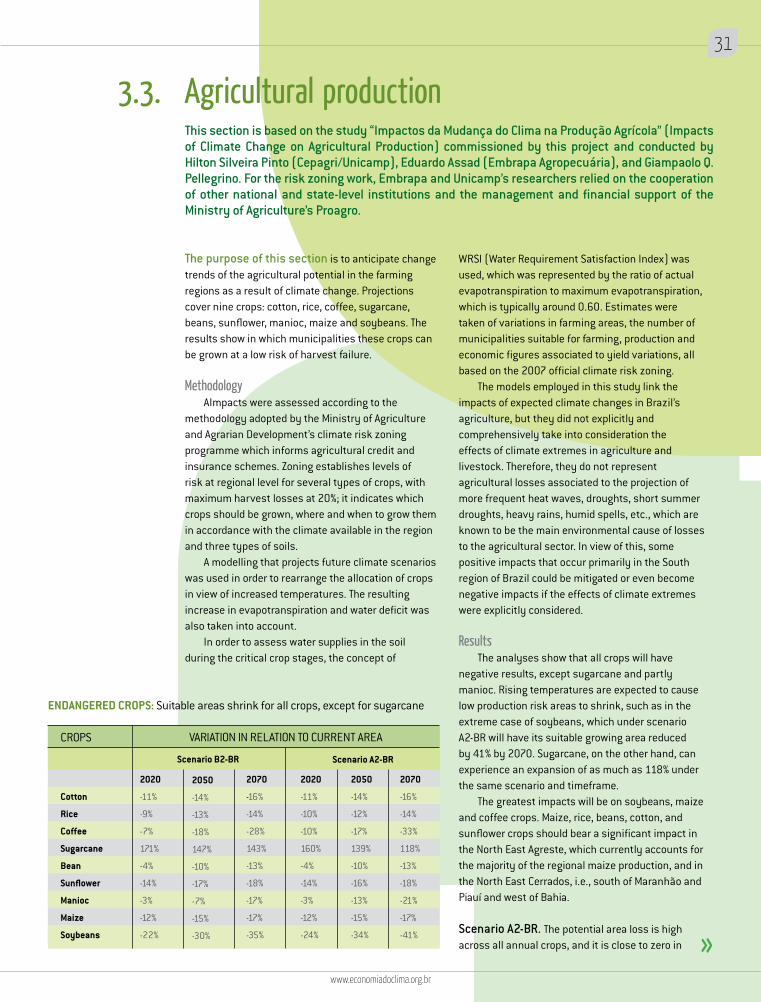
ENDANGERED CROPS: Suitable areas shrink for all crops, except for sugarcane
CROPS
Cotton
Rice
Coffee
Sugarcane
Bean
Sunflower
Manioc
Maize
Soybeans
Scenario B2-BR Scenario A2-BR
2020
-11%
-9%
-7%
171%
-4%
-14%
-3%
-12%
-22%
2050
-14%
-13%
-18%
147%
-10%
-17%
-7%
-15%
-30%
2070
-16%
-14%
-28%
143%
-13%
-18%
-17%
-17%
-35%
2020
-11%
-10%
-10%
160%
-4%
-14%
-3%
-12%
-24%
2050
-14%
-12%
-17%
139%
-10%
-16%
-13%
-15%
-34%
2070
-16%
-14%
-33%
118%
-13%
-18%
-21%
-17%
-41%
This section is based on the study “Impactos da Mudança do Clima na Produção Agrícola” (Impacts of Climate Change on Agricultural Production) commissioned by this project and conducted by Hilton Silveira Pinto (Cepagri/Unicamp), Eduardo Assad (Embrapa Agropecuária), and Giampaolo Q. Pellegrino. For the risk zoning work, Embrapa and Unicamp’s researchers relied on the cooperation of other national and state-level institutions and the management and financial support of the Ministry of Agriculture’s Proagro.
VARIATION IN RELATION TO CURRENT AREA
The purpose of this section is to anticipate change trends of the agricultural potential in the farming regions as a result of climate change. Projections cover nine crops: cotton, rice, coffee, sugarcane, beans, sunflower, manioc, maize and soybeans. The results show in which municipalities these crops can be grown at a low risk of harvest failure.
MethodologyAImpacts were assessed according to the
methodology adopted by the Ministry of Agriculture and Agrarian Development’s climate risk zoning programme which informs agricultural credit and insurance schemes. Zoning establishes levels of risk at regional level for several types of crops, with maximum harvest losses at 20%; it indicates which crops should be grown, where and when to grow them in accordance with the climate available in the region and three types of soils.
A modelling that projects future climate scenarios was used in order to rearrange the allocation of crops in view of increased temperatures. The resulting increase in evapotranspiration and water deficit was also taken into account.
In order to assess water supplies in the soil during the critical crop stages, the concept of
WRSI (Water Requirement Satisfaction Index) was used, which was represented by the ratio of actual evapotranspiration to maximum evapotranspiration, which is typically around 0.60. Estimates were taken of variations in farming areas, the number of municipalities suitable for farming, production and economic figures associated to yield variations, all based on the 2007 official climate risk zoning.
The models employed in this study link the impacts of expected climate changes in Brazil’s agriculture, but they did not explicitly and comprehensively take into consideration the effects of climate extremes in agriculture and livestock. Therefore, they do not represent agricultural losses associated to the projection of more frequent heat waves, droughts, short summer droughts, heavy rains, humid spells, etc., which are known to be the main environmental cause of losses to the agricultural sector. In view of this, some positive impacts that occur primarily in the South region of Brazil could be mitigated or even become negative impacts if the effects of climate extremes were explicitly considered.
ResultsThe analyses show that all crops will have
negative results, except sugarcane and partly manioc. Rising temperatures are expected to cause low production risk areas to shrink, such as in the extreme case of soybeans, which under scenario A2-BR will have its suitable growing area reduced by 41% by 2070. Sugarcane, on the other hand, can experience an expansion of as much as 118% under the same scenario and timeframe.
The greatest impacts will be on soybeans, maize and coffee crops. Maize, rice, beans, cotton, and sunflower crops should bear a significant impact in the North East Agreste, which currently accounts for the majority of the regional maize production, and in the North East Cerrados, i.e., south of Maranhão and Piauí and west of Bahia.
Scenario A2-BR. The potential area loss is high across all annual crops, and it is close to zero in
3.3. Agricultural production
www.economiadoclima.org.br
31
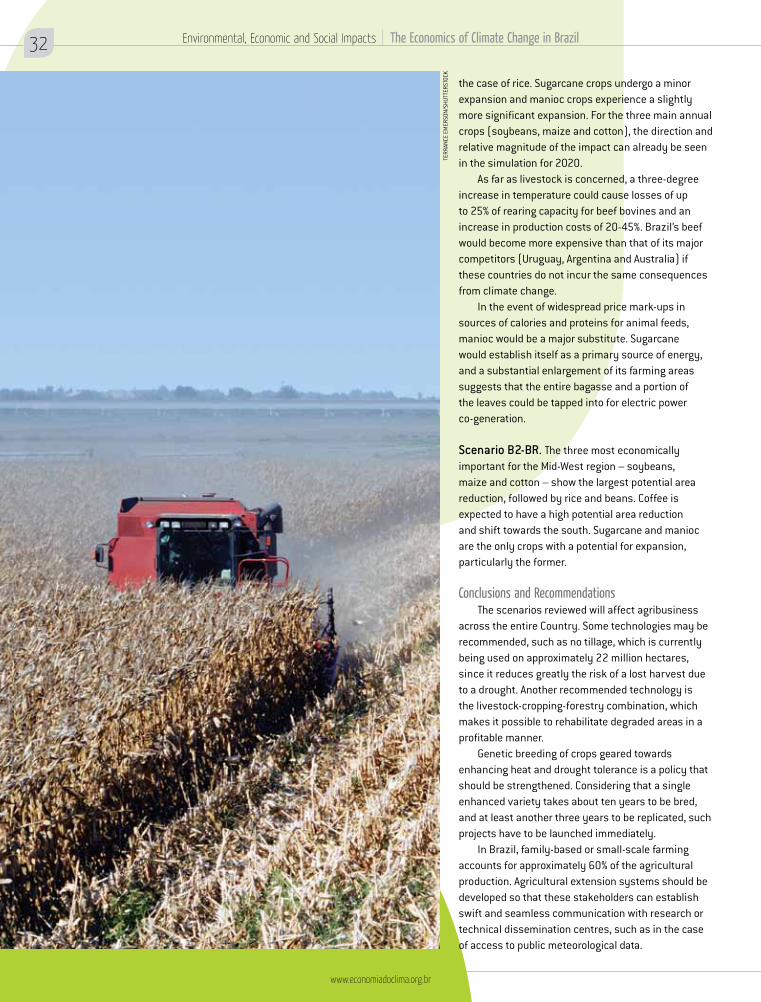
the case of rice. Sugarcane crops undergo a minor expansion and manioc crops experience a slightly more significant expansion. For the three main annual crops (soybeans, maize and cotton), the direction and relative magnitude of the impact can already be seen in the simulation for 2020.
As far as livestock is concerned, a three-degree increase in temperature could cause losses of up to 25% of rearing capacity for beef bovines and an increase in production costs of 20-45%. Brazil’s beef would become more expensive than that of its major competitors (Uruguay, Argentina and Australia) if these countries do not incur the same consequences from climate change.
In the event of widespread price mark-ups in sources of calories and proteins for animal feeds, manioc would be a major substitute. Sugarcane would establish itself as a primary source of energy, and a substantial enlargement of its farming areas suggests that the entire bagasse and a portion of the leaves could be tapped into for electric power co-generation.
Scenario B2-BR. The three most economically important for the Mid-West region – soybeans, maize and cotton – show the largest potential area reduction, followed by rice and beans. Coffee is expected to have a high potential area reduction and shift towards the south. Sugarcane and manioc are the only crops with a potential for expansion, particularly the former.
Conclusions and RecommendationsThe scenarios reviewed will affect agribusiness
across the entire Country. Some technologies may be recommended, such as no tillage, which is currently being used on approximately 22 million hectares, since it reduces greatly the risk of a lost harvest due to a drought. Another recommended technology is the livestock-cropping-forestry combination, which makes it possible to rehabilitate degraded areas in a profitable manner.
Genetic breeding of crops geared towards enhancing heat and drought tolerance is a policy that should be strengthened. Considering that a single enhanced variety takes about ten years to be bred, and at least another three years to be replicated, such projects have to be launched immediately.
In Brazil, family-based or small-scale farming accounts for approximately 60% of the agricultural production. Agricultural extension systems should be developed so that these stakeholders can establish swift and seamless communication with research or technical dissemination centres, such as in the case of access to public meteorological data.
32
www.economiadoclima.org.br
Environmental, Economic and Social Impacts | The Economics of Climate Change in Brazil
TERR
ANCE
EM
ERSO
N/SH
UTTE
RSTO
CK
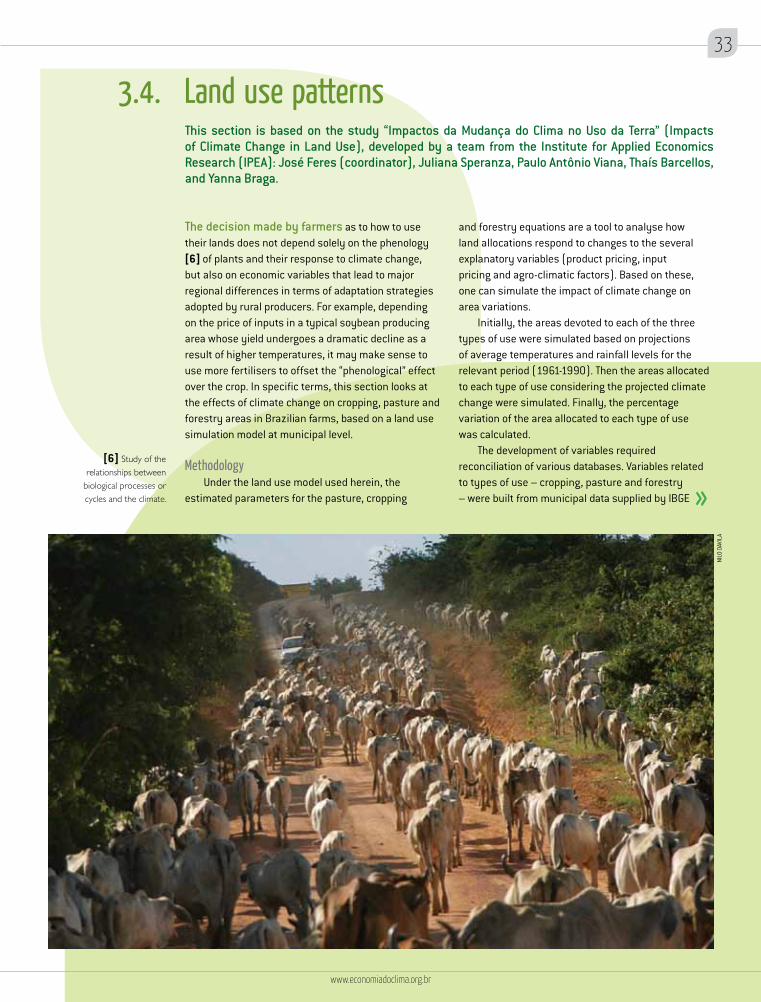
The decision made by farmers as to how to use their lands does not depend solely on the phenology [6] of plants and their response to climate change, but also on economic variables that lead to major regional differences in terms of adaptation strategies adopted by rural producers. For example, depending on the price of inputs in a typical soybean producing area whose yield undergoes a dramatic decline as a result of higher temperatures, it may make sense to use more fertilisers to offset the “phenological” effect over the crop. In specific terms, this section looks at the effects of climate change on cropping, pasture and forestry areas in Brazilian farms, based on a land use simulation model at municipal level.
MethodologyUnder the land use model used herein, the
estimated parameters for the pasture, cropping
[6] Study of the relationships between
biological processes or cycles and the climate.
This section is based on the study “Impactos da Mudança do Clima no Uso da Terra” (Impacts of Climate Change in Land Use), developed by a team from the Institute for Applied Economics Research (IPEA): José Feres (coordinator), Juliana Speranza, Paulo Antônio Viana, Thaís Barcellos, and Yanna Braga.
and forestry equations are a tool to analyse how land allocations respond to changes to the several explanatory variables (product pricing, input pricing and agro-climatic factors). Based on these, one can simulate the impact of climate change on area variations.
Initially, the areas devoted to each of the three types of use were simulated based on projections of average temperatures and rainfall levels for the relevant period (1961-1990). Then the areas allocated to each type of use considering the projected climate change were simulated. Finally, the percentage variation of the area allocated to each type of use was calculated.
The development of variables required reconciliation of various databases. Variables related to types of use – cropping, pasture and forestry – were built from municipal data supplied by IBGE
3.4. Land use patterns
www.economiadoclima.org.br
33
NILO
DAV
ILA
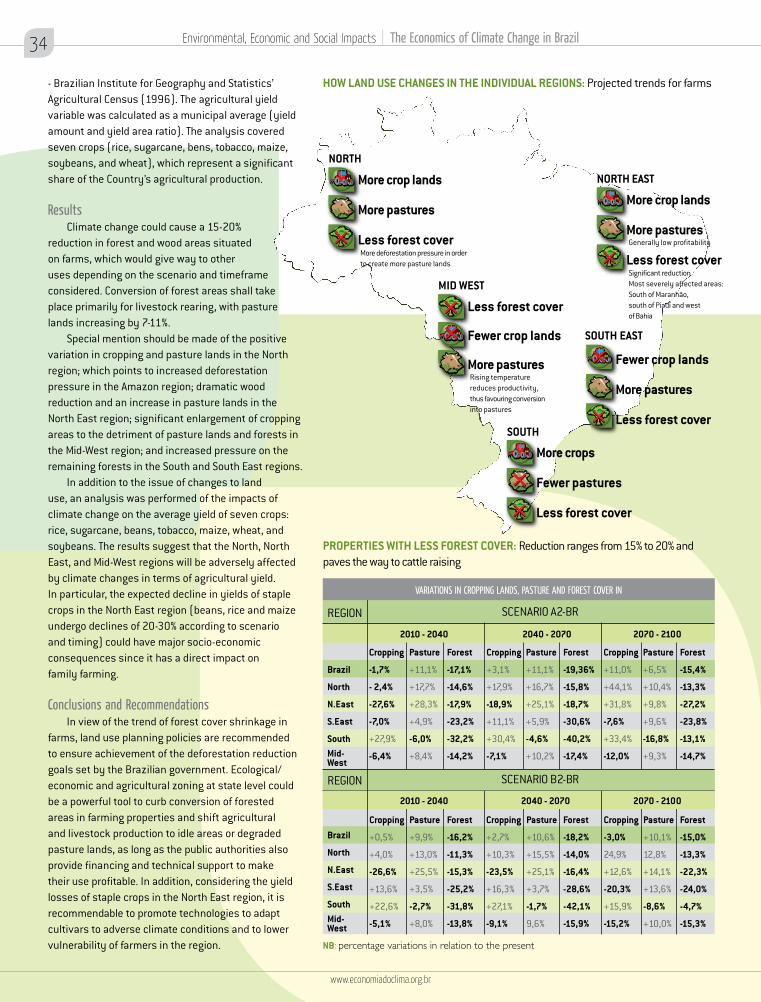
More crop lands
More pastures
Less forest coverGenerally low profitability
Significant reductionMost severely affected areas:South of Maranhão,south of Piauí and westof Bahia
NORTH EAST
MID WEST
Less forest cover
Fewer crop lands
More pasturesRising temperaturereduces productivity,thus favouring conversioninto pastures
SOUTH
More crops
Fewer pastures
Less forest cover
NORTH
More crop lands
More pastures
Less forest coverMore deforestation pressure in orderto create more pasture lands
SOUTH EAST
Fewer crop lands
More pastures
Less forest cover
PROPERTIES WITH LESS FOREST COVER: Reduction ranges from 15% to 20% and paves the way to cattle raising
SCENARIO A2-BR
2010 - 2040 2040 - 2070 2070 - 2100
Cropping
-1,7%
- 2,4%
-27,6%
-7,0%
+27,9%
-6,4%
Cropping
+0,5%
+4,0%
-26,6%
+13,6%
+22,6%
-5,1%
Pasture
+11,1%
+16,7%
+25,1%
+5,9%
-4,6%
+10,2%
Pasture
+10,6%
+15,5%
+25,1%
+3,7%
-1,7%
9,6%
Pasture
+11,1%
+17,7%
+28,3%
+4,9%
-6,0%
+8,4%
Pasture
+9,9%
+13,0%
+25,5%
+3,5%
-2,7%
+8,0%
2010 - 2040 2040 - 2070
Forest
-19,36%
-15,8%
-18,7%
-30,6%
-40,2%
-17,4%
Forest
-18,2%
-14,0%
-16,4%
-28,6%
-42,1%
-15,9%
2070 - 2100
Forest
-17,1%
-14,6%
-17,9%
-23,2%
-32,2%
-14,2%
Forest
-16,2%
-11,3%
-15,3%
-25,2%
-31,8%
-13,8%
Cropping
+11,0%
+44,1%
+31,8%
-7,6%
+33,4%
-12,0%
Cropping
-3,0%
24,9%
+12,6%
-20,3%
+15,9%
-15,2%
Pasture
+6,5%
+10,4%
+9,8%
+9,6%
-16,8%
+9,3%
Pasture
+10,1%
12,8%
+14,1%
+13,6%
-8,6%
+10,0%
Forest
-15,4%
-13,3%
-27,2%
-23,8%
-13,1%
-14,7%
Forest
-15,0%
-13,3%
-22,3%
-24,0%
-4,7%
-15,3%
HOW LAND USE CHANGES IN THE INDIVIDUAL REGIONS: Projected trends for farms
NB: percentage variations in relation to the present
Cropping
+2,7%
+10,3%
-23,5%
+16,3%
+27,1%
-9,1%
Cropping
+3,1%
+17,9%
-18,9%
+11,1%
+30,4%
-7,1%
SCENARIO B2-BR
REGION
Brazil
North
N.East
S.East
South Mid-West
REGION
Brazil
North
N.East
S.East
South Mid-West
VARIATIONS IN CROPPING LANDS, PASTURE AND FOREST COVER IN
- Brazilian Institute for Geography and Statistics’ Agricultural Census (1996). The agricultural yield variable was calculated as a municipal average (yield amount and yield area ratio). The analysis covered seven crops (rice, sugarcane, bens, tobacco, maize, soybeans, and wheat), which represent a significant share of the Country’s agricultural production.
ResultsClimate change could cause a 15-20%
reduction in forest and wood areas situated on farms, which would give way to other uses depending on the scenario and timeframe considered. Conversion of forest areas shall take place primarily for livestock rearing, with pasture lands increasing by 7-11%.
Special mention should be made of the positive variation in cropping and pasture lands in the North region; which points to increased deforestation pressure in the Amazon region; dramatic wood reduction and an increase in pasture lands in the North East region; significant enlargement of cropping areas to the detriment of pasture lands and forests in the Mid-West region; and increased pressure on the remaining forests in the South and South East regions.
In addition to the issue of changes to land use, an analysis was performed of the impacts of climate change on the average yield of seven crops: rice, sugarcane, beans, tobacco, maize, wheat, and soybeans. The results suggest that the North, North East, and Mid-West regions will be adversely affected by climate changes in terms of agricultural yield. In particular, the expected decline in yields of staple crops in the North East region (beans, rice and maize undergo declines of 20-30% according to scenario and timing) could have major socio-economic consequences since it has a direct impact on family farming.
Conclusions and Recommendations In view of the trend of forest cover shrinkage in
farms, land use planning policies are recommended to ensure achievement of the deforestation reduction goals set by the Brazilian government. Ecological/economic and agricultural zoning at state level could be a powerful tool to curb conversion of forested areas in farming properties and shift agricultural and livestock production to idle areas or degraded pasture lands, as long as the public authorities also provide financing and technical support to make their use profitable. In addition, considering the yield losses of staple crops in the North East region, it is recommendable to promote technologies to adapt cultivars to adverse climate conditions and to lower vulnerability of farmers in the region.
34
www.economiadoclima.org.br
Environmental, Economic and Social Impacts | The Economics of Climate Change in Brazil
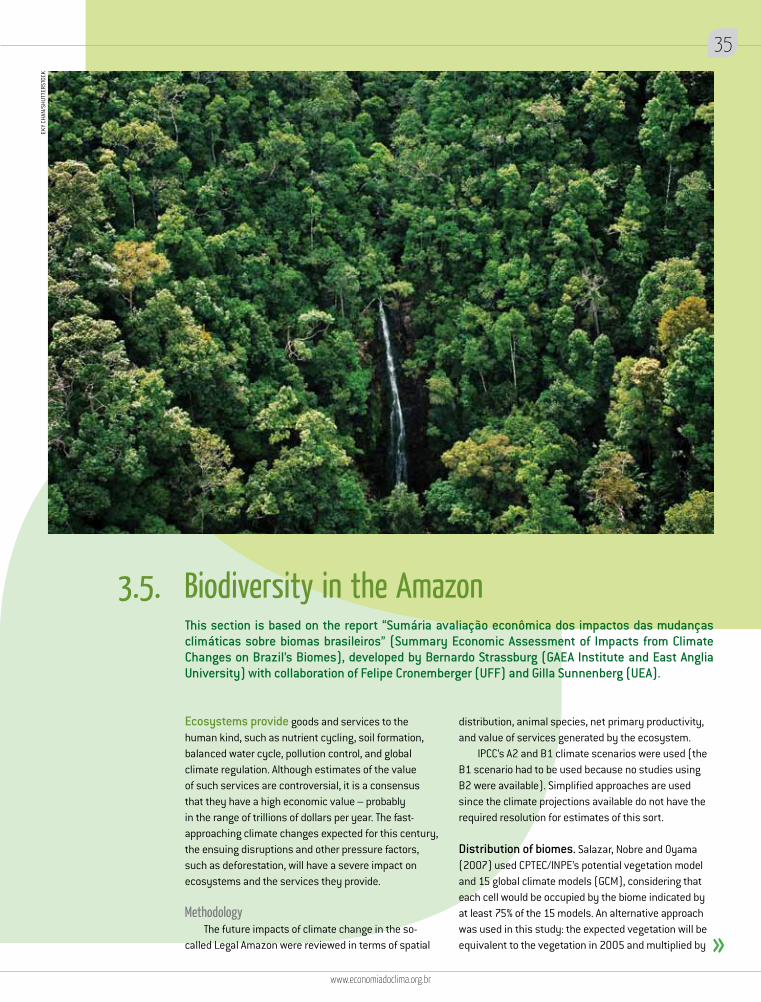
Ecosystems provide goods and services to the human kind, such as nutrient cycling, soil formation, balanced water cycle, pollution control, and global climate regulation. Although estimates of the value of such services are controversial, it is a consensus that they have a high economic value – probably in the range of trillions of dollars per year. The fast-approaching climate changes expected for this century, the ensuing disruptions and other pressure factors, such as deforestation, will have a severe impact on ecosystems and the services they provide.
MethodologyThe future impacts of climate change in the so-
called Legal Amazon were reviewed in terms of spatial
distribution, animal species, net primary productivity, and value of services generated by the ecosystem.
IPCC’s A2 and B1 climate scenarios were used (the B1 scenario had to be used because no studies using B2 were available). Simplified approaches are used since the climate projections available do not have the required resolution for estimates of this sort.
Distribution of biomes. Salazar, Nobre and Oyama (2007) used CPTEC/INPE’s potential vegetation model and 15 global climate models (GCM), considering that each cell would be occupied by the biome indicated by at least 75% of the 15 models. An alternative approach was used in this study: the expected vegetation will be equivalent to the vegetation in 2005 and multiplied by
3.5. Biodiversity in the AmazonThis section is based on the report “Sumária avaliação econômica dos impactos das mudanças climáticas sobre biomas brasileiros” (Summary Economic Assessment of Impacts from Climate Changes on Brazil’s Biomes), developed by Bernardo Strassburg (GAEA Institute and East Anglia University) with collaboration of Felipe Cronemberger (UFF) and Gilla Sunnenberg (UEA).
www.economiadoclima.org.br
35EK
Y CH
AN/S
HUTT
ERST
OCK
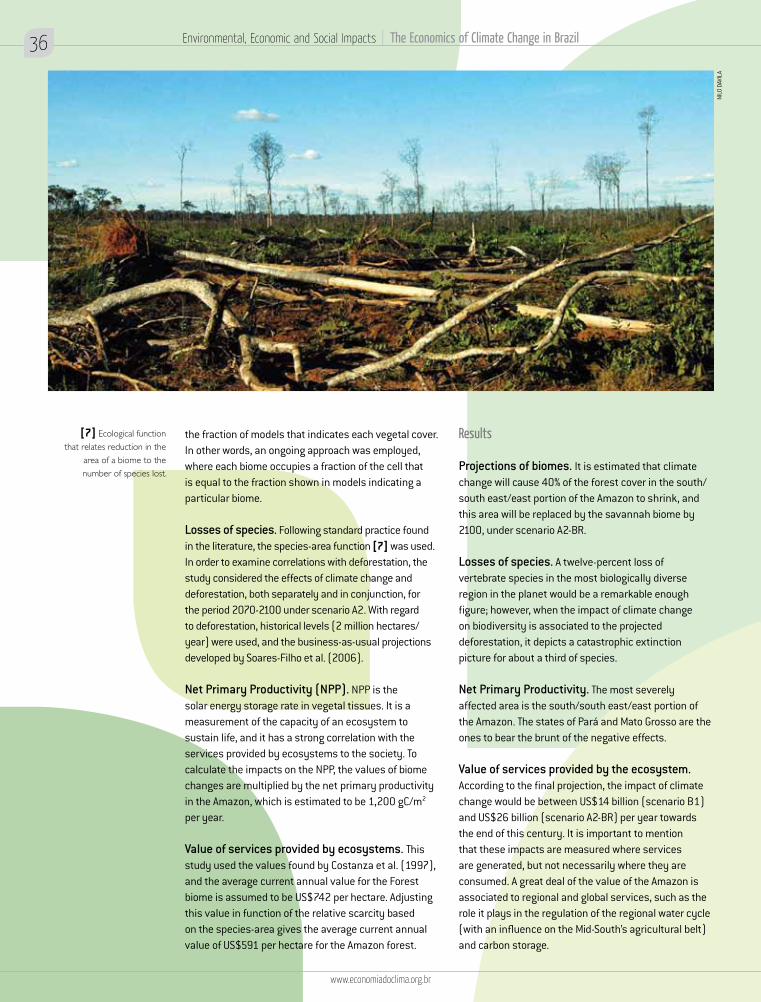
the fraction of models that indicates each vegetal cover. In other words, an ongoing approach was employed, where each biome occupies a fraction of the cell that is equal to the fraction shown in models indicating a particular biome.
Losses of species. Following standard practice found in the literature, the species-area function [7] was used. In order to examine correlations with deforestation, the study considered the effects of climate change and deforestation, both separately and in conjunction, for the period 2070-2100 under scenario A2. With regard to deforestation, historical levels (2 million hectares/year) were used, and the business-as-usual projections developed by Soares-Filho et al. (2006).
Net Primary Productivity (NPP). NPP is the solar energy storage rate in vegetal tissues. It is a measurement of the capacity of an ecosystem to sustain life, and it has a strong correlation with the services provided by ecosystems to the society. To calculate the impacts on the NPP, the values of biome changes are multiplied by the net primary productivity in the Amazon, which is estimated to be 1,200 gC/m2 per year.
Value of services provided by ecosystems. This study used the values found by Costanza et al. (1997), and the average current annual value for the Forest biome is assumed to be US$742 per hectare. Adjusting this value in function of the relative scarcity based on the species-area gives the average current annual value of US$591 per hectare for the Amazon forest.
[7] Ecological function that relates reduction in the
area of a biome to the number of species lost.
Results
Projections of biomes. It is estimated that climate change will cause 40% of the forest cover in the south/south east/east portion of the Amazon to shrink, and this area will be replaced by the savannah biome by 2100, under scenario A2-BR.
Losses of species. A twelve-percent loss of vertebrate species in the most biologically diverse region in the planet would be a remarkable enough figure; however, when the impact of climate change on biodiversity is associated to the projected deforestation, it depicts a catastrophic extinction picture for about a third of species.
Net Primary Productivity. The most severely affected area is the south/south east/east portion of the Amazon. The states of Pará and Mato Grosso are the ones to bear the brunt of the negative effects.
Value of services provided by the ecosystem. According to the final projection, the impact of climate change would be between US$14 billion (scenario B1) and US$26 billion (scenario A2-BR) per year towards the end of this century. It is important to mention that these impacts are measured where services are generated, but not necessarily where they are consumed. A great deal of the value of the Amazon is associated to regional and global services, such as the role it plays in the regulation of the regional water cycle (with an influence on the Mid-South’s agricultural belt) and carbon storage.
36
www.economiadoclima.org.br
Environmental, Economic and Social Impacts | The Economics of Climate Change in Brazil
NILO
DAV
ILA
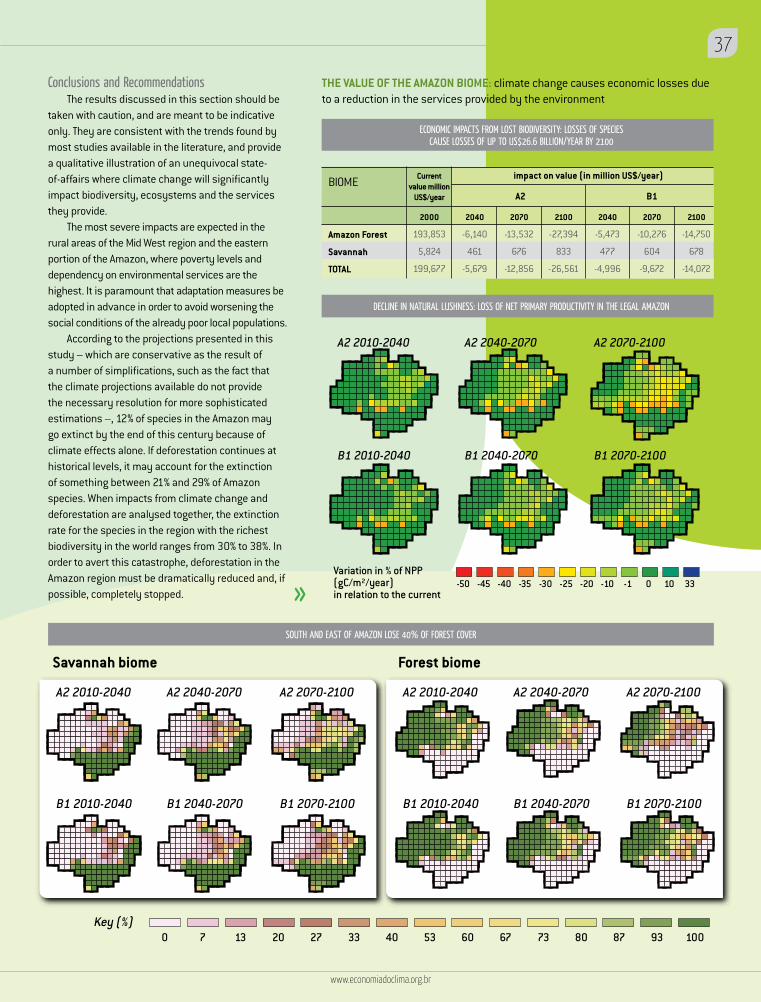
SOUTH AND EAST OF AMAZON LOSE 40% OF FOREST COVER
DECLINE IN NATURAL LUSHNESS: LOSS OF NET PRIMARY PRODUCTIVITY IN THE LEGAL AMAZON
A2 2010-2040 A2 2040-2070 A2 2070-2100
B1 2010-2040 B1 2040-2070 B1 2070-2100
-50 -45 -40 -35 -30 -25 -20 -10 -1 0 10 33Variation in % of NPP (gC/m!/year) in relation to the current
Savannah biome Forest biome
A2 2010-2040 A2 2040-2070 A2 2070-2100
B1 2010-2040 B1 2040-2070 B1 2070-2100
A2 2010-2040 A2 2040-2070 A2 2070-2100
B1 2010-2040 B1 2040-2070 B1 2070-2100
Key (%)0 7 13 20 27 33 40 53 60 67 73 80 87 93 100
THE VALUE OF THE AMAZON BIOME: climate change causes economic losses due to a reduction in the services provided by the environment
ECONOMIC IMPACTS FROM LOST BIODIVERSITY: LOSSES OF SPECIES CAUSE LOSSES OF UP TO US$26.6 BILLION/YEAR BY 2100
Conclusions and RecommendationsThe results discussed in this section should be
taken with caution, and are meant to be indicative only. They are consistent with the trends found by most studies available in the literature, and provide a qualitative illustration of an unequivocal state-of-affairs where climate change will significantly impact biodiversity, ecosystems and the services they provide.
The most severe impacts are expected in the rural areas of the Mid West region and the eastern portion of the Amazon, where poverty levels and dependency on environmental services are the highest. It is paramount that adaptation measures be adopted in advance in order to avoid worsening the social conditions of the already poor local populations.
According to the projections presented in this study – which are conservative as the result of a number of simplifications, such as the fact that the climate projections available do not provide the necessary resolution for more sophisticated estimations –, 12% of species in the Amazon may go extinct by the end of this century because of climate effects alone. If deforestation continues at historical levels, it may account for the extinction of something between 21% and 29% of Amazon species. When impacts from climate change and deforestation are analysed together, the extinction rate for the species in the region with the richest biodiversity in the world ranges from 30% to 38%. In order to avert this catastrophe, deforestation in the Amazon region must be dramatically reduced and, if possible, completely stopped.
A2 B1
impact on value (in million US$/year)BIOME
Amazon Forest
Savannah
TOTAL
2040
-5,473
477
-4,996
2040
-6,140
461
-5,679
Current value million
US$/year
2000
193,853
5,824
199,677
2070
-10,276
604
-9,672
2070
-13,532
676
-12,856
2100
-14,750
678
-14,072
2100
-27,394
833
-26,561
www.economiadoclima.org.br
37
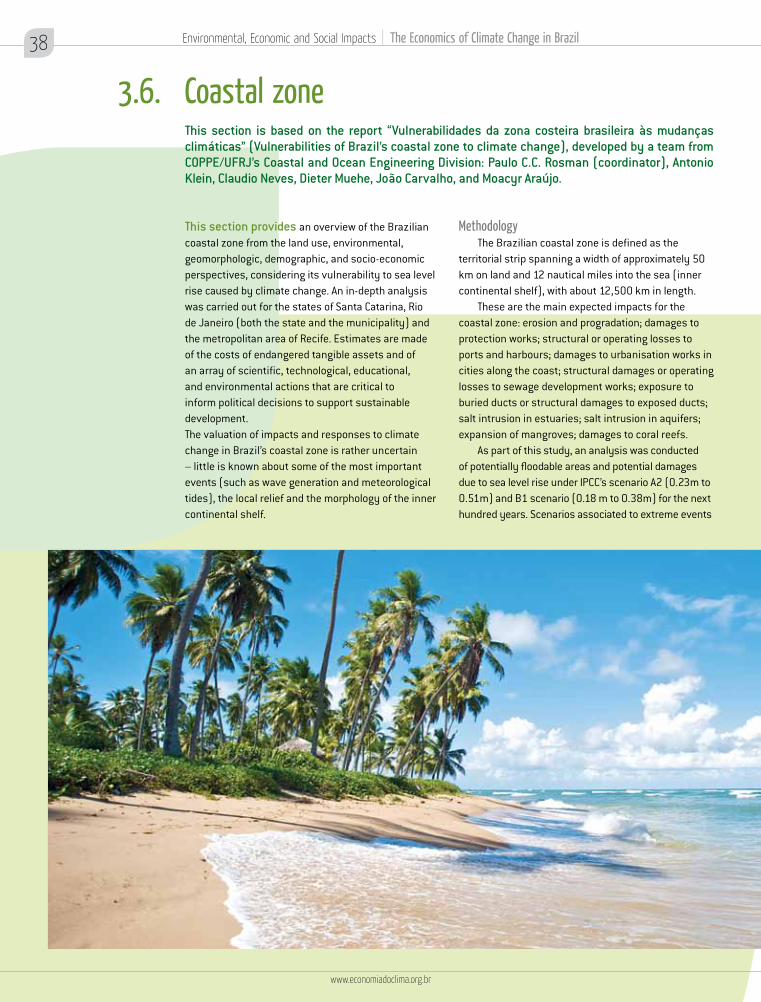
3.6. Coastal zoneThis section is based on the report “Vulnerabilidades da zona costeira brasileira às mudanças climáticas” (Vulnerabilities of Brazil’s coastal zone to climate change), developed by a team from COPPE/UFRJ’s Coastal and Ocean Engineering Division: Paulo C.C. Rosman (coordinator), Antonio Klein, Claudio Neves, Dieter Muehe, João Carvalho, and Moacyr Araújo.
This section provides an overview of the Brazilian coastal zone from the land use, environmental, geomorphologic, demographic, and socio-economic perspectives, considering its vulnerability to sea level rise caused by climate change. An in-depth analysis was carried out for the states of Santa Catarina, Rio de Janeiro (both the state and the municipality) and the metropolitan area of Recife. Estimates are made of the costs of endangered tangible assets and of an array of scientific, technological, educational, and environmental actions that are critical to inform political decisions to support sustainable development.The valuation of impacts and responses to climate change in Brazil’s coastal zone is rather uncertain – little is known about some of the most important events (such as wave generation and meteorological tides), the local relief and the morphology of the inner continental shelf.
MethodologyThe Brazilian coastal zone is defined as the
territorial strip spanning a width of approximately 50 km on land and 12 nautical miles into the sea (inner continental shelf), with about 12,500 km in length.
These are the main expected impacts for the coastal zone: erosion and progradation; damages to protection works; structural or operating losses to ports and harbours; damages to urbanisation works in cities along the coast; structural damages or operating losses to sewage development works; exposure to buried ducts or structural damages to exposed ducts; salt intrusion in estuaries; salt intrusion in aquifers; expansion of mangroves; damages to coral reefs.
As part of this study, an analysis was conducted of potentially floodable areas and potential damages due to sea level rise under IPCC’s scenario A2 (0.23m to 0.51m) and B1 scenario (0.18 m to 0.38m) for the next hundred years. Scenarios associated to extreme events
38
www.economiadoclima.org.br
Environmental, Economic and Social Impacts | The Economics of Climate Change in Brazil

1
2
3
4
5
6
7
8
RJ
BA
RS
ES
SP
PE
CE
Other micro-regions
Rio de Janeiro
Salvador
Porto Alegre
Vitória
Santos
Recife
Fortaleza
R$ 84.313,23
R$ 21.204,71
R$ 16.891,74
R$ 14.721,42
R$ 14.428,25
R$ 13.140,96
R$ 12.134,45
R$ 30.655,24
R$ 55.646,73
R$ 13.995,11
R$ 11.148,55
R$ 9.716,13
R$ 9.522,65
R$ 8.673,03
R$ 8.008,74
R$ 19.789,06
State Micro-region
Estimated value Coastline Methodology*(million R$)
Estimated valuePopulation Percentage Methodology*(million R$)
COAST AT RISK: main cities with assets endangered by climate change. Total value is between R$136.5 billion
* See methodology.
(extra-tropical cyclones) over the coast were included, and these would cause the relative level of the sea to rise temporarily to a level significantly higher than the level described in IPCC’s scenarios, and they would be associated to heavy rainfalls and wave effects.
As a means to indicate potential areas for coastal flooding, the maximum vertical sea levels for the coast during a storm were calculated, which were then compared to the altimetric quotas for the terrain. In metropolitan areas alone, such as Rio de Janeiro and Recife, the extent to which areas are subject to floods was measured. Future coastlines were projected in thematic maps in order to spatialise and integrate danger zones.
In order to calculate the costs from rising sea levels, the approach developed by Nicholls et al. (2008) was adapted to account for the vulnerability of 136 port cities, including ten cities in Brazil, where the value of goods or upgrading works at risk corresponds to the investments in urban upgrading works, which is in the range of 25% of the GDP; a three-percent annual growth rate and a forty-year lifespan. It is estimated that the values are about 4 or 5 times the value of the per capita GDP multiplied by the population living in the areas at risk.
Natural environments were not considered, and this was due to difficulties in profiling the vulnerability of these environments and their connections to socio-
economic chains. Therefore, the values obtained are considered to be underestimates.
Alternatively, the concept of Coastline Equivalent Length has been developed. The estimated value of each type of asset (urbanisation, utility networks, etc.) is converted into a coastline extension whose protection would have the same value. If the population per unit length of coastline (PCL) and the per capita GDP value are known, one can establish a value for the GDP/km of coastline (GDP-CL). Cities with a high GPD-CL value are those with a high value assets exposed to rising sea levels.
ResultsThe estimated value of assets at risk along the
coastline, considering the highest sea level and extreme weather events scenario, is R$136 billion. The alternative approach provided the same ranking of vulnerable cities, but with higher values, in a total of R$207.5 billion.
Conclusions and RecommendationsSpecific studies for the coastal metropolitan areas
are recommended, and these should cover economic, social, environmental, and (urban, sewage, transport, etc.) infrastructure aspects, with their correlation matrices. For these studies to be carried out, specific climate scenarios for the coastal zone must be established.
It is also recommendable that a similar assessment of vulnerabilities be conducted for environments away from large urban concentrations, i.e., those areas with lower PCL values, which may serve as indicators of natural environment evolution.
www.economiadoclima.org.br
39
SCHM
ID C
HRIS
TOPH
E/SH
UTTE
RSTO
CK
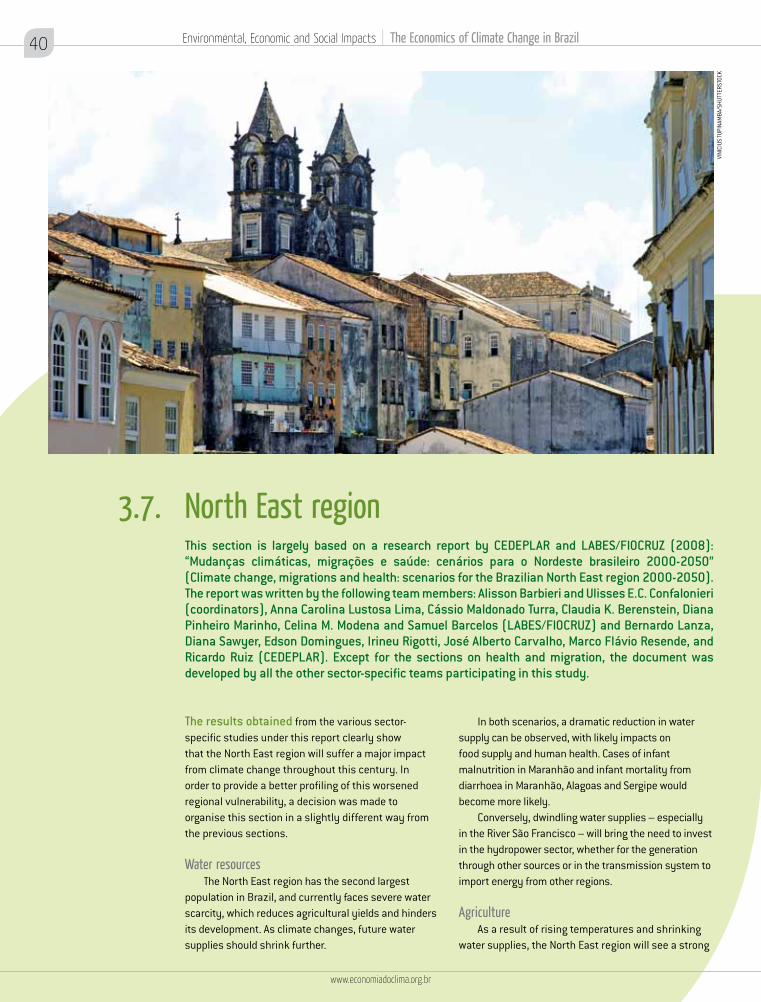
The results obtained from the various sector-specific studies under this report clearly show that the North East region will suffer a major impact from climate change throughout this century. In order to provide a better profiling of this worsened regional vulnerability, a decision was made to organise this section in a slightly different way from the previous sections.
Water resourcesThe North East region has the second largest
population in Brazil, and currently faces severe water scarcity, which reduces agricultural yields and hinders its development. As climate changes, future water supplies should shrink further.
In both scenarios, a dramatic reduction in water supply can be observed, with likely impacts on food supply and human health. Cases of infant malnutrition in Maranhão and infant mortality from diarrhoea in Maranhão, Alagoas and Sergipe would become more likely.
Conversely, dwindling water supplies – especially in the River São Francisco – will bring the need to invest in the hydropower sector, whether for the generation through other sources or in the transmission system to import energy from other regions.
AgricultureAs a result of rising temperatures and shrinking
water supplies, the North East region will see a strong
3.7. North East regionThis section is largely based on a research report by CEDEPLAR and LABES/FIOCRUZ (2008): “Mudanças climáticas, migrações e saúde: cenários para o Nordeste brasileiro 2000-2050” (Climate change, migrations and health: scenarios for the Brazilian North East region 2000-2050). The report was written by the following team members: Alisson Barbieri and Ulisses E.C. Confalonieri (coordinators), Anna Carolina Lustosa Lima, Cássio Maldonado Turra, Claudia K. Berenstein, Diana Pinheiro Marinho, Celina M. Modena and Samuel Barcelos (LABES/FIOCRUZ) and Bernardo Lanza, Diana Sawyer, Edson Domingues, Irineu Rigotti, José Alberto Carvalho, Marco Flávio Resende, and Ricardo Ruiz (CEDEPLAR). Except for the sections on health and migration, the document was developed by all the other sector-specific teams participating in this study.
40
www.economiadoclima.org.br
Environmental, Economic and Social Impacts | The Economics of Climate Change in Brazil
VINI
CIUS
TUPI
NAM
BA/S
HUTT
ERST
OCK
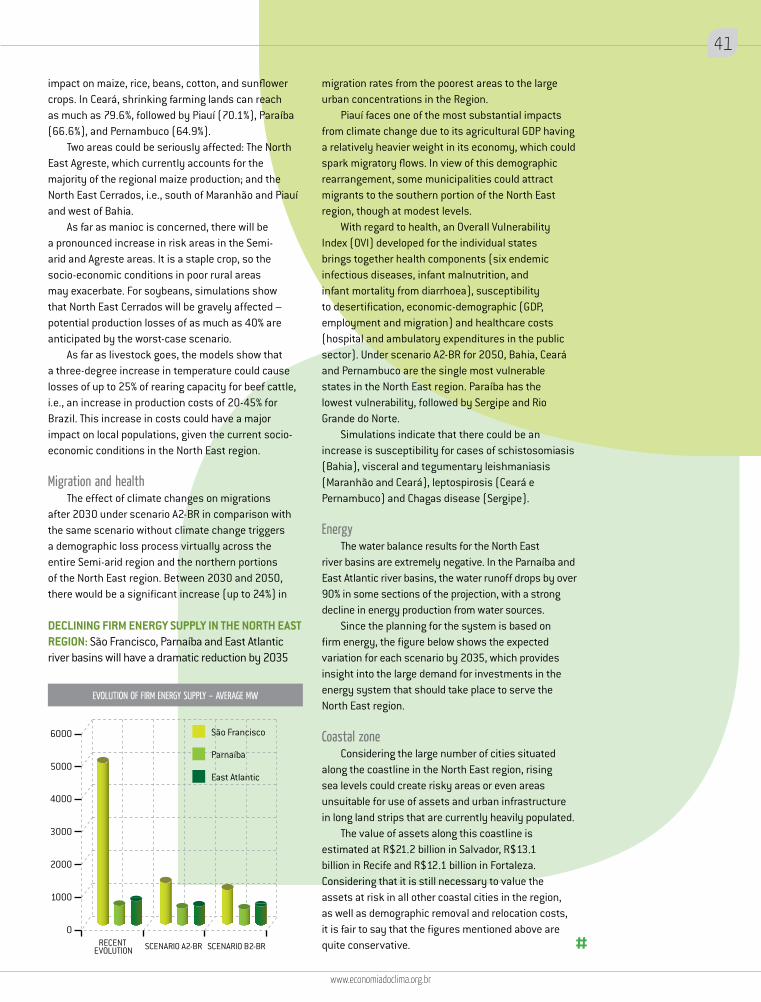
migration rates from the poorest areas to the large urban concentrations in the Region.
Piauí faces one of the most substantial impacts from climate change due to its agricultural GDP having a relatively heavier weight in its economy, which could spark migratory flows. In view of this demographic rearrangement, some municipalities could attract migrants to the southern portion of the North East region, though at modest levels.
With regard to health, an Overall Vulnerability Index (OVI) developed for the individual states brings together health components (six endemic infectious diseases, infant malnutrition, and infant mortality from diarrhoea), susceptibility to desertification, economic-demographic (GDP, employment and migration) and healthcare costs (hospital and ambulatory expenditures in the public sector). Under scenario A2-BR for 2050, Bahia, Ceará and Pernambuco are the single most vulnerable states in the North East region. Paraíba has the lowest vulnerability, followed by Sergipe and Rio Grande do Norte.
Simulations indicate that there could be an increase is susceptibility for cases of schistosomiasis (Bahia), visceral and tegumentary leishmaniasis (Maranhão and Ceará), leptospirosis (Ceará e Pernambuco) and Chagas disease (Sergipe).
EnergyThe water balance results for the North East
river basins are extremely negative. In the Parnaíba and East Atlantic river basins, the water runoff drops by over 90% in some sections of the projection, with a strong decline in energy production from water sources.
Since the planning for the system is based on firm energy, the figure below shows the expected variation for each scenario by 2035, which provides insight into the large demand for investments in the energy system that should take place to serve the North East region.
Coastal zoneConsidering the large number of cities situated
along the coastline in the North East region, rising sea levels could create risky areas or even areas unsuitable for use of assets and urban infrastructure in long land strips that are currently heavily populated.
The value of assets along this coastline is estimated at R$21.2 billion in Salvador, R$13.1 billion in Recife and R$12.1 billion in Fortaleza. Considering that it is still necessary to value the assets at risk in all other coastal cities in the region, as well as demographic removal and relocation costs, it is fair to say that the figures mentioned above are quite conservative.
impact on maize, rice, beans, cotton, and sunflower crops. In Ceará, shrinking farming lands can reach as much as 79.6%, followed by Piauí (70.1%), Paraíba (66.6%), and Pernambuco (64.9%).
Two areas could be seriously affected: The North East Agreste, which currently accounts for the majority of the regional maize production; and the North East Cerrados, i.e., south of Maranhão and Piauí and west of Bahia.
As far as manioc is concerned, there will be a pronounced increase in risk areas in the Semi-arid and Agreste areas. It is a staple crop, so the socio-economic conditions in poor rural areas may exacerbate. For soybeans, simulations show that North East Cerrados will be gravely affected – potential production losses of as much as 40% are anticipated by the worst-case scenario.
As far as livestock goes, the models show that a three-degree increase in temperature could cause losses of up to 25% of rearing capacity for beef cattle, i.e., an increase in production costs of 20-45% for Brazil. This increase in costs could have a major impact on local populations, given the current socio-economic conditions in the North East region.
Migration and healthThe effect of climate changes on migrations
after 2030 under scenario A2-BR in comparison with the same scenario without climate change triggers a demographic loss process virtually across the entire Semi-arid region and the northern portions of the North East region. Between 2030 and 2050, there would be a significant increase (up to 24%) in
4000
3000
2000
1000
0
6000
5000
RECENT EVOLUTION SCENARIO A2-BR SCENARIO B2-BR
DECLINING FIRM ENERGY SUPPLY IN THE NORTH EAST REGION: São Francisco, Parnaíba and East Atlantic river basins will have a dramatic reduction by 2035
EVOLUTION OF FIRM ENERGY SUPPLY – AVERAGE MW
São Francisco
Parnaíba
East Atlantic
www.economiadoclima.org.br
41

MAN
GOST
OCK/
SHUT
TERS
TOCK
CHAPTER 4
Adapting to climate change
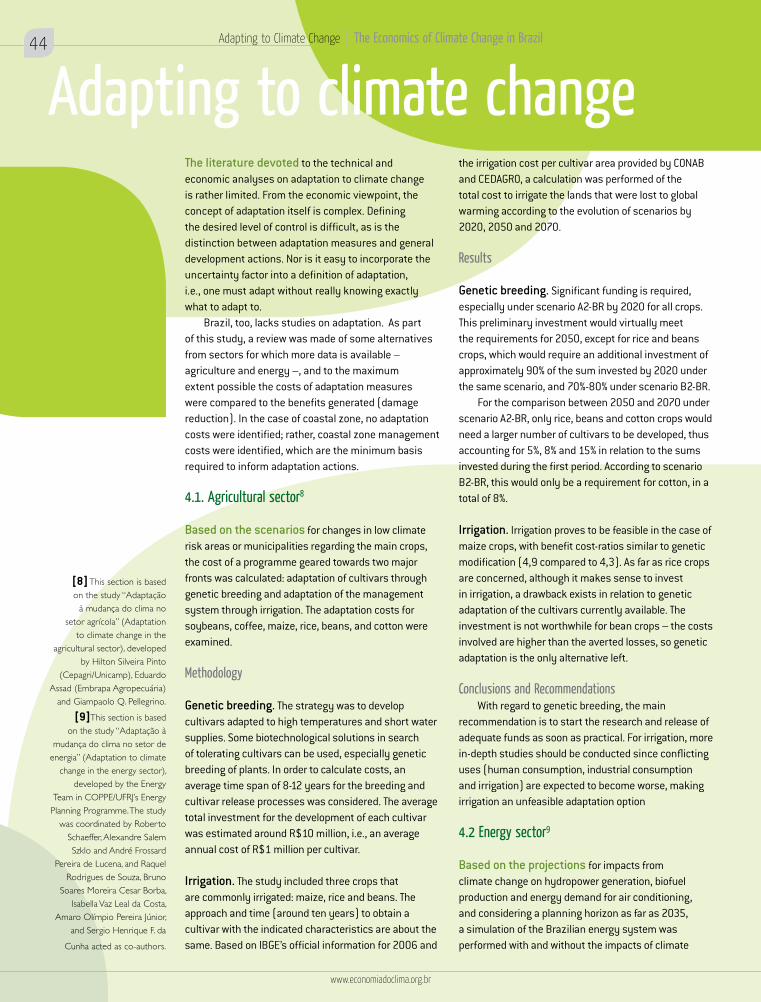
Adapting to climate changeThe literature devoted to the technical and economic analyses on adaptation to climate change is rather limited. From the economic viewpoint, the concept of adaptation itself is complex. Defining the desired level of control is difficult, as is the distinction between adaptation measures and general development actions. Nor is it easy to incorporate the uncertainty factor into a definition of adaptation, i.e., one must adapt without really knowing exactly what to adapt to.
Brazil, too, lacks studies on adaptation. As part of this study, a review was made of some alternatives from sectors for which more data is available – agriculture and energy –, and to the maximum extent possible the costs of adaptation measures were compared to the benefits generated (damage reduction). In the case of coastal zone, no adaptation costs were identified; rather, coastal zone management costs were identified, which are the minimum basis required to inform adaptation actions.
4.1. Agricultural sector8
Based on the scenarios for changes in low climate risk areas or municipalities regarding the main crops, the cost of a programme geared towards two major fronts was calculated: adaptation of cultivars through genetic breeding and adaptation of the management system through irrigation. The adaptation costs for soybeans, coffee, maize, rice, beans, and cotton were examined.
Methodology
Genetic breeding. The strategy was to develop cultivars adapted to high temperatures and short water supplies. Some biotechnological solutions in search of tolerating cultivars can be used, especially genetic breeding of plants. In order to calculate costs, an average time span of 8-12 years for the breeding and cultivar release processes was considered. The average total investment for the development of each cultivar was estimated around R$10 million, i.e., an average annual cost of R$1 million per cultivar.
Irrigation. The study included three crops that are commonly irrigated: maize, rice and beans. The approach and time (around ten years) to obtain a cultivar with the indicated characteristics are about the same. Based on IBGE’s official information for 2006 and
the irrigation cost per cultivar area provided by CONAB and CEDAGRO, a calculation was performed of the total cost to irrigate the lands that were lost to global warming according to the evolution of scenarios by 2020, 2050 and 2070.
Results
Genetic breeding. Significant funding is required, especially under scenario A2-BR by 2020 for all crops. This preliminary investment would virtually meet the requirements for 2050, except for rice and beans crops, which would require an additional investment of approximately 90% of the sum invested by 2020 under the same scenario, and 70%-80% under scenario B2-BR.
For the comparison between 2050 and 2070 under scenario A2-BR, only rice, beans and cotton crops would need a larger number of cultivars to be developed, thus accounting for 5%, 8% and 15% in relation to the sums invested during the first period. According to scenario B2-BR, this would only be a requirement for cotton, in a total of 8%.
Irrigation. Irrigation proves to be feasible in the case of maize crops, with benefit cost-ratios similar to genetic modification (4,9 compared to 4,3). As far as rice crops are concerned, although it makes sense to invest in irrigation, a drawback exists in relation to genetic adaptation of the cultivars currently available. The investment is not worthwhile for bean crops – the costs involved are higher than the averted losses, so genetic adaptation is the only alternative left.
Conclusions and RecommendationsWith regard to genetic breeding, the main
recommendation is to start the research and release of adequate funds as soon as practical. For irrigation, more in-depth studies should be conducted since conflicting uses (human consumption, industrial consumption and irrigation) are expected to become worse, making irrigation an unfeasible adaptation option
4.2 Energy sector9
Based on the projections for impacts from climate change on hydropower generation, biofuel production and energy demand for air conditioning, and considering a planning horizon as far as 2035, a simulation of the Brazilian energy system was performed with and without the impacts of climate
[8] This section is based on the study “Adaptação
à mudança do clima no setor agrícola” (Adaptation
to climate change in the agricultural sector), developed
by Hilton Silveira Pinto (Cepagri/Unicamp), Eduardo
Assad (Embrapa Agropecuária) and Giampaolo Q. Pellegrino.
[9]This section is based on the study “Adaptação à
mudança do clima no setor de energia” (Adaptation to climate
change in the energy sector), developed by the Energy
Team in COPPE/UFRJ’s Energy Planning Programme. The study
was coordinated by Roberto Schaeffer, Alexandre Salem Szklo and André Frossard
Pereira de Lucena, and Raquel Rodrigues de Souza, Bruno
Soares Moreira Cesar Borba, Isabella Vaz Leal da Costa,
Amaro Olímpio Pereira Júnior, and Sergio Henrique F. da
Cunha acted as co-authors.
Adapting to Climate Change | The Economics of Climate Change in Brazil44
www.economiadoclima.org.br
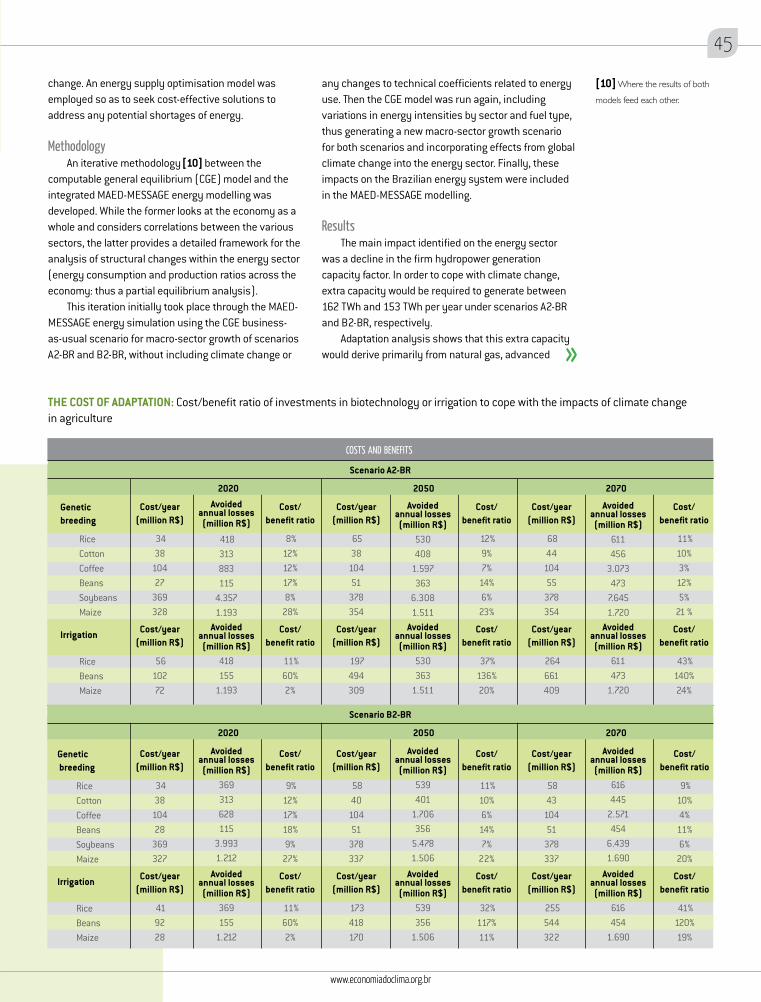
change. An energy supply optimisation model was employed so as to seek cost-effective solutions to address any potential shortages of energy.
MethodologyAn iterative methodology [10] between the
computable general equilibrium (CGE) model and the integrated MAED-MESSAGE energy modelling was developed. While the former looks at the economy as a whole and considers correlations between the various sectors, the latter provides a detailed framework for the analysis of structural changes within the energy sector (energy consumption and production ratios across the economy: thus a partial equilibrium analysis).
This iteration initially took place through the MAED-MESSAGE energy simulation using the CGE business-as-usual scenario for macro-sector growth of scenarios A2-BR and B2-BR, without including climate change or
any changes to technical coefficients related to energy use. Then the CGE model was run again, including variations in energy intensities by sector and fuel type, thus generating a new macro-sector growth scenario for both scenarios and incorporating effects from global climate change into the energy sector. Finally, these impacts on the Brazilian energy system were included in the MAED-MESSAGE modelling.
ResultsThe main impact identified on the energy sector
was a decline in the firm hydropower generation capacity factor. In order to cope with climate change, extra capacity would be required to generate between 162 TWh and 153 TWh per year under scenarios A2-BR and B2-BR, respectively.
Adaptation analysis shows that this extra capacity would derive primarily from natural gas, advanced
[10] Where the results of both
models feed each other.
THE COST OF ADAPTATION: Cost/benefit ratio of investments in biotechnology or irrigation to cope with the impacts of climate change in agriculture
Genetic breeding
Rice Cotton Coffee Beans Soybeans Maize
Irrigation
Rice Beans Maize
Cost/year (million R$)
3438
10428
369327
Cost/year (million R$)
419228
Cost/year (million R$)
5840
10451
378337
Cost/year (million R$)
173418170
Cost/year (million R$)
5843
10451
378337
Cost/year (million R$)
255544322
Avoided annual losses
(million R$)369313628115
3.9931.212
Avoided annual losses
(million R$)369155
1.212
Avoided annual losses
(million R$)539401
1.706356
5.4781.506
Avoided annual losses
(million R$)539356
1.506
Avoided annual losses
(million R$)616445
2.571454
6.4391.690
Avoided annual losses
(million R$)616454
1.690
Cost/ benefit ratio
9%12%17%18%9%
27%
Cost/ benefit ratio
11%60%2%
Cost/ benefit ratio
11%10%6%
14%7%
22%
Cost/ benefit ratio
32%117%11%
Cost/ benefit ratio
9%10%4%
11%6%
20%
Cost/ benefit ratio
41%120%19%
Genetic breeding
Rice Cotton Coffee Beans Soybeans Maize
Irrigation
Rice Beans Maize
Cost/year (million R$)
3438
10427
369328
Cost/year (million R$)
5610272
Cost/year (million R$)
6538
10451
378354
Cost/year (million R$)
197494309
Cost/year (million R$)
6844
10455
378354
Cost/year (million R$)
264661409
Avoided annual losses
(million R$)
418313883115
4.3571.193
Avoided annual losses
(million R$)418155
1.193
Avoided annual losses
(million R$)530408
1.597363
6.3081.511
Avoided annual losses
(million R$)530363
1.511
Avoided annual losses
(million R$)611456
3.073473
7.6451.720
Avoided annual losses
(million R$)611473
1.720
Cost/ benefit ratio
8%12%12%17%8%
28%
Cost/ benefit ratio
11%60%2%
Cost/ benefit ratio
12%9%7%
14%6%
23%
Cost/ benefit ratio
37%136%20%
Cost/ benefit ratio
11%10%3%
12%5%
21 %
Cost/ benefit ratio
43%140%24%
2020
2020
2050
2050
2070
2070
Scenario B2-BR
Scenario A2-BR
COSTS AND BENEFITS
www.economiadoclima.org.br
45
www.economiadoclima.org.br
45
technologies for sugarcane bagasse burning and wind energy. At the aggregate level, these options would require capital costs in the range of US$51 billion and US$48 billion according to the two scenarios, respectively.
The operating costs would depend on how close the hydrological scenario is to the critical scenario. In case the latter is realised, the annual operating and fuel cost will be US$6.9 billion and US$7.2 billion, respectively. Because the critical scenario does not occur all the time, these figures can be considered as the maximum limit for the variable cost of adaptation to the loss of reliability in the hydropower system.
Conclusions and RecommendationsThe main implication of this result is the need to
shift natural gas from the industrial sector in order to meet the demand of the energy sector (the industrial sector’s demand would then be satisfied with fuel oil).
The extra installed capacity to ensure reliability of the system should be idle during part of the time. This result is not a problem in itself for flexible technologies such as gas turbines, provided that alternatives to market natural gas in a secondary market are in place. As far as bagasse goes, insofar as CEST [11] cycles allow for a certain modulation of generation, it can be used in applications other than
electricity generation (possibly in the production of cellulose ethanol).
Now, in the case of nuclear power generation, the operating inertia is significant (one cannot operate a nuclear plant by modulating its load). The optimisation model points to the nuclear power alternative during the critical period, but under average water conditions (where hydropower plants continue to generate energy), a costly and low operating flexibility plant would remain operational even if there were water in the reservoirs, which would then need to be wasted (spilled).
It should be pointed out that a portion of adaptation can be conducted in a cost-effective manner through advanced bagasse co-generation according to the option chosen under the optimisation model. But, another substantial portion of the selected adaptation took place from natural gas-fired plants, which would not be ‘switched on’ during a sizeable part of the time. When they were, however, greenhouse gas emissions in the energy sector would go up, and so would GHG emissions in the industrial sector, which would then replace natural gas with fuel oil.
From a technical viewpoint, it would be possible to adapt without increasing emissions substantially, with more advanced bagasse-based generation cycles (gasification cycles), but they are not yet competitive and were not selected during the optimisation process.
[11] Condensation and extraction steam turbines.
Adapting to Climate Change | The Economics of Climate Change in Brazil46
www.economiadoclima.org.br
SAND
RA C
UNNI
NGHA
M/S
HUTT
ERST
OCK
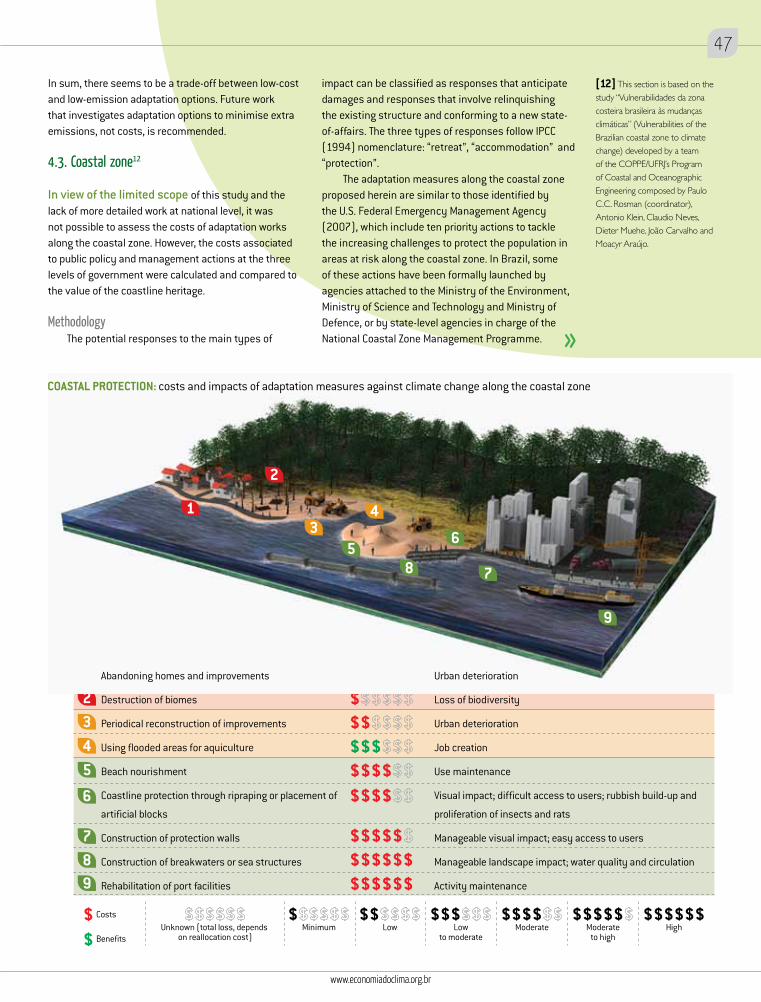
LEGENDA
12345
6
789
Types of response Cost Impact
RETREAT ACCOMMODATION PROTECTION
34
7
9
8
65
1
2
Minimum Low Lowto moderate
Moderate Moderateto high
HighUnknown (total loss, depends on reallocation cost)
Costs
Benefits
Urban deterioration
Loss of biodiversity
Urban deterioration
Job creation
Use maintenance
Visual impact; difficult access to users; rubbish build-up and
proliferation of insects and rats
Manageable visual impact; easy access to users
Manageable landscape impact; water quality and circulation
Activity maintenance
Abandoning homes and improvements
Destruction of biomes
Periodical reconstruction of improvements
Using flooded areas for aquiculture
Beach nourishment
Coastline protection through ripraping or placement of
artificial blocks
Construction of protection walls
Construction of breakwaters or sea structures
Rehabilitation of port facilities
COASTAL PROTECTION: costs and impacts of adaptation measures against climate change along the coastal zone
In sum, there seems to be a trade-off between low-cost and low-emission adaptation options. Future work that investigates adaptation options to minimise extra emissions, not costs, is recommended.
4.3. Coastal zone12
In view of the limited scope of this study and the lack of more detailed work at national level, it was not possible to assess the costs of adaptation works along the coastal zone. However, the costs associated to public policy and management actions at the three levels of government were calculated and compared to the value of the coastline heritage.
MethodologyThe potential responses to the main types of
impact can be classified as responses that anticipate damages and responses that involve relinquishing the existing structure and conforming to a new state-of-affairs. The three types of responses follow IPCC (1994) nomenclature: “retreat”, “accommodation” and “protection”.
The adaptation measures along the coastal zone proposed herein are similar to those identified by the U.S. Federal Emergency Management Agency (2007), which include ten priority actions to tackle the increasing challenges to protect the population in areas at risk along the coastal zone. In Brazil, some of these actions have been formally launched by agencies attached to the Ministry of the Environment, Ministry of Science and Technology and Ministry of Defence, or by state-level agencies in charge of the National Coastal Zone Management Programme.
[12] This section is based on the study “Vulnerabilidades da zona costeira brasileira às mudanças climáticas” (Vulnerabilities of the Brazilian coastal zone to climate change) developed by a team of the COPPE/UFRJ’s Program of Coastal and Oceanographic Engineering composed by Paulo C.C. Rosman (coordinator), Antonio Klein, Claudio Neves, Dieter Muehe, João Carvalho and Moacyr Araújo.
www.economiadoclima.org.br
47
www.economiadoclima.org.br
47
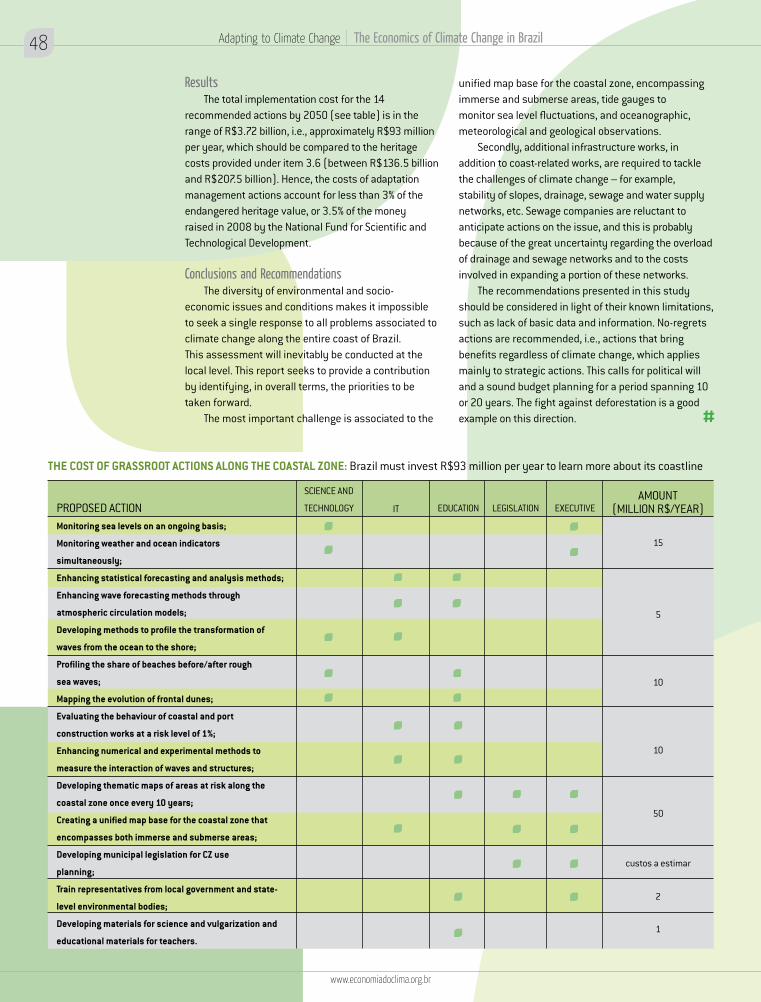
ResultsThe total implementation cost for the 14
recommended actions by 2050 (see table) is in the range of R$3.72 billion, i.e., approximately R$93 million per year, which should be compared to the heritage costs provided under item 3.6 (between R$136.5 billion and R$207.5 billion). Hence, the costs of adaptation management actions account for less than 3% of the endangered heritage value, or 3.5% of the money raised in 2008 by the National Fund for Scientific and Technological Development.
Conclusions and RecommendationsThe diversity of environmental and socio-
economic issues and conditions makes it impossible to seek a single response to all problems associated to climate change along the entire coast of Brazil. This assessment will inevitably be conducted at the local level. This report seeks to provide a contribution by identifying, in overall terms, the priorities to be taken forward.
The most important challenge is associated to the
THE COST OF GRASSROOT ACTIONS ALONG THE COASTAL ZONE: Brazil must invest R$93 million per year to learn more about its coastline
Cenário A2 do IPCC Cenário B2 do IPCC
AMOUNT(MILLION R$/YEAR)
SCIENCE AND
TECHNOLOGY IT EDUCATION LEGISLATION EXECUTIVE
15
5
10
10
50
custos a estimar
2
1
PROPOSED ACTIONMonitoring sea levels on an ongoing basis;
Monitoring weather and ocean indicators
simultaneously;
Enhancing statistical forecasting and analysis methods;
Enhancing wave forecasting methods through
atmospheric circulation models;
Developing methods to profile the transformation of
waves from the ocean to the shore;
Profiling the share of beaches before/after rough
sea waves;
Mapping the evolution of frontal dunes;
Evaluating the behaviour of coastal and port
construction works at a risk level of 1%;
Enhancing numerical and experimental methods to
measure the interaction of waves and structures;
Developing thematic maps of areas at risk along the
coastal zone once every 10 years;
Creating a unified map base for the coastal zone that
encompasses both immerse and submerse areas;
Developing municipal legislation for CZ use
planning;
Train representatives from local government and state-
level environmental bodies;
Developing materials for science and vulgarization and
educational materials for teachers.
unified map base for the coastal zone, encompassing immerse and submerse areas, tide gauges to monitor sea level fluctuations, and oceanographic, meteorological and geological observations.
Secondly, additional infrastructure works, in addition to coast-related works, are required to tackle the challenges of climate change – for example, stability of slopes, drainage, sewage and water supply networks, etc. Sewage companies are reluctant to anticipate actions on the issue, and this is probably because of the great uncertainty regarding the overload of drainage and sewage networks and to the costs involved in expanding a portion of these networks.
The recommendations presented in this study should be considered in light of their known limitations, such as lack of basic data and information. No-regrets actions are recommended, i.e., actions that bring benefits regardless of climate change, which applies mainly to strategic actions. This calls for political will and a sound budget planning for a period spanning 10 or 20 years. The fight against deforestation is a good example on this direction.
Adapting to Climate Change | The Economics of Climate Change in Brazil48
www.economiadoclima.org.br
www.economiadoclima.org.br
49
www.economiadoclima.org.br
49W
IGI P
HOTO
GRAP
HY/S
HUTT
ERST
OCK

JBOR
/SHU
TTER
STOC
K
CHAPTER 5
Macro-economic analysis
Macro-economic analysis
How does global warming influence Brazil’s development agenda? In order to provide an innovative answer to this question, an integrated approach was developed for this study that projects the economic impacts from climate change and adaptation and mitigation policies, explicitly considering the various territorial scales in Brazil (macro-regions, states, micro-regions, and networks of cities). Also, an attempt was made to establish a correlation between projected climate changes and socio-economic models.
MethodologyA computable general equilibrium (GCE) model was
used to simulate two climate change-free scenarios regarding the future of Brazil’s economy that are consistent with the global economic development trends under IPCC’s scenarios A2 and B2, which in this study are called scenarios A2-BR and B2-BR, respectively. Climate shocks, i.e., unusual changes that generate impacts, that were projected by INPE for Brazil and captured by the model through impacts on the agricultural/livestock and energy sectors were applied to these scenarios. The socio-economic trends of the scenarios with and without global climate change were reviewed in terms of benefits and costs for Brazil and its regions.
The models interact with the agricultural/livestock and energy sector studies through variables such as energy generation and consumption for different sectors and regions, replacement of sources of energy in the production process and consumption by the residential sector, agricultural yields and land use, etc. These, in turn, are dependent on climate variables, future water supply and other economic factors.
Development of the two socio-economic scenarios for Brazil relied on an integrated modelling system for the generation of temporal scenarios, with a general computable equilibrium model called EFES as its core model. Its overall objective is to specify and implement an integrated information system for macro-economic, sector-specific and regional projections, and the analysis of economic policies.
EFES is integrated with a macro-economic dynamic general equilibrium (EGD) model that makes it possible to generate disaggregate results for up to 55 sectors
and 110 products. This EGD provides macro-economic projections, including information on the evolution of inflation, exchange rate, household sector consumption, government expenditures, aggregate investment, and exports. It also includes expert projections and scenarios on specific preferences, technology and sector policies.
Once the EFES model is fed with this information, it generates structural and macro-economic projections for the Brazilian economy that are consistent with IPCC’s scenarios A2 and B2. At this stage a semi-iterative integration with the energy demand and supply model takes places, which allows adjusting the energy matrix according to the operation of the energy sector (therefore including adaptation costs).
Once the baseline trends were defined (two scenarios with no global climate change), the next step
This chapter is based on the study “Avaliação de impactos de mudanças climáticas sobre a economia brasileira” (Assessment of impacts from climate change on the Brazilian economy) commissioned by this project and developed by the Economic Research Institute Foundation (FIPE)’s team: Eduardo Haddad (coordinator), Eduardo Almeida, Carlos Azzoni, Edson Domingues, Joaquim Guilhoto, Fábio Kanczuk, and Fernando Perobelli.
52
www.economiadoclima.org.br
Macro-economic Analysis | The Economics of Climate Change in Brazil
www.economiadoclima.org.br
SZEF
EI/S
HUTT
ERST
OCK
was to establish deviations in relation to these trends caused by climate change. Inputs from other models that provide the shocks to be fed into the main model were: (i) changes to the allocation among cropping, pasture and forestry, by state (UF); (ii) changes to agricultural yields, by UF; and (iii) changes to Brazil’s energy matrix.
ResultsThe climate change-free simulations show that
Brazil’s GDP grows by 4.20% per year between 2008 and 2035, and 3.77% during the period 2035-2050, under scenario A2-BR; and 4.24% and 3.95% under scenario B2-BR during the same timeframes.
Regarding the impacts of climate change on the economy, the simulations reveal a permanent loss for Brazil’s GDP by 2050 of approximately 0.5% when the trends for A2-BR with and without climate change are compared, and about 2.3% between trends for B2-BR with and without climate change. Although B2-BR involves more significant losses than A2-BR, an important caveat must be made: in absolute terms, the Brazilian economy will have more benefits without and with climate change if the trend for B2-BR is followed, rather than the trend for A2-BR.
In order to calculate annual GDP losses that are accrued until 2050 at their present value, three
different discount rates were used: 0.5%, 1% and 3% per year. Losses range between 13.6% and 147% of the GDP for 2008. Hence, if the costs from climate change in Brazil by 2050 were brought forward to today, at an intertemporal discount rate of 1.0% per year, for example, the cost in terms of the GDP would be between R$719 billion under A2-BR and R$3.655 trillion under B2-BR, which would account for 25-125% of the GDP for 2008.
The economic impacts of climate change are experienced in different ways across the business sectors, regions, states, and large cities. For example, agriculture is the business sector more directly sensitive to climate, with a permanent decline in production of 3.6% under A2-BR and 5.0% under B2-BR by 2050.
From the regional perspective, the greatest threat looms over the poorest regions in the Country. It is fair to conclude that climate change exacerbates regional inequalities in Brazil. The most significant discrepancy can be found in the trend for A2-BR by comparing the effects of climate change in the South region (gains of 2%) to the effects in the Mid-West region (losses of 3%) in relation to the same scenario A2-BR without climate change.
When the states are considered, the exceptions are the cold states, which will have milder temperatures
www.economiadoclima.org.br
53
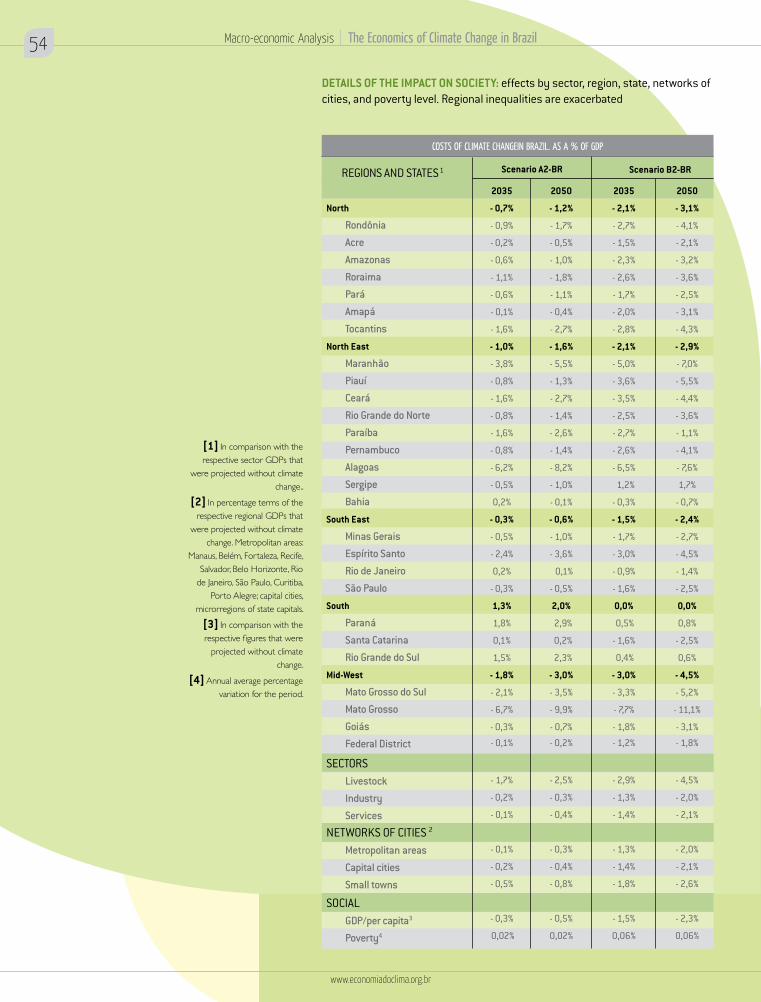
DETAILS OF THE IMPACT ON SOCIETY: effects by sector, region, state, networks of cities, and poverty level. Regional inequalities are exacerbated
COSTS OF CLIMATE CHANGEIN BRAZIL. AS A % OF GDP
Scenario A2-BR Scenario B2-BRREGIONS AND STATES 1
North
RondôniaAcreAmazonasRoraimaParáAmapáTocantins
North East
MaranhãoPiauíCearáRio Grande do NorteParaíbaPernambucoAlagoasSergipeBahia
South East
Minas GeraisEspírito SantoRio de JaneiroSão Paulo
South
ParanáSanta CatarinaRio Grande do Sul
Mid-West
Mato Grosso do SulMato GrossoGoiásFederal District
SECTORSLivestockIndustryServices
NETWORKS OF CITIES 2
Metropolitan areasCapital citiesSmall towns
SOCIALGDP/per capita3
Poverty4
2050
- 1,2%
- 1,7%
- 0,5%
- 1,0%
- 1,8%
- 1,1%
- 0,4%
- 2,7%
- 1,6%
- 5,5%
- 1,3%
- 2,7%
- 1,4%
- 2,6%
- 1,4%
- 8,2%
- 1,0%
- 0,1%
- 0,6%
- 1,0%
- 3,6%
0,1%
- 0,5%
2,0%
2,9%
0,2%
2,3%
- 3,0%
- 3,5%
- 9,9%
- 0,7%
- 0,2%
- 2,5%
- 0,3%
- 0,4%
- 0,3%
- 0,4%
- 0,8%
- 0,5%
0,02%
2050
- 3,1%
- 4,1%
- 2,1%
- 3,2%
- 3,6%
- 2,5%
- 3,1%
- 4,3%
- 2,9%
- 7,0%
- 5,5%
- 4,4%
- 3,6%
- 1,1%
- 4,1%
- 7,6%
1,7%
- 0,7%
- 2,4%
- 2,7%
- 4,5%
- 1,4%
- 2,5%
0,0%
0,8%
- 2,5%
0,6%
- 4,5%
- 5,2%
- 11,1%
- 3,1%
- 1,8%
- 4,5%
- 2,0%
- 2,1%
- 2,0%
- 2,1%
- 2,6%
- 2,3%
0,06%
2035
- 0,7%
- 0,9%
- 0,2%
- 0,6%
- 1,1%
- 0,6%
- 0,1%
- 1,6%
- 1,0%
- 3,8%
- 0,8%
- 1,6%
- 0,8%
- 1,6%
- 0,8%
- 6,2%
- 0,5%
0,2%
- 0,3%
- 0,5%
- 2,4%
0,2%
- 0,3%
1,3%
1,8%
0,1%
1,5%
- 1,8%
- 2,1%
- 6,7%
- 0,3%
- 0,1%
- 1,7%
- 0,2%
- 0,1%
- 0,1%
- 0,2%
- 0,5%
- 0,3%
0,02%
2035
- 2,1%
- 2,7%
- 1,5%
- 2,3%
- 2,6%
- 1,7%
- 2,0%
- 2,8%
- 2,1%
- 5,0%
- 3,6%
- 3,5%
- 2,5%
- 2,7%
- 2,6%
- 6,5%
1,2%
- 0,3%
- 1,5%
- 1,7%
- 3,0%
- 0,9%
- 1,6%
0,0%
0,5%
- 1,6%
0,4%
- 3,0%
- 3,3%
- 7,7%
- 1,8%
- 1,2%
- 2,9%
- 1,3%
- 1,4%
- 1,3%
- 1,4%
- 1,8%
- 1,5%
0,06%
[1] In comparison with the respective sector GDPs that
were projected without climate change..
[2] In percentage terms of the respective regional GDPs that
were projected without climate change. Metropolitan areas:
Manaus, Belém, Fortaleza, Recife, Salvador, Belo Horizonte, Rio
de Janeiro, São Paulo, Curitiba, Porto Alegre; capital cities,
microrregions of state capitals.
[3] In comparison with the respective !gures that were
projected without climate change.
[4] Annual average percentage variation for the period.
54
www.economiadoclima.org.br
Macro-economic Analysis | The Economics of Climate Change in Brazil
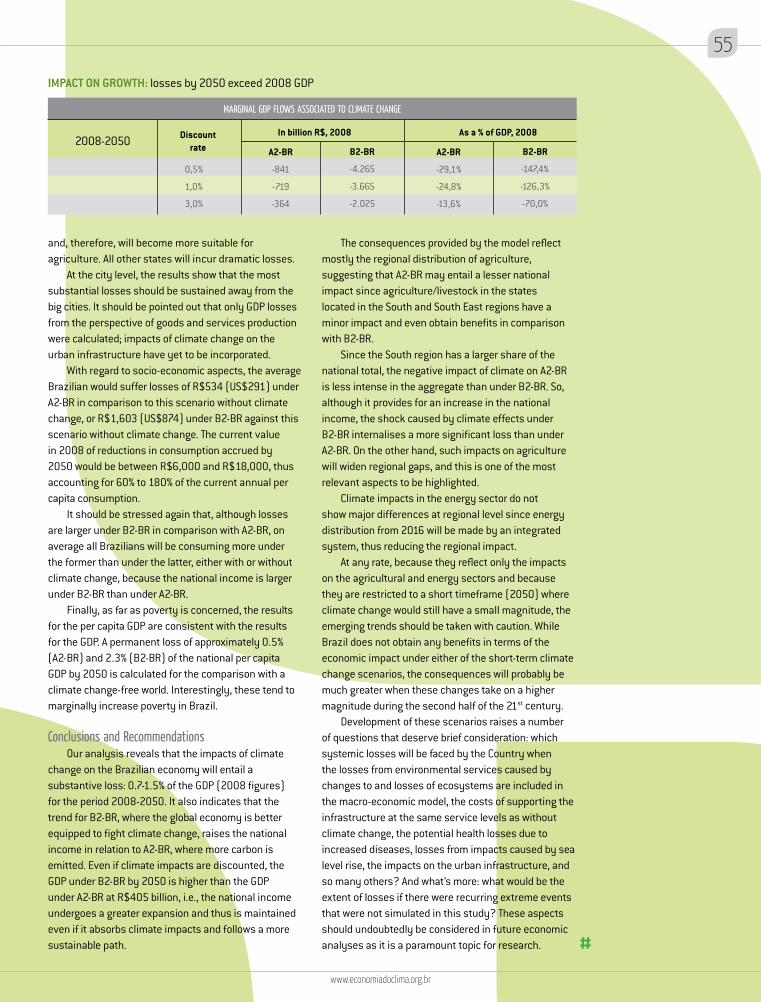
and, therefore, will become more suitable for agriculture. All other states will incur dramatic losses.
At the city level, the results show that the most substantial losses should be sustained away from the big cities. It should be pointed out that only GDP losses from the perspective of goods and services production were calculated; impacts of climate change on the urban infrastructure have yet to be incorporated.
With regard to socio-economic aspects, the average Brazilian would suffer losses of R$534 (US$291) under A2-BR in comparison to this scenario without climate change, or R$1,603 (US$874) under B2-BR against this scenario without climate change. The current value in 2008 of reductions in consumption accrued by 2050 would be between R$6,000 and R$18,000, thus accounting for 60% to 180% of the current annual per capita consumption.
It should be stressed again that, although losses are larger under B2-BR in comparison with A2-BR, on average all Brazilians will be consuming more under the former than under the latter, either with or without climate change, because the national income is larger under B2-BR than under A2-BR.
Finally, as far as poverty is concerned, the results for the per capita GDP are consistent with the results for the GDP. A permanent loss of approximately 0.5% (A2-BR) and 2.3% (B2-BR) of the national per capita GDP by 2050 is calculated for the comparison with a climate change-free world. Interestingly, these tend to marginally increase poverty in Brazil.
Conclusions and RecommendationsOur analysis reveals that the impacts of climate
change on the Brazilian economy will entail a substantive loss: 0.7-1.5% of the GDP (2008 figures) for the period 2008-2050. It also indicates that the trend for B2-BR, where the global economy is better equipped to fight climate change, raises the national income in relation to A2-BR, where more carbon is emitted. Even if climate impacts are discounted, the GDP under B2-BR by 2050 is higher than the GDP under A2-BR at R$405 billion, i.e., the national income undergoes a greater expansion and thus is maintained even if it absorbs climate impacts and follows a more sustainable path.
The consequences provided by the model reflect mostly the regional distribution of agriculture, suggesting that A2-BR may entail a lesser national impact since agriculture/livestock in the states located in the South and South East regions have a minor impact and even obtain benefits in comparison with B2-BR.
Since the South region has a larger share of the national total, the negative impact of climate on A2-BR is less intense in the aggregate than under B2-BR. So, although it provides for an increase in the national income, the shock caused by climate effects under B2-BR internalises a more significant loss than under A2-BR. On the other hand, such impacts on agriculture will widen regional gaps, and this is one of the most relevant aspects to be highlighted.
Climate impacts in the energy sector do not show major differences at regional level since energy distribution from 2016 will be made by an integrated system, thus reducing the regional impact.
At any rate, because they reflect only the impacts on the agricultural and energy sectors and because they are restricted to a short timeframe (2050) where climate change would still have a small magnitude, the emerging trends should be taken with caution. While Brazil does not obtain any benefits in terms of the economic impact under either of the short-term climate change scenarios, the consequences will probably be much greater when these changes take on a higher magnitude during the second half of the 21st century.
Development of these scenarios raises a number of questions that deserve brief consideration: which systemic losses will be faced by the Country when the losses from environmental services caused by changes to and losses of ecosystems are included in the macro-economic model, the costs of supporting the infrastructure at the same service levels as without climate change, the potential health losses due to increased diseases, losses from impacts caused by sea level rise, the impacts on the urban infrastructure, and so many others? And what’s more: what would be the extent of losses if there were recurring extreme events that were not simulated in this study? These aspects should undoubtedly be considered in future economic analyses as it is a paramount topic for research.
IMPACT ON GROWTH: losses by 2050 exceed 2008 GDP
0,5%
1,0%
3,0%
A2-BR
-841
-719
-364
A2-BR
-29,1%
-24,8%
-13,6%
B2-BR
-4.265
-3.665
-2.025
B2-BR
-147,4%
-126,3%
-70,0%
In billion R$, 2008 As a % of GDP, 2008
MARGINAL GDP FLOWS ASSOCIATED TO CLIMATE CHANGE
Discount rate2008-2050
www.economiadoclima.org.br
55

JBOR
/SHU
TTER
STOC
K
CHAPTER 6
Emission reductions
Emission Reductions | The Economics of Climate Change in Brazil
Emission reductionsThis chapter discusses the main options for the Country to contribute to the global emission reduction effort, which in the case of Brazil are primarily as follows: (i) costs of emissions reduction in the Amazon region through deforestation control; (ii) impact of biofuels in further reducing emissions in the Country and assisting other countries in reaching this objective; and (iii) imposing a tax on carbon emissions as an instrument for mitigation and its impacts on the economy.
A fourth item of fundamental importance is mitigation options for the energy sector. The topic was the specific object of a parallel study by the World Bank, in partnership with the Brazilian Government, conducted by a team which included the same technical team in charge of the chapters on energy in this present study. Therefore, the analyses presented here are based on the results of the study conducted by the World Bank.
6.1 Reduction of deforestation in the Brazilian Amazon and its opportunity costs13
The land use change and forests (particularly deforestation of tropical rainforests) is the second biggest global source of greenhouse gases, with an estimated contribution between 8% and 28% of CO2 emissions in the year of 1990. It is estimated that in Brazil, deforestation accounts for around 60% of domestic emissions, presenting an enormous potential for mitigation activities.
To reduce emissions, a compensation and incentives system between Brazil and other countries could be set up – Brazil would be paid at least the same amount of income currently generated through deforestation, and the international community would reduce its carbon emissions at a lower cost. This mechanism, called REDD (reducing emissions from deforestation and forest degradation), which is still being defined, could be adopted in negotiations being held at the level of the United Nations Framework Convention on Climate Change.
As a result of the importance of this theme, two studies to assess the opportunity cost of deforestation have been commissioned. This chapter also attempts to show how an instrument like REDD could be implemented in Brazil in terms of economic incentives.
MethodologyThis section is based on two studies. One of them
(Strassburg, 2009) develops a partial equilibrium
model based on three possible scenarios. The first identifies the different uses to which land in the Brazilian Amazon has historically been put to, estimating its economic return. For the period between 1997 and 2006, 64 different products from each of the 102 micro-regions of the Legal Amazon region are included. The second study provides an estimate of the maximum return that could have been obtained in the same area. The third and last scenario estimates the different future land uses in the region and the economic return associated to deforestation in the period between 2010 and 2050.
The other study (IPAM, 2007) develops a bottom-up model which imposes biophysical, climate and infrastructure limitations to the expansion of agriculture and livestock in the tropical rainforest regions. The work is divided in two parts: in the first, models are combined to provide and predict the opportunity cost of conserving the forest, using income models for the three main activities – timber, soybeans and cattle ranching. The second calculates the cost of reducing emissions from deforestation to close to zero for a period of ten years. In addition to programme costs, an initial assessment is made of the benefits of these reductions to Brazilian society and necessary institutional organisation elements.
ResultsThe average opportunity cost in both studies differs
by a factor a little higher than 2. The main justification for this divergence is that by considering only three alternative activities, the study by the IPAM ignores other important activities, which have a very high net opportunity cost (approximately 10 times higher than pasture) and occupy 19% of the area according to Strassburg. The latter in turn includes other activities, but overestimates their expansion potential by not considering the appropriateness of land and climate in the model, as well as the existence or lack of infrastructure and markets.
The authors of this study developed a group of revised assumptions for each model, in an attempt to correct the limitations identified in each of them. For the Strassburg study, the opportunity cost of other activities was reduced from US$ 6,480 per hectare to US$ 3,500 due to market problems and projected volumes. For IPAM’s model, ‘other activities’ were allowed to be introduced, but only for 10% of the land. The result shows two models converging to an opportunity cost of US$ 1,000 per hectare, adopted
[13] This section is based on two studies and one direct
collaboration. The !rst – “Os determinantes agrícolas e o retorno econômico do
desmatamento na Amazônia brasileira entre 1997-2006 e 2010-2050” (Agricultural
determinants and the economic return of deforestation in the
Brazilian Amazon between 1997-2006 and 2010-2050)
(Strassburg 2009) – coordinated by Bernardo Strassburg (GAEA
and East Anglia University), with the collaboration of Felipe
Cronemberger (UFF), Gilla Sunnenberg (UEA) and Annabel
Kelly (UEA). The second study – “Os custos e benefícios
da redução das emissões de carbono do desmatamento e da degradação de "orestas na
Amazônia brasileira” (Costs and bene!ts of reducing carbon
emissions from deforestation and forest degradation in the
Brazilian Amazon) (IPAM 2007) – developed by a team including Daniel Nepstad (WHRC, IPAM),
Britaldo Soares-Filho (UFMG), FrankMerry (WHRC), Paulo
Moutinho (IPAM, WHRC), Hermann Oliveira Rodrigues
(UFMG), Maria Bowman (WHRC), Steve Schwartzman (ED), Oriana Almeida (UFPa)
and Sergio Rivero (UFPa). Robert Schneider (consultant)
was in charge of integrating both studies and for the calculation
of the proposed REDD programme.
58
www.economiadoclima.org.br
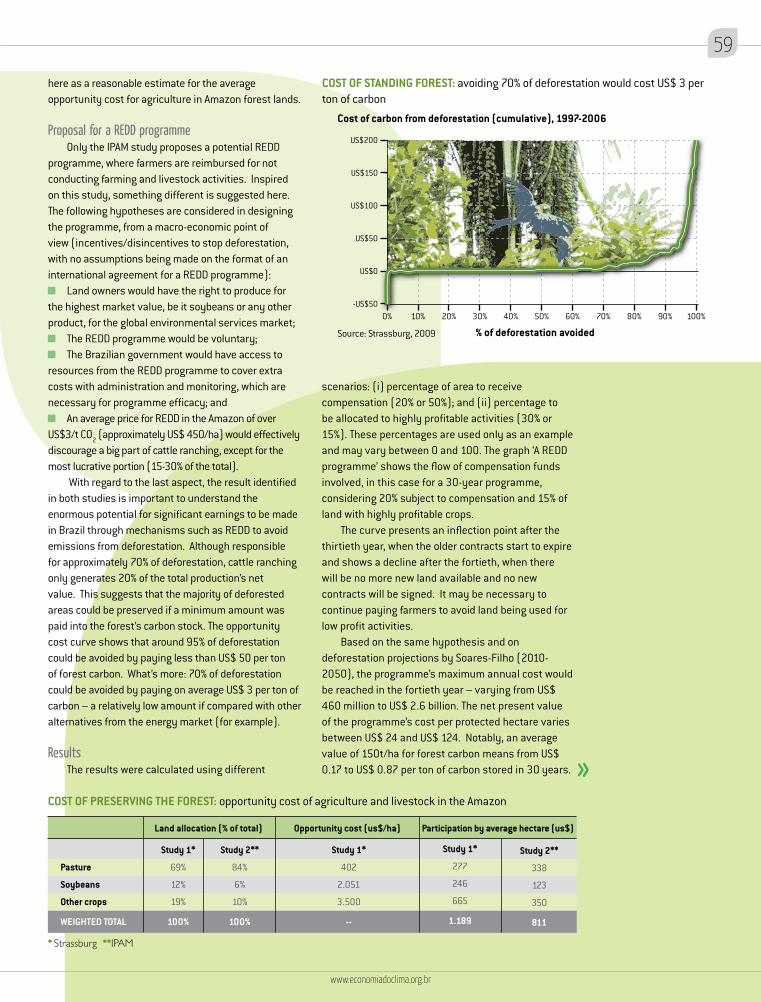
here as a reasonable estimate for the average opportunity cost for agriculture in Amazon forest lands.
Proposal for a REDD programmeOnly the IPAM study proposes a potential REDD
programme, where farmers are reimbursed for not conducting farming and livestock activities. Inspired on this study, something different is suggested here. The following hypotheses are considered in designing the programme, from a macro-economic point of view (incentives/disincentives to stop deforestation, with no assumptions being made on the format of an international agreement for a REDD programme):
Land owners would have the right to produce for the highest market value, be it soybeans or any other product, for the global environmental services market;
The REDD programme would be voluntary; The Brazilian government would have access to
resources from the REDD programme to cover extra costs with administration and monitoring, which are necessary for programme efficacy; and
An average price for REDD in the Amazon of over US$3/t CO2 (approximately US$ 450/ha) would effectively discourage a big part of cattle ranching, except for the most lucrative portion (15-30% of the total).
With regard to the last aspect, the result identified in both studies is important to understand the enormous potential for significant earnings to be made in Brazil through mechanisms such as REDD to avoid emissions from deforestation. Although responsible for approximately 70% of deforestation, cattle ranching only generates 20% of the total production’s net value. This suggests that the majority of deforested areas could be preserved if a minimum amount was paid into the forest’s carbon stock. The opportunity cost curve shows that around 95% of deforestation could be avoided by paying less than US$ 50 per ton of forest carbon. What’s more: 70% of deforestation could be avoided by paying on average US$ 3 per ton of carbon – a relatively low amount if compared with other alternatives from the energy market (for example).
ResultsThe results were calculated using different
scenarios: (i) percentage of area to receive compensation (20% or 50%); and (ii) percentage to be allocated to highly profitable activities (30% or 15%). These percentages are used only as an example and may vary between 0 and 100. The graph ‘A REDD programme’ shows the flow of compensation funds involved, in this case for a 30-year programme, considering 20% subject to compensation and 15% of land with highly profitable crops.
The curve presents an inflection point after the thirtieth year, when the older contracts start to expire and shows a decline after the fortieth, when there will be no more new land available and no new contracts will be signed. It may be necessary to continue paying farmers to avoid land being used for low profit activities.
Based on the same hypothesis and on deforestation projections by Soares-Filho (2010-2050), the programme’s maximum annual cost would be reached in the fortieth year – varying from US$ 460 million to US$ 2.6 billion. The net present value of the programme’s cost per protected hectare varies between US$ 24 and US$ 124. Notably, an average value of 150t/ha for forest carbon means from US$ 0.17 to US$ 0.87 per ton of carbon stored in 30 years.
COST OF PRESERVING THE FOREST: opportunity cost of agriculture and livestock in the Amazon
Pasture
Soybeans
Other crops
WEIGHTED TOTAL
Land allocation (% of total) Opportunity cost (us$/ha) Participation by average hectare (us$)
Study 1*
69%
12%
19%
100%
Study 2**
84%
6%
10%
100%
Study 1*
402
2.051
3.500
--
Study 1*
277
246
665
1.189
Study 2**
338
123
350
811
COST OF STANDING FOREST: avoiding 70% of deforestation would cost US$ 3 per ton of carbon
* Strassburg **IPAM
evitar 95% custaria US$ 50Cost of carbon from deforestation (cumulative), 1997-2006
Source: Strassburg, 2009
US$200
US$150
US$100
US$50
US$0
-US$50
% of deforestation avoided0% 10% 20% 30% 40% 50% 60% 70% 80% 90% 100%
www.economiadoclima.org.br
59
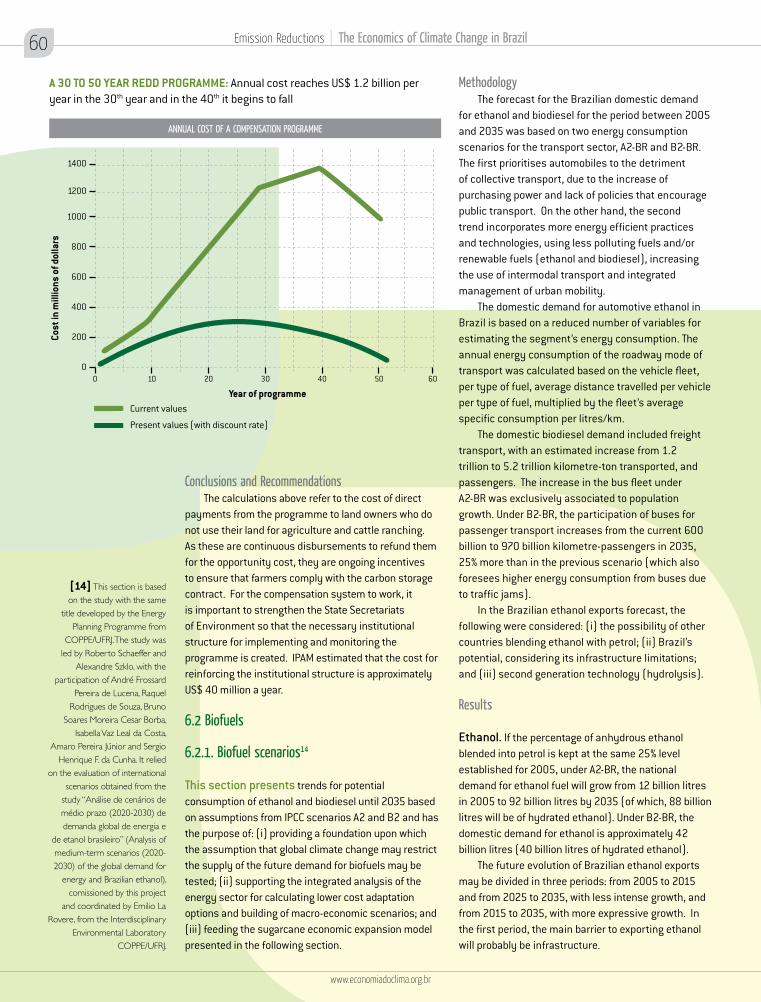
1000
1200
1400
800
600
400
200
00 10 20 30 40 50 60
Cost
in m
illio
ns o
f dol
lars
Year of programme
Emission Reductions | The Economics of Climate Change in Brazil
Conclusions and RecommendationsThe calculations above refer to the cost of direct
payments from the programme to land owners who do not use their land for agriculture and cattle ranching. As these are continuous disbursements to refund them for the opportunity cost, they are ongoing incentives to ensure that farmers comply with the carbon storage contract. For the compensation system to work, it is important to strengthen the State Secretariats of Environment so that the necessary institutional structure for implementing and monitoring the programme is created. IPAM estimated that the cost for reinforcing the institutional structure is approximately US$ 40 million a year.
6.2 Biofuels
6.2.1. Biofuel scenarios14
This section presents trends for potential consumption of ethanol and biodiesel until 2035 based on assumptions from IPCC scenarios A2 and B2 and has the purpose of: (i) providing a foundation upon which the assumption that global climate change may restrict the supply of the future demand for biofuels may be tested; (ii) supporting the integrated analysis of the energy sector for calculating lower cost adaptation options and building of macro-economic scenarios; and (iii) feeding the sugarcane economic expansion model presented in the following section.
MethodologyThe forecast for the Brazilian domestic demand
for ethanol and biodiesel for the period between 2005 and 2035 was based on two energy consumption scenarios for the transport sector, A2-BR and B2-BR. The first prioritises automobiles to the detriment of collective transport, due to the increase of purchasing power and lack of policies that encourage public transport. On the other hand, the second trend incorporates more energy efficient practices and technologies, using less polluting fuels and/or renewable fuels (ethanol and biodiesel), increasing the use of intermodal transport and integrated management of urban mobility.
The domestic demand for automotive ethanol in Brazil is based on a reduced number of variables for estimating the segment’s energy consumption. The annual energy consumption of the roadway mode of transport was calculated based on the vehicle fleet, per type of fuel, average distance travelled per vehicle per type of fuel, multiplied by the fleet’s average specific consumption per litres/km.
The domestic biodiesel demand included freight transport, with an estimated increase from 1.2 trillion to 5.2 trillion kilometre-ton transported, and passengers. The increase in the bus fleet under A2-BR was exclusively associated to population growth. Under B2-BR, the participation of buses for passenger transport increases from the current 600 billion to 970 billion kilometre-passengers in 2035, 25% more than in the previous scenario (which also foresees higher energy consumption from buses due to traffic jams).
In the Brazilian ethanol exports forecast, the following were considered: (i) the possibility of other countries blending ethanol with petrol; (ii) Brazil’s potential, considering its infrastructure limitations; and (iii) second generation technology (hydrolysis).
Results
Ethanol. If the percentage of anhydrous ethanol blended into petrol is kept at the same 25% level established for 2005, under A2-BR, the national demand for ethanol fuel will grow from 12 billion litres in 2005 to 92 billion litres by 2035 (of which, 88 billion litres will be of hydrated ethanol). Under B2-BR, the domestic demand for ethanol is approximately 42 billion litres (40 billion litres of hydrated ethanol).
The future evolution of Brazilian ethanol exports may be divided in three periods: from 2005 to 2015 and from 2025 to 2035, with less intense growth, and from 2015 to 2035, with more expressive growth. In the first period, the main barrier to exporting ethanol will probably be infrastructure.
A 30 TO 50 YEAR REDD PROGRAMME: Annual cost reaches US$ 1.2 billion per year in the 30th year and in the 40th it begins to fall
ANNUAL COST OF A COMPENSATION PROGRAMME
Current values
Present values (with discount rate)
[14] This section is based on the study with the same
title developed by the Energy Planning Programme from
COPPE/UFRJ. The study was led by Roberto Schaeffer and
Alexandre Szklo, with the participation of André Frossard
Pereira de Lucena, Raquel Rodrigues de Souza, Bruno
Soares Moreira Cesar Borba, Isabella Vaz Leal da Costa,
Amaro Pereira Júnior and Sergio Henrique F. da Cunha. It relied
on the evaluation of international scenarios obtained from the
study “Análise de cenários de médio prazo (2020-2030) de demanda global de energia e
de etanol brasileiro” (Analysis of medium-term scenarios (2020-2030) of the global demand for
energy and Brazilian ethanol), comissioned by this project
and coordinated by Emilio La Rovere, from the Interdisciplinary
Environmental Laboratory COPPE/UFRJ.
60
www.economiadoclima.org.br
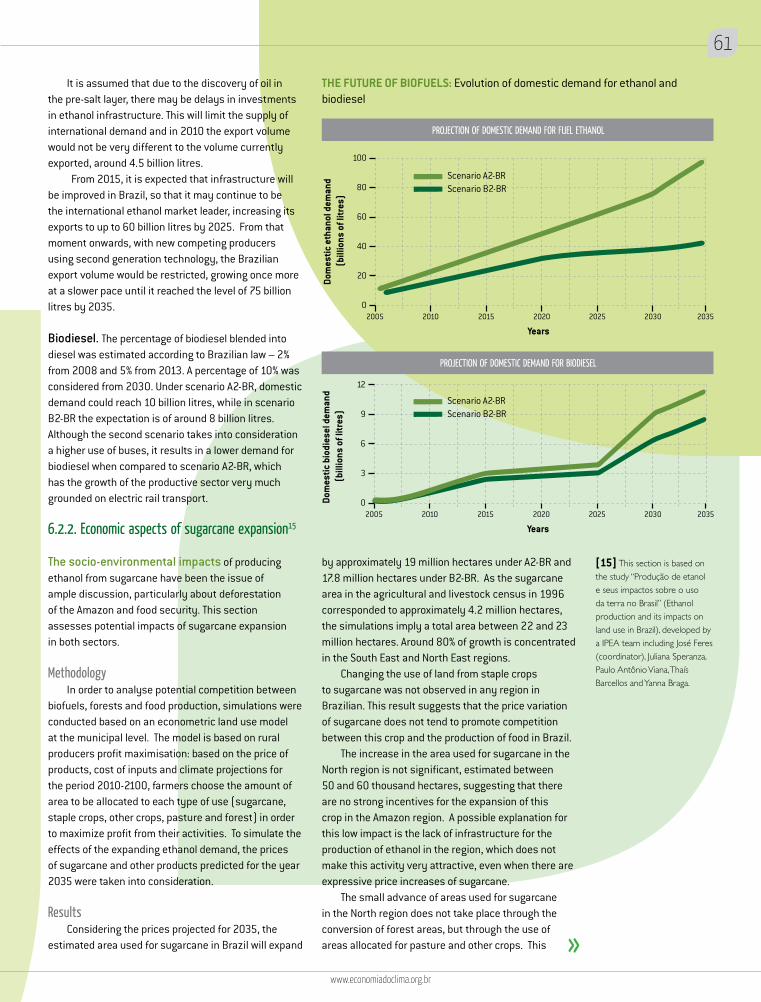
100
80
60
40
20
02005 2010 2015 2020 2025 2030 2035
Dom
estic
eth
anol
dem
and
(bill
ions
of l
itres
)Years
12
9
6
3
02005 2010 2015 2020 2025 2030 2035
Dom
estic
bio
dies
el d
eman
d (b
illio
ns o
f litr
es)
Years
It is assumed that due to the discovery of oil in the pre-salt layer, there may be delays in investments in ethanol infrastructure. This will limit the supply of international demand and in 2010 the export volume would not be very different to the volume currently exported, around 4.5 billion litres.
From 2015, it is expected that infrastructure will be improved in Brazil, so that it may continue to be the international ethanol market leader, increasing its exports to up to 60 billion litres by 2025. From that moment onwards, with new competing producers using second generation technology, the Brazilian export volume would be restricted, growing once more at a slower pace until it reached the level of 75 billion litres by 2035.
Biodiesel. The percentage of biodiesel blended into diesel was estimated according to Brazilian law – 2% from 2008 and 5% from 2013. A percentage of 10% was considered from 2030. Under scenario A2-BR, domestic demand could reach 10 billion litres, while in scenario B2-BR the expectation is of around 8 billion litres. Although the second scenario takes into consideration a higher use of buses, it results in a lower demand for biodiesel when compared to scenario A2-BR, which has the growth of the productive sector very much grounded on electric rail transport.
6.2.2. Economic aspects of sugarcane expansion15
The socio-environmental impacts of producing ethanol from sugarcane have been the issue of ample discussion, particularly about deforestation of the Amazon and food security. This section assesses potential impacts of sugarcane expansion in both sectors.
MethodologyIn order to analyse potential competition between
biofuels, forests and food production, simulations were conducted based on an econometric land use model at the municipal level. The model is based on rural producers profit maximisation: based on the price of products, cost of inputs and climate projections for the period 2010-2100, farmers choose the amount of area to be allocated to each type of use (sugarcane, staple crops, other crops, pasture and forest) in order to maximize profit from their activities. To simulate the effects of the expanding ethanol demand, the prices of sugarcane and other products predicted for the year 2035 were taken into consideration.
ResultsConsidering the prices projected for 2035, the
estimated area used for sugarcane in Brazil will expand
THE FUTURE OF BIOFUELS: Evolution of domestic demand for ethanol and biodiesel
Scenario A2-BRScenario B2-BR
Scenario A2-BRScenario B2-BR
PROJECTION OF DOMESTIC DEMAND FOR FUEL ETHANOL
PROJECTION OF DOMESTIC DEMAND FOR BIODIESEL
by approximately 19 million hectares under A2-BR and 17.8 million hectares under B2-BR. As the sugarcane area in the agricultural and livestock census in 1996 corresponded to approximately 4.2 million hectares, the simulations imply a total area between 22 and 23 million hectares. Around 80% of growth is concentrated in the South East and North East regions.
Changing the use of land from staple crops to sugarcane was not observed in any region in Brazilian. This result suggests that the price variation of sugarcane does not tend to promote competition between this crop and the production of food in Brazil.
The increase in the area used for sugarcane in the North region is not significant, estimated between 50 and 60 thousand hectares, suggesting that there are no strong incentives for the expansion of this crop in the Amazon region. A possible explanation for this low impact is the lack of infrastructure for the production of ethanol in the region, which does not make this activity very attractive, even when there are expressive price increases of sugarcane.
The small advance of areas used for sugarcane in the North region does not take place through the conversion of forest areas, but through the use of areas allocated for pasture and other crops. This
[15] This section is based on the study “Produção de etanol e seus impactos sobre o uso da terra no Brasil” (Ethanol production and its impacts on land use in Brazil), developed by a IPEA team including José Feres (coordinator), Juliana Speranza, Paulo Antônio Viana, Thaís Barcellos and Yanna Braga.
www.economiadoclima.org.br
61
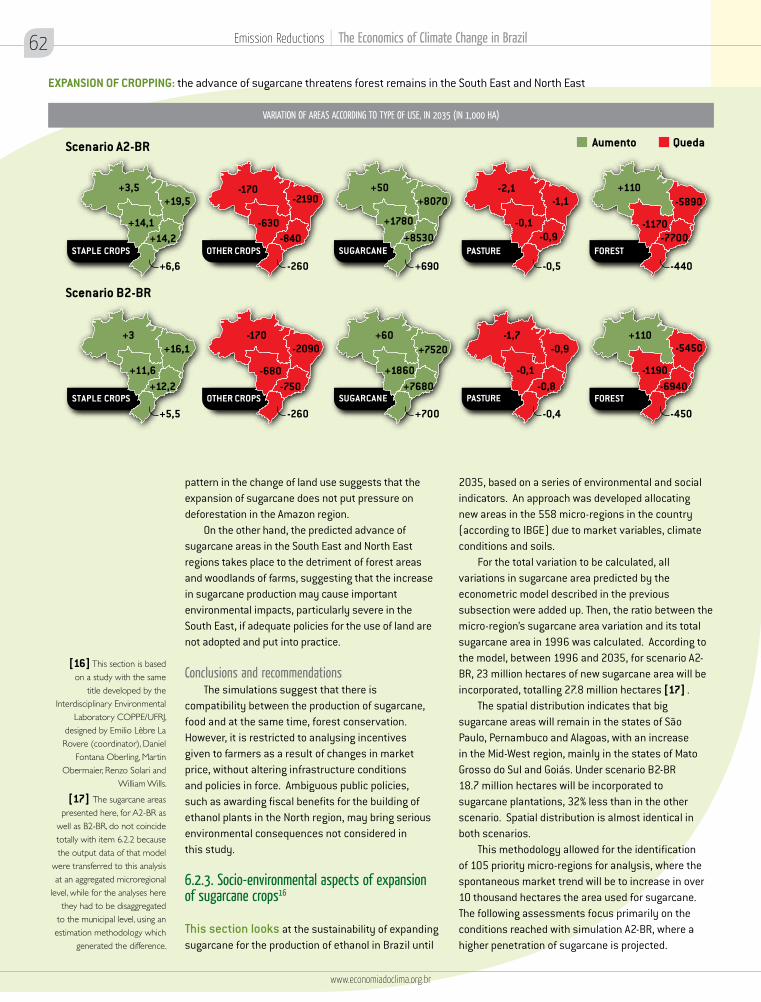
Emission Reductions | The Economics of Climate Change in Brazil
EXPANSION OF CROPPING: the advance of sugarcane threatens forest remains in the South East and North East
VARIATION OF AREAS ACCORDING TO TYPE OF USE, IN 2035 (IN 1,000 HA)
AumentoScenario A2-BR
Scenario B2-BR
+3,5+19,5
+14,2+14,1
+6,6
-170-2190
-840-630
-260
+50+8070
+1780
+690
-2,1-1,1
-0,9-0,1
-0,5
+110-5890
-7700-1170
-440
+3+16,1
+12,2+11,6
+5,5
-170-2090
-750-680
-260
+60+7520
+7680+1860
+700
-1,7-0,9
-0,8-0,1
-0,4
STAPLE CROPS OTHER CROPS SUGARCANE PASTURE
PASTURE
FOREST
+110-5450
-6940-1190
-450
Queda
+8530
STAPLE CROPS OTHER CROPS SUGARCANE FOREST
pattern in the change of land use suggests that the expansion of sugarcane does not put pressure on deforestation in the Amazon region.
On the other hand, the predicted advance of sugarcane areas in the South East and North East regions takes place to the detriment of forest areas and woodlands of farms, suggesting that the increase in sugarcane production may cause important environmental impacts, particularly severe in the South East, if adequate policies for the use of land are not adopted and put into practice.
Conclusions and recommendationsThe simulations suggest that there is
compatibility between the production of sugarcane, food and at the same time, forest conservation. However, it is restricted to analysing incentives given to farmers as a result of changes in market price, without altering infrastructure conditions and policies in force. Ambiguous public policies, such as awarding fiscal benefits for the building of ethanol plants in the North region, may bring serious environmental consequences not considered in this study.
6.2.3. Socio-environmental aspects of expansion of sugarcane crops16
This section looks at the sustainability of expanding sugarcane for the production of ethanol in Brazil until
2035, based on a series of environmental and social indicators. An approach was developed allocating new areas in the 558 micro-regions in the country (according to IBGE) due to market variables, climate conditions and soils.
For the total variation to be calculated, all variations in sugarcane area predicted by the econometric model described in the previous subsection were added up. Then, the ratio between the micro-region’s sugarcane area variation and its total sugarcane area in 1996 was calculated. According to the model, between 1996 and 2035, for scenario A2-BR, 23 million hectares of new sugarcane area will be incorporated, totalling 27.8 million hectares [17] .
The spatial distribution indicates that big sugarcane areas will remain in the states of São Paulo, Pernambuco and Alagoas, with an increase in the Mid-West region, mainly in the states of Mato Grosso do Sul and Goiás. Under scenario B2-BR 18.7 million hectares will be incorporated to sugarcane plantations, 32% less than in the other scenario. Spatial distribution is almost identical in both scenarios.
This methodology allowed for the identification of 105 priority micro-regions for analysis, where the spontaneous market trend will be to increase in over 10 thousand hectares the area used for sugarcane. The following assessments focus primarily on the conditions reached with simulation A2-BR, where a higher penetration of sugarcane is projected.
[16] This section is based on a study with the same
title developed by the Interdisciplinary Environmental
Laboratory COPPE/UFRJ, designed by Emilio Lèbre La Rovere (coordinator), Daniel
Fontana Oberling, Martin Obermaier, Renzo Solari and
William Wills.
[17] The sugarcane areas presented here, for A2-BR as
well as B2-BR, do not coincide totally with item 6.2.2 because the output data of that model
were transferred to this analysis at an aggregated microregional
level, while for the analyses here they had to be disaggregated
to the municipal level, using an estimation methodology which
generated the difference.
62
www.economiadoclima.org.br
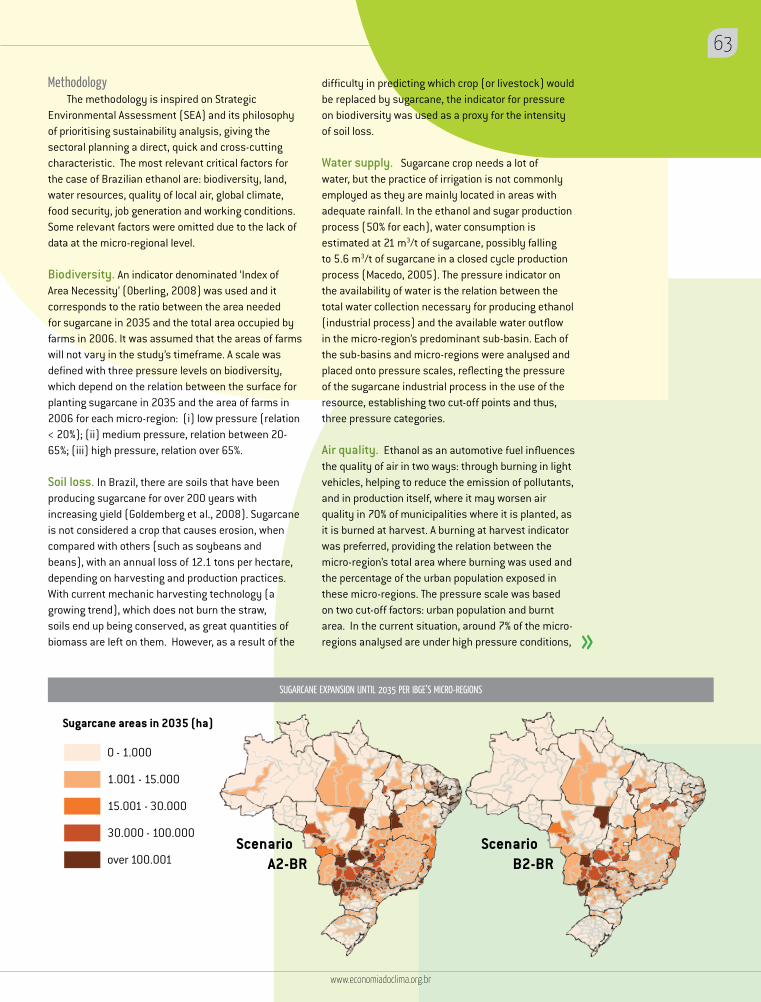
SUGARCANE EXPANSION UNTIL 2035 PER IBGE’S MICRO-REGIONS
Sugarcane areas in 2035 (ha)
0 - 1.000
1.001 - 15.000
15.001 - 30.000
30.000 - 100.000
over 100.001Scenario A2-BR
Scenario B2-BR
MethodologyThe methodology is inspired on Strategic
Environmental Assessment (SEA) and its philosophy of prioritising sustainability analysis, giving the sectoral planning a direct, quick and cross-cutting characteristic. The most relevant critical factors for the case of Brazilian ethanol are: biodiversity, land, water resources, quality of local air, global climate, food security, job generation and working conditions. Some relevant factors were omitted due to the lack of data at the micro-regional level.
Biodiversity. An indicator denominated ‘Index of Area Necessity’ (Oberling, 2008) was used and it corresponds to the ratio between the area needed for sugarcane in 2035 and the total area occupied by farms in 2006. It was assumed that the areas of farms will not vary in the study’s timeframe. A scale was defined with three pressure levels on biodiversity, which depend on the relation between the surface for planting sugarcane in 2035 and the area of farms in 2006 for each micro-region: (i) low pressure (relation < 20%); (ii) medium pressure, relation between 20-65%; (iii) high pressure, relation over 65%.
Soil loss. In Brazil, there are soils that have been producing sugarcane for over 200 years with increasing yield (Goldemberg et al., 2008). Sugarcane is not considered a crop that causes erosion, when compared with others (such as soybeans and beans), with an annual loss of 12.1 tons per hectare, depending on harvesting and production practices. With current mechanic harvesting technology (a growing trend), which does not burn the straw, soils end up being conserved, as great quantities of biomass are left on them. However, as a result of the
difficulty in predicting which crop (or livestock) would be replaced by sugarcane, the indicator for pressure on biodiversity was used as a proxy for the intensity of soil loss.
Water supply. Sugarcane crop needs a lot of water, but the practice of irrigation is not commonly employed as they are mainly located in areas with adequate rainfall. In the ethanol and sugar production process (50% for each), water consumption is estimated at 21 m3/t of sugarcane, possibly falling to 5.6 m3/t of sugarcane in a closed cycle production process (Macedo, 2005). The pressure indicator on the availability of water is the relation between the total water collection necessary for producing ethanol (industrial process) and the available water outflow in the micro-region’s predominant sub-basin. Each of the sub-basins and micro-regions were analysed and placed onto pressure scales, reflecting the pressure of the sugarcane industrial process in the use of the resource, establishing two cut-off points and thus, three pressure categories.
Air quality. Ethanol as an automotive fuel influences the quality of air in two ways: through burning in light vehicles, helping to reduce the emission of pollutants, and in production itself, where it may worsen air quality in 70% of municipalities where it is planted, as it is burned at harvest. A burning at harvest indicator was preferred, providing the relation between the micro-region’s total area where burning was used and the percentage of the urban population exposed in these micro-regions. The pressure scale was based on two cut-off factors: urban population and burnt area. In the current situation, around 7% of the micro-regions analysed are under high pressure conditions,
www.economiadoclima.org.br
63
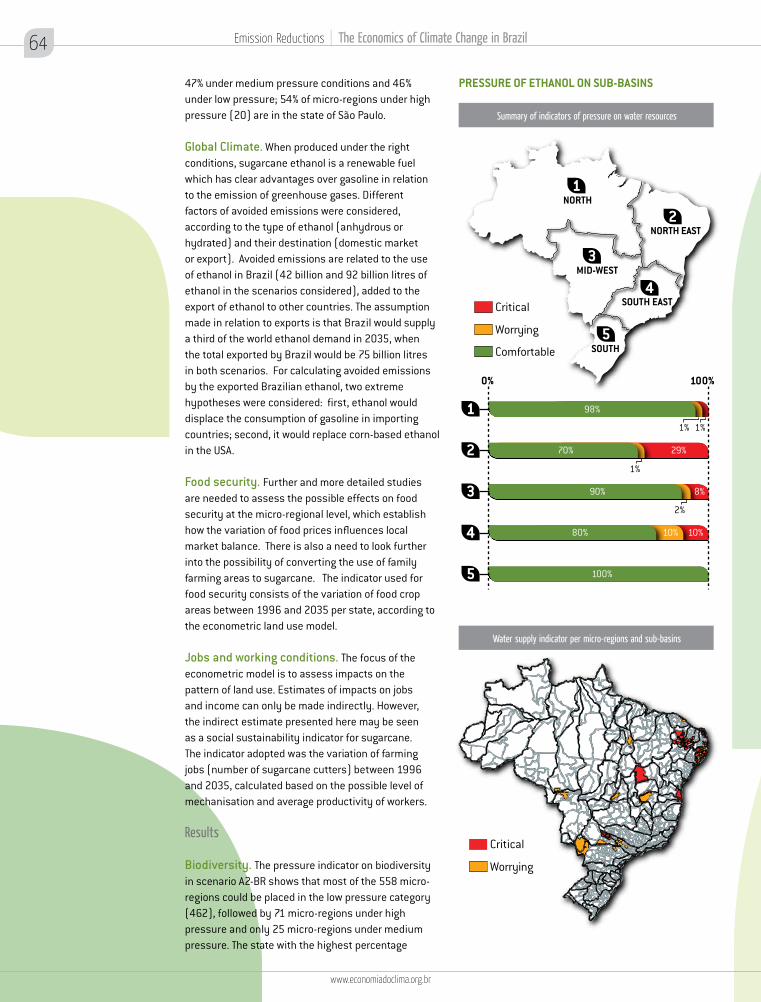
Emission Reductions | The Economics of Climate Change in Brazil
47% under medium pressure conditions and 46% under low pressure; 54% of micro-regions under high pressure (20) are in the state of São Paulo.
Global Climate. When produced under the right conditions, sugarcane ethanol is a renewable fuel which has clear advantages over gasoline in relation to the emission of greenhouse gases. Different factors of avoided emissions were considered, according to the type of ethanol (anhydrous or hydrated) and their destination (domestic market or export). Avoided emissions are related to the use of ethanol in Brazil (42 billion and 92 billion litres of ethanol in the scenarios considered), added to the export of ethanol to other countries. The assumption made in relation to exports is that Brazil would supply a third of the world ethanol demand in 2035, when the total exported by Brazil would be 75 billion litres in both scenarios. For calculating avoided emissions by the exported Brazilian ethanol, two extreme hypotheses were considered: first, ethanol would displace the consumption of gasoline in importing countries; second, it would replace corn-based ethanol in the USA.
Food security. Further and more detailed studies are needed to assess the possible effects on food security at the micro-regional level, which establish how the variation of food prices influences local market balance. There is also a need to look further into the possibility of converting the use of family farming areas to sugarcane. The indicator used for food security consists of the variation of food crop areas between 1996 and 2035 per state, according to the econometric land use model.
Jobs and working conditions. The focus of the econometric model is to assess impacts on the pattern of land use. Estimates of impacts on jobs and income can only be made indirectly. However, the indirect estimate presented here may be seen as a social sustainability indicator for sugarcane. The indicator adopted was the variation of farming jobs (number of sugarcane cutters) between 1996 and 2035, calculated based on the possible level of mechanisation and average productivity of workers.
Results
Biodiversity. The pressure indicator on biodiversity in scenario A2-BR shows that most of the 558 micro-regions could be placed in the low pressure category (462), followed by 71 micro-regions under high pressure and only 25 micro-regions under medium pressure. The state with the highest percentage
NORTH
NORTH EAST
SOUTH EAST
MID-WEST
SOUTH
1
1
2
3
4
5
Critical
Worrying
Comfortable
2
3
4
5
0% 100%
1%1%
1%
2%
98%
70% 29%
90% 8%
80% 10% 10%
100%
Critical
Worrying
PRESSURE OF ETHANOL ON SUB-BASINS
Water supply indicator per micro-regions and sub-basins
Summary of indicators of pressure on water resources
64
www.economiadoclima.org.br
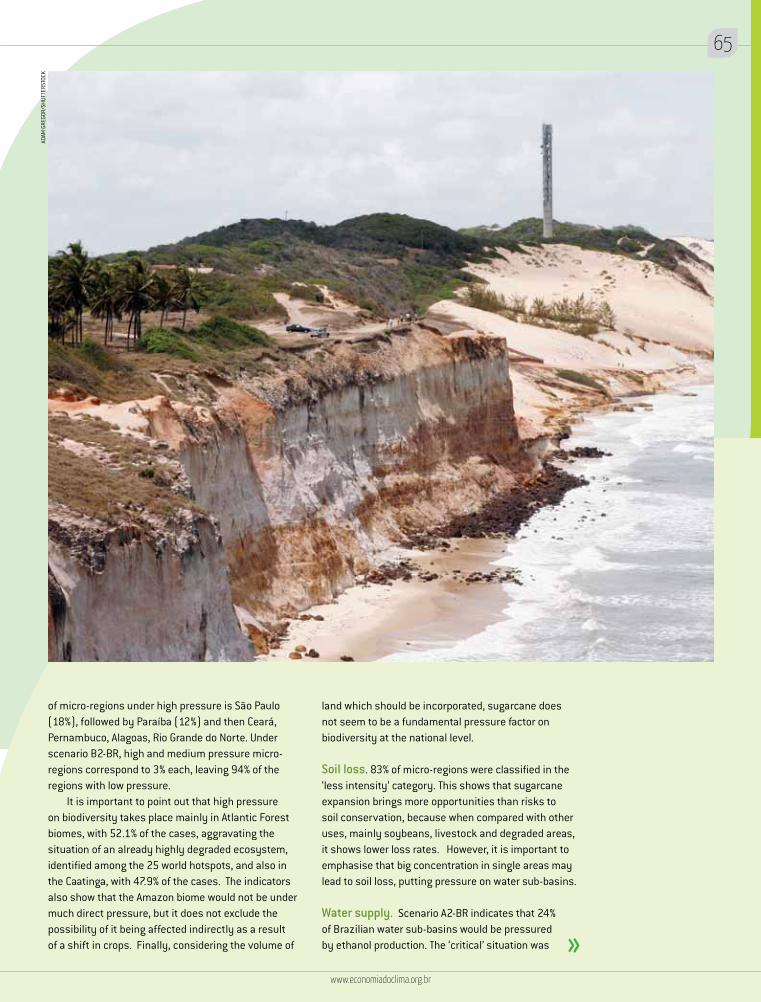
of micro-regions under high pressure is São Paulo (18%), followed by Paraíba (12%) and then Ceará, Pernambuco, Alagoas, Rio Grande do Norte. Under scenario B2-BR, high and medium pressure micro-regions correspond to 3% each, leaving 94% of the regions with low pressure.
It is important to point out that high pressure on biodiversity takes place mainly in Atlantic Forest biomes, with 52.1% of the cases, aggravating the situation of an already highly degraded ecosystem, identified among the 25 world hotspots, and also in the Caatinga, with 47.9% of the cases. The indicators also show that the Amazon biome would not be under much direct pressure, but it does not exclude the possibility of it being affected indirectly as a result of a shift in crops. Finally, considering the volume of
land which should be incorporated, sugarcane does not seem to be a fundamental pressure factor on biodiversity at the national level.
Soil loss. 83% of micro-regions were classified in the ‘less intensity’ category. This shows that sugarcane expansion brings more opportunities than risks to soil conservation, because when compared with other uses, mainly soybeans, livestock and degraded areas, it shows lower loss rates. However, it is important to emphasise that big concentration in single areas may lead to soil loss, putting pressure on water sub-basins.
Water supply. Scenario A2-BR indicates that 24% of Brazilian water sub-basins would be pressured by ethanol production. The ‘critical’ situation was
ADAM
GRE
GOR/
SHUT
TERS
TOCK
www.economiadoclima.org.br
65
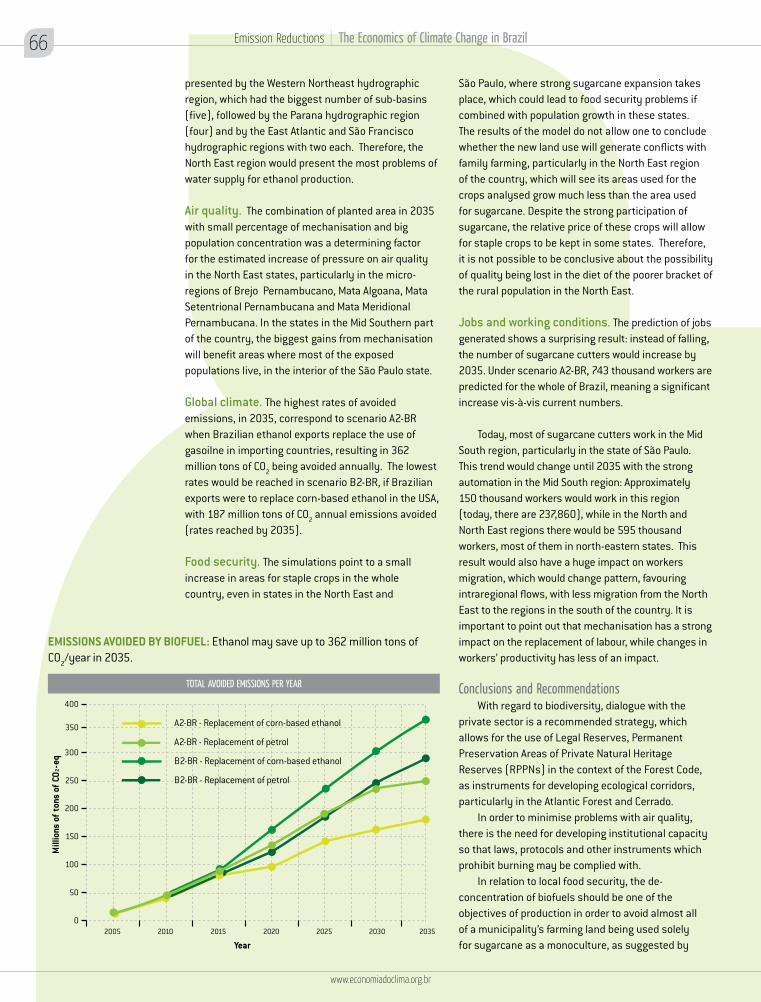
Emission Reductions | The Economics of Climate Change in Brazil
presented by the Western Northeast hydrographic region, which had the biggest number of sub-basins (five), followed by the Parana hydrographic region (four) and by the East Atlantic and São Francisco hydrographic regions with two each. Therefore, the North East region would present the most problems of water supply for ethanol production.
Air quality. The combination of planted area in 2035 with small percentage of mechanisation and big population concentration was a determining factor for the estimated increase of pressure on air quality in the North East states, particularly in the micro-regions of Brejo Pernambucano, Mata Algoana, Mata Setentrional Pernambucana and Mata Meridional Pernambucana. In the states in the Mid Southern part of the country, the biggest gains from mechanisation will benefit areas where most of the exposed populations live, in the interior of the São Paulo state.
Global climate. The highest rates of avoided emissions, in 2035, correspond to scenario A2-BR when Brazilian ethanol exports replace the use of gasoilne in importing countries, resulting in 362 million tons of CO2 being avoided annually. The lowest rates would be reached in scenario B2-BR, if Brazilian exports were to replace corn-based ethanol in the USA, with 187 million tons of CO2 annual emissions avoided (rates reached by 2035).
Food security. The simulations point to a small increase in areas for staple crops in the whole country, even in states in the North East and
São Paulo, where strong sugarcane expansion takes place, which could lead to food security problems if combined with population growth in these states. The results of the model do not allow one to conclude whether the new land use will generate conflicts with family farming, particularly in the North East region of the country, which will see its areas used for the crops analysed grow much less than the area used for sugarcane. Despite the strong participation of sugarcane, the relative price of these crops will allow for staple crops to be kept in some states. Therefore, it is not possible to be conclusive about the possibility of quality being lost in the diet of the poorer bracket of the rural population in the North East.
Jobs and working conditions. The prediction of jobs generated shows a surprising result: instead of falling, the number of sugarcane cutters would increase by 2035. Under scenario A2-BR, 743 thousand workers are predicted for the whole of Brazil, meaning a significant increase vis-à-vis current numbers.
Today, most of sugarcane cutters work in the Mid South region, particularly in the state of São Paulo. This trend would change until 2035 with the strong automation in the Mid South region: Approximately 150 thousand workers would work in this region (today, there are 237,860), while in the North and North East regions there would be 595 thousand workers, most of them in north-eastern states. This result would also have a huge impact on workers migration, which would change pattern, favouring intraregional flows, with less migration from the North East to the regions in the south of the country. It is important to point out that mechanisation has a strong impact on the replacement of labour, while changes in workers’ productivity has less of an impact.
Conclusions and RecommendationsWith regard to biodiversity, dialogue with the
private sector is a recommended strategy, which allows for the use of Legal Reserves, Permanent Preservation Areas of Private Natural Heritage Reserves (RPPNs) in the context of the Forest Code, as instruments for developing ecological corridors, particularly in the Atlantic Forest and Cerrado.
In order to minimise problems with air quality, there is the need for developing institutional capacity so that laws, protocols and other instruments which prohibit burning may be complied with.
In relation to local food security, the de-concentration of biofuels should be one of the objectives of production in order to avoid almost all of a municipality’s farming land being used solely for sugarcane as a monoculture, as suggested by
200
150
100
50
0
300
250
350
400
2005 2010 2015 2020 2025 2030 2035
Mill
ions
of t
ons
of C
O2-e
q
Year
EMISSIONS AVOIDED BY BIOFUEL: Ethanol may save up to 362 million tons of CO2/year in 2035.
TOTAL AVOIDED EMISSIONS PER YEAR
A2-BR - Replacement of petrol
A2-BR - Replacement of corn-based ethanol
B2-BR - Replacement of corn-based ethanol
B2-BR - Replacement of petrol
66
www.economiadoclima.org.br
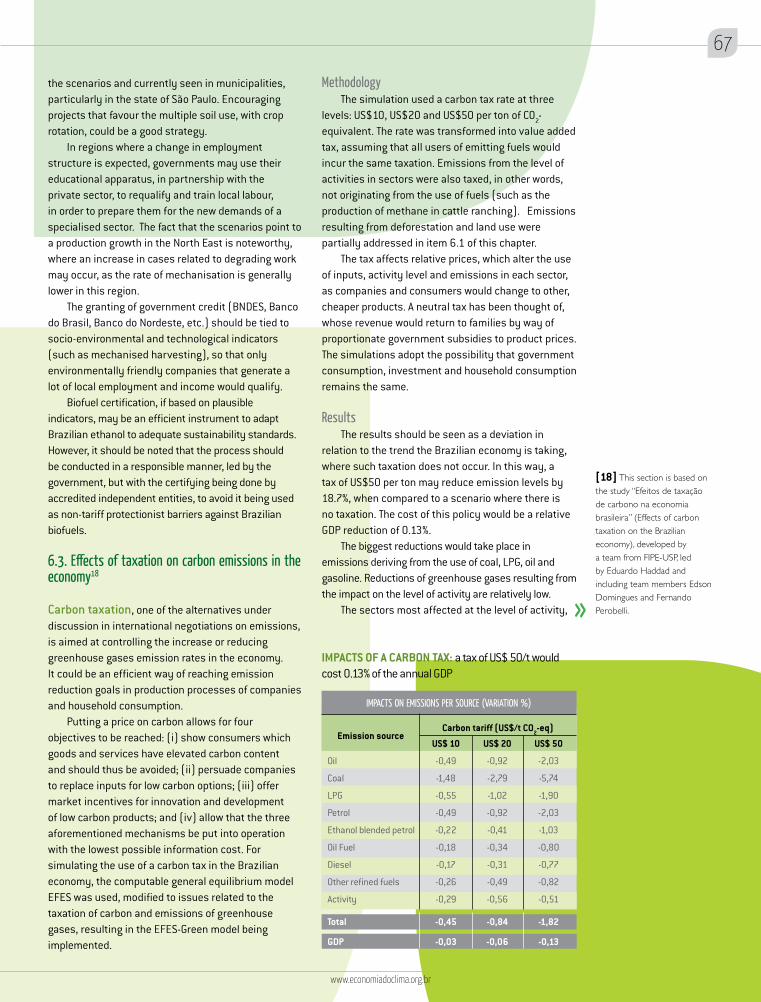
IMPACTS ON EMISSIONS PER SOURCE (VARIATION %)
Carbon tariff (US$/t CO2-eq)US$ 10
-0,49
-1,48
-0,55
-0,49
-0,22
-0,18
-0,17
-0,26
-0,29
-0,45
-0,03
US$ 20
-0,92
-2,79
-1,02
-0,92
-0,41
-0,34
-0,31
-0,49
-0,56
-0,84
-0,06
US$ 50
-2,03
-5,74
-1,90
-2,03
-1,03
-0,80
-0,77
-0,82
-0,51
-1,82
-0,13
IMPACTS OF A CARBON TAX: a tax of US$ 50/t would cost 0.13% of the annual GDP
the scenarios and currently seen in municipalities, particularly in the state of São Paulo. Encouraging projects that favour the multiple soil use, with crop rotation, could be a good strategy.
In regions where a change in employment structure is expected, governments may use their educational apparatus, in partnership with the private sector, to requalify and train local labour, in order to prepare them for the new demands of a specialised sector. The fact that the scenarios point to a production growth in the North East is noteworthy, where an increase in cases related to degrading work may occur, as the rate of mechanisation is generally lower in this region.
The granting of government credit (BNDES, Banco do Brasil, Banco do Nordeste, etc.) should be tied to socio-environmental and technological indicators (such as mechanised harvesting), so that only environmentally friendly companies that generate a lot of local employment and income would qualify.
Biofuel certification, if based on plausible indicators, may be an efficient instrument to adapt Brazilian ethanol to adequate sustainability standards. However, it should be noted that the process should be conducted in a responsible manner, led by the government, but with the certifying being done by accredited independent entities, to avoid it being used as non-tariff protectionist barriers against Brazilian biofuels. 6.3. E!ects of taxation on carbon emissions in the economy18
Carbon taxation, one of the alternatives under discussion in international negotiations on emissions, is aimed at controlling the increase or reducing greenhouse gases emission rates in the economy. It could be an efficient way of reaching emission reduction goals in production processes of companies and household consumption.
Putting a price on carbon allows for four objectives to be reached: (i) show consumers which goods and services have elevated carbon content and should thus be avoided; (ii) persuade companies to replace inputs for low carbon options; (iii) offer market incentives for innovation and development of low carbon products; and (iv) allow that the three aforementioned mechanisms be put into operation with the lowest possible information cost. For simulating the use of a carbon tax in the Brazilian economy, the computable general equilibrium model EFES was used, modified to issues related to the taxation of carbon and emissions of greenhouse gases, resulting in the EFES-Green model being implemented.
MethodologyThe simulation used a carbon tax rate at three
levels: US$10, US$20 and US$50 per ton of CO2-equivalent. The rate was transformed into value added tax, assuming that all users of emitting fuels would incur the same taxation. Emissions from the level of activities in sectors were also taxed, in other words, not originating from the use of fuels (such as the production of methane in cattle ranching). Emissions resulting from deforestation and land use were partially addressed in item 6.1 of this chapter.
The tax affects relative prices, which alter the use of inputs, activity level and emissions in each sector, as companies and consumers would change to other, cheaper products. A neutral tax has been thought of, whose revenue would return to families by way of proportionate government subsidies to product prices. The simulations adopt the possibility that government consumption, investment and household consumption remains the same.
ResultsThe results should be seen as a deviation in
relation to the trend the Brazilian economy is taking, where such taxation does not occur. In this way, a tax of US$50 per ton may reduce emission levels by 18.7%, when compared to a scenario where there is no taxation. The cost of this policy would be a relative GDP reduction of 0.13%.
The biggest reductions would take place in emissions deriving from the use of coal, LPG, oil and gasoline. Reductions of greenhouse gases resulting from the impact on the level of activity are relatively low.
The sectors most affected at the level of activity,
[18] This section is based on the study “Efeitos de taxação de carbono na economia brasileira” (Effects of carbon taxation on the Brazilian economy), developed by a team from FIPE-USP, led by Eduardo Haddad and including team members Edson Domingues and Fernando Perobelli.
Oil
Coal
LPG
Petrol
Ethanol blended petrol
Oil Fuel
Diesel
Other refined fuels
Activity
Total
GDP
Emission source
www.economiadoclima.org.br
67
Emission Reductions | The Economics of Climate Change in Brazil
by taxing US$50/ton were steel, transport equipment, mineral extraction, chemical products and refining. Sectoral ranks are not altered much in the case of tariffs between US$10 and US$20. Livestock, agriculture, food and services were relatively benefitted, be it for not using fuels intensively, or as a result of the positive impact subsidies had on household consumption.
It is important to point out that the simulations assumed that sectors did not alter their production technology when incurring carbon taxation. Investments made in less polluting technology by companies could avoid the payment of the tax and increase the reduction of emissions. Therefore, the results may be seen as a lower limit to reduction, and their cost (in terms of GDP reduction), as an upper limit.
Conclusions and recommendations The results reached point to a potential reduction in
emission in the Brazilian economy as a consequence of carbon taxation, as well as to the importance of taxing sources of greenhouse gases not connected to the use of fuels, such as livestock and agriculture. In a country
like Brazil, with a relatively ‘clean’ energy matrix, emission sources are even more important.
A way of increasing the impact of carbon taxation would be to create an emissions certification market, as the combination of these two instruments may lead to a more efficient reduction at a lower cost.
Although taxation allows for the reduction of greenhouse gas emissions, as well as being a relatively simple policy to implement, it is not possible to guarantee that emission levels will stabilise at a level considered reasonable over the next few years. Accelerated growth trends of the Brazilian economy over the next few decades, even with the impacts of the world economic crisis in 2008, requires emission levels to be followed with attention and mitigation policies adjusted throughout the period this is recorded.
It is important to point out again that emissions from deforestation were not considered here. Adequate modelling of its relation with economic activity requires more detailed studies. Regional impacts of mitigation policies should be a relevant issue in the design of policies and a relevant focus in future economic research.
[19] This section is based on the 2009 World Bank study “Cenário de baixa emissão de carbono no Brasil” (Low carbon emissions scenario
in Brazil), conducted in partnership with the Brazilian
government, having among those involved the same
technical team in charge of the chapters related to energy in the present study, from the Energy Planning Programme
COPPE/UFRJ (in charge of energy report of the study).
The coordinators of the study are Roberto Schaeffer
and Alexandre Szklo, with researchers Bruno S.M.C. Borba and David Castelo Branco. The coordinator
of the World Bank study is Christophe de Gouvello.
LOSE
VSKY
PAV
EL/S
HUTT
ERST
OCK
68
www.economiadoclima.org.br
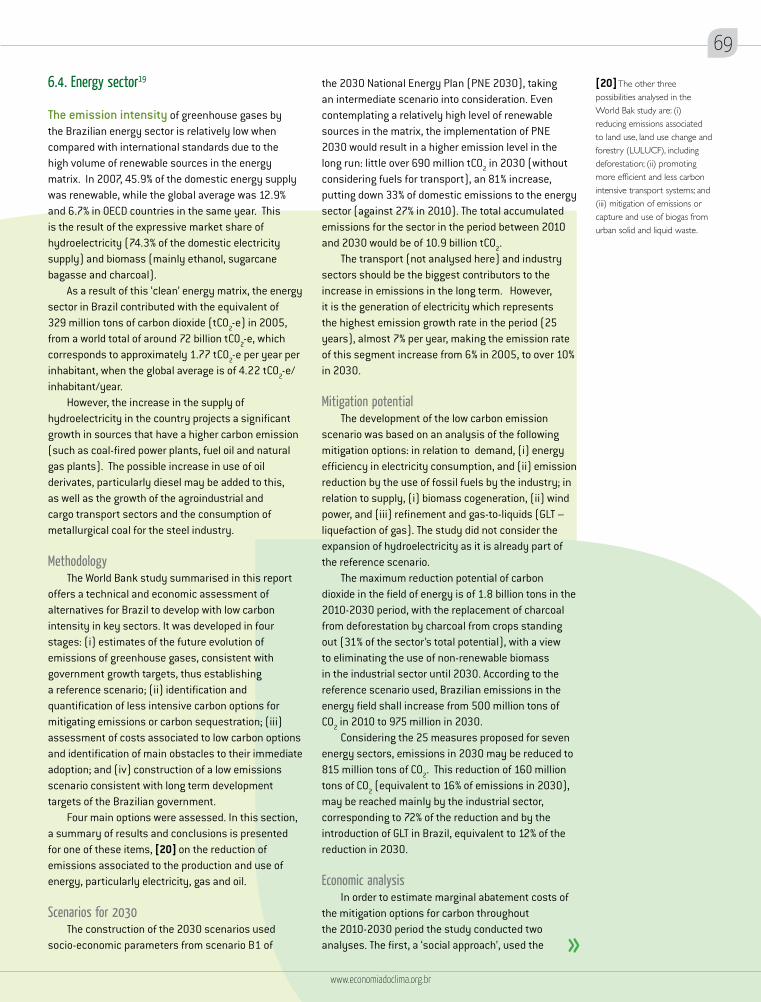
6.4. Energy sector19
The emission intensity of greenhouse gases by the Brazilian energy sector is relatively low when compared with international standards due to the high volume of renewable sources in the energy matrix. In 2007, 45.9% of the domestic energy supply was renewable, while the global average was 12.9% and 6.7% in OECD countries in the same year. This is the result of the expressive market share of hydroelectricity (74.3% of the domestic electricity supply) and biomass (mainly ethanol, sugarcane bagasse and charcoal).
As a result of this ‘clean’ energy matrix, the energy sector in Brazil contributed with the equivalent of 329 million tons of carbon dioxide (tCO2-e) in 2005, from a world total of around 72 billion tCO2-e, which corresponds to approximately 1.77 tCO2-e per year per inhabitant, when the global average is of 4.22 tCO2-e/inhabitant/year.
However, the increase in the supply of hydroelectricity in the country projects a significant growth in sources that have a higher carbon emission (such as coal-fired power plants, fuel oil and natural gas plants). The possible increase in use of oil derivates, particularly diesel may be added to this, as well as the growth of the agroindustrial and cargo transport sectors and the consumption of metallurgical coal for the steel industry.
MethodologyThe World Bank study summarised in this report
offers a technical and economic assessment of alternatives for Brazil to develop with low carbon intensity in key sectors. It was developed in four stages: (i) estimates of the future evolution of emissions of greenhouse gases, consistent with government growth targets, thus establishing a reference scenario; (ii) identification and quantification of less intensive carbon options for mitigating emissions or carbon sequestration; (iii) assessment of costs associated to low carbon options and identification of main obstacles to their immediate adoption; and (iv) construction of a low emissions scenario consistent with long term development targets of the Brazilian government.
Four main options were assessed. In this section, a summary of results and conclusions is presented for one of these items, [20] on the reduction of emissions associated to the production and use of energy, particularly electricity, gas and oil.
Scenarios for 2030
The construction of the 2030 scenarios used socio-economic parameters from scenario B1 of
the 2030 National Energy Plan (PNE 2030), taking an intermediate scenario into consideration. Even contemplating a relatively high level of renewable sources in the matrix, the implementation of PNE 2030 would result in a higher emission level in the long run: little over 690 million tCO2 in 2030 (without considering fuels for transport), an 81% increase, putting down 33% of domestic emissions to the energy sector (against 27% in 2010). The total accumulated emissions for the sector in the period between 2010 and 2030 would be of 10.9 billion tCO2.
The transport (not analysed here) and industry sectors should be the biggest contributors to the increase in emissions in the long term. However, it is the generation of electricity which represents the highest emission growth rate in the period (25 years), almost 7% per year, making the emission rate of this segment increase from 6% in 2005, to over 10% in 2030.
Mitigation potentialThe development of the low carbon emission
scenario was based on an analysis of the following mitigation options: in relation to demand, (i) energy efficiency in electricity consumption, and (ii) emission reduction by the use of fossil fuels by the industry; in relation to supply, (i) biomass cogeneration, (ii) wind power, and (iii) refinement and gas-to-liquids (GLT – liquefaction of gas). The study did not consider the expansion of hydroelectricity as it is already part of the reference scenario.
The maximum reduction potential of carbon dioxide in the field of energy is of 1.8 billion tons in the 2010-2030 period, with the replacement of charcoal from deforestation by charcoal from crops standing out (31% of the sector’s total potential), with a view to eliminating the use of non-renewable biomass in the industrial sector until 2030. According to the reference scenario used, Brazilian emissions in the energy field shall increase from 500 million tons of CO2 in 2010 to 975 million in 2030.
Considering the 25 measures proposed for seven energy sectors, emissions in 2030 may be reduced to 815 million tons of CO2. This reduction of 160 million tons of CO2 (equivalent to 16% of emissions in 2030), may be reached mainly by the industrial sector, corresponding to 72% of the reduction and by the introduction of GLT in Brazil, equivalent to 12% of the reduction in 2030.
Economic analysisIn order to estimate marginal abatement costs of
the mitigation options for carbon throughout the 2010-2030 period the study conducted two analyses. The first, a ‘social approach’, used the
[20] The other three possibilities analysed in the World Bak study are: (i) reducing emissions associated to land use, land use change and forestry (LULUCF), including deforestation; (ii) promoting more ef!cient and less carbon intensive transport systems; and (iii) mitigation of emissions or capture and use of biogas from urban solid and liquid waste.
www.economiadoclima.org.br
69
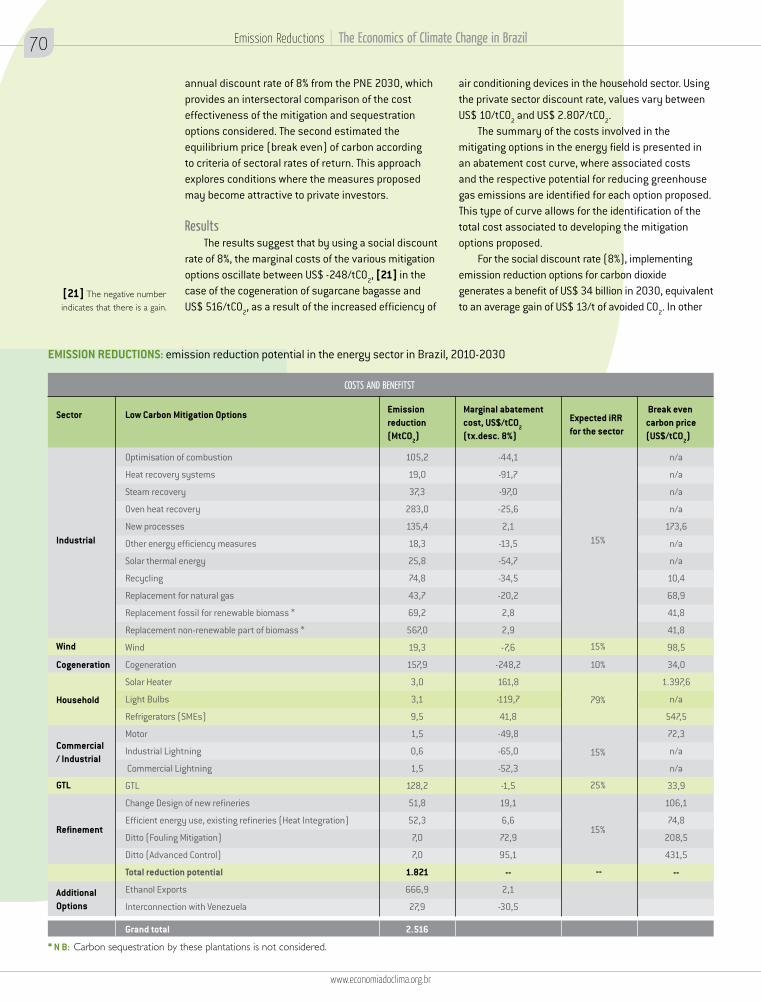
Emission Reductions | The Economics of Climate Change in Brazil
annual discount rate of 8% from the PNE 2030, which provides an intersectoral comparison of the cost effectiveness of the mitigation and sequestration options considered. The second estimated the equilibrium price (break even) of carbon according to criteria of sectoral rates of return. This approach explores conditions where the measures proposed may become attractive to private investors.
Results
The results suggest that by using a social discount rate of 8%, the marginal costs of the various mitigation options oscillate between US$ -248/tCO2, [21] in the case of the cogeneration of sugarcane bagasse and US$ 516/tCO2, as a result of the increased efficiency of
air conditioning devices in the household sector. Using the private sector discount rate, values vary between US$ 10/tCO2 and US$ 2.807/tCO2.
The summary of the costs involved in the mitigating options in the energy field is presented in an abatement cost curve, where associated costs and the respective potential for reducing greenhouse gas emissions are identified for each option proposed. This type of curve allows for the identification of the total cost associated to developing the mitigation options proposed.
For the social discount rate (8%), implementing emission reduction options for carbon dioxide generates a benefit of US$ 34 billion in 2030, equivalent to an average gain of US$ 13/t of avoided CO2. In other
EMISSION REDUCTIONS: emission reduction potential in the energy sector in Brazil, 2010-2030
Low Carbon Mitigation OptionsSector Emission reduction (MtCO2)
Marginal abatement cost, US$/tCO2
(tx.desc. 8%)
Break even carbon price (US$/tCO2)
Expected iRR for the sector
Industrial
Wind
GTL
Refinement
Additional Options
Cogeneration
Household
Commercial / Industrial
Optimisation of combustion
Heat recovery systems
Steam recovery
Oven heat recovery
New processes
Other energy efficiency measures
Solar thermal energy
Recycling
Replacement for natural gas
Replacement fossil for renewable biomass *
Replacement non-renewable part of biomass *
Wind
Cogeneration
Solar Heater
Light Bulbs
Refrigerators (SMEs)
Motor
Industrial Lightning
Commercial Lightning
GTL
Change Design of new refineries
Efficient energy use, existing refineries (Heat Integration)
Ditto (Fouling Mitigation)
Ditto (Advanced Control)
Total reduction potential
Ethanol Exports
Interconnection with Venezuela
Grand total
-44,1
-91,7
-97,0
-25,6
2,1
-13,5
-54,7
-34,5
-20,2
2,8
2,9
-7,6
-248,2
161,8
-119,7
41,8
-49,8
-65,0
-52,3
-1,5
19,1
6,6
72,9
95,1
--
2,1
-30,5
105,2
19,0
37,3
283,0
135,4
18,3
25,8
74,8
43,7
69,2
567,0
19,3
157,9
3,0
3,1
9,5
1,5
0,6
1,5
128,2
51,8
52,3
7,0
7,0
1.821
666,9
27,9
2.516
n/a
n/a
n/a
n/a
173,6
n/a
n/a
10,4
68,9
41,8
41,8
98,5
34,0
1.397,6
n/a
547,5
72,3
n/a
n/a
33,9
106,1
74,8
208,5
431,5
--
15%
15%
25%
15%
10%
79%
15%
--
COSTS AND BENEFITST
* N B: Carbon sequestration by these plantations is not considered.
[21] The negative number indicates that there is a gain.
70
www.economiadoclima.org.br
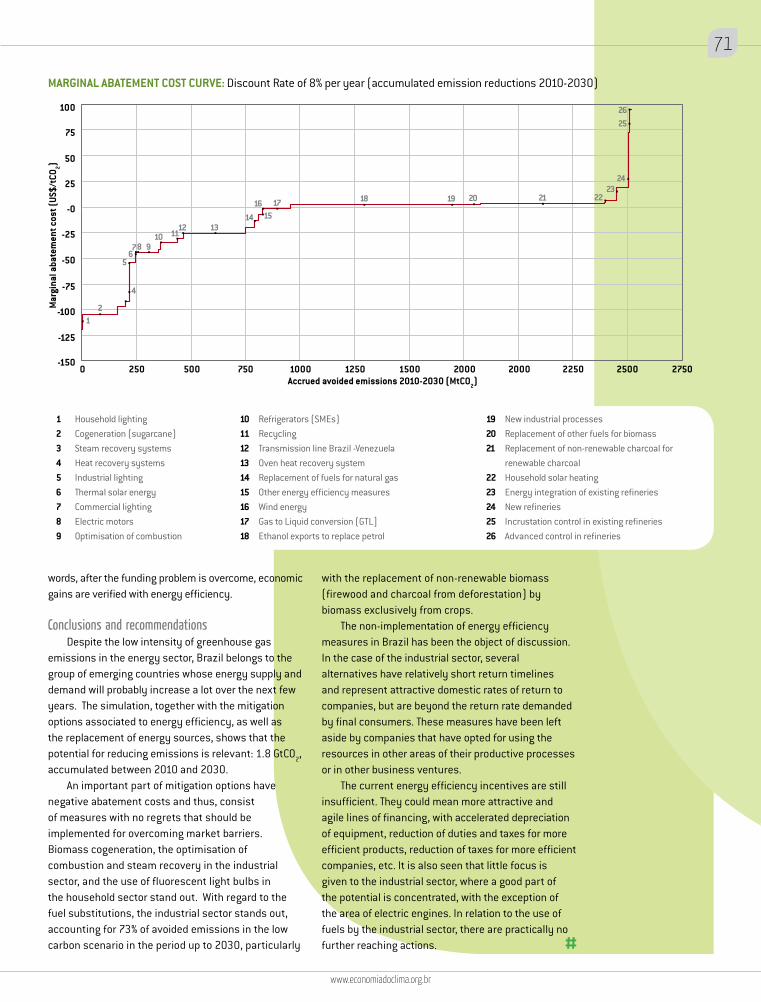
words, after the funding problem is overcome, economic gains are verified with energy efficiency.
Conclusions and recommendations
Despite the low intensity of greenhouse gas emissions in the energy sector, Brazil belongs to the group of emerging countries whose energy supply and demand will probably increase a lot over the next few years. The simulation, together with the mitigation options associated to energy efficiency, as well as the replacement of energy sources, shows that the potential for reducing emissions is relevant: 1.8 GtCO2, accumulated between 2010 and 2030.
An important part of mitigation options have negative abatement costs and thus, consist of measures with no regrets that should be implemented for overcoming market barriers. Biomass cogeneration, the optimisation of combustion and steam recovery in the industrial sector, and the use of fluorescent light bulbs in the household sector stand out. With regard to the fuel substitutions, the industrial sector stands out, accounting for 73% of avoided emissions in the low carbon scenario in the period up to 2030, particularly
with the replacement of non-renewable biomass (firewood and charcoal from deforestation) by biomass exclusively from crops.
The non-implementation of energy efficiency measures in Brazil has been the object of discussion. In the case of the industrial sector, several alternatives have relatively short return timelines and represent attractive domestic rates of return to companies, but are beyond the return rate demanded by final consumers. These measures have been left aside by companies that have opted for using the resources in other areas of their productive processes or in other business ventures.
The current energy efficiency incentives are still insufficient. They could mean more attractive and agile lines of financing, with accelerated depreciation of equipment, reduction of duties and taxes for more efficient products, reduction of taxes for more efficient companies, etc. It is also seen that little focus is given to the industrial sector, where a good part of the potential is concentrated, with the exception of the area of electric engines. In relation to the use of fuels by the industrial sector, there are practically no further reaching actions.
MARGINAL ABATEMENT COST CURVE: Discount Rate of 8% per year (accumulated emission reductions 2010-2030)
275025002250200020001500125010007505002500-150
-125
-100
-75
-50
-25
-0
25
50
75
100
12
4
567 9
10 1113
14 1516 17 18 19 20 21 22
2324
2526
12
8
Household lightingCogeneration (sugarcane)Steam recovery systemsHeat recovery systemsIndustrial lightingThermal solar energyCommercial lightingElectric motorsOptimisation of combustion
123456789
Refrigerators (SMEs)RecyclingTransmission line Brazil -VenezuelaOven heat recovery systemReplacement of fuels for natural gasOther energy efficiency measuresWind energyGas to Liquid conversion (GTL]Ethanol exports to replace petrol
101112131415161718
New industrial processesReplacement of other fuels for biomassReplacement of non-renewable charcoal for renewable charcoal Household solar heatingEnergy integration of existing refineriesNew refineriesIncrustation control in existing refineriesAdvanced control in refineries
192021
2223242526
Mar
gina
l aba
tem
ent c
ost (
US$/
tCO 2)
Accrued avoided emissions 2010-2030 (MtCO2)
www.economiadoclima.org.br
71

JOHN
NY LY
E/SH
UTTE
RSTO
CK
CHAPTER 7
Conclusions and Recommendations
changes, produces an increased national income in relation to A2-BR, which is more carbon intense. Even if climate impacts are taken away, in 2050, the GDP in scenario B2-BR would be R$ 405 million greater than under A2-BR. In other words, national income would increase more and stay at the same level, even after absorbing climate related impacts.
From the point of view of the well-being of the Brazilian population, even stronger climate change impacts are predicted, with real consumption in 2050 projected at less than the 3.4% of the baseline under B2-BR, equivalent to an annual reduction of US$ 200 billion in Brazilian household consumption (2008 figures). In per capita terms, there would be a loss for the average Brazilian citizen of US$ 874 (under the same scenario B2-BR). It is important to point out that global climate change tends to slightly increase poverty in Brazil, with higher results reached in scenario B2-BR.
Sector perspective
Water resources. Despite climate models not agreeing on future rainfall, surface water supply for almost all Brazilian regions showed a reduction in relation to climate data provided by INPE and also by the average of 15 global climate models. The projected results are alarming for some basins, particularly in the North East region, with a sharp reduction in runoff by 2100 for both scenarios, with resulting values close to zero.
Energy. The most relevant impact for the sector is the loss of reliability in the generation of electricity from water sources. The impacts are particularly acute in the North and North East regions. In the South and South East regions, which concentrate the bulk of the power generating capacity, impacts are minimum or even positive, but not sufficient to compensate losses in the North and North East, threatening the reliability of the hydro power system and forcing the expansion of the installed capacity, which could be idle for a long period of time.
Agriculture. With the exception of sugarcane and cassava, which should experience positive impacts, all other crops will see low risk production areas reduced.
7.1. Main lessons and results
This study of economic impacts from climate change in Brazil, despite the limitations discussed, shows that the problem is of great importance for the country’s development agenda. Potential costs and risks are high and a burden to the poorer and more vulnerable brackets of the population above all, particularly in the North and North East region. In addition to this high social relevance, fighting climate change is both an opportunity and a requirement for public policies to be integrated.
The projections of climate change impacts on the Brazilian economy over the next 40 years suggest the possibility of associating ambitious growth targets with the reduction of greenhouse gases emissions. From a strictly economic perspective, it is about increasing the country’s competiveness and ensuring wide access to markets that tend to favour low carbon emission goods and services.
Therefore, it is essential to ensure that the energy matrix continues to be ‘clean’ and that GDP growth also takes place in a ‘clean’ manner. Based on the current conditions of the Brazilian economy, none of these factors would mean any restrictions for Brazil. Ambitious growth targets and growing in a ‘clean’ fashion are one of the main challenges for building the future.
Macro-economic perspectivesThe analysis showed that the Brazilian GDP would
be between 0.5% (scenario A2-BR) and 2.3% (scenario B2-BR) lower than if there was no climate change. If the costs of this change until 2050 in Brazil were anticipated to today, at an intertemporal discount rate of 1.0% per year, the value would be between R$ 719 billion (A2-BR) and R$ 3.655 trillion (B2-BR), which would represent 25% to 125% of the 2008 Brazilian GDP, a substantial loss: from now until 2050, Brazilians may lose more than a year’s worth of GDP as result of climate change. It is important to emphasise that despite losses from climate change being smaller in scenario A2-BR than under B2-BR, on average, all Brazilians will be consuming more in the second than in the first case, with or without climate change. Scenario B2-BR, where the world economy is more adequate to face climate
Conclusions and Recommendations
74
www.economiadoclima.org.br
Conclusions and Recommendations | The Economics of Climate Change in Brazil
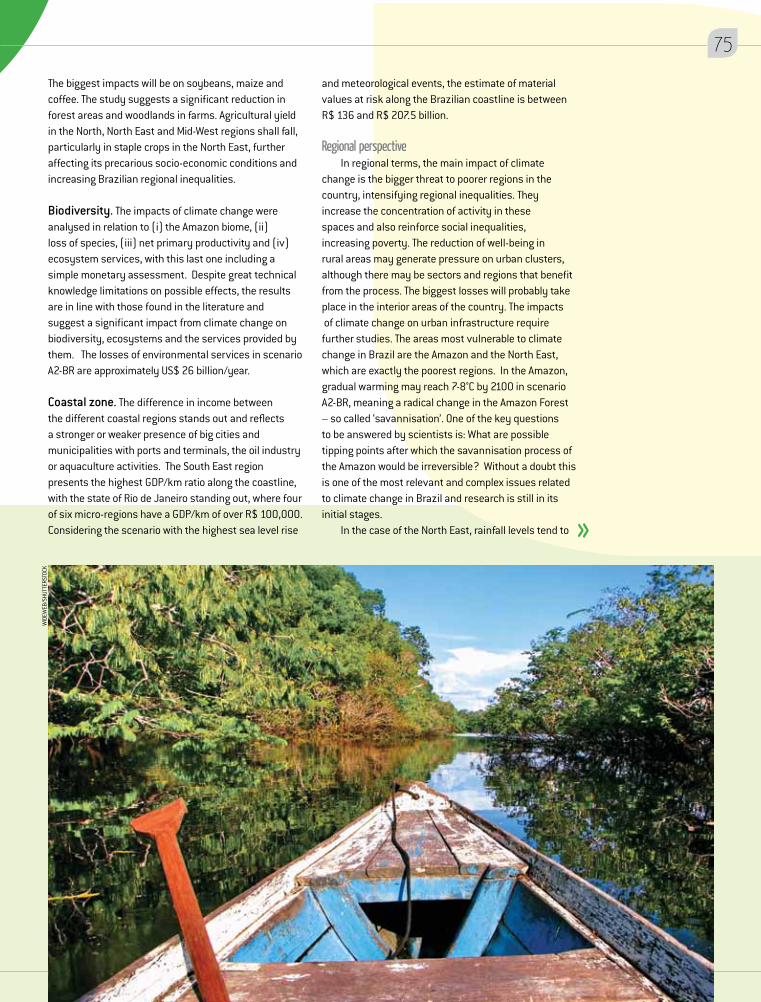
The biggest impacts will be on soybeans, maize and coffee. The study suggests a significant reduction in forest areas and woodlands in farms. Agricultural yield in the North, North East and Mid-West regions shall fall, particularly in staple crops in the North East, further affecting its precarious socio-economic conditions and increasing Brazilian regional inequalities.
Biodiversity. The impacts of climate change were analysed in relation to (i) the Amazon biome, (ii) loss of species, (iii) net primary productivity and (iv) ecosystem services, with this last one including a simple monetary assessment. Despite great technical knowledge limitations on possible effects, the results are in line with those found in the literature and suggest a significant impact from climate change on biodiversity, ecosystems and the services provided by them. The losses of environmental services in scenario A2-BR are approximately US$ 26 billion/year.
Coastal zone. The difference in income between the different coastal regions stands out and reflects a stronger or weaker presence of big cities and municipalities with ports and terminals, the oil industry or aquaculture activities. The South East region presents the highest GDP/km ratio along the coastline, with the state of Rio de Janeiro standing out, where four of six micro-regions have a GDP/km of over R$ 100,000. Considering the scenario with the highest sea level rise
and meteorological events, the estimate of material values at risk along the Brazilian coastline is between R$ 136 and R$ 207.5 billion.
Regional perspectiveIn regional terms, the main impact of climate
change is the bigger threat to poorer regions in the country, intensifying regional inequalities. They increase the concentration of activity in these spaces and also reinforce social inequalities, increasing poverty. The reduction of well-being in rural areas may generate pressure on urban clusters, although there may be sectors and regions that benefit from the process. The biggest losses will probably take place in the interior areas of the country. The impacts of climate change on urban infrastructure require further studies. The areas most vulnerable to climate change in Brazil are the Amazon and the North East, which are exactly the poorest regions. In the Amazon, gradual warming may reach 7-8°C by 2100 in scenario A2-BR, meaning a radical change in the Amazon Forest – so called ‘savannisation’. One of the key questions to be answered by scientists is: What are possible tipping points after which the savannisation process of the Amazon would be irreversible? Without a doubt this is one of the most relevant and complex issues related to climate change in Brazil and research is still in its initial stages.
In the case of the North East, rainfall levels tend to
WID
EWEB
/SHU
TTER
STOC
K
www.economiadoclima.org.br
75
decrease during the 21st Century, at a rate of 2-2.5 mm/day. This will lead to agricultural losses in all states of the region and its concomitant change to livestock. With the advance of livestock, the future situation of the north-eastern rural zone tends to deteriorate even more, as the dominant livestock practices show low yield levels. In this sense, it is necessary to better investigate the caatinga biome, in terms of expected impacts and its future support capacity. The region is subject to a series of health hazards, probably never seen before in history, further aggravated by the North East’s socioeconomic conditions, a worrying picture.
With regard to the states, with the exception of the ones in colder regions, which will begin to experience higher temperatures, more appropriate for agriculture, the rest will see significant losses. The consequences of climate impacts reflect its regional distribution mainly on agriculture. This distribution suggests that scenario A2-BR may have a lower impact nationally, as agriculture and livestock in the states on the South and South East – regions with stronger market share in the national total – are less affected and even relatively benefitted relative to scenario B2-BR.
Development and response capacityThe impacts of climate change are more intense in
the long run than in the short term. Their effects in 2035 will reach a Brazil with a per capita income equivalent to South Korea today. By 2050, it will be a bit below Japan today. This suggests that the best ‘remedy’ for the problem would be to simply grow and develop, because with these income levels it would be possible to protect against the effect of climate change and at the same time reduce greenhouse gas emissions through technologies yet to be developed. In addition, the poorest would be less poor and thus, less vulnerable to the impact of climate change.
However, such thesis, which can not be immediately discarded, does not take into consideration the uncertainties related to climate change and the risks of irreversible effects reaching catastrophic dimensions, threatening the survival of the planet itself, as well as humanity. Growth and development are indeed appropriate responses; the Netherlands for example, country extremely vulnerable to sea level rise, does not worry as much as Bangladesh in relation to the same problem, because its defence capabilities are much superior. However, response capacity and reliability have clear limits, regardless of national income levels. The devastation caused by Hurricane Katrina is a sad point in the history of the wealthiest country in the world, in theory with the best technology available and appropriate adaptation and defence infrastructure for facing natural disasters, which tend to become more intense with climate change.
AdaptationAdaptation alternatives to climate change in
three sectors were analysed. In agriculture, second generation genetic breeding and engineering are highly viable alternatives for mitigating predicted climate change impacts, with an approximate mean of benefits over costs reaching 15, in other words, the costs incurred from the adaptation measures in this case, may be reduced to 1/15 of the loss in value because of climate change if nothing is done. Irrigation showed to be advantageous in the case of maize, but less so in other crops. Such measures demand significant transfer of resources, particularly in scenario A2-BR, for all crops.
In the energy sector, in order to face climate change, an extra generating capacity between 153 and 162 TWh would have to be installed. This additional capacity would be made up mainly of natural gas, advanced technologies from the burning of sugarcane bagasse and wind energy. Added together, these options would mean capital costs in the amount of US$ 48 to US$ 51 billion. Operational costs will depend on how close the hydrologic scenario gets to the critical scenario. If this comes true, the annual operational and fuel cost (upper limit of the estimates) will be of US$ 6.9 to US$ 7.2 billion.
In the coastal zone, because of the study’s limited scope and the lack of other more detailed studies at the national level, it was not possible to make a cost assessment of possible construction works and physical interventions for adaptation. However, the costs of management actions and public policies at the different government levels were projected and compared with the coastal heritage value. The total cost for implementing the 14 recommended actions by 2050 is of R$ 3.72 billion, approximately R$ 93 million per year. The most important challenge to be faced in the sector is related to the cartography base.
Mitigation opportunitiesThe main options for Brazil to contribute to the
global effort of emissions reductions include: (i) deforestation control in the Amazon; (ii) production and consumption of biofuels, to further reduce its own emissions and for exports, aiding other countries in reaching this objective; (iii) charging of a carbon tax (which would certainly have to be global); and (iv) energy efficiency. This study focused on the first three options.
Deforestation. As deforestation in the Amazon currently accounts for around 60% of emissions in Brazil, it represents a huge opportunity for the country to reduce its emissions. In addition, it has the potential for generating resources for local agents – an
76
www.economiadoclima.org.br
Conclusions and Recommendations | The Economics of Climate Change in Brazil
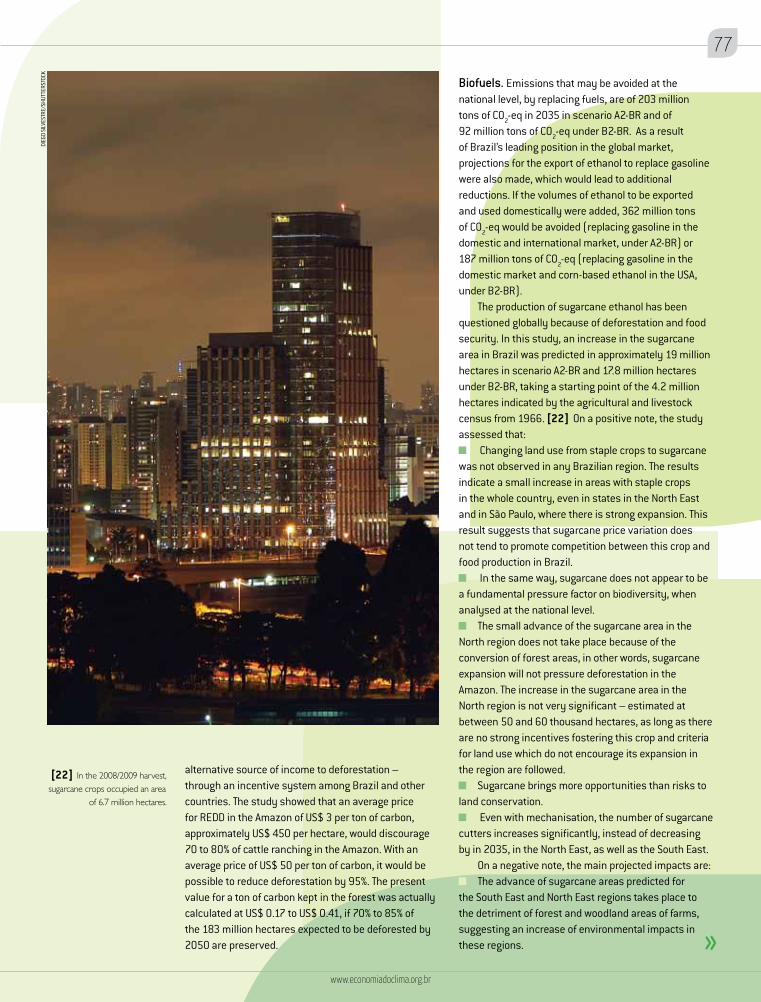
alternative source of income to deforestation – through an incentive system among Brazil and other countries. The study showed that an average price for REDD in the Amazon of US$ 3 per ton of carbon, approximately US$ 450 per hectare, would discourage 70 to 80% of cattle ranching in the Amazon. With an average price of US$ 50 per ton of carbon, it would be possible to reduce deforestation by 95%. The present value for a ton of carbon kept in the forest was actually calculated at US$ 0.17 to US$ 0.41, if 70% to 85% of the 183 million hectares expected to be deforested by 2050 are preserved.
Biofuels. Emissions that may be avoided at the national level, by replacing fuels, are of 203 million tons of CO2-eq in 2035 in scenario A2-BR and of 92 million tons of CO2-eq under B2-BR. As a result of Brazil’s leading position in the global market, projections for the export of ethanol to replace gasoline were also made, which would lead to additional reductions. If the volumes of ethanol to be exported and used domestically were added, 362 million tons of CO2-eq would be avoided (replacing gasoline in the domestic and international market, under A2-BR) or 187 million tons of CO2-eq (replacing gasoline in the domestic market and corn-based ethanol in the USA, under B2-BR).
The production of sugarcane ethanol has been questioned globally because of deforestation and food security. In this study, an increase in the sugarcane area in Brazil was predicted in approximately 19 million hectares in scenario A2-BR and 17.8 million hectares under B2-BR, taking a starting point of the 4.2 million hectares indicated by the agricultural and livestock census from 1966. [22] On a positive note, the study assessed that:
Changing land use from staple crops to sugarcane was not observed in any Brazilian region. The results indicate a small increase in areas with staple crops in the whole country, even in states in the North East and in São Paulo, where there is strong expansion. This result suggests that sugarcane price variation does not tend to promote competition between this crop and food production in Brazil.
In the same way, sugarcane does not appear to be a fundamental pressure factor on biodiversity, when analysed at the national level.
The small advance of the sugarcane area in the North region does not take place because of the conversion of forest areas, in other words, sugarcane expansion will not pressure deforestation in the Amazon. The increase in the sugarcane area in the North region is not very significant – estimated at between 50 and 60 thousand hectares, as long as there are no strong incentives fostering this crop and criteria for land use which do not encourage its expansion in the region are followed.
Sugarcane brings more opportunities than risks to land conservation.
Even with mechanisation, the number of sugarcane cutters increases significantly, instead of decreasing by in 2035, in the North East, as well as the South East.
On a negative note, the main projected impacts are: The advance of sugarcane areas predicted for the South East and North East regions takes place to the detriment of forest and woodland areas of farms, suggesting an increase of environmental impacts in these regions.
[22] In the 2008/2009 harvest, sugarcane crops occupied an area
of 6.7 million hectares.
www.economiadoclima.org.br
77DI
EGO
SILV
ESTR
E/SH
UTTE
RSTO
CK
DESH
ACAM
/SHU
TTER
STOC
K
The North East region would present the most problems related to water supply for ethanol production, both because of a lack of the resource and the intensity of sugarcane crops occupation.
In the Mid South states particularly, exposure of great population concentrations to high levels of pollution will continue as a result of the burning of sugarcane.
Carbon taxation. It is a potential measure to be adopted within an international negotiation framework on emissions. The study predicted that the impact of taxing domestic emissions would be -1.16% and -1.87%, with a GDP reduction between 0.13% and 0.08%, assuming that sectors do not change production technology after being taxed. In addition, the calculations for emissions from deforestation were not included.
Energy sector. The study used here suggests that if the reference scenario from the 2030 National Energy Plan, from the Energy Research Company is considered, the potential for reducing greenhouse gas emissions will be of 1.8 GtCO2, accumulated in the
2010-2030 period. With a discount rate of 8% per year, the total cost for implementing reduction options in the energy area would be of US$ 34 billion in 2030, equivalent to an average cost of US$ -13/t of CO2, in other words, the benefits of the options overcome their cost.
7.2 Policy recommendations
Despite the level of uncertainty about the real magnitude and rhythm of global warming, there is little doubt about the occurrence of climate change. The biggest concern is exactly about the uncertainty and the risks involved: do nothing and face giant impacts in the future, or take early action which proves unnecessary in the future, sacrificing resources which could have been used in other urgent social and economic actions. The science and the art of the decision maker are in identifying and putting into practice, supported by the best available knowledge, policy options that sacrifice the minimum of future resources and at the same time produce maximum benefits, with or without climate change.
In this sense, the main policy recommendation
78
www.economiadoclima.org.br
Conclusions and Recommendations | The Economics of Climate Change in Brazil
for climate change in Brazil is to increase technical knowledge on the problem. This includes climate models, models that translate expected changes in climate into physical impacts in the different sectors of the economy (dose-response relationships), more efficient and cost-effective mitigation and adaptation options, as well as social, economic and environmental perspectives. The analyses presented here adopt a rough scale and need to be downscaled and detailed to be used at a more local level.
The recommendation of increasing knowledge is not just an academic nature. In addition to making decision making difficult, the severity and complexity of the problem require readiness for action at the right moment, having beforehand well analysed and designed alternatives, something not available today. Technical knowledge is linked to the capability of government institutions of gathering necessary information and defining appropriate policies and incentives. The study did not assess this capability, but it is relevant to recommend that it be ready.
Fighting climate change should become part of policies in a cross-cutting manner (mainstreaming). The environmental sector, for example, could include in its licensing process factors connected to emissions (or sequestration) of greenhouse gases, in the case of the brown environmental agenda (pollution) and the green agenda (agricultural and related sectors). The transport, housing, agricultural and industrial sectors, should all begin to include environmental criteria related to climate change in their planning activities, with a view to discouraging emissions and encouraging the production and consumption of low carbon products and inputs.
The main recommendation in this document is to make use of existing legal instruments, including economic incentives, to stop deforestation in the Amazon. This depends on the possibility of developing a financial remuneration mechanism, at a global scale, for environmental services rendered by the preserved forest. The economic analyses clearly showed that, considering the price levels of carbon suggested today, deforestation control in the Amazon would be a highly cost-effective option for reducing carbon emissions, regardless of its obvious ecological and local economic benefits.
Another important recommendation is strengthening social protection mechanisms further, particularly in the semi-arid region in the North East and in the Amazon. The study suggests that economic growth on its own will only reduce the vulnerability of these populations, but through a long term process which would not guarantee that regional and social inequalities would reduce simultaneously. Depending on the severity and speed of climate change, adaptation
mechanisms for these populations will have to be prioritised, including migrations.
The study conducted only a preliminary analysis of the impacts of climate change in the coastal zone and does not include infrastructure. As they are the sectors that involve the biggest volume of resources, it is imperative that studies be developed on the effects of climate change on the supply and demand for infrastructure. In great urban clusters in the coastal zone, the costs of adapting to sea level rise and storm surges can be extremely high.
Sectoral analyses made the need to invest in state of the art agricultural research clear, paying particular attention to genetic breeding of cultivars and second generation genetic engineering. This is essential in a country where the agricultural sector has a strategic position and a history of advanced research. A good example is ethanol production, field where Brazil is the leader in the technologies for the whole production process - industrial and agricultural - and shows potential to continue to be the world leader. The trend of the global energy sector is evident, in the sense of growing low carbon renewable sources and Brazil should keep and enhance the policies that made it a market leader.
However, it is imperative to point out limitations in the study. The work which gives continuity to this pioneering research should consider the nature and the risk of extreme events beyond 2050, and even 2100, as this is when some of the biggest impacts will be felt. In order for actions to limit these risks to be cost-effective, many of them need to start now. It will not be easy, as it will take time, money and a lot of computational capacity to carry out several projections related to the whole range of expected situations. However, the return on investment for guiding policies and actions will be more than compensating.
Economics has a central role to play. There is plenty of experience with large scale dynamic models, including uncertainty and ways to handle it. However, regional and global climate models need to be enhanced and achieve consistency with analyses of historic trend. In the case of Brazil, it is necessary to increase the observation network of the tropical region in South America, with a view to promoting high quality homogenous and wide reaching data.
Although this study does not address directly the issue of balancing risks, it establishes a solid platform so that future analyses on the impacts in Brazil may further detail thechallenges, alternatives, costs and opportunities that climate change poses for the Country’s development, for this and future generations. With the largest natural resource-based economy in the world, Brazil only stands to lose if it hesitates in taking the forefront of sustainable development into the 21st Century.
www.economiadoclima.org.br
79
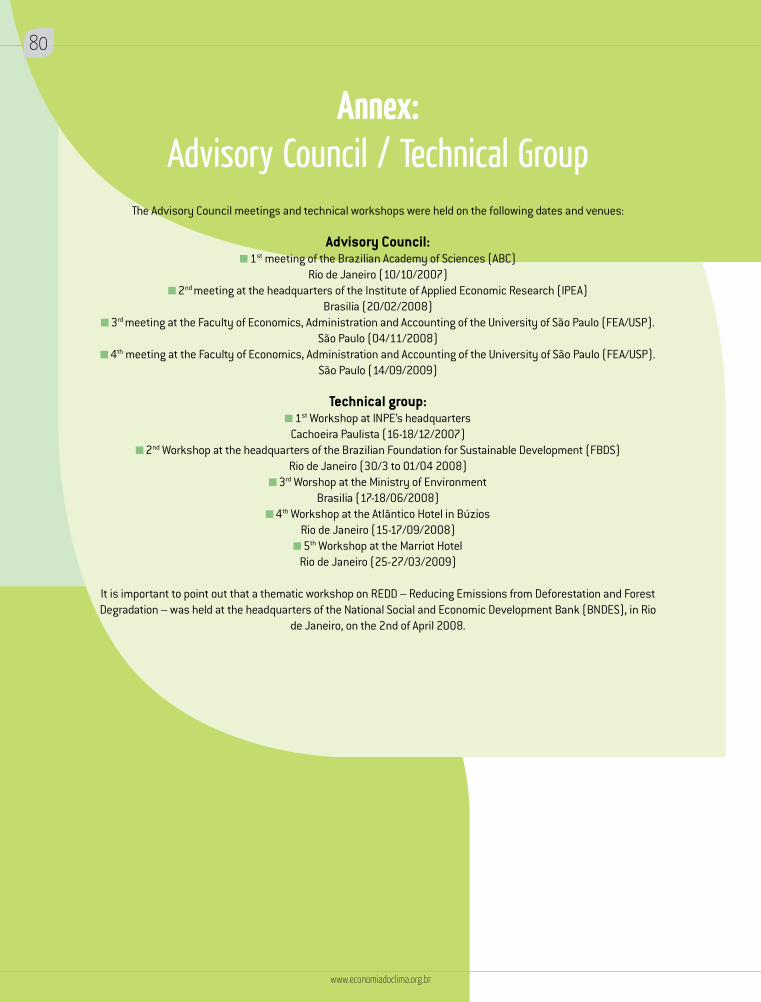
Annex: Advisory Council / Technical Group
The Advisory Council meetings and technical workshops were held on the following dates and venues:
Advisory Council: 1st meeting of the Brazilian Academy of Sciences (ABC)
Rio de Janeiro (10/10/2007) 2nd meeting at the headquarters of the Institute of Applied Economic Research (IPEA)
Brasilia (20/02/2008) 3rd meeting at the Faculty of Economics, Administration and Accounting of the University of São Paulo (FEA/USP).
São Paulo (04/11/2008) 4th meeting at the Faculty of Economics, Administration and Accounting of the University of São Paulo (FEA/USP).
São Paulo (14/09/2009)
Technical group: 1st Workshop at INPE’s headquartersCachoeira Paulista (16-18/12/2007)
2nd Workshop at the headquarters of the Brazilian Foundation for Sustainable Development (FBDS)Rio de Janeiro (30/3 to 01/04 2008)
3rd Worshop at the Ministry of EnvironmentBrasilia (17-18/06/2008)
4th Workshop at the Atlântico Hotel in BúziosRio de Janeiro (15-17/09/2008) 5th Workshop at the Marriot HotelRio de Janeiro (25-27/03/2009)
It is important to point out that a thematic workshop on REDD – Reducing Emissions from Deforestation and Forest Degradation – was held at the headquarters of the National Social and Economic Development Bank (BNDES), in Rio
de Janeiro, on the 2nd of April 2008.
80
www.economiadoclima.org.br
ReferencesBANCO MUNDIAL (2009). Cenário de Baixa Emissão de Carbono no Brasil.
No prelo.BARBIERI, A., CONFALONIERI, U., LIMA, A. C. L., TURRA, M. C., BERENSTEIN,
C. K., MARINHEIRO, D. P., MODENA, C. M., BARCELOS, S. LANZA, B., SAWYER, D., DOMINGUES, E. RIGOTTI, I., CARVALHO, J. A., RESENDE, M. F. e RUIZ, R. (2008). Mudanças Climáticas, Migrações e Saúde: Cenários para o Nordeste Brasileiro, 2000-2050. Relatório do CEDEPLAR e LABES/FIOCRUZ.
CAMARGO, A.P., MARIN, F.R., SENTELHAS, P.C. e PICINI, A.G. (1999). Ajuste do Método de Thornthwaite para Estimar a Evapotranspiração Potencial em Climas Áridos e Superúmido, com Base na Amplitude Térmica Diária. Rev. Bras. Agrometeorologia. 7 (2), 251–257. 1999
CENSO AGROPECUÁRIO DO IBGE (1996). Instituto Brasileiro de Geografia e Estatística. Rio de Janeiro, 1996.
COSTANZA, R., D’ARGE, R., GROOT, R., FARBER, S., GRASSO, M., HANNON, B., LIMBURG, K., NAEEM, S., O’NEILL, R. V., PARUELO, J., RASKIN, R. G., SUTTON, P. e VAN DEN BELT, M. (1997). The Value of the World’s Ecosystem Services and Natural Capital. Nature 387, 253 - 260 (15 May 1997).
FERES, J. , SPERANZA, J., VIANA, P. A., BARCELLOS, T. e BRAGA, Y. (2009-1). Impactos da Mudança do Clima no Uso da Terra. Relatório do IPEA.
FERES, J. , SPERANZA, J., VIANA, P. A., BARCELLOS, T. e BRAGA, Y. (2009-2). Produção de Etanol e seus Impactos sobre o Uso da Terra no Brasil. Relatório do IPEA.
GOLDEMBERG J., COELHO S. e GUARDABASSI P. (2008). The Sustainability of Ethanol Production from Sugarcane. Energy Policy.
HADDAD, E., ALMEIDA. E., AZZONI, C., DOMINGUES, E., GUILHOTO, J., KANCZUK, F. e PEROBELLI, F. (2009). Avaliação de Impactos de Mudanças Climáticas sobre a Economia Brasileira. Relatório da FIPE/USP.
HADDAD, E., DOMINGUES e PEROBELLI, F. (2009). Efeitos de Taxação de Carbono na Economia Brasileira. Relatório da FIPE/ USP.
IPCC (1994). Preparing to Meet the Coastal Challenges of the 21st Century Conference Report of the World Coast Conference.
IPCC (2001). Painel Intergovernamental sobre Mudança Climática. 2001. Terceiro Relatório de Avaliação.
IPCC (2007). Painel Intergovernamental sobre Mudança Climática. 2007. Quarto Relatório de Avaliação.
MACEDO, I.C. (2005). Sugarcane’s Energy: Twelve Studies on Brazilian Sugarcane Agribusiness and its Sustainability. UNICA, São Paulo.
MARENGO, J., ALVES, L. SALAZAR, L. TORRES, D. e SANTOS, D. C. (2009). Cenários Futuros sobre o Clima no Brasil, CPTEC/INPE
NEPSTAD, D., SOARES-FILHO, B., MERRY, F., MOUTINHO, P., BOWMAN, M., SCHWARTZMAN, S., ALMEIDA, O. e RIVERO, S. (2007). The Costs and Benefits of Reducing Carbon Emissions from Deforestation and Forest Degradation in the Brazilian Amazon. Woods Hole Research Center, 28 p. IPAM (2007).
NICHOLLS, R. J., HANSON, S., HERWEIJER, C., PATMORE, N., HALLEGATTE, S., CORFEE-MORLOT, J., CHÂTEAU, J. e MUIRWOOD, R. (2008). Ranking Port Cities with High Exposure and Vulnerability to Climate Extremes - Exposure Estimates. OECD Environment Working Papers, No. 1, OECD publishing. doi:10.1787/011766488208
OBERLING, D. (2008). Avaliação Ambiental Estratégica da Expansão
de Etanol no Brasil: uma Proposta Metodológica e sua Aplicação Preliminar. Dissertação de M.Sc. em Planejamento Energético. PPE/COPPE – Universidade Federal do Rio de Janeiro. Rio de Janeiro. 214 p.
PINTO, H. S., ASSAD, E. e PELLEGRINO, G. (2009 - 1). Impactos da Mudança do Clima na Produção Agrícola. Relatório de Cepagri/ Unicamp e Embrapa Agropecuária,
PINTO, H. S., ASSAD, E. e PELLEGRINO, G. (2009 - 2). Adaptação à Mudança do Clima no Setor Agrícola. Relatório de Cepagri/ Unicamp e Embrapa Agropecuária,
PLANO NACIONAL DE ENERGIA, 2030 (PNE 2030). Ministério de Minas e Energia; colaboração com a Empresa de Pesquisa Energética. Brasília: MME : EPE, 2007.
ROSMAN, P. C. C., KLEIN, A. NEVES, C., MUEHE, D., CARVALHO, J. e ARAÚJO, M. (2009). Vulnerabilidades da Zona Costeira Brasileira Às Mudanças Climáticas. PENO/COPPE/UFRJ
ROVERE, E. L. L, OBERMAIER, M., WILLS, W. e OBERLING, D. (2009) . Análise de Cenários de Médio Prazo (2020-2030) de Demanda Global de Energia e de Etanol Brasileiro. Relatório do LIMA/COPPE/UFRJ.
ROVERE, E. L. L, OBERLING, D., OBERMAIER, M., SOLARI, R. e WILLS, W. (2009). Aspectos socioambientais da expansão da cana-de-açúcar. Relatório do LIMA/COPPE/UFRJ.
SALATI, E., SCHINDLER. W., VICTORIA, D. C., SALATI, E., SOUZA, J. C.S. e NOVA, N. A. V. (2009). Estimativas da Oferta de Recursos Hídricos no Brasil em Cenários Futuros de Clima (2015 – 2100)”. Relatório da FDBS.
SALAZAR, L. F., NOBRE, C. A. e OYAMA M. D. (2007). Climate Change Consequences on the Biome Distribution in Tropical South America, Geophys. Res. Lett., 34, L09708, doi:10.1029/2007GL029695.
SCHAEFFER, R. , SZKLO, A., LUCENA. A.F.P., SOUZA, R. BORBA, B., COSTA, I. V. L., PEREIRA JUNIOR, A. O. e CUNHA, S. H. (2009 - 1). Impactos na Demanda e na Confiabilidade no Setor de Energia. Relatório do PPE/COPPE/UFRJ.
SCHAEFFER, R. , SZKLO, A., LUCENA. A.F.P., SOUZA, R. BORBA, B., COSTA, I. V. L., PEREIRA JUNIOR, A. O. e CUNHA, S. H. (2009 - 2). Adaptação à Mudança do Clima no Setor de Energia. Relatório do PPE/COPPE/UFRJ.
SCHAEFFER, R. , SZKLO, A., LUCENA. A.F.P., SOUZA, R. BORBA, B., COSTA, I. V. L., PEREIRA JUNIOR, A. O. e CUNHA, S. H. (2009 - 3). Cenários de Biocombustíveis. Relatório do PPE/COPPE/ UFRJ.
SCHNEIDER, R. (2009). Redução do Desmatamento na Amazônia Brasileira e seus Custos de Oportunidade. Relatório do autor.
SOARES-FILHO B.S., NEPSTAD, D.C., CURRAN, L.M., CERQUEIRA, G.C., GARCIA, R.A., RAMOS, C.A., VOLL, E., MCDONALD, A., LEFEBVRE, P. e SCHLESINGER, P. (2006). Modeling Conservation in the Amazon Basin. Nature, 440. 520-523.
STRASSBURG B. B. N. (2009 - 1). Sumária Avaliação Econômica dos Impactos das Mudanças Climáticas sobre Biomas Brasileiros. Relatório do autor.
STRASSBURG, B.B.N. (2009 - 2). Os Determinantes Agrícolas e o Retorno Econômico do Desmatamento na Amazônia Brasileira entre 1997-2006 e 2010-2050. Relatório do autor.
U.S. FEDERAL EMERGENCY MANAGEMENT AGENCY (2007). Procedure Memorandum No. 37 - Protocol for Atlantic and Gulf Coast Coastal Flood Insurance Studies in FY05.
www.economiadoclima.org.br
81
Credits
Publisher School of Economics, Business Administration and Accountancy –
University of São Paulo
Editing and proofreading Sergio Margulis, Carolina Burle Schmidt
Dubeux, and Marcelo Leite
Translator Marsel N. G. de Souza
Artwork Graphic Design and Artwork Editing: Dora Dias
Adaptation: Marcius Marques www.vendoeditorial.com.br
Infographs: Alberto Cairo
Photos: Shutterstock e Nilo D’Ávila
Printed by Vox Editora e Gráfica Ltda.
Print Run One thousand copies
Support British Embassy – Brasilia
São Paulo Research Foundation – FAPESP National Institute of Science and Technology for Climate Change – INCT-MC
Foundation Institute of Economic Research – FIPE


In consideration of environmental and social issues, we have used FSC-certified paper to print this publication. The FSC (Forest Stewardship Council) Certification ensures that forest raw materials are obtained from socially, environmentally and economically adequate sources, and from other controlled sources. Printed at Vox Editora e Gráfica Ltda. - Certified at the custody chain - FSC.