Embed Size (px)
Citation preview
The Economic Viability of Alternative Wet Dry (AWD) Irrigation in Rice Production in the
Mid-South
Lanier Nalleya*
, Merle Andersb, Kent Kovacs
c and Bruce Lindquist
d
a,cAssociate and Assistant Professor, respectively in the Department of Agricultural Economics
and Agribusiness. University of Arkansas. bAssistant Professor Department of Crop, Soil and
Environmental Sciences. University of Arkansas Division of Agriculture. d Assistant Professor
Department of Plant Sciences. University of California Davis.
Working Paper Prepared for the Southern Agricultural Economics Association
46th Annual Meeting Program
February 1-4, 2014
Dallas, Texas
* Corresponding author. Tel.: 479-575-6818; fax: 479-575-5306. E-mail address: [email protected] (L. Nalley).
Abstract
This study looks at the economic feasibility of Alternate Wet Drying (AWD) irrigation
methods to address concerns of groundwater depletion and greenhouse gas (methane) emissions
associated with rice production. AWD is an irrigation régime where the producer allows the rice
field to dry intermittently during the rice life-cycle rather than having the field continuously
submerged. In previous studies AWD has been found to reduce water usage by from 20-70% and
to reduce methane emissions by over 50% as compared to rice produced under continuous
flooding. However; the large disadvantage of AWD is that it is often times associated with a
yield loss. Thus, this study sets out to estimate the economic viability of three types of AWD
irrigation methods in Arkansas using test plot data. Data includes water usage, methane
emissions and yields for three hybrid rice varieties across three years and three AWD methods.
The goals of this study are to (1) estimate if any of the AWD methods demonstrate higher
profitability than traditional flooding (2) introduce a carbon offset market to capture benefits of
the GHG reduction, via methane, and estimate profitability between AWD and traditional
flooding (3) introduce a water tax equivalent to the social cost of water and reestimate
profitability of AWD and traditional flooding. These results will give producers as well as large
rice buyers (MARS and Kelloggs) an idea of relative profitability and additional premiums
necessary to switch to/source a more “sustainable” rice crop.
Introduction
We assess the economic feasibility of Alternate Wet Drying (AWD) irrigation methods to
address concerns groundwater depletion and greenhouse gas (GHG) emissions (principally
methane) associated with rice production. AWD is an irrigation régime where the producer
allows the rice field to dry intermittently during the rice life-cycle rather than having the field
continuously submerged. In previous studies AWD is found to reduce water usage by from 20-
70% and to reduce methane emissions by almost 50% as compared to rice produced under
continuous flooding, which was certified by the Intergovernmental Panel on Climate Change
(IPCC). However; the large disadvantage of AWD is that it is often times associated with yield
loss.Thus, this study sets out to estimate the economic viability of three types of AWD irrigation
methods in Arkansas using test plot data.
Groundwater depletion in the rice producing region of Arkansas is a pressing concern.
Today’s irrigation level is unsustainable in the sense that water use exceeds recharge. In 2004,
the Arkansas Natural Resources Commission (ANRC) estimated groundwater withdrawals at 6.5
billion gallons per day, a 70% increase from the amount used in 1985 and over twelve times that
of 1945 (ANRC, 2007). Exacerbating this issue is the drilling of over 10,000 new wells since
1997 (ANRC, 2007), which is likely a result of enhanced profitability for irrigated crops (notably
corn) as well as agricultural lending preferences for irrigated production.To reach sustainable
pumping levels, the United States Geological Survey’s 2013 estimates indicate that certain rice
growing counties in the Arkansas Delta counties will need to reduce irrigation pumping rates by
as much as 74% (USGS, 2013). With water supplies declining at these rates in parts of the
Alluvial aquifer, water-intensive agricultural production and associated processing industries are
at risk.
Figure 1 illustrates the percentage of irrigation water use that is sustainable in counties
located in the Alluvial aquifer region. These estimates are based on 2009 pumping rates, the
most recent sustainability study of its kind put out by USGS. Arkansas, Lonoke, Lee, Poinsett
and St. Francis counties would all need to reduce their pumping rates by over 40% to maintain
current ground-water levels. To put this in perspective, these counties alone consisted of 25% of
Arkansas’ total rice acreage in 2012. Hogan et al. (2007) estimated that flood irrigation for an
acre of rice required more than twice as much irrigation water as the methods used with other
crops in the Mid-South. From rice production in Arkansas alone from 2000 through 2009, based
on harvested cropland acres from USDA-NASS (2010), required an average of 3.6 billion m3 of
irrigation water per year. This presents a problem for sustainability given the profitability of rice
combined with the required water needed for its production.
Besides using nearly twice as much water as the next crop produced in the state, rice
production (from seed to farm gate) has been identified as a significant source of atmospheric
methane (CH4) emissions from U.S. agricultural production (U.S. Environmental Protection
Agency, 2011). As a result, producers and large purchasers of U.S. rice have attempted to
increase the GHG emissions efficiency of rice production. Since 2007, the California Rice
Commission has worked with the Environmental Defense Fund (EDF) to reduce the CH4
emissions associated with California rice production. Best management practices for GHG
reduction developed by the partnership might allow California rice producers to participate in
voluntary carbon offset markets (Lyman and Nalley, 2012). The EDF has since partnered with
Arkansas based Winrock International to extend the product to Arkansas (Bennett, 2011).
Kellogg, a large purchaser of U.S. rice, is working with Louisiana rice producers to increase the
sustainability of Kellogg’s rice-based supply chain (Schultz, 2011). Mars, another major
purchaser of U.S. rice, recently hired a rice scientist to assist Mars’ sustainability effort (Mars,
2011). Increasing pressure on rice producers to reduce their GHG emissions will likely have
significant implications for Arkansas, home to nearly half of U.S. rice production.
The goals of this study are to (1) estimate if any of the AWD methods demonstrate higher
profitability than traditional flooding (2) introduce a carbon payment from an offset market for
GHG reduction, via methane, and estimate profitability between AWD and traditional flooding
(3) introduce a water tax equivalent to the social cost of water and reestimate profitability of
AWD and traditional flooding. We data on water usage, methane emissions and yields for three
hybrid rice varieties across three years and three AWD methods. These results will give
producers as well as large rice buyers (MARS and Kelloggs) an idea of relative profitability and
additional premiums necessary to switch to/source this “sustainable” rice crop.
Alternate Wet Dry Rice Production
Alternate Wet-Dry (AWD) irrigation is an irrigation scheme where the producer allows the rice
field to dry intermittently during the rice life-cycle rather than having the field continuously
submerged. The theory behind AWD is that this irrigation method allows the roots of the rice
plant to be adequately supplied with water for some period (due to the initial flush or flooding)
even if there is no observable standing water in the field. The rate and timing of the application
of the water is determined by the producer and is a function of rainfall, soil type and the specific
period of the rice life-cycle. Theoretically AWD can increase the water use efficiency by
reducing seepage and percolation during production.
Previous studies in the mid-south have concluded that rice could be produced under non-
flooded conditions using furrow and sprinkler irrigation are not economically viable (Van der
Hoek et al. 2001). Those authors found that rice yields under non-flooded conditions generally
decreased proportionally with reduced water application (increased stress). There were periods
during the rice growth cycle when the yield was particularly sensitive to moisture stress.
However, they also found that there were statistical differences in yield among different varieties
and their resistance to both blast and drought stress. Vories et al. (2002) reported consistently
lower yields with furrow irrigation of rice than for flooded production. Studies with center pivot
systems during the 1980s in Louisiana (Westcott and Vines, 1986) and Texas (McCauley, 1990)
reported large yield and revenue reductions compared with flooded production. Other studies
(Guerra et al. 1998 and Bouman et al. 2000) have shown that test plots using water-saving
irrigation techniques (AWD) have the potential to reduce total water usage by 20-70% without
causing significant yield losses. That being said, these were test plots, under highly controlled
environments where scientists could precisely control the flushing of the fields given different
stages in the rice life cycle minimizing stress on the plant. The most comprehensive study, a
synthesis of 31 published articles, conducted by Bouman and Tuong (2001) found that 92% of
the AWD studies resulted in yield reductions ranging from zero to 70% relative to flooded
controls. The authors state that the large range in yield reductions is due to the differences in
“severity” of AWD treatments, ranging from marginal water savings with little stress on the rice
crop to significant waters savings associated with large yield penalties. In most of the mid-south
where flooding predominates, failure to maintain an adequate flood depth results in dry portions
of the paddy leads to increased weed pressure and lower yields. Another large obstacle for mass
adoption in the Mid-South is the presence of rice blast and the fact one of the most efficient ways
of mitigating an outbreak is simply raising the flood on a field, which cannot be done with AWD
or center pivot irrigation.
Disease Issues with Alternative Irrigation
Rice blast is one the most frequent and costly diseases of rice in the Mid-South, caused
by the fungus (Magnaportha grisea ). The fungus survives between crops on infected rice
straw/seed. Blast lesions typically form as oval-shaped spots on rice leaves with these lesions
producing spores that are transported through the air to other plants where they continue the
infection process throughout the growing season if climatic conditions are favorable. At heading
(the emergence of the panicle tip from the flag leaf sheath), spores can infect the node below the
panicle, resulting in “neck blast” the most damaging type of blast. The yield losses associated
with blast outbreaks in Arkansas have been estimated from 10 to 50% (Delta Farm Press 2004).
Fungicides have been produced worldwide to help control blast, most notably with
Quadris® and Quilt
® in the United States,. When blast lesions are found, via scouting, fungicide
is quickly applied via crop duster in an attempt to mitigate the spread of the disease. However,
the use of fungicides with similar modes of action over extensive periods is not recommended
because this results in the emergence of resistant populations of the pathogen (Kim et al 2008).
Given that producers historically plant varieties with weak blast resistant they have relied on
raising the flood to mitigate blast outbreaks. Since AWD irrigation methods typically do not
involve flooding, blast possess a serious impediment for the wide scale adoption of AWD.
In the past decade, the increased availability of hybrid rice seed in the mid-southern
United States has offered rice producers an alternative to the inbred (conventional) rice cultivars
historically planted in the mid-south. The heterosis or vigor, of first-generation (F1) hybrid rice
(can yield 15 to 20% more than conventional cultivars on similar land due to the combination of
yield-improving genetic traits from parent cultivars (Yuan and Virmani, 1988). Arkansas, the
largest rice producer in the United States, accounts for two-thirds of the total hybrid rice acreage
in the mid-southern states (Louisiana, Mississippi, Missouri, and Texas). Hybrid adoption in
Arkansas has grown from 2% of harvested long-grain acreage in 2002 to nearly 50% in 2011.
Producers in Arkansas have also adopted hybrids because of their increased disease package; all
hybrids are blast resistant.
In the late 1990’s center pivot rice production was tried on some fields throughout the
Arkansas Delta with little success. Producers experienced reduced yields attributed to the fact
they could not control weeds as efficiently as with a flood and the presence of blast. At that time
there were only a few rice varieties that were completely blast resistant and the only way to
mitigate a blast outbreak was to either spray fungicide or raise the flood (which was not an
option for center pivot rice). So, until recently with the mass adoption of hybrid varieties and a
few conventional (inbred) varieties (namely Roy J) any type of alternative irrigation systems
AWD or center pivot have not been seriously considered by producers. Thus, with the advent of
hybrids and Roy J this study sets out to see what if any economic benefits are associated with the
environmental benefits that come with AWD irrigation methods using blast resistant varieties.
Greenhouse Gas Reduction Potential with AWD Irrigation
Methane is produced anaerobically by methanogenetic bacteria and flooded rice fields are
the second largest source of methane emissions after ruminant livestock. Methane is over 21
times more potent in terms of greenhouse warming potential than CO2 over a 100-year period
(EPA, 2014). Methane emissions from rice fields are determined mainly by water regime
(flooding or alternative irrigation methods) and organic inputs, but they are also influenced by
soil texture, weather, tillage management, residues, fertilizers, and rice variety. Flooding of the
soil is a prerequisite for sustained emissions of methane. Periodic aeration of flooded soils
inhibits methane producing bacteria; as such AWD can substantially reduce methane emissions.
Wassmann, Hosen and Sumfleth, 2009 estimate that AWD irrigation can reduce methane
emissions by over 40%. Lampayan (2012) and Wassmann et al. (2009) showed that AWD has
the potential to reduce methane emissions by almost 50% as compared to rice produced under
continuous flooding, which merited certification from the Intergovernmental Panel on Climate
Change (IPCC). In the revised IPCC methodology (IPCC 2006), “multiple aeration,” to which
AWD corresponds, is presumed to reduce methane emissions by 48% compared with continuous
flooding of rice fields (UN FAO 2010). However, some have suggested that by the nature of
AWD creating nearly saturated soil conditions, it may promote N2O production. Wassmann et
al. (2009) conclude that there are conflicting reports on the net global warming potential (GWP)
of AWD, but there seems to be a growing consensus that this practice decreases the net GWP of
paddy fields as long as nitrogen is applied in appropriate doses and, as commonly practiced in
the Mid South, when large amounts of rice straw are returned to the soil. Bouman et al. 2007
concludes AWD generates multiple benefits related to reducing water use, reducing methane
emissions (mitigation), increasing productivity, and increasing food security.
Data and Methods
Site Description
In 2011 and 2012 a water management study was carried out at the University of
Arkansas’ Rice Research and Extension Center near Stuttgart, Arkansas (N 34o27' lat; W 091
o24'
long) on a Dewitt silt loam (fine, smectitic, thermic, Typic Albaqualfs; USDA, 2006). The study
site was previously managed as a rice-soybean rotation. In both years, the rice crop being studied
was planted following soybean. The field was managed so that each year’s planting was adjacent
to that of the previous year. Composite soil samples were collected to a 15-cm depth from each
replication area in March 2012.
Methane Treatments and Experimental Design
In both years the study contained four replications and the following six water treatments:
1) flood, 2) AWD/40-flood, 3) AWD/60, 4) AWD/40, Row Rice (RW)/60, and RW/40 where
AWD represents alternate wetting and drying followed by the percent of saturated soil water
holding capacity at which fields were re-flooded to a depth of 10-cm. For the AWD/40-flood
treatment the AWD/40 management was maintained from initial flood to the plants reaching the
R0-R1 growth stage (Counce et al. 2000); after which a 10-cm flood was maintained until the
field was drained. Row water treatments consisted of rice planted across beds that were 10-cm in
height and 75-cm across. Water treatments (main plots 8.5 x 30.5-m) were randomly split to
accommodate two 4.24 x 30.5-m variety sub-plots. In 2011 CLXL745 and XL723 (RiceTec)
hybrid varieties were grown. In 2012 CLXL745 and XL753 were used. All rice plantings were
dry seeded into 19-cm rows using an Almaco no-tillage grain drill (Almaco, Nevada, IA) at a
seeding rate of 30 kg seed ha-1
. All plots received an application of Command (clomazone) at a
rate of 0.56 kg ha-1
and Facet (quinclorac) at a rate of 0.34 kg ha-1
immediately following
planting. When the plants reached the V4-V5 growth stage, and prior to flooding the field,
Clincher (cyhalofop) at 0.31 kg ha-1
, Permit (halosulfuron) at 0.053 kg ha-1
, and Facet
(quinclorac) at 0.22 kg ha-1
were applied and the field flooded.
All plots received a single phosphorus and potassium application of 29 kg P ha-1
and 84 kg K ha-
1 as triple-super phosphate and muriate of potash, respectively, prior to tilling the field in the
early spring. A single nitrogen application in the form of urea at 144 kg N ha-1
was made just
prior to the plots receiving their initial water treatment application. For the flood and AWD water
treatments, the initial flood was maintained for 10 days after which the AWD treatments were
allowed to dry via evapotranspiration. For the RW treatments, water was applied slowly during
the first water application to minimize fertilizer movement down the field. When a water
treatment in a majority of replications reached the R7 growth stage, no further water was applied
and those plots containing water were drained. A 3.0 x 30.5-m area of each plot was harvested to
determine grain yield and samples for further analysis.
Sample Collection and Analysis
Prior to spring tillage (March) composite of ten soil samples were collected in each
replication to a 15-cm depth using a 10-cm diameter, stainless steel core chamber. Following
collection, samples were manually broken up into pieces that were small enough to pass through
a 6-mm sieve and air-dried for seven days at an approximate temperature of 22 oC. Sub-samples
of air-dried soil were then ground for 12 hrs using a roller mill. In 2012 soil samples were
collected following harvest from each main plot treatment and processed as previously
described. Samples were analyzed using a Mehlich-3 procedure for extractable P, K, Ca, Mg, Na,
S, Fe, Mn, Zn, and Cu (Mehlich, 1984). Total soil C and N were determined by high-temperature
combustion using a LECO CN-2000 (LECO Corporation, St. Joseph, MI; Nelson and Sommers,
1996). Soil pH and electrical conductivity (EC) determinations were made using a 1:2 soil water
mixture and measured by electrode. Soil organic matter was determined by loss-on-ignition
(Schulte and Hopkins, 1996). At the time of harvest, 4-kg sub-samples were collected from each
treatment as the grain was augured from the combine collection bin. These samples were dried at
45o C to a12% moisture content and placed in seed storage.
Non-Methane GHG Emissions
Multiple GHG’s associated with global warming, were converted to their CO2 equivalent to
obtain a “carbon footprint” for all inputs used in rice production. Values provided by the US
Environmental Protection Agency (EPA) were used for diesel. EcoInvent’s life cycle inventory
database through SimaPro (2009) was used to calculate the upstream emissions from the
production of fuel. Typically the Life Cycle Inventory (LCI) used within included both direct
and indirect emissions associated with rice production. Direct emissions are those that come
from on-farm operations. Examples are carbon dioxide (CO2) emissions from diesel used by
tractors and irrigation equipment and gasoline used by farm trucks. Indirect emissions are
generated off farm as a result of manufacturing inputs used on the farm. Examples are GHG
emissions from natural gas to produce commercial fertilizer.
McFadden et al. (2013) conducted a variety specific life cycle analysis and found large
differences between GHG emissions between hybrids and conventional varieties but not across
hybrid varieties. This is not surprising given the fact that all “modern hybrids” have the same
input (fertilizer, herbicide, fungicide, flood depth, etc.) recommendations so on a per acre basis
the carbon footprint across hybrids, like the ones analyzed in this study, should be equivalent.1
Thus, this study will assume all inputs and associated GHG’s are equivalent between each of the
three hybrid varieties (CLXL745, XL753 and XL72). The only differences between GHG
emissions will be between irrigation regimes resulting in differences between (1) methane
emissions and (2) emissions from running irrigation equipment. That is, because AWD uses less
water than traditional flooding there will be a measured difference in the amount of diesel
needed to raise that water. The study assumed that water for irrigation was pumped from 74.11
feet using a diesel pump which required 1.022 gallons of diesel to raise one acre-inch of water
1 The only difference being that the Clearfield® hybrids use a different type of herbicide, Newpath, but at similar
rates of application. Thus the only difference in GHG emissions per acre would be associated with the emissions
associated with the active ingredients between herbicides.
(Slaton 2001).2 The average depth of the Alluvial Aquifer, on the Arkansas side is estimated to
be 74.11 so this was chosen to represent the average pumping cost for irrigation (ANRC, 2012).
So, GHG reductions in this study are a result of switching from traditional flooding to an AWD
irrigation régime resulting in less methane emissions from a reduced flood and reduced CO2
emissions from reduced diesel required for irrigation.3 As such, CO2 mitigation payments could
be paid to a producer for switching to AWD from traditional flooding.
Carbon Payments
A mitigation price of $5.91 per ton of CO2e was used as it was the 2013 futures price on
the European Carbon Futures market on the European Energy Exchange (EEX). Thus as an
example, reducing irrigation by 15 acre/inches would result in a carbon payment of $1.14 per
acre. Where each gallon of diesel fuel is equivalent to 25.81 lbs/CO2e (EPA, 2013) multiplied
by 15 ac/in (387.2) divided by 2,000 from tons to pounds (0.1936) times $5.91(carbon price)
results in a mitigation payment of $1.14. While carbon payments for diesel are relatively small
those for methane can be relatively much larger (given methane emissions for flooded rice often
exceed a ton per acre) giving a producer a potential incentive to switch to AWD. It should be
noted that the authors are not suggesting that these carbon mitigation payments are large enough
to trigger switching to AWD but view this payments as partially offsetting the yield loss that
typically comes with AWD.
Social Cost of Water
2 Assuming a 75 percent pump efficiency and 5 percent drive loss.
3 Roughly 50% of irrigation wells in Arkansas are powered by electric motors. That being said, the amount of CO2
released to raise an acre inch of water is higher when using an electric motor given the source of the electricity
production. Thus, the estimates from this study should be slightly conservative.
Pumped groundwater, in addition to increasing the water supply, mitigates undesirable
fluctuations in the water supply. Here we describe how to assign an economic value to this
stabilization role (Tsur, 1990). Let the uncertain supply of surface water, s, be distributed
according to a cumulative distribution having a moment vector with the mean and the
variance 2 .4 In the absence of groundwater, growers use the surface water available and enjoy
the operating profit per acre of pF(), where F( ) represents per acre yield response to water, and p
is the net unit value of the crop. The demand for groundwater by growers is determined after the
observed precipitation occurs. This ex post situation is most realistic and is what prevails in the
Arkansas region.
The stabilization (or buffer) value of groundwater for irrigation is defined as
( , ) ( , ) ( , )u cBV p B p B p .
The buffer value BV equals the difference between the benefits of groundwater in the uncertain
and the certain environments. BV is the amount a grower facing an uncertain surface water
supply would be willing to pay for groundwater over the corresponding amount that is willing to
be paid if the surface water supplies are certain at . This is a measure of how much a producer
would be willing to pay to move from a situation in which surface water supplies fluctuate
symmetrically about a mean to a stable environment in which this supply is fixed at the level
.
Tsur (1990) shows that ( , ) ( ) ( )BV p pF pE F s . The availability of groundwater
shifts uncertainty from production to costs. The linearity in costs for groundwater implies
producers are indifferent to uncertainty in costs, but production is concave in the water input
4 In the Arkansas region, surface water derives largely from precipitation and is independent of groundwater source.
meaning stability in the water input is valuable. Using Jensen’s inequality, BV is approximated
by 20.5 ''( )BV p F . This indicates the BV depends on the value of marginal productivity
of water at input level , the degree of concavity of F at , and the variance of surface water
supply 2 .
Social Cost of Water Data
Monthly rainfall data are collected from the Wynne, Arkansas weather station from June
to September when groundwater is typically applied to rice in the Delta over thirteen years from
2000 to 2012 (NOAA, 2013). For the four month season over the thirteen years, the average
seasonal rainfall is 12 inches and the variance of the seasonal rainfall is 19 inches squared. Data
on rice yield for varying levels of water input come from field observations of alternate wet-dry
and flood irrigation. Several functional forms are estimated for the response of rice yield to water
input, and the natural log form is chosen based on fit to determine the concavity of rice yield
response to water input at the average rainfall for the season, ''( )F , estimated to be 0.1753.
The net unit value of rice is the price of a hundred-weight of rice from the five year average of
December futures prices for harvest time contracts (GPTC, 2012) at $6.327 per bushel less the
costs of production for a hundred-weight of rice based on production budgets (Division of
Agriculture, 2012) of $3.279 per bushel, making the net unit value of rice equal to $3.047.
The buffer value for eleven acre-inches of groundwater which is the difference of the water
applied for conventionally grown and AWD rice is:
20.5 ''( ) 0.5*3.047*0.1753*19.4 $5.189.BV p F
The estimate for the buffer value (or social cost of water) per acre-inch for the rice is then:
$5.189/11 acre-inches is $0.47 per acre-inch.
Results
All model variations; (1) AWD vs traditional flooding; (2) AWD with carbon payments vs
traditional flooding; (3) AWD with social cost of water payments vs traditional flooding; and (4)
AWD with carbon payments and social cost of water payments vs. traditional flooding were
analyzed under varying diesel and rice prices ranging from $3.20 - $4.40 per gallon and $2.50 -
$7.00 per bushel, respectively. Excluding water availability, these two costs are the largest when
contemplating adopting AWD irrigation. Rice price plays a large role given the fact that AWD is
often associated with lower rice yield and thus lower revenue which can be analyzed as an
opportunity cost. Table 1 indicates that on average across all years if a producer grows CLXL745
their yields would decrease by 11.54 bu/ac if they switched from traditional to AWD/40
irrigation. Given today’s rice price of $6.21 per bushel, that would result in a loss of $71.66 per
acre. Across the three AWD scenarios CLXL745 has the lowest average yield loss at 5.26%
followed by XL723 and XL753 with 7.16% and 8.65%, respectively. Thus, there would be a
disincentive to adopt AWD flooding unless there was a countervailing incentive, which is the
reduction in diesel usage. An advantage of AWD is lower fuel usage, as diesel price increases so
does the attractiveness of AWD in terms of savings associated with pumping costs. Table 1
illustrates that switching from traditional flooding to AWD/40 a producer could reduce diesel
usage by 10.80 gallons per acre. Given off-road diesel price today of $3.17 per gallon a producer
would save $34.24 on diesel costs by switching to AWD/40 from traditional flooding. That being
said, from our example above we indicate that switching from traditional flooding to AWD
would on average cost a producer $71.66 per acre resulting in a net loss of $37.42 per acre.
Therefore, unless there were additional incentives to adopt AWD it does not look economically
feasible in Arkansas.
Table 3 illustrates the efficiency measures in terms of GHG emissions and water usage
per bushel of rice produced by variety and flooding régime. The average amount of water used to
produce a bushel of rice under traditional flooding was estimated to be 3,911 gallons which is
1.56 times the amount to grow an average bushel of corn ( USDA-ARS, 2011). Switching from
traditional flooding to AWD/40 on average was found to save 321 gallons per bushel (8.2%
efficiency gain), AWD/40 flood was found to save 546 gallons per bushel (13.9% efficiency
gain) and AWD/60 was estimated to save 1,170 gallons per bushel (a 30% efficiency gain). This
seems counter intuitive given that AWD/60 uses substantially more water than AWD/40 but the
yield losses associated with AWD/60 are 4.25% less than with AWD/40; thus the efficiency ratio
of yield to water used is higher. Table 3 also highlights the increased efficiency rice bushels per
unit of GHG (methane in this case) emitted. Traditional flooding was estimated to on average
(across all varieties) emit ten pounds of methane for every bushel of rice produced. AWD/40
reduced that ratio to 0.21 lbs of GHG per bushel (a 98% increase in efficiency), AWD/40-Flood
had a ratio of 5.4 lbs of GHG per bushel (a 46% increase in efficiency) and AWD/60 was
estimate to have an average ratio of 0.4 lbs of GHG per bushel of rice (a 96% increase in
efficiency). Thus, from an environmental efficiency standpoint all forms of AWD irrigation are
superior to traditional flooding. That being said, often times there is a divergence between
environmental efficiency and profit maximization. Government recognizing that the values of a
stable climate or an abundant aquifer are often not internalized in the private marketplace may
establish regulations that generate payments or taxes for use of these resources. The remaining
results section explores the economic viability of AWD when there are incentives (carbon
payments and water savings payments) for the adoption of AWD.
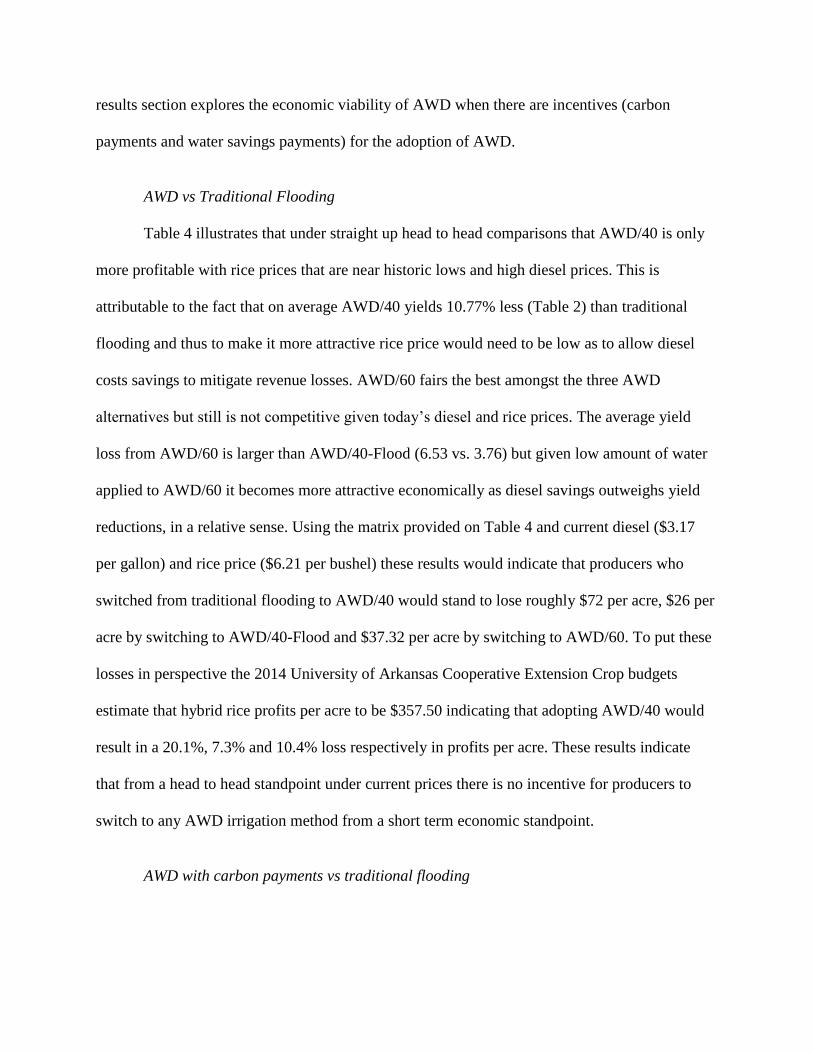
AWD vs Traditional Flooding
Table 4 illustrates that under straight up head to head comparisons that AWD/40 is only
more profitable with rice prices that are near historic lows and high diesel prices. This is
attributable to the fact that on average AWD/40 yields 10.77% less (Table 2) than traditional
flooding and thus to make it more attractive rice price would need to be low as to allow diesel
costs savings to mitigate revenue losses. AWD/60 fairs the best amongst the three AWD
alternatives but still is not competitive given today’s diesel and rice prices. The average yield
loss from AWD/60 is larger than AWD/40-Flood (6.53 vs. 3.76) but given low amount of water
applied to AWD/60 it becomes more attractive economically as diesel savings outweighs yield
reductions, in a relative sense. Using the matrix provided on Table 4 and current diesel ($3.17
per gallon) and rice price ($6.21 per bushel) these results would indicate that producers who
switched from traditional flooding to AWD/40 would stand to lose roughly $72 per acre, $26 per
acre by switching to AWD/40-Flood and $37.32 per acre by switching to AWD/60. To put these
losses in perspective the 2014 University of Arkansas Cooperative Extension Crop budgets
estimate that hybrid rice profits per acre to be $357.50 indicating that adopting AWD/40 would
result in a 20.1%, 7.3% and 10.4% loss respectively in profits per acre. These results indicate
that from a head to head standpoint under current prices there is no incentive for producers to
switch to any AWD irrigation method from a short term economic standpoint.
AWD with carbon payments vs traditional flooding
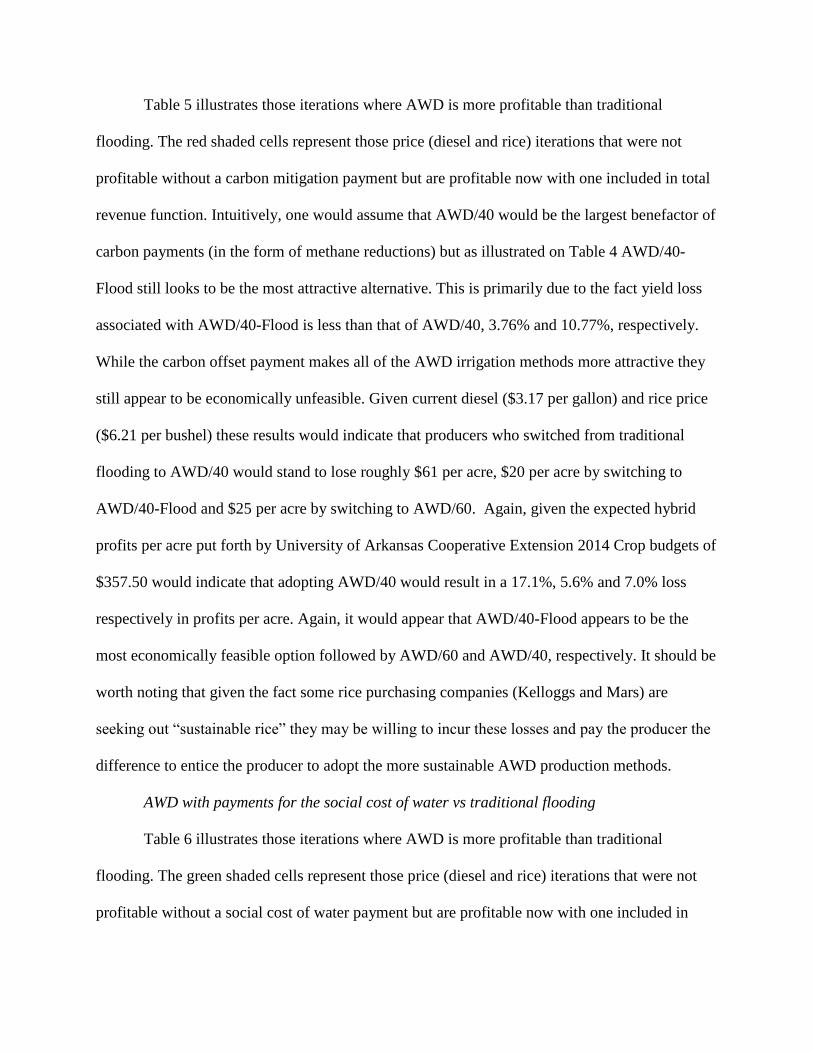
Table 5 illustrates those iterations where AWD is more profitable than traditional
flooding. The red shaded cells represent those price (diesel and rice) iterations that were not
profitable without a carbon mitigation payment but are profitable now with one included in total
revenue function. Intuitively, one would assume that AWD/40 would be the largest benefactor of
carbon payments (in the form of methane reductions) but as illustrated on Table 4 AWD/40-
Flood still looks to be the most attractive alternative. This is primarily due to the fact yield loss
associated with AWD/40-Flood is less than that of AWD/40, 3.76% and 10.77%, respectively.
While the carbon offset payment makes all of the AWD irrigation methods more attractive they
still appear to be economically unfeasible. Given current diesel ($3.17 per gallon) and rice price
($6.21 per bushel) these results would indicate that producers who switched from traditional
flooding to AWD/40 would stand to lose roughly $61 per acre, $20 per acre by switching to
AWD/40-Flood and $25 per acre by switching to AWD/60. Again, given the expected hybrid
profits per acre put forth by University of Arkansas Cooperative Extension 2014 Crop budgets of
$357.50 would indicate that adopting AWD/40 would result in a 17.1%, 5.6% and 7.0% loss
respectively in profits per acre. Again, it would appear that AWD/40-Flood appears to be the
most economically feasible option followed by AWD/60 and AWD/40, respectively. It should be
worth noting that given the fact some rice purchasing companies (Kelloggs and Mars) are
seeking out “sustainable rice” they may be willing to incur these losses and pay the producer the
difference to entice the producer to adopt the more sustainable AWD production methods.
AWD with payments for the social cost of water vs traditional flooding
Table 6 illustrates those iterations where AWD is more profitable than traditional
flooding. The green shaded cells represent those price (diesel and rice) iterations that were not
profitable without a social cost of water payment but are profitable now with one included in
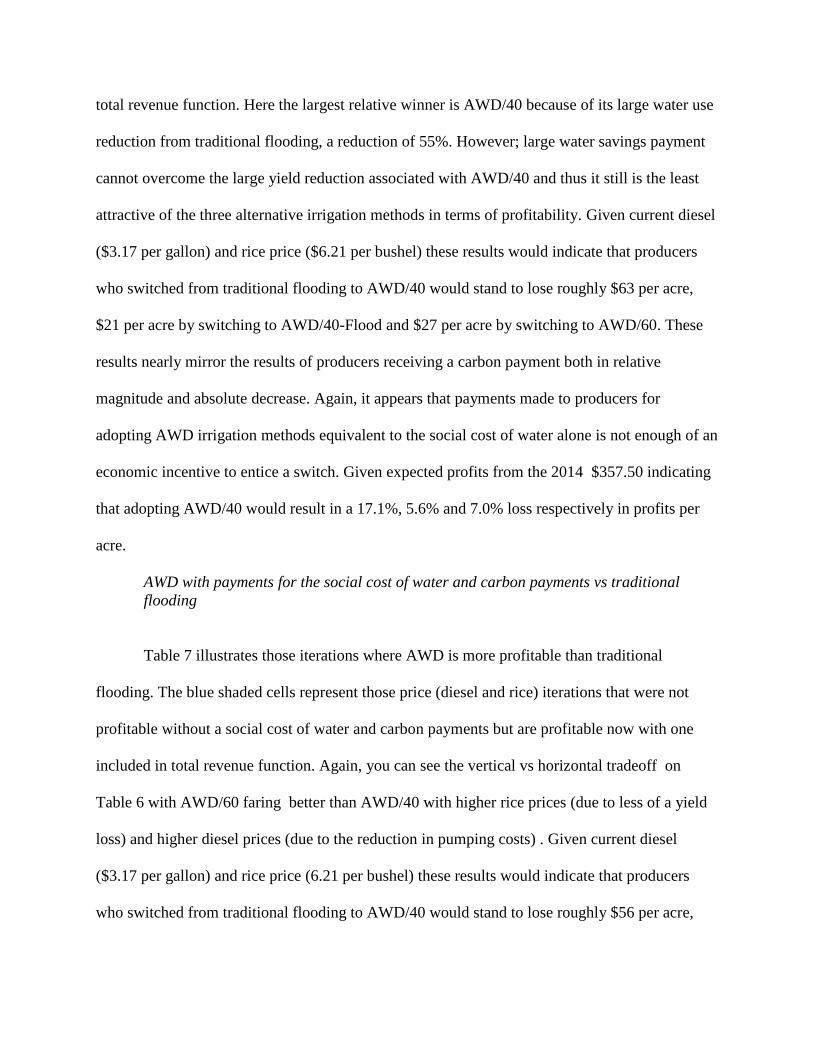
total revenue function. Here the largest relative winner is AWD/40 because of its large water use
reduction from traditional flooding, a reduction of 55%. However; large water savings payment
cannot overcome the large yield reduction associated with AWD/40 and thus it still is the least
attractive of the three alternative irrigation methods in terms of profitability. Given current diesel
($3.17 per gallon) and rice price ($6.21 per bushel) these results would indicate that producers
who switched from traditional flooding to AWD/40 would stand to lose roughly $63 per acre,
$21 per acre by switching to AWD/40-Flood and $27 per acre by switching to AWD/60. These
results nearly mirror the results of producers receiving a carbon payment both in relative
magnitude and absolute decrease. Again, it appears that payments made to producers for
adopting AWD irrigation methods equivalent to the social cost of water alone is not enough of an
economic incentive to entice a switch. Given expected profits from the 2014 $357.50 indicating
that adopting AWD/40 would result in a 17.1%, 5.6% and 7.0% loss respectively in profits per
acre.
AWD with payments for the social cost of water and carbon payments vs traditional
flooding
Table 7 illustrates those iterations where AWD is more profitable than traditional
flooding. The blue shaded cells represent those price (diesel and rice) iterations that were not
profitable without a social cost of water and carbon payments but are profitable now with one
included in total revenue function. Again, you can see the vertical vs horizontal tradeoff on
Table 6 with AWD/60 faring better than AWD/40 with higher rice prices (due to less of a yield
loss) and higher diesel prices (due to the reduction in pumping costs) . Given current diesel
($3.17 per gallon) and rice price (6.21 per bushel) these results would indicate that producers
who switched from traditional flooding to AWD/40 would stand to lose roughly $56 per acre,
$18 per acre by switching to AWD/40-Flood and $20 per acre by switching to AWD/60. Given
the expected hybrid profits per acre put forth by University of Arkansas Cooperative Extension
2014 Crop budgets of $357.50 adopting AWD/40 would result in a 15.7%, 5.0% and 5.6% loss
respectively in profits per acre. Again, even with the carbon and social cost of water payments
given to producers AWD looks to associated with a minimum of a 5% profit loss for producers.
That being said, this is appears to be well within a margin which a company such as MARS or
Kellogg’s could pay to source “sustainable rice”.
These results should also be considered static with the price of carbon which is
unrealistic. Carbon markets are currently thinly traded and thus few places to purchase offsets
and thus the sticky European carbon price of $5.91 per ton. That being said, the EPA predicted a
US carbon price between $10 and $30 per ton if the Waxman-Markey Bill would have passed in
2011 (US EPA, 2011). To put this in perspective, AWD/60 would be more profitable than
traditional flooding with a CO2e/ton price $27. Other caveats about this study are the pumping
depth used of 74.11 feet will only increase as the Alluvial aquifer falls. In many places in the
aquifer 100+ feet wells are not uncommon and thus AWD would look more attractive
Conclusions
Rice production in the United States is beginning to experience constraints on aquifer depletion
and increased demand from private industry to reduce GHG emissions associated with rice
production. This study investigates the potential economic viability of alternate wet dry (AWD)
irrigation in the Mid-South. AWD is an irrigation régime where the producer allows the rice field
to dry intermittently during the rice life-cycle rather than having the field continuously
submerged. In previous studies AWD has been found to reduce water usage by from 20-70% and
to reduce methane emissions by almost 50% as compared to rice produced under continuous
flooding. However; the large disadvantage of AWD is that it is often times associated with yield.
The results of the four scenarios (1) AWD vs traditional flooding; (2) AWD with carbon
payments vs traditional flooding; (3) AWD with social cost of water payments vs traditional
flooding; and (4) AWD with carbon payments and social cost of water payments vs. traditional
flooding offer conclusions relevant to rice industry and producer interests. Relative to traditional
flooding switching to AWD lowers producer profits from 7-20% based on which AWD régime is
chosen. Environmentally and economically beneficial outcomes are thus not profitable without
further economic incentives such as a carbon or water conservation payment. With the
introduction of carbon abatement payments for reducing methane and CO2 emissions producers
who adopt AWD would still stand to lose between 6-17% in profits compared to traditional
flooding. Nearly identical results are found when payments are made for water conservation.
That being said, when carbon abatement payments are made along with water conservation
payments (equivalent to a water usage tax for traditional flooding) profits decrease between only
5-15%. From a societal standpoint switching to AWD can reduce CO2e by over one ton per acre
which given that Arkansas alone has roughly one million acres of rice could play a major factor
in lowering agricultures global warming potential.
This study’s relevance depends on how rice consumers and buyers, like Kellogg’s and
MARS, incentivize “sustainable” rice production to producers. As it stands now, water
availability notwithstanding, there is no economic incentive based on this study’s results to
convert to AWD. That being said, given the large “green” push from consumers large companies
could incentive producers to switch to AWD by covering the roughly 5-7% loss associated with
AWD/60. In doing so producers should be indifferent between AWD and traditional flooding
and large rice buyers can market their product as reducing on farm GHG emissions by over 50%
and water usage by roughly the same amount. This study also has relevance given the increased
regulatory demand regarding water. In Arkansas where the price of an acre inch of water is
equivalent to the cost of diesel fuel needed to raise it, AWD could become much more popular if
water rights/taxes are assigned.
Implications of this study for future research stem primarily from the assumptions used in
building economic model. The assumption of constant water depth across the Delta in the
Alluvial aquifer precludes any discussion about the high variability of depths and the reality that
the aquifer will only continue to be depleted making the economic and social cost of AWD more
attractive. Experimental generation of more data on cultivar specific and other thresholds for
AWD will allow future studies to incorporate GHG emissions uncertainty to stochastic analyses
of carbon abatement.
References
Arkansas Natural Resources Commission (ANRC). “Arkansas Groundwater Protection and
Management Report for 2012: A Supplement to the Arkansas Water Plan.” Little Rock,
Arkansas. 2013.
Bennett, David. "California Rice Project to Strengthen Carbon Credit Market?" Western Farm
Press, 30 June 2011. Web. 08 Aug. 2011. <http://westernfarmpress.com/rice/california-
rice-project-strengthen-carbon-credit-market?page=4>.
Bouman, B., R. Lampayan and T. Toung. 2007. “Water Management in Irrigated Rice: Coping
with Water Scarcity” Los Banos, the Philippines: International Rice Research Institute.
Bouman, B. and T. Toung. Field Water Management to Save Water and Increase its Productivity
in Irrigated Lowland Rice. Agricultural Water Management (2001): 1615:1-20.
Hardke, J. and C. Wilson “Trends in Arkansas Rice Production” B.R. Wells Rice Research
Studies 2012
Hogan, R., S. Stiles, P. Tacker, E. Vories, and K. J. Bryant. 2007. Estimating irrigation costs.
Little Rock, Ark.: Ark. Coop. Ext. Serv. FSA28-PD-6-07RV. Available at:
www.uaex.edu/Other_ Areas/ publications/pdf/FSA-28.pdf.
Great Pacific Trading Company (GPTC). “Charts and Quotes.” Internet site:
http://www.gptc.com/quotes.html (Accessed November 2012).
Guerra, L. S. Bhuiyan, T. Tuong and R. Barker. Producing More Rice with Less Water from
Irrigated Systems. SWIM Paper 5, Colombo, Sri Lanka, International Water Management
Institute (IWMI). 1998
Lampayan RM. 2012. Water Saving Work Group. Development, dissemination, and adoption of
technologies to help farmers cope with water scarcity. Presentation at the Meta-Impact
Assessment Inception Meeting, IRRI, Los Baños, Philippines.
Lyman, N. and L. Nalley. "Incentivizing Net GHG Emissions Reductions in Rice Production: The
Case of Arkansas Rice". Journal of Agricultural and Applied Economics. 45, 1(2013):
171-185.
Mars. ‘‘Global Expert Joins Mars Food to Accelerate Scientific Advances in Rice Sustainability
and Nutrition.’’ 2011. Internet site: www.mars.com/global/press-center/press-
list/newsreleases.aspx?SiteId=94&Id=2822 (Accessed, 2013).
McCauley, G. N. 1990. Sprinkler vs. flood irrigation in traditional rice production regions of
southeast Texas. Agron. J. 82(4): 677-683.
McFadden, B., L. Nalley and M. Popp. "How Greenhouse Gas Emission Policy and Industry
Pressure Could Affect Producer Selection of Rice Cultivars. Agricultural and
Resource Economics Review 42(2):1-13. 2013
National Oceanic and Atmospheric Administration (NOAA). National Climatic Data Center.
“Climate Data Online: Search Tool.” Internet site: http://www.ncdc.noaa.gov/cdo-
web/search?datasetid=GHCNDMS (Accessed October 2013).
Schultz, B. (March 2, 2011) Delta Farm Press. Internet site: http://deltafarmpress.com/rice/
sustainability-rice-farming-lsu-agcenter-kelloggco-collaborate (Accessed 2013).
SimaPro 7.1. Life Cycle Assessment Software, Pré Consultants, Amersfoort, The
Netherlands, 2009.
Slaton, Nathan. “Rice Production Handbook.” The University of Arkansas Cooperative
Extension Service. Little Rock, Arkansas, 2001.
Tsur, Y. 1990. “The Stabilization Role of Groundwater when Surface Water Supplies are
Uncertain: The Implications for Groundwater Development.” Water Resources Research
26 (5): 811-818.
UN FAO. 2010. Climate-smart Agriculture Policies: Practices and Financing for Food Security,
Adaptation and Mitigation. Food and Agriculture Organization. Rome, Italy.
U.S. Army Corps of Engineers. 2000. Grand Prairie Area Demonstration Project. Available at:
www.mvm.usace.army. mil/grandprairie/overview/default.asp. Accessed January 2012.
United States Environmental Protection Agency (EPA). “Overview of Greenhouse Gases” As
accessed at http://epa.gov/climatechange/ghgemissions/gases/ch4.html.
United States Environmental Protection Agency (EPA). 2011. EPA Preliminary Analysis of the
Waxman-Markey Discussion Draft: The Clean Energy and Security Act of 2009 in the
111th
Congress.” Washington, DC: U.S. Environmental Protection Agency, 2011.
USDA-ARS. 2011”Growing Crops and Saving Water in the West” Water Availability and
Watershed Management, an ARS national program (#211).” As accessed at
http://www.ars.usda.gov/is/AR/archive/aug11/water0811.htm. Accessed January 2014.
USDA-NASS. 2010. Quick Stats. Washington, D.C.: USDA National Agricultural Statistics
Service. Available at: www.nass.usda.gov/.
University of Arkansas - Division of Agriculture. “2012 Crop and Enterprise Budgets.” Little
Rock, AR: AG-1272. 2012. Internet site:
http://www.uaex.edu/depts/ag_economics/budgets/2012/Budgets2012.pdf (Accessed
July 2013).
Van der Hoek,W.; R. Sakthivadivel; M. Renshaw; J. B. Silver; M. H. Birley;
F. Konradsen. 2001. Alternate wet/dry irrigation in rice cultivation: A practical way to
save water and control malaria and Japanese encephalitis? Research Report 47.
Colombo, Sri Lanka: International Water Management Institute.
Vories, E. D., P. A. Counce, and T. C. Keisling. 2002. Comparison of flooded and furrow-
irrigated rice on clay. Irrig. Sci. 21(3): 139-144
Wassmann, R., Y. Hosen and K. Sumfleth. “Agriculture and Climate Change: An Agenda for
Negotiation in Copenhagen”. International Rice Research Institute Focus 16, Brief 3.
May 2009.
Westcott, M. P., and K. W. Vines. 1986. A comparison of sprinkler and flood irrigation for rice.
Agron. J. 78(4): 637-640
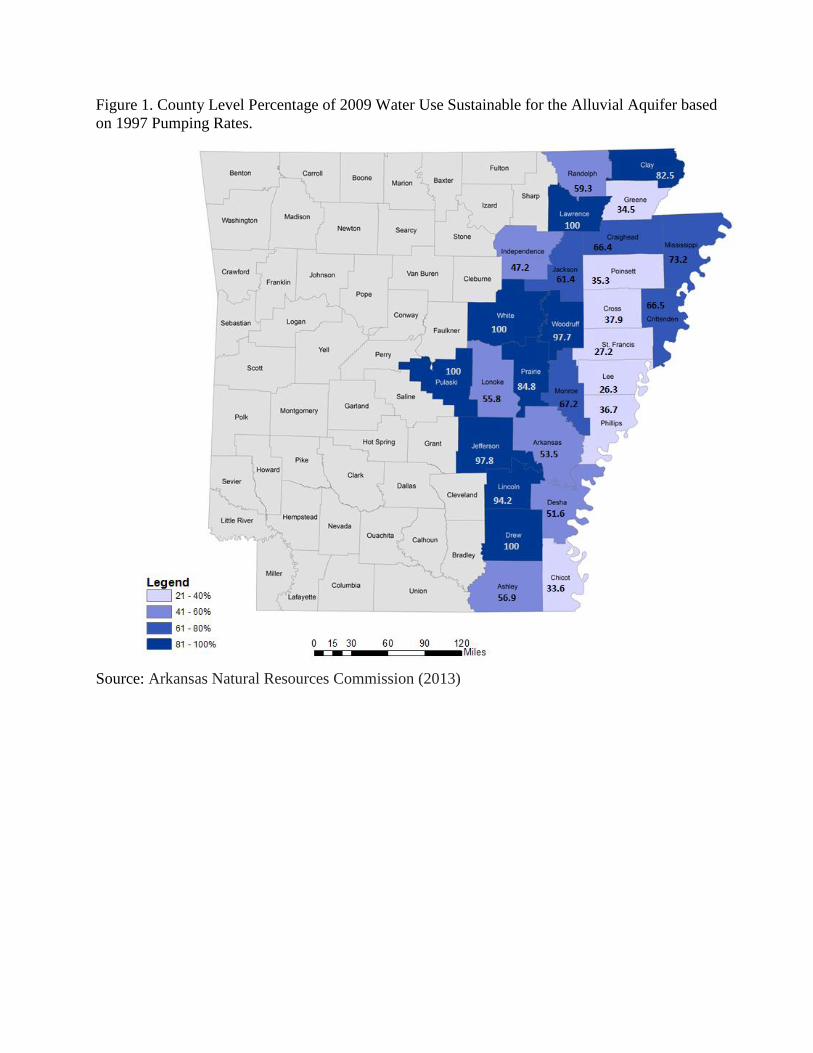
Figure 1. County Level Percentage of 2009 Water Use Sustainable for the Alluvial Aquifer based
on 1997 Pumping Rates.
Source: Arkansas Natural Resources Commission (2013)
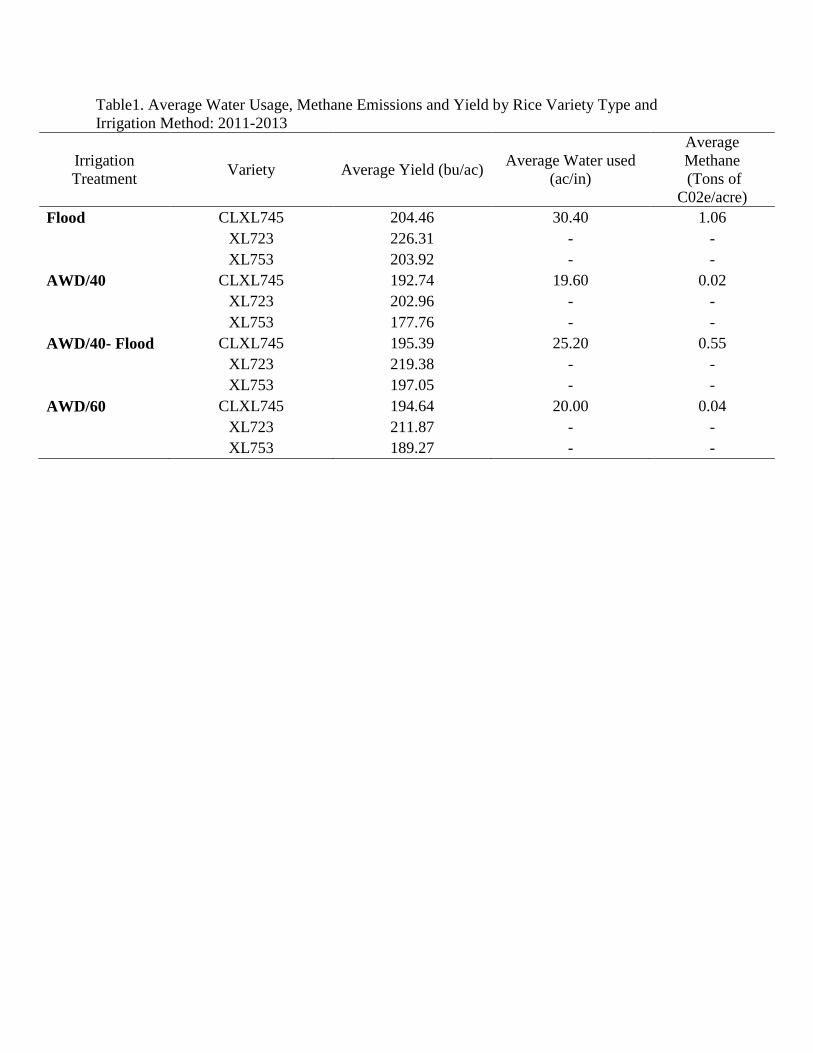
Table1. Average Water Usage, Methane Emissions and Yield by Rice Variety Type and
Irrigation Method: 2011-2013
Irrigation
Treatment Variety Average Yield (bu/ac)
Average Water used
(ac/in)
Average
Methane
(Tons of
C02e/acre)
Flood CLXL745 204.46 30.40 1.06
XL723 226.31 - -
XL753 203.92 - -
AWD/40 CLXL745 192.74 19.60 0.02
XL723 202.96 - -
XL753 177.76 - -
AWD/40- Flood CLXL745 195.39 25.20 0.55
XL723 219.38 - -
XL753 197.05 - -
AWD/60 CLXL745 194.64 20.00 0.04
XL723 211.87 - -
XL753 189.27 - -
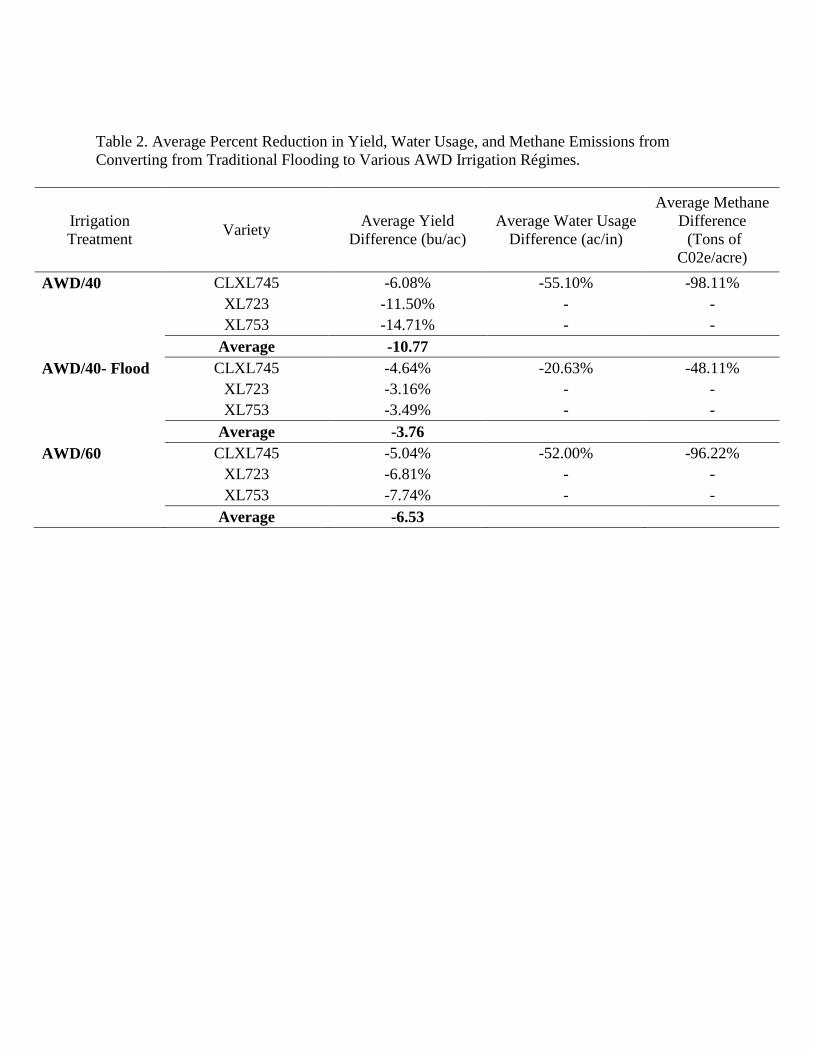
Table 2. Average Percent Reduction in Yield, Water Usage, and Methane Emissions from
Converting from Traditional Flooding to Various AWD Irrigation Régimes.
Irrigation
Treatment Variety
Average Yield
Difference (bu/ac)
Average Water Usage
Difference (ac/in)
Average Methane
Difference
(Tons of
C02e/acre)
AWD/40 CLXL745 -6.08% -55.10% -98.11%
XL723 -11.50% - -
XL753 -14.71% - -
Average -10.77
AWD/40- Flood CLXL745 -4.64% -20.63% -48.11%
XL723 -3.16% - -
XL753 -3.49% - -
Average -3.76
AWD/60 CLXL745 -5.04% -52.00% -96.22%
XL723 -6.81% - -
XL753 -7.74% - -
Average -6.53
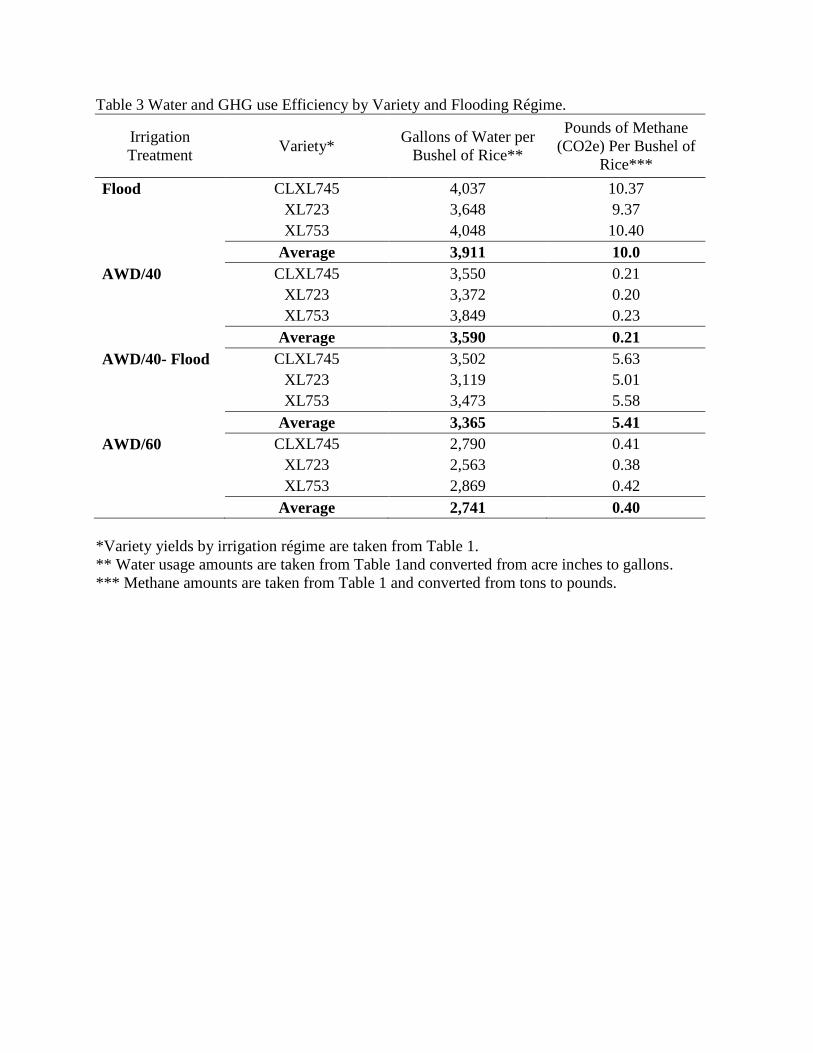
Table 3 Water and GHG use Efficiency by Variety and Flooding Régime.
Irrigation
Treatment Variety*
Gallons of Water per
Bushel of Rice**
Pounds of Methane
(CO2e) Per Bushel of
Rice***
Flood CLXL745 4,037 10.37
XL723 3,648 9.37
XL753 4,048 10.40
Average 3,911 10.0
AWD/40 CLXL745 3,550 0.21
XL723 3,372 0.20
XL753 3,849 0.23
Average 3,590 0.21
AWD/40- Flood CLXL745 3,502 5.63
XL723 3,119 5.01
XL753 3,473 5.58
Average 3,365 5.41
AWD/60 CLXL745 2,790 0.41
XL723 2,563 0.38
XL753 2,869 0.42
Average 2,741 0.40
*Variety yields by irrigation régime are taken from Table 1.
** Water usage amounts are taken from Table 1and converted from acre inches to gallons.
*** Methane amounts are taken from Table 1 and converted from tons to pounds.
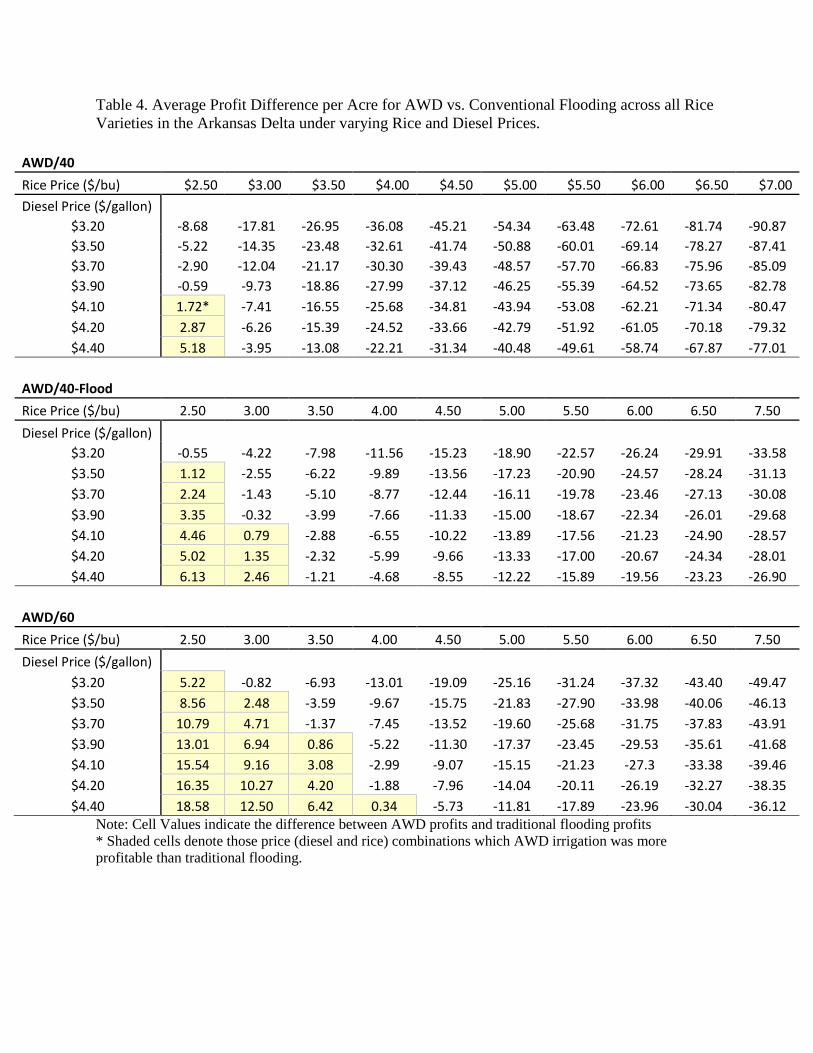
Table 4. Average Profit Difference per Acre for AWD vs. Conventional Flooding across all Rice
Varieties in the Arkansas Delta under varying Rice and Diesel Prices.
AWD/40 Rice Price ($/bu) $2.50 $3.00 $3.50 $4.00 $4.50 $5.00 $5.50 $6.00 $6.50 $7.00
Diesel Price ($/gallon)
$3.20 -8.68 -17.81 -26.95 -36.08 -45.21 -54.34 -63.48 -72.61 -81.74 -90.87
$3.50 -5.22 -14.35 -23.48 -32.61 -41.74 -50.88 -60.01 -69.14 -78.27 -87.41
$3.70 -2.90 -12.04 -21.17 -30.30 -39.43 -48.57 -57.70 -66.83 -75.96 -85.09
$3.90 -0.59 -9.73 -18.86 -27.99 -37.12 -46.25 -55.39 -64.52 -73.65 -82.78
$4.10 1.72* -7.41 -16.55 -25.68 -34.81 -43.94 -53.08 -62.21 -71.34 -80.47
$4.20 2.87 -6.26 -15.39 -24.52 -33.66 -42.79 -51.92 -61.05 -70.18 -79.32
$4.40 5.18 -3.95 -13.08 -22.21 -31.34 -40.48 -49.61 -58.74 -67.87 -77.01
AWD/40-Flood
Rice Price ($/bu) 2.50 3.00 3.50 4.00 4.50 5.00 5.50 6.00 6.50 7.50
Diesel Price ($/gallon)
$3.20 -0.55 -4.22 -7.98 -11.56 -15.23 -18.90 -22.57 -26.24 -29.91 -33.58
$3.50 1.12 -2.55 -6.22 -9.89 -13.56 -17.23 -20.90 -24.57 -28.24 -31.13
$3.70 2.24 -1.43 -5.10 -8.77 -12.44 -16.11 -19.78 -23.46 -27.13 -30.08
$3.90 3.35 -0.32 -3.99 -7.66 -11.33 -15.00 -18.67 -22.34 -26.01 -29.68
$4.10 4.46 0.79 -2.88 -6.55 -10.22 -13.89 -17.56 -21.23 -24.90 -28.57
$4.20 5.02 1.35 -2.32 -5.99 -9.66 -13.33 -17.00 -20.67 -24.34 -28.01
$4.40 6.13 2.46 -1.21 -4.68 -8.55 -12.22 -15.89 -19.56 -23.23 -26.90
AWD/60
Rice Price ($/bu) 2.50 3.00 3.50 4.00 4.50 5.00 5.50 6.00 6.50 7.50
Diesel Price ($/gallon)
$3.20 5.22 -0.82 -6.93 -13.01 -19.09 -25.16 -31.24 -37.32 -43.40 -49.47
$3.50 8.56 2.48 -3.59 -9.67 -15.75 -21.83 -27.90 -33.98 -40.06 -46.13
$3.70 10.79 4.71 -1.37 -7.45 -13.52 -19.60 -25.68 -31.75 -37.83 -43.91
$3.90 13.01 6.94 0.86 -5.22 -11.30 -17.37 -23.45 -29.53 -35.61 -41.68
$4.10 15.54 9.16 3.08 -2.99 -9.07 -15.15 -21.23 -27.3 -33.38 -39.46
$4.20 16.35 10.27 4.20 -1.88 -7.96 -14.04 -20.11 -26.19 -32.27 -38.35
$4.40 18.58 12.50 6.42 0.34 -5.73 -11.81 -17.89 -23.96 -30.04 -36.12 Note: Cell Values indicate the difference between AWD profits and traditional flooding profits
* Shaded cells denote those price (diesel and rice) combinations which AWD irrigation was more
profitable than traditional flooding.
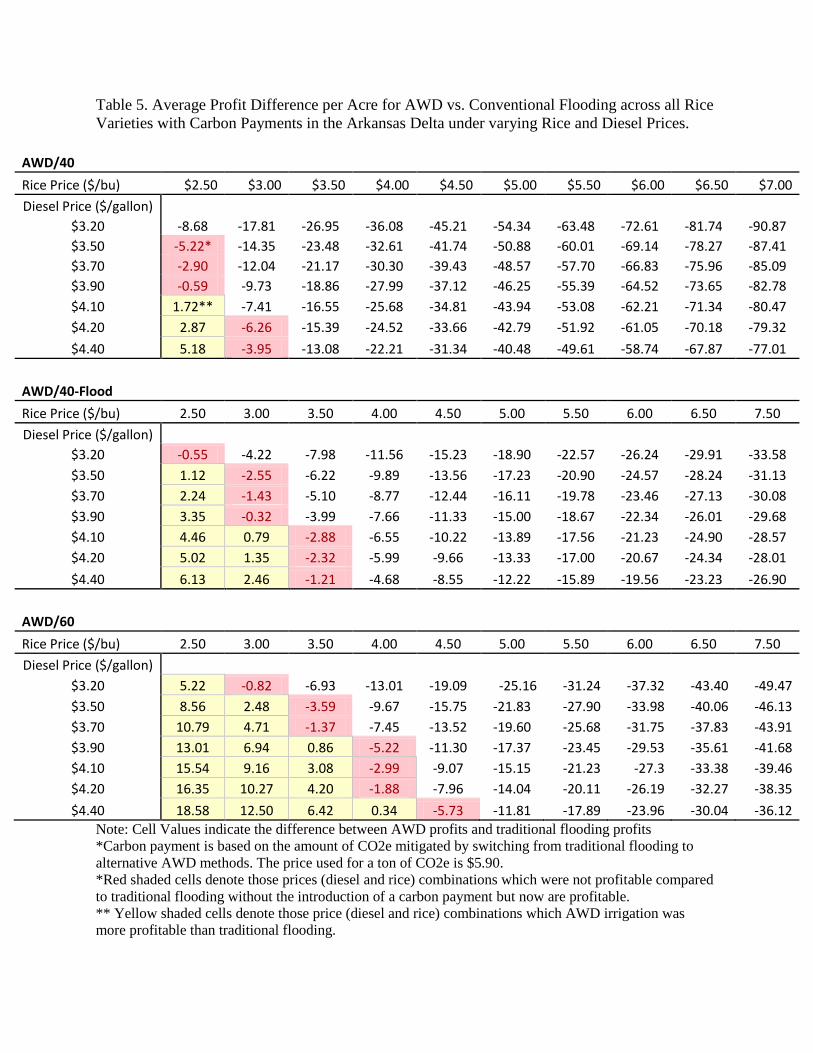
Table 5. Average Profit Difference per Acre for AWD vs. Conventional Flooding across all Rice
Varieties with Carbon Payments in the Arkansas Delta under varying Rice and Diesel Prices.
AWD/40
Rice Price ($/bu) $2.50 $3.00 $3.50 $4.00 $4.50 $5.00 $5.50 $6.00 $6.50 $7.00
Diesel Price ($/gallon)
$3.20 -8.68 -17.81 -26.95 -36.08 -45.21 -54.34 -63.48 -72.61 -81.74 -90.87
$3.50 -5.22* -14.35 -23.48 -32.61 -41.74 -50.88 -60.01 -69.14 -78.27 -87.41
$3.70 -2.90 -12.04 -21.17 -30.30 -39.43 -48.57 -57.70 -66.83 -75.96 -85.09
$3.90 -0.59 -9.73 -18.86 -27.99 -37.12 -46.25 -55.39 -64.52 -73.65 -82.78
$4.10 1.72** -7.41 -16.55 -25.68 -34.81 -43.94 -53.08 -62.21 -71.34 -80.47
$4.20 2.87 -6.26 -15.39 -24.52 -33.66 -42.79 -51.92 -61.05 -70.18 -79.32
$4.40 5.18 -3.95 -13.08 -22.21 -31.34 -40.48 -49.61 -58.74 -67.87 -77.01
AWD/40-Flood
Rice Price ($/bu) 2.50 3.00 3.50 4.00 4.50 5.00 5.50 6.00 6.50 7.50
Diesel Price ($/gallon)
$3.20 -0.55 -4.22 -7.98 -11.56 -15.23 -18.90 -22.57 -26.24 -29.91 -33.58
$3.50 1.12 -2.55 -6.22 -9.89 -13.56 -17.23 -20.90 -24.57 -28.24 -31.13
$3.70 2.24 -1.43 -5.10 -8.77 -12.44 -16.11 -19.78 -23.46 -27.13 -30.08
$3.90 3.35 -0.32 -3.99 -7.66 -11.33 -15.00 -18.67 -22.34 -26.01 -29.68
$4.10 4.46 0.79 -2.88 -6.55 -10.22 -13.89 -17.56 -21.23 -24.90 -28.57
$4.20 5.02 1.35 -2.32 -5.99 -9.66 -13.33 -17.00 -20.67 -24.34 -28.01
$4.40 6.13 2.46 -1.21 -4.68 -8.55 -12.22 -15.89 -19.56 -23.23 -26.90
AWD/60
Rice Price ($/bu) 2.50 3.00 3.50 4.00 4.50 5.00 5.50 6.00 6.50 7.50
Diesel Price ($/gallon)
$3.20 5.22 -0.82 -6.93 -13.01 -19.09 -25.16 -31.24 -37.32 -43.40 -49.47
$3.50 8.56 2.48 -3.59 -9.67 -15.75 -21.83 -27.90 -33.98 -40.06 -46.13
$3.70 10.79 4.71 -1.37 -7.45 -13.52 -19.60 -25.68 -31.75 -37.83 -43.91
$3.90 13.01 6.94 0.86 -5.22 -11.30 -17.37 -23.45 -29.53 -35.61 -41.68
$4.10 15.54 9.16 3.08 -2.99 -9.07 -15.15 -21.23 -27.3 -33.38 -39.46
$4.20 16.35 10.27 4.20 -1.88 -7.96 -14.04 -20.11 -26.19 -32.27 -38.35
$4.40 18.58 12.50 6.42 0.34 -5.73 -11.81 -17.89 -23.96 -30.04 -36.12
Note: Cell Values indicate the difference between AWD profits and traditional flooding profits
*Carbon payment is based on the amount of CO2e mitigated by switching from traditional flooding to
alternative AWD methods. The price used for a ton of CO2e is $5.90.
*Red shaded cells denote those prices (diesel and rice) combinations which were not profitable compared
to traditional flooding without the introduction of a carbon payment but now are profitable.
** Yellow shaded cells denote those price (diesel and rice) combinations which AWD irrigation was
more profitable than traditional flooding.
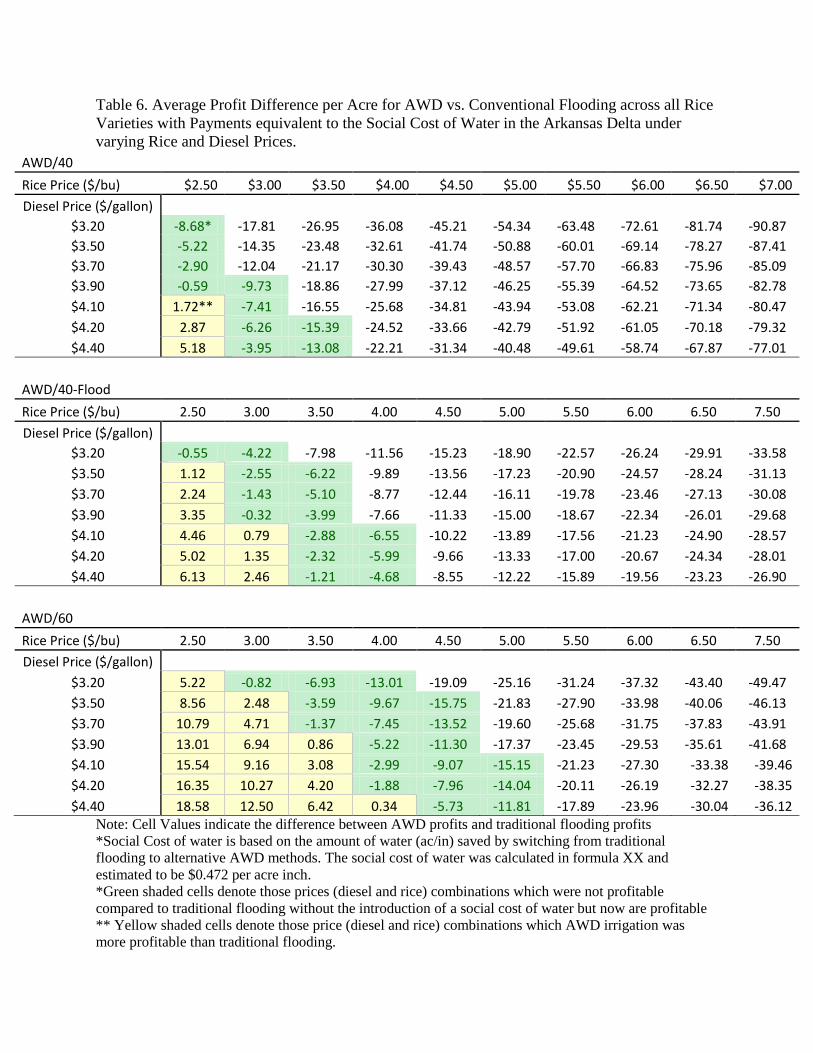
Table 6. Average Profit Difference per Acre for AWD vs. Conventional Flooding across all Rice
Varieties with Payments equivalent to the Social Cost of Water in the Arkansas Delta under
varying Rice and Diesel Prices.
AWD/40
Rice Price ($/bu) $2.50 $3.00 $3.50 $4.00 $4.50 $5.00 $5.50 $6.00 $6.50 $7.00
Diesel Price ($/gallon)
$3.20 -8.68* -17.81 -26.95 -36.08 -45.21 -54.34 -63.48 -72.61 -81.74 -90.87
$3.50 -5.22 -14.35 -23.48 -32.61 -41.74 -50.88 -60.01 -69.14 -78.27 -87.41
$3.70 -2.90 -12.04 -21.17 -30.30 -39.43 -48.57 -57.70 -66.83 -75.96 -85.09
$3.90 -0.59 -9.73 -18.86 -27.99 -37.12 -46.25 -55.39 -64.52 -73.65 -82.78
$4.10 1.72** -7.41 -16.55 -25.68 -34.81 -43.94 -53.08 -62.21 -71.34 -80.47
$4.20 2.87 -6.26 -15.39 -24.52 -33.66 -42.79 -51.92 -61.05 -70.18 -79.32
$4.40 5.18 -3.95 -13.08 -22.21 -31.34 -40.48 -49.61 -58.74 -67.87 -77.01
AWD/40-Flood
Rice Price ($/bu) 2.50 3.00 3.50 4.00 4.50 5.00 5.50 6.00 6.50 7.50
Diesel Price ($/gallon)
$3.20 -0.55 -4.22 -7.98 -11.56 -15.23 -18.90 -22.57 -26.24 -29.91 -33.58
$3.50 1.12 -2.55 -6.22 -9.89 -13.56 -17.23 -20.90 -24.57 -28.24 -31.13
$3.70 2.24 -1.43 -5.10 -8.77 -12.44 -16.11 -19.78 -23.46 -27.13 -30.08
$3.90 3.35 -0.32 -3.99 -7.66 -11.33 -15.00 -18.67 -22.34 -26.01 -29.68
$4.10 4.46 0.79 -2.88 -6.55 -10.22 -13.89 -17.56 -21.23 -24.90 -28.57
$4.20 5.02 1.35 -2.32 -5.99 -9.66 -13.33 -17.00 -20.67 -24.34 -28.01
$4.40 6.13 2.46 -1.21 -4.68 -8.55 -12.22 -15.89 -19.56 -23.23 -26.90
AWD/60
Rice Price ($/bu) 2.50 3.00 3.50 4.00 4.50 5.00 5.50 6.00 6.50 7.50
Diesel Price ($/gallon)
$3.20 5.22 -0.82 -6.93 -13.01 -19.09 -25.16 -31.24 -37.32 -43.40 -49.47
$3.50 8.56 2.48 -3.59 -9.67 -15.75 -21.83 -27.90 -33.98 -40.06 -46.13
$3.70 10.79 4.71 -1.37 -7.45 -13.52 -19.60 -25.68 -31.75 -37.83 -43.91
$3.90 13.01 6.94 0.86 -5.22 -11.30 -17.37 -23.45 -29.53 -35.61 -41.68
$4.10 15.54 9.16 3.08 -2.99 -9.07 -15.15 -21.23 -27.30 -33.38 -39.46
$4.20 16.35 10.27 4.20 -1.88 -7.96 -14.04 -20.11 -26.19 -32.27 -38.35
$4.40 18.58 12.50 6.42 0.34 -5.73 -11.81 -17.89 -23.96 -30.04 -36.12 Note: Cell Values indicate the difference between AWD profits and traditional flooding profits
*Social Cost of water is based on the amount of water (ac/in) saved by switching from traditional
flooding to alternative AWD methods. The social cost of water was calculated in formula XX and
estimated to be $0.472 per acre inch.
*Green shaded cells denote those prices (diesel and rice) combinations which were not profitable
compared to traditional flooding without the introduction of a social cost of water but now are profitable
** Yellow shaded cells denote those price (diesel and rice) combinations which AWD irrigation was
more profitable than traditional flooding.
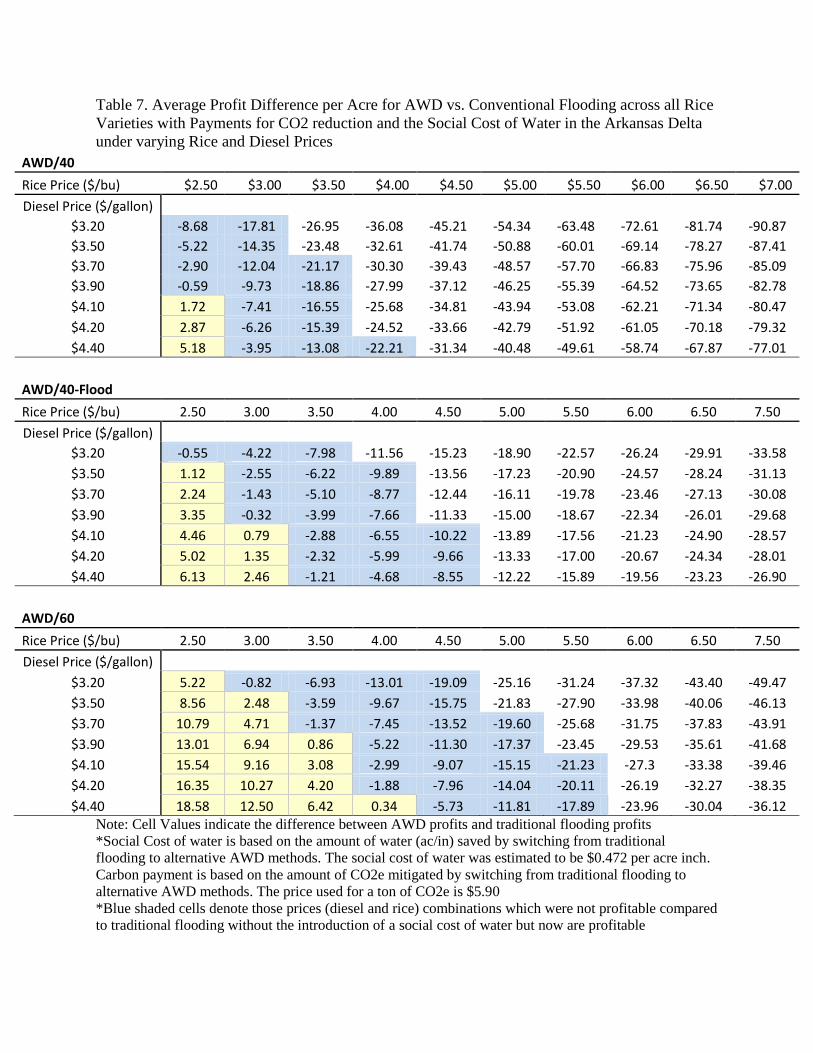
Table 7. Average Profit Difference per Acre for AWD vs. Conventional Flooding across all Rice
Varieties with Payments for CO2 reduction and the Social Cost of Water in the Arkansas Delta
under varying Rice and Diesel Prices
AWD/40
Rice Price ($/bu) $2.50 $3.00 $3.50 $4.00 $4.50 $5.00 $5.50 $6.00 $6.50 $7.00
Diesel Price ($/gallon) $3.20 -8.68 -17.81 -26.95 -36.08 -45.21 -54.34 -63.48 -72.61 -81.74 -90.87
$3.50 -5.22 -14.35 -23.48 -32.61 -41.74 -50.88 -60.01 -69.14 -78.27 -87.41
$3.70 -2.90 -12.04 -21.17 -30.30 -39.43 -48.57 -57.70 -66.83 -75.96 -85.09
$3.90 -0.59 -9.73 -18.86 -27.99 -37.12 -46.25 -55.39 -64.52 -73.65 -82.78
$4.10 1.72 -7.41 -16.55 -25.68 -34.81 -43.94 -53.08 -62.21 -71.34 -80.47
$4.20 2.87 -6.26 -15.39 -24.52 -33.66 -42.79 -51.92 -61.05 -70.18 -79.32
$4.40 5.18 -3.95 -13.08 -22.21 -31.34 -40.48 -49.61 -58.74 -67.87 -77.01
AWD/40-Flood
Rice Price ($/bu) 2.50 3.00 3.50 4.00 4.50 5.00 5.50 6.00 6.50 7.50
Diesel Price ($/gallon)
$3.20 -0.55 -4.22 -7.98 -11.56 -15.23 -18.90 -22.57 -26.24 -29.91 -33.58
$3.50 1.12 -2.55 -6.22 -9.89 -13.56 -17.23 -20.90 -24.57 -28.24 -31.13
$3.70 2.24 -1.43 -5.10 -8.77 -12.44 -16.11 -19.78 -23.46 -27.13 -30.08
$3.90 3.35 -0.32 -3.99 -7.66 -11.33 -15.00 -18.67 -22.34 -26.01 -29.68
$4.10 4.46 0.79 -2.88 -6.55 -10.22 -13.89 -17.56 -21.23 -24.90 -28.57
$4.20 5.02 1.35 -2.32 -5.99 -9.66 -13.33 -17.00 -20.67 -24.34 -28.01
$4.40 6.13 2.46 -1.21 -4.68 -8.55 -12.22 -15.89 -19.56 -23.23 -26.90
AWD/60
Rice Price ($/bu) 2.50 3.00 3.50 4.00 4.50 5.00 5.50 6.00 6.50 7.50
Diesel Price ($/gallon) $3.20 5.22 -0.82 -6.93 -13.01 -19.09 -25.16 -31.24 -37.32 -43.40 -49.47
$3.50 8.56 2.48 -3.59 -9.67 -15.75 -21.83 -27.90 -33.98 -40.06 -46.13
$3.70 10.79 4.71 -1.37 -7.45 -13.52 -19.60 -25.68 -31.75 -37.83 -43.91
$3.90 13.01 6.94 0.86 -5.22 -11.30 -17.37 -23.45 -29.53 -35.61 -41.68
$4.10 15.54 9.16 3.08 -2.99 -9.07 -15.15 -21.23 -27.3 -33.38 -39.46
$4.20 16.35 10.27 4.20 -1.88 -7.96 -14.04 -20.11 -26.19 -32.27 -38.35
$4.40 18.58 12.50 6.42 0.34 -5.73 -11.81 -17.89 -23.96 -30.04 -36.12 Note: Cell Values indicate the difference between AWD profits and traditional flooding profits
*Social Cost of water is based on the amount of water (ac/in) saved by switching from traditional
flooding to alternative AWD methods. The social cost of water was estimated to be $0.472 per acre inch.
Carbon payment is based on the amount of CO2e mitigated by switching from traditional flooding to
alternative AWD methods. The price used for a ton of CO2e is $5.90
*Blue shaded cells denote those prices (diesel and rice) combinations which were not profitable compared
to traditional flooding without the introduction of a social cost of water but now are profitable

** Yellow shaded cells denote those price (diesel and rice) combinations which AWD irrigation was
more profitable than traditional flooding.


![AWD Profiles [Compatibility Mode]](https://img.pdfslide.us/doc/110x75/577dad331a28ab223f8ee62f/awd-profiles-compatibility-mode.jpg)