Embed Size (px)
Citation preview
THE ECONOMIC USE OF EPO PATENTS:
EVIDENCE FROM THE PATVAL
SURVEYS
Salvatore Torrisi
University of Bologna
Conference on Patent Use, September 9 2013, Big Innovation Center, London, IPO, Brunel University and ESRC
7/22/2013 Salvatore Torrisi 1
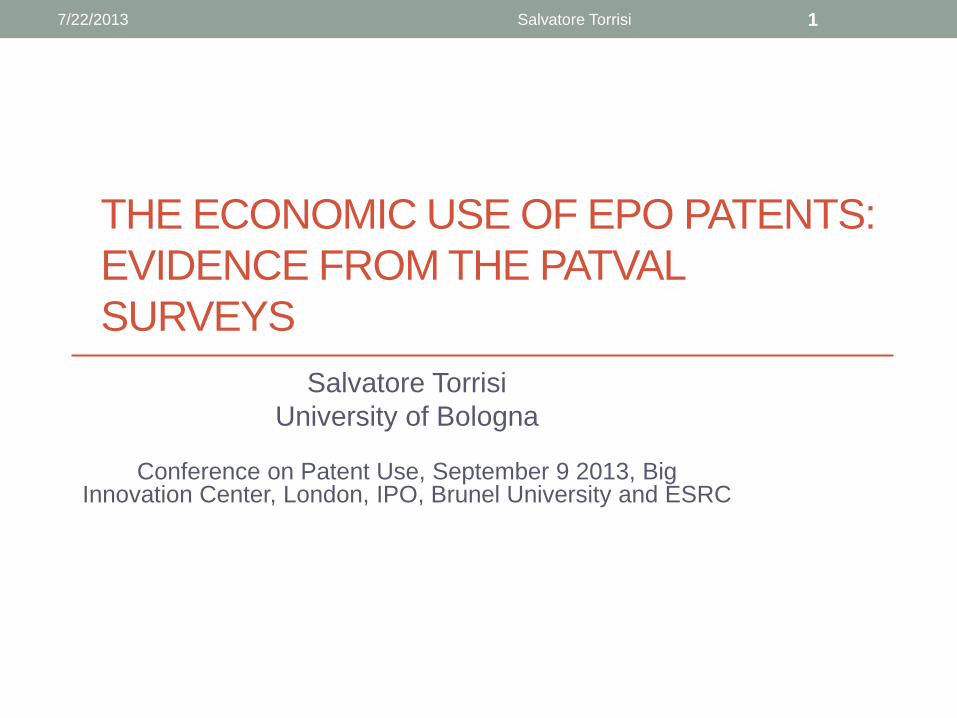
Aims
• How are EPO patents used in different countries,
technological fields, organizations? • Commercial use in manufacturing processes, products etc.; Sale;
Licensing; Foundation of a new company
• What patent, technological and organizational
characteristics are associated with different uses?
• What patent, technological, organizational characteristics
are associated with unused patents?
• Evidence from two surveys: Patval-EU and Patval EU-II,
US, Japan and Israel (InnoS&T 7FP Project)
7/22/2013 Salvatore Torrisi 2
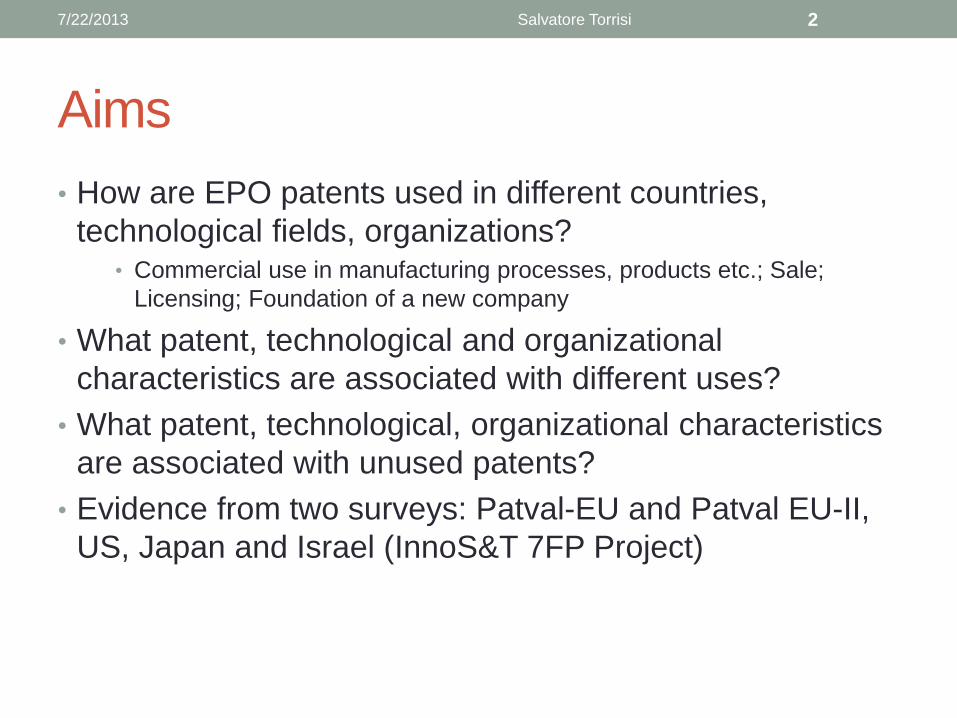
Outline of the presentation
• Comparison between the two surveys
• A focus on commercial use vs. external use
(licensing/sale)
• A focus on PatVal II
• Discussion and policy implications
7/22/2013 Salvatore Torrisi 3
Patent uses
• Typical patent uses: direct, commercial use in new
products/processes and technology trade (licensing, sale)
• Limitations to direct use: low value, high development costs,
lack of complementary assets and limited opportunities to
exploit economies of scale (SMEs) (Serrano, 2008)
• Limitations to trade: low value, transaction costs (Arora et al.
2001; Gans&Stern, 2003)
• Transaction costs are particularly high in complex, cumulative
technologies (Heller and Eisenberg 1998; Shapiro, 2000;
Cohen et al. 2002)
• Patent valorization in new goods and services is also limited by
the strategic use of patents (e.g. blocking patents)
7/22/2013 Salvatore Torrisi 4
PatVal-EU
• EPO granted patents with priority 1993-1997
• First inventor listed in the patent document was located in
one of these countries: DE, ES, FR, IT, NL, UK, DK and
HU
• 27,531 inventors contacted, 9,017 respondents (32.8%
response rate)
• Survey period: May 2003 - January 2004
• 43.2% patents were either opposed or cited vs. 28.5%
share in the population of EU8 patents with the same
priority date (Giuri et al. 2007)
7/22/2013 Salvatore Torrisi 5
Patval EU-II, US, Japan and Israel
• EPO patent applications with priority 2003-2005
• 124,134 questionnaires to inventors of EPO patents
located in 20 European countries (Patval EU-I+
Switzerland, Sweden, Finland, Belgium, Austria, Norway,
Ireland, Greece, Slovenia, Czech Republic, Poland, and
Luxembourg), US, Japan and Israel.
• 23,044 responses (19% response rate)
• Random sampling
• Survey period: November 2010- Sept 2011
• (Gambardella et al. 2012)
7/22/2013 Salvatore Torrisi 6
Comparing Patval I and Patval II
• Both surveys: Poststratification to account for both
nonresponse and underrepresented groups in the
population.
• Comparison based on 8 countries common to PatVal I
and all PatValI and granted patents
• Analysis extended to all patents (granted and not
granted), same countries
7/22/2013 Salvatore Torrisi 7
Commercial use
• The share of patents used in new products/processes is smaller in PatVal2 than in PatVal1 sample – from about 60% to 57.5%
• The share of patents whose commercial use is still under consideration increased from 16.5% to 24.2%.
• The most remarkable decline occurred to French patents (from 72.5% to 38.4%).
• The share of German and British patents used commercially remained stable between the two surveys.
• The share of Dutch and Italian patents used commercially has increased.
• When all patents are considered, the share of patents used in new products/processes drops to about 53%
7/22/2013 Salvatore Torrisi 8
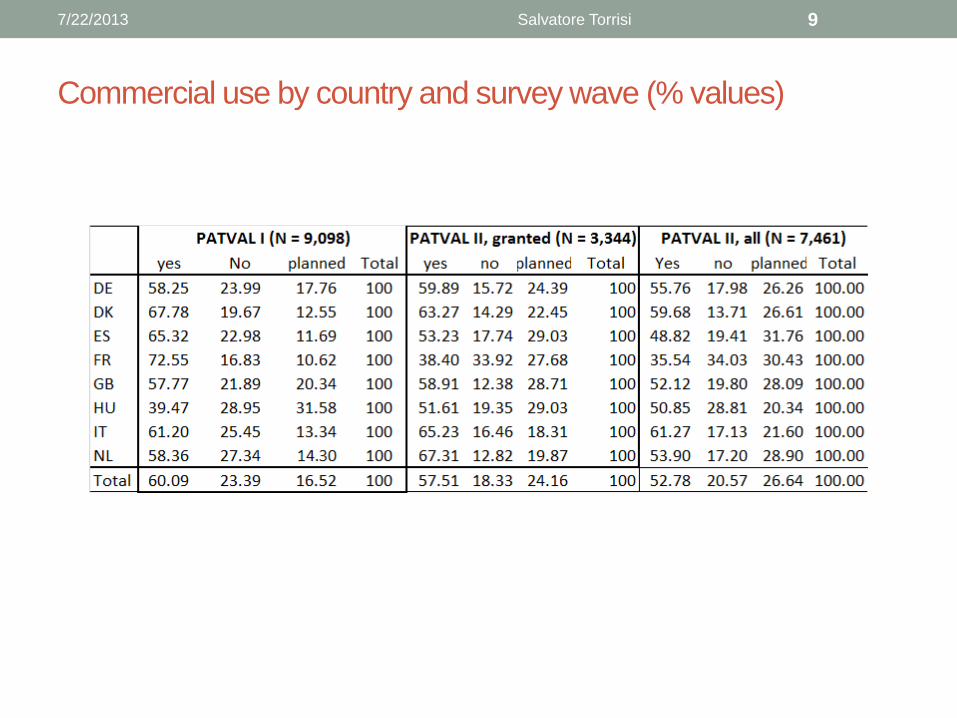
Commercial use by country and survey wave (% values)
7/22/2013 Salvatore Torrisi 9
Commercial use by type of inventor’s employer
• As expected, the share of patents used in new
products/processes is larger when the inventor’s
employer is a business enterprises as compared with a
PRO or a university
• The share of patents that are used commercially is
significantly larger in the case of firms compared with PRI
(PRO+universities)
• The gap between firms and PRI increased between the
two surveys
• But the % of patents that PRIs plan to use increased very
much between the two surveys
7/22/2013 Salvatore Torrisi 10
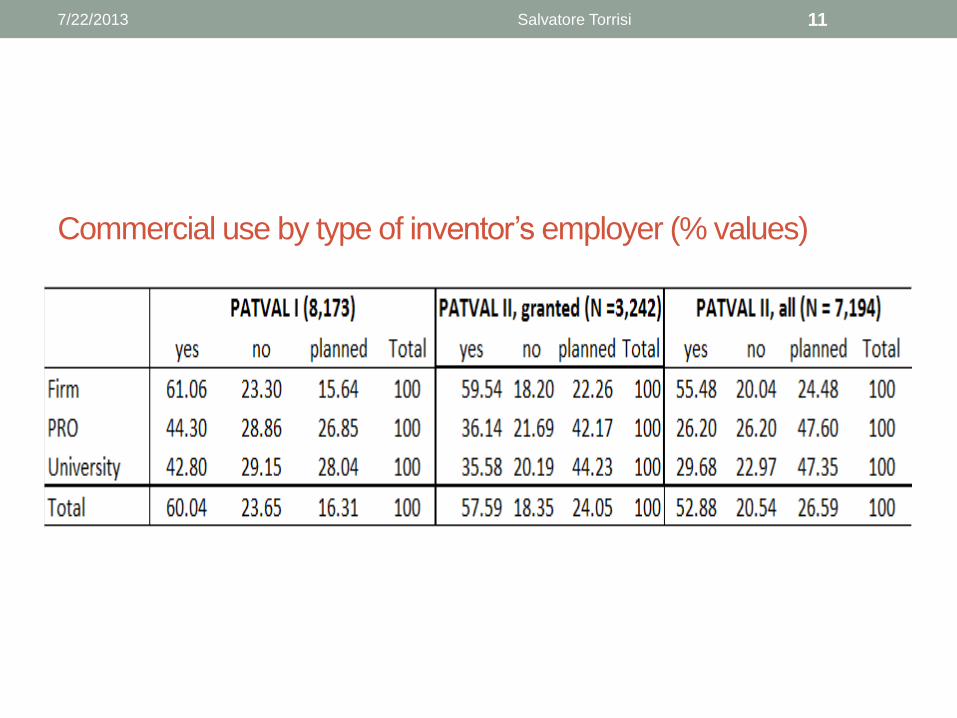
Commercial use by type of inventor’s employer (% values)
7/22/2013 Salvatore Torrisi 11
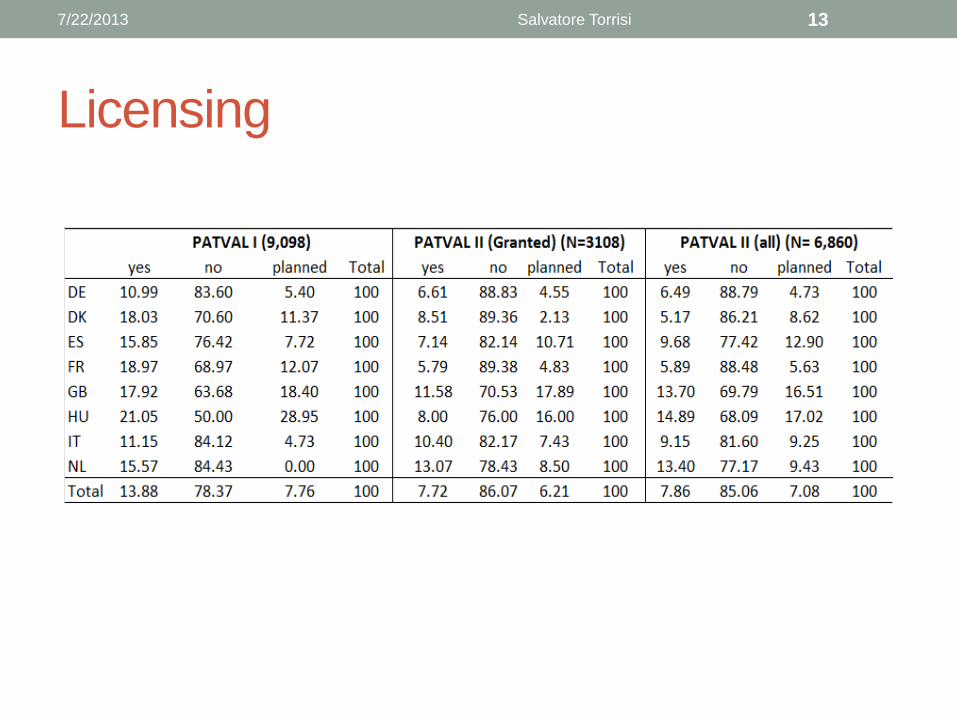
Licensing
• The share of patents licensed also declines over time,
from 13.9% to 7.7% (7.9% for all PatVal2 patents).
• The share of patents whose applicant is willing to license
declines, although less markedly
• The most remarkable decline in license occured to French
patents followed by Danish patents
• The decline of German and British patents that are
licensed is less remarkable
• Even less significant is the decline of Dutch and Italian
patents that are licensed.
7/22/2013 Salvatore Torrisi 12
Licensing
7/22/2013 Salvatore Torrisi 13
Licensing by type inventor’s employer
• As expected, firms are less likely to license a patent
compared with PRIs.
• Firms are also less willing to license. And their propensity
to license between the two surveys declines
• Instead, the % of patents that PRIs are willing to license
has increased.
• This may be due to increased awareness of PRI about the
importance of patent valorization and rising social
pressure to a more intensive technology transfer.
7/22/2013 Salvatore Torrisi 14
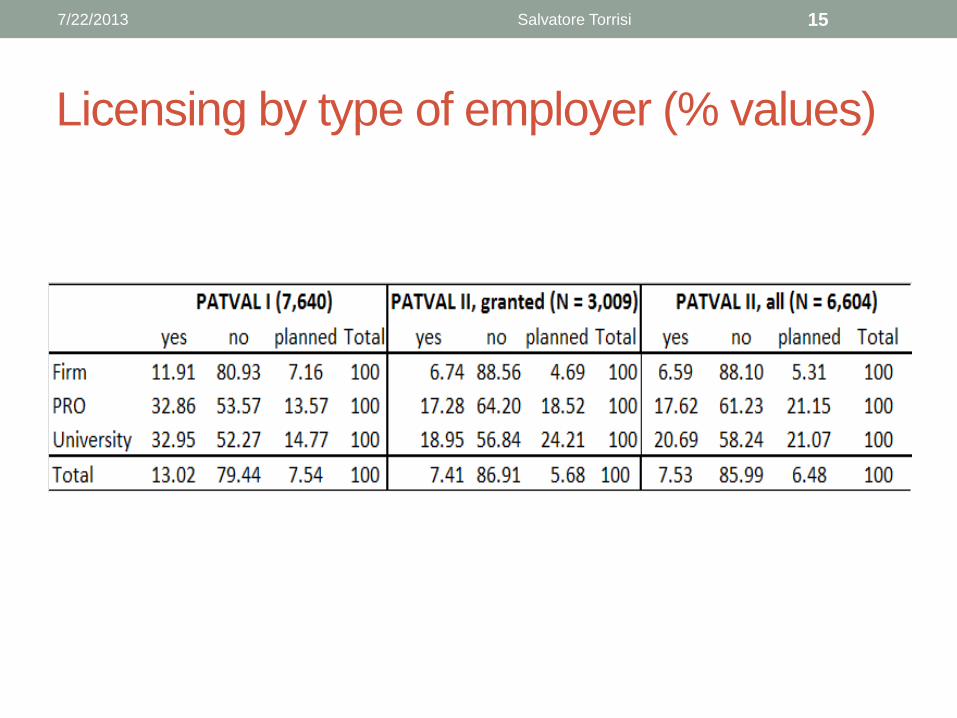
Licensing by type of employer (% values)
7/22/2013 Salvatore Torrisi 15
Used/unused patents
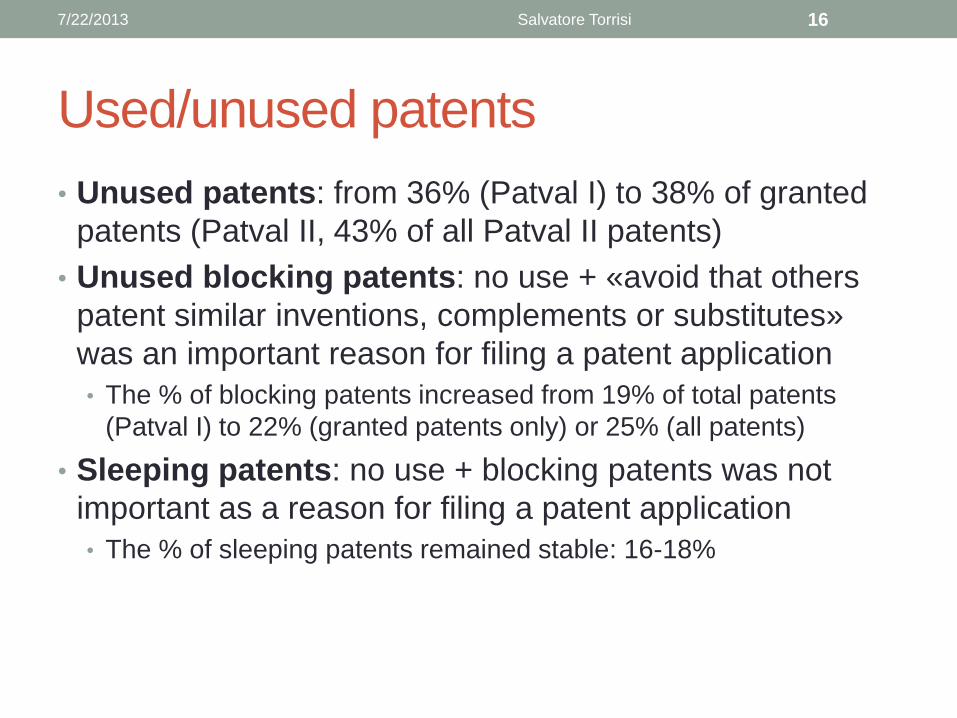
• Unused patents: from 36% (Patval I) to 38% of granted
patents (Patval II, 43% of all Patval II patents)
• Unused blocking patents: no use + «avoid that others
patent similar inventions, complements or substitutes»
was an important reason for filing a patent application
• The % of blocking patents increased from 19% of total patents
(Patval I) to 22% (granted patents only) or 25% (all patents)
• Sleeping patents: no use + blocking patents was not
important as a reason for filing a patent application
• The % of sleeping patents remained stable: 16-18%
7/22/2013 Salvatore Torrisi 16

Used/unused by country (% values)
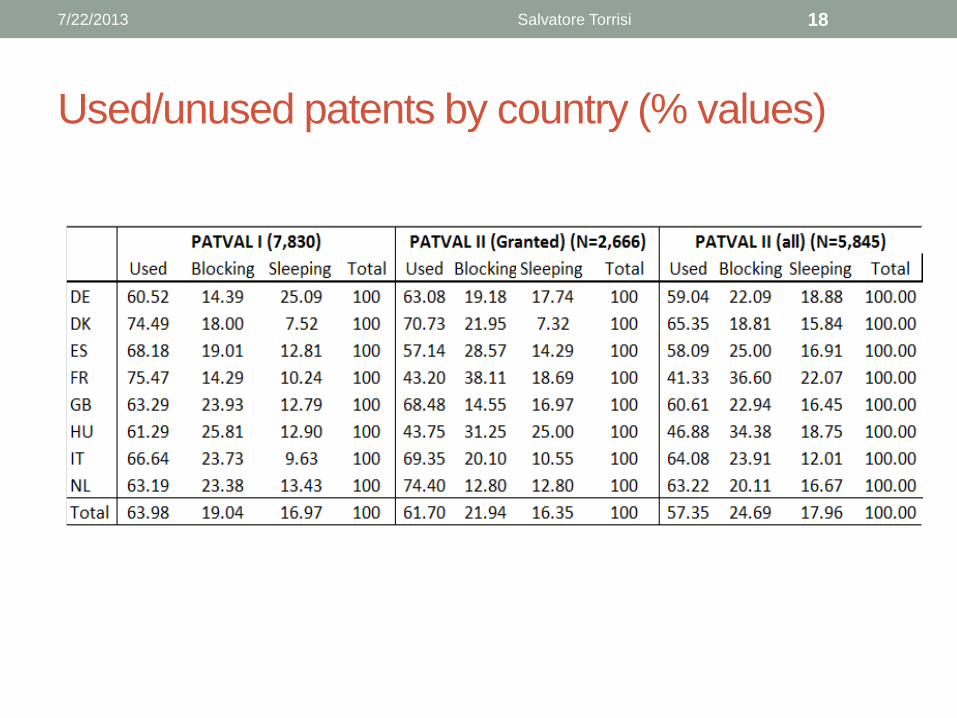
• The share of unused patents remained rather stable in the
case of German and the British patents
• It increased dramatically for French and Spanish patents
• And increased substantially for Italian patents.
• The share of blocking patents increased substantially in
the case of Spanish and French patents
• A marked drop took place to Dutch patents.
7/22/2013 Salvatore Torrisi 17
Used/unused patents by country (% values)
7/22/2013 Salvatore Torrisi 18
Used/unused patents by employers (% values)
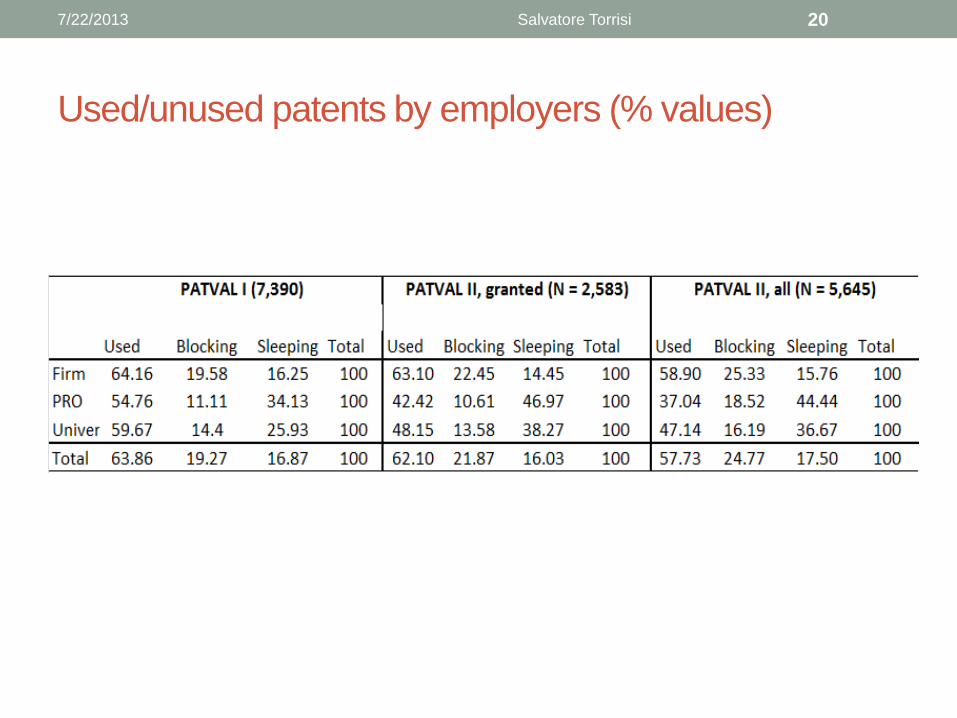
• The share of unused patents is greater for PRI compared
with Firms … and this gap has grown over time
• The share of blocking patents has increased for firms
while their share of sleeping patents has remained stable
• Instead, the share of sleeping patents has increased very
much for both PROs and universities.
7/22/2013 Salvatore Torrisi 19
Used/unused patents by employers (% values)
7/22/2013 Salvatore Torrisi 20
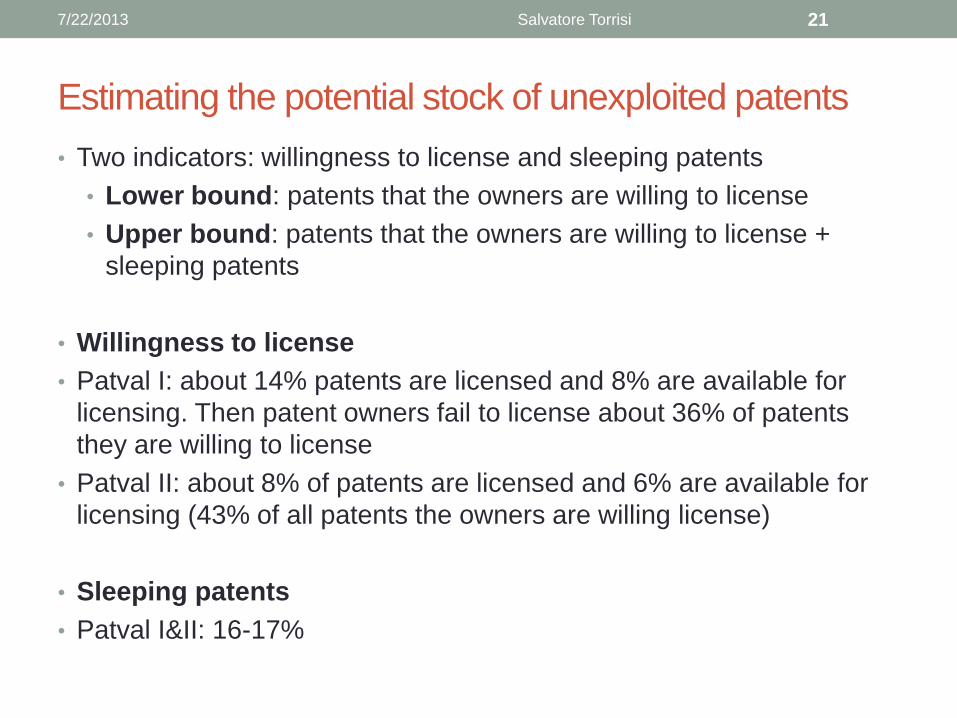
Estimating the potential stock of unexploited patents
• Two indicators: willingness to license and sleeping patents
• Lower bound: patents that the owners are willing to license
• Upper bound: patents that the owners are willing to license +
sleeping patents
• Willingness to license
• Patval I: about 14% patents are licensed and 8% are available for
licensing. Then patent owners fail to license about 36% of patents
they are willing to license
• Patval II: about 8% of patents are licensed and 6% are available for
licensing (43% of all patents the owners are willing license)
• Sleeping patents
• Patval I&II: 16-17%
7/22/2013 Salvatore Torrisi 21
The potential stock of underexploited patents by
type of organization
• Both the lower bound and the upper bound decreased in
the case of firms
• Instead, the lower and the upper bound of potential
participation increases substantially for PROs and
universities
• These patterns do no change substantially when patent
sales is included
7/22/2013 Salvatore Torrisi 22
Estimating the potential stock of unexploited patents
• There is still a substantial room for technology transfer from PRIs.
• However, the firms’ propensity to use the market for technology is limited and this represents a major constraint to a more intensive expoitation of patents
• There are differences across countries. For instance, in the case of UK the lower and upper bounds for both firms and PRIs are above the sample average (Patval II granted patents, same countries as Patval II).
• Instead, UK universities are below the average in terms of lower and upper bound.
• But UK universities have a much larger share of patents licensed compared to French, Italian and even German universities.
7/22/2013 Salvatore Torrisi 23
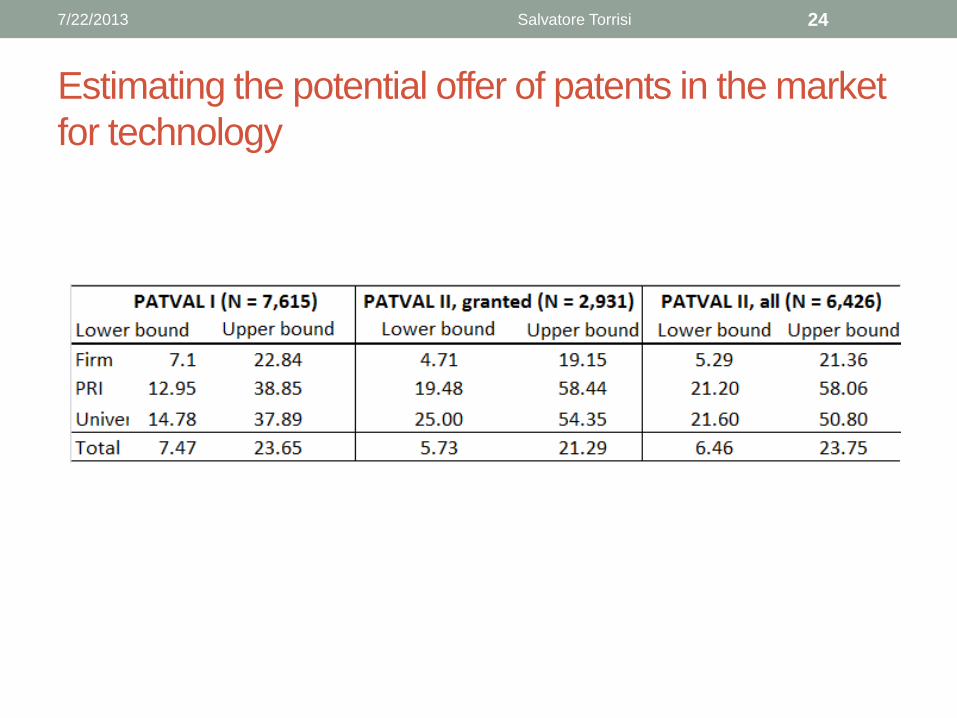
Estimating the potential offer of patents in the market
for technology
7/22/2013 Salvatore Torrisi 24
A focus on Patval II – summary of results (1)
1. The % of commercial use of patents declines with patent value ( #cits received)
2. while the % of sale/licensing increases with patent value
3. The % of blocking patents increases with patent value while the % of sleeping patents declines
• blocking patents are not less valuable than other patents; their value is generated by blocking competition in the downstream market
4. However, the % of unused (blocking and sleeping) patents drops in the case of very high value patents (top 1% of the citation distribution) … … these patents are mostly used commercially rather than being licensed/sold
7/22/2013 Salvatore Torrisi 25
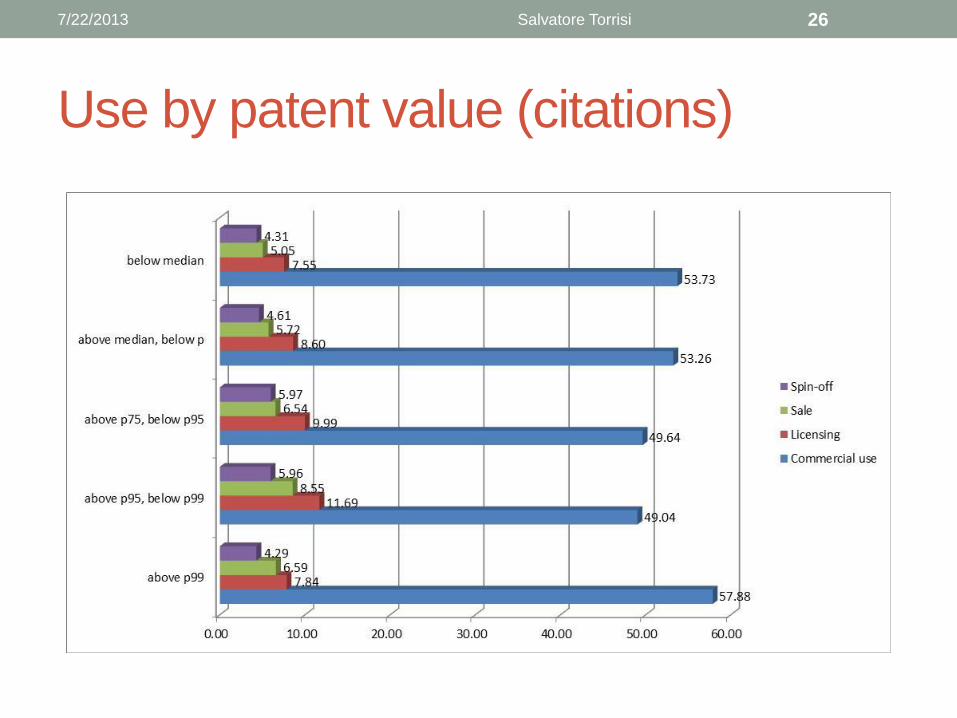
Use by patent value (citations)
7/22/2013 Salvatore Torrisi 26
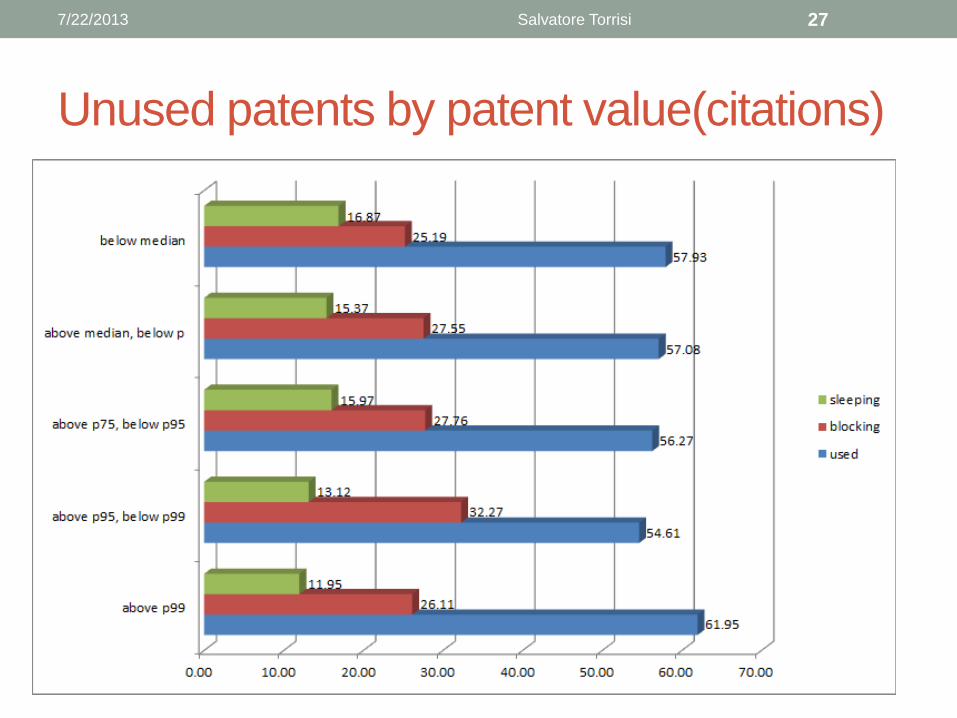
Unused patents by patent value(citations)
7/22/2013 Salvatore Torrisi 27
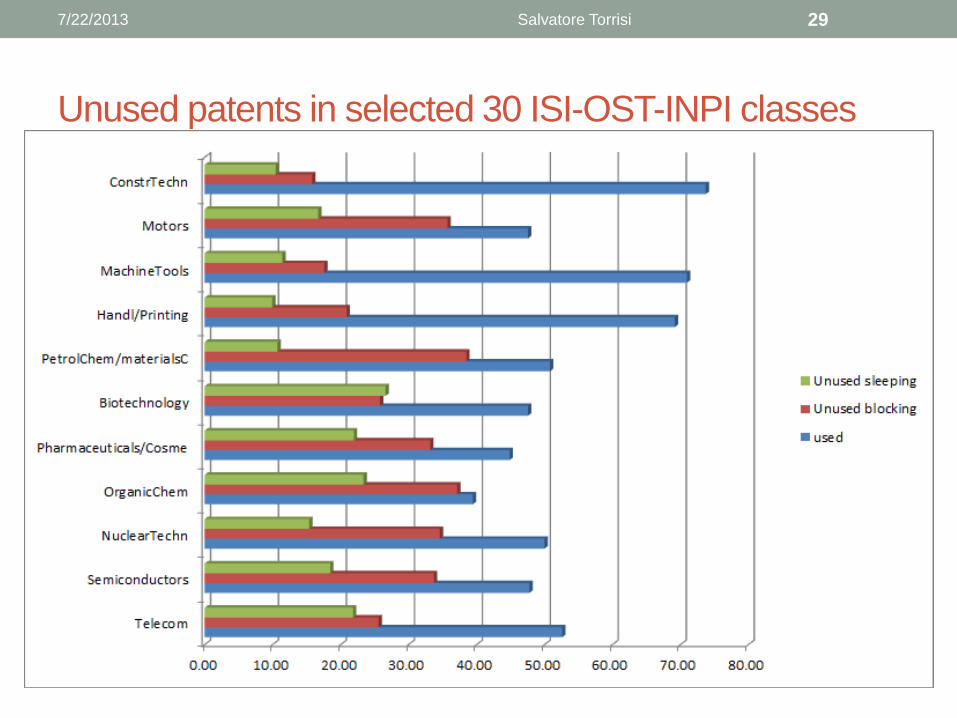
A focus on Patval II – summary of results (2)
1. The % of unused patents is high in biotechnology,
pharmaceuticals / cosmetics and motors.
2. Blocking patents are more frequent in petrochemicals,
organic chemicals and motors.
7/22/2013 Salvatore Torrisi 28
Unused patents in selected 30 ISI-OST-INPI classes
7/22/2013 Salvatore Torrisi 29
Patent uses – probit estimations (AMEs)
7/22/2013 Salvatore Torrisi 30
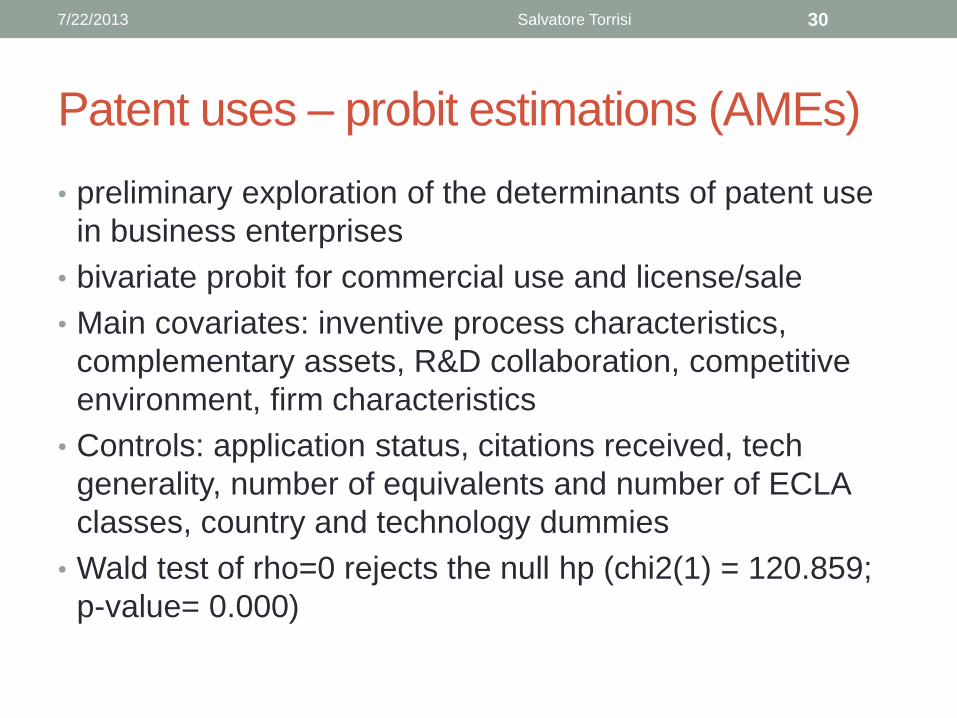
• preliminary exploration of the determinants of patent use
in business enterprises
• bivariate probit for commercial use and license/sale
• Main covariates: inventive process characteristics,
complementary assets, R&D collaboration, competitive
environment, firm characteristics
• Controls: application status, citations received, tech
generality, number of equivalents and number of ECLA
classes, country and technology dummies
• Wald test of rho=0 rejects the null hp (chi2(1) = 120.859;
p-value= 0.000)
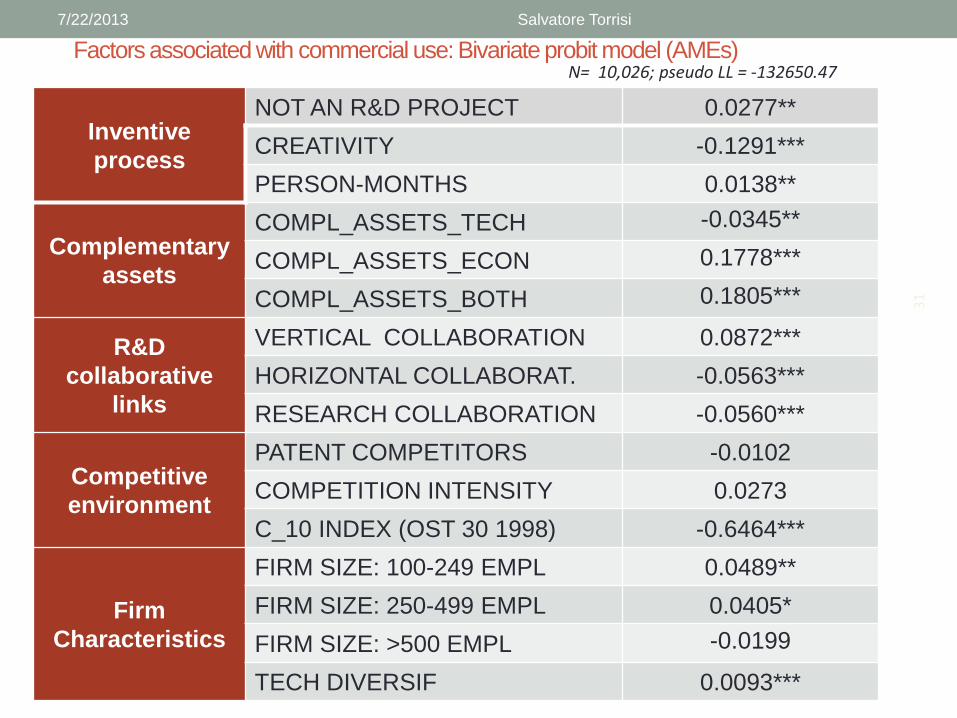
Factors associated with commercial use: Bivariate probit model (AMEs)
Inventive
process
NOT AN R&D PROJECT 0.0277**
CREATIVITY -0.1291***
PERSON-MONTHS 0.0138**
Complementary
assets
COMPL_ASSETS_TECH -0.0345**
COMPL_ASSETS_ECON 0.1778***
COMPL_ASSETS_BOTH 0.1805***
R&D
collaborative
links
VERTICAL COLLABORATION 0.0872***
HORIZONTAL COLLABORAT. -0.0563***
RESEARCH COLLABORATION -0.0560***
Competitive
environment
PATENT COMPETITORS -0.0102
COMPETITION INTENSITY 0.0273
C_10 INDEX (OST 30 1998) -0.6464***
Firm
Characteristics
FIRM SIZE: 100-249 EMPL 0.0489**
FIRM SIZE: 250-499 EMPL 0.0405*
FIRM SIZE: >500 EMPL -0.0199
TECH DIVERSIF 0.0093***
31
N= 10,026; pseudo LL = -132650.47
7/22/2013 Salvatore Torrisi
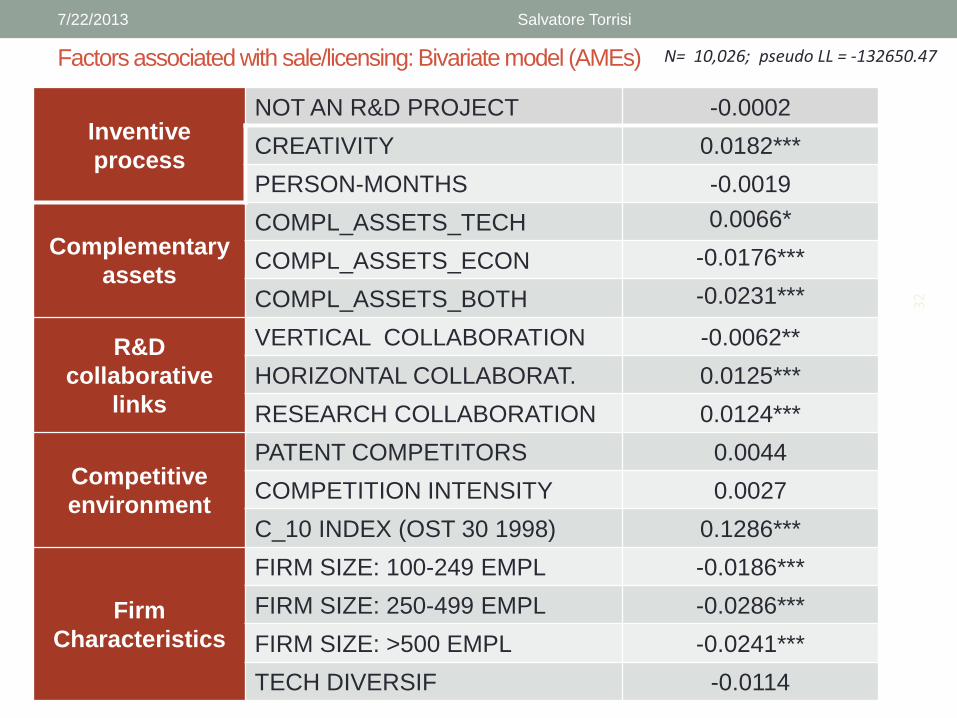
Factors associated with sale/licensing: Bivariate model (AMEs)
Inventive
process
NOT AN R&D PROJECT -0.0002
CREATIVITY 0.0182***
PERSON-MONTHS -0.0019
Complementary
assets
COMPL_ASSETS_TECH 0.0066*
COMPL_ASSETS_ECON -0.0176***
COMPL_ASSETS_BOTH -0.0231***
R&D
collaborative
links
VERTICAL COLLABORATION -0.0062**
HORIZONTAL COLLABORAT. 0.0125***
RESEARCH COLLABORATION 0.0124***
Competitive
environment
PATENT COMPETITORS 0.0044
COMPETITION INTENSITY 0.0027
C_10 INDEX (OST 30 1998) 0.1286***
Firm
Characteristics
FIRM SIZE: 100-249 EMPL -0.0186***
FIRM SIZE: 250-499 EMPL -0.0286***
FIRM SIZE: >500 EMPL -0.0241***
TECH DIVERSIF -0.0114
32
N= 10,026; pseudo LL = -132650.47
7/22/2013 Salvatore Torrisi
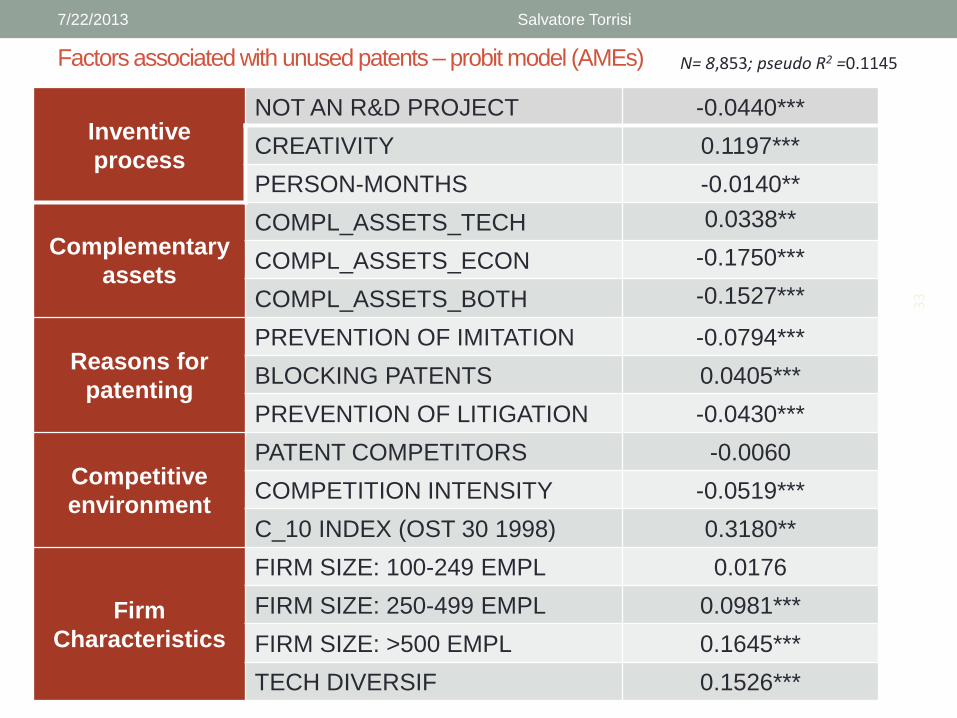
Factors associated with unused patents – probit model (AMEs)
Inventive
process
NOT AN R&D PROJECT -0.0440***
CREATIVITY 0.1197***
PERSON-MONTHS -0.0140**
Complementary
assets
COMPL_ASSETS_TECH 0.0338**
COMPL_ASSETS_ECON -0.1750***
COMPL_ASSETS_BOTH -0.1527***
Reasons for
patenting
PREVENTION OF IMITATION -0.0794***
BLOCKING PATENTS 0.0405***
PREVENTION OF LITIGATION -0.0430***
Competitive
environment
PATENT COMPETITORS -0.0060
COMPETITION INTENSITY -0.0519***
C_10 INDEX (OST 30 1998) 0.3180**
Firm
Characteristics
FIRM SIZE: 100-249 EMPL 0.0176
FIRM SIZE: 250-499 EMPL 0.0981***
FIRM SIZE: >500 EMPL 0.1645***
TECH DIVERSIF 0.1526***
33
N= 8,853; pseudo R2 =0.1145
7/22/2013 Salvatore Torrisi
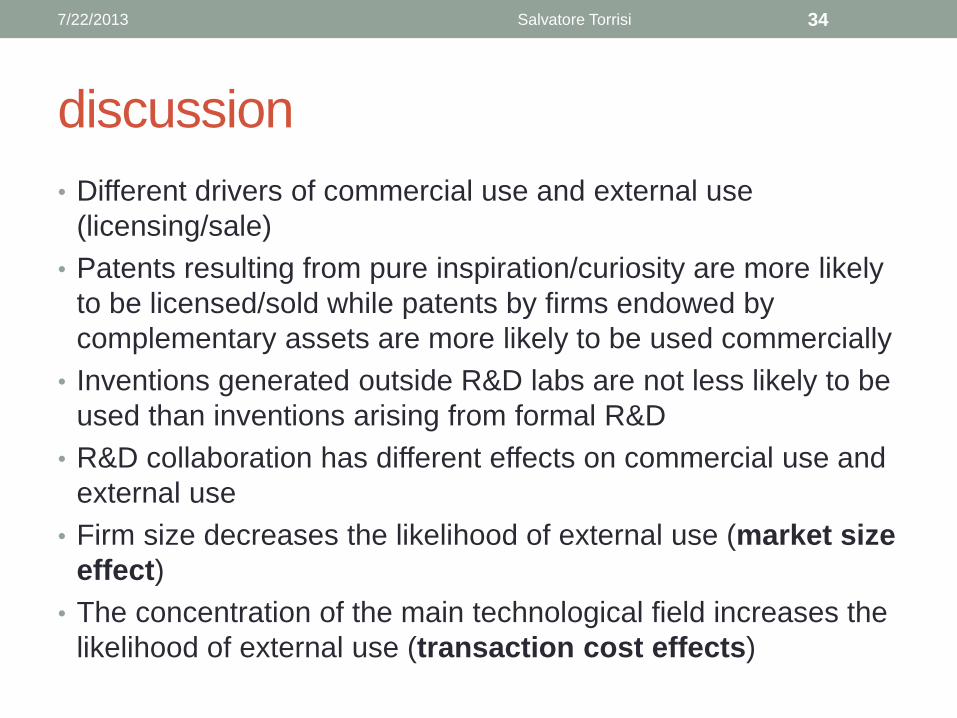
discussion
• Different drivers of commercial use and external use
(licensing/sale)
• Patents resulting from pure inspiration/curiosity are more likely
to be licensed/sold while patents by firms endowed by
complementary assets are more likely to be used commercially
• Inventions generated outside R&D labs are not less likely to be
used than inventions arising from formal R&D
• R&D collaboration has different effects on commercial use and
external use
• Firm size decreases the likelihood of external use (market size
effect)
• The concentration of the main technological field increases the
likelihood of external use (transaction cost effects)
7/22/2013 Salvatore Torrisi 34
discussion
• A large share of patents is not used. Reasons?
• (I) strategic patenting. The rising % of blocking patents between the two surveys (especially large firms) confirms the importance of this factor.
• (II) patent value. The % of sleeping patents decreases with patent value (citations received).
• However, the % of blocking patents increases with patent value. Only among high value patents (top 1% of the citation distribution) the share of blocking patents decreases…. Blocking is a form of patent use
• 20% of patents in the top 5% of the distribution of forward citations are licensed or sold while only 14% of patents above the median and below the top 25% of the citation distribution are licensed or sold.
7/22/2013 Salvatore Torrisi 35
discussion
• (III) Transaction costs. 7% - 24% of Patval II patents are
potentially transferrable. Beyond value, patent owners
face high barriers to trade (Arora et al. 2001; Gans&Stern,
2003).
• of applications in some technological fields → IPR
fragmentation, litigation and and transaction costs (Heller
and Eisenberg 1998; Shapiro, 2000; Cohen et al. 2002;
Harhoff & Reitzig 2004; Hall et al. 2009)
• The large share of sleeping patents in Patval II data,
especially among PRIs, points to the presence of high
barriers to trade.
7/22/2013 Salvatore Torrisi 36
Policy implications
• There is not much that public policy can do to stimulate alternative
uses of blocking patents (in fact they are already ‘used’ to hamper competition)
• PatVal II data suggest that sleeping patents are associated with lack of complementary assets, limited vertical R&D collaboration and pure inspiration/curiosity-driven R&D
• How can public policy reduce transaction costs and stimulate the growth of the market for technology?
• Mixed evidence about the impact of various public policy instruments like license of right system and public support to IPR exchange platforms, patent trading funds and technology development funds (EU 2012).
• Reducing transaction costs is a challenging policy task: data on US patents held by SMEs show that a 50% decrease of transaction costs increase the probability of patent sale by only 6 % (10% for few patents above the median value) (Serrano, 2011)
7/22/2013 Salvatore Torrisi 37