Embed Size (px)
Citation preview
1
The Economic Impact of University System of Georgia Institutions
on their Regional Economies in FY 2019
May 2020
Commissioned by The Board of Regents of the University System of Georgia
Dr. Jeffrey M. Humphreys, Director n Selig Center for Economic Growth
2
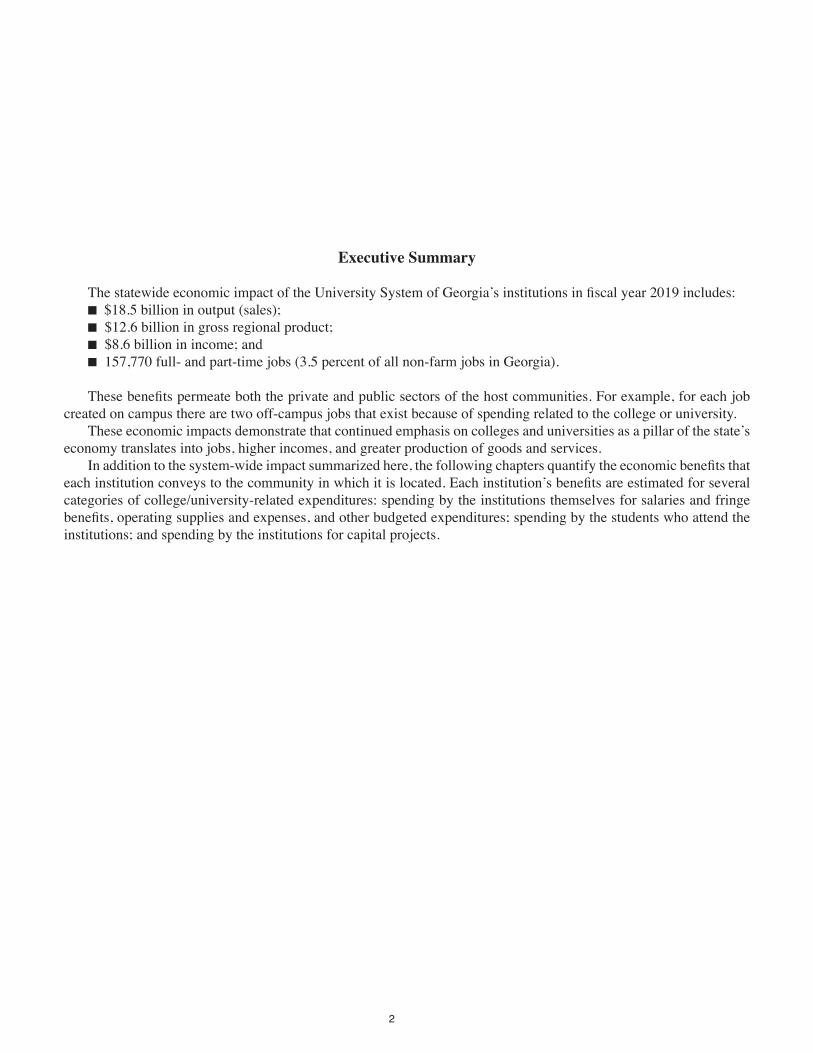
Executive Summary
ThestatewideeconomicimpactoftheUniversitySystemofGeorgia’sinstitutionsinfiscalyear2019includes:n$18.5billioninoutput(sales);n $12.6billioningrossregionalproduct;n $8.6billioninincome;andn 157,770full-andpart-timejobs(3.5percentofallnon-farmjobsinGeorgia).
Thesebenefitspermeateboththeprivateandpublicsectorsofthehostcommunities.Forexample,foreachjobcreatedoncampustherearetwooff-campusjobsthatexistbecauseofspendingrelatedtothecollegeoruniversity. Theseeconomicimpactsdemonstratethatcontinuedemphasisoncollegesanduniversitiesasapillarofthestate’seconomytranslatesintojobs,higherincomes,andgreaterproductionofgoodsandservices. Inadditiontothesystem-wideimpactsummarizedhere,thefollowingchaptersquantifytheeconomicbenefitsthateachinstitutionconveystothecommunityinwhichitislocated.Eachinstitution’sbenefitsareestimatedforseveralcategoriesofcollege/university-relatedexpenditures:spendingbytheinstitutionsthemselvesforsalariesandfringebenefits,operatingsuppliesandexpenses,andotherbudgetedexpenditures;spendingbythestudentswhoattendtheinstitutions;andspendingbytheinstitutionsforcapitalprojects.
3
Introduction
Howmuchdoesaregionbenefiteconomicallyfromhostinganinstitutionofhighereducation?Traditionally,thebenefitsarediscussedinbroad,qualitativetermsthatoftenfailtosatisfythosewhodemandtangibleevidenceof theeconomic linkagesbetweentheacademiccommunityand thecommunityasawhole;however, this
reportquantifiestheeconomicbenefitsthattheUniversitySystemofGeorgia’sinstitutionsconveytothecommunitiesinwhichtheyarelocated.
Thebenefitsareestimatedforseveralimportantcategoriesofcollege/university-relatedexpenditures:spendingbytheinstitutionsthemselvesforsalariesandfringebenefits,operatingsuppliesandexpenses,andotherbudgetedexpenditures;spendingbythestudentswhoattendtheinstitutions;andspendingbytheinstitutionsforcapitalprojects(construction).Theeconomicimpactestimatesarebasedonregionalinput-outputmodelsofeachinstitution’sregionaleconomy,certainnecessaryassumptions,andavailabledataonannualspendinginthespecifiedcategories.Moreover,theemphasisisonfundsreceivedbyresidentsintheregionthathostseachcollegeoruniversity.Thestudyreportsexpendituresandimpactsforthe2019fiscalyear—July1,2018throughJune30,2019.
Thestudydoesnotaccount forallof the short-term impactsof the26 institutionson theirhostcommunities,however.Forexample,therearenodollaramountsestimatedforseveralsourcesofcollege/university-relatedspendingbecausedoingsowouldrequirecollectingsurveydata,ataskbeyondtheresourcesavailabletothisstudy.Inaddition,thestudyneitherquantifies themany long-termbenefits thatan institutionofhighereducation imparts to thehostcommunity’seconomicdevelopmentnordoesitmeasureintangiblebenefits(suchasculturalopportunities,intellectualstimulation,andvolunteerwork)tolocalresidents.Finally,thestudyisnotanetbenefitanalysis;itestimatesonlyeconomicbenefitsanddoesnotcalculatewhatthepresenceofatax-exemptcollege/universitycoststhecommunity.
Economic Impact Highlights
Inthesimplestterms,thetotaleconomicimpactofall26institutionsontheirhostcommunitieswas$18.5billioninFY2019.Theoutput impactofeach institution is thechange in regionaloutput that isdue to spendingby theinstitutionandspendingbythestudentswhoattendthatparticularcollegeoruniversity.OftheFY2019total,$12.6billion (68percent) is initial spendingby the institutions and students;$5.9billion (32percent) is the inducedorre-spending(multiplier)impact.DividingtheFY2019totaloutputimpact($18.5billion)byinitialspending($12.6billion)yieldsanaveragemultipliervalueof1.47.Onaverage,therefore,everydollarofinitialspendinggeneratesanadditional47centsfortheeconomyoftheregionthathoststheinstitution.
InFY2019,valueaddedcomprises$12.6billion(68percent)ofthe$18.5billionoutputimpact,withdomesticandforeigntradecomprisingtheremaining$5.9billion(32percent).The$12.6billionvalue-addedimpactequals2.1percentofGeorgia’sGDP.Laborincomereceivedbyresidentsofthecommunitiesthathostoneormoreinstitutionsequals$8.6billion,andrepresents68percentofthevalue-addedimpact.
Thecollectiveorrolled-upemploymentimpactofallinstitutionsontheirhostcommunitiesinFY2019,includingmultipliereffects, is157,770 full-andpart-time jobs.Approximately33percentof thesepositionsareoncampus(51,768FTEUniversitySystem employees) and 67 percent (106,002 jobs) are off-campus positions in either theprivateorpublicsectors.Onaverage,foreachjobcreatedoncampustherearetwooff-campusjobsthatexistbecauseofspendingrelatedtotheinstitution.The157,770jobsgeneratedbytheUniversitySystemaccountfor3.5percentofallthenonfarmjobsinGeorgia,oraboutonejobin29.Toprovideperspective,therolled-upemploymentimpactoftheUSG’s26institutionsexceededthecombinednumberofjobsatGeorgia’stopfiveemployers—FortBenning(40,000jobs),Walmart(34,872jobs),DeltaAirLines(30,813jobs),U.SArmySignalCenterandFortGordon(25,264jobs),andEmoryUniversity(24,535jobs).
4
Methodology
n Understanding the Concept of the Short-Term Economic Impact of a College or University n
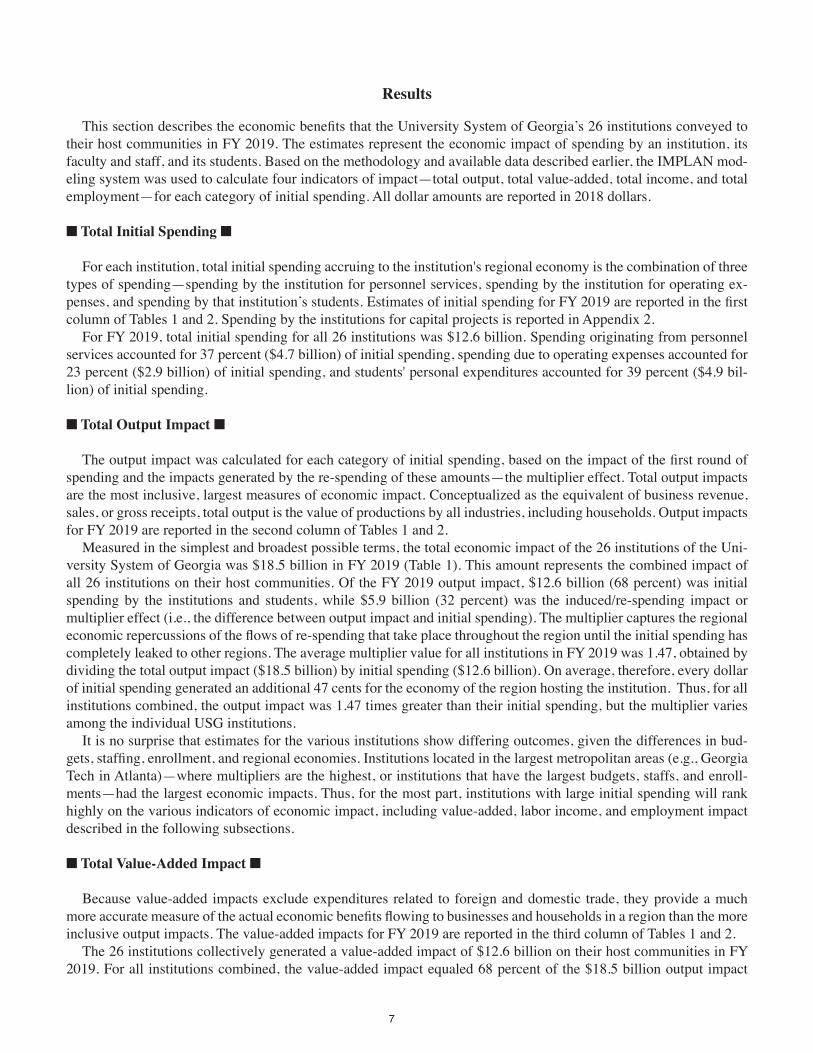
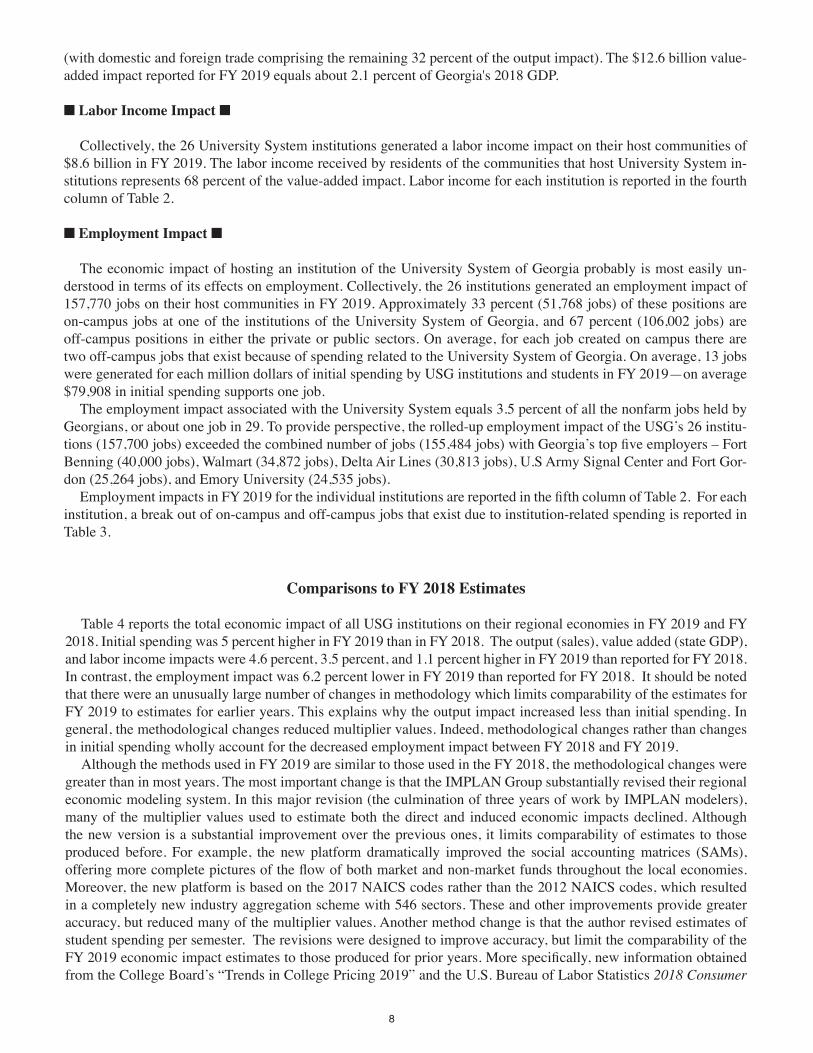
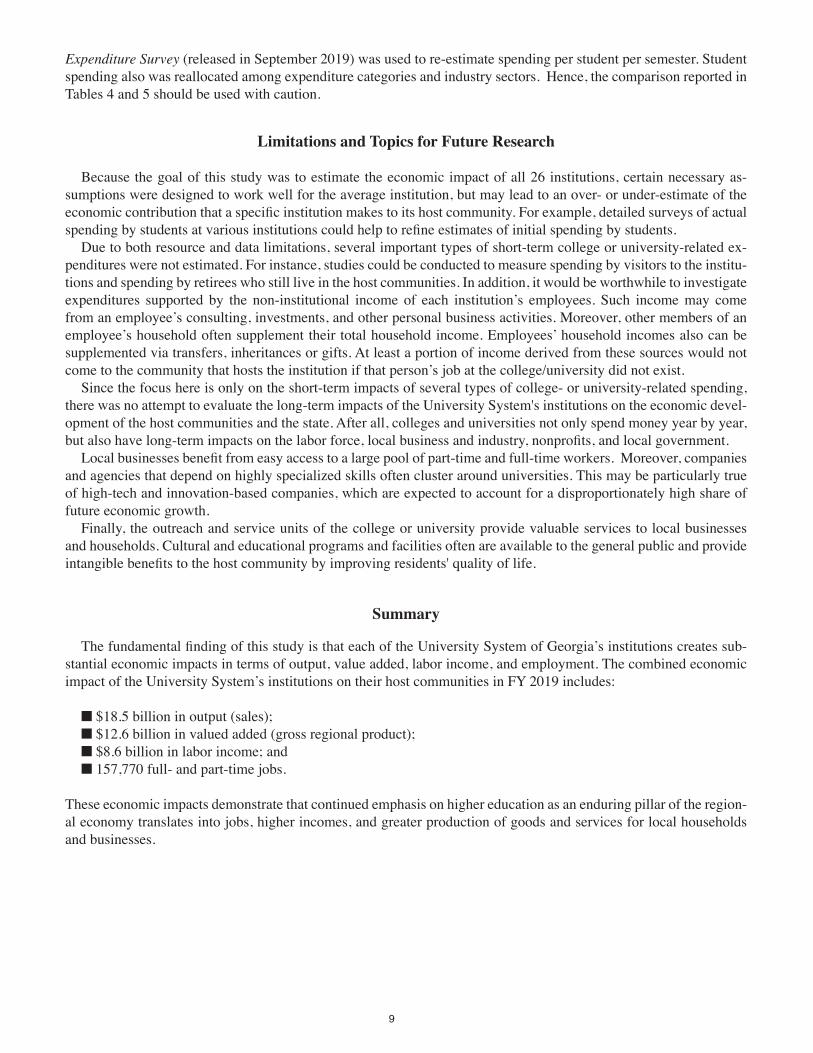
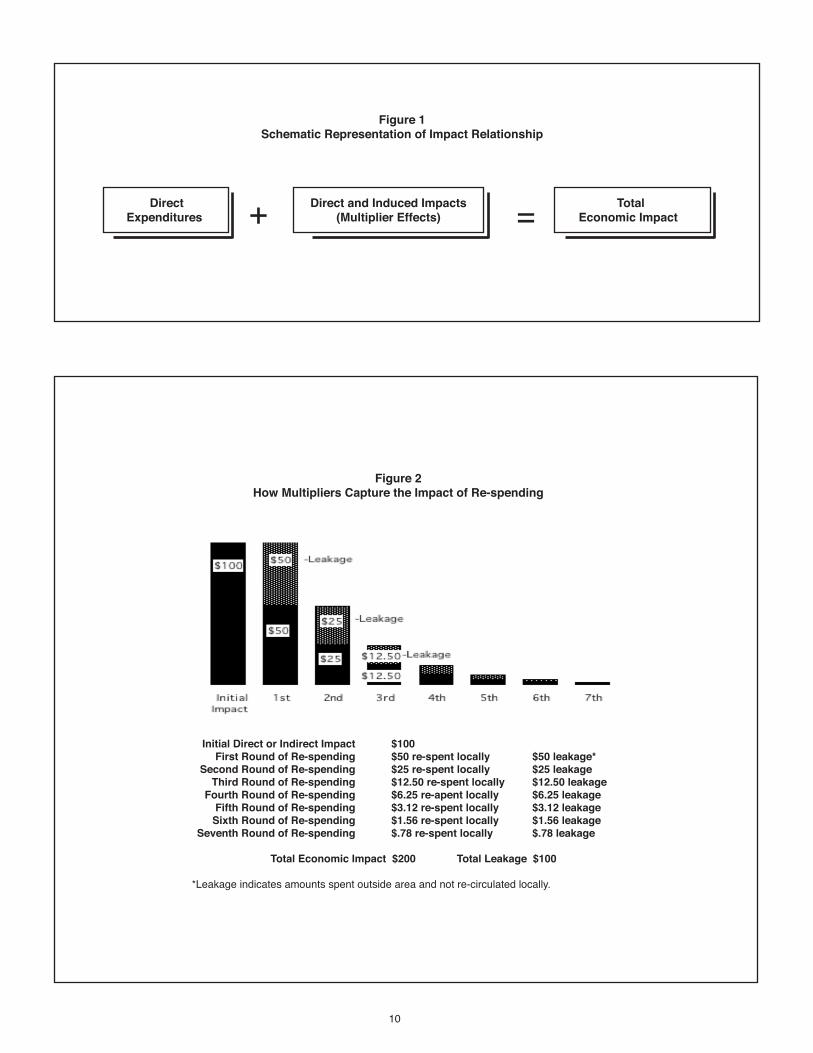
Thetotalannualeconomicimpactofcollege-oruniversity-relatedspendingconsistsofthenetchangesinregionaloutput,valueadded,laborincome,andemploymentthatareduetoinitialspendingbytheinstitution(foroperationsaswellaspersonnelservices)anditsstudents.Thetotaleconomicimpactincludestheimpactoftheinitialroundofspendingandthesecondary,orindirectandinducedspending—referredtoasthemultipliereffect—thatoccurswhentheinitialexpendituresarere-spent.Figure1providesaschematicrepresentationofimpactrelationships. Indirectspendingreferstothechangesininter-industrypurchasesasaregion’sindustriesrespondtotheadditionaldemandstriggeredbyspendingbythecollegeoruniversity,itsfacultyandstaff,anditsstudents.Itconsistsoftheripplesofactivitythatarecreatedwhenaninstitutionanditsemployeesandstudentspurchasegoodsorservicesfromotherindustrieslocatedinthehostcommunity.Inducedspendingissimilartoindirectspendingexceptthatitreferstotheadditionaldemandtriggeredbyspendingbytheregion’shouseholdsastheirincomeincreasesduetochangesinproduction.Basically,theinducedimpactcapturestheripplesofactivitythatarecreatedwhenhouseholdsspendmoreduetoincreasesintheirearningsthatweregeneratedbythedirectandindirectspending. Thesumofthedirect,indirect,andinducedeconomicimpactsisthetotaleconomicimpact,whichisexpressedintermsofoutput(sales,plusorminusinventory),valueadded(grossregionalproduct),laborincome,oremployment.Totalindustryoutputisgrossreceiptsorsales,plusorminusinventory,orthevalueofproductionbyindustry(includ-inghouseholds)foragivenperiod.Totaloutputimpactsarethemostinclusive,largestmeasuresofeconomicimpact.Becauseoftheirsize,outputimpactstypicallyareemphasizedineconomicimpactstudiesandreceivemuchmediaattention.Oneproblemwithoutputasameasureofeconomicimpact,however,isthatitincludesthevalueofinputsproducedbyotherindustries,whichmeansthatthereinevitablyissomedoublecountingofeconomicactivity.Theothermeasuresofeconomicactivity(valueadded,laborincome,andemployment)arefreefromdoublecountingandprovideamuchmorerealisticmeasureofthetrueeconomicimpactofacollegeoruniversityonitsregionaleconomy. Theregionaleconomicareasarethehostcommunities,includingthesurroundingcountiesfromwhichemployeesandstudentscommute.Theeffectsofexpendituresthatgotopeople,businesses,orgovernmentslocatedoutsidetheregionsarenotincludedinthevalue-added,laborincome,andemploymentimpactestimates. Themultiplierconceptiscommontomosteconomicimpactstudies.Multipliersmeasuretheresponseofthelo-caleconomytoachangeindemandorproduction.Inessence,multiplierscapturetheimpactoftheinitialroundofspendingplustheimpactsgeneratedbysuccessiveroundsofre-spendingofthoseinitialdollars.Themagnitudeofaparticularmultiplierdependsuponwhatproportionofeachspentdollarleavestheregionduringeachroundofspend-ing.Multipliersthereforeareuniquetotheregionandtotheindustrythatreceivestheinitialroundofspending. Figure2illustratesthesuccessiveroundsofspendingthatmightoccurifapersonbuysanitemlocally.Assumethattheamountspentis$100andthattheappropriateregionaloutputmultiplieris2.0.Theinitialinjectionofspend-ingtotheregionis$100,whichcreatesadirecteconomicimpactof$100totheregionaleconomy.Ofthat$100,only$50isre-spentlocally;therestflowsoutoftheregionthroughnon-localtaxes,non-localpurchases,andincometransfers.Afterthefirstroundofspending,thetotaleconomicimpacttotheregionis$150.Duringthesecondroundofre-spending,$25isre-spentlocallyand$25leaksoutoftheregion,a50percentleakage.Nowthetotaleconomicimpacttotheregionis$175.Aftersevenroundsofre-spending,lessthan$1remainsinthelocaleconomy,butthetotaleconomicimpacthasreachedalmost$200.Theinduced(multipliereffect)impacttotheregion($100)equalsthetotalimpact($200)minusthedirectimpact($100). Themultipliertracestheflowsofre-spendingthatoccurthroughouttheregionuntiltheinitialdollarshavecom-pletelyleakedtootherregions.Obviously,multipliereffectswithinlarge,self-sufficientareasarelikelytobelargerthanthoseinsmall,rural,orspecializedareasthatarelessabletocapturespendingfornecessarygoodsandservices.Multipliereffectsalsovarygreatlyfromindustrytoindustry,butingeneral,thegreatertheinteractionwiththelocaleconomy,thelargerthemultiplierforthat industry. Forexample,personalservices,businessservices,andenter-tainmentindustrieshaveintricaterelationshipswithlocalsupportingindustries,andthereforehaverelativelyhighmultipliervalues.Conversely,electric,gas,andsanitaryservicesusuallyarelessintertwinedwithlocalsupportingindustries,andtheirmultipliersarelower.
5
n Analytic Approach n
EstimatingtheeconomicimpactoftheUniversitySystemofGeorgiainstitutionsontheirregionaleconomiesinFY2019involvedfourbasicsteps.First,initialspending(andemployment)foreachinstitutionwereobtainedforBudgetUnit"A"and"BudgetUnit"B";andthentheinstitutionalexpenditureswereallocatedtoindustrialsectorsrecognizedbytheeconomicimpactmodelingsystem.Second,spendingbystudentswasestimatedandthenallocatedtoindustrialsectors.Third,expendituresassociatedwithcapitalprojects(construction)fundedwereobtainedforeachinstitutionandwereallocatedtotheappropriateindustrialsectors.Finally,theIMPLANmodelingsystemwasusedtobuildregionaleconomicmodelsthatarespecifictoeachinstitution. Thegeographicareascorrespondingtotheregionalmodelsthatwerebuiltforeachinstitution,whichincludethelaborforcedirectlyinvolvedintheireconomicspheres,arereportedinAppendix1.ThesegeographicareasarebasedonananalysisofcommutingpatternsdataobtainedfromtheU.S.CensusBureau.Foranalyticalpurposes,alldollaramountswereconvertedtoinflation-adjusteddollars,buttheamountsexpressedinthisreportareexpressedin2018dollars. TypeSAM(socialaccountingmatrices)multipliersfromIMPLANwereusedtoestimatetheeconomicimpactsassociatedwithallcategoriesofspending.TypeSAMmultiplierscapturetheoriginalexpendituresresultingfromtheimpact,theindirecteffectsofindustriesbuyingfromindustries,andtheinducedeffectsofhouseholds’expendituresbasedoninformationinthesocialaccountmatrix.ThemultipliersaccountforSocialSecurityandincometaxleak-age,institutionalsavings,commuting,inter-institutionaltransfers,andpeople-to-peopletransfers. Wheneverappropriate,IMPLANappliedmarginstoconvertpurchaserpricestoproducerprices.Ininput-outputmodels,allexpendituresareintermsofproducerprices,whichallowallspendingtobeallocatedtotheindustriesthatactuallyproducethegoodorservice.ThemarginsarederivedfromU.S.BureauofEconomicAnalysisdata.Moreover,marginswereselectedaccordingtotypeofconsumertowhichtheseapplied.Forexample,householdspaytransportation,wholesale,andthefullretailmargins.Incontrast,institutionsofhighereducationmaypaylittleornoretailmarginastheyhavetypicallymorebuyingpowerthanahousehold.Inaddition,somesectorsofthemodeldonothavemargins.Forinstance,becausethereusuallyarenowholesalersorretailersinvolvedwhensomeonerentsaroom,hotelsandotherlodgingdonothavemargins. Themodel’sdefaultestimatesofthelocaleconomy’sregionalpurchasecoefficientswereusedtoderivetheratiooflocallypurchasedtoimportedgoods.Theregionalpurchasecoefficientrepresentstheproportionofthetotaldemandsforagivencommoditythatissuppliedbytheregiontoitself.Theregionalpurchasecoefficientswereestimatedwithaneconometricequationthatpredictslocalpurchasesbasedoneachregion’suniquecharacteristics.Inaddition,theentireanalysiswasconductedusingthefullrangeofindustrialsectorsinordertoavoidaggregationbias.
n Initial Spending by the Institutions n Initialspendingisthecombinationofseveraltypesofspending,includingspendingbyUSGinstitutionsforper-sonnelservices(wages,salaries,andbenefits),spendingbyUSGinstitutionsforoperatingexpenses,andspendingbystudents. TheBoardofRegentsprovidedinstitution-specificdataonexpendituresforpersonnelservicesandthenumberofpositions.TheexpenditureamountsareindustrychangesandarereportedinthefirstcolumnofTables1and2,respec-tively.TheseamountsareallocatedtovariouseconomicsectorsrecognizedbyIMPLANonthetypicalexpenditurepatternforhouseholdsofmoderateincome. Institution-specificdataonexpendituresforoperatingexpenses(non-personnelservices)forFY2019wereob-tainedfromtheBoardofRegents.TheseamountsareindustrychangesandarereportedinthefirstcolumnofTables1and2,respectively. Toavoiddouble-counting,theestimatesofinitialspendingdonotincludeexpendituresarisingfromtwobudgetaryclasses:auxiliaryenterprisefunds(self-supportingactivitiesforhousing,foodservice,bookstore,athletics,andother)andstudentactivityfunds(culturalandrecreationalprogramsoperatedbystudents).Thespendingassociatedwithsuchactivitiesisincludedinthestudent’spersonalexpenditures,however. TheexpendituresandimpactreportedinTables1-3forAugustaUniversitydonotaccountforspendingbythehospitalandclinicsoperatingbytheAUHealthSystem,Inc.ExpendituresandimpactsfortheAUHealthSystem,
6
Inc.arereportedinAppendix3,however.Appendix4reportsthecombinedimpactsofAugustaUniversityandtheAUHealthSystem,Inc.ontheAugustaMSA(includingthetwoout-of-statecounties)ratherthanthatportionofthelocaleconomythatlieswithinGeorgia(definedinAppendix1). Sinceadetailedanalysisofspendingpatternsateachinstitutionwasnotpractical,budgetedexpendituresforoper-atingexpenseswereallocatedtovariouseconomicsectorsbasedonatypicalexpenditurepatternestimatedforU.S.collegesthatwasdevelopedbytheIMPLANmodelers. Institution-specificdataoncapitalprojects(construction)alsowereobtainedfromtheBoardofRegents.Theex-penditureswereallocatedtothefiscalyearofreportedfunding,regardlessofwhetherornotallofthefundswereactu-allyspentduringfiscalyear2019.Therefore,theamountsforcapitalexpendituresandtheirimpactsarenotincludedintheeconomicimpactsexpressedinTables1-3,buttheyarereportedinAppendix2. Itshouldbenotedthatsomepreviouseditionsofthisstudydidnotincludetheimpactsofpublic/privateventures.TheFY2019capitalprojectimpactsthereforearenotdirectlycomparabletothoseforFY2004orearlierfiscalyears.
n Students’ Personal Expenditures n
Collegestudentsspendsignificantamountsofmoneyinthelocaleconomyasapartoftheirlivingexpenses,sothedollarvalueofthisspendingwasestimated.Sinceadetailedsurveyofstudents'spendinghabitsateachinstitutionwasnotpractical,typicalexpenditurelevelsperstudentpersemesterwereestimatedbasedondataobtainedfromseveralsources:(1)TheCollegeBoardAnnualSurveyofColleges;(2)variousannualConsumer Expenditure Sur-veysconductedbytheU.S.BureauofLaborStatistics(BLS);(3)aspecialBLSstudythatappearedintheJuly2001issue of the Monthly Labor Reviewthatexaminedtheexpendituresofcollege-agestudentsandnon-students;and(4)asampleofrecentestimatedcostsofattendancepreparedbyindividualinstitutions.AlthoughtheestimatedcostsofattendancepreparedbytheCollegeBoardandindividualinstitutionswerenotdetailedenoughtobeusedbytheIMPLANmodelingsystem,theydidprovideinformationforaprofileofaverageexpendituresforsomeoftheitemstypicallypurchasedbystudents. AlthoughtheConsumer Expenditure Surveyscoverhouseholdsconsistingofonepersonatvariousincomelevels,norecentdataareavailablespecificallyforcollegestudents;therefore,toadaptthedataforthisstudy,spendingesti-matesforseveralcategoriesofgoodsorserviceswereincreased,decreased,oreliminated.Forexample,comparedtoaweightedaverageoflower-incomehouseholds,students’expendituresforbooksandforeatingoutwereincreasedsubstantially,whilestudents’expendituresforgroceries,cashcontributions,insuranceandpensions,andhealthcarewerereduced.Becausespendingforvacationandtraveldonottakeplacelocally,theseexpenditureswereeliminated.Inaddition,expendituresfortuitionwereeliminatedbecauseofpossibledoublecounting.Institutionsreceivepay-mentsfromstudentsfortuition,whichinturnsupporttheinstitutions'expenditures,whichhasalreadybeenestimated.Afteradjustment,theaverageexpenditureperstudentbysemesterwasestimatedat$5,383forSummer2018,$8,075forFall2018,andat$8,075forSpring2019. Thefinalstepinestimatingstudents'personalexpenditureswastomultiplythenumberofsemestersofstudentspendingbytheaveragespendingpersemester.ForFY2019,theseamountsarereportedinthefirstcolumnofTables1and2.Thenumberofsemestersofstudents'spendingequalseachinstitution'sFTEenrollmentasreportedintheSemester Enrollment ReportissuedbytheBoardofRegents.
7
Results
ThissectiondescribestheeconomicbenefitsthattheUniversitySystemofGeorgia’s26institutionsconveyedtotheirhostcommunitiesinFY2019.Theestimatesrepresenttheeconomicimpactofspendingbyaninstitution,itsfacultyandstaff,anditsstudents.Basedonthemethodologyandavailabledatadescribedearlier,theIMPLANmod-elingsystemwasusedtocalculatefourindicatorsofimpact—totaloutput,totalvalue-added,totalincome,andtotalemployment—foreachcategoryofinitialspending.Alldollaramountsarereportedin2018dollars.
n Total Initial Spending n
Foreachinstitution,totalinitialspendingaccruingtotheinstitution'sregionaleconomyisthecombinationofthreetypesofspending—spendingbytheinstitutionforpersonnelservices,spendingbytheinstitutionforoperatingex-penses,andspendingbythatinstitution’sstudents.EstimatesofinitialspendingforFY2019arereportedinthefirstcolumnofTables1and2.SpendingbytheinstitutionsforcapitalprojectsisreportedinAppendix2. ForFY2019,totalinitialspendingforall26institutionswas$12.6billion.Spendingoriginatingfrompersonnelservicesaccountedfor37percent($4.7billion)ofinitialspending,spendingduetooperatingexpensesaccountedfor23percent($2.9billion)ofinitialspending,andstudents'personalexpendituresaccountedfor39percent($4.9bil-lion)ofinitialspending.
n Total Output Impact n
Theoutputimpactwascalculatedforeachcategoryofinitialspending,basedontheimpactofthefirstroundofspendingandtheimpactsgeneratedbythere-spendingoftheseamounts—themultipliereffect.Totaloutputimpactsarethemostinclusive,largestmeasuresofeconomicimpact.Conceptualizedastheequivalentofbusinessrevenue,sales,orgrossreceipts,totaloutputisthevalueofproductionsbyallindustries,includinghouseholds.OutputimpactsforFY2019arereportedinthesecondcolumnofTables1and2. Measuredinthesimplestandbroadestpossibleterms,thetotaleconomicimpactofthe26institutionsoftheUni-versitySystemofGeorgiawas$18.5billioninFY2019(Table1).Thisamountrepresentsthecombinedimpactofall26institutionsontheirhostcommunities.OftheFY2019outputimpact,$12.6billion(68percent)wasinitialspendingby the institutions and students,while $5.9 billion (32percent)was the induced/re-spending impact ormultipliereffect(i.e.,thedifferencebetweenoutputimpactandinitialspending).Themultipliercapturestheregionaleconomicrepercussionsoftheflowsofre-spendingthattakeplacethroughouttheregionuntiltheinitialspendinghascompletelyleakedtootherregions.TheaveragemultipliervalueforallinstitutionsinFY2019was1.47,obtainedbydividingthetotaloutputimpact($18.5billion)byinitialspending($12.6billion).Onaverage,therefore,everydollarofinitialspendinggeneratedanadditional47centsfortheeconomyoftheregionhostingtheinstitution.Thus,forallinstitutionscombined,theoutputimpactwas1.47timesgreaterthantheirinitialspending,butthemultipliervariesamongtheindividualUSGinstitutions. Itisnosurprisethatestimatesforthevariousinstitutionsshowdifferingoutcomes,giventhedifferencesinbud-gets,staffing,enrollment,andregionaleconomies.Institutionslocatedinthelargestmetropolitanareas(e.g.,GeorgiaTechinAtlanta)—wheremultipliersarethehighest,orinstitutionsthathavethelargestbudgets,staffs,andenroll-ments—hadthelargesteconomicimpacts.Thus,forthemostpart,institutionswithlargeinitialspendingwillrankhighlyonthevariousindicatorsofeconomicimpact,includingvalue-added,laborincome,andemploymentimpactdescribedinthefollowingsubsections.
n Total Value-Added Impact n
Becausevalue-addedimpactsexcludeexpendituresrelatedtoforeignanddomestic trade, theyprovideamuchmoreaccuratemeasureoftheactualeconomicbenefitsflowingtobusinessesandhouseholdsinaregionthanthemoreinclusiveoutputimpacts.Thevalue-addedimpactsforFY2019arereportedinthethirdcolumnofTables1and2. The26institutionscollectivelygeneratedavalue-addedimpactof$12.6billionontheirhostcommunitiesinFY2019.Forallinstitutionscombined,thevalue-addedimpactequaled68percentofthe$18.5billionoutputimpact
8
(withdomesticandforeigntradecomprisingtheremaining32percentoftheoutputimpact).The$12.6billionvalue-addedimpactreportedforFY2019equalsabout2.1percentofGeorgia's2018GDP.
n Labor Income Impact n
Collectively,the26UniversitySysteminstitutionsgeneratedalaborincomeimpactontheirhostcommunitiesof$8.6billioninFY2019.ThelaborincomereceivedbyresidentsofthecommunitiesthathostUniversitySystemin-stitutionsrepresents68percentofthevalue-addedimpact.LaborincomeforeachinstitutionisreportedinthefourthcolumnofTable2.
n Employment Impact n
TheeconomicimpactofhostinganinstitutionoftheUniversitySystemofGeorgiaprobablyismosteasilyun-derstoodintermsofitseffectsonemployment.Collectively,the26institutionsgeneratedanemploymentimpactof157,770jobsontheirhostcommunitiesinFY2019.Approximately33percent(51,768jobs)ofthesepositionsareon-campus jobsatoneof the institutionsof theUniversitySystemofGeorgia,and67percent (106,002 jobs)areoff-campuspositionsineither theprivateorpublicsectors.Onaverage,foreachjobcreatedoncampustherearetwooff-campusjobsthatexistbecauseofspendingrelatedtotheUniversitySystemofGeorgia.Onaverage,13jobsweregeneratedforeachmilliondollarsofinitialspendingbyUSGinstitutionsandstudentsinFY2019—onaverage$79,908ininitialspendingsupportsonejob. TheemploymentimpactassociatedwiththeUniversitySystemequals3.5percentofallthenonfarmjobsheldbyGeorgians,oraboutonejobin29.Toprovideperspective,therolled-upemploymentimpactoftheUSG’s26institu-tions(157,700jobs)exceededthecombinednumberofjobs(155,484jobs)withGeorgia’stopfiveemployers–FortBenning(40,000jobs),Walmart(34,872jobs),DeltaAirLines(30,813jobs),U.SArmySignalCenterandFortGor-don(25,264jobs),andEmoryUniversity(24,535jobs). EmploymentimpactsinFY2019fortheindividualinstitutionsarereportedinthefifthcolumnofTable2.Foreachinstitution,abreakoutofon-campusandoff-campusjobsthatexistduetoinstitution-relatedspendingisreportedinTable3.
Comparisons to FY 2018 Estimates
Table4reportsthetotaleconomicimpactofallUSGinstitutionsontheirregionaleconomiesinFY2019andFY2018.Initialspendingwas5percenthigherinFY2019thaninFY2018.Theoutput(sales),valueadded(stateGDP),andlaborincomeimpactswere4.6percent,3.5percent,and1.1percenthigherinFY2019thanreportedforFY2018.Incontrast,theemploymentimpactwas6.2percentlowerinFY2019thanreportedforFY2018.ItshouldbenotedthattherewereanunusuallylargenumberofchangesinmethodologywhichlimitscomparabilityoftheestimatesforFY2019toestimatesforearlieryears.Thisexplainswhytheoutputimpactincreasedlessthaninitialspending.Ingeneral,themethodologicalchangesreducedmultipliervalues.Indeed,methodologicalchangesratherthanchangesininitialspendingwhollyaccountforthedecreasedemploymentimpactbetweenFY2018andFY2019. AlthoughthemethodsusedinFY2019aresimilartothoseusedintheFY2018,themethodologicalchangesweregreaterthaninmostyears.ThemostimportantchangeisthattheIMPLANGroupsubstantiallyrevisedtheirregionaleconomicmodelingsystem.Inthismajorrevision(theculminationofthreeyearsofworkbyIMPLANmodelers),manyof themultipliervaluesused toestimateboth thedirectand inducedeconomic impactsdeclined.Althoughthenewversionisasubstantialimprovementoverthepreviousones,it limitscomparabilityofestimatestothoseproduced before. For example, the new platform dramatically improved the social accountingmatrices (SAMs),offeringmorecompletepicturesoftheflowofbothmarketandnon-marketfundsthroughoutthelocaleconomies.Moreover,thenewplatformisbasedonthe2017NAICScodesratherthanthe2012NAICScodes,whichresultedinacompletelynewindustryaggregationschemewith546sectors.Theseandotherimprovementsprovidegreateraccuracy,butreducedmanyofthemultipliervalues.Anothermethodchangeisthattheauthorrevisedestimatesofstudentspendingpersemester.Therevisionsweredesignedtoimproveaccuracy,butlimitthecomparabilityoftheFY2019economicimpactestimatestothoseproducedforprioryears.Morespecifically,newinformationobtainedfromtheCollegeBoard’s“TrendsinCollegePricing2019”andtheU.S.BureauofLaborStatistics2018 Consumer
9
Expenditure Survey(releasedinSeptember2019)wasusedtore-estimatespendingperstudentpersemester.Studentspendingalsowasreallocatedamongexpenditurecategoriesandindustrysectors.Hence,thecomparisonreportedinTables4and5shouldbeusedwithcaution.
Limitations and Topics for Future Research
Becausethegoalofthisstudywastoestimatetheeconomicimpactofall26institutions,certainnecessaryas-sumptionsweredesignedtoworkwellfortheaverageinstitution,butmayleadtoanover-orunder-estimateoftheeconomiccontributionthataspecificinstitutionmakestoitshostcommunity.Forexample,detailedsurveysofactualspendingbystudentsatvariousinstitutionscouldhelptorefineestimatesofinitialspendingbystudents. Duetobothresourceanddatalimitations,severalimportanttypesofshort-termcollegeoruniversity-relatedex-penditureswerenotestimated.Forinstance,studiescouldbeconductedtomeasurespendingbyvisitorstotheinstitu-tionsandspendingbyretireeswhostillliveinthehostcommunities.Inaddition,itwouldbeworthwhiletoinvestigateexpenditures supported by the non-institutional income of each institution’s employees. Such incomemay comefromanemployee’sconsulting,investments,andotherpersonalbusinessactivities.Moreover,othermembersofanemployee’shouseholdoftensupplementtheirtotalhouseholdincome.Employees’householdincomesalsocanbesupplementedviatransfers,inheritancesorgifts.Atleastaportionofincomederivedfromthesesourceswouldnotcometothecommunitythathoststheinstitutionifthatperson’sjobatthecollege/universitydidnotexist. Sincethefocushereisonlyontheshort-termimpactsofseveraltypesofcollege-oruniversity-relatedspending,therewasnoattempttoevaluatethelong-termimpactsoftheUniversitySystem'sinstitutionsontheeconomicdevel-opmentofthehostcommunitiesandthestate.Afterall,collegesanduniversitiesnotonlyspendmoneyyearbyyear,butalsohavelong-termimpactsonthelaborforce,localbusinessandindustry,nonprofits,andlocalgovernment. Localbusinessesbenefitfromeasyaccesstoalargepoolofpart-timeandfull-timeworkers.Moreover,companiesandagenciesthatdependonhighlyspecializedskillsoftenclusterarounduniversities.Thismaybeparticularlytrueofhigh-techandinnovation-basedcompanies,whichareexpectedtoaccountforadisproportionatelyhighshareoffutureeconomicgrowth. Finally,theoutreachandserviceunitsofthecollegeoruniversityprovidevaluableservicestolocalbusinessesandhouseholds.Culturalandeducationalprogramsandfacilitiesoftenareavailabletothegeneralpublicandprovideintangiblebenefitstothehostcommunitybyimprovingresidents'qualityoflife.
Summary
ThefundamentalfindingofthisstudyisthateachoftheUniversitySystemofGeorgia’sinstitutionscreatessub-stantialeconomicimpactsintermsofoutput,valueadded,laborincome,andemployment.ThecombinedeconomicimpactoftheUniversitySystem’sinstitutionsontheirhostcommunitiesinFY2019includes:
n$18.5billioninoutput(sales); n$12.6billioninvaluedadded(grossregionalproduct); n$8.6billioninlaborincome;and n157,770full-andpart-timejobs.
Theseeconomicimpactsdemonstratethatcontinuedemphasisonhighereducationasanenduringpillaroftheregion-aleconomytranslatesintojobs,higherincomes,andgreaterproductionofgoodsandservicesforlocalhouseholdsandbusinesses.
10
Figure 1Schematic Representation of Impact Relationship
Direct Direct and Induced Impacts TotalExpenditures (Multiplier Effects) Economic Impact
+ =
Figure 2How Multipliers Capture the Impact of Re-spending
Initial Direct or Indirect Impact $100 First Round of Re-spending $50 re-spent locally $50 leakage* Second Round of Re-spending $25 re-spent locally $25 leakage Third Round of Re-spending $12.50 re-spent locally $12.50 leakage Fourth Round of Re-spending $6.25 re-apent locally $6.25 leakage Fifth Round of Re-spending $3.12 re-spent locally $3.12 leakage Sixth Round of Re-spending $1.56 re-spent locally $1.56 leakage Seventh Round of Re-spending $.78 re-spent locally $.78 leakage
Total Economic Impact $200 Total Leakage $100 *Leakage indicates amounts spent outside area and not re-circulated locally.
11
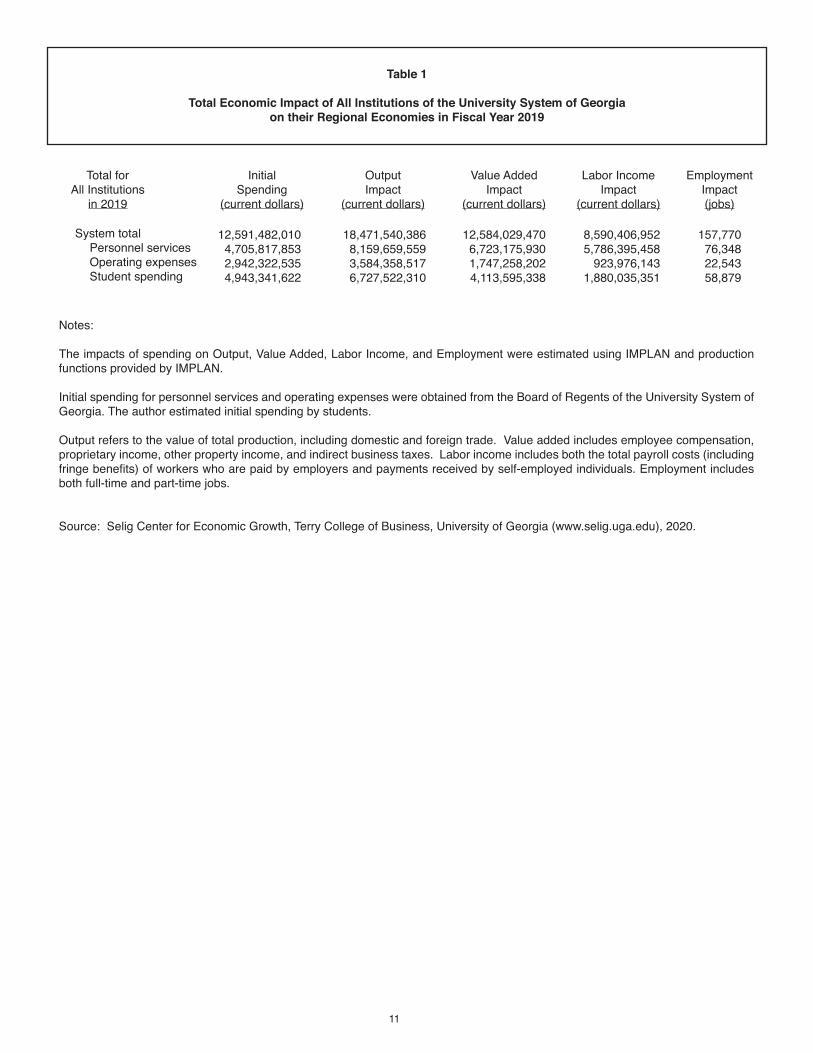
Table 1
Total Economic Impact of All Institutions of the University System of Georgiaon their Regional Economies in Fiscal Year 2019
Notes:
The impacts of spending on Output, Value Added, Labor Income, and Employment were estimated using IMPLAN and production functions provided by IMPLAN.
Initial spending for personnel services and operating expenses were obtained from the Board of Regents of the University System of Georgia. The author estimated initial spending by students.
Output refers to the value of total production, including domestic and foreign trade. Value added includes employee compensation, proprietary income, other property income, and indirect business taxes. Labor income includes both the total payroll costs (including fringe benefits) of workers who are paid by employers and payments received by self-employed individuals. Employment includes both full-time and part-time jobs.
Source: Selig Center for Economic Growth, Terry College of Business, University of Georgia (www.selig.uga.edu), 2020.
Total for Initial Output Value Added Labor Income Employment All Institutions Spending Impact Impact Impact Impact in 2019 (current dollars) (current dollars) (current dollars) (current dollars) (jobs)
System total Personnel services Operating expenses Student spending
12,591,482,010 18,471,540,386 12,584,029,470 8,590,406,952 157,770 4,705,817,853 8,159,659,559 6,723,175,930 5,786,395,458 76,348 2,942,322,535 3,584,358,517 1,747,258,202 923,976,143 22,543 4,943,341,622 6,727,522,310 4,113,595,338 1,880,035,351 58,879
12
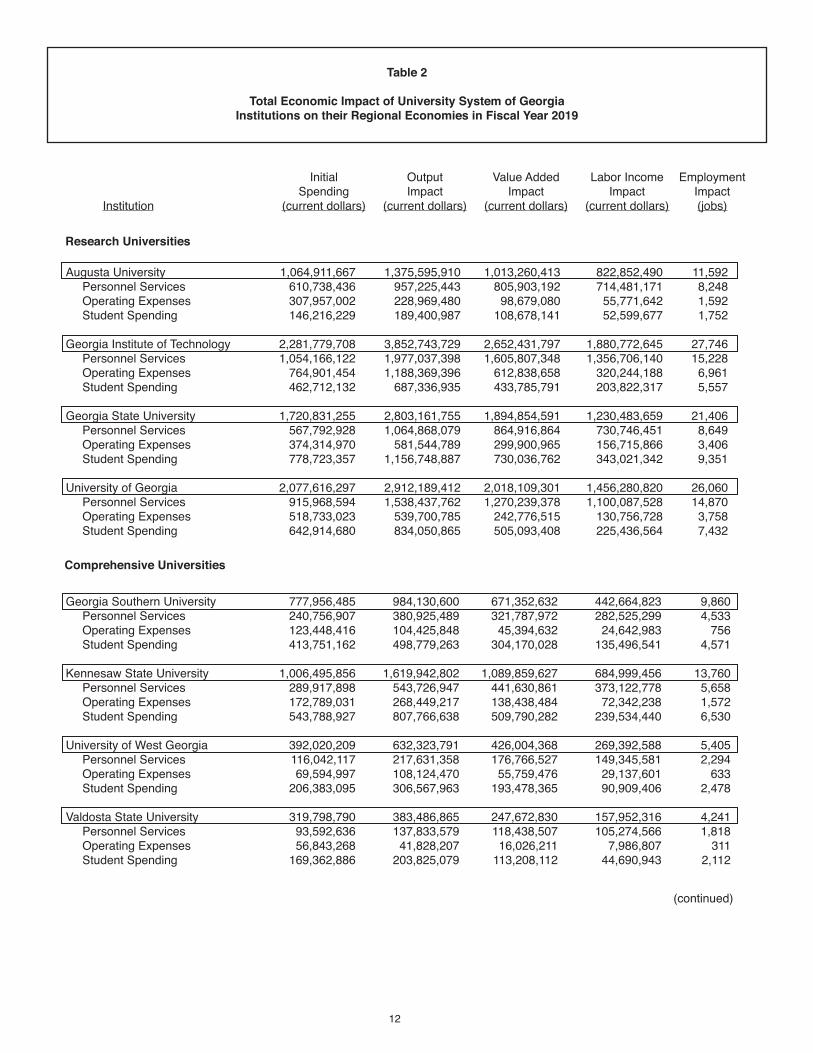
Table 2
Total Economic Impact of University System of GeorgiaInstitutions on their Regional Economies in Fiscal Year 2019
(continued)
Comprehensive Universities
Initial Output Value Added Labor Income Employment Spending Impact Impact Impact Impact Institution (current dollars) (current dollars) (current dollars) (current dollars) (jobs)
Research Universities
Augusta University 1,064,911,667 1,375,595,910 1,013,260,413 822,852,490 11,592 Personnel Services 610,738,436 957,225,443 805,903,192 714,481,171 8,248 Operating Expenses 307,957,002 228,969,480 98,679,080 55,771,642 1,592 Student Spending 146,216,229 189,400,987 108,678,141 52,599,677 1,752 Georgia Institute of Technology 2,281,779,708 3,852,743,729 2,652,431,797 1,880,772,645 27,746 Personnel Services 1,054,166,122 1,977,037,398 1,605,807,348 1,356,706,140 15,228 Operating Expenses 764,901,454 1,188,369,396 612,838,658 320,244,188 6,961 Student Spending 462,712,132 687,336,935 433,785,791 203,822,317 5,557 Georgia State University 1,720,831,255 2,803,161,755 1,894,854,591 1,230,483,659 21,406 Personnel Services 567,792,928 1,064,868,079 864,916,864 730,746,451 8,649 Operating Expenses 374,314,970 581,544,789 299,900,965 156,715,866 3,406 Student Spending 778,723,357 1,156,748,887 730,036,762 343,021,342 9,351 University of Georgia 2,077,616,297 2,912,189,412 2,018,109,301 1,456,280,820 26,060 Personnel Services 915,968,594 1,538,437,762 1,270,239,378 1,100,087,528 14,870 Operating Expenses 518,733,023 539,700,785 242,776,515 130,756,728 3,758 Student Spending 642,914,680 834,050,865 505,093,408 225,436,564 7,432
Georgia Southern University 777,956,485 984,130,600 671,352,632 442,664,823 9,860 Personnel Services 240,756,907 380,925,489 321,787,972 282,525,299 4,533 Operating Expenses 123,448,416 104,425,848 45,394,632 24,642,983 756 Student Spending 413,751,162 498,779,263 304,170,028 135,496,541 4,571 Kennesaw State University 1,006,495,856 1,619,942,802 1,089,859,627 684,999,456 13,760 Personnel Services 289,917,898 543,726,947 441,630,861 373,122,778 5,658 Operating Expenses 172,789,031 268,449,217 138,438,484 72,342,238 1,572 Student Spending 543,788,927 807,766,638 509,790,282 239,534,440 6,530 University of West Georgia 392,020,209 632,323,791 426,004,368 269,392,588 5,405 Personnel Services 116,042,117 217,631,358 176,766,527 149,345,581 2,294 Operating Expenses 69,594,997 108,124,470 55,759,476 29,137,601 633 Student Spending 206,383,095 306,567,963 193,478,365 90,909,406 2,478 Valdosta State University 319,798,790 383,486,865 247,672,830 157,952,316 4,241 Personnel Services 93,592,636 137,833,579 118,438,507 105,274,566 1,818 Operating Expenses 56,843,268 41,828,207 16,026,211 7,986,807 311 Student Spending 169,362,886 203,825,079 113,208,112 44,690,943 2,112
13
(continued)
Table 2 (continued)
Total Economic Impact of University System of GeorgiaInstitutions on their Regional Economies in Fiscal Year 2019
State Universities
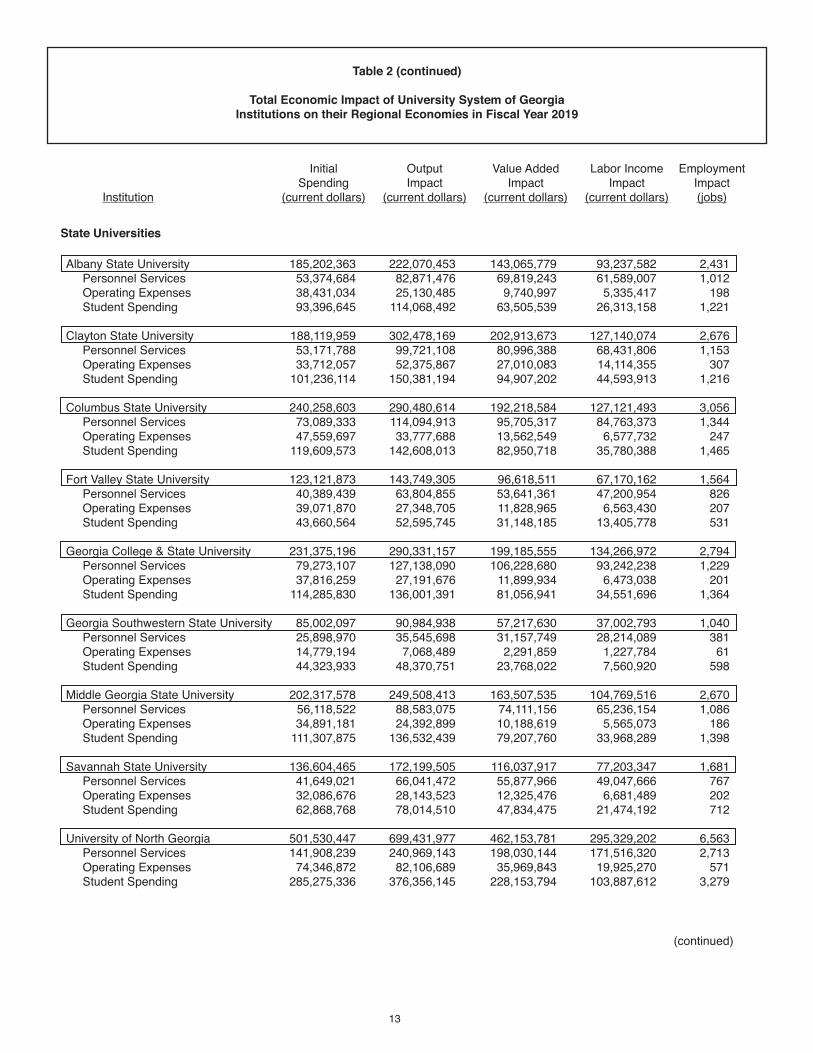
Initial Output Value Added Labor Income Employment Spending Impact Impact Impact Impact Institution (current dollars) (current dollars) (current dollars) (current dollars) (jobs)
Albany State University 185,202,363 222,070,453 143,065,779 93,237,582 2,431 Personnel Services 53,374,684 82,871,476 69,819,243 61,589,007 1,012 Operating Expenses 38,431,034 25,130,485 9,740,997 5,335,417 198 Student Spending 93,396,645 114,068,492 63,505,539 26,313,158 1,221 Clayton State University 188,119,959 302,478,169 202,913,673 127,140,074 2,676 Personnel Services 53,171,788 99,721,108 80,996,388 68,431,806 1,153 Operating Expenses 33,712,057 52,375,867 27,010,083 14,114,355 307 Student Spending 101,236,114 150,381,194 94,907,202 44,593,913 1,216 Columbus State University 240,258,603 290,480,614 192,218,584 127,121,493 3,056 Personnel Services 73,089,333 114,094,913 95,705,317 84,763,373 1,344 Operating Expenses 47,559,697 33,777,688 13,562,549 6,577,732 247 Student Spending 119,609,573 142,608,013 82,950,718 35,780,388 1,465 Fort Valley State University 123,121,873 143,749,305 96,618,511 67,170,162 1,564 Personnel Services 40,389,439 63,804,855 53,641,361 47,200,954 826 Operating Expenses 39,071,870 27,348,705 11,828,965 6,563,430 207 Student Spending 43,660,564 52,595,745 31,148,185 13,405,778 531 Georgia College & State University 231,375,196 290,331,157 199,185,555 134,266,972 2,794 Personnel Services 79,273,107 127,138,090 106,228,680 93,242,238 1,229 Operating Expenses 37,816,259 27,191,676 11,899,934 6,473,038 201 Student Spending 114,285,830 136,001,391 81,056,941 34,551,696 1,364 Georgia Southwestern State University 85,002,097 90,984,938 57,217,630 37,002,793 1,040 Personnel Services 25,898,970 35,545,698 31,157,749 28,214,089 381 Operating Expenses 14,779,194 7,068,489 2,291,859 1,227,784 61 Student Spending 44,323,933 48,370,751 23,768,022 7,560,920 598 Middle Georgia State University 202,317,578 249,508,413 163,507,535 104,769,516 2,670 Personnel Services 56,118,522 88,583,075 74,111,156 65,236,154 1,086 Operating Expenses 34,891,181 24,392,899 10,188,619 5,565,073 186 Student Spending 111,307,875 136,532,439 79,207,760 33,968,289 1,398 Savannah State University 136,604,465 172,199,505 116,037,917 77,203,347 1,681 Personnel Services 41,649,021 66,041,472 55,877,966 49,047,666 767 Operating Expenses 32,086,676 28,143,523 12,325,476 6,681,489 202 Student Spending 62,868,768 78,014,510 47,834,475 21,474,192 712 University of North Georgia 501,530,447 699,431,977 462,153,781 295,329,202 6,563 Personnel Services 141,908,239 240,969,143 198,030,144 171,516,320 2,713 Operating Expenses 74,346,872 82,106,689 35,969,843 19,925,270 571 Student Spending 285,275,336 376,356,145 228,153,794 103,887,612 3,279
14
(continued)
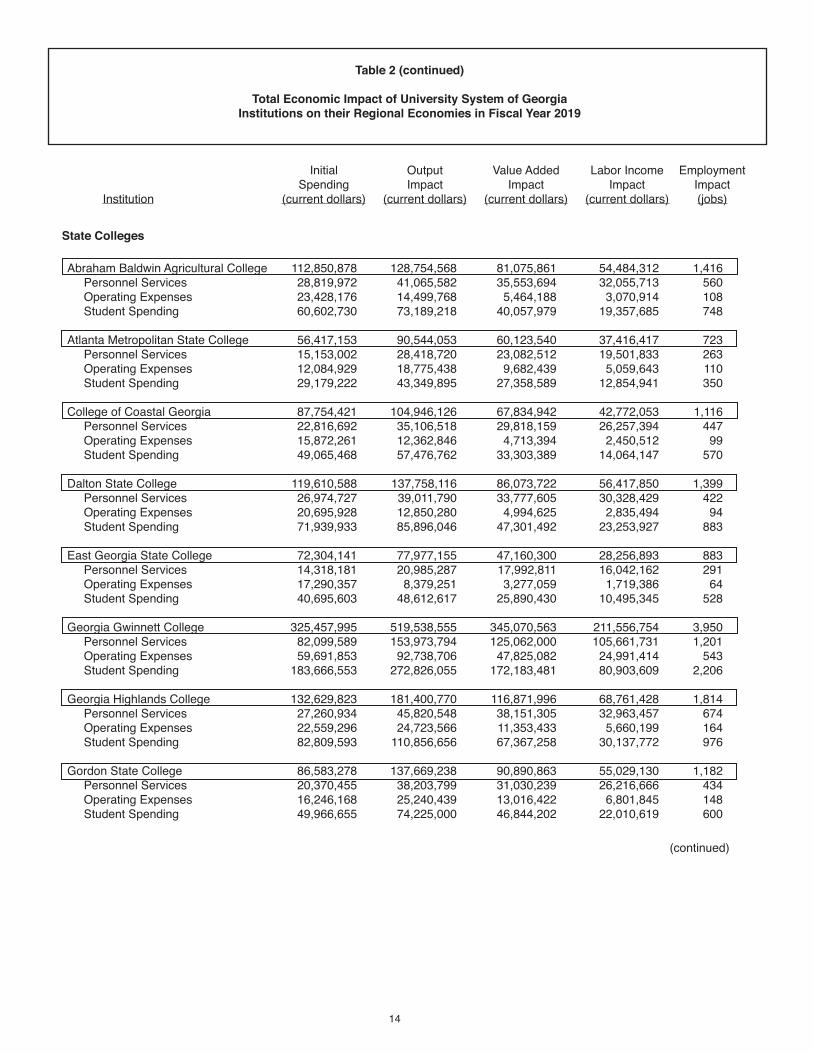
Table 2 (continued)
Total Economic Impact of University System of GeorgiaInstitutions on their Regional Economies in Fiscal Year 2019
State Colleges
Initial Output Value Added Labor Income Employment Spending Impact Impact Impact Impact Institution (current dollars) (current dollars) (current dollars) (current dollars) (jobs)
Abraham Baldwin Agricultural College 112,850,878 128,754,568 81,075,861 54,484,312 1,416 Personnel Services 28,819,972 41,065,582 35,553,694 32,055,713 560 Operating Expenses 23,428,176 14,499,768 5,464,188 3,070,914 108 Student Spending 60,602,730 73,189,218 40,057,979 19,357,685 748 Atlanta Metropolitan State College 56,417,153 90,544,053 60,123,540 37,416,417 723 Personnel Services 15,153,002 28,418,720 23,082,512 19,501,833 263 Operating Expenses 12,084,929 18,775,438 9,682,439 5,059,643 110 Student Spending 29,179,222 43,349,895 27,358,589 12,854,941 350 College of Coastal Georgia 87,754,421 104,946,126 67,834,942 42,772,053 1,116 Personnel Services 22,816,692 35,106,518 29,818,159 26,257,394 447 Operating Expenses 15,872,261 12,362,846 4,713,394 2,450,512 99 Student Spending 49,065,468 57,476,762 33,303,389 14,064,147 570 Dalton State College 119,610,588 137,758,116 86,073,722 56,417,850 1,399 Personnel Services 26,974,727 39,011,790 33,777,605 30,328,429 422 Operating Expenses 20,695,928 12,850,280 4,994,625 2,835,494 94 Student Spending 71,939,933 85,896,046 47,301,492 23,253,927 883 East Georgia State College 72,304,141 77,977,155 47,160,300 28,256,893 883 Personnel Services 14,318,181 20,985,287 17,992,811 16,042,162 291 Operating Expenses 17,290,357 8,379,251 3,277,059 1,719,386 64 Student Spending 40,695,603 48,612,617 25,890,430 10,495,345 528 Georgia Gwinnett College 325,457,995 519,538,555 345,070,563 211,556,754 3,950 Personnel Services 82,099,589 153,973,794 125,062,000 105,661,731 1,201 Operating Expenses 59,691,853 92,738,706 47,825,082 24,991,414 543 Student Spending 183,666,553 272,826,055 172,183,481 80,903,609 2,206 Georgia Highlands College 132,629,823 181,400,770 116,871,996 68,761,428 1,814 Personnel Services 27,260,934 45,820,548 38,151,305 32,963,457 674 Operating Expenses 22,559,296 24,723,566 11,353,433 5,660,199 164 Student Spending 82,809,593 110,856,656 67,367,258 30,137,772 976 Gordon State College 86,583,278 137,669,238 90,890,863 55,029,130 1,182 Personnel Services 20,370,455 38,203,799 31,030,239 26,216,666 434 Operating Expenses 16,246,168 25,240,439 13,016,422 6,801,845 148 Student Spending 49,966,655 74,225,000 46,844,202 22,010,619 600
15
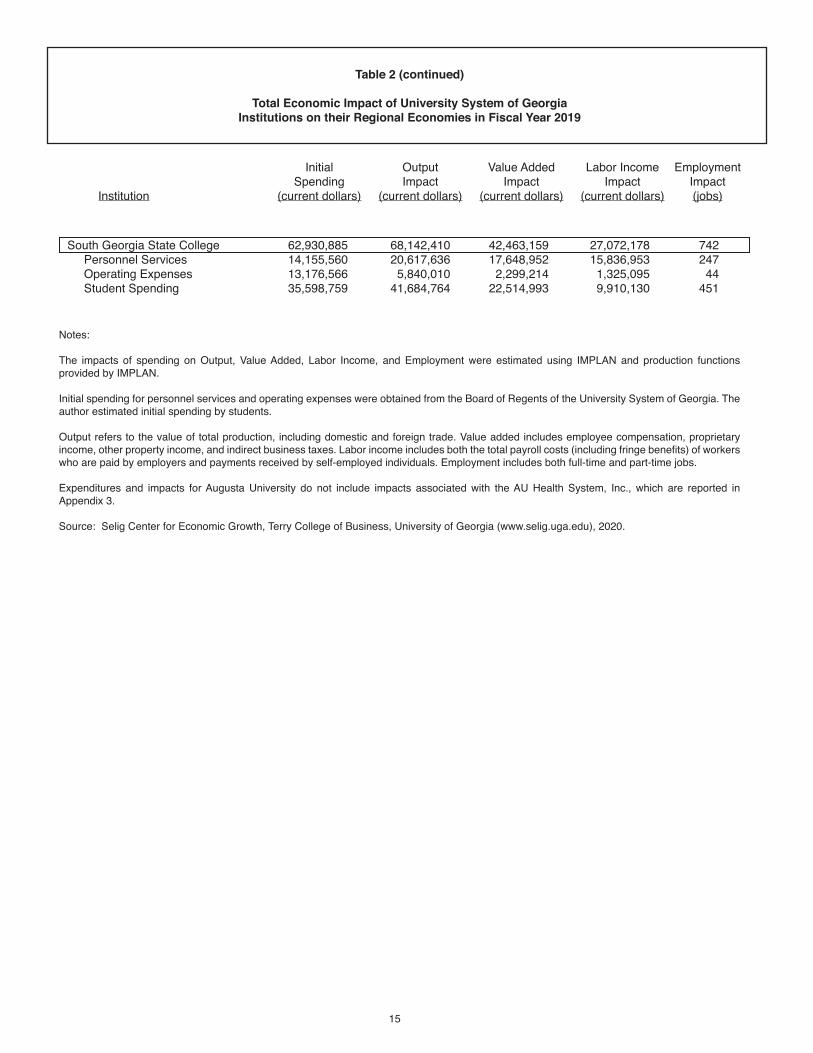
Table 2 (continued)
Total Economic Impact of University System of GeorgiaInstitutions on their Regional Economies in Fiscal Year 2019
Notes:
The impacts of spending on Output, Value Added, Labor Income, and Employment were estimated using IMPLAN and production functions provided by IMPLAN.
Initial spending for personnel services and operating expenses were obtained from the Board of Regents of the University System of Georgia. The author estimated initial spending by students.
Output refers to the value of total production, including domestic and foreign trade. Value added includes employee compensation, proprietary income, other property income, and indirect business taxes. Labor income includes both the total payroll costs (including fringe benefits) of workers who are paid by employers and payments received by self-employed individuals. Employment includes both full-time and part-time jobs.
Expenditures and impacts for Augusta University do not include impacts associated with the AU Health System, Inc., which are reported in Appendix 3.
Source: Selig Center for Economic Growth, Terry College of Business, University of Georgia (www.selig.uga.edu), 2020.
Initial Output Value Added Labor Income Employment Spending Impact Impact Impact Impact Institution (current dollars) (current dollars) (current dollars) (current dollars) (jobs)
South Georgia State College 62,930,885 68,142,410 42,463,159 27,072,178 742 Personnel Services 14,155,560 20,617,636 17,648,952 15,836,953 247 Operating Expenses 13,176,566 5,840,010 2,299,214 1,325,095 44 Student Spending 35,598,759 41,684,764 22,514,993 9,910,130 451
16
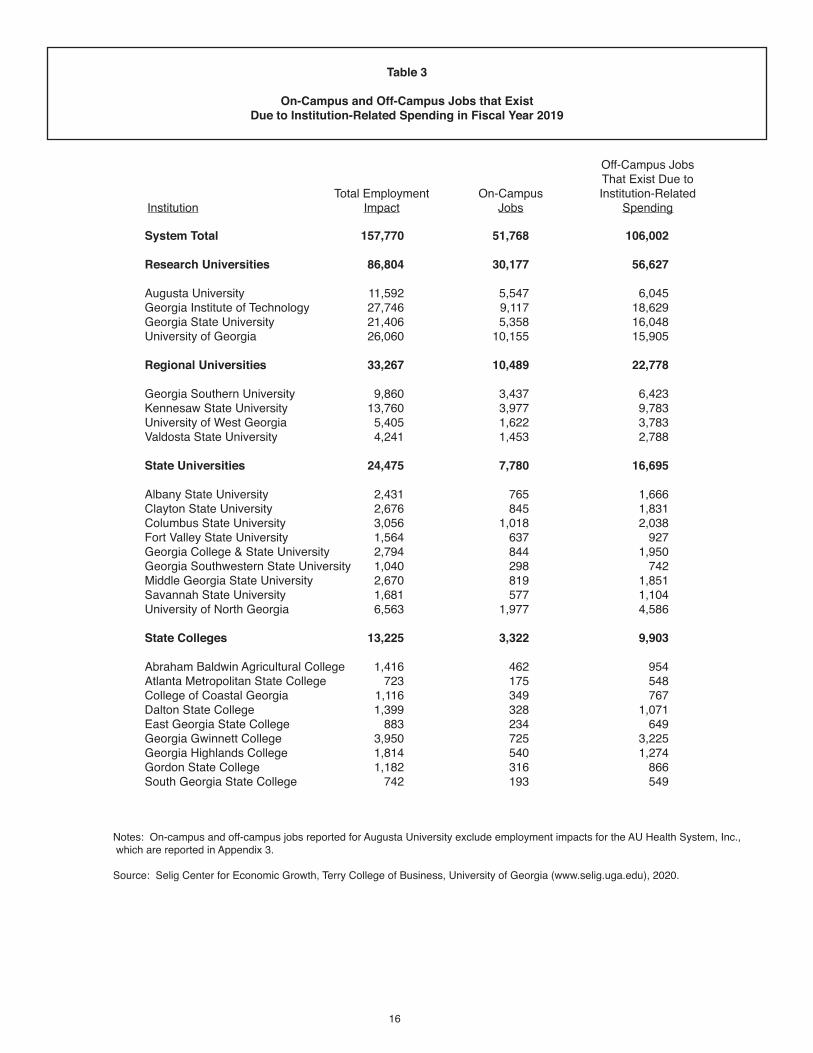
Table 3
On-Campus and Off-Campus Jobs that Exist Due to Institution-Related Spending in Fiscal Year 2019
Off-Campus Jobs That Exist Due to Total Employment On-Campus Institution-Related Institution Impact Jobs Spending
Notes: On-campus and off-campus jobs reported for Augusta University exclude employment impacts for the AU Health System, Inc., which are reported in Appendix 3.
Source: Selig Center for Economic Growth, Terry College of Business, University of Georgia (www.selig.uga.edu), 2020.
System Total 157,770 51,768 106,002 Research Universities 86,804 30,177 56,627 Augusta University 11,592 5,547 6,045Georgia Institute of Technology 27,746 9,117 18,629Georgia State University 21,406 5,358 16,048University of Georgia 26,060 10,155 15,905 Regional Universities 33,267 10,489 22,778 Georgia Southern University 9,860 3,437 6,423Kennesaw State University 13,760 3,977 9,783University of West Georgia 5,405 1,622 3,783Valdosta State University 4,241 1,453 2,788 State Universities 24,475 7,780 16,695 Albany State University 2,431 765 1,666Clayton State University 2,676 845 1,831Columbus State University 3,056 1,018 2,038Fort Valley State University 1,564 637 927Georgia College & State University 2,794 844 1,950Georgia Southwestern State University 1,040 298 742Middle Georgia State University 2,670 819 1,851Savannah State University 1,681 577 1,104University of North Georgia 6,563 1,977 4,586 State Colleges 13,225 3,322 9,903 Abraham Baldwin Agricultural College 1,416 462 954Atlanta Metropolitan State College 723 175 548College of Coastal Georgia 1,116 349 767Dalton State College 1,399 328 1,071East Georgia State College 883 234 649Georgia Gwinnett College 3,950 725 3,225Georgia Highlands College 1,814 540 1,274Gordon State College 1,182 316 866South Georgia State College 742 193 549
17
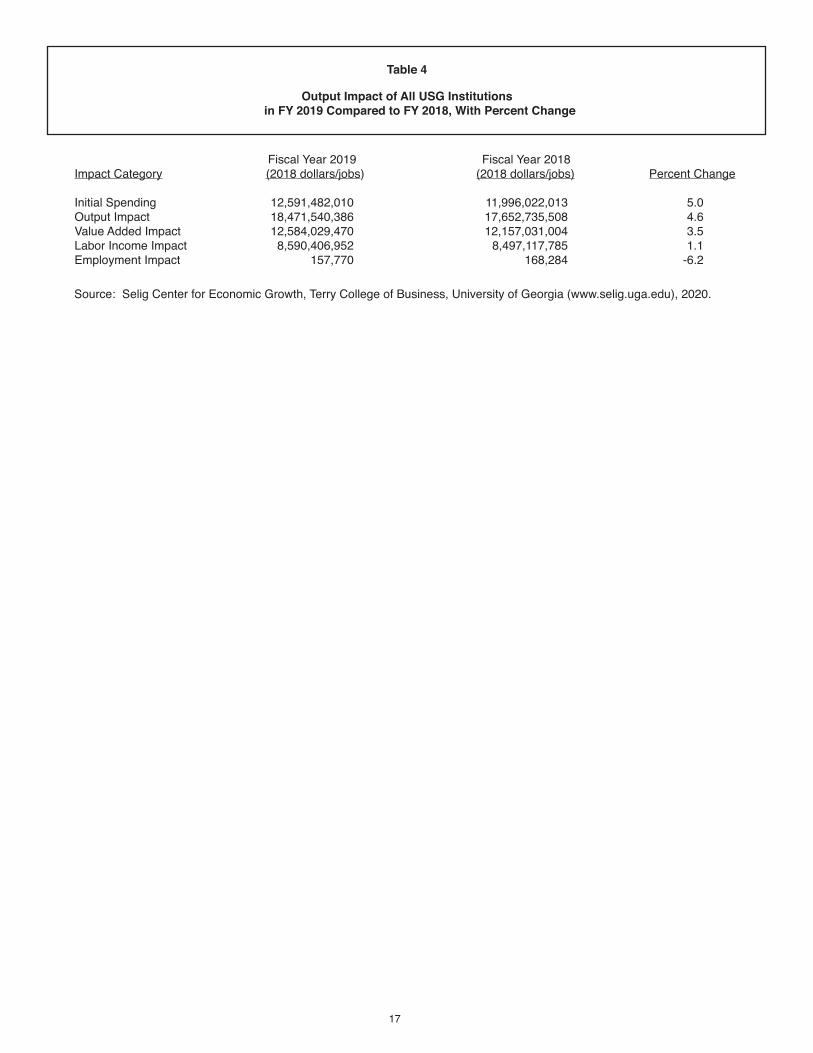
Table 4
Output Impact of All USG Institutions in FY 2019 Compared to FY 2018, With Percent Change
Fiscal Year 2019 Fiscal Year 2018 Impact Category (2018 dollars/jobs) (2018 dollars/jobs) Percent Change Initial Spending 12,591,482,010 11,996,022,013 5.0Output Impact 18,471,540,386 17,652,735,508 4.6Value Added Impact 12,584,029,470 12,157,031,004 3.5Labor Income Impact 8,590,406,952 8,497,117,785 1.1Employment Impact 157,770 168,284 -6.2
Source: Selig Center for Economic Growth, Terry College of Business, University of Georgia (www.selig.uga.edu), 2020.
18
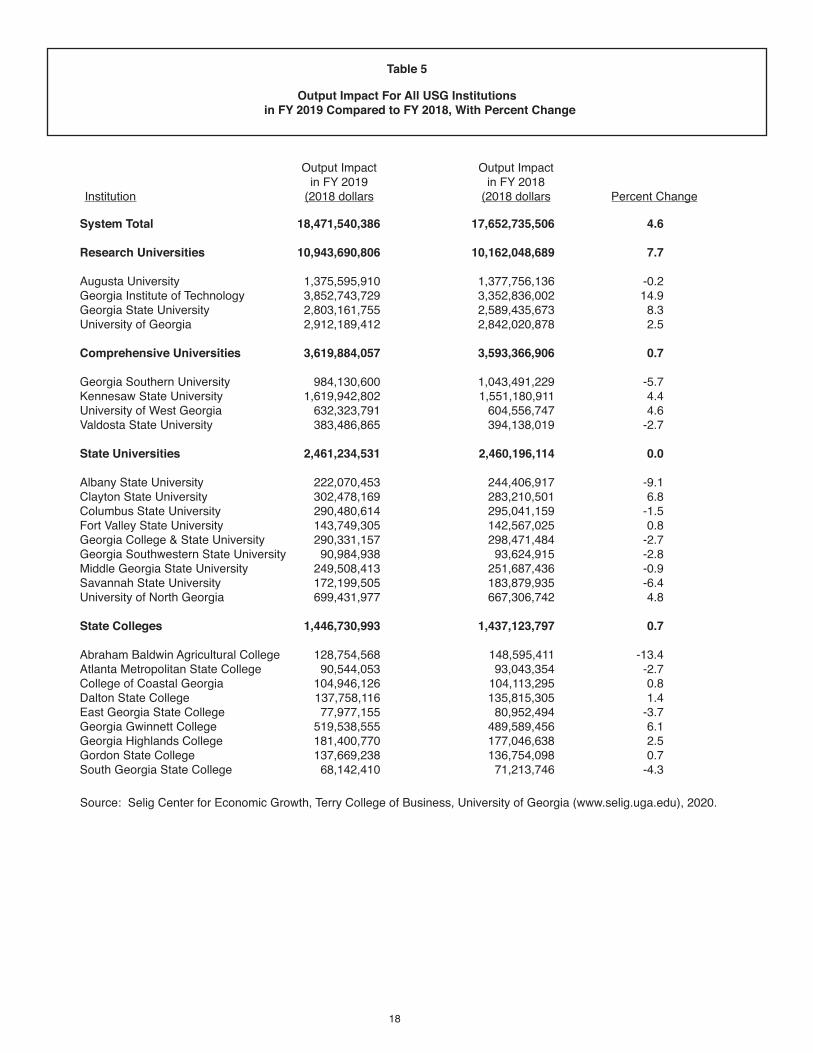
Table 5
Output Impact For All USG Institutions in FY 2019 Compared to FY 2018, With Percent Change
Output Impact Output Impact in FY 2019 in FY 2018 Institution (2018 dollars (2018 dollars Percent Change
System Total 18,471,540,386 17,652,735,506 4.6 Research Universities 10,943,690,806 10,162,048,689 7.7 Augusta University 1,375,595,910 1,377,756,136 -0.2Georgia Institute of Technology 3,852,743,729 3,352,836,002 14.9Georgia State University 2,803,161,755 2,589,435,673 8.3University of Georgia 2,912,189,412 2,842,020,878 2.5 Comprehensive Universities 3,619,884,057 3,593,366,906 0.7 Georgia Southern University 984,130,600 1,043,491,229 -5.7Kennesaw State University 1,619,942,802 1,551,180,911 4.4University of West Georgia 632,323,791 604,556,747 4.6Valdosta State University 383,486,865 394,138,019 -2.7 State Universities 2,461,234,531 2,460,196,114 0.0 Albany State University 222,070,453 244,406,917 -9.1Clayton State University 302,478,169 283,210,501 6.8Columbus State University 290,480,614 295,041,159 -1.5Fort Valley State University 143,749,305 142,567,025 0.8Georgia College & State University 290,331,157 298,471,484 -2.7Georgia Southwestern State University 90,984,938 93,624,915 -2.8Middle Georgia State University 249,508,413 251,687,436 -0.9Savannah State University 172,199,505 183,879,935 -6.4University of North Georgia 699,431,977 667,306,742 4.8 State Colleges 1,446,730,993 1,437,123,797 0.7 Abraham Baldwin Agricultural College 128,754,568 148,595,411 -13.4Atlanta Metropolitan State College 90,544,053 93,043,354 -2.7College of Coastal Georgia 104,946,126 104,113,295 0.8Dalton State College 137,758,116 135,815,305 1.4East Georgia State College 77,977,155 80,952,494 -3.7Georgia Gwinnett College 519,538,555 489,589,456 6.1Georgia Highlands College 181,400,770 177,046,638 2.5Gordon State College 137,669,238 136,754,098 0.7South Georgia State College 68,142,410 71,213,746 -4.3
Source: Selig Center for Economic Growth, Terry College of Business, University of Georgia (www.selig.uga.edu), 2020.
19
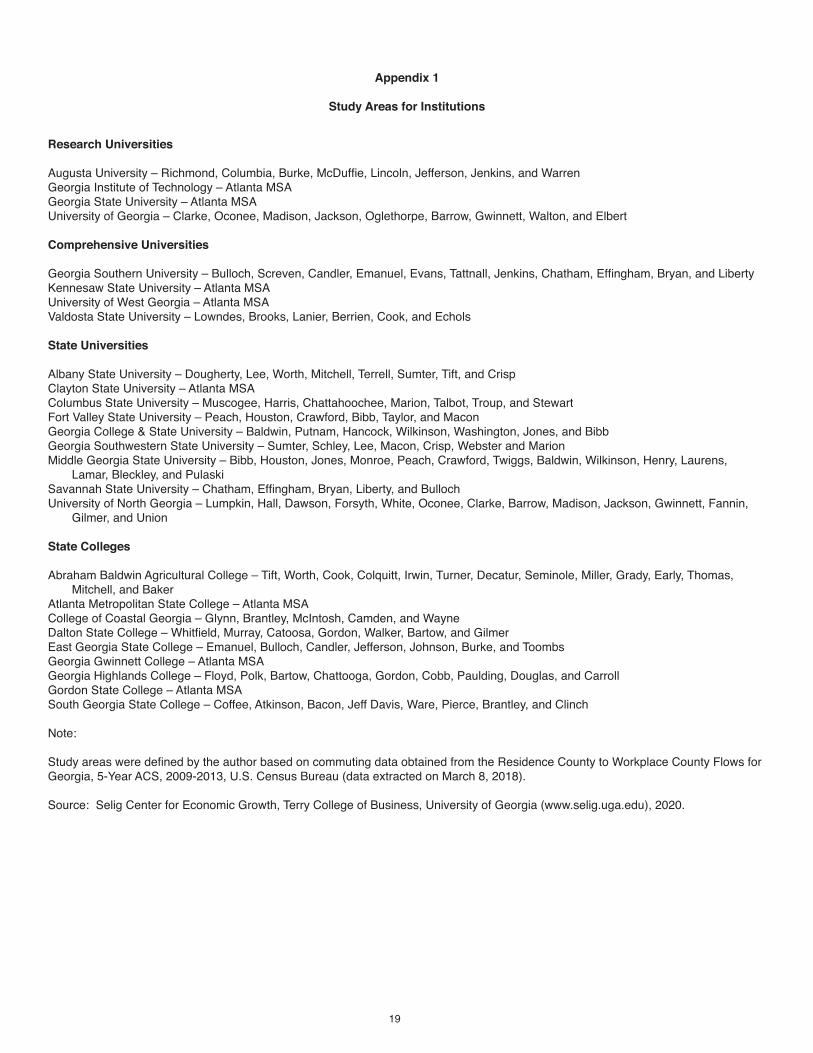
Appendix 1
Study Areas for Institutions
Research Universities
Augusta University – Richmond, Columbia, Burke, McDuffie, Lincoln, Jefferson, Jenkins, and WarrenGeorgia Institute of Technology – Atlanta MSAGeorgia State University – Atlanta MSAUniversity of Georgia – Clarke, Oconee, Madison, Jackson, Oglethorpe, Barrow, Gwinnett, Walton, and Elbert
Comprehensive Universities
Georgia Southern University – Bulloch, Screven, Candler, Emanuel, Evans, Tattnall, Jenkins, Chatham, Effingham, Bryan, and Liberty Kennesaw State University – Atlanta MSAUniversity of West Georgia – Atlanta MSAValdosta State University – Lowndes, Brooks, Lanier, Berrien, Cook, and Echols
State Universities
Albany State University – Dougherty, Lee, Worth, Mitchell, Terrell, Sumter, Tift, and CrispClayton State University – Atlanta MSAColumbus State University – Muscogee, Harris, Chattahoochee, Marion, Talbot, Troup, and StewartFort Valley State University – Peach, Houston, Crawford, Bibb, Taylor, and MaconGeorgia College & State University – Baldwin, Putnam, Hancock, Wilkinson, Washington, Jones, and BibbGeorgia Southwestern State University – Sumter, Schley, Lee, Macon, Crisp, Webster and MarionMiddle Georgia State University – Bibb, Houston, Jones, Monroe, Peach, Crawford, Twiggs, Baldwin, Wilkinson, Henry, Laurens, Lamar, Bleckley, and PulaskiSavannah State University – Chatham, Effingham, Bryan, Liberty, and BullochUniversity of North Georgia – Lumpkin, Hall, Dawson, Forsyth, White, Oconee, Clarke, Barrow, Madison, Jackson, Gwinnett, Fannin,
Gilmer, and Union
State Colleges
Abraham Baldwin Agricultural College – Tift, Worth, Cook, Colquitt, Irwin, Turner, Decatur, Seminole, Miller, Grady, Early, Thomas, Mitchell, and Baker Atlanta Metropolitan State College – Atlanta MSACollege of Coastal Georgia – Glynn, Brantley, McIntosh, Camden, and WayneDalton State College – Whitfield, Murray, Catoosa, Gordon, Walker, Bartow, and GilmerEast Georgia State College – Emanuel, Bulloch, Candler, Jefferson, Johnson, Burke, and ToombsGeorgia Gwinnett College – Atlanta MSAGeorgia Highlands College – Floyd, Polk, Bartow, Chattooga, Gordon, Cobb, Paulding, Douglas, and CarrollGordon State College – Atlanta MSASouth Georgia State College – Coffee, Atkinson, Bacon, Jeff Davis, Ware, Pierce, Brantley, and Clinch
Note:
Study areas were defined by the author based on commuting data obtained from the Residence County to Workplace County Flows for Georgia, 5-Year ACS, 2009-2013, U.S. Census Bureau (data extracted on March 8, 2018).
Source: Selig Center for Economic Growth, Terry College of Business, University of Georgia (www.selig.uga.edu), 2020.
20
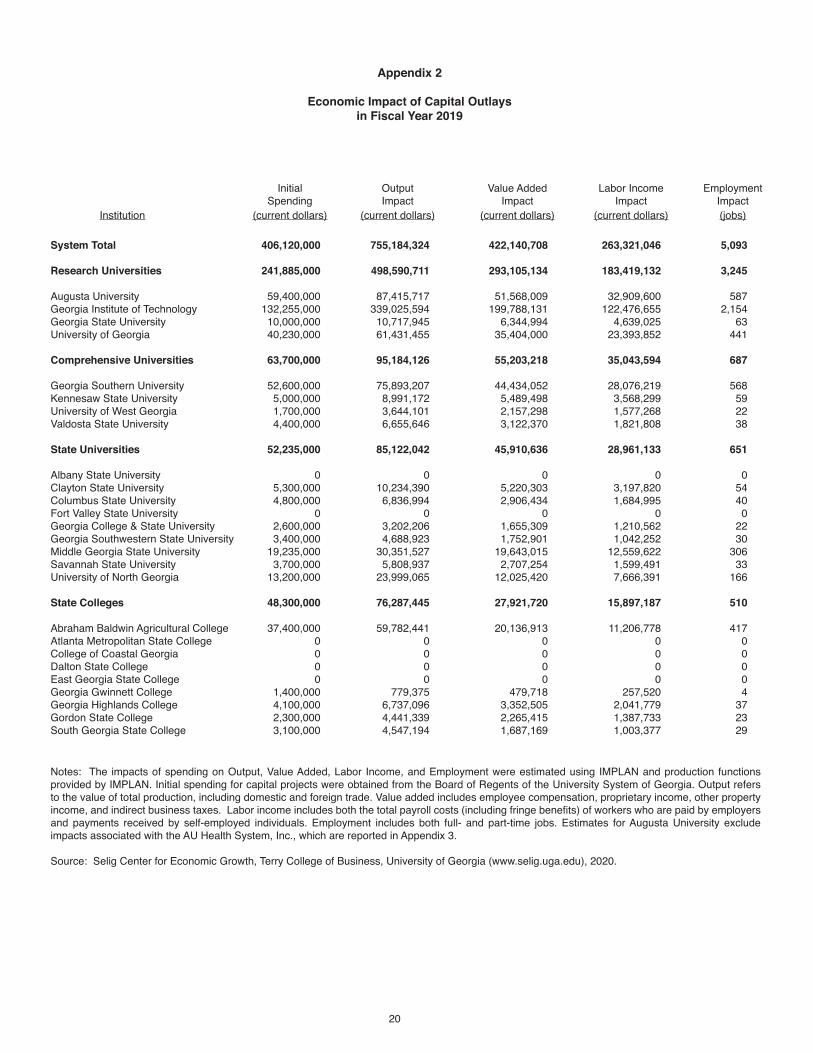
Appendix 2
Economic Impact of Capital Outlaysin Fiscal Year 2019
Initial Output Value Added Labor Income Employment Spending Impact Impact Impact Impact Institution (current dollars) (current dollars) (current dollars) (current dollars) (jobs)
Notes: The impacts of spending on Output, Value Added, Labor Income, and Employment were estimated using IMPLAN and production functions provided by IMPLAN. Initial spending for capital projects were obtained from the Board of Regents of the University System of Georgia. Output refers to the value of total production, including domestic and foreign trade. Value added includes employee compensation, proprietary income, other property income, and indirect business taxes. Labor income includes both the total payroll costs (including fringe benefits) of workers who are paid by employers and payments received by self-employed individuals. Employment includes both full- and part-time jobs. Estimates for Augusta University exclude impacts associated with the AU Health System, Inc., which are reported in Appendix 3. Source: Selig Center for Economic Growth, Terry College of Business, University of Georgia (www.selig.uga.edu), 2020.
System Total 406,120,000 755,184,324 422,140,708 263,321,046 5,093 Research Universities 241,885,000 498,590,711 293,105,134 183,419,132 3,245 Augusta University 59,400,000 87,415,717 51,568,009 32,909,600 587Georgia Institute of Technology 132,255,000 339,025,594 199,788,131 122,476,655 2,154Georgia State University 10,000,000 10,717,945 6,344,994 4,639,025 63University of Georgia 40,230,000 61,431,455 35,404,000 23,393,852 441 Comprehensive Universities 63,700,000 95,184,126 55,203,218 35,043,594 687 Georgia Southern University 52,600,000 75,893,207 44,434,052 28,076,219 568Kennesaw State University 5,000,000 8,991,172 5,489,498 3,568,299 59University of West Georgia 1,700,000 3,644,101 2,157,298 1,577,268 22Valdosta State University 4,400,000 6,655,646 3,122,370 1,821,808 38 State Universities 52,235,000 85,122,042 45,910,636 28,961,133 651 Albany State University 0 0 0 0 0Clayton State University 5,300,000 10,234,390 5,220,303 3,197,820 54Columbus State University 4,800,000 6,836,994 2,906,434 1,684,995 40Fort Valley State University 0 0 0 0 0Georgia College & State University 2,600,000 3,202,206 1,655,309 1,210,562 22Georgia Southwestern State University 3,400,000 4,688,923 1,752,901 1,042,252 30Middle Georgia State University 19,235,000 30,351,527 19,643,015 12,559,622 306Savannah State University 3,700,000 5,808,937 2,707,254 1,599,491 33University of North Georgia 13,200,000 23,999,065 12,025,420 7,666,391 166 State Colleges 48,300,000 76,287,445 27,921,720 15,897,187 510 Abraham Baldwin Agricultural College 37,400,000 59,782,441 20,136,913 11,206,778 417Atlanta Metropolitan State College 0 0 0 0 0College of Coastal Georgia 0 0 0 0 0Dalton State College 0 0 0 0 0East Georgia State College 0 0 0 0 0Georgia Gwinnett College 1,400,000 779,375 479,718 257,520 4Georgia Highlands College 4,100,000 6,737,096 3,352,505 2,041,779 37Gordon State College 2,300,000 4,441,339 2,265,415 1,387,733 23South Georgia State College 3,100,000 4,547,194 1,687,169 1,003,377 29
21
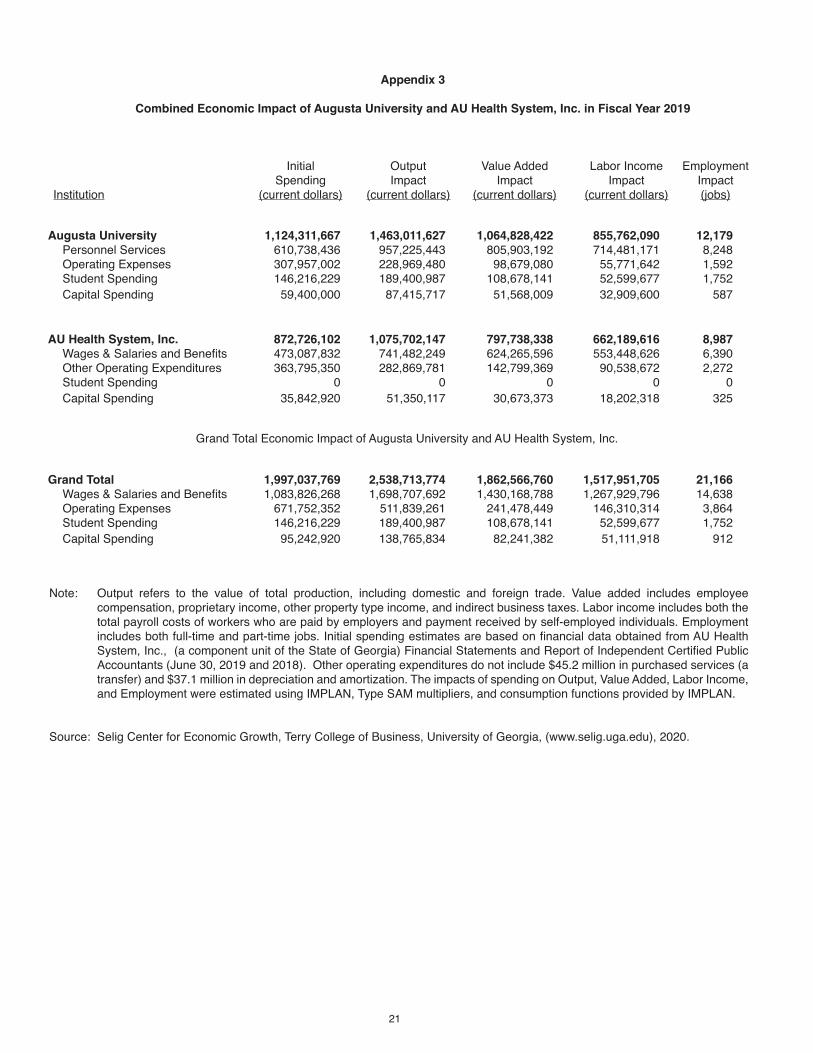
Appendix 3
Combined Economic Impact of Augusta University and AU Health System, Inc. in Fiscal Year 2019
Initial Output Value Added Labor Income Employment Spending Impact Impact Impact ImpactInstitution (current dollars) (current dollars) (current dollars) (current dollars) (jobs)
Note: Output refers to the value of total production, including domestic and foreign trade. Value added includes employee compensation, proprietary income, other property type income, and indirect business taxes. Labor income includes both the total payroll costs of workers who are paid by employers and payment received by self-employed individuals. Employment includes both full-time and part-time jobs. Initial spending estimates are based on financial data obtained from AU Health System, Inc., (a component unit of the State of Georgia) Financial Statements and Report of Independent Certified Public Accountants (June 30, 2019 and 2018). Other operating expenditures do not include $45.2 million in purchased services (a transfer) and $37.1 million in depreciation and amortization. The impacts of spending on Output, Value Added, Labor Income, and Employment were estimated using IMPLAN, Type SAM multipliers, and consumption functions provided by IMPLAN.
Source: Selig Center for Economic Growth, Terry College of Business, University of Georgia, (www.selig.uga.edu), 2020.
Grand Total Economic Impact of Augusta University and AU Health System, Inc.
Augusta University 1,124,311,667 1,463,011,627 1,064,828,422 855,762,090 12,179 Personnel Services 610,738,436 957,225,443 805,903,192 714,481,171 8,248 Operating Expenses 307,957,002 228,969,480 98,679,080 55,771,642 1,592 Student Spending 146,216,229 189,400,987 108,678,141 52,599,677 1,752 Capital Spending 59,400,000 87,415,717 51,568,009 32,909,600 587
AU Health System, Inc. 872,726,102 1,075,702,147 797,738,338 662,189,616 8,987 Wages & Salaries and Benefits 473,087,832 741,482,249 624,265,596 553,448,626 6,390 Other Operating Expenditures 363,795,350 282,869,781 142,799,369 90,538,672 2,272 Student Spending 0 0 0 0 0 Capital Spending 35,842,920 51,350,117 30,673,373 18,202,318 325
Grand Total 1,997,037,769 2,538,713,774 1,862,566,760 1,517,951,705 21,166 Wages & Salaries and Benefits 1,083,826,268 1,698,707,692 1,430,168,788 1,267,929,796 14,638 Operating Expenses 671,752,352 511,839,261 241,478,449 146,310,314 3,864 Student Spending 146,216,229 189,400,987 108,678,141 52,599,677 1,752 Capital Spending 95,242,920 138,765,834 82,241,382 51,111,918 912
22
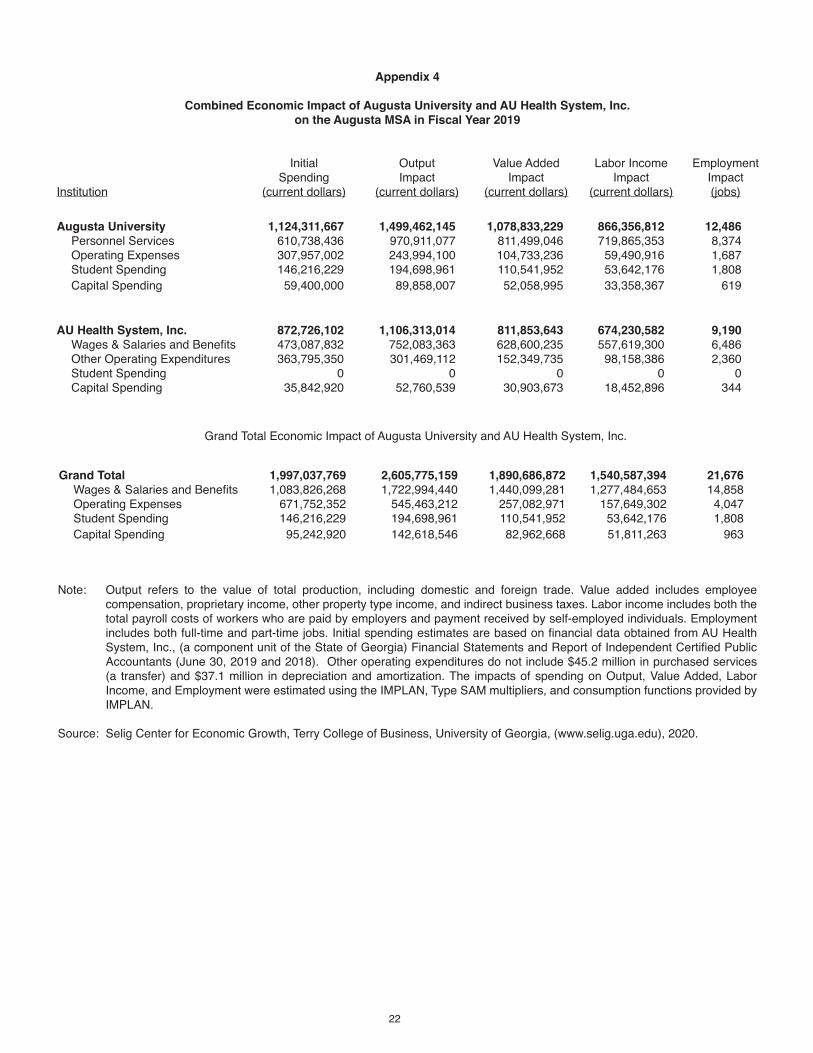
Appendix 4
Combined Economic Impact of Augusta University and AU Health System, Inc. on the Augusta MSA in Fiscal Year 2019
Initial Output Value Added Labor Income Employment Spending Impact Impact Impact ImpactInstitution (current dollars) (current dollars) (current dollars) (current dollars) (jobs)
Grand Total Economic Impact of Augusta University and AU Health System, Inc.
Note: Output refers to the value of total production, including domestic and foreign trade. Value added includes employee compensation, proprietary income, other property type income, and indirect business taxes. Labor income includes both the total payroll costs of workers who are paid by employers and payment received by self-employed individuals. Employment includes both full-time and part-time jobs. Initial spending estimates are based on financial data obtained from AU Health System, Inc., (a component unit of the State of Georgia) Financial Statements and Report of Independent Certified Public Accountants (June 30, 2019 and 2018). Other operating expenditures do not include $45.2 million in purchased services (a transfer) and $37.1 million in depreciation and amortization. The impacts of spending on Output, Value Added, Labor Income, and Employment were estimated using the IMPLAN, Type SAM multipliers, and consumption functions provided by IMPLAN.
Source: Selig Center for Economic Growth, Terry College of Business, University of Georgia, (www.selig.uga.edu), 2020.
Augusta University 1,124,311,667 1,499,462,145 1,078,833,229 866,356,812 12,486 Personnel Services 610,738,436 970,911,077 811,499,046 719,865,353 8,374 Operating Expenses 307,957,002 243,994,100 104,733,236 59,490,916 1,687 Student Spending 146,216,229 194,698,961 110,541,952 53,642,176 1,808 Capital Spending 59,400,000 89,858,007 52,058,995 33,358,367 619
AU Health System, Inc. 872,726,102 1,106,313,014 811,853,643 674,230,582 9,190 Wages & Salaries and Benefits 473,087,832 752,083,363 628,600,235 557,619,300 6,486 Other Operating Expenditures 363,795,350 301,469,112 152,349,735 98,158,386 2,360 Student Spending 0 0 0 0 0 Capital Spending 35,842,920 52,760,539 30,903,673 18,452,896 344
Grand Total 1,997,037,769 2,605,775,159 1,890,686,872 1,540,587,394 21,676 Wages & Salaries and Benefits 1,083,826,268 1,722,994,440 1,440,099,281 1,277,484,653 14,858 Operating Expenses 671,752,352 545,463,212 257,082,971 157,649,302 4,047 Student Spending 146,216,229 194,698,961 110,541,952 53,642,176 1,808 Capital Spending 95,242,920 142,618,546 82,962,668 51,811,263 963
23
Appendix 5
Augusta University’s Albany, Savannah, and Rome Clinical Campuses:Economic Impact of FY 2019 Expenditures
Augusta University has established clinical campuses in Albany, Savannah, and Rome, which generate economic impacts for their host communities. Appendix 5 documents the economic impact that the Albany, Savannah, and Rome clinical campuses had on their host communities in FY 2019. Albany: In FY 2019, total expenditures at the Albany clinical campus were $1,275,769, including $667,270 personnel expense, $172,449 operating expense, and $436,050 in student spending (Assistant Vice Chancellor for Fiscal Affairs/Budget Director, Board of Regents, University System of Georgia provided the estimates for personnel and operating expenses as well as enrollment). The economic impact accruing to Albany includes:
n $1,275,769 in initial expenditures and 4 on-campus jobs, n $1,681,362 in output (sales), n $1,213,062 in gross regional product (value added), n $916,756 in income, and n 14 jobs.
Savannah: Total expenditures at the Savannah clinical campus were $1,711,409, including $829,788 personnel expense, $187,171 operating expense, and $694,450 in student spending (Assistant Vice Chancellor for Fiscal Affairs/Budget Director, Board of Regents, University System of Georgia provided the estimates for personnel and operating expenses as well as enrollment). The economic impact accruing to Savannah includes: n $1,711,409 in initial expenditures and 4 on-campus jobs, n $2,341,644 in output (sales), n $1,713,708 in gross regional product (value added), n $1,253,361 in income, and n 17 jobs. Rome: Total expenditures at the Rome clinical campus were $1,339,949, including $829,778 personnel expense, $187,171 operating expense, and $323,000 in student spending (Assistant Vice Chancellor for Fiscal Affairs/Budget Director, Board of Regents, University System of Georgia provided the estimates for personnel and operating expenses). The economic impact accruing to Rome includes: n $1,339,949 in initial expenditures and 5 on-campus jobs, n $2,032,229 in output (sales), n $1,518,229 in gross regional product (value added), n $1,167,868 in income, and n 14 jobs.
Source: Selig Center for Economic Growth, Terry College of Business, University of Georgia, (www.selig.uga.edu), 2020.
24
Appendix 6
Augusta University and UGA Medical Partnership’s Athens Campus:Economic Impact of FY 2019 Expenditures
In partnership, Augusta University and the University of Georgia opened a new campus in Athens in FY 2011, which generates significant economic impacts for Athens’ regional economy. Appendix 6 documents the economic impact that the Athens campus had on its host community in FY 2019. In FY 2019, initial expenditures at the Athens campus (including St. Mary’s) were $17,291,536, including $10,371,187 personnel expense, $2,434,609 operating expense, and $2,664,750 in student spending, and $1,820,990 in capital outlays (Assistant Vice Chancellor for Fiscal Affairs/Budget Director, Board of Regents, University System of Georgia provided expense data for personnel and operations as well as enrollment data). The economic impact accruing to Athens includes: n $17,291,536 in initial expenditures and 85 on-campus and St. Mary’s jobs, n $26,299,521 in output (sales), n $19,308,230 in gross regional product (value added), n $15,132,112 in income, and n 208 jobs.
Source: Selig Center for Economic Growth, Terry College of Business, University of Georgia, (www.selig.uga.edu), 2020.
25
Appendix 7
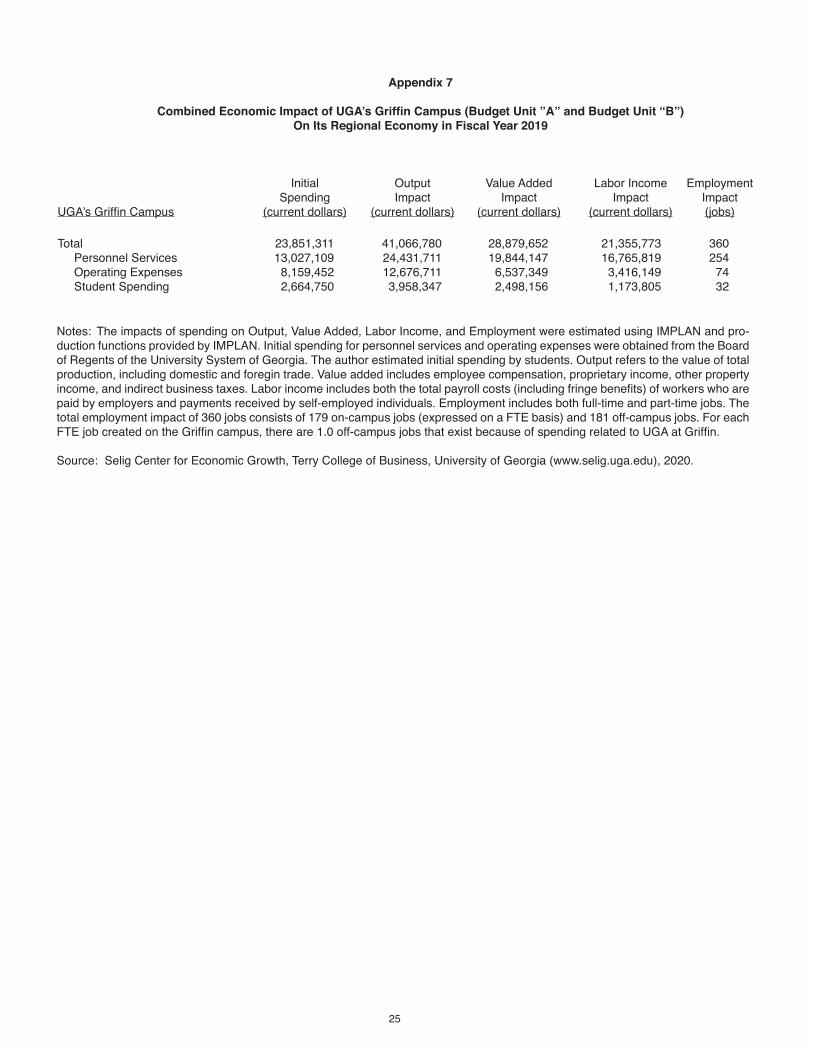
Combined Economic Impact of UGA’s Griffin Campus (Budget Unit ”A” and Budget Unit “B”)On Its Regional Economy in Fiscal Year 2019
Initial Output Value Added Labor Income Employment Spending Impact Impact Impact ImpactUGA’s Griffin Campus (current dollars) (current dollars) (current dollars) (current dollars) (jobs)
Notes: The impacts of spending on Output, Value Added, Labor Income, and Employment were estimated using IMPLAN and pro-duction functions provided by IMPLAN. Initial spending for personnel services and operating expenses were obtained from the Board of Regents of the University System of Georgia. The author estimated initial spending by students. Output refers to the value of total production, including domestic and foregin trade. Value added includes employee compensation, proprietary income, other property income, and indirect business taxes. Labor income includes both the total payroll costs (including fringe benefits) of workers who are paid by employers and payments received by self-employed individuals. Employment includes both full-time and part-time jobs. The total employment impact of 360 jobs consists of 179 on-campus jobs (expressed on a FTE basis) and 181 off-campus jobs. For each FTE job created on the Griffin campus, there are 1.0 off-campus jobs that exist because of spending related to UGA at Griffin.
Source: Selig Center for Economic Growth, Terry College of Business, University of Georgia (www.selig.uga.edu), 2020.
Total 23,851,311 41,066,780 28,879,652 21,355,773 360 Personnel Services 13,027,109 24,431,711 19,844,147 16,765,819 254 Operating Expenses 8,159,452 12,676,711 6,537,349 3,416,149 74 Student Spending 2,664,750 3,958,347 2,498,156 1,173,805 32
26
Appendix 8
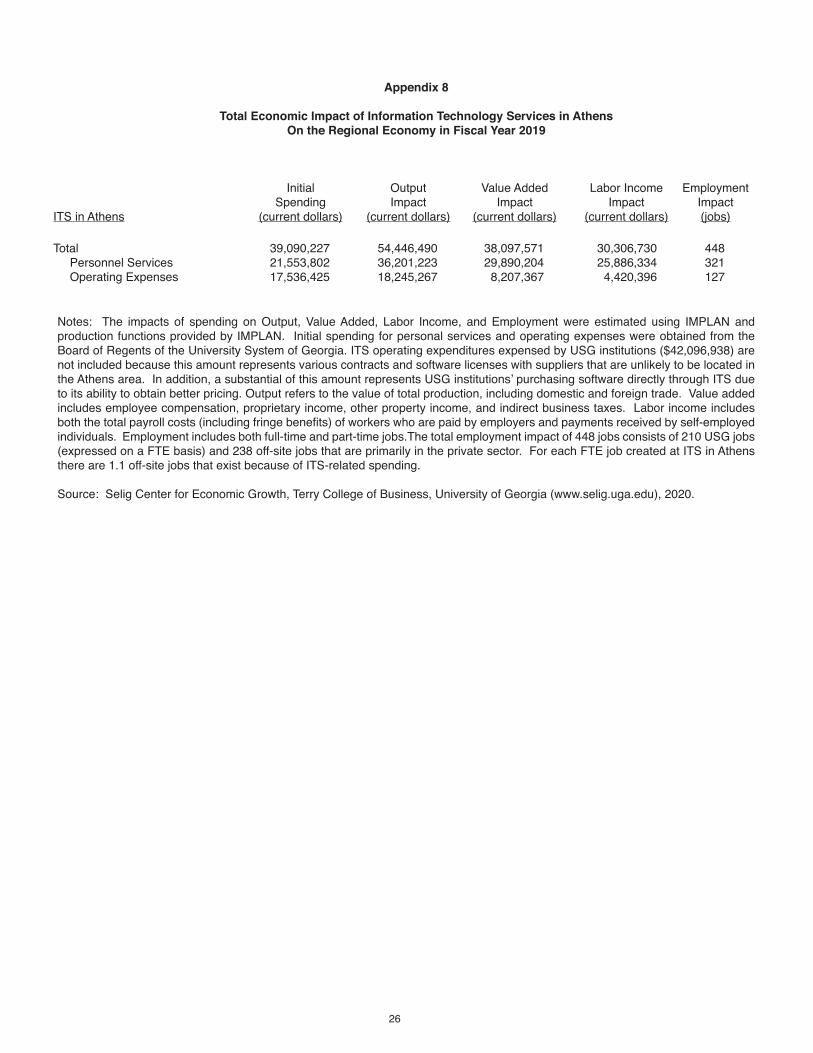
Total Economic Impact of Information Technology Services in AthensOn the Regional Economy in Fiscal Year 2019
Initial Output Value Added Labor Income Employment Spending Impact Impact Impact ImpactITS in Athens (current dollars) (current dollars) (current dollars) (current dollars) (jobs) Total 39,090,227 54,446,490 38,097,571 30,306,730 448 Personnel Services 21,553,802 36,201,223 29,890,204 25,886,334 321 Operating Expenses 17,536,425 18,245,267 8,207,367 4,420,396 127 Notes: The impacts of spending on Output, Value Added, Labor Income, and Employment were estimated using IMPLAN and production functions provided by IMPLAN. Initial spending for personal services and operating expenses were obtained from the Board of Regents of the University System of Georgia. ITS operating expenditures expensed by USG institutions ($42,096,938) are not included because this amount represents various contracts and software licenses with suppliers that are unlikely to be located in the Athens area. In addition, a substantial of this amount represents USG institutions’ purchasing software directly through ITS due to its ability to obtain better pricing. Output refers to the value of total production, including domestic and foreign trade. Value added includes employee compensation, proprietary income, other property income, and indirect business taxes. Labor income includes both the total payroll costs (including fringe benefits) of workers who are paid by employers and payments received by self-employed individuals. Employment includes both full-time and part-time jobs.The total employment impact of 448 jobs consists of 210 USG jobs (expressed on a FTE basis) and 238 off-site jobs that are primarily in the private sector. For each FTE job created at ITS in Athens there are 1.1 off-site jobs that exist because of ITS-related spending.
Source: Selig Center for Economic Growth, Terry College of Business, University of Georgia (www.selig.uga.edu), 2020.
27
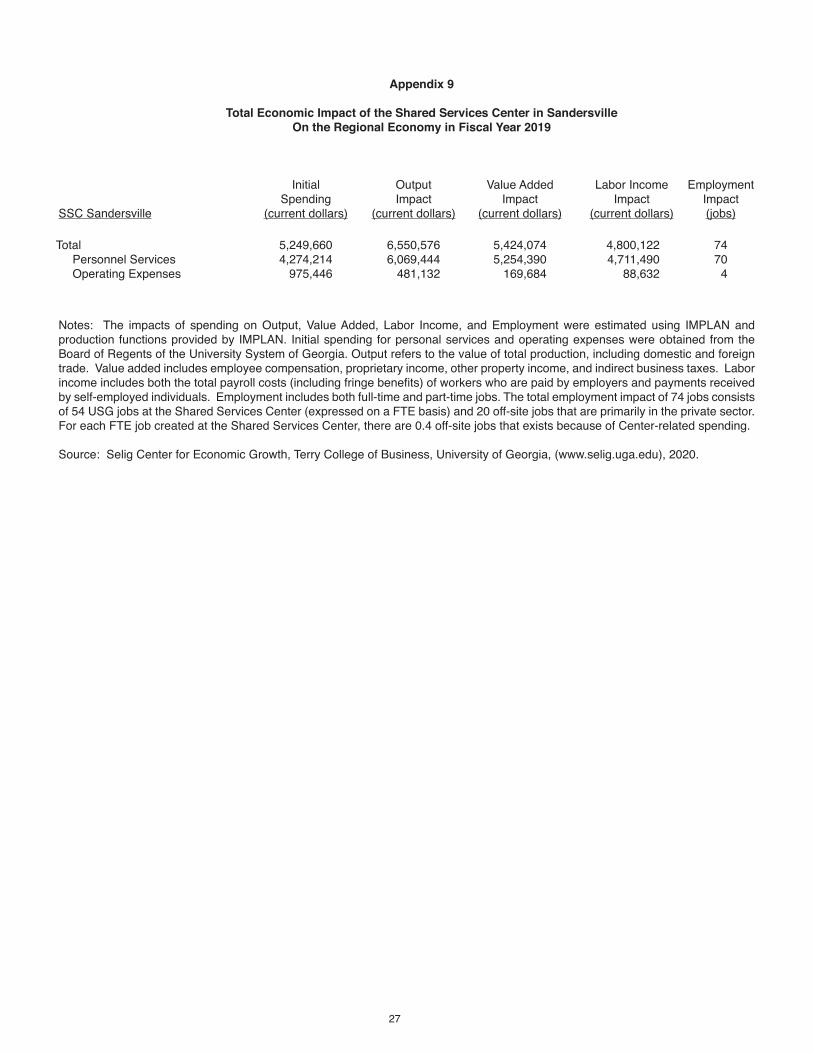
Appendix 9
Total Economic Impact of the Shared Services Center in SandersvilleOn the Regional Economy in Fiscal Year 2019
Initial Output Value Added Labor Income Employment Spending Impact Impact Impact ImpactSSC Sandersville (current dollars) (current dollars) (current dollars) (current dollars) (jobs) Total 5,249,660 6,550,576 5,424,074 4,800,122 74 Personnel Services 4,274,214 6,069,444 5,254,390 4,711,490 70 Operating Expenses 975,446 481,132 169,684 88,632 4
Notes: The impacts of spending on Output, Value Added, Labor Income, and Employment were estimated using IMPLAN and production functions provided by IMPLAN. Initial spending for personal services and operating expenses were obtained from the Board of Regents of the University System of Georgia. Output refers to the value of total production, including domestic and foreign trade. Value added includes employee compensation, proprietary income, other property income, and indirect business taxes. Labor income includes both the total payroll costs (including fringe benefits) of workers who are paid by employers and payments received by self-employed individuals. Employment includes both full-time and part-time jobs. The total employment impact of 74 jobs consists of 54 USG jobs at the Shared Services Center (expressed on a FTE basis) and 20 off-site jobs that are primarily in the private sector. For each FTE job created at the Shared Services Center, there are 0.4 off-site jobs that exists because of Center-related spending.
Source: Selig Center for Economic Growth, Terry College of Business, University of Georgia, (www.selig.uga.edu), 2020.