Embed Size (px)
Citation preview

Economic and Fiscal Impact Analysis of the Music Industry in Georgia
May 2011
Prepared by: B. William Riall, Ph.D.
This study was commissioned by Georgia Music Partners http://georgiamusicpartners.org

Table of Contents Executive Summary .....................................................................................................1 Section 1 – Introduction................................................................................................6 Section 2 – Industry Definition......................................................................................10 Section 3 – Economic and Fiscal Impact Analysis Methods.........................................18 Section 4 – Results ......................................................................................................24 References...................................................................................................................27

Music Industry Economic and Fiscal Impact Summary This analysis examined 2009 data sources to estimate the economic impacts and fiscal revenues accruing to state and local governments as a result of activities in the music industry sector. Table S-1 provides a summary of the economic impacts as measured by output (roughly equivalent to revenues), labor income (including benefits) and employment. The “Industry” column refers to industry activity; the “Direct” column refers to the resources being brought into the state by the music industry which form the basis for the multiplier effect which is provided in the “Total” column, which includes direct, induced, and indirect impacts.
Table S-1: Economic Impacts Industry Direct Total Output $2,137,357,671 $1,836,652,737 $3,777,861,628 Labor Income $485,654,445 $279,900,252 $888,103,487 Employment 8,842 7,850 19,955
The economic impacts described in Table S-1 support state and local governments in many ways. The revenues accruing to each, by category, is provided in Table S-2. These total over $126 million per year to the state and almost $188 million per year to local governments.
Table S-2: State and Local Government Revenues State Government Revenues General Sales Tax $12,058,728 Selective Sales Tax $9,204,539 Individual Income Tax $18,401,168 Corporate Income Tax $4,587,413 License Revenue $617,114 Intergovernmental Transfers $63,677,044 Revenues from Fees $6,788,896 Miscellaneous Fees $10,934,822 Total State Government Revenues $126,269,724 Local Government Revenues Intergovernmental Transfers $58,728,472 Property Tax $49,314,930 General Sales Tax $8,267,659 Selective Sales Tax $4,808,986 Current Charges $38,775,956 Miscellaneous Revenues $5,696,011 Utility Revenues $21,647,891 Insurance Trust Revenues $488,086 Total Local Government Revenues $187,727,990 Total Revenues to State and Local Governments $313,997,714

Executive Summary
Executive Summary 2
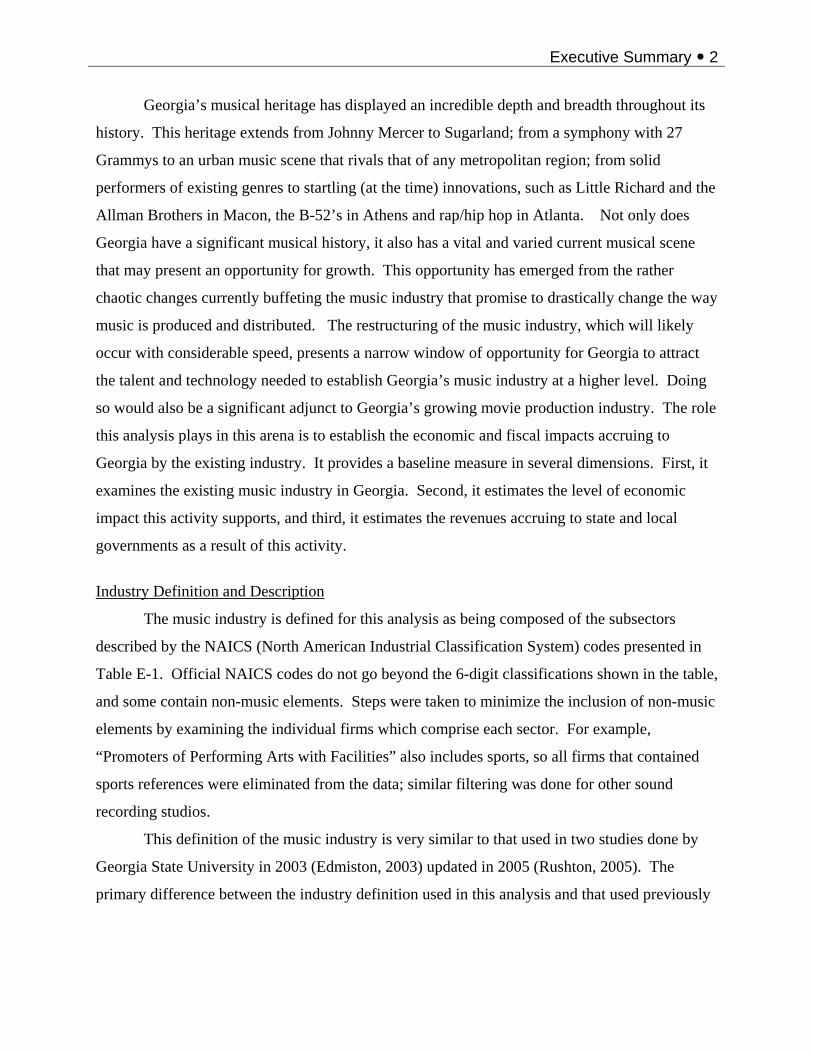
Georgia’s musical heritage has displayed an incredible depth and breadth throughout its
history. This heritage extends from Johnny Mercer to Sugarland; from a symphony with 27
Grammys to an urban music scene that rivals that of any metropolitan region; from solid
performers of existing genres to startling (at the time) innovations, such as Little Richard and the
Allman Brothers in Macon, the B-52’s in Athens and rap/hip hop in Atlanta. Not only does
Georgia have a significant musical history, it also has a vital and varied current musical scene
that may present an opportunity for growth. This opportunity has emerged from the rather
chaotic changes currently buffeting the music industry that promise to drastically change the way
music is produced and distributed. The restructuring of the music industry, which will likely
occur with considerable speed, presents a narrow window of opportunity for Georgia to attract
the talent and technology needed to establish Georgia’s music industry at a higher level. Doing
so would also be a significant adjunct to Georgia’s growing movie production industry. The role
this analysis plays in this arena is to establish the economic and fiscal impacts accruing to
Georgia by the existing industry. It provides a baseline measure in several dimensions. First, it
examines the existing music industry in Georgia. Second, it estimates the level of economic
impact this activity supports, and third, it estimates the revenues accruing to state and local
governments as a result of this activity.
Industry Definition and Description
The music industry is defined for this analysis as being composed of the subsectors
described by the NAICS (North American Industrial Classification System) codes presented in
Table E-1. Official NAICS codes do not go beyond the 6-digit classifications shown in the table,
and some contain non-music elements. Steps were taken to minimize the inclusion of non-music
elements by examining the individual firms which comprise each sector. For example,
“Promoters of Performing Arts with Facilities” also includes sports, so all firms that contained
sports references were eliminated from the data; similar filtering was done for other sound
recording studios.
This definition of the music industry is very similar to that used in two studies done by
Georgia State University in 2003 (Edmiston, 2003) updated in 2005 (Rushton, 2005). The
primary difference between the industry definition used in this analysis and that used previously

Executive Summary 3
is that this definition is in terms of NAICS sectors and the GSU studies used SIC (standard
industrial classification) sectors, which are no longer used in current data.
Table E-1: Definition of the Music Industry in Georgia
NAICS Code Description
334310 Household Audio and Video Equipment Manufacturing 334610 CD,Tape and Record Production 339992 Musical Instrument Manufacturing 451140 Musical Instrument and Supplies Stores 451220 Prerecorded Tape, CD, and Record Stores 512210 Record production 512220 Integrated record production/distribution 512230 Music Publishers 512240 Sound Recording Studios 611610 Fine Arts Schools 711130 Musical Groups and Artists 711310 Promoters of Performing Arts with Facilities 711320 Promoters of Performing Arts without Facilities 711410 Agents 711510 Independent Artists, Writers, and Performers
The primary source of information for these sectors is the Georgia Department of Labor
Covered Employment and Wages (CEW) data. The most recent complete year of data available
is, as of this writing, 2009.
One of the problems with the CEW data is that they only provide information on firms
that have employees. A single proprietorship with no employees would not be represented.
Because sound recording studios are both an important component of the music industry and a
sector with many small firms, additional data on this sector was procured from ReferenceUSA
(ReferenceUSA, 2010). The firms in this sector documented in the ReferenceUSA data set were
compared to the firms listed in the CEW data, with duplicates eliminated. Where the
ReferenceUSA data did not disclose an employment level but instead gave an employment
range, (and employment information was not available from the CEW data), the firm
employment was estimated using the midpoint of the relevant range.

Executive Summary 4
Analysis Methods
The first analytical step is to use information on the size of the industry to estimate how
much of the services and products produced bring new resources into the Georgia economy. The
second step is to estimate how much economic activity is supported by these new resources. The
traditional name for this process is the multiplier effect. It examines the flow of the resources
within the economy and how quickly those resources leave the Georgia economy as purchases of
goods and services provided by firms and households outside the Georgia economy.
When the measures of economic activity in terms of income, employment, and output
associated with the music industry were compiled, they were used, with statistical relationships,
to estimate the revenues accruing to state and local governments. Various methods were used to
make these estimates. In general, the relationships between each source of revenue and its
determinants were examined, and the ones that were the most logical and had the more robust
statistical properties were used in the estimation process.
Results
The economic impact results fall into three categories. The first relates to various
measures of the size of the existing music industry in Georgia. The second relates to the
estimation of how much of the industry is bringing new resources in the state (known as direct
impacts), and how much is recirculating resources already present. The third is the result of
using an input-output model to estimate how much additional economic activity is supported by
the direct impacts. Table E-3 provides the results for the economic impact analysis. The music
industry in Georgia is estimated to support almost $3.8 billion in economic output, compensating
19,955 employees with over $888 million in wages, salaries, and benefits.
Table E-3: Economic Impacts Industry Direct Total Output $2,137,357,671 $1,836,652,737 $3,777,861,628 Labor Income $485,654,445 $279,900,252 $888,103,487 Employment 8,842 7,850 19,955
The economic activity described in Table E-3 generates considerable revenues for state
and local governments. At the state level, it is estimated that over $126 million per year is
generated with the revenues distributed as shown in table E-4.
Executive Summary 5
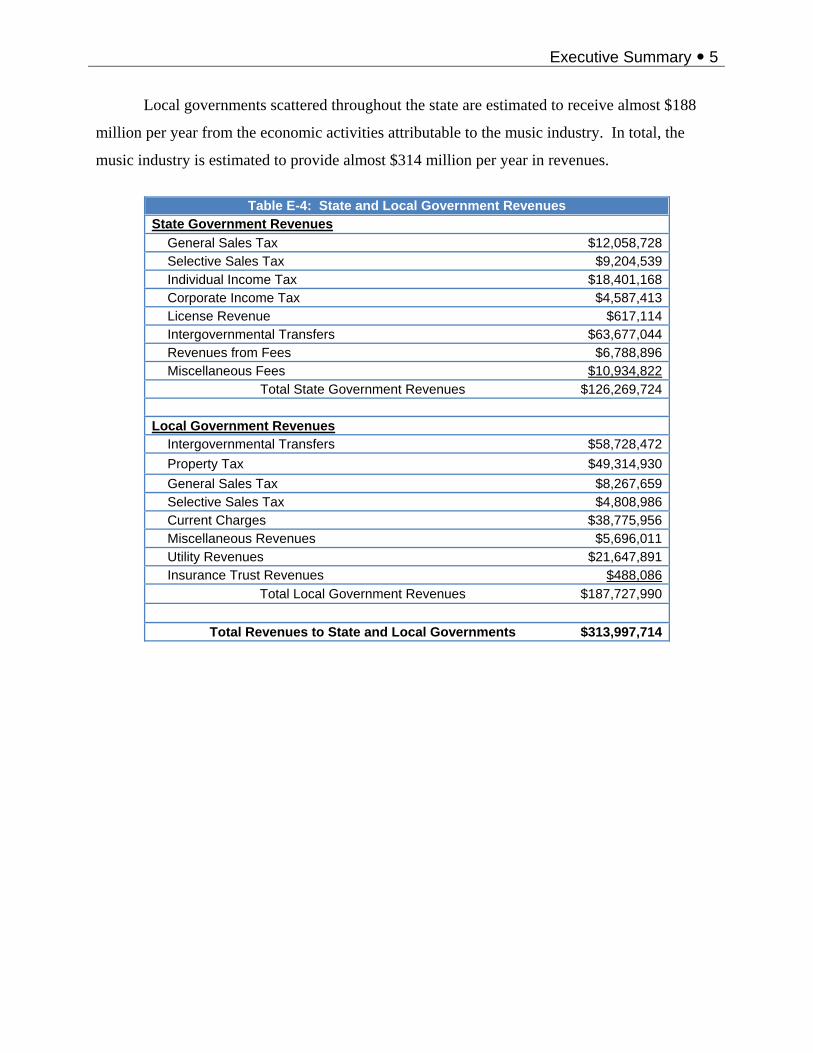
Local governments scattered throughout the state are estimated to receive almost $188
million per year from the economic activities attributable to the music industry. In total, the
music industry is estimated to provide almost $314 million per year in revenues.
Table E-4: State and Local Government Revenues
State Government Revenues General Sales Tax $12,058,728 Selective Sales Tax $9,204,539 Individual Income Tax $18,401,168 Corporate Income Tax $4,587,413 License Revenue $617,114 Intergovernmental Transfers $63,677,044 Revenues from Fees $6,788,896 Miscellaneous Fees $10,934,822 Total State Government Revenues $126,269,724 Local Government Revenues Intergovernmental Transfers $58,728,472 Property Tax $49,314,930 General Sales Tax $8,267,659 Selective Sales Tax $4,808,986 Current Charges $38,775,956 Miscellaneous Revenues $5,696,011 Utility Revenues $21,647,891 Insurance Trust Revenues $488,086 Total Local Government Revenues $187,727,990 Total Revenues to State and Local Governments $313,997,714

Section 1 – Introduction
Section 1 – Introduction 7
The music industry in Georgia is diverse, significant, and dynamic, and it has been for
quite a long time. While the blossoming of Georgia talent continues unabated, the music
industry is going through a dramatic restructuring primarily as a response to technological
change. Although the movement from analog (vinyl) to digital (compact disks, in the early days)
occurred some time ago, the impact of this digitization is still being felt. The music industry has
taken on a technological component affecting the creation, production, and distribution of music
that many think will change the industry forever.
To understand the changes underway, it is worthwhile to reflect, a bit, on how things used
to work. For the creator, music is intellectual property that falls under the copyright (as opposed
to patent) body of law. Much of the structure of the music industry is formed to ensure that
copyright is not infringed, i.e., everyone who owns a piece of the material, gets compensated.
This led to three structures within the music industry. First was the formation of, for example,
the American Society of Authors, Composers and Publishers, (better known as ASCAP) and
Broadcast Music, Inc., (better known as BMI) and SESAC with each organizations’ core mission
being the collection and distribution of revenues, and the protection of the artists property. Each
organization has offices in Atlanta and, in addition to their core duties they also work to promote
music through workshops, conferences, and concerts to give up-and-coming artists more
visibility. It is likely that these organizations will assume a larger role as the industry evolves.
The second structural element of the music industry is comprised of the record labels,
which own a “master” recording of a song, but not the song itself. In the past, these labels were
almost the only route a musical artist could take to gain recognition even though this was an
often contentious relationship. The labels provided the marketing and legal support (not to
mention a livelihood) to the artist, and in return, the artists brought in lots of money. But this
structure was formed when music was distributed through a tangible product; it now exists as a
file on a computer, composed of bytes of information rather than bits of matter. The marginal
cost of producing an extra copy is essentially zero, and that copy can be sent to China as easily as
next door. Record labels revenues have declined dramatically over the last 10 years, or so, and
although they have tried to compensate by exploiting what was previously considered ancillary
revenues (from film, TV and advertising, for example), their decline continues.
The third structural element is the publisher. Typically, the publisher splits ownership of
the song 50/50 with the artist. But the publisher has historically had the say on how and when a
Section 1 – Introduction 8
song might be presented. This stranglehold is considerably diminished today, but the publishers
have managed to maintain their revenue streams primarily by boosting revenues from
performance and synchronization (when music is synchronized with visual media) sources, even
while mechanical (i.e., revenues from vinyl, tape, CD and download) sources has declined.
Additionally, the technology now allows individual musicians to accomplish things
unheard of only a few years ago. For example, a symphony composer had, at one time, to hire
an orchestra if he wanted to hear his creation. Now, it can be done with a piece of software,
freeing up the composer to experiment and extend his talent in ways never before seen. This
technology also allows the individual artist to perform all (or most) of the functions previously
performed by the record labels. Hence, the diminution of the role played by the labels. How
much they diminish and how they operate in the new paradigm now evolving is unclear.
What is clear is the music industry is changing in a way that is dependent on technology
and Georgia has both the talent and the technology to thrive in the new environment. There is,
for example, a Center for Music Technology at Georgia Tech. There is also a flourishing movie
and television industry that helps to attract the critical mass of talent needed to support the music
industry’s activities. It is not likely that Atlanta would turn into the next Hollywood, but maybe
the next Burbank, or even, the next Nashville.
It is beyond the scope of this effort to detail a strategy to accomplish these ambitious
goals. What this analysis can do is define the music industry in Georgia, characterize its
activities in economic terms, estimate the level of economic activity supported by the music
industry, and analyze the fiscal implications of that activity.
In the following (Section 2) of this analysis this industry is defined in terms of its major
and constituent components. Various measures of the level of activity it of these components
such as employment, number of establishments, and wages are also presented. The third section
presents the methodology used to estimate the fiscal and economic impacts of the music
industry. It discusses the process that leads to additional economic activity supported by the
industry, and how this activity is estimated. It also describes the relationship between various
governmental revenue streams and their determinants, and how, consequently, this relationship
can be used to estimate the flow of resources to state and local governments.
Section 4 provides the results of the analysis in terms of estimated industry activity,
direct impacts, and total economic impacts. The total economic impacts are then used as the

Section 1 – Introduction 9
basis for estimating the revenues accruing to state and local governments, measured by major
revenue category, attributable to the music industry.

Section 2 – Industry Definition

Section 2 – Industry Definition 11
Defining the music industry is like trying to photograph a moving subject. You can get
close, but by the time you are finished, it has already changed into something else. While this
dynamism creates problems in defining the music industry, it also creates opportunities for those
perceptive and insightful enough to take advantage of the chaos.
In terms of primary revenue streams, the music industry can be considered to have six
major components: recorded music, publishing (music and lyrics), performing rights, musical
equipment, touring and live performance, and new media.
Recorded Music. Record labels have historically been the financial backbone of the
music industry, but it appears that the highest revenues peaked in 1997 at about $45 billion, and
has declined every year since. Global sales revenue in 2007 is pegged at $25 billion, and
indications are the decline continues. As the typical owner of the “master” recording, record
labels (anxious to generate more revenue) are currently exploiting what was previously
considered ancillary revenues to a greater extent. This includes use the master in films,
television, advertisements, in-flight listening, internet streaming, video games, at corporate
conventions, in kiosks, for product demonstrations and release on other compilation records or
soundtrack albums. These revenues, including legal music downloads, however, do not come
close to replacing record sales seen in the previous century.
Publishing Music and Lyrics. Whereas record labels exploit a particular recording of a
song, the publishers actually own (generally, partly, i.e. a 50/50 split with the artist) the song
itself. Publishing revenue is primarily generated through three main types of royalties:
mechanical, performance and synchronization. A mechanical royalty is earned whenever
someone acquires a previously recorded song regardless of whether it is on vinyl, tape, CD, or
downloaded. Performance royalties include not only live performances but also radio
broadcasts, in film or TV programs, or advertising. Synchronization revenues result from being
synchronized with visual media rather than as a stand-alone performance. Revenues from these
components have actually increased revenues to the publishers, but their historical stranglehold
on material is diminished. Yes, they continue to be big players but they are no longer the 600 lb.
gorilla.
Performing Rights. Three primary organizations (usually referred to as PROs) are
responsible for collecting revenues due to artists from any public (outside the home)
performance of copyrighted music. They are ASCAP (American Society of Composers, Authors
Section 2 – Industry Definition 12
and Publishers), BMI (Broadcast Music, Inc.), and SESAC (it used to be an acronym, but no
longer), each having offices in Atlanta. While their primary concern is the collection of revenues
from the performance of copyrighted music material (for distribution to the owners of the
material) but they also serve to promote music (and especially, its performance), which benefits
both the artists and the industry. Atlanta is fortunate to have offices from all three PROs.
Musical Equipment. The production and sale of musical instruments and the means to
play music back. It therefore includes the saxophone used to play the music, the microphone and
recording (or amplifying) equipment the music is played into, and the MP3 or CD player (or
turntable, for that matter) used to play the music later. The digitalization of music has had a
tremendous impact in this arena with the creation of entirely new ways to record, store, and
playback songs.
Touring and Live Performances. With the decline of revenues from recordings, live
performances have increased to try to fill the gap. As the importance of live performances and
tours increases, all of the players (promoters, hall/arena owners, amplification and display
equipment manufacturers and managers, etc.) associated with these performances have also
increased in importance. Recently, however, it appears that a “perfect storm” of poor economic
conditions, fan anger over high ticket prices, poorly conceived tours, and an over-filled calendar
(Resnick 2011) have contributed to recent declines. Large-scale festivals (e.g., Bonaroo) and
club performances have, however, done well.
New Media. The business model that has been in effect in the music industry for the last
70-80 years is crumbling in the face of new technologies. It is perhaps, worthwhile to consider
that over the life of music-making in human society, this is just a recent blip. The new business
model has yet to emerge, but it is safe to assume that new media will be at the center of it. For
example, iTunes’ distribution model is really just a new technical twist on the old model with
revenues distributed roughly the same as the record label model which provides about 15% to the
artist. Legal questions are arising, however, that consider iTunes, for example, to be granting
licenses, which typically give a 50% split to the artist. The center of the emerging music
industry business model is, like in days of yore, the artist – not the producer, recorder, publisher,
or promoter.
Section 2 – Industry Definition 13
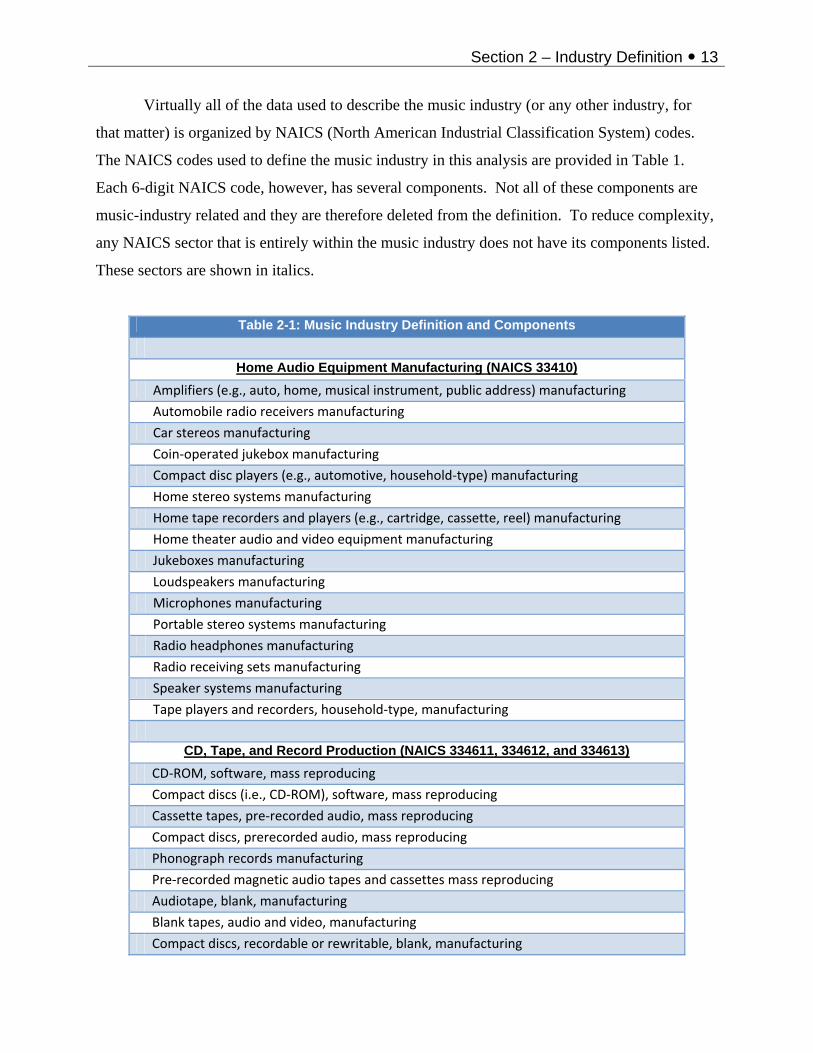
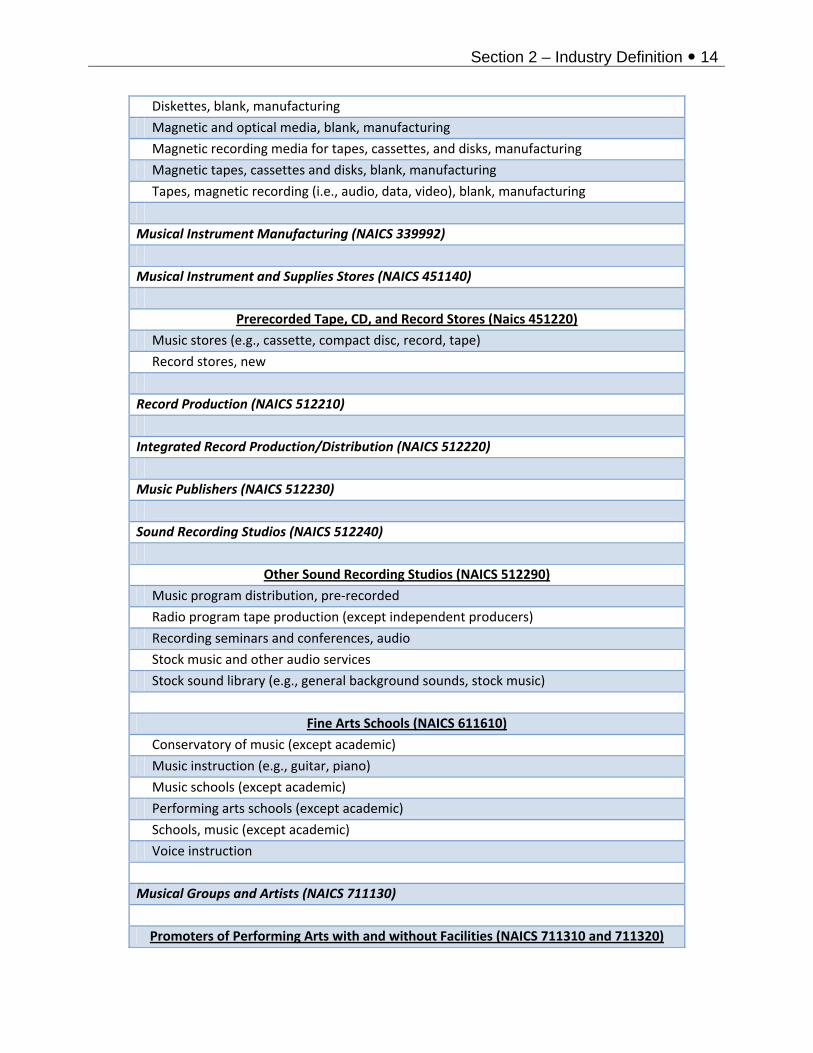
Virtually all of the data used to describe the music industry (or any other industry, for
that matter) is organized by NAICS (North American Industrial Classification System) codes.
The NAICS codes used to define the music industry in this analysis are provided in Table 1.
Each 6-digit NAICS code, however, has several components. Not all of these components are
music-industry related and they are therefore deleted from the definition. To reduce complexity,
any NAICS sector that is entirely within the music industry does not have its components listed.
These sectors are shown in italics.
Table 2-1: Music Industry Definition and Components
Home Audio Equipment Manufacturing (NAICS 33410) Amplifiers (e.g., auto, home, musical instrument, public address) manufacturing
Automobile radio receivers manufacturing
Car stereos manufacturing
Coin‐operated jukebox manufacturing
Compact disc players (e.g., automotive, household‐type) manufacturing
Home stereo systems manufacturing
Home tape recorders and players (e.g., cartridge, cassette, reel) manufacturing
Home theater audio and video equipment manufacturing
Jukeboxes manufacturing
Loudspeakers manufacturing
Microphones manufacturing
Portable stereo systems manufacturing
Radio headphones manufacturing
Radio receiving sets manufacturing
Speaker systems manufacturing
Tape players and recorders, household‐type, manufacturing
CD, Tape, and Record Production (NAICS 334611, 334612, and 334613)
CD‐ROM, software, mass reproducing
Compact discs (i.e., CD‐ROM), software, mass reproducing
Cassette tapes, pre‐recorded audio, mass reproducing
Compact discs, prerecorded audio, mass reproducing
Phonograph records manufacturing
Pre‐recorded magnetic audio tapes and cassettes mass reproducing
Audiotape, blank, manufacturing
Blank tapes, audio and video, manufacturing
Compact discs, recordable or rewritable, blank, manufacturing
Section 2 – Industry Definition 14
Diskettes, blank, manufacturing
Magnetic and optical media, blank, manufacturing
Magnetic recording media for tapes, cassettes, and disks, manufacturing
Magnetic tapes, cassettes and disks, blank, manufacturing
Tapes, magnetic recording (i.e., audio, data, video), blank, manufacturing
Musical Instrument Manufacturing (NAICS 339992)
Musical Instrument and Supplies Stores (NAICS 451140)
Prerecorded Tape, CD, and Record Stores (Naics 451220)
Music stores (e.g., cassette, compact disc, record, tape)
Record stores, new
Record Production (NAICS 512210)
Integrated Record Production/Distribution (NAICS 512220)
Music Publishers (NAICS 512230)
Sound Recording Studios (NAICS 512240)
Other Sound Recording Studios (NAICS 512290)
Music program distribution, pre‐recorded
Radio program tape production (except independent producers)
Recording seminars and conferences, audio
Stock music and other audio services
Stock sound library (e.g., general background sounds, stock music)
Fine Arts Schools (NAICS 611610)
Conservatory of music (except academic)
Music instruction (e.g., guitar, piano)
Music schools (except academic)
Performing arts schools (except academic)
Schools, music (except academic)
Voice instruction
Musical Groups and Artists (NAICS 711130)
Promoters of Performing Arts with and without Facilities (NAICS 711310 and 711320)
Section 2 – Industry Definition 15
Arts event managers, organizers and promoters
Arts festival managers, organizers and promoters
Concert hall operators
Concert booking agencies
Concert Managers, Organizers and Promoters
Live arts center operators
Live theater operators
Managers of arts events
Managers of festivals
Managers of live performing arts productions (e.g., concerts)
Music Festival Managers, Organizers, and Promoters
Organizers of live performing arts productions (e.g., concerts)
Performing arts center operators
Promoters of live performing arts productions (e.g., concerts)
Agents (NAICS 711410)
Independent artists, Writers, and Performers (NAICS 711510)
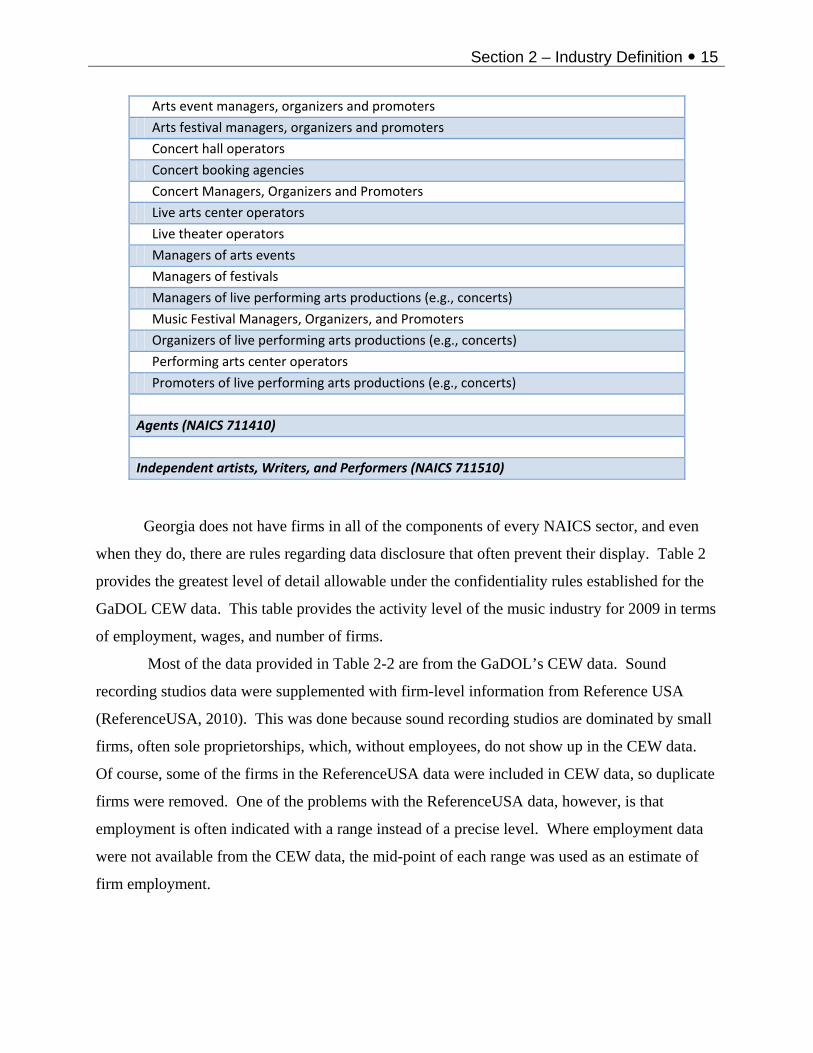
Georgia does not have firms in all of the components of every NAICS sector, and even
when they do, there are rules regarding data disclosure that often prevent their display. Table 2
provides the greatest level of detail allowable under the confidentiality rules established for the
GaDOL CEW data. This table provides the activity level of the music industry for 2009 in terms
of employment, wages, and number of firms.
Most of the data provided in Table 2-2 are from the GaDOL’s CEW data. Sound
recording studios data were supplemented with firm-level information from Reference USA
(ReferenceUSA, 2010). This was done because sound recording studios are dominated by small
firms, often sole proprietorships, which, without employees, do not show up in the CEW data.
Of course, some of the firms in the ReferenceUSA data were included in CEW data, so duplicate
firms were removed. One of the problems with the ReferenceUSA data, however, is that
employment is often indicated with a range instead of a precise level. Where employment data
were not available from the CEW data, the mid-point of each range was used as an estimate of
firm employment.

Section 2 – Industry Definition 16
Table 2-2: Music Industry Activity 2009
Sector Establishments Employment Labor Income
Household AV Equipment, CD,Tape, and Record Manufacturing 43 1,258 $93,301,837Musical Instrument Manufacturing 13 22 $800,354Musical Instrument and Supplies Stores 141 887 $23,598,487Prerecorded Tape, CD, and Record Stores 109 366 $7,542,578Record production 20 34 $1,550,278Integrated record production/distribution 18 43 $3,912,429Music Publishers 19 74 $9,977,279Sound Recording Studios 303 1,270 $6,020,401Fine Arts Schools 310 1,371 $18,294,971Musical Groups and Artists 162 503 $24,784,821Promoters of Performing Arts with Facilities 33 1,117 $182,494,485Promoters of Performing Arts without Facilities 46 279 $57,303,634Agents 106 170 $9,640,842Independent Artists, Writers, and Performers 564 1,447 $46,432,049
Total 1887 8,842 $485,654,445 Note: NAICS 334310 and 334610 (both manufacturing) are combined to preserve confidentiality
Table 2-3: Industry Average Wage and Firm Size Annual Average Wage Average Employees Per Employee Per Establishment Household AV Equipment, CD,Tape, and Record Manufacturing $74,172 29 Musical Instrument Manufacturing $35,971 2 Musical Instrument and Supplies Stores $26,597 6 Prerecorded Tape, CD, and Record Stores $20,616 3 Record Production $45,117 2 Integrated Record Production/Distribution $90,114 2 Music Publishers $134,374 4 Sound Recording Studios $4,740 4 Fine Arts Schools $13,345 4 Musical Groups and Artists $49,320 3 Promoters of Performing Arts with Facilities $163,379 34 Promoters of Performing Arts without Facilities $205,144 6 Agents $56,822 2 Independent artists, Writers, and Performers $32,079 3
Total $54,924 5
Georgia Average $41,711 12 Table 2-3 provides a calculation of the pay per employee and average firm size measured
by employees per establishment for each of the industry components. These compare favorably

Section 2 – Industry Definition 17
to the average for Georgia in 2009 (over all jobs) of $41,711, with the overall industry average of
$54,924 being almost one-third higher. This demonstrates that the employment opportunities in
the music industry, particularly promoters, are more lucrative than those available to the average
Georgian. The Georgia average firm size is more than twice that of the music industry, further
documenting the relative small size of music industry firms.
The changing structure of the music industry alluded to earlier is dramatically evident in
Figure 2-1 (Florida, 2010) which shows how the concentration of the industry has changed
between 1970 and 2004. The data on the figure is the absolute change in location quotients
between those years, with location quotients defined as the concentration in an area relative to
the country. For each of the 31 major music regions the percentage of total employment in the
music industry is divided by the percentage of total employment in the music industry for the
U.S. for 1970 and for 2004 with the difference between the two years displayed in Figure 1.
Nashville, it seems, has found the key strategy to music industry expansion at a time when its
relative size is shrinking in every other major music region. It remains to be seen whether
Georgia can take advantage of the current turmoil in the music industry and improve its position.
Figure 2-1: Absolute Change in Location Quotient 1970-2004

Section 3 – Economic and Fiscal Impact Analysis Methods
Section 3 – Economic and Fiscal Impact Analysis Methods 19
Economic Impacts Economic impact analysis estimates the additional economic activity that is supported by
resources entering the economy. Resources enter the economy by exporting goods and services
to firms and individuals outside the economy. In turn, these firms respond by remitting
payments for those goods and services. These payments then become income to firms and
individuals who respend it for other goods and services. When this spending procures goods and
services from Georgia entities, it remains available to be respent again. When the spending is for
items not supplied by Georgians, the resources are assumed to leave the Georgia economy, and
are no longer available to be respent. This is called leakage. The recirculation process therefore
continues until the original resource injection leaks away. The estimate of economic impact is
based on the rate at which resources flow into the economy versus how quickly they leak out.
The recirculation process is often called the multiplier effect. There are several methods
available to estimate how much economic activity is supported by the multiplier effect, but the
most common is to use an input/output model. These models are, at their core, a recipe box
containing recipes for providing all the goods and services produced grouped into 440 separate
categories. These categories roughly translate into six-digit NAICS (North American Industrial
Classification System) codes.
When, for example, music is produced in Georgia, the recipe for making music (artists,
instruments, lawyers) are used in the input/output model to estimate how much of what items
will be needed. The second step is to estimate how much of each of these items will be
purchased from Georgia suppliers. This is based on the capacity within Georgia for supplying
each of these items, and the propensity for local procurement specific to each item. Each
purchased item is, in turn, produced according to its own recipe with its own mixture of locally
supplied and imported (into Georgia) items and the calculations continue.
Economic impact is traditionally measured by three parameters: output, labor income,
and employment. Output is usually about the same as business revenues, and is the largest of the
three measures. Labor income includes employee compensation (wages, salaries, and benefits)
plus proprietor’s income, and employment is a mixture of full-time and part-time employment.
The most difficult task in estimating economic impact is identifying the initial injection
of new resources. In the case of an industry analysis, additional complications develop. The
goal is to identify all the portals through which resources enter the economy, without double-

Section 3 – Economic and Fiscal Impact Analysis Methods 20
counting. The possibility of double-counting arises because of the interactions among
components. For example, musicians in Georgia sometimes use the services of a recording
studio. This local demand portion of the recording studio activity is included in the multiplier
effect associated with musicians. If all employment at recording studios were included and all of
the musician activity, then that portion of the studio output that supports the musician activity
would be double-counted. Only that portion of the studio activity that brings new resources into
the state should be included in the direct impacts of the industry. Fortunately, this is not the
intractable problem it appears because the input/output model can estimate how much of the
music industry output is attributable to recirculation within the industry. Consequently, from
knowing the total output, it is possible to identify that portion of the industry that should be
considered a direct impact.
After the direct impacts have been identified, the input-output model is used to estimate
the indirect and induced impacts. Indirect impacts result from the recirculation of resources
within the business community, and induced impacts result from the respending of income by the
household sector. The sum of direct, induced, and indirect impacts equals total impacts.
Fiscal Impact Analysis
The objective of fiscal impact analysis is to estimate how much revenue accrues to state
and local governments from the economic activity attributable to a business sector, here, the
music industry. The functional relationships between economic activity and revenue generation
vary depending on what revenue source is examined. The largest components of the state’s
internally generated revenue streams are sales and use taxes, and individual income taxes. There
are several additional significant sources as well. Local governments rely most heavily on
property and sales taxes and revenues from supplied utilities.
State Government Revenues
Figure 3-1 shows the overall state revenue source picture for Georgia in 2009. The
largest single source is intergovernmental revenues mostly. These are revenues that flow to
Georgia primarily from the federal government, usually as matching funds for highway
construction, social welfare programs, education, health care, and many others. The largest
internally generated revenue source is individual income taxes with about 27.3%, followed
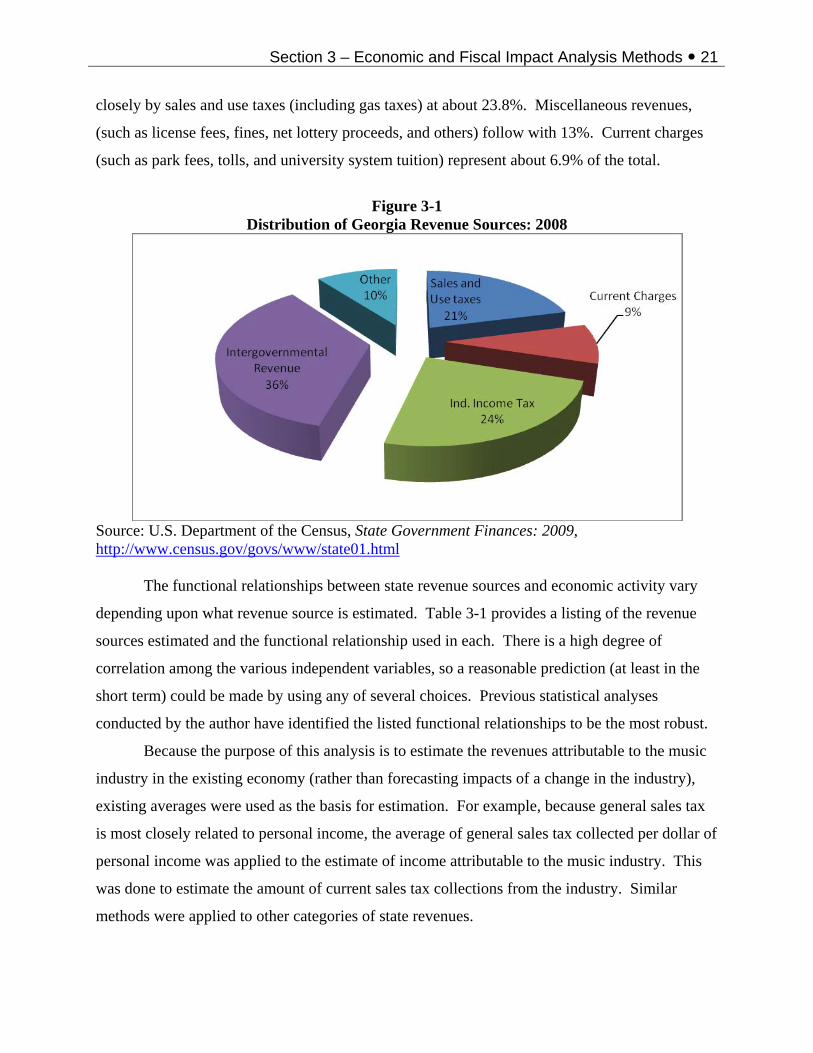
Section 3 – Economic and Fiscal Impact Analysis Methods 21
closely by sales and use taxes (including gas taxes) at about 23.8%. Miscellaneous revenues,
(such as license fees, fines, net lottery proceeds, and others) follow with 13%. Current charges
(such as park fees, tolls, and university system tuition) represent about 6.9% of the total.
Figure 3-1
Distribution of Georgia Revenue Sources: 2008
Source: U.S. Department of the Census, State Government Finances: 2009, http://www.census.gov/govs/www/state01.html The functional relationships between state revenue sources and economic activity vary
depending upon what revenue source is estimated. Table 3-1 provides a listing of the revenue
sources estimated and the functional relationship used in each. There is a high degree of
correlation among the various independent variables, so a reasonable prediction (at least in the
short term) could be made by using any of several choices. Previous statistical analyses
conducted by the author have identified the listed functional relationships to be the most robust.
Because the purpose of this analysis is to estimate the revenues attributable to the music
industry in the existing economy (rather than forecasting impacts of a change in the industry),
existing averages were used as the basis for estimation. For example, because general sales tax
is most closely related to personal income, the average of general sales tax collected per dollar of
personal income was applied to the estimate of income attributable to the music industry. This
was done to estimate the amount of current sales tax collections from the industry. Similar
methods were applied to other categories of state revenues.
Section 3 – Economic and Fiscal Impact Analysis Methods 22
Table 3-1: State Government Revenue Sources Estimated and Functional Relationship
Revenue Source Title Assumed a Function of: General Sales Tax Personal Income Selective Sales Tax Employment Individual Income Tax Personal Income Corporate Income Tax Employment License Revenue Personal Income Intergovernmental Transfers Population Revenues from Fees Personal Income Miscellaneous Fees Population
Local Government Revenues
There is considerable variability in the revenues generated by local governments, and
without information about the geographic dispersion of the economic activity supported by the
music industry and the specific governments affected, any estimate of local government revenues
must be considered uncertain. Estimates based upon state averages have as much a probability
of being over- as underestimated and are, therefore, a valid representation of expected value.
Because much of the industry is located in urban centers, where local government tax rates tend
to be higher, it could even be argued that estimates based on state averages would be
conservative.
The total local government revenues collected throughout the state formed the basis for
the estimates of how much the music industry supports them. A statistical analysis of the
functional relationships between the revenue categories and economic and demographic
variables (principally income, employment, and population) provided the basis for estimating the
local government revenues attributable to the music industry. The functional relationships that
resulted from the statistical analysis are provided in Table 3-2.
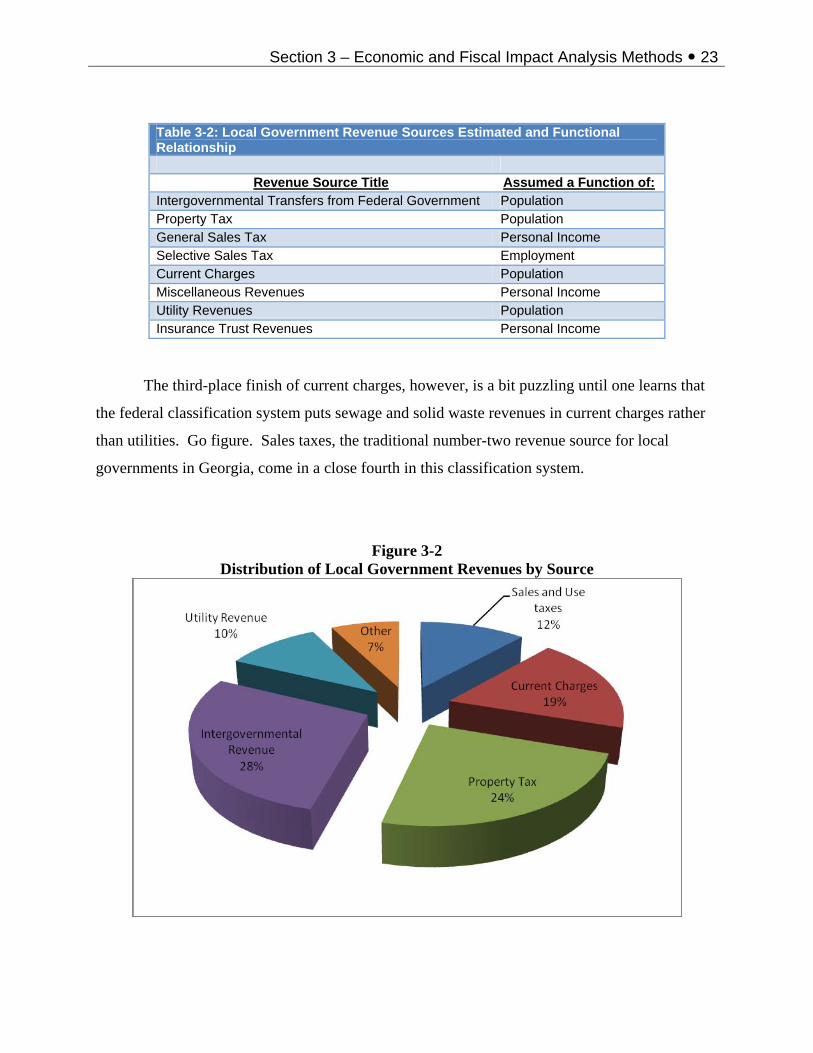
The relative size of each of these revenue sources (general and selective sales taxes have
been combined and insurance trust revenue has been combined with miscellaneous revenues in
this figure) is displayed in Figure 3-2. The largest source of revenue is intergovernmental
transfers from the federal government, but this may be anomalous because of the federal
stimulus package that was enacted in 2008. Following closely behind intergovernmental
transfers are property taxes, with about 24 percent.
Section 3 – Economic and Fiscal Impact Analysis Methods 23
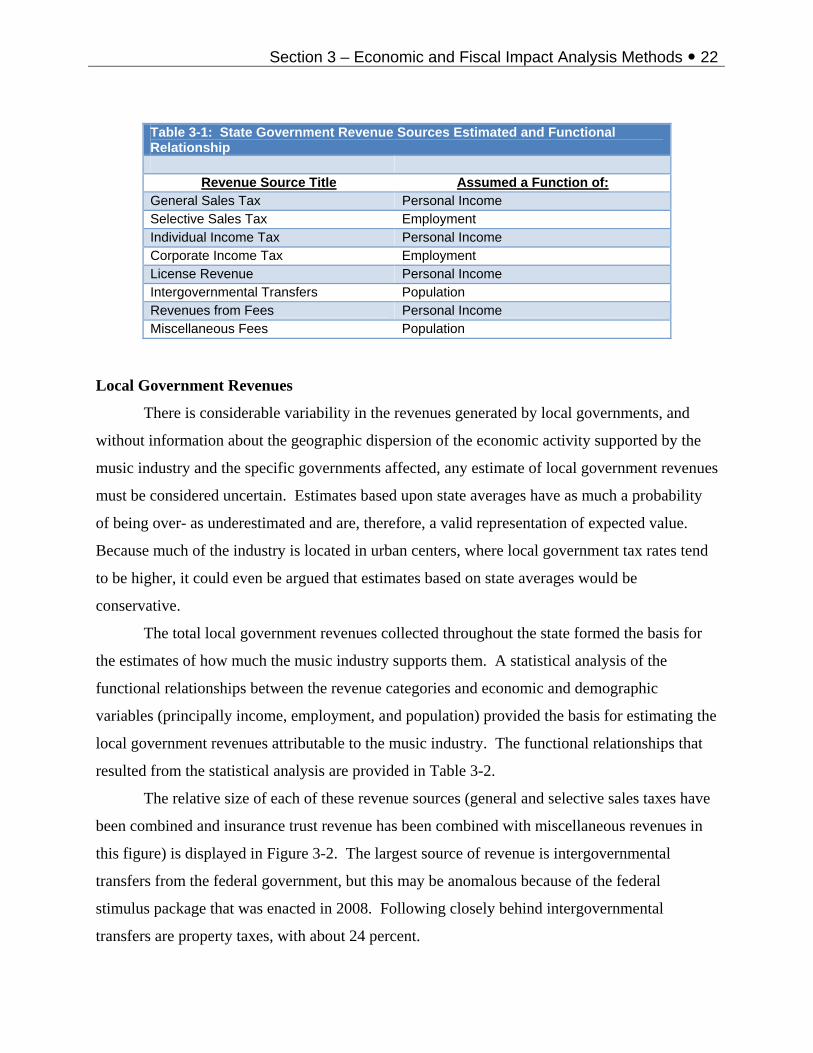
Table 3-2: Local Government Revenue Sources Estimated and Functional Relationship
Revenue Source Title Assumed a Function of: Intergovernmental Transfers from Federal Government Population Property Tax Population General Sales Tax Personal Income Selective Sales Tax Employment Current Charges Population Miscellaneous Revenues Personal Income Utility Revenues Population Insurance Trust Revenues Personal Income
The third-place finish of current charges, however, is a bit puzzling until one learns that
the federal classification system puts sewage and solid waste revenues in current charges rather
than utilities. Go figure. Sales taxes, the traditional number-two revenue source for local
governments in Georgia, come in a close fourth in this classification system.
Figure 3-2 Distribution of Local Government Revenues by Source

Section 4 – Results
Section 4 – Results 25
The results of the analysis fall into two categories. The first relates to the economic
impact, which measures the additional economic activity supported by the resources brought into
Georgia by the music industry. The second section displays the fiscal impacts at the state and
local levels attributable to this economic activity.
Economic Impacts
Estimating the economic impacts from an industry first requires the estimation of the
direct impacts from the industry. Direct impacts isolate the new resources brought into the
economy by the industry and therefore differ from measures of the activity of the entire industry.
This distinction is important to avoid any double-counting due to the industry’s purchases from
other elements within the same industry. The total impact of the industry is then estimated by
considering how those direct impacts affect all the other industries and households in the Georgia
economy.
Table 4-1, therefore, has three columns. The first provides measures of the industry
activity in Georgia. The direct impacts in the second column are noticeably smaller and
represent the portion of the industry that is bringing new resources to the state. The Implan
input-output model was used to estimate the total impacts based on the direct impact data.
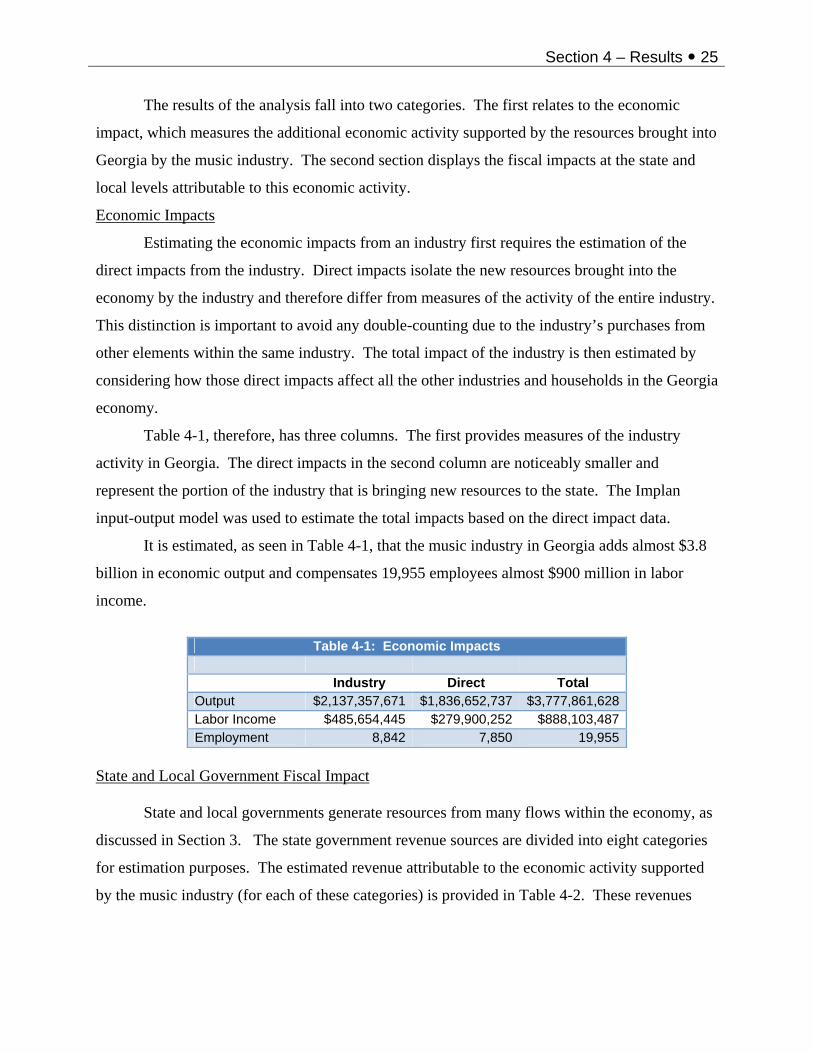
It is estimated, as seen in Table 4-1, that the music industry in Georgia adds almost $3.8
billion in economic output and compensates 19,955 employees almost $900 million in labor
income.
Table 4-1: Economic Impacts
Industry Direct Total Output $2,137,357,671 $1,836,652,737 $3,777,861,628 Labor Income $485,654,445 $279,900,252 $888,103,487 Employment 8,842 7,850 19,955
State and Local Government Fiscal Impact State and local governments generate resources from many flows within the economy, as
discussed in Section 3. The state government revenue sources are divided into eight categories
for estimation purposes. The estimated revenue attributable to the economic activity supported
by the music industry (for each of these categories) is provided in Table 4-2. These revenues
Section 4 – Results 26
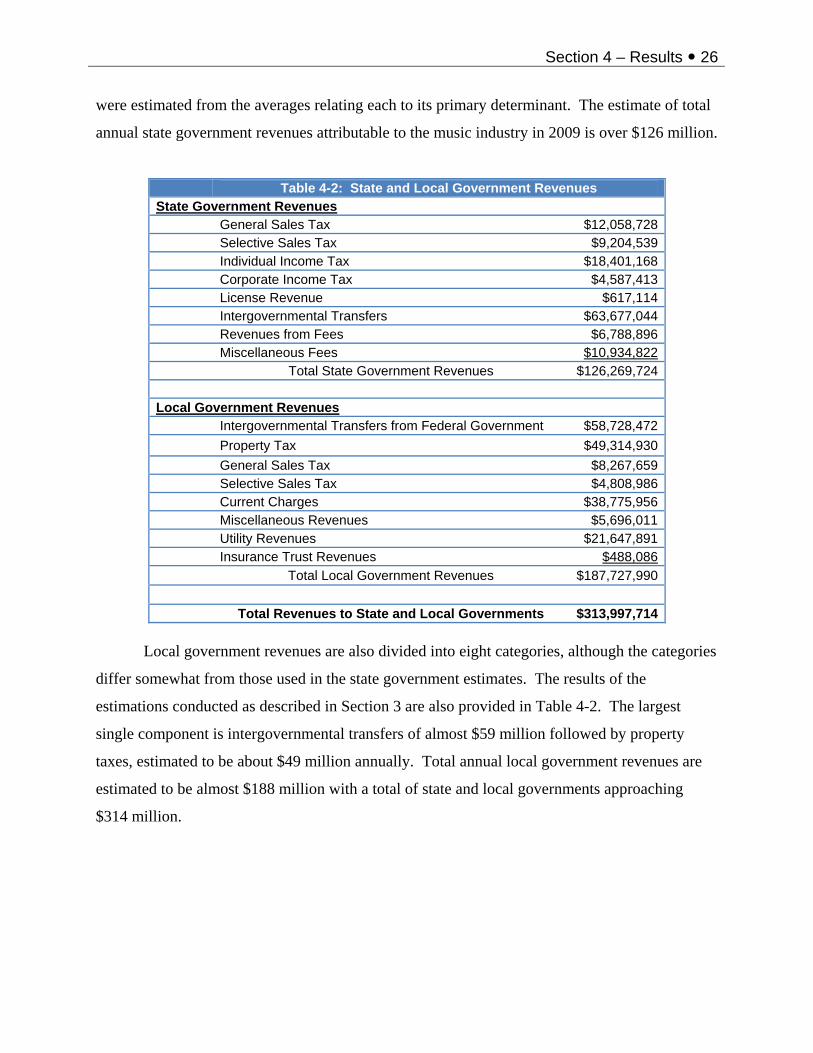
were estimated from the averages relating each to its primary determinant. The estimate of total
annual state government revenues attributable to the music industry in 2009 is over $126 million.
Table 4-2: State and Local Government Revenues State Government Revenues General Sales Tax $12,058,728 Selective Sales Tax $9,204,539 Individual Income Tax $18,401,168 Corporate Income Tax $4,587,413 License Revenue $617,114 Intergovernmental Transfers $63,677,044 Revenues from Fees $6,788,896 Miscellaneous Fees $10,934,822 Total State Government Revenues $126,269,724 Local Government Revenues Intergovernmental Transfers from Federal Government $58,728,472 Property Tax $49,314,930 General Sales Tax $8,267,659 Selective Sales Tax $4,808,986 Current Charges $38,775,956 Miscellaneous Revenues $5,696,011 Utility Revenues $21,647,891 Insurance Trust Revenues $488,086 Total Local Government Revenues $187,727,990 Total Revenues to State and Local Governments $313,997,714
Local government revenues are also divided into eight categories, although the categories
differ somewhat from those used in the state government estimates. The results of the
estimations conducted as described in Section 3 are also provided in Table 4-2. The largest
single component is intergovernmental transfers of almost $59 million followed by property
taxes, estimated to be about $49 million annually. Total annual local government revenues are
estimated to be almost $188 million with a total of state and local governments approaching
$314 million.

References 27
References Edmiston, Kelley, and Marcus Thomas, “The Commercial Music Industry in Atlanta and the State of Georgia: An Economic Impact Study,” Fiscal Research Program Georgia State University (report FRC-85), August 2003. Florida, Richard and Scott Jackson, “Sonic City: The Evolving Economic Geography of the Music Industry,” Journal of Planning Education and Research, 29-3, 2010 p.316. Kusek, Dave, “Music Business 101: the Future of Global Music,” Berklee College of Music, 2011. http://www.futureofmusicbook.com/ Resnick, Bernard and Pricilla Mattison, “USA Concert Touring Issues,”2011. http://www.bernardresnick.com/Library/IAEL_FINAL.pdf ReferenceUSA “Data for 2009 NAICS 512240 and 512290: Sound Recording Studios,” procured 2010, http://www.referenceusa.com/Home/Home Rushton, Michael and Marcus Thomas, “The Economics of the Commercial Music Industry in Atlanta and the State of Georgia: Industrial Organization and New Estimates of Economic Impacts,” Fiscal Research Program Georgia State University, February, 2005. U.S. Department of the Census, State Government Finances: 2009, http://www.census.gov/govs/www/state01.html
References 28
Biographical Sketch
B. WILLIAM RIALL
Education Ph.D. in Economics Georgia State University 1985 Masters in Business Administration University of Alabama 1973 B.S., Major in Chemistry, Minor in Economics University of Alabama 1971 Employment History Georgia Institute of Technology Retired (part-time) 2005 - Now Principal Research Associate 1993 - 2005 Senior Research Scientist 1986 - 1993 Research Scientist II 1979 - 1986 Georgia Department of Natural Resources 1974 - 1979 Environmental Protection Division Program Manager I 1978 - 1979 Environmental Specialist 1974 - 1978 Experience Summary Current work involves directing economic research projects in a variety of subject areas. Primarily the projects are in the areas assessing the economic viability of technology and of economic development opportunities. Other project areas include feasibility analysis, cost-benefit analysis, investment decision rules, economic impact analysis in both domestic and foreign economies, and assessment of policy and strategic recommendations related to economic development opportunities and software development as coauthor of the nationally distributed local fiscal impact tool “LOCI”. Previous experience at Georgia Tech includes energy demand forecasting in the commercial sector, technology penetration analysis, environmental impact analysis, socioeconomic impact analysis, and economic analysis methodology development. Other experience includes assistance in the administration of federal programs, at the state level, relating to water quality control. Current Fields of Interest Economic development strategies, economic and feasibility analysis of development and technological opportunities, economic and fiscal impact analysis at the state and local level, and software development. Major Reports and Publications 1. “Beneficial Use of Savannah River Dredged Materials in Brick Making: An Explorative
Study,” for the Georgia Department of Transportation, coauthor, June, 2010 2. “Economic Development Strategies,” prepared for Paulding County, 2010, co-author. 3. “Economic and Fiscal Impact of Children’s Healthcare of Atlanta,” prepared for Children’s
Healthcare of Atlanta, coauthor, May, 2009. 4. “Impact Analysis of the Ohio Technology-Based Economic Development Programs,”

References 29
author, as a part of a larger project, prepared for the State of Ohio, May, 2009. 5. “Fiscal Impact Analysis of a Coal-Fired Electric Power Generation Facility in Washington
County,” author, prepared for Washington County, Georgia, November, 2008. 6. “Economic Impacts of the Forestry Industry in Georgia”, author, October 2008 7. “Fiscal and Economic Impact Analysis of the Proposed Taubman Development,”
prepared for Forsyth County, Georgia, co-author and project director, March, 2008. 8. “Economic Impact of the Kia Automotive Plant Location on the Troup County Region,”
co-author, prepared for Troup County, Georgia as part of a larger study, September, 2007.
9. “Economic Impact of the Kia Automotive Plant Location on the Chambers County Region,” co-author, prepared for Chambers County (Alabama) Development Authority, co-author, June, 2007.
10. “Fiscal and Economic Impact Analysis of the Closure of the Brown & Williamson Facility,” author, prepared for the Macon/Bibb County Development Authority, April, 2007.
11. “Economic Impacts of the Forestry Industry in Georgia”, author, October 2006 12. “Analysis of the Economic Dependence on Military Activities in Bryan County,” prepared
for the Bryan County Development Authority, author, August, 2006. 13. “Economic Impacts of the Forestry Industry in Georgia”, author, October 2005 14. “Local Fiscal Impact by Sector in the GREDC Region,” co-author, prepared for the
Georgia Regional Economic Development Center, May, 2005. 15. “Economic and Fiscal Impact Analysis of the Roper Existing and Planned Expansion in
Jackson County and the City of Commerce,” author, prepared for Roper Industries, April, 2005.
16. “Arabia Mountain National Heritage Area: Opportunities for Tourism Development,” co-author, prepared for the Arabia Mountain Heritage Alliance, Jan, 2005.
17. “Liquid Natural Gas (LNG) in Georgia,” coauthor, prepared for the Atlanta Gas Light Company, November, 2004.
18. “Economic Impacts of the Forestry Industry in Georgia”, author, October 2004 19. “Economic and Fiscal Impact Analysis of the Motion Picture Industry in Georgia,”
author, prepared for Turner Broadcasting System, April, 2004. 20. “Building a Fiscal Impact Tool for Land Use Planning For Gwinnett County”, coauthor,
December, 2003 21. “Preliminary Feasibility Analysis of an Intermodal Facility in Cordele”, coauthor,
November, 2003 22. “Economic Impacts of the Forestry Industry in Georgia”, author, October 2003 23. “Economic Impacts of the Federal Law Enforcement Training Center”, author, March,
2003. 24. “Economic Benefits in Rockdale County of the Georgia International Horsepark”,
coauthor, January, 2003. 25. “Economic Analysis of Alternative Poultry Box Designs”, author, March, 2002. 26. “Rural Georgia: To Be or Not To Be...Zoned An Economic Development Perspective”,
coauthor, December, 2001. 27. “The Development Potential of Georgia’s Biotechnology Industry,” prepared for the
Gergia Department of Industry, Trade and Tourism, coauthor, January, 2001. 9. “SFIA: State Fiscal Impact Analysis Model for Georgia,” developed under the EDRP,
implemented 1999. 10. “The Critical Success Factors for the Advanced Ceramics Industry,” consultants report
presented to Pechiney, Ltd., Paris, France, 1988. 11. Developing a Regional Industrial Park in the Franklin, Hart, and Stephens County Joint
Development authority Region,” prepared for EDRP, the US Economic Development

References 30
Administration, and the Franklin, Hart, and Stephens County Joint Development Authority, October, 1998.
12. Georgia Research Alliance industry Profiles: Advanced Telecommunication, Biotechnology, and Environmental,” prepared for the Georgia Office of Planning and Budget under EDRP, December, 1997.
13. “Measuring Outcomes in Economic Development Programs,” prepared for the Georgia Office of Planning and Budget under EDRP, July, 1997.
14. “Fiscal Impacts of a Hypothetical Semiconductor Manufacturing Facility,” prepared for the Georgia Office of Planning and Budget, May, 1997.
15. “An Analysis of the Impact of Freeport Exemptions in Bartow County,” prepared for the City of Cartersville, and the Bartow County Commission, November, 1995; rev 1997
16. “Window on the Mountains: Tourism Opportunities in CEDO Region 2,” prepared for the Council of Economic Development Organizations Region 2, coauthor, June, 1995.
17. “The Potential for Warehouse/Distribution Centers in Glynn County: A Comparative Analysis of Costs,” prepared for the Brunswick/Glynn County Economic Development Authority, coauthor, January, 1995.
18. “Globalization and the Georgia Economy,” prepared for the Governor’s Development Council with Georgia State University, coauthor, November, 1994.
19. “NAFTA: A Preliminary Evaluation,” prepared for the Governor’s Development Council, coauthor, November, 1993.
20. “The 1996 Olympic Yachting Events in Savannah: Strategies for Maximizing the Economic Benefits for Coastal Georgia,” prepared for the City of Savannah and the Coastal Georgia Regional Development Center, coauthor, October, 1993.
21. "Assessment of the Economic Impact and Technical Viability of a Wood-Fired Electric Power Plant,” (with Jim Walsh) prepared for Alternative Energy, Inc., Bangor, Maine, 1994.
22. "Compass: A Software Tool for Equipment Acquisition Decision Making in the Apparel Industry,” International Journal of Clothing Science and Technology, 1993 (refereed).
23. "Impacts of NAFTA on the Georgia Economy,” (with others) prepared for The Georgia Development Council, 1993.
24. "Economic Impact of the Proposed Georgia Music Hall of Fame,” prepared for the Georgia Music Hall of Fame Authority, June, 1993 (draft), coauthor.
25. “State Economic Development Incentives: An Appraisal of Need,” prepared under the Economic Development Research Program, June, 1992.
26. "Economic Impact of the Proposed Georgia Music Hall of Fame,” presented to the Georgia Music Hall of Fame Authority, Atlanta, Georgia, June 1992.
27. "Local Economic Impacts: Costs and Benefits of Development,” prepared under the Economic Development Research Program, December, 1991, author.
28. "Toward Development of an Export Strategy for Georgia,” prepared under the Economic Development Research Program, December, 1991, author.
29. "The Feasibility of Improving the Marker Making Process,” International Journal of Clothing Science and Technology, 1991 (refereed).
30. "Economic Justification of Technology Acquisition,” Management of Technology (proceedings: T.K. Khalil and B.A. Bayraktar, Editors), March 1990 (refereed).
31. "Energy Potential from Biomass Sources in Georgia,” (with others) prepared for the Georgia Forestry Commission, February 1990, project director.
32. "Feasibility of Improved Marker-Making,” (with others) prepared for the U.S. Defense Logistics Agency, February 1990.
33. "Technology in Appalachian Region Industries,” (with others) prepared for the Appalachian Regional Commission, February 1990.
34. "Software to Support Nontraditional Equipment Acquisition Decision-Making,” Apparel
References 31
Researchers Conference, Philadelphia, Pennsylvania, February 1990. 35. "An Economic Growth Strategy for Rural Coastal Georgia,” (with others) prepared for the
National Coastal Resources and Development Institute, October 1989, coauthor. 36. "Evaluation of Target Industry Modeling and Suggested Revisions,” prepared under the
Economic Development Research Program, July 1989, author. 37. "Business, Industry and Technology: An Analysis of the Supply and Demand for
University System Graduates in Selected Disciplines,” (with others) submitted to the Board of Regents of the University System of Georgia, January 1989.
38. "Nontraditional Equipment Justification Methods and their Applicability to the Apparel Industry,” prepared for the U.S. Defense Logistics Agency, November 1988.
39. "Feasibility of Cut Flower Production,” (with others) prepared under the Economic Development Research Program, June 1988, project director.
40. "Project Feasibility/Small Enterprise Development,” presented to the U.S. Peace Corps Small Enterprise Development Program, Asuncion, Paraguay, April 1988.
41. "Development and Use of Economic Regions in Georgia and an Analysis of Georgia's Economy by Sectors and Markets,” (with others) prepared for the Governor's Growth Strategies Commission, November 1987.
42. "Economic Analysis of Agroforestry Grant Projects in the Sudan Renewable Energy Project,” prepared for the National Council for Research, Republic of Sudan, March 1987, author.
54. "Costs and Benefits of Shelterbelts in Sudanese Agriculture,” presented to the Sudan Renewable Energy Program, Khartoum, Sudan, January, 1987.
43. "Manual of Economic Analysis,” (with others) prepared for the U.S. Agency for International Development, December 1986, coauthor.
44. "Dendro Thermal Power Generation Program Evaluation Study: Economic and Financial Feasibility Analysis,” (with others) prepared for National Electrification Administration (Philippines) and Asian Development Bank, March 1985, project director.
45. "Analysis of Commercial Sector Electricity Use and Peak Demand for Investigation into the Potential for Cool Storage Systems,” (with others) prepared for the Electric Power Research Institute, April 1984.