Embed Size (px)
Citation preview
2016
The Economic Impact of Tourism in Louisiana
Prepared for :

Overview
3
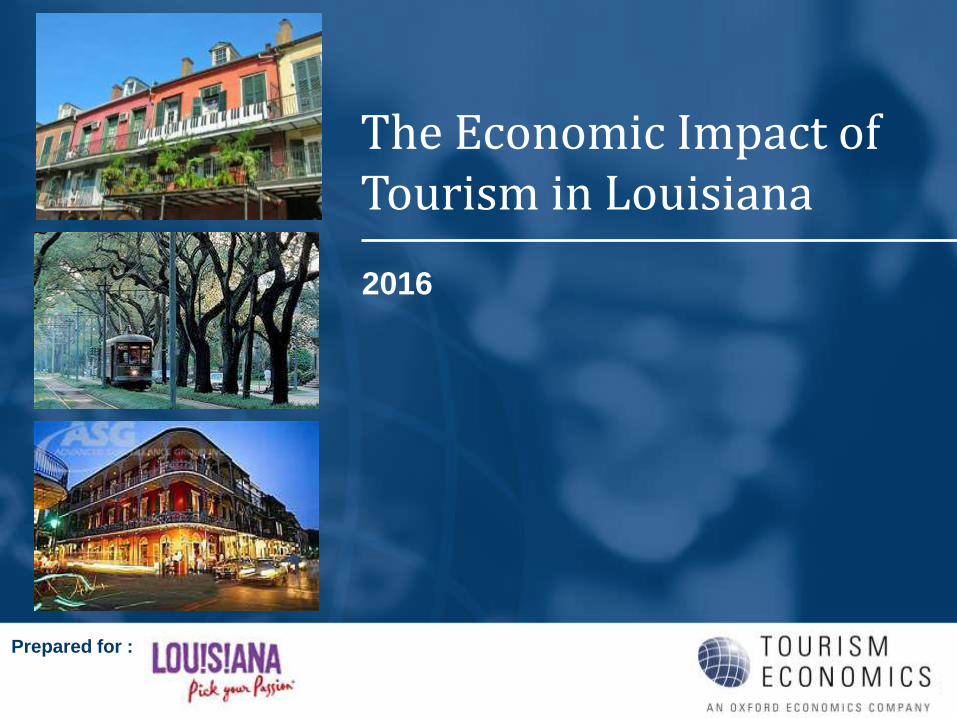
2016 at a glance
A total of 185,389 jobs, with income of $5.7 billion, were
sustained by the visitor economy in Louisiana in 2016.
Visitor-supported employment represents nearly 7% of all
employment in the state of Louisiana (1-in-14 jobs).
Including indirect and induced impacts, travel in Louisiana
generated $1.7 billion in state and local taxes and $1.3 billion in
Federal taxes in 2016.
State Travel Impacts
5
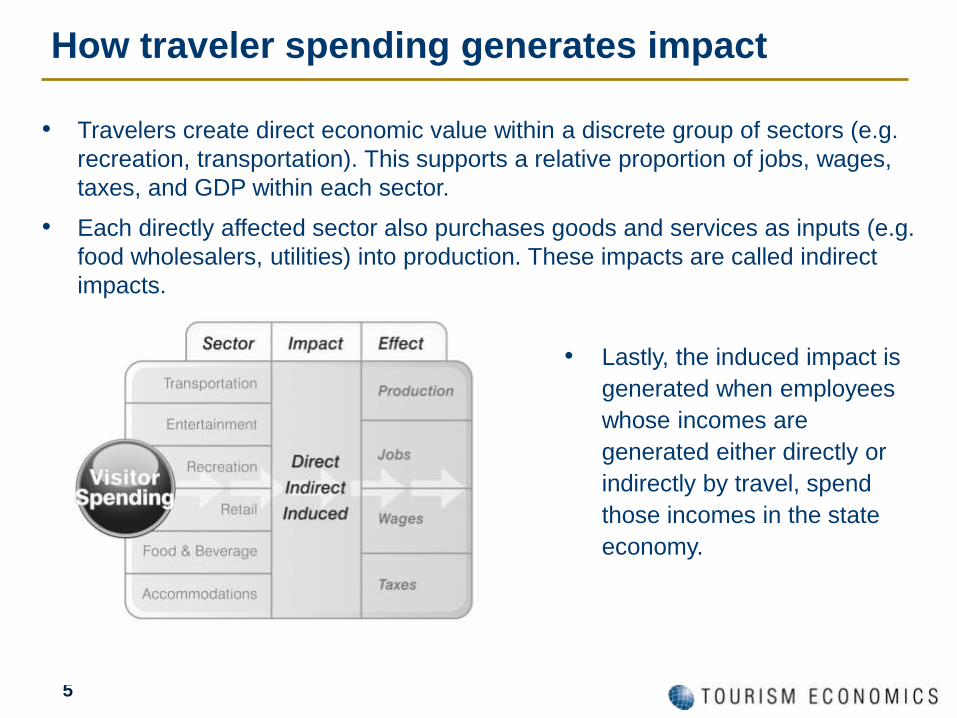
How traveler spending generates impact
• Lastly, the induced impact is
generated when employees
whose incomes are
generated either directly or
indirectly by travel, spend
those incomes in the state
economy.
• Travelers create direct economic value within a discrete group of sectors (e.g.
recreation, transportation). This supports a relative proportion of jobs, wages,
taxes, and GDP within each sector.
• Each directly affected sector also purchases goods and services as inputs (e.g.
food wholesalers, utilities) into production. These impacts are called indirect
impacts.
6
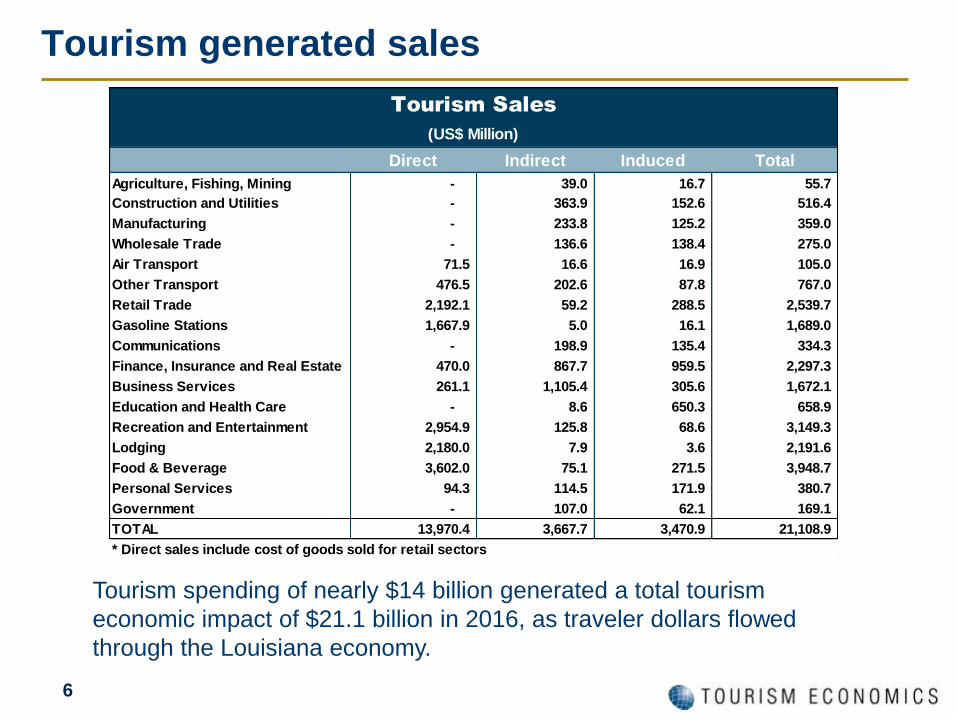
Tourism generated sales
Direct Indirect Induced Total
Agriculture, Fishing, Mining - 39.0 16.7 55.7
Construction and Utilities - 363.9 152.6 516.4
Manufacturing - 233.8 125.2 359.0
Wholesale Trade - 136.6 138.4 275.0
Air Transport 71.5 16.6 16.9 105.0
Other Transport 476.5 202.6 87.8 767.0
Retail Trade 2,192.1 59.2 288.5 2,539.7
Gasoline Stations 1,667.9 5.0 16.1 1,689.0
Communications - 198.9 135.4 334.3
Finance, Insurance and Real Estate 470.0 867.7 959.5 2,297.3
Business Services 261.1 1,105.4 305.6 1,672.1
Education and Health Care - 8.6 650.3 658.9
Recreation and Entertainment 2,954.9 125.8 68.6 3,149.3
Lodging 2,180.0 7.9 3.6 2,191.6
Food & Beverage 3,602.0 75.1 271.5 3,948.7
Personal Services 94.3 114.5 171.9 380.7
Government - 107.0 62.1 169.1
TOTAL 13,970.4 3,667.7 3,470.9 21,108.9
* Direct sales include cost of goods sold for retail sectors
Tourism Sales
(US$ Million)
Tourism spending of nearly $14 billion generated a total tourism
economic impact of $21.1 billion in 2016, as traveler dollars flowed
through the Louisiana economy.
7
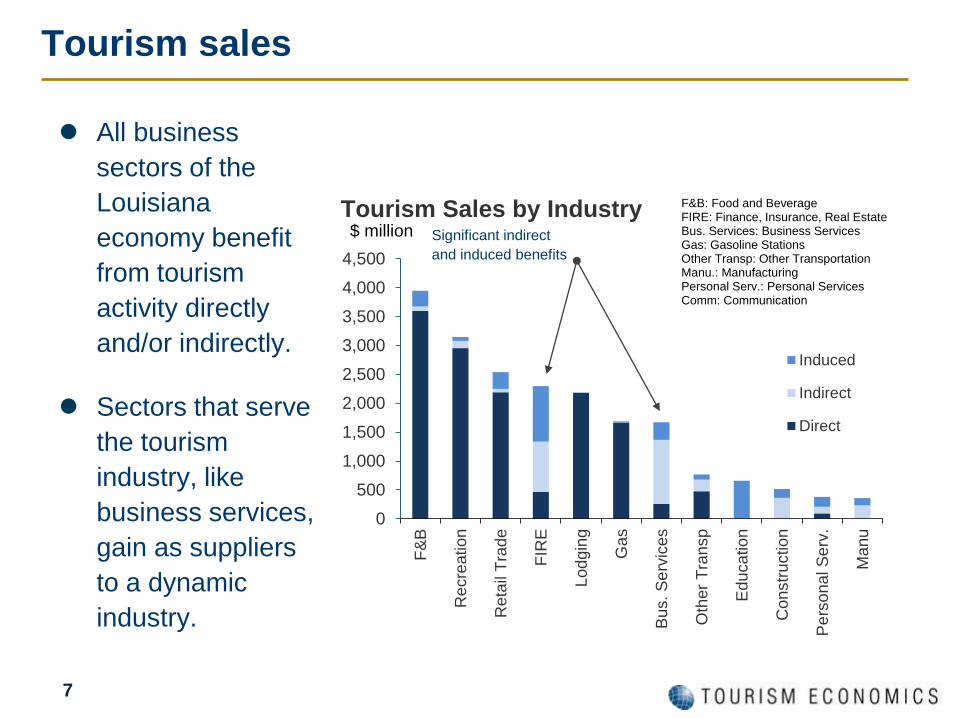
All business
sectors of the
Louisiana
economy benefit
from tourism
activity directly
and/or indirectly.
Sectors that serve
the tourism
industry, like
business services,
gain as suppliers
to a dynamic
industry.
Tourism sales
Significant indirect
and induced benefits
0
500
1,000
1,500
2,000
2,500
3,000
3,500
4,000
4,500
F&
B
Re
cre
ation
Re
tail
Tra
de
FIR
E
Lo
dg
ing
Ga
s
Bu
s.
Se
rvic
es
Oth
er
Tra
nsp
Education
Co
nstr
uctio
n
Pe
rso
na
l S
erv
.
Ma
nu
Induced
Indirect
Direct
Tourism Sales by Industry$ million
F&B: Food and BeverageFIRE: Finance, Insurance, Real EstateBus. Services: Business ServicesGas: Gasoline StationsOther Transp: Other TransportationManu.: ManufacturingPersonal Serv.: Personal ServicesComm: Communication
8
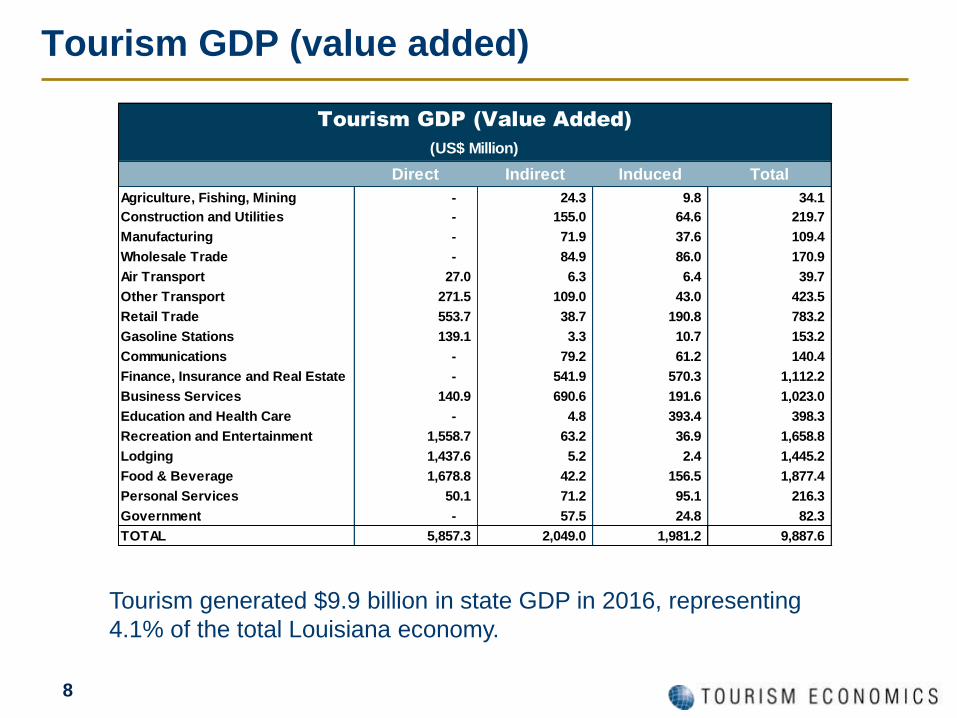
Tourism GDP (value added)
Direct Indirect Induced Total
Agriculture, Fishing, Mining - 24.3 9.8 34.1
Construction and Utilities - 155.0 64.6 219.7
Manufacturing - 71.9 37.6 109.4
Wholesale Trade - 84.9 86.0 170.9
Air Transport 27.0 6.3 6.4 39.7
Other Transport 271.5 109.0 43.0 423.5
Retail Trade 553.7 38.7 190.8 783.2
Gasoline Stations 139.1 3.3 10.7 153.2
Communications - 79.2 61.2 140.4
Finance, Insurance and Real Estate - 541.9 570.3 1,112.2
Business Services 140.9 690.6 191.6 1,023.0
Education and Health Care - 4.8 393.4 398.3
Recreation and Entertainment 1,558.7 63.2 36.9 1,658.8
Lodging 1,437.6 5.2 2.4 1,445.2
Food & Beverage 1,678.8 42.2 156.5 1,877.4
Personal Services 50.1 71.2 95.1 216.3
Government - 57.5 24.8 82.3
TOTAL 5,857.3 2,049.0 1,981.2 9,887.6
Tourism GDP (Value Added)
(US$ Million)
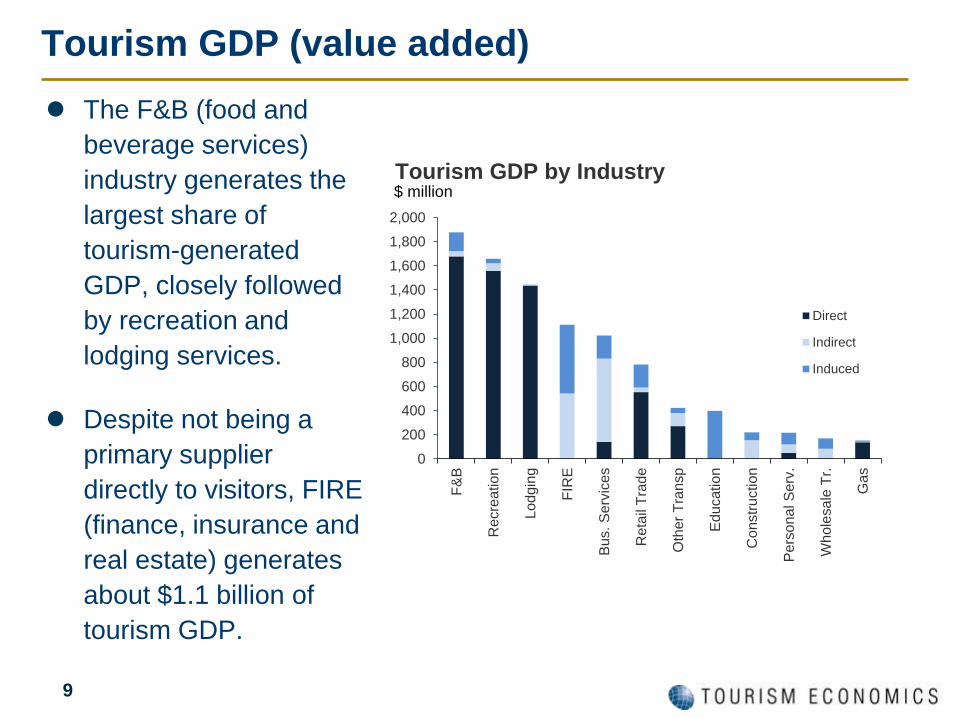
Tourism generated $9.9 billion in state GDP in 2016, representing
4.1% of the total Louisiana economy.
9
The F&B (food and
beverage services)
industry generates the
largest share of
tourism-generated
GDP, closely followed
by recreation and
lodging services.
Despite not being a
primary supplier
directly to visitors, FIRE
(finance, insurance and
real estate) generates
about $1.1 billion of
tourism GDP.
Tourism GDP (value added)
0
200
400
600
800
1,000
1,200
1,400
1,600
1,800
2,000
F&
B
Re
cre
atio
n
Lo
dg
ing
FIR
E
Bus.
Serv
ice
s
Re
tail
Tra
de
Oth
er
Tra
nsp
Edu
ca
tio
n
Co
nstr
uctio
n
Pers
on
al S
erv
.
Wh
ole
sa
le T
r.
Ga
s
Direct
Indirect
Induced
Tourism GDP by Industry$ million
10
Tourism employment
Direct Indirect Induced Total
Agriculture, Fishing, Mining - 297 134 431
Construction and Utilities - 1,038 426 1,465
Manufacturing - 484 191 675
Wholesale Trade - 563 571 1,134
Air Transport 190 44 45 279
Other Transport 4,905 1,431 599 6,935
Retail Trade 13,416 748 3,439 17,603
Gasoline Stations 3,037 73 234 3,344
Communications - 670 338 1,008
Finance, Insurance and Real Estate - 4,871 2,688 7,559
Business Services 1,201 9,772 3,008 13,980
Education and Health Care - 219 7,064 7,283
Recreation and Entertainment 33,476 2,130 812 36,417
Lodging 21,253 68 32 21,353
Food & Beverage 52,522 1,483 4,535 58,540
Personal Services 2,545 1,287 2,591 6,422
Government - 654 306 960
TOTAL 132,545 25,833 27,011 185,389
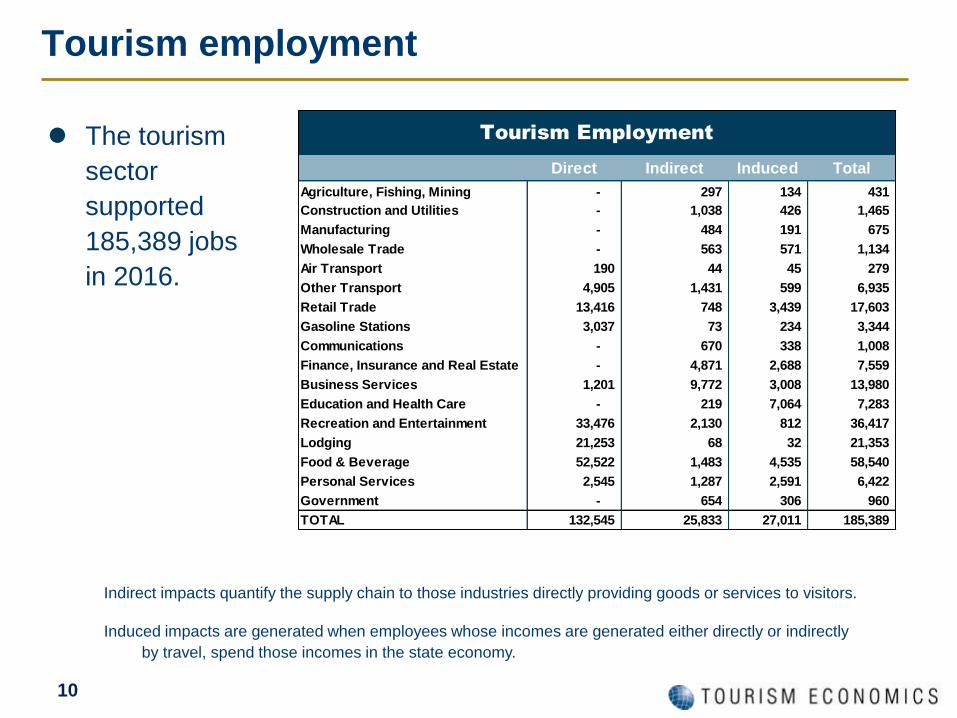
Tourism Employment The tourism
sector
supported
185,389 jobs
in 2016.
Indirect impacts quantify the supply chain to those industries directly providing goods or services to visitors.
Induced impacts are generated when employees whose incomes are generated either directly or indirectly
by travel, spend those incomes in the state economy.
11
Tourism employment
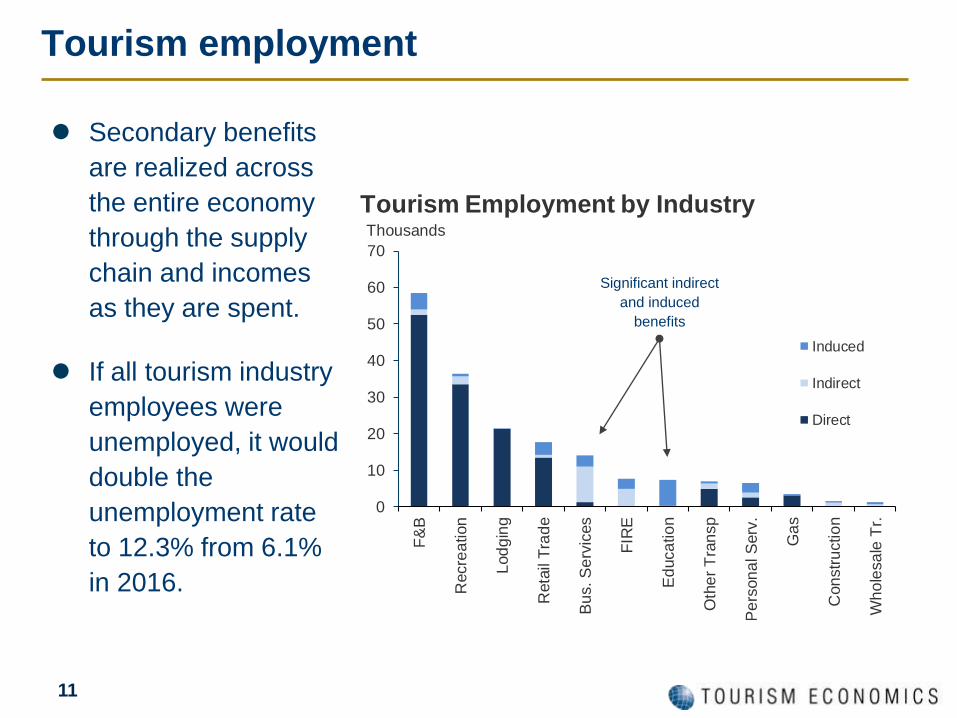
Secondary benefits
are realized across
the entire economy
through the supply
chain and incomes
as they are spent.
If all tourism industry
employees were
unemployed, it would
double the
unemployment rate
to 12.3% from 6.1%
in 2016.
Significant indirect
and induced
benefits
0
10
20
30
40
50
60
70
F&
B
Recre
ation
Lod
gin
g
Reta
il T
rad
e
Bu
s. S
erv
ices
FIR
E
Ed
uca
tio
n
Oth
er
Tra
nsp
Pe
rson
al S
erv
.
Ga
s
Con
str
uctio
n
Wh
ole
sa
le T
r.
Thousands
Induced
Indirect
Direct
Tourism Employment by Industry
12
Tourism personal income
Direct Indirect Induced Total
Agriculture, Fishing, Mining - 16.4 6.8 23.2
Construction and Utilities - 74.6 30.9 105.5
Manufacturing - 27.7 12.2 39.9
Wholesale Trade - 42.9 43.5 86.5
Air Transport 16.3 3.8 3.8 23.9
Other Transport 204.2 80.7 32.0 316.9
Retail Trade 324.6 23.4 105.8 453.7
Gasoline Stations 113.0 2.7 8.7 124.4
Communications - 39.5 20.8 60.4
Finance, Insurance and Real Estate - 154.2 96.2 250.4
Business Services 68.9 501.2 144.9 715.0
Education and Health Care - 4.6 359.6 364.2
Recreation and Entertainment 792.3 36.2 19.3 847.7
Lodging 701.4 2.3 1.1 704.8
Food & Beverage 1,148.7 35.7 103.4 1,287.8
Personal Services 59.0 59.6 84.5 203.1
Government - 52.6 21.7 74.3
TOTAL 3,428.3 1,158.1 1,095.2 5,681.7
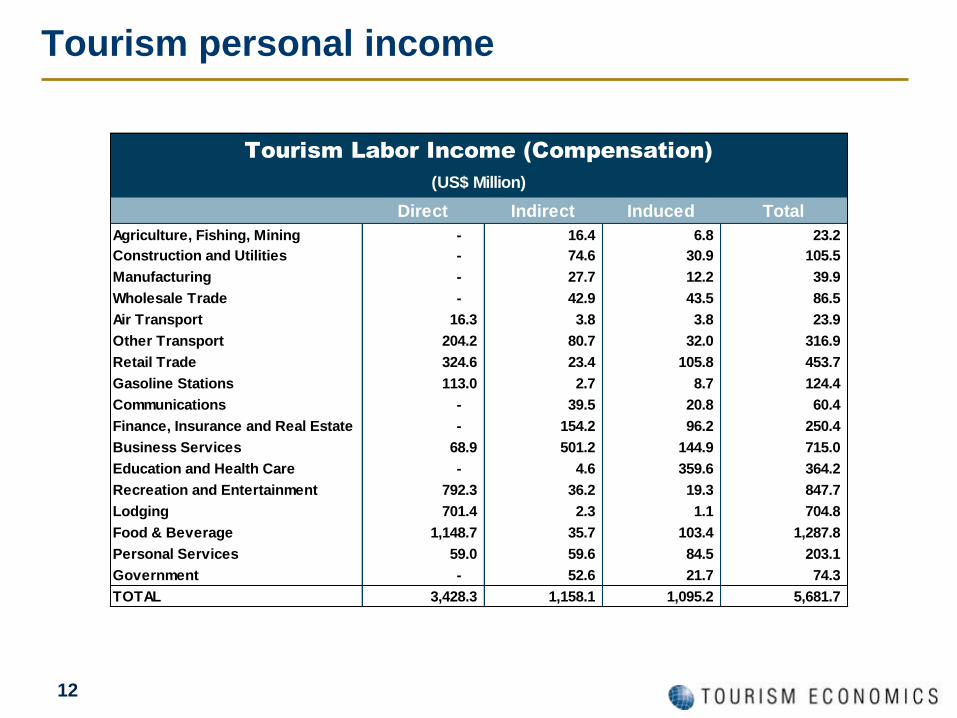
Tourism Labor Income (Compensation)
(US$ Million)
13
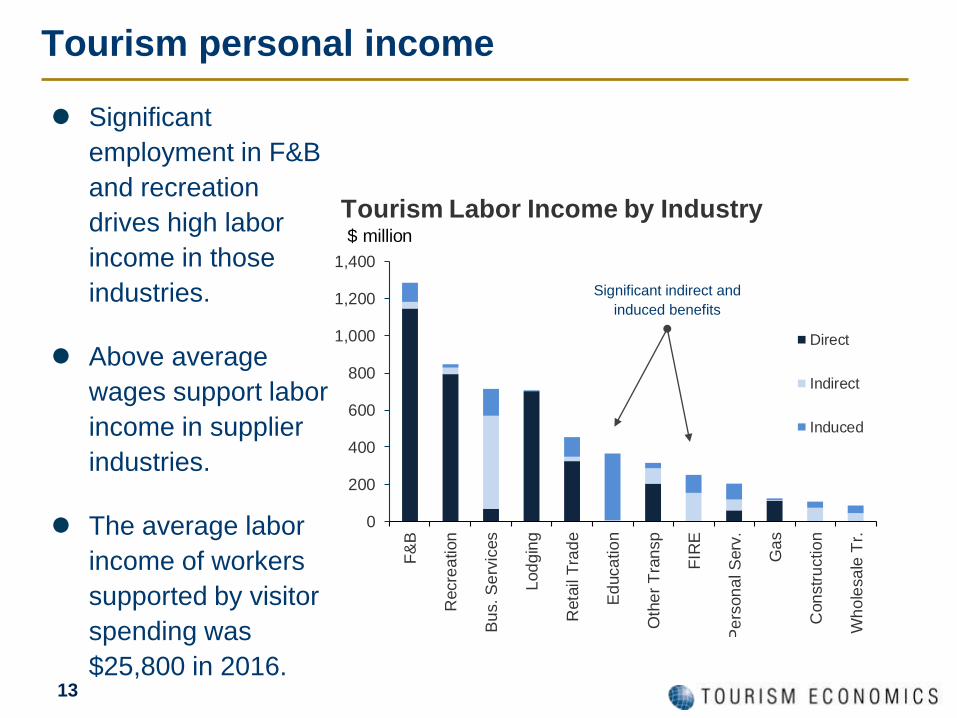
Tourism personal income
Significant
employment in F&B
and recreation
drives high labor
income in those
industries.
Above average
wages support labor
income in supplier
industries.
The average labor
income of workers
supported by visitor
spending was
$25,800 in 2016.
Significant indirect and
induced benefits
0
200
400
600
800
1,000
1,200
1,400
F&
B
Recre
ation
Bu
s. S
erv
ices
Lod
gin
g
Reta
il T
rad
e
Ed
uca
tio
n
Oth
er
Tra
nsp
FIR
E
Pe
rson
al S
erv
.
Ga
s
Con
str
uctio
n
Wh
ole
sa
le T
r.
Direct
Indirect
Induced
Tourism Labor Income by Industry$ million
14
Tourism tax generation
Direct Indirect/
Induced
Total
Federal 817.4 532.1 1,349.5
Personal Income 241.5 159.1 400.6
Corporate 110.0 114.3 224.3
Indirect business 124.4 39.3 163.7
Social Security 341.6 219.3 560.9
State and Local 1,396.4 338.1 1,734.6
Sales 851.6 188.4 1,040.0
Bed Tax 157.4 - 157.4
Personal Income 43.9 28.9 72.8
Corporate 5.4 5.6 10.9
Social Security 7.0 4.4 11.5
Excise and Fees 99.5 37.2 136.7
Property 231.7 73.6 305.3
TOTAL 2,213.9 870.2 3,084.1
(US$ Million, 2016)
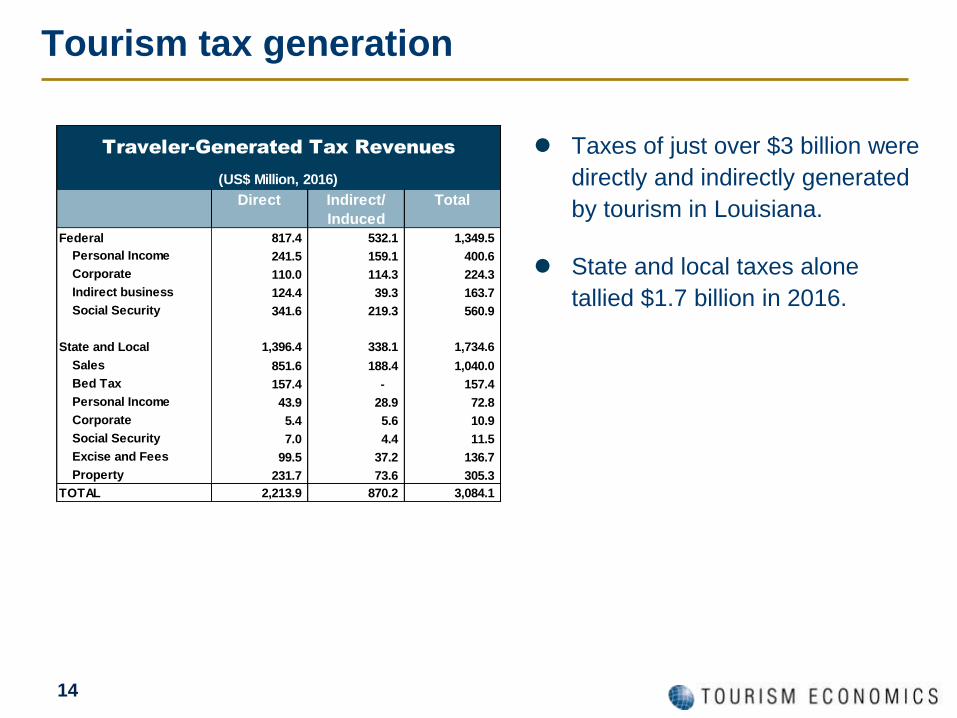
Traveler-Generated Tax Revenues Taxes of just over $3 billion were
directly and indirectly generated
by tourism in Louisiana.
State and local taxes alone
tallied $1.7 billion in 2016.
15
Tourism tax generation
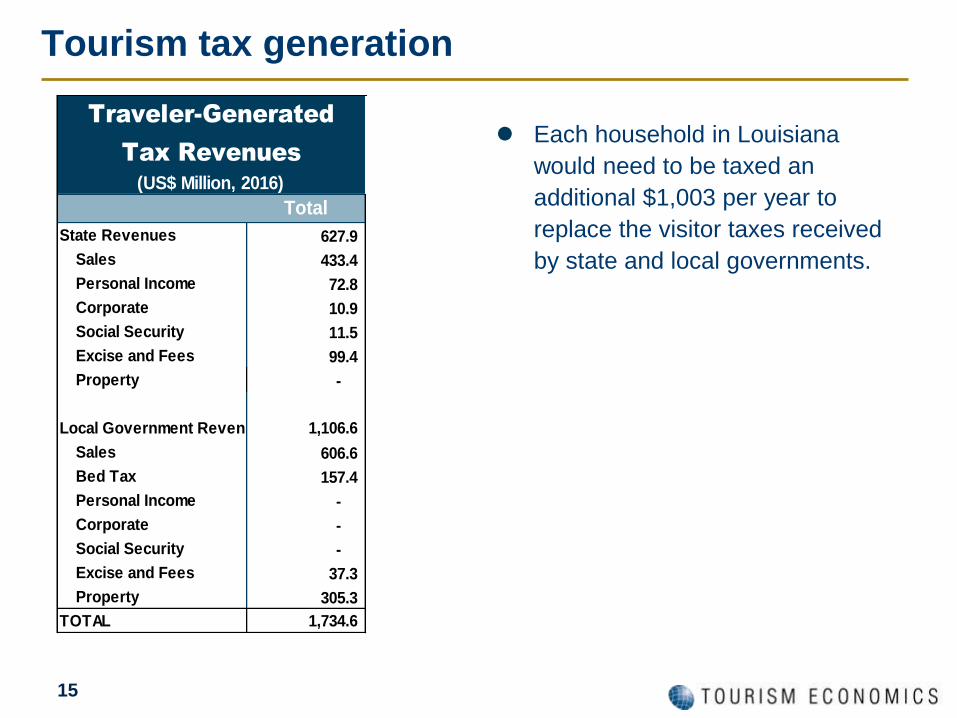
Each household in Louisiana
would need to be taxed an
additional $1,003 per year to
replace the visitor taxes received
by state and local governments.
Total
State Revenues 627.9
Sales 433.4
Personal Income 72.8
Corporate 10.9
Social Security 11.5
Excise and Fees 99.4
Property -
Local Government Revenues 1,106.6
Sales 606.6
Bed Tax 157.4
Personal Income -
Corporate -
Social Security -
Excise and Fees 37.3
Property 305.3
TOTAL 1,734.6
Traveler-Generated
Tax Revenues
(US$ Million, 2016)
16
Visitor spending has increased an average of 4.6% each year since
2011, supported by continued growth in visits from both domestic
tourists and visitors from abroad.
Increases in visitor spending were broadly felt across the major
tourism sectors, with lodging and food & beverage experiencing the
largest boost.
The tourism economy supported over 185,000 jobs, and state and
local tax revenues from visitor activity registered just over $1.7
billion.
2016 Wrap-up
Tourism in Context
18
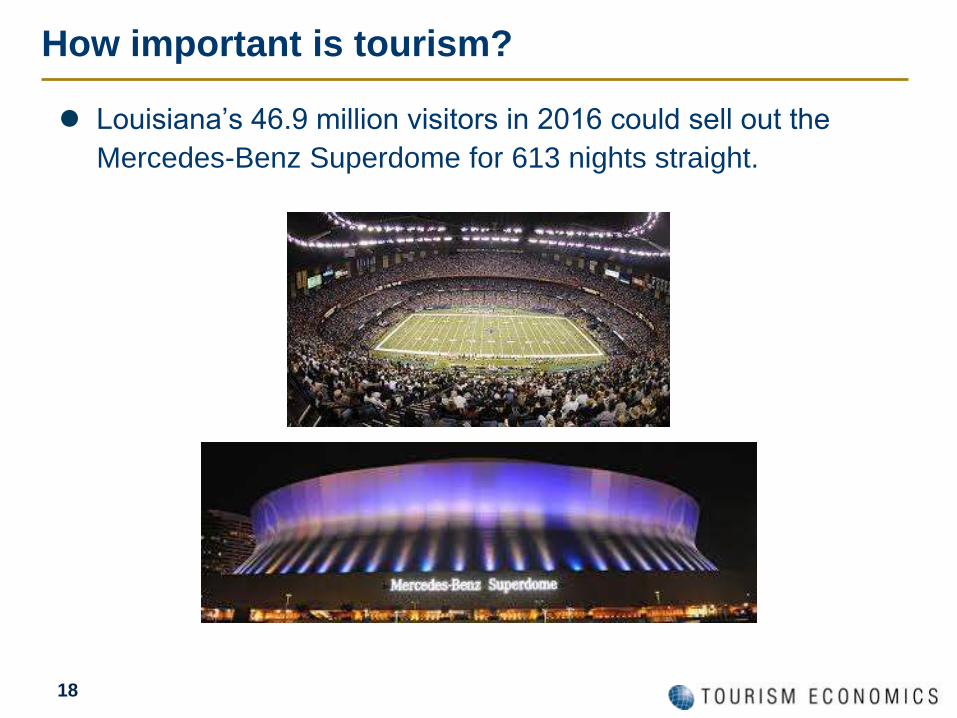
Louisiana’s 46.9 million visitors in 2016 could sell out the
Mercedes-Benz Superdome for 613 nights straight.
How important is tourism?
19
The 132,545 direct tourism jobs would be enough jobs for every
person at a sold out LSU Tigers game and every student at LSU.
Total tourism supported employment is almost nine times larger
than the enrollment of Louisiana State University.
How important is tourism?
20
The $1.7 billion in state and local revenues from visitor
activity represents a ‘savings’ of $1,003 per household in
Louisiana – or enough money to purchase 1,406 beignets
at Café du Monde.
How important is tourism?

Methodology and
Background
22
• Estimates of visitor volume and expenditures in Louisiana were based on several sources
including:
• Volume and spending estimates for both domestic and international visitors,
produced by D.K. Shifflet and Associates, a national consumer research firm.
• Smith Travel Research (STR) data on hotel room demand, supply, revenues, average
prices, and occupancy rates.
• U.S. Census data on sales and employees by industry.
• An IMPLAN input-output model was constructed for Louisiana. The model traces the flow
of visitor-related expenditures through the local economy and their effects on employment,
wages, and taxes. IMPLAN also quantifies the indirect (supplier) and induced (income)
impacts of tourism. Tourism Economics then cross-checked these findings with
employment and wage data for each sector to ensure the findings are within reasonable
ranges.
• The source of the employment and wage data is the Regional Economic Information
System (REIS), Bureau of Economic Analysis, U.S. Department of Commerce. This is
more comprehensive than Bureau of Labor Statistics (ES202/QCEW) data. The main
definitional difference is that sole-proprietors, which do not require unemployment
insurance, are not counted in the ES202 data.
Methods and data sources
23
By monitoring tourism’s economic impact, policy makers
can make informed decisions regarding the funding and
prioritization of tourism development.
It can also carefully monitor its successes and future
needs.
In order to do this, tourism must be measured in the
same categories as other economic sectors – i.e. tax
generation, employment, wages, and gross domestic
product.
Why quantify the tourism economy?
24
Why is this a challenge?
Most economic sectors such as financial services,
insurance, or construction are easily defined within a
region by economic data and statistics.
Tourism is not so easily measured because it is not a
single industry. It is a demand-side activity which affects
multiple sectors to various degrees.
Tourism spans nearly a dozen sectors including lodging,
recreation, retail, real estate, air passenger transport, food
& beverage, car rental, taxi services, travel agents,
museums, and theme parks.
25
Quantifying the travel and tourism economy
Most economic sectors such as financial services,
insurance, or construction are easily defined within a
country’s national accounts statistics.
Travel is not so easily measured because it is not a single
industry. It is a demand-side activity which affects multiple
sectors to various degrees.
Travel spans nearly a dozen sectors including lodging,
retail, real estate, air passenger transport, food &
beverage, car rental, taxi services, travel agents, and
recreation (including museums, theme parks, sports
events and others).
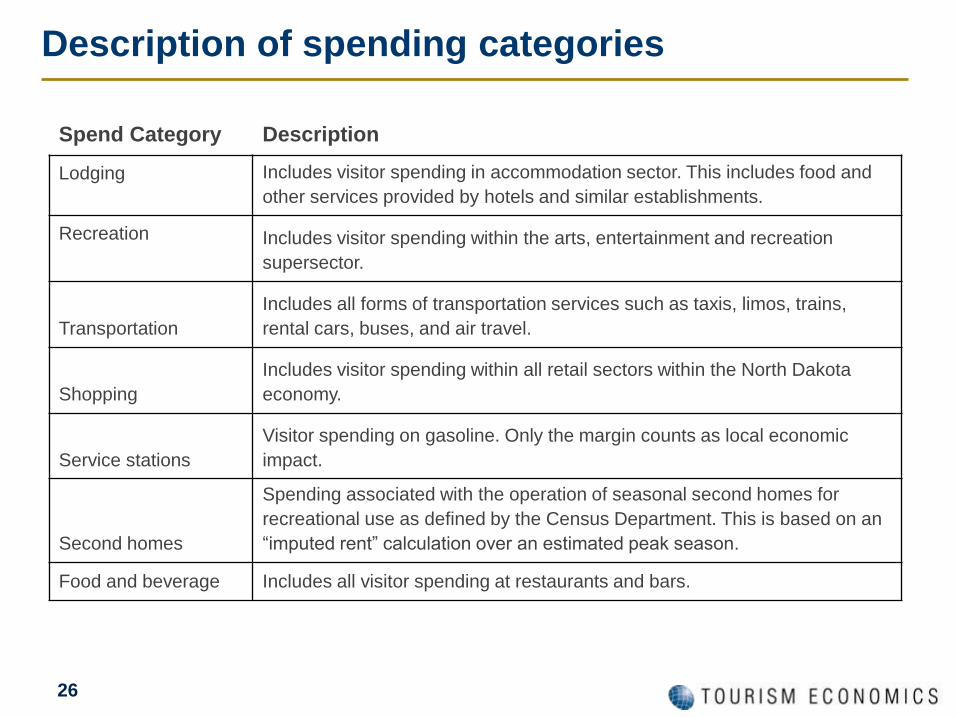
26
Description of spending categories
Spend Category Description
Lodging Includes visitor spending in accommodation sector. This includes food and
other services provided by hotels and similar establishments.
Recreation Includes visitor spending within the arts, entertainment and recreation
supersector.
Transportation
Includes all forms of transportation services such as taxis, limos, trains,
rental cars, buses, and air travel.
Shopping
Includes visitor spending within all retail sectors within the North Dakota
economy.
Service stations
Visitor spending on gasoline. Only the margin counts as local economic
impact.
Second homes
Spending associated with the operation of seasonal second homes for
recreational use as defined by the Census Department. This is based on an
“imputed rent” calculation over an estimated peak season.
Food and beverage Includes all visitor spending at restaurants and bars.
27
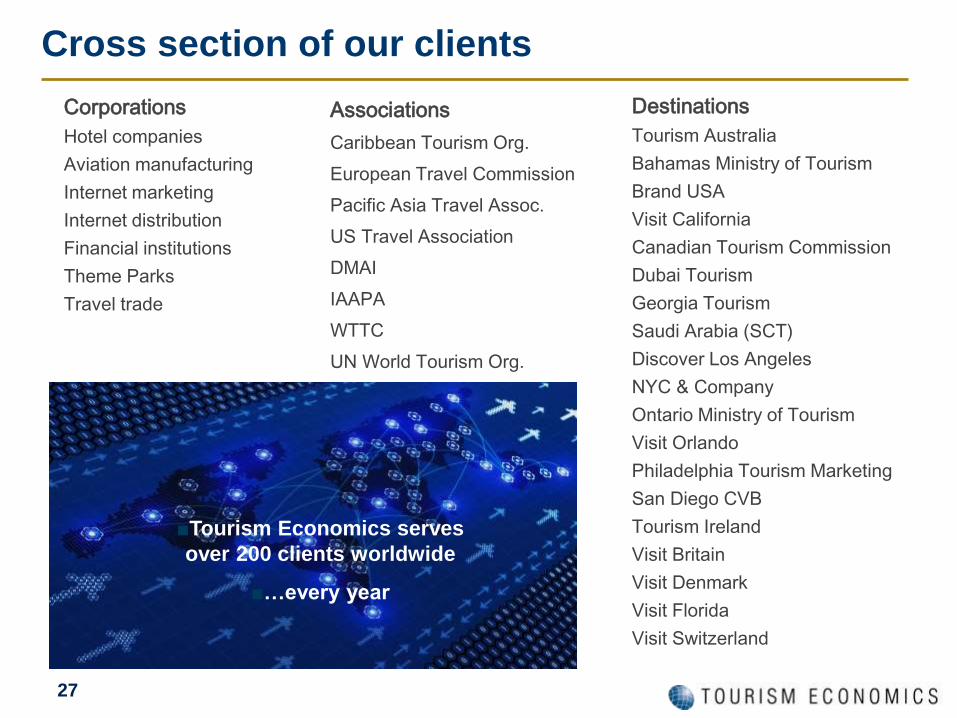
Cross section of our clients
Corporations
Hotel companies
Aviation manufacturing
Internet marketing
Internet distribution
Financial institutions
Theme Parks
Travel trade
Destinations
Tourism Australia
Bahamas Ministry of Tourism
Brand USA
Visit California
Canadian Tourism Commission
Dubai Tourism
Georgia Tourism
Saudi Arabia (SCT)
Discover Los Angeles
NYC & Company
Ontario Ministry of Tourism
Visit Orlando
Philadelphia Tourism Marketing
San Diego CVB
Tourism Ireland
Visit Britain
Visit Denmark
Visit Florida
Visit Switzerland
Associations
Caribbean Tourism Org.
European Travel Commission
Pacific Asia Travel Assoc.
US Travel Association
DMAI
IAAPA
WTTC
UN World Tourism Org.
■Tourism Economics serves
over 200 clients worldwide
■…every year
28
About Tourism Economics
Tourism Economics, headquartered in Philadelphia, is an Oxford Economics
company dedicated to providing high value, robust, and relevant analyses of the
tourism sector that reflects the dynamics of local and global economies. By
combining quantitative methods with industry knowledge, Tourism Economics
designs custom market strategies, project feasibility analysis, tourism forecasting
models, tourism policy analysis, and economic impact studies.
Our staff have worked with over 200 destinations to quantify the economic value
of tourism, forecast demand, guide strategy, or evaluate tourism policies.
Oxford Economics is one of the world’s leading providers of economic analysis,
forecasts and consulting advice. Founded in 1981 as a joint venture with Oxford
University’s business college, Oxford Economics is founded on a reputation for
high quality, quantitative analysis and evidence-based advice. For this, it draws
on its own staff of 80 highly-experienced professional economists; a dedicated
data analysis team; global modeling tools; close links with Oxford University, and
a range of partner institutions in Europe, the US and in the United Nations
Project Link.
For more information: [email protected].
29
For more information:
Adam Sacks, President
Christopher Pike, Director