Embed Size (px)
Citation preview

LOUISIANA DEPARTMENT OF ECONOMIC DEVELOPMENT - ENTERPRISE ZONE PROGRAM
PERFORMANCE AUDIT ISSUED APRIL 25, 2012
LOUISIANA LEGISLATIVE AUDITOR 1600 NORTH THIRD STREET
POST OFFICE BOX 94397 BATON ROUGE, LOUISIANA 70804-9397
LEGISLATIVE AUDITOR DARYL G. PURPERA, CPA, CFE
FIRST ASSISTANT LEGISLATIVE AUDITOR AND STATE AUDIT SERVICES
PAUL E. PENDAS, CPA
DIRECTOR OF PERFORMANCE AUDIT SERVICES NICOLE B. EDMONSON, CIA, CGAP, MPA
FOR QUESTIONS RELATED TO THIS PERFORMANCE AUDIT, CONTACT NICOLE EDMONSON, DIRECTOR OF PERFORMANCE AUDIT SERVICES,
AT 225-339-3800. Under the provisions of state law, this report is a public document. A copy of this report has been submitted to the Governor, to the Attorney General, and to other public officials as required by state law. A copy of this report has been made available for public inspection at the Baton Rouge office of the Louisiana Legislative Auditor. This document is produced by the Louisiana Legislative Auditor, State of Louisiana, Post Office Box 94397, Baton Rouge, Louisiana 70804-9397 in accordance with Louisiana Revised Statute 24:513. Five copies of this public document were produced at an approximate cost of $23.90. This material was produced in accordance with the standards for state agencies established pursuant to R.S. 43:31. This report is available on the Legislative Auditor’s Web site at www.lla.la.gov. When contacting the office, you may refer to Agency ID No. 9726 or Report ID No. 40100034 for additional information. In compliance with the Americans With Disabilities Act, if you need special assistance relative to this document, or any documents of the Legislative Auditor, please contact Kerry Fitzgerald, Chief Administrative Officer, at 225-339-3800.

LOUISIANA LEGISLATIVE AUDITOR
DARYL G. PURPERA, CPA, CFE
1600 NORTH THIRD STREET • POST OFFICE BOX 94397 • BATON ROUGE, LOUISIANA 70804-9397
WWW.LLA.LA.GOV • PHONE: 225-339-3800 • FAX: 225-339-3870
April 25, 2012 The Honorable John A. Alario, President of the Senate The Honorable Charles E. “Chuck” Kleckley, Speaker of the House of Representatives Dear Senator Alario and Representative Kleckley:
This report provides the results of our performance audit on the Enterprise Zone program administered by the Louisiana Department of Economic Development (LED).
The report contains our findings, conclusions, and matters for legislative consideration. Appendix A contains LED management’s response to this report. I hope this report will benefit you in your legislative decision-making process.
We would like to express our appreciation to the management and staff of the LED for their assistance during this audit.
Sincerely, Daryl G. Purpera, CPA, CFE Legislative Auditor
DGP/dl LEDEZP 2012


Louisiana Legislative Auditor Daryl G. Purpera, CPA, CFE Louisiana Department of Economic Development, Enterprise Zone Program April 2012 Audit Control # 40100034
1
Executive Summary
This report provides the results of our performance audit on the Louisiana Department of Economic Development’s (LED) Enterprise Zone (EZ) program. When the EZ program was created in 1981, it was designed to stimulate growth in enterprise zones1 by providing tax incentives to businesses that locate to and operate in these areas. Act 977 of the 1999 Regular Legislative Session eliminated the requirement that businesses must locate to or operate in an enterprise zone to qualify for EZ program incentives, but did not change the purpose of the law. Therefore, the program’s current design and operation is not consistent with its statutory purpose.
We conducted this audit to determine whether the EZ program is meeting its statutory purpose of stimulating business and industrial growth in enterprise zones, as defined by an increase in capital investment and jobs. Appendix B details our scope and methodology. The audit objectives and results of our work are as follows: Objective 1: Did the EZ program meet its statutory purpose of stimulating business and industrial growth in enterprise zones during calendar years 2008 through 2010?
Results: While the EZ program stimulated some growth in enterprise zones during calendar years 2008 through 2010, the program provided a majority of its incentives to businesses and industries located outside of a designated enterprise zone. Similarly, the majority of capital investment and new jobs associated with these incentives were also located outside of an enterprise zone. As stated previously, while providing incentives outside of designated enterprise zones is allowed by law, it does not meet the statutory purpose of the program, which is to stimulate business and industrial growth in enterprise zones. Specifically, we found:
Approximately 632 (68%) of the 930 businesses that received EZ program incentives during calendar years 2008 through 2010 were located outside of a designated enterprise zone. These businesses received approximately $123.9 million (61%) of the $203.1 million in total EZ program incentives granted during this time period.
1 According to LED officials, 40% of Louisiana’s census track block groups were designated enterprise zones using the weighted average of the block group’s ranks on unemployment, per capita income, and number of residents receiving public assistance.
Louisiana Department of Economic Development Enterprise Zone Program
2
Approximately $3.9 billion (60%) of the $6.5 billion in capital investment by businesses that were granted EZ program incentives during calendar years 2008 through 2010 was located outside of a designated enterprise zone.
Approximately 12,570 (75%) of the 16,760 new jobs created by businesses granted EZ program incentives during calendar years 2008 through 2010 were located outside of an enterprise zone.
Objective 2: How does Louisiana’s EZ program differ from those in other states?
Results: We identified the following ways in which Louisiana’s EZ program differs significantly from those in competing, neighboring states (Alabama, Arkansas, Mississippi, and Texas):
R.S. 51:1781 et seq. allows businesses located outside an enterprise zone to participate in the EZ program and receive EZ program incentives. Two out of four competing states (Alabama and Mississippi) require businesses to be located in an enterprise zone in order to receive EZ program incentives while the two other states (Arkansas and Texas) do not have this requirement. Texas, however, sets stricter eligibility requirements for businesses located outside an enterprise zone.
R.S. 51:1781 et seq. allows all industries to receive EZ program incentives whereas all four competing, neighboring states exclude retail industries. According to LED officials, these states exclude retail industries as retail jobs are easily transferrable from one business to another business. As a result, there may be no actual net increase in jobs despite a new retail business locating to an area.
R.S. 51:1787 allows businesses to count part-time employees to qualify for EZ program incentives. None of the four competing, neighboring states allows businesses to include part-time employees when qualifying for EZ program incentives. Allowing businesses to include part-time employees lowers the eligibility requirements for the program. This results in more businesses being eligible for the program, which potentially increases program costs. In addition, part-time jobs provide a smaller economic impact to the state than full-time jobs because they pay less and typically do not come with benefits. As a result, the state earns a lower return on its investment for EZ job tax credits because it gives the same tax credit amount for part-time jobs as it does for full-time jobs.
R.S. 51:1781 et seq. allows businesses to receive EZ program incentives before proving new job creation. Three out of the four competing, neighboring states (Alabama, Arkansas, and Texas) require companies to prove the creation of new jobs before the business can receive any EZ incentives. In Louisiana, businesses can claim investment tax credits or sales and use rebates upon completing a project completion report and

Louisiana Department of Economic Development Enterprise Zone Program
3
have up to two years to create the required minimum new jobs. If the business does not create the minimum number of new jobs, LED informs the Louisiana Department of Revenue (LDR), who must recoup the investment tax credits or sales and use rebates.
While LED provides the public with the names and types of businesses that participate in the EZ program, R.S. 47:1508 prohibits disclosure of the amount of incentives received by each business. This limits transparency on how state tax dollars are being spent on this program. In contrast, Texas shares with the public both the names of businesses that participate in the program and the amounts of incentives each individual business receives.

Louisiana Department of Economic Development Enterprise Zone Program
4
Overview of the EZ Program Purpose. According to R.S. 51:1782, the purpose of the EZ program is to stimulate business and industrial growth in certain depressed areas of Louisiana (i.e., enterprise zones) by providing assistance in the form of tax incentives to businesses and industries that locate to and operate in these areas. When the EZ program was created in 1981, it was designed to provide tax incentives only to businesses that locate to and operate in enterprise zones. Act 977 of the 1999 Regular Legislative Session eliminated the requirement that businesses must locate to or operate in an enterprise zone to qualify for the EZ program. However, Act 977 did not change the purpose of the law. Therefore, the program’s current design and operation is not consistent with its statutory purpose. Eligibility Requirements. Any business is eligible to receive EZ program incentives as long as it creates a minimum number of net new jobs at the business site and 35% of these jobs meet at least one of the following four employee hiring requirements:
1. The employee must live in or near an enterprise zone.
2. The employee receives some form of public assistance.
3. The employee lacks basic skills (e.g., below the 9th grade proficiency in reading, writing, or math).
4. The employee is unemployable by traditional standards (e.g., has no prior work history or job training, has a criminal record, is physically challenged, etc.).
Incentive Types. R.S. 51:1787 states that businesses can receive the following benefits when they participate in the EZ program:
A one-time $2,500 credit per each new job (certain industries receive a greater credit), hereafter referred to as “job tax credit”;
A sales and use tax rebate2 on materials, machinery, furniture or equipment; or
Earn a 1.5% refundable investment tax credit.
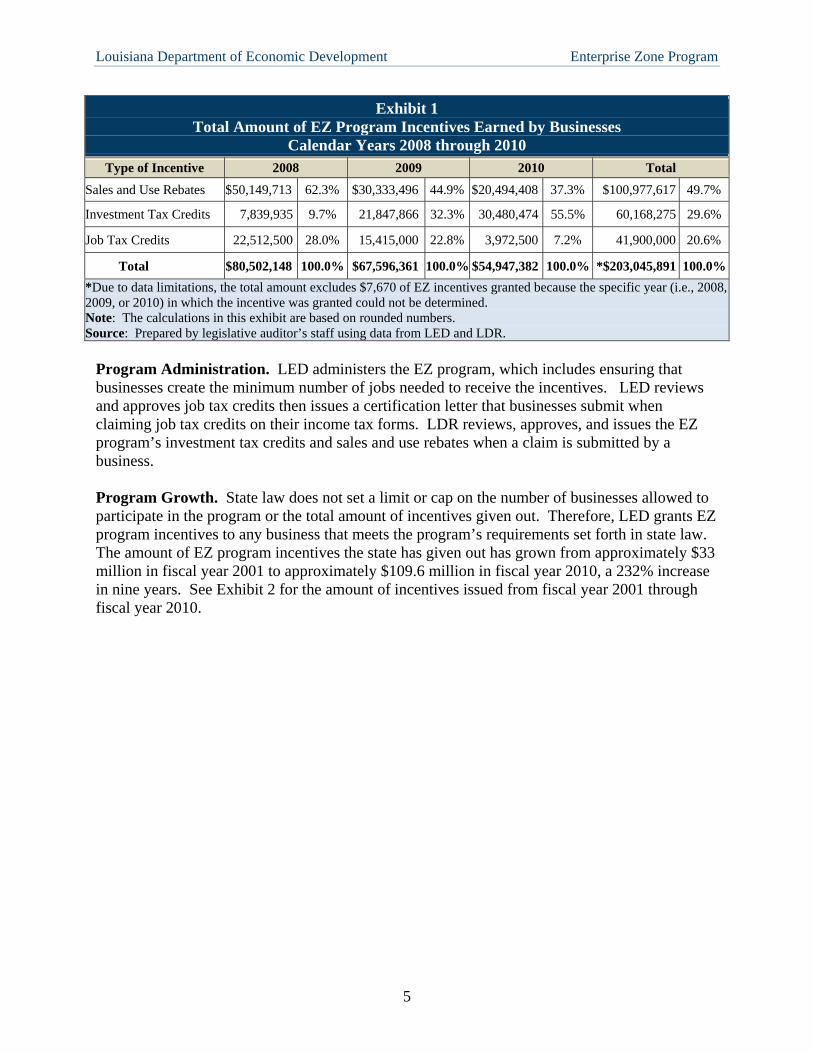
Sales and use rebates accounted for approximately $100.9 (49.7%) of the $203.1 million in total EZ tax incentives granted to businesses during calendar years 2008 through 2010, followed by approximately $60.2 million (29.6%) in investment tax credits and $41.9 million (20.6%) in job tax credits. Exhibit 1 shows the total amount of EZ program incentives, by type, that businesses received in calendar years 2008 through 2010.
2 According to LED and LDR officials, the sales and use tax rebate is 4% at the state level.
Louisiana Department of Economic Development Enterprise Zone Program
5
Exhibit 1 Total Amount of EZ Program Incentives Earned by Businesses
Calendar Years 2008 through 2010
Type of Incentive 2008 2009 2010 Total
Sales and Use Rebates $50,149,713 62.3% $30,333,496 44.9% $20,494,408 37.3% $100,977,617 49.7%
Investment Tax Credits 7,839,935 9.7% 21,847,866 32.3% 30,480,474 55.5% 60,168,275 29.6%
Job Tax Credits 22,512,500 28.0% 15,415,000 22.8% 3,972,500 7.2% 41,900,000 20.6%
Total $80,502,148 100.0% $67,596,361 100.0% $54,947,382 100.0% *$203,045,891 100.0%
*Due to data limitations, the total amount excludes $7,670 of EZ incentives granted because the specific year (i.e., 2008, 2009, or 2010) in which the incentive was granted could not be determined. Note: The calculations in this exhibit are based on rounded numbers. Source: Prepared by legislative auditor’s staff using data from LED and LDR.
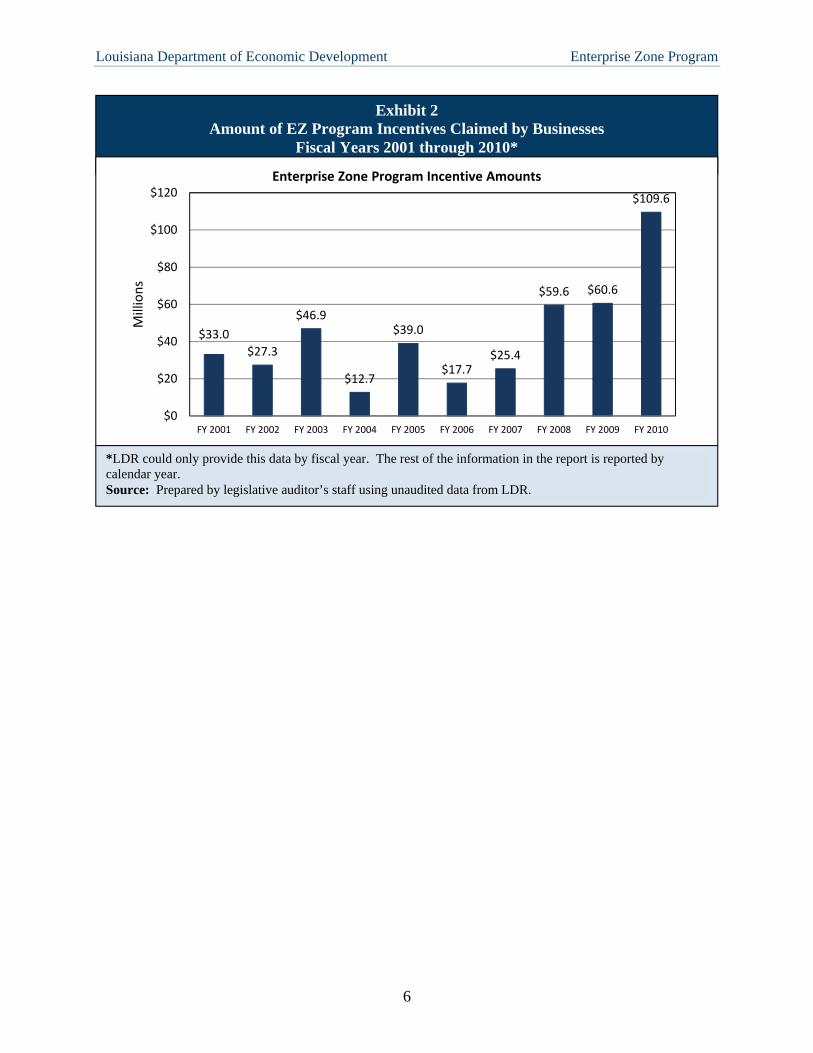
Program Administration. LED administers the EZ program, which includes ensuring that businesses create the minimum number of jobs needed to receive the incentives. LED reviews and approves job tax credits then issues a certification letter that businesses submit when claiming job tax credits on their income tax forms. LDR reviews, approves, and issues the EZ program’s investment tax credits and sales and use rebates when a claim is submitted by a business. Program Growth. State law does not set a limit or cap on the number of businesses allowed to participate in the program or the total amount of incentives given out. Therefore, LED grants EZ program incentives to any business that meets the program’s requirements set forth in state law. The amount of EZ program incentives the state has given out has grown from approximately $33 million in fiscal year 2001 to approximately $109.6 million in fiscal year 2010, a 232% increase in nine years. See Exhibit 2 for the amount of incentives issued from fiscal year 2001 through fiscal year 2010.
Louisiana Department of Economic Development Enterprise Zone Program
6
Exhibit 2 Amount of EZ Program Incentives Claimed by Businesses
Fiscal Years 2001 through 2010*
*LDR could only provide this data by fiscal year. The rest of the information in the report is reported by calendar year. Source: Prepared by legislative auditor’s staff using unaudited data from LDR.
$33.0
$27.3
$46.9
$12.7
$39.0
$17.7$25.4
$59.6 $60.6
$109.6
$0
$20
$40
$60
$80
$100
$120
FY 2001 FY 2002 FY 2003 FY 2004 FY 2005 FY 2006 FY 2007 FY 2008 FY 2009 FY 2010
Mill
ion
s
Enterprise Zone Program Incentive Amounts
Louisiana Department of Economic Development Enterprise Zone Program
7
Objective 1: Did the EZ program meet its statutory purpose of stimulating business and industrial growth in enterprise zones
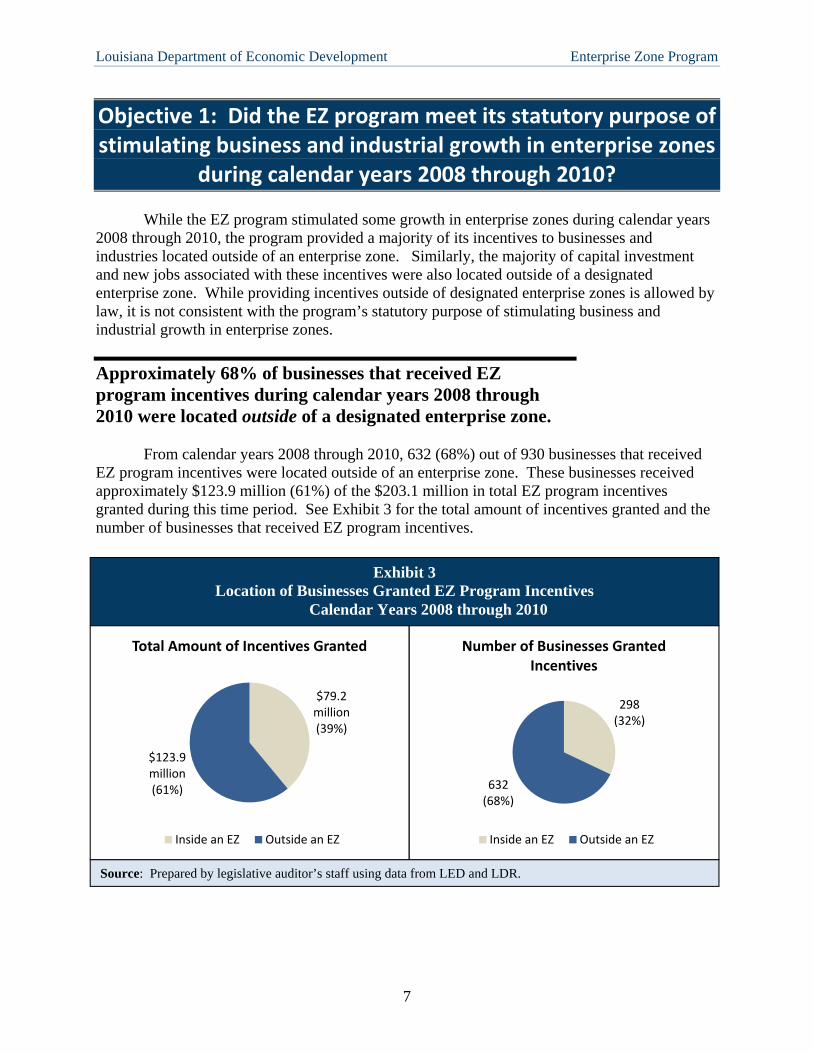
during calendar years 2008 through 2010? While the EZ program stimulated some growth in enterprise zones during calendar years 2008 through 2010, the program provided a majority of its incentives to businesses and industries located outside of an enterprise zone. Similarly, the majority of capital investment and new jobs associated with these incentives were also located outside of a designated enterprise zone. While providing incentives outside of designated enterprise zones is allowed by law, it is not consistent with the program’s statutory purpose of stimulating business and industrial growth in enterprise zones.
Approximately 68% of businesses that received EZ program incentives during calendar years 2008 through 2010 were located outside of a designated enterprise zone.
From calendar years 2008 through 2010, 632 (68%) out of 930 businesses that received EZ program incentives were located outside of an enterprise zone. These businesses received approximately $123.9 million (61%) of the $203.1 million in total EZ program incentives granted during this time period. See Exhibit 3 for the total amount of incentives granted and the number of businesses that received EZ program incentives.
Exhibit 3 Location of Businesses Granted EZ Program Incentives
Calendar Years 2008 through 2010
298 (32%)
632 (68%)
Number of Businesses Granted Incentives
Inside an EZ Outside an EZ
$79.2 million (39%)
$123.9 million (61%)
Total Amount of Incentives Granted
Inside an EZ Outside an EZ
Source: Prepared by legislative auditor’s staff using data from LED and LDR.

Louisiana Department of Economic Development Enterprise Zone Program
8
Approximately 60% of capital investment by businesses that were granted EZ program incentives during calendar years 2008 through 2010 was located outside of a designated enterprise zone.
In total, businesses that received EZ program incentives during calendar years 2008 through 2010 created approximately $6.5 billion in capital investment. Of this amount, approximately $3.9 billion (60%) was located outside of an enterprise zone. See Appendix B for the methodology on how capital investment was determined. See Exhibit 4 for a breakdown, by location, of the capital investment by businesses that received EZ program incentives during calendar years 2008 through 2010.
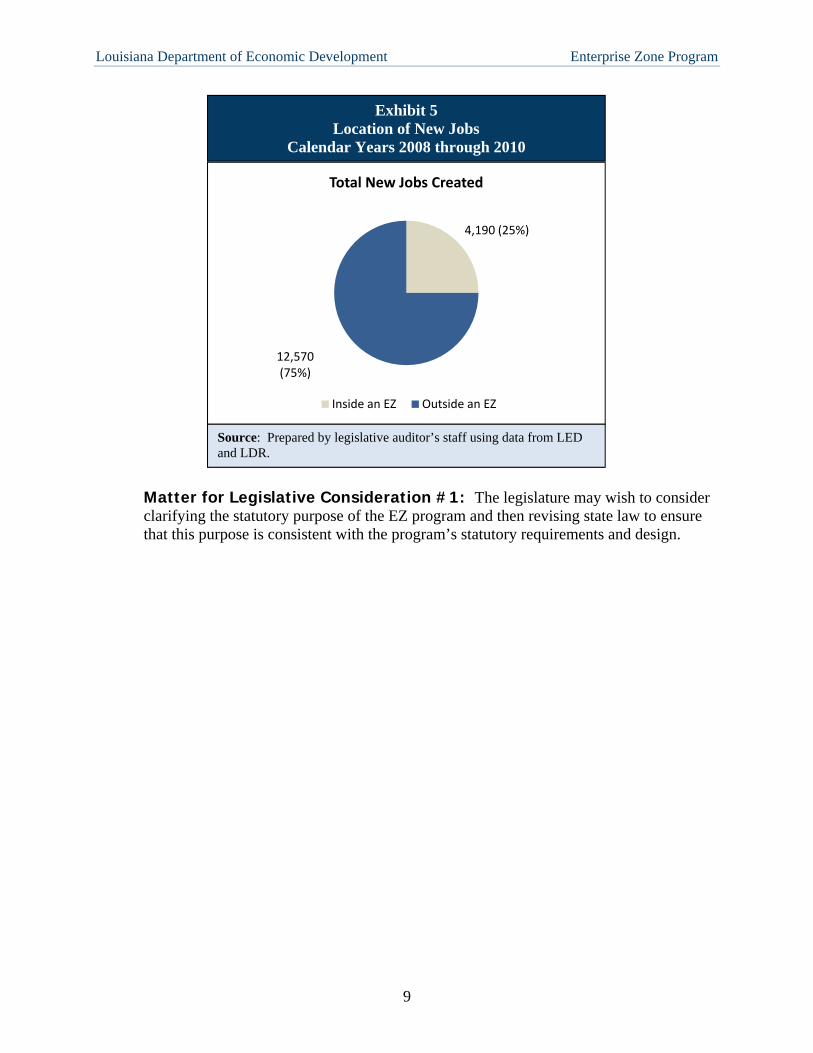
Approximately 75% of new jobs created by businesses granted EZ program incentives during calendar years 2008 through 2010 were located outside of an enterprise zone.
In total, 16,760 new jobs were created by businesses that were granted EZ program incentives during calendar years 2008 through 2010. Of these jobs, 12,570 (75%) were located outside of an enterprise zone. See Exhibit 5 for a breakdown, by location, of the new jobs created by businesses granted EZ program incentives in calendar years 2008 through 2010.
Source: Prepared by legislative auditor’s staff using data from LED and LDR.
$2.6 billion (40%)
$3.9 billion (60%)
Total Capital Investment
Inside an EZ Outside an EZ
Exhibit 4 Location of Capital Investment by Businesses Granted EZ
Program Incentives Calendar Years 2008 through 2010
Louisiana Department of Economic Development Enterprise Zone Program
9
Matter for Legislative Consideration #1: The legislature may wish to consider clarifying the statutory purpose of the EZ program and then revising state law to ensure that this purpose is consistent with the program’s statutory requirements and design.
Exhibit 5 Location of New Jobs
Calendar Years 2008 through 2010
4,190 (25%)
12,570 (75%)
Total New Jobs Created
Inside an EZ Outside an EZ
Source: Prepared by legislative auditor’s staff using data from LED and LDR.
Louisiana Department of Economic Development Enterprise Zone Program
10
Objective 2: How does Louisiana’s EZ program differ from those in other states?
We identified the following ways in which Louisiana’s EZ program differs significantly
from those in competing, neighboring states (Alabama, Arkansas, Mississippi, and Texas).3 First, state law allows businesses located outside an enterprise zone to participate in the EZ program and receive EZ program incentives. In addition, state law does not exclude retail industries from receiving EZ program incentives, allows businesses to count part-time employees to qualify for them, and allows businesses to receive EZ program incentives before proving new job creation. Finally, state law prohibits the disclosure of the amount of EZ program incentives received by individual businesses.
State law allows businesses located and operating outside of an enterprise zone to receive EZ program incentives.
EZ program eligibility requirements set forth in R.S. 51:1781 et seq. do not require businesses to locate to or operate in an enterprise zone. Two out of four competing states (Alabama and Mississippi) require businesses to be located in an enterprise zone in order to receive EZ program incentives while the two other states (Arkansas and Texas) do not have this requirement. Texas, however, sets stricter eligibility requirements for businesses located outside of an enterprise zone.
As stated in the background section of the report, the eligibility requirements for Louisiana are that a business creates a minimum number of net new jobs and that 35% of these jobs meet at least one of four employee hiring requirements. Of the four hiring requirements, only one pertains to the enterprise zone and it only requires employees to live in or near an enterprise zone. The requirement that businesses locate to and operate in an enterprise zone was eliminated from state law in 1999. Due to this change in law, the program’s eligibility requirements have little to do with stimulating growth in enterprise zones. As discussed in Objective 1 of this report, the EZ program provided a majority of its incentives to businesses and industries located outside of an enterprise zone during calendar years 2008 through 2010. Therefore, the majority of new jobs and capital investment associated with EZ program incentives were also located outside of a designated enterprise zone.
Matter for Legislative Consideration #2: The legislature may wish to consider amending R.S. 51:1781 et seq. to require businesses to locate to or operate in an enterprise zone to be eligible for EZ program incentives
3 We chose these states because, according to LED officials, they are the state’s regional competitors in attracting businesses for new locations and expansion efforts.

Louisiana Department of Economic Development Enterprise Zone Program
11
State law does not exclude retail industries from receiving EZ program incentives.
Whereas R.S. 51:1781 et seq. allows all industries to receive EZ program incentives, none of the four competing, neighboring states to Louisiana allow retail industries to receive EZ program incentives. As shown in Exhibit 7 on page 13, retail businesses in Louisiana received approximately $25.8 (12.7%) million in EZ program incentives during calendar years 2008 through 2010. According to LED officials, other states exclude retail industries as retail jobs easily transfer or shift from one business to another. As a result, there may be no actual net increase in retail jobs despite a new retail business locating to an area. This is because as one business opens, others close or downsize and decrease their number of workers. According to LED officials, other industry sectors such as health care, real estate, construction, and food services have similar substitution effects.
Matter for Legislative Consideration #3: The legislature may wish to consider amending R.S. 51:178 et seq. to exclude retail businesses and other industries that experience similar substitution effects from receiving EZ program incentives as jobs created in these industries are easily transferable from one business to another and may not create an increase in net new jobs.
State law allows businesses to count part-time employees to qualify for EZ program incentives.
R.S. 51:1787 allows businesses to count both full-time employees and part-time employees that meet certain requirements to qualify for EZ program incentives. Program rules require full-time employees to work a minimum of 35 hours per week and receive benefits. Program rules only require part-time employees to work a minimum of 20 hours per week for 6 consecutive months with no benefit requirements. None of the four competing, neighboring states to Louisiana allow businesses to include part-time employees when qualifying for EZ program incentives.
Allowing businesses to include part-time employees lowers the eligibility requirements for the program which increases program costs. In addition, part-time jobs provide a smaller economic impact to the state than full-time jobs because they pay less and usually do not come with benefits. As a result, the state earns a lower return on its investment for EZ job tax credits because it gives the same tax credit amount for part-time jobs as it does for full-time jobs. Exhibit 6 illustrates this difference in the state’s return on investment for part-time versus full-time jobs.

Louisiana Department of Economic Development Enterprise Zone Program
12
Exhibit 6 Difference in Economic Impact for
Part-Time and Full-Time Jobs
Hourly Wage Minimum Hours
per Week Economic Impact* Job Tax Credit
(State Revenue Loss)
$7.25 20 (part-time) $7,540 $2,500
$7.25 35 (full-time) $13,195 + Benefits $2,500
*Calculation shows minimum annual income before taxes based on an employee being a part-time employee for the entire year. If the employee meets only the minimum six months to qualify, then that employee’s income would only be $3,770 for the year. Source: Prepared by legislative auditor’s staff.
Matter for Legislative Consideration #4: The legislature may wish to consider amending R.S. 51:1787 to prohibit businesses from claiming part-time employees when applying for the EZ program because they increase program costs but provide a smaller economic impact to the state.
State law allows businesses to receive EZ program incentives before proving new job creation.
R.S. 51:1781 et seq. allows businesses to receive EZ program incentives before proving new job creation. Businesses can claim investment tax credits or sales and use rebates upon completing a project completion report. State law stipulates that businesses have up to two years to create the required minimum new jobs. If the business does not create the minimum number of new jobs, LED informs LDR, who must recoup the investment tax credits or sales and use rebates. Three out of the four competing, neighboring states to Louisiana (Alabama, Arkansas, and Texas) require companies to prove the creation of new jobs before the business can receive any EZ program incentives.
Matter for Legislative Consideration #5: The legislature may wish to consider amending R.S. 51:1781 et seq. to require companies to prove new job creation before receiving any EZ program incentives.
State law prohibits disclosure of the amount of EZ program incentives received by individual businesses.
While LED provides the public with information such as the names and types of businesses that participate in the EZ program, R.S. 47:1508 prohibits the disclosure of the amount of incentives received4 by each business. As a result, we can only provide summary statistics by industry sector. This limits transparency on how state tax dollars are being spent on this program. In contrast, Texas shares with the public both the names of businesses that participate in the program and the amounts of incentives each individual business receives.
4 R.S. 47:1508 prohibits all entities, including the Legislative Auditor, from divulging or disclosing any information obtained from tax records except for “the publication of statistics so classified as to prevent the identification of any return or report and the items thereof.”
Louisiana Department of Economic Development Enterprise Zone Program
13
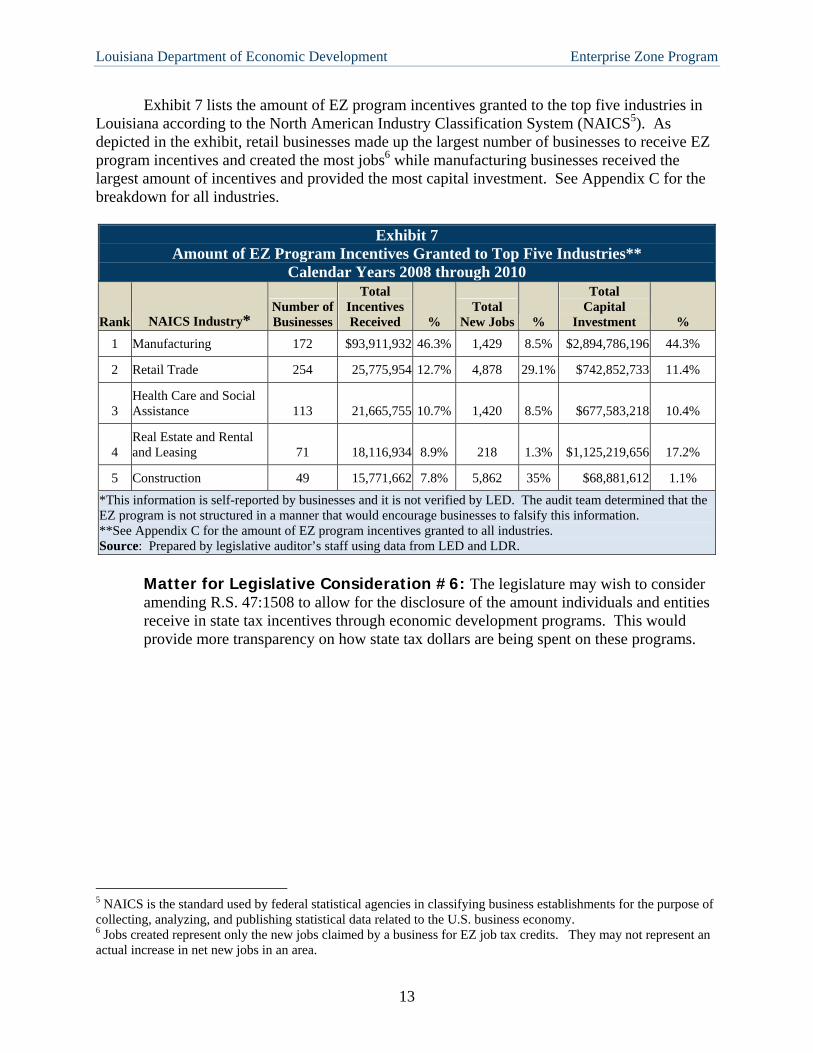
Exhibit 7 lists the amount of EZ program incentives granted to the top five industries in Louisiana according to the North American Industry Classification System (NAICS5). As depicted in the exhibit, retail businesses made up the largest number of businesses to receive EZ program incentives and created the most jobs6 while manufacturing businesses received the largest amount of incentives and provided the most capital investment. See Appendix C for the breakdown for all industries.
Exhibit 7 Amount of EZ Program Incentives Granted to Top Five Industries**
Calendar Years 2008 through 2010
Rank NAICS Industry* Number ofBusinesses
Total Incentives Received %
Total New Jobs %
Total Capital
Investment %
1 Manufacturing 172 $93,911,932 46.3% 1,429 8.5% $2,894,786,196 44.3%
2 Retail Trade 254 25,775,954 12.7% 4,878 29.1% $742,852,733 11.4%
3 Health Care and Social Assistance 113 21,665,755 10.7% 1,420 8.5% $677,583,218 10.4%
4 Real Estate and Rental and Leasing 71 18,116,934 8.9% 218 1.3% $1,125,219,656 17.2%
5 Construction 49 15,771,662 7.8% 5,862 35% $68,881,612 1.1%
*This information is self-reported by businesses and it is not verified by LED. The audit team determined that the EZ program is not structured in a manner that would encourage businesses to falsify this information. **See Appendix C for the amount of EZ program incentives granted to all industries. Source: Prepared by legislative auditor’s staff using data from LED and LDR.
Matter for Legislative Consideration #6: The legislature may wish to consider amending R.S. 47:1508 to allow for the disclosure of the amount individuals and entities receive in state tax incentives through economic development programs. This would provide more transparency on how state tax dollars are being spent on these programs.
5 NAICS is the standard used by federal statistical agencies in classifying business establishments for the purpose of collecting, analyzing, and publishing statistical data related to the U.S. business economy. 6 Jobs created represent only the new jobs claimed by a business for EZ job tax credits. They may not represent an actual increase in net new jobs in an area.


A.1
APPENDIX A: MANAGEMENT’S RESPONSE

IJED I LOUISIANA ECONOMIC DEVELOPMENT
March 12, 2012
Mr. Daryl G. Purpera, CPA Legislative Auditor Louisiana Legislative Auditor 1600 North Third Street Post Office Box 94397 Baton Rouge, Louisiana 70804-9397
Dear Mr. Purpera:
Bobby Jindal Governor
Stephen Moret Secretary
We agree with the general findings and results presented in the performance audit of Louisiana's Enterprise Zone (EZ) program. In fact, the La. Department of Economic Development (LED) identified a number of similar findings in its 2009 report covering the Enterprise Zone (EZ) program. The LED report was distributed to the Louisiana Legislature in March 2010 and was included on LED's website at: www.louisianaeconomicdevelopment.com/downloads/2009 Annual Report Enterprise Zone.pdf.
Similar to the findings included in your performance audit of the EZ program, LED identified in its 2009 report that:
• 29 percent of all EZ projects were located in actual enterprise zones with 71 percent located outside of actual enterprise zones, over a four-year period (page 11 of LED's EZ report) .
• Lou isiana's EZ program was (and is) significantly less focused on generating net new permanent jobs in the state as compared to programs in neighboring states. This is because Louisiana's EZ program does not exclude certain industries that typically follow local demand and/or suffer from substitution effects (e.g. , retail , restaurants and other sectors serving primarily local demand). These industries are excluded by several neighboring states (page 9 of LED's EZ report) .
As noted in the audit, LED does make available to the public detailed information on companies approved for the EZ program and other LED-administered incentive programs. Detailed EZ program incentive approvals can be found in the Board of Commerce & Industry Incentive Approvals report (included in the Performance Reporting section of LED's website at www.louisianaeconomicdevelopment.com) and at Fastlane, LED's online, real-time, searchable database for tax incentive data (fastlane.lou isianaeconomicdevelopment. com).
For each EZ project approval , information available online includes items such as: • Company name • Contact information for the applicant • Project description • Project location • Estimated number of new jobs and total jobs • Estimated amount of new payroll and total payroll • Estimated amount of company investment • Estimated amount of incentives associated with the project
1051 North Third Street • Baton Rouge, LA 70802 • 225.342.3000 • LouisianaEconomicDevelopment.com
An Equal Opportunity Employer
A.2
We have very much enjoyed working with the Legislative Auditor team on the performance audit of Louisiana's EZ program. We thank you and your team for your professionalism in working with our department.
Sincerely,
Stephen Moret Secretary
A.3

B.1
APPENDIX B: Audit Initiation, Scope, and Methodology
R.S. 24:522 directs the legislative auditor to establish a schedule of performance audits to
ensure that at least one performance audit is completed and published for each executive department agency within a seven-year period, beginning with the 1998 fiscal year. In addition, R.S. 51:935.1 directs the legislative auditor to conduct a performance audit on at least three economic development programs per year. In accordance with these legislative mandates, we scheduled a performance audit of the Department of Economic Development (LED). We focused the audit on whether the Enterprise Zone (EZ) program met its statutory purpose of stimulating business and industrial growth in enterprise zones during calendar years 2008 through 2010. We also looked at how Louisiana’s EZ program differs from those in other states.
We conducted this performance audit in accordance with generally accepted government auditing standards issued by the Comptroller General of the United States. Those standards require that we plan and perform the audit to obtain sufficient, appropriate evidence to provide reasonable basis for our findings and conclusions based on our audit objectives. We determined that the evidence obtained provides a reasonable basis for our findings and conclusions based on our audit objectives. To answer our objective, we reviewed internal controls relevant to the audit objective and performed the following audit steps:
Researched relevant state laws, rules, and regulations related to the EZ program.
Obtained EZ program data from both LED and LDR.
Identified the lack of a statutory definition of “business and industrial growth.” Based on discussions with LED staff and LED’s 2009 Annual Report for the program, growth is defined as an increase in capital investment and new jobs.
Analyzed the data using both ACL and Excel to determine the number of businesses receiving incentives, the cost of those incentives, et cetera.
Interviewed both LED and LDR staff to ensure analysis was performed correctly and to resolve any issues discovered during analysis.
Interviewed both LED and LDR staff to determine how they monitor and verify the total number of net new jobs and capital invested by businesses receiving EZ program incentives.
Interviewed officials from other states to determine how their EZ programs differ from Louisiana’s in key areas identified during the audit.
Performed internet research on and conducted phone interviews with officials from neighboring state’s EZ programs (Alabama, Arkansas, Mississippi, and

Louisiana Department of Economic Development Enterprise Zone Program
B.2
Texas). We chose these states because, according to LED officials, they are the state’s regional competitors in attracting businesses for new locations and expansion efforts.
Calculated job tax credits by multiplying $2,500 times the net new jobs created by businesses. LDR was unable to provide the specific job tax credit amounts issues in calendar years 2008 through 2010.
Calculated the amount of capital investment associated with the incentives issued by LDR. For investment tax credits, the amount of capital investment used to claim the incentive amount issued by LDR equals the incentive amount divided by 1.5%. For sales and use rebates, the amount of capital investment used to claim the incentives equals the incentive amount issued by LDR divided by 4%.
Conducted a sample file review to ensure the reliability of data fields and that LED and LDR’s monitoring process is sufficient to generate reliable net new jobs and incentive numbers
To determine the location of a business and whether it is located inside or outside of an enterprise zone, the team used LED’s GIS software and staff to map the businesses’ addresses. The audit team was able to map approximately 86% of the addresses. For the remaining 14%, the audit team calculated the jobs, capital investment, and incentive amounts using the breakdown based on the 86%.
C.1
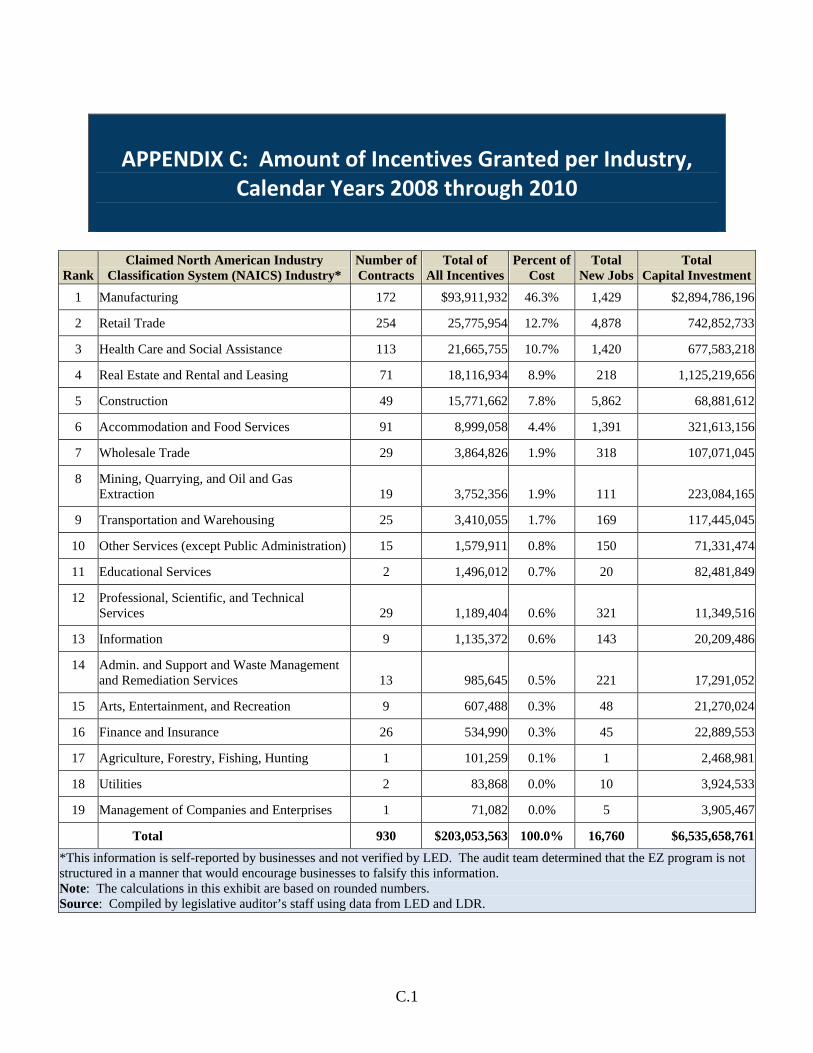
APPENDIX C: Amount of Incentives Granted per Industry, Calendar Years 2008 through 2010
Rank Claimed North American Industry
Classification System (NAICS) Industry* Number ofContracts
Total of All Incentives
Percent of Cost
Total New Jobs
Total Capital Investment
1 Manufacturing 172 $93,911,932 46.3% 1,429 $2,894,786,196
2 Retail Trade 254 25,775,954 12.7% 4,878 742,852,733
3 Health Care and Social Assistance 113 21,665,755 10.7% 1,420 677,583,218
4 Real Estate and Rental and Leasing 71 18,116,934 8.9% 218 1,125,219,656
5 Construction 49 15,771,662 7.8% 5,862 68,881,612
6 Accommodation and Food Services 91 8,999,058 4.4% 1,391 321,613,156
7 Wholesale Trade 29 3,864,826 1.9% 318 107,071,045
8 Mining, Quarrying, and Oil and Gas Extraction 19 3,752,356 1.9% 111 223,084,165
9 Transportation and Warehousing 25 3,410,055 1.7% 169 117,445,045
10 Other Services (except Public Administration) 15 1,579,911 0.8% 150 71,331,474
11 Educational Services 2 1,496,012 0.7% 20 82,481,849
12 Professional, Scientific, and Technical Services 29 1,189,404 0.6% 321 11,349,516
13 Information 9 1,135,372 0.6% 143 20,209,486
14 Admin. and Support and Waste Management and Remediation Services 13 985,645 0.5% 221 17,291,052
15 Arts, Entertainment, and Recreation 9 607,488 0.3% 48 21,270,024
16 Finance and Insurance 26 534,990 0.3% 45 22,889,553
17 Agriculture, Forestry, Fishing, Hunting 1 101,259 0.1% 1 2,468,981
18 Utilities 2 83,868 0.0% 10 3,924,533
19 Management of Companies and Enterprises 1 71,082 0.0% 5 3,905,467
Total 930 $203,053,563 100.0% 16,760 $6,535,658,761
*This information is self-reported by businesses and not verified by LED. The audit team determined that the EZ program is not structured in a manner that would encourage businesses to falsify this information. Note: The calculations in this exhibit are based on rounded numbers. Source: Compiled by legislative auditor’s staff using data from LED and LDR.