Embed Size (px)
Citation preview

The Economic Impact of the University of South Carolina

January 2021
Developed by:Division of Research
Moore School of Business

Greetings,
I’m pleased to share with you a recent study which found that the University of South Carolina contributes approximately $6.2 billion annually to the state’s economy, securing it as a major contributor to South Carolina’s growing job market and its future economic prosperity.
The findings in this report are from a recent study conducted by researchers at UofSC’s Darla Moore School of Business, which is an update of a 2017 report that found the university’s annual statewide economic impact was $5.5 billion – representing a $700 million growth in annual impact in South Carolina over four years. This marked increase in the university’s economic impact on the state is made even more profound by the fact that UofSC has weathered the effects of the COVID-19 pandemic over the past year.
This study examines the current economic impact of UofSC in both the Midlands region and across South Carolina. The total annual economic impact of UofSC on the Columbia metropolitan region is approximately $3.7 billion, and the university supports approximately 1 in every 9 jobs in Columbia. Statewide, the UofSC system supports a total of 63,689 jobs, representing $2.6 billion in personal income. In fact, the wage premium for the average college graduate in SC is approximately $20,000 higher than high school graduates. This study also concludes that the UofSC system is responsible for returning more than $202 million in annual tax revenue to state coffers. A future Moore School study will further examine the impact of the individual system institutions on various regions of the state, including Aiken, Beaufort, Upstate and the four regional Palmetto College institutions.
In the coming decade, the University of South Carolina Columbia campus will play a central role in boosting future economic growth in the Midlands region. UofSC offers Columbia a major competitive asset that has the potential to significantly boost growth throughout the 2020s – namely, the presence of a high-skilled workforce. Through its Office of Innovation, Partnerships, and Economic Engagement, the university has also worked to create research partnerships with corporate leaders in advanced manufacturing, artificial intelligence, pharmaceuticals and more.
Growth in existing industry and new business would help keep skilled graduates in the Midlands. That’s critical, as the study concludes, because even small increases in the retention of college graduates can have a significant regional economic impact—an estimated $14 million annually for every one percent increase in graduate retention. To the extent that local economic development efforts generate more high-skilled employment opportunities, local graduate retention rates would likely rise from UofSC’s Columbia campus, thus increasing Columbia’s long-run rate of economic growth.
As you will see in the enclosed study, it’s clear that the University of South Carolina is delivering on its mission as the flagship university to transform the lives of the people of South Carolina through empowering education, innovative research, creative engagement, impactful economic development and selfless service. Thank you for your continued partnership as we seek to serve the people and the state of South Carolina.
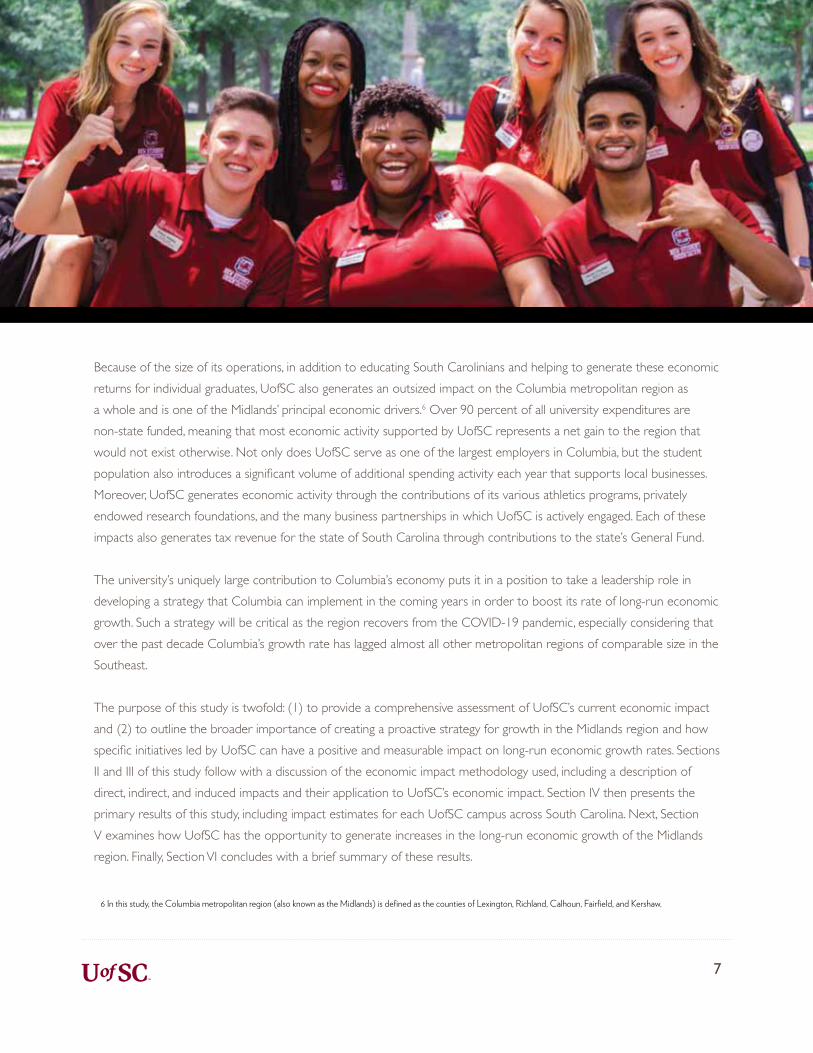
Executive SummaryThe University of South Carolina (UofSC) is a major economic driver for the Palmetto State. As an educational institution, UofSC enrollment across all campuses currently exceeds 50,000 graduate and undergraduate students with more than 200,000 alumni currently residing in South Carolina. UofSC also confers over 30 percent of all bachelor’s and graduate degrees awarded at public institutions in South Carolina. The economic footprint of UofSC is most strongly concentrated within the Midlands region at its flagship campus, where the majority of students attend and where approximately 85 percent of university faculty, infrastructure, and daily activities are located. This generates a sizable economic impact for Columbia that results from the ongoing expenditures associated with UofSC operations, construction activity, athletics, as well as the local spending generated by faculty, staff, and students who live and work in the metro area.
In addition, UofSC offers Columbia a major competitive asset that has the potential to significantly boost growth throughout the 2020s – namely, the presence of a high-skilled workforce. This implies that UofSC’s total economic impact in the Midlands has the potential to increase substantially in the coming decade. To the extent that local economic development efforts generate more high-skilled employment opportunities, local graduate retention rates would likely rise from UofSC’s Columbia campus, thus increasing Columbia’s long-run rate of economic growth.
This study documents the current economic impact of UofSC in both the Midlands region and across South Carolina and also highlights the extent to which increases in the graduate retention rate could improve the long-run rate of economic growth in the Columbia area.
The key findings are as follows:
• The total annual economic impact of UofSC on the Columbia metropolitan region is approximately $3.7 billion. This figure reflects the dollar volume of all economic activity that can be attributed to – directly or indirectly – the University of South Carolina. This includes increases in alumni wages that are earned and spent in the local community, ongoing busines activities resulting from non-state funded expenditures, and all activities associated with UofSC athletics.
• UofSC contributes $1.7 billion towards personal income and supports approximately 43,876 jobs in the Midlands community, 13,705 of which represent employees working directly at UofSC. These estimates imply that UofSC supports approximately 1 in every 9 jobs in the Columbia metropolitan region.

• In addition to its sizable impact on the Columbia metropolitan region, UofSC has an even larger statewide presence due to its seven system universities throughout the state as well as all UofSC alumni who live and work in-state but outside of Columbia. The total economic impact of UofSC on South Carolina as a whole is estimated to be approximately $6.2 billion annually. This volume of economic activity is associated with 63,689 jobs and $2.6 billion in labor income.
• Approximately 61.8 percent of all in-state UofSC alumni currently live and work outside of the Midlands region. The economic impact generated by this widespread distribution of graduates highlights not only the significant statewide economic footprint of UofSC but also highlights the ongoing contribution that UofSC makes towards maintaining and improving educational attainment throughout South Carolina.
• Successfully increasing the retention rate of UofSC’s Columbia campus has the potential to sizably increase Columbia’s long-run rate of economic growth. Specifically, for every one percentage point increase in the overall graduate retention rate of the UofSC Columbia campus, this study estimates that approximately $14.1 million in new annual economic activity for the Midlands region would be generated.


Section I
Introduction

IntroductionFrom its founding in 1801, the University of South Carolina (UofSC) has maintained as its primary
mission “…the education of the state’s citizens through teaching, research, creative activity,
and community engagement” along with a “…responsibility to state and society to promote the
dissemination of knowledge, cultural enrichment, and an enhanced quality of life.” 1 UofSC enrollment across all campuses currently exceeds 50,000 graduate and undergraduate students with more than 200,000 alumni residing in the state. In addition, UofSC confers over 30 percent of all bachelor’s and graduate degrees awarded at public institutions in South Carolina. UofSC educates students who become leaders in South Carolina and contribute to its social, economic, and political goals through their work and leadership in business, government, and the local community.
The economic returns to higher education are widely cited and well known in the economics literature. For example, the average U.S. lifetime earnings premium of a bachelor’s degree over that of a high school diploma has been estimated to be as high as 74 percent.2 In South Carolina, the average annual difference between a college educated worker’s wages and a high school graduate worker’s wages is over $20,000.3 Higher education also helps to reduce poverty, which in turn lowers state and local government costs. In 2019 approximately 13.8 percent of South Carolina’s population with only a high school diploma lived in poverty, compared to just 3.9 percent of those with a bachelor’s degree or higher.4 And during the pandemic-induced recession of 2020, the employment levels of college graduates were much more resilient compared to high school graduates. Between February 2020 and April 2020, the U.S. unemployment rate for high school graduates spiked by 13.7 percentage points; by contrast, U.S. unemployment for college graduates only increased by 6.5 percentage points over the same time period.5
UofSC enrollment across all campuses currently exceeds 50,000 graduate and undergraduate students with more than 200,000 alumni residing in the state. In addition, UofSC confers over 30 percent of all bachelor’s and graduate degrees awarded at public institutions in South Carolina.
6
1 https://sc.edu/about/south_carolina_at_a_glance/our_mission.php2 Carnevale, et al. (2013)3 American Community Survey (ACS) 2019 5-Year Estimates: High School Graduate vs. Bachelor’s Degree holder4 American Community Survey (ACS) 2019 5-Year Estimates: Poverty Status in the Past 12 Months5 U.S. Bureau of Labor Statistics, Current Population Survey
Because of the size of its operations, in addition to educating South Carolinians and helping to generate these economic returns for individual graduates, UofSC also generates an outsized impact on the Columbia metropolitan region as a whole and is one of the Midlands’ principal economic drivers.6 Over 90 percent of all university expenditures are non-state funded, meaning that most economic activity supported by UofSC represents a net gain to the region that would not exist otherwise. Not only does UofSC serve as one of the largest employers in Columbia, but the student population also introduces a significant volume of additional spending activity each year that supports local businesses. Moreover, UofSC generates economic activity through the contributions of its various athletics programs, privately endowed research foundations, and the many business partnerships in which UofSC is actively engaged. Each of these impacts also generates tax revenue for the state of South Carolina through contributions to the state’s General Fund.
The university’s uniquely large contribution to Columbia’s economy puts it in a position to take a leadership role in developing a strategy that Columbia can implement in the coming years in order to boost its rate of long-run economic growth. Such a strategy will be critical as the region recovers from the COVID-19 pandemic, especially considering that over the past decade Columbia’s growth rate has lagged almost all other metropolitan regions of comparable size in the Southeast.
The purpose of this study is twofold: (1) to provide a comprehensive assessment of UofSC’s current economic impact and (2) to outline the broader importance of creating a proactive strategy for growth in the Midlands region and how specific initiatives led by UofSC can have a positive and measurable impact on long-run economic growth rates. Sections II and III of this study follow with a discussion of the economic impact methodology used, including a description of direct, indirect, and induced impacts and their application to UofSC’s economic impact. Section IV then presents the primary results of this study, including impact estimates for each UofSC campus across South Carolina. Next, Section V examines how UofSC has the opportunity to generate increases in the long-run economic growth of the Midlands region. Finally, Section VI concludes with a brief summary of these results.
7
6 In this study, the Columbia metropolitan region (also known as the Midlands) is defined as the counties of Lexington, Richland, Calhoun, Fairfield, and Kershaw.


Section II
Assessing the Economic Impact of UofSC

The indirect effect reflects all of the additional
economic impacts resulting from inter-industry linkages
between local firms in South Carolina. For example, if
the university spends funding on the remodeling of a
classroom building, the remodeling vendor must then
purchase additional inputs from its suppliers – such as
additional staff and equipment. Suppliers of staff and
equipment must then purchase additional supplies as
well. These indirect effects ripple through the economy
and affect many sectors of South Carolina.
Assessing the Economic Impact of UofSCThe economic impact of any organization is measured by how expenditures of that organization increase the demand for various goods and services in the local region over what it would have been otherwise. A university has the additional impact of providing its local region with a more highly educated workforce that results in increased wages for graduates and increased wages for the entire local workforce through educational spillover effects.
In a standard economic impact analysis, there are three types of economic impacts that can be identified: direct, indirect, and induced effects. The direct effect represents the initial change in economic activity. The direct effect of the University of South Carolina reflects non-state funded expenditures made directly by the university within the state of South Carolina. This includes, for example, new construction and remodeling, lab equipment, athletic vendors, and other overhead and administrative costs. This spending increases demand and leads to the creation of new jobs and more income for employees and suppliers of the university. Sources for non-state funds can include tuition, federal grants, and private donations, among others.
10

11
The induced effect reflects all of the additional economic impacts resulting from increases in the spending of household income. For example, when part of the university’s budget is spent on remodeling a building and the demand for these remodeling services rise, some of the remodeling staff will see a rise in their income levels. Part of this income will then be spent locally on, for example, food, clothing, housing, or entertainment. These industries will then also see an increase in demand for their goods and services, which will lead to higher income levels of some of their employees, part of which will also be spent locally. The induced effect is also where the economic impact of increased wages from a more highly educated workforce is measured. Increased wages lead to increases in household expenditures, which again will primarily be spent locally and increase the demand for goods and services in many local industries.
The successive rounds of indirect and induced spending do not go on forever, which is why a specific value can be calculated for each of them. In each round, money is “leaked out” of the local area for a variety of reasons. For example, employees will save some of their additional income and part of the money they do spend will go to businesses located outside of South Carolina. In order to determine the total economic impact, economic multipliers are used.
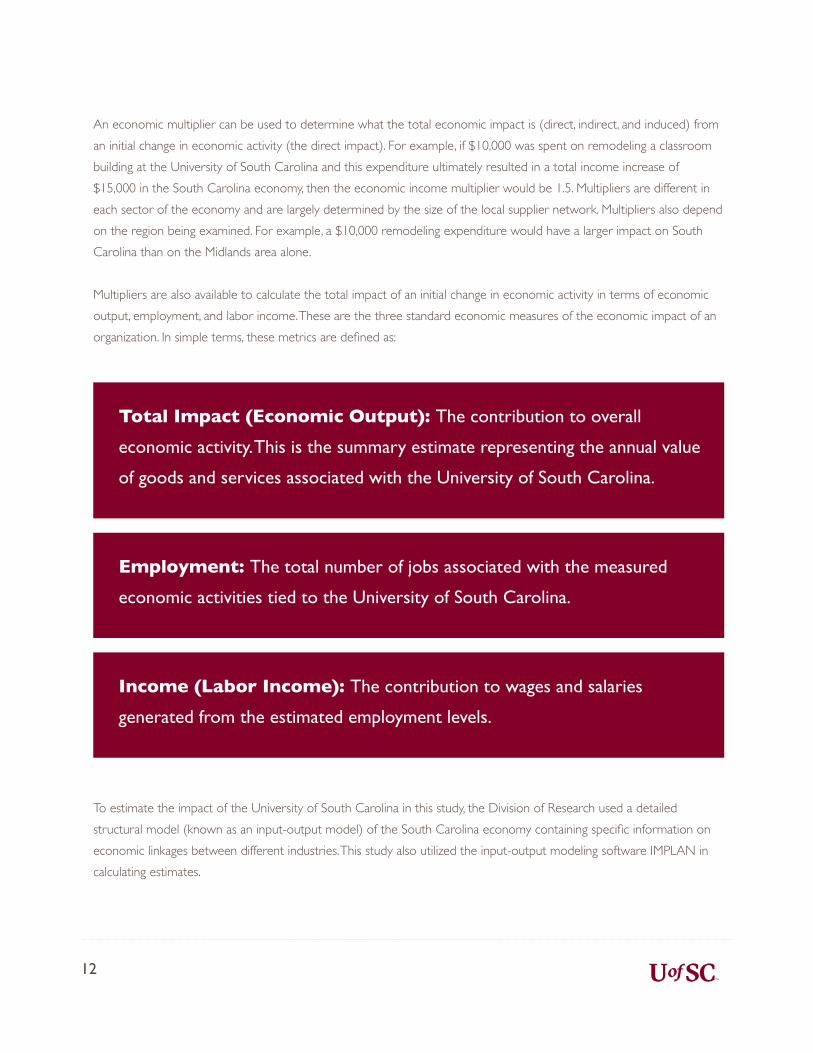
An economic multiplier can be used to determine what the total economic impact is (direct, indirect, and induced) from an initial change in economic activity (the direct impact). For example, if $10,000 was spent on remodeling a classroom building at the University of South Carolina and this expenditure ultimately resulted in a total income increase of $15,000 in the South Carolina economy, then the economic income multiplier would be 1.5. Multipliers are different in each sector of the economy and are largely determined by the size of the local supplier network. Multipliers also depend on the region being examined. For example, a $10,000 remodeling expenditure would have a larger impact on South Carolina than on the Midlands area alone.
Multipliers are also available to calculate the total impact of an initial change in economic activity in terms of economic output, employment, and labor income. These are the three standard economic measures of the economic impact of an organization. In simple terms, these metrics are defined as:
To estimate the impact of the University of South Carolina in this study, the Division of Research used a detailed structural model (known as an input-output model) of the South Carolina economy containing specific information on economic linkages between different industries. This study also utilized the input-output modeling software IMPLAN in calculating estimates.
Total Impact (Economic Output): The contribution to overall
economic activity. This is the summary estimate representing the annual value
of goods and services associated with the University of South Carolina.
Employment: The total number of jobs associated with the measured
economic activities tied to the University of South Carolina.
Income (Labor Income): The contribution to wages and salaries
generated from the estimated employment levels.
12

Section III
Methodology
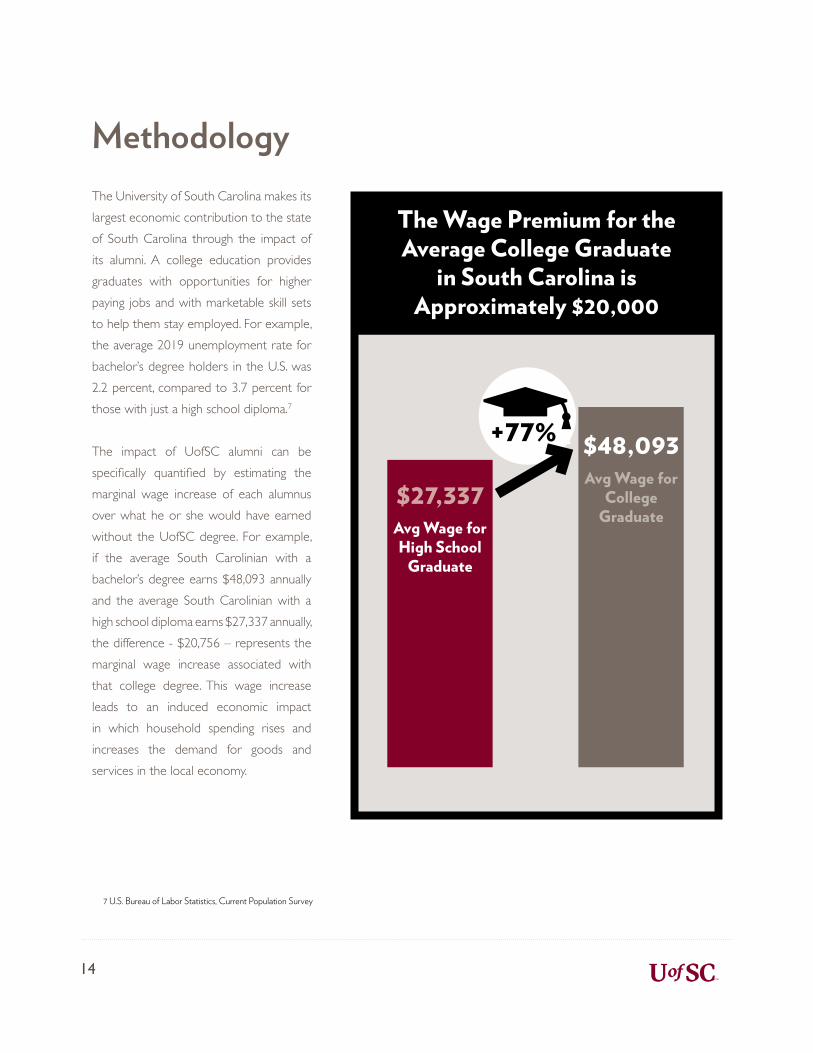
MethodologyThe University of South Carolina makes its largest economic contribution to the state of South Carolina through the impact of its alumni. A college education provides graduates with opportunities for higher paying jobs and with marketable skill sets to help them stay employed. For example, the average 2019 unemployment rate for bachelor’s degree holders in the U.S. was 2.2 percent, compared to 3.7 percent for those with just a high school diploma.7
The impact of UofSC alumni can be specifically quantified by estimating the marginal wage increase of each alumnus over what he or she would have earned without the UofSC degree. For example, if the average South Carolinian with a bachelor’s degree earns $48,093 annually and the average South Carolinian with a high school diploma earns $27,337 annually, the difference - $20,756 – represents the marginal wage increase associated with that college degree. This wage increase leads to an induced economic impact in which household spending rises and increases the demand for goods and services in the local economy.
7 U.S. Bureau of Labor Statistics, Current Population Survey
$27,337Avg Wage for High School
Graduate
$48,093Avg Wage for
College Graduate
The Wage Premium for the Average College Graduate
in South Carolina is Approximately $20,000
+77%
14

15
A second impact of UofSC alumni comes about through economic spillover effects. There is an extensive body of research documenting social returns to higher education. For example, the median incomes of all workers in a region (both college and non-college educated) tend to rise as the percentage of college educated workers rise in that region.8 The most common explanation for such a phenomenon is the sharing of knowledge and skills in both formal and informal settings across workers.9 In addition, a more highly educated population is associated with non-financial benefits, such as increased voting and volunteering, better health, and improved child educational attainment.10 This study estimates the social returns of UofSC alumni by assuming that for each percentage point increase in the supply of college graduates in South Carolina, the wages of high school dropouts rise by 1.9 percent, the wages of high school graduates rise by 1.6 percent, and the wages of college graduates rise by 0.4 percent. This assumption is based off of empirical results from economist Enrico Moretti of UCLA, a leading expert in the estimation of the social returns of higher education.11
Table 1 – Social Returns to Higher Education
8 Moretti (2004)9 Lucas (1988); Acemoglu (1998)10 Oreopoulous and Salvanes (2009); Grossman (2006); Cutler and Lleras-Muney (2006); Angrist and Lavy (1996) 11 See Moretti (2004) for the derivation of these estimates.
13
A second impact of UofSC alumni comes about through economic spillover effects. There is an extensive body of research documenting social returns to higher education. For example, the median incomes of all workers in a region (both college and non-college educated) tend to rise as the percentage of college educated workers rise in that region.8 The most common explanation for such a phenomenon is the sharing of knowledge and skills in both formal and informal settings across workers.9 In addition, a more highly educated population is associated with non-financial benefits, such as increased voting and volunteering, better health, and improved child educational attainment.10 This study estimates the social returns of UofSC alumni by assuming that for each percentage point increase in the supply of college graduates in South Carolina, the wages of high school dropouts rise by 1.9 percent, the wages of high school graduates rise by 1.6 percent, and the wages of college graduates rise by 0.4 percent. This assumption is based off of empirical results from economist Enrico Moretti of UCLA, a leading expert in the estimation of the social returns of higher education.11
Table 1 – Social Returns to Higher Education
Impact of a 1% increase in the supply of college graduates
Education Level Wage IncreaseHigh School
Dropout +1.9%
High School Graduate +1.6%
College Graduate +0.4%
8 Moretti (2004)9 Lucas (1988); Acemoglu (1998)10 Oreopoulous and Salvanes (2009); Grossman (2006); Cutler and Lleras-Muney (2006); Angrist and Lavy (1996) 11 See Moretti (2004) for the derivation of these estimates.
12 Wages for bachelor’s and associate’s degree alumni were measured against S.C. average high school graduate wages. Wages for master’s degree alumni were measured against S.C. average bachelor’s degree wages. Wages for doctorate and professional degree alumni were measured against S.C. average master’s degree wages.
There were approximately 200,000 alumni of the University of South Carolina living in the state of South Carolina as of November 2020. Data were provided by UofSC’s Alumni Association, which show in which county each alumnus currently resides and the most recent degree he or she obtained from UofSC. Using the latest data available from the U.S. Census Bureau, wage estimates were obtained for each alumnus based on their county of residence and their degree type. This wage estimate was then compared to the average wage for a South Carolinian with the next lowest degree type.12 The marginal wage difference for each alumnus was calculated and adjusted to reflect the county labor force participation rate.
Alumni of the University of South Carolina currently comprise approximately 5.1 percent of the total South Carolina population. Thus, the economic spillover effects of
UofSC alumni were estimated by calculating the increase in wages for the population at each education level based on percentages listed in Table 1.
In addition to the alumni impact, the University of South Carolina also has an economic impact on the state of South Carolina through the non-state funded expenditures it makes each year. Non-state funded expenditures represent net contributions to the state of South Carolina in terms of new jobs, income, and output. This study used data from in-state expenditures on labor (employees), construction, research and development, education foundations, and the athletics departments to determine the direct, indirect, and induced impacts on South Carolina. Industry appropriate economic multipliers were applied to all UofSC expenditures, ensuring that the proper effects were estimated in the regional economic model.
16

17
The economic impact of all alumni and non-state funded expenditures have implications for state tax revenue as well. Increases in the income levels of workers in South Carolina clearly have a direct impact on state income tax revenue – more income means more taxable income. University expenditures can also lead to increases in sales and business tax revenue through direct, indirect, and induced sales and business activity that result from the expenditures. In order to determine the total impact on state tax revenue, a ratio of the General Fund revenue (from the S.C. Office of Revenue and Fiscal Affairs) to South Carolina’s nominal GDP (from the U.S. Department of Commerce, Bureau of Economic Analysis) was estimated. This ratio was then used to determine increased tax revenue arising from new local economic value added generated from the direct, indirect, and induced impacts result from the presence of in-state alumni as well as all non-state funded expenditures.


Section IV
The Economic Impact of UofSC: Primary Results
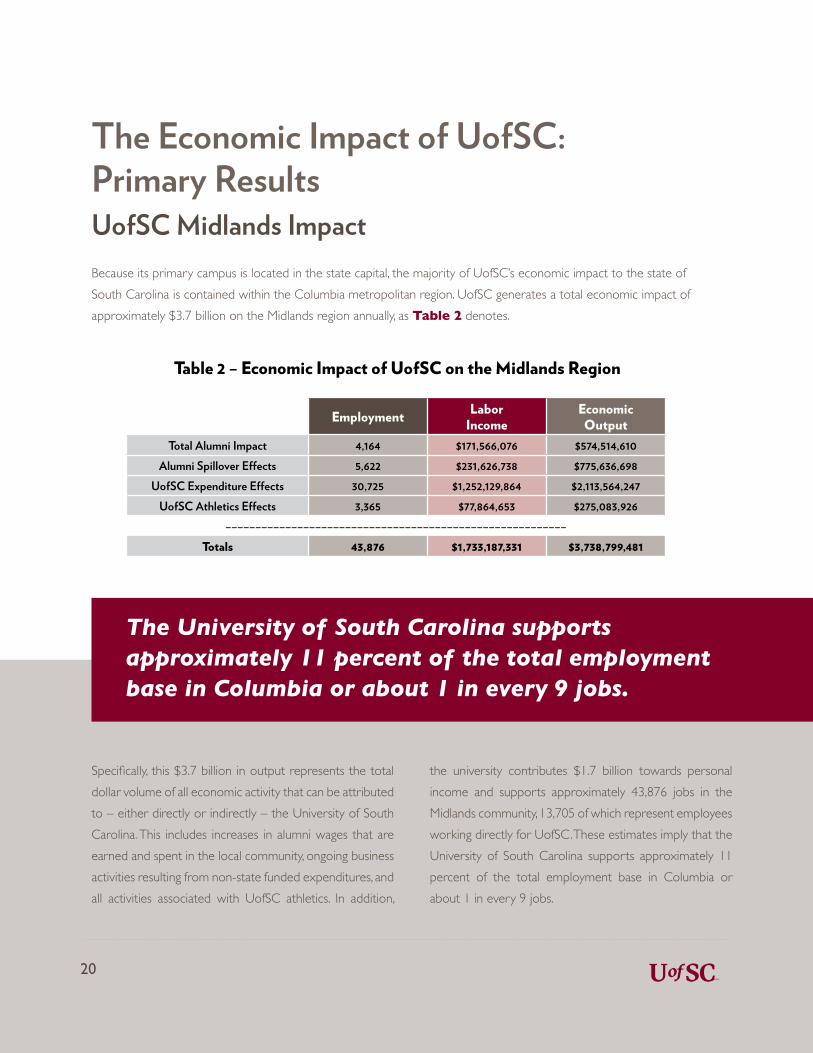
The Economic Impact of UofSC: Primary ResultsUofSC Midlands Impact Because its primary campus is located in the state capital, the majority of UofSC’s economic impact to the state of South Carolina is contained within the Columbia metropolitan region. UofSC generates a total economic impact of approximately $3.7 billion on the Midlands region annually, as Table 2 denotes.
Table 2 – Economic Impact of UofSC on the Midlands Region
Specifically, this $3.7 billion in output represents the total dollar volume of all economic activity that can be attributed to – either directly or indirectly – the University of South Carolina. This includes increases in alumni wages that are earned and spent in the local community, ongoing business activities resulting from non-state funded expenditures, and all activities associated with UofSC athletics. In addition,
the university contributes $1.7 billion towards personal income and supports approximately 43,876 jobs in the Midlands community, 13,705 of which represent employees working directly for UofSC. These estimates imply that the University of South Carolina supports approximately 11 percent of the total employment base in Columbia or about 1 in every 9 jobs.
20
The University of South Carolina supports approximately 11 percent of the total employment base in Columbia or about 1 in every 9 jobs.
The Economic Impact of UofSC: Primary ResultsUofSC Midlands Impact Because its primary campus is located in the state capital, the majority of UofSC’s economic impact to the state of South Carolina is contained within the Columbia metropolitan region. UofSC generates a total economic impact of approximately $3.7 billion on the Midlands region annually, as Table 2 denotes.
Table 2 – Economic Impact of UofSC on the Midlands Region
Employment LaborIncome
EconomicOutput
Total Alumni Impact 4,164 $171,566,076 $574,514,610Alumni Spillover Effects 5,622 $231,626,738 $775,636,698
UofSC Expenditure Effects 30,725 $1,252,129,864 $2,113,564,247UofSC Athletics Effects 3,365 $77,864,653 $275,083,926
–––––––––––––––––––––––––––––––––––––––––––––––––––––––––Totals 43,876 $1,733,187,331 $3,738,799,481
Specifically, this $3.7 billion in output represents the total dollar volume of all economic activity that can be attributed to – either directly or indirectly – the University of South Carolina. This includes increases in alumni wages that are earned and spent in the local community, ongoing business activities resulting from non-state funded expenditures, and all activities associated with UofSC athletics. In addition,
the university contributes $1.7 billion towards personal income and supports approximately 43,876 jobs in the Midlands community, 13,705 of which represent employees working directly for UofSC. These estimates imply that the University of South Carolina supports approximately 11 percent of the total employment base in Columbia or about 1 in every 9 jobs.
17
The University of South Carolina supports approximately 11 percent of the total employment base in Columbia or about 1 in every 9 jobs.
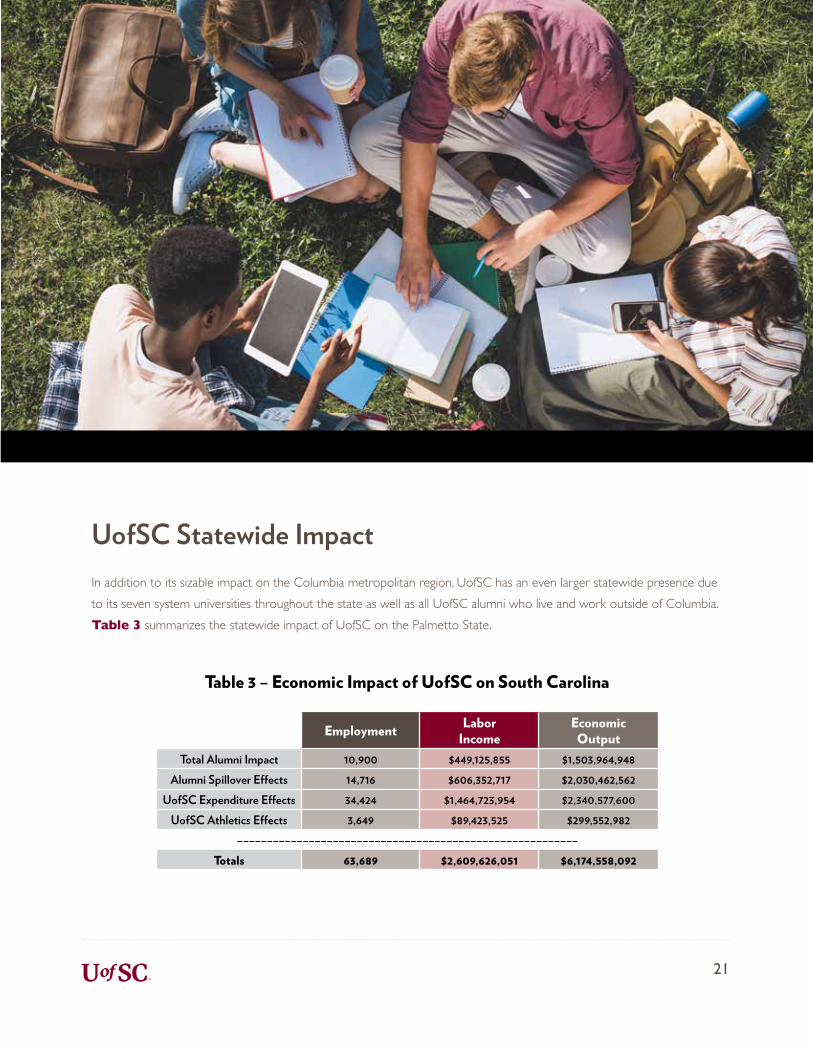
UofSC Statewide Impact In addition to its sizable impact on the Columbia metropolitan region, UofSC has an even larger statewide presence due to its seven system universities throughout the state as well as all UofSC alumni who live and work outside of Columbia. Table 3 summarizes the statewide impact of UofSC on the Palmetto State.
Table 3 – Economic Impact of UofSC on South Carolina
21
UofSC Statewide Impact In addition to its sizable impact on the Columbia metropolitan region, UofSC has an even larger statewide presence due to its seven regional campuses throughout the state as well as all UofSC alumni who live and work outside of Columbia. Table 3 summarizes the statewide impact of UofSC on the Palmetto State.
Table 3 – Economic Impact of UofSC on South Carolina
Employment LaborIncome
EconomicOutput
Total Alumni Impact 10,900 $449,125,855 $1,503,964,948Alumni Spillover Effects 14,716 $606,352,717 $2,030,462,562
UofSC Expenditure Effects 34,424 $1,464,723,954 $2,340,577,600UofSC Athletics Effects 3,649 $89,423,525 $299,552,982
–––––––––––––––––––––––––––––––––––––––––––––––––––––––––Totals 63,689 $2,609,626,051 $6,174,558,092
18
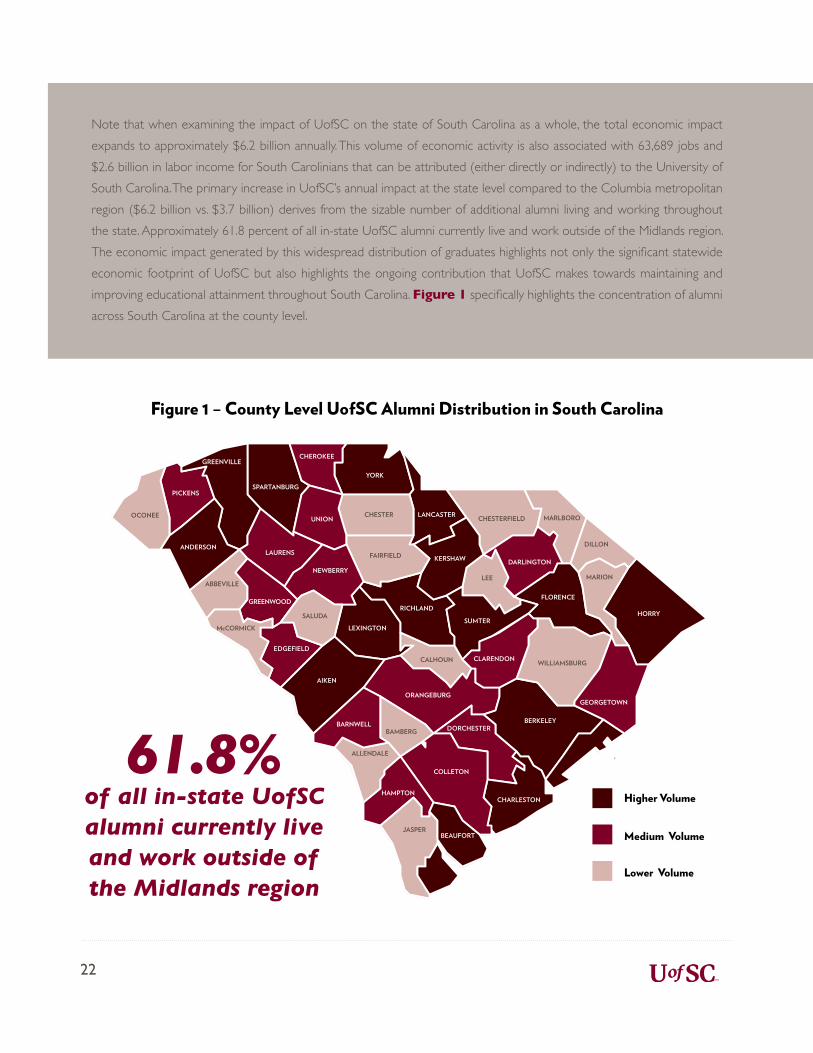
Note that when examining the impact of UofSC on the state of South Carolina as a whole, the total economic impact expands to approximately $6.2 billion annually. This volume of economic activity is also associated with 63,689 jobs and $2.6 billion in labor income for South Carolinians that can be attributed (either directly or indirectly) to the University of South Carolina. The primary increase in UofSC’s annual impact at the state level compared to the Columbia metropolitan region ($6.2 billion vs. $3.7 billion) derives from the sizable number of additional alumni living and working throughout the state. Approximately 61.8 percent of all in-state UofSC alumni currently live and work outside of the Midlands region. The economic impact generated by this widespread distribution of graduates highlights not only the significant statewide economic footprint of UofSC but also highlights the ongoing contribution that UofSC makes towards maintaining and improving educational attainment throughout South Carolina. Figure 1 specifically highlights the concentration of alumni across South Carolina at the county level.
Figure 1 – County Level UofSC Alumni Distribution in South Carolina
Higher Volume
Medium Volume
Lower Volume
EDGEFIELD
AIKEN
BARNWELL
HAMPTON
ALLENDALE
JASPERBEAUFORT
COLLETON
CHARLESTON
DORCHESTERBERKELEY
ORANGEBURG
CALHOUN
LEXINGTON
RICHLAND
BAMBERG
MARION
McCORMICK
SALUDA
NEWBERRY
YORK
CHESTER
FAIRFIELD
LANCASTER
KERSHAW
CHESTERFIELD MARLBORO
DILLON
DARLINGTON
LEE
SUMTER
CLARENDON WILLIAMSBURG
HORRY
GEORGETOWN
FLORENCE
OCONEE
PICKENS
ANDERSON
ABBEVILLE
GREENWOOD
LAURENS
GREENVILLECHEROKEE
UNION
SPARTANBURG
61.8%of all in-state UofSC alumni currently live and work outside of the Midlands region
22
23
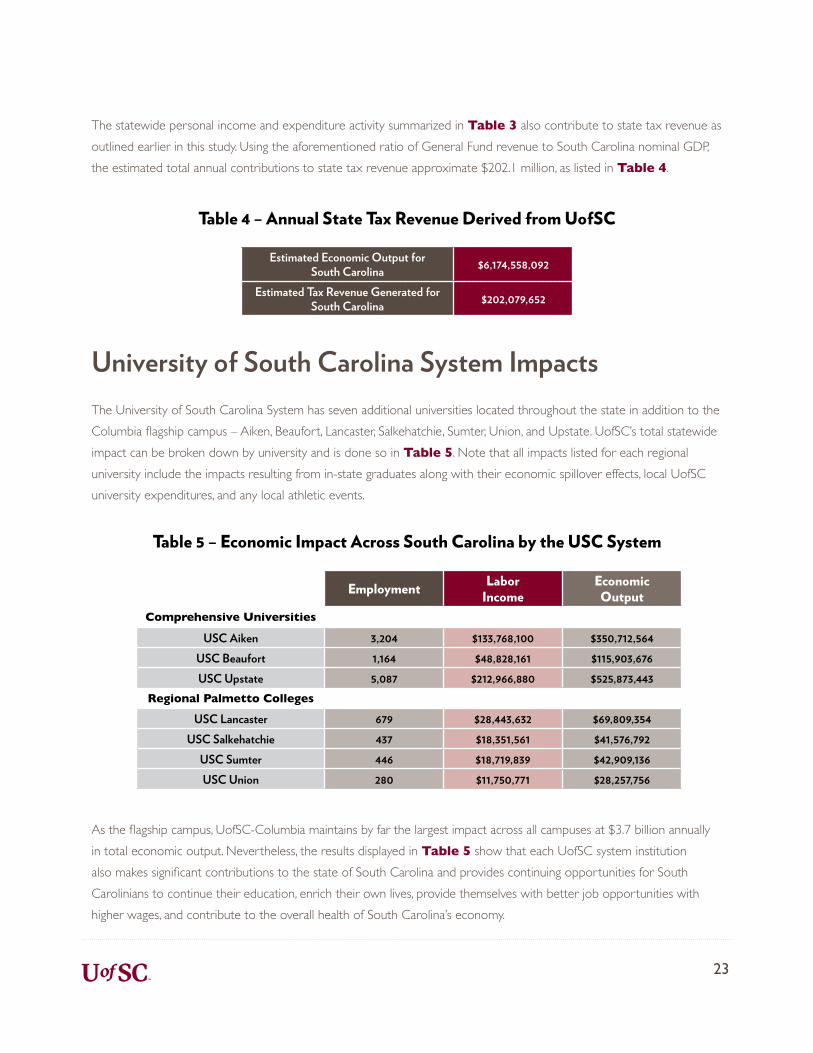
The statewide personal income and expenditure activity summarized in Table 3 also contribute to state tax revenue as outlined earlier in this study. Using the aforementioned ratio of General Fund revenue to South Carolina nominal GDP, the estimated total annual contributions to state tax revenue approximate $202.1 million, as listed in Table 4.
As the flagship campus, UofSC-Columbia maintains by far the largest impact across all campuses at $3.7 billion annually in total economic output. Nevertheless, the results displayed in Table 5 show that each UofSC system institution also makes significant contributions to the state of South Carolina and provides continuing opportunities for South Carolinians to continue their education, enrich their own lives, provide themselves with better job opportunities with higher wages, and contribute to the overall health of South Carolina’s economy.
Table 4 – Annual State Tax Revenue Derived from UofSC
Estimated Economic Output for South Carolina $6,174,558,092
Estimated Tax Revenue Generated for South Carolina $202,079,652
University of South Carolina System Impacts The University of South Carolina System has seven additional universities located throughout the state in addition to the Columbia flagship campus – Aiken, Beaufort, Lancaster, Salkehatchie, Sumter, Union, and Upstate. UofSC’s total statewide impact can be broken down by university and is done so in Table 5. Note that all impacts listed for each regional university include the impacts resulting from in-state graduates along with their economic spillover effects, local UofSC university expenditures, and any local athletic events.
Table 5 – Economic Impact Across South Carolina by the USC System
Employment LaborIncome
EconomicOutput
Comprehensive Universities
USC Aiken 3,204 $133,768,100 $350,712,564USC Beaufort 1,164 $48,828,161 $115,903,676USC Upstate 5,087 $212,966,880 $525,873,443
Regional Palmetto Colleges
USC Lancaster 679 $28,443,632 $69,809,354USC Salkehatchie 437 $18,351,561 $41,576,792
USC Sumter 446 $18,719,839 $42,909,136USC Union 280 $11,750,771 $28,257,756


Section V
The Ability of UofSC to Increase Long-Run Economic Growth
in the Midlands

The Ability of UofSC to Increase Long-Run Economic Growth in the Midlands Over the past decade, South Carolina’s rate of economic growth has consistently outpaced that of the United States as a whole. This can be observed across a variety of metrics but is especially apparent when comparing employment gains. For example, between 2010 and 2019, the annual rate of employment growth in South Carolina averaged 2.2 percent, compared to 1.7 percent for the U.S. as a whole. Moreover, as Figure 2 illustrates, this gap in the two growth rates was consistent over time, with South Carolina often maintaining growth rates in excess of 1.5 percentage points above the national average. Much of this strong growth in South Carolina was due to the rapid expansion of the state’s advanced manufacturing base (e.g., the aerospace, automotive, and tire clusters).
Figure 2 – South Carolina vs. United States Employment Growth: 2010-2019Source: U.S. Bureau of Labor Statistics, CES, NSA
0.0%
0.5%
1.0%
1.5%
2.0%
2.5%
3.0%
3.5%
Jan. ‘11 Jan.’12 Jan.’13 Jan.’14 Jan.’15 Jan.’16 Jan.’17 Jan.’18 Jan.’19
South Carolina United States
26
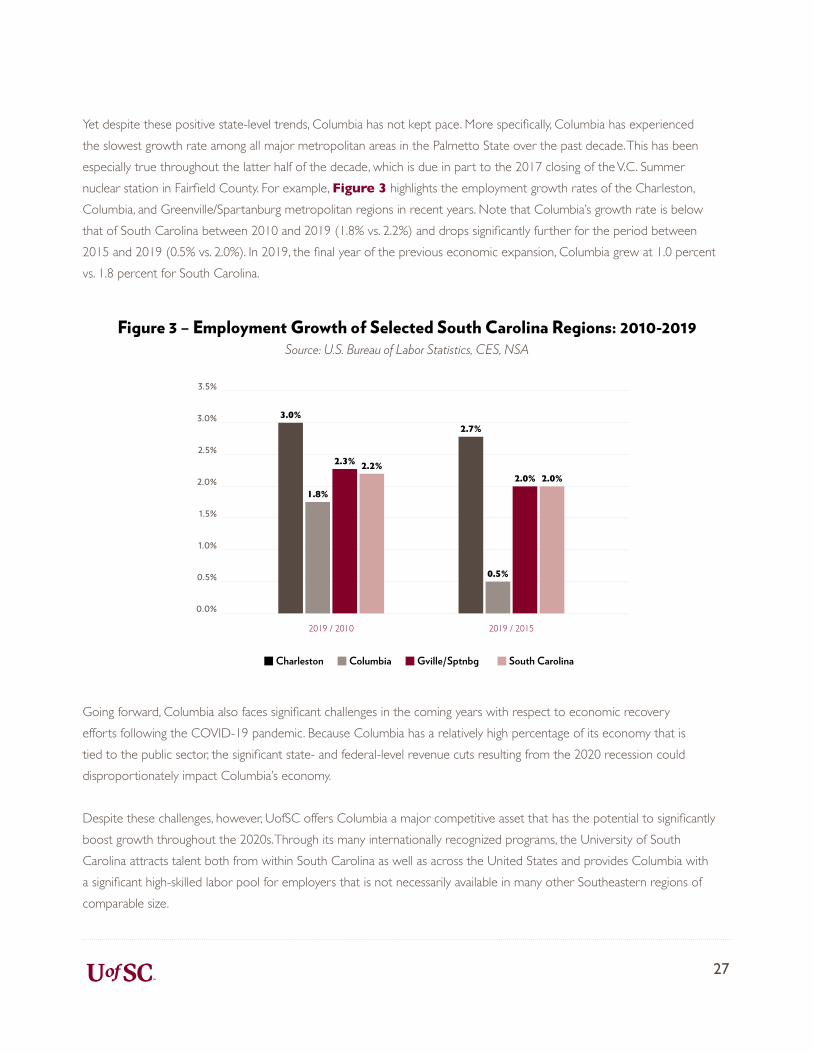
Yet despite these positive state-level trends, Columbia has not kept pace. More specifically, Columbia has experienced the slowest growth rate among all major metropolitan areas in the Palmetto State over the past decade. This has been especially true throughout the latter half of the decade, which is due in part to the 2017 closing of the V.C. Summer nuclear station in Fairfield County. For example, Figure 3 highlights the employment growth rates of the Charleston, Columbia, and Greenville/Spartanburg metropolitan regions in recent years. Note that Columbia’s growth rate is below that of South Carolina between 2010 and 2019 (1.8% vs. 2.2%) and drops significantly further for the period between 2015 and 2019 (0.5% vs. 2.0%). In 2019, the final year of the previous economic expansion, Columbia grew at 1.0 percent vs. 1.8 percent for South Carolina.
Going forward, Columbia also faces significant challenges in the coming years with respect to economic recovery efforts following the COVID-19 pandemic. Because Columbia has a relatively high percentage of its economy that is tied to the public sector, the significant state- and federal-level revenue cuts resulting from the 2020 recession could disproportionately impact Columbia’s economy.
Despite these challenges, however, UofSC offers Columbia a major competitive asset that has the potential to significantly boost growth throughout the 2020s. Through its many internationally recognized programs, the University of South Carolina attracts talent both from within South Carolina as well as across the United States and provides Columbia with a significant high-skilled labor pool for employers that is not necessarily available in many other Southeastern regions of comparable size.
27
Figure 3 – Employment Growth of Selected South Carolina Regions: 2010-2019Source: U.S. Bureau of Labor Statistics, CES, NSA
0.0%
0.5%
1.0%
1.5%
2.0%
2.5%
3.0%
3.5%
2019 / 2010
3.0%
1.8%
2.3% 2.2%
2019 / 2015
2.7%
0.5%
2.0% 2.0%
Charleston Columbia Gville/Sptnbg South Carolina
According to the South Carolina Commission on Higher Education, the retention rate for undergraduates from public four-year research institutions is approximately 58.5 percent for in-state students and 16.6 percent for out-of-state students.13 Applying these percentages to graduates from the UofSC Columbia campus, this implies that the overall retention rate for UofSC-Columbia is approximately 40.3 percent. In other words, roughly 40.3 percent of graduates from the UofSC Columbia campus are still in Columbia living and working five years after their graduation.
There are a variety of reasons why undergraduate students may choose not to remain in the location of their alma mater, regardless of the school from which they graduate. Two of the most common reasons are outside job opportunities and lifestyle factors – such as being close to family members. Nevertheless, this study finds that successfully increasing the retention rate of UofSC’s Columbia campus would meaningfully increase the region’s long-run rate of economic growth. Specifically, this study finds that for every one percentage point increase in the overall graduate retention rate of the UofSC Columbia campus, approximately $14.1 million in new annual economic activity for the Midlands region would be generated. This new economic activity would be the result of one of two scenarios: (1) outside employers hiring UofSC graduates to work remotely while residing in Columbia or (2) new employers relocating to Columbia to capitalize on the local talent base generated by UofSC. Increasing the graduate retention rate therefore must be a collaborative effort to both recruit new employers and match graduates to existing employers outside the region that are willing to hire a remote workforce.
13 Source: South Carolina Commission on Higher Education: Employment Outcomes for South Carolina Post-Secondary Graduates, October 2017. Note that “graduate retention” specifically refers to the number of graduates found in the South Carolina wage records five years post-graduation.
28

EDGEFIELD
AIKEN
BARNWELL
HAMPTON
ALLENDALE
JASPERBEAUFORT
COLLETON
CHARLESTON
DORCHESTERBERKELEY
ORANGEBURG
CALHOUN
LEXINGTON
RICHLAND
BAMBERG
MARION
McCORMICK
SALUDA
NEWBERRY
YORK
CHESTER
FAIRFIELD
LANCASTER
KERSHAW
CHESTERFIELD MARLBORO
DILLON
DARLINGTON
LEE
SUMTER
CLARENDON WILLIAMSBURG
HORRY
GEORGETOWN
FLORENCE
OCONEE
PICKENS
ANDERSON
ABBEVILLE
GREENWOOD
LAURENS
GREENVILLECHEROKEE
UNION
SPARTANBURG
$14.1 MILLION in new annual economic activity for the Midlands region would be created for every
one percentage point increase in UofSC-Columbia’s graduate retention rate.


Section VI
Conclusion
Conclusion The economic benefits of higher education are far reaching for both individual citizens and for the state as a whole. College graduates earn higher wages and have better job opportunities, while the local community benefits from economic spillover effects that result in wage increases for all workers. Other intangible benefits such as improved community leadership, improved community health, and lower crime rates also exist. Additionally, the state benefits from tax revenue that accrues from citizens earning higher wages.
As an institution whose primary goal is to provide higher education for the citizens of South Carolina, the University of South Carolina is a major economic driver that provides all of these economic benefits in addition to the economic impacts it has through its non-state funded expenditures in South Carolina.
The economic impact of the University of South Carolina can be clearly measured by estimating the marginal increase in the wages of working alumni within the state that result from their UofSC degrees. In addition, the economic spillover effects can be estimated using parameters in the economics literature that specifically quantify the impact that an increase in the education of the working population has on worker wages within a region. Together, when combined with the new jobs and income supported non-state funded expenditures on labor (employees), new construction, research and development, education foundations, and athletics departments, the total impact of the University of South Carolina approximates $6.2 billion in economic output, $2.6 billion in income, and over 63,000 jobs. Nearly 70 percent of this impact is concentrated within the Midlands region, meaning that UofSC supports approximately 1 in every 9 jobs in the Columbia metropolitan region.
The university’s uniquely large contribution to Columbia’s economy puts it in a position to take a leadership role in developing a strategy that Columbia can implement in the coming years in order to boost its rate of long-run economic growth. Such a strategy will be critical as the region recovers from the COVID-19 pandemic, especially considering that over the past decade Columbia’s growth rate has lagged almost all other metropolitan regions of comparable size in the Southeast. This study estimates that for every one percentage point increase in the overall graduate retention rate of the UofSC Columbia campus, approximately $14.1 million in new annual economic activity for the Midlands region would be generated.
32

References Acemoglu, D. “Why Do New Technologies Complement Skills? Directed Technical Change and Wage Inequality,” Quarterly Journal
of Economics 113 (1998): 1055-1090.
Angrist, J.D., and Lavy, V. “The Effect of Teen Childbearing and Single Parenthood on Childhood Disabilities and Progress in School,”
Working Paper 5807, (1996). National Bureau of Economic Research: http://www.nber.org/
Carnevale AP, Rose SJ, Cheah B. The college payoff: Education, occupation, and lifetime earnings (Report) Washington, DC:
Georgetown University Center on Education and the Workforce; 2013
Cutler, D.M., and Lleras-Muney, A. “Education and Health: Evaluating Theories and Evidence,” Working Paper 12352, (2006).
National Bureau of Economic Research: http://www.nber.org/
Grossman, Michael. “Education and Nonmarket Outcomes,” Handbook of the Economics of Education Vol. 1 (2006). Eds. Eric A.
Hanushek and Finis Welch. Oxford, UK: Elsevier.
Lucas, R.E. “On the Mechanics of Economic Development,” Journal of Monetary Economics 22 (1988): 3-42.
Moretti, Enrico. “Estimating the Social Return to Higher Education: Evidence from Longitudinal and Repeated Cross-Sectional
Data,” Journal of Econometrics 121 (2004): 175-212.
Oreopoulous, P., and Salvanes, K. “How Large are Returns to Schooling? Hint: Money Isn’t Everything,” Working Paper 15339,
(2009). National Bureau of Economic Research: http://www.nber.org/

w w w . s c . e d u