Embed Size (px)
Citation preview

The Economic Impact ofBT Group plc in the UK
2020 EditionA report by Hatch for BT Group plc
London & the South East
Midlands &East of England North of England South West Scotland Wales Northern Ireland

2
Contents
1 Introduction 3
2 Our report 6
3 The economic impact of
BT Group plc in the UK 8
Economic impacts 11 Total impact in the UK 13
4 BT Group plc across the UK 14
London & the South East 16 Midlands & East of England 32 North of England 57 South West 81 Scotland 89 Wales 95 Northern Ireland 101
5 Technical appendices 107
Hatch Urban solutions provides robust analysis of economic and social impact for corporates, trade bodies, major investment, policies and economic shocks. We work across the UK and globally. See: Hatch.com/urbansolutions for further information. Note: The Hatch Urban Solutions team in the UK merged with Regeneris Consulting in 2018.

1Introduction

4
BT plays a critical role in supporting the UK’s economy and society. We are here to connect for the good of our customers, colleagues and country, and our people and networks underpin nearly every part of our lives across the UK. We have a profound sense of purpose that we are here to deliver not connectivity per se, but the benefit it brings to people.
The coronavirus crisis has brought our national leadership role in telecommunications into the sharpest focus in our company’s history. The multiple challenges posed by Covid-19 have highlighted the vital role BT plays in supporting families, businesses and communities across the UK. Throughout the pandemic we have seen how technology can be harnessed to help save lives and deliver even better services for the public. We were proud to get the new NHS field hospitals around the country connected, and support the Life lines project so that families could stay in touch with loved ones whilst isolated in intensive care.
More than 95% of the UK now has access to superfast speeds. We are committed to delivering full fibre across the UK and, with the right fiscal, regulatory and legislative enablers in place are ready to make the biggest communications infrastructure investment in the UK in a generation. When combined with our extensive 5G mobile network from EE, this will provide the UK with a digital infrastructure that will connect millions and help drive future economic growth. In addition to our mobile and broadband networks, we have the UK’s most extensive public wi-fi network and are bringing these three networks into one converged, digital platform.
We have seen the power of innovative technology and the best converged network in trials in health care and education. Working with partners we are using new technology to treat patients remotely and helping develop the smart hospital of the future. Working with the University of Stirling we are developing a world-leading living laboratory. We are one of the largest investors in innovation in the UK, investing £662m in 2019/20. Our innovations have been responsible for many of the pioneering innovations which have transformed our digital world.
We are a key part of communities across the UK and want to help people harness the power of technology to meet their needs or fulfil their potential. In 2019/20 we launched our Skills for Tomorrow programme, designed to empower 10 million people by providing help to improve their digital skills, by 2025. This programme offers free resources for school children, parents and jobseekers. Recognising the importance of small business to the economy we are supporting 1 million businesses with free digital skills support, and we have already supported 1,000 vulnerable people connect with family and friends through the donation of devices.
1 Introduction
Jane WoodUK Nations and Regions Director
1
2
3
4
5

5
We are the founding partner of the UK Modern Slavery Helpline and Tech Against Trafficking. In terms of the climate change challenge, our technology and communications networks have a huge role to play in enabling the innovative solutions and exponential change needed to achieve a net zero carbon economy. The switch to full fibre will bring a significant increase in energy efficiency. In the UK 100% of our directly purchased electricity comes from renewable energy suppliers. We are also working with others to drive innovation in electric vehicles to transform our fleet.
In this report we look at the economic contribution of BT Group across Scotland, Wales, Northern Ireland and the English regions, and show we make a very significant impact on the UK’s economy. We support employment across every part of the UK through our direct workforce and indirectly, through our extensive supply chain, with our procurement and expenditure in the local economies. For the period 2019/20 the total Gross Value Added (GVA) to the UK economy, combining the direct, indirect and induced impacts of our activities and spending, is estimated to be £24.2 billion.
Jane WoodDecember 2020
1 1
2
3
4
5

2Our report

7
The Economic Impact Report 2020 has been prepared independently by Hatch Urban Solutions, drawing upon data for BT Group.
Estimates in this report relate to BT Group plc activities in the UK during the financial year 2019/20. BT Group plc includes all wholly owned subsidiaries, including Openreach Limited and EE (now part of BT Consumer)
We are proud to be a major contributor of taxes in the UK. The One Hundred Group 2019 Total Tax Contribution Survey ranked us as the sixth highest contributor in the UK. The impact of this tax contribution has not been assessed in this report.
Further information about BT Group’s activities can be found in the BT Group plc Annual Report 2020 and Digital Impact and Sustainability Report 2019/20.
Impact calculations are in accordance with Government guidelines and the HM Treasury’s Green Book Guidance for appraisal and evaluation, and are consistent with the Office for National Statistics’ national accounts. Details of our approach are shown in Appendix 5.
Note that the economic impact figures presented throughout this report are expressed to three significant figures. This means they have been rounded up or down as appropriate and, as a result, may not sum exactly to the totals presented.
Economic impact report 2020This study shows BT Group’s economic contribution to the UK national economy and to regional economies in terms of jobs, output and Gross Value Added (GVA) supported. The report covers several effects of BT Group’s activities:
Direct impact: people employed directly by BT Group (including contractor employees) who receive wages and salaries.
Indirect impact: income and employment created with suppliers as a result of BT Group’s spending on goods and services.
Induced impact: further income and employment generated as wages created directly and indirectly are spent within the economy.
2 Our report1
2
3
4
5

3The economic impact of BT Group plc in the UK

9
Working Living Total income Spend with Total direct £m suppliers £m GVA £m
London & the South East 24,300 23,100 992 5,620 3,220
London 14,500 12,200 634 3,140 2,050
South East 9,780 10,900 359 2,480 1,160
Midlands & East of England 19,500 20,500 751 2,270 2,440
East of England 8,950 9,580 377 1,510 1,220
East Midlands 4,490 4,990 151 130 489
West Midlands 6,070 5,940 224 636 725
North of England 25,700 25,500 813 876 2,630
North East 9,290 9,280 262 41 849
North West 9,720 9,690 322 410 1,040
Yorkshire and The Humber 6,660 6,550 229 424 741
South West 8,560 8,350 321 634 1,040
Scotland 7,440 7,480 254 167 825
Wales 4,600 5,060 146 340 472
Northern Ireland 3,340 3,350 115 155 373
Source: Hatch
The figures below show the number of employees working in each English region, Scotland, Wales and Northern Ireland.Note: Figures are rounded to 3 significant figures.
3 The economic impact of BT Group plc in the UK1
2
3
4
5

10
Across the UK in 2019/2082,800 employees directly working for BT Group, and 10,600 contractors (Full Time Equivalent – FTE)
300,000 total FTE jobs supported (including indirect and induced effects)
£3.4 billion total income of BT Group employees (including contractors)
£10.1 billion spend with suppliers based in the UK
£24 billion total GVA impact associated with BT Group activities (including indirect and induced effects)
BT Group directly employed 1 in every 230 employees in the private sector across the UK, and 1 in every 12 in the IT and Communications sector
BT Group directly created £1 in every £165 of GVA in the UK
As a result of the full economic impact of BT Group, the firm supported £1 in every £75 of GVA in the UK economy and 1 in every 90 employeesworking in the UK economy
3 Key points1
2
3
4
5

11
Economic impactsDirect impactBT Group directly employs a total of 82,800 people in the UK, with a further 10,600 employed as contractors. These employees have an associated £3.4 billion in wages and salary spend.
Procurement impact (indirect)BT Group spent a total of £10.1 billion with UK based suppliers in 2019/20. This results in significant benefits for the UK economy, including knock-on benefits further down the supply chain, which results in additional employment and output. This is summarised below.
139,000FTE
Employment supportedamongst suppliers
£16.3billion
£5.1billion
£8.6billion
Output generatedamongst suppliers
£££Income of supply chain employees
£££GVA generated in
the United Kingdom
£££Figure 3-1: Indirect (supply chain impacts) in the UK Source: Hatch
BT Group supply chain spend in the United Kingdom = £10.1 billion
3 1
2
3
4
5
12
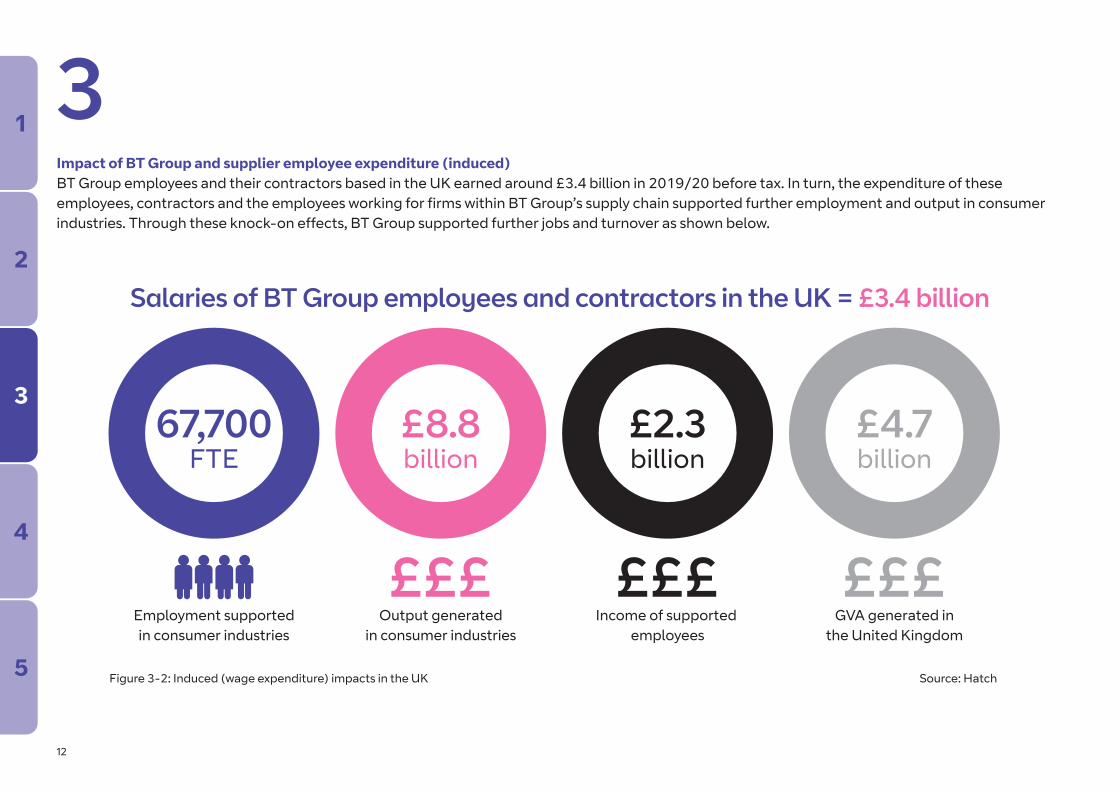
Impact of BT Group and supplier employee expenditure (induced)BT Group employees and their contractors based in the UK earned around £3.4 billion in 2019/20 before tax. In turn, the expenditure of these employees, contractors and the employees working for firms within BT Group’s supply chain supported further employment and output in consumer industries. Through these knock-on effects, BT Group supported further jobs and turnover as shown below.
3
67,700FTE
Employment supportedin consumer industries
£8.8billion
£2.3billion
£4.7billion
Output generatedin consumer industries
£££Income of supported
employees
£££GVA generated in
the United Kingdom
£££Figure 3-2: Induced (wage expenditure) impacts in the UK Source: Hatch
Salaries of BT Group employees and contractors in the UK = £3.4 billion
1
2
3
4
5

13
Total impact in the UKCombining BT Group’s direct impact and employment with the indirect supply chain impact and induced wage expenditure impact gives the total impact of BT Group’s operations in the UK in 2019/20. This is summarised in the table below.
3
United Kingdomemployment impact
United Kingdomgross output
£££United Kingdom grossemployment income
£££United Kingdom
total GVA
£££
£4,650m INDUCED
£2,260m INDUCED
£8,750m INDUCED
67,700 INDUCED
£8,550m
INDIRECT
£5,140m INDIRECT
£16,300m INDIRECT
139,000 INDIRECT
£11,
000m
DIR
ECT
£3,3
90m
D
IRECT
£19,
400m
DIR
ECT
93,4
00 D
IRECT
£44,500million
£10,800million
£24,200million
300,000FTE
Figure 3-3: Total impact of BT Group in the UK Source: Hatch
1
2
3
4
5

4BT Group plc across the UK

15
This section presents key statistics on the economic impact of BT Group for each of the 4 English regions, Scotland, Wales and Northern Ireland. These geographies are presented in order as follows:
1. London & the South East
2. Midlands & East of England
3. North of England
4. South West
5. Scotland
6. Wales
7. Northern Ireland
As in previous economic impact reports, we also present results for each of the Local Enterprise Partnerships.
4 BT Group in the UK nations and regions
1
2
3
4
5
6
7
1
2
3
4
A
16
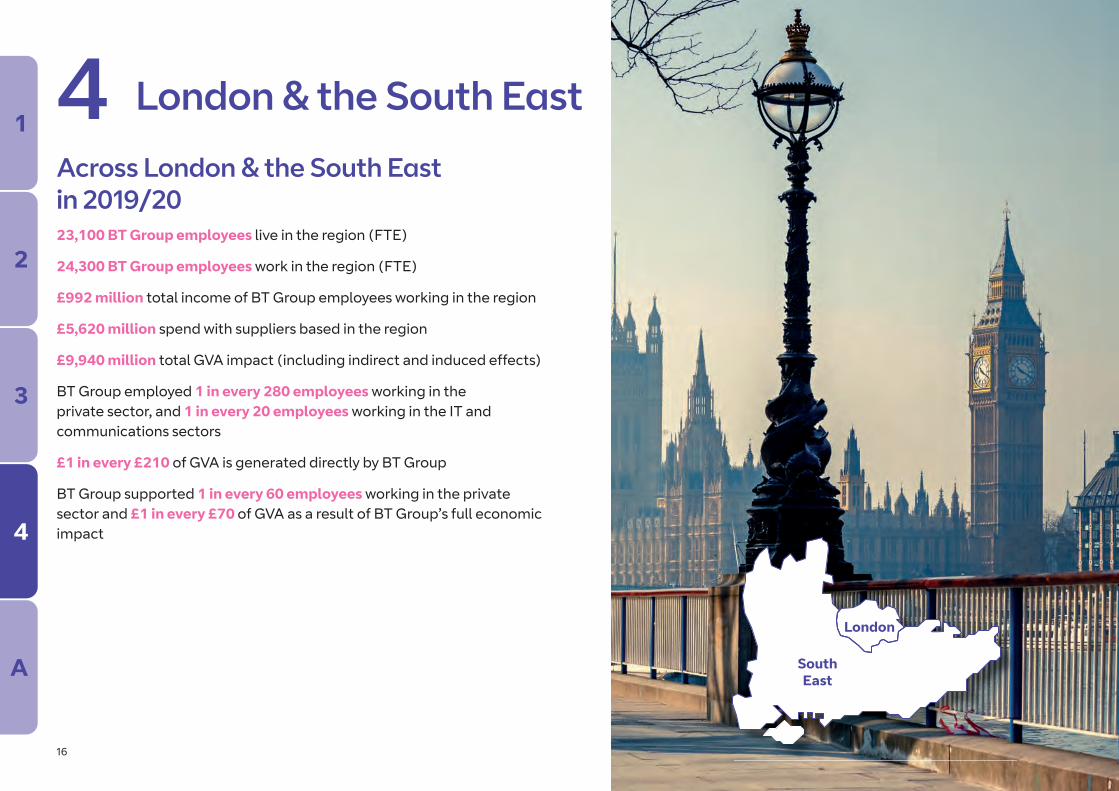
Across London & the South East in 2019/2023,100 BT Group employees live in the region (FTE)
24,300 BT Group employees work in the region (FTE)
£992 million total income of BT Group employees working in the region
£5,620 million spend with suppliers based in the region
£9,940 million total GVA impact (including indirect and induced effects)
BT Group employed 1 in every 280 employees working in the private sector, and 1 in every 20 employees working in the IT and communications sectors
£1 in every £210 of GVA is generated directly by BT Group
BT Group supported 1 in every 60 employees working in the private sector and £1 in every £70 of GVA as a result of BT Group’s full economic impact
4 London & the South East
SouthEast
London
1
2
3
4
A

17
Across London in 2019/20 12,200 BT Group employees live in the region (FTE)
14,500 BT Group employees work in the region (FTE)
£634 million total income of BT Group employees working in the region
£3,140 million spend with suppliers based in the region
£6,120 million total GVA impact (including indirect and induced effects)
BT Group employed 1 in every 260 employees working in the private sector, and 1 in every 18 employees working in the IT and communications sectors
£1 in every £200 of GVA is generated directly by BT Group
BT Group supported 1 in every 50 employees working in the private sector and £1 in every £70 of GVA as a result of BT Group’s full economic impact
4 London1
2
3
4
5

18
Regional impactsDirect impactBT Group directly employs a total of 12,000 people in the London region, with a further 2,510 employed as contractors. This results in £634 million in wages and salary spend across the region.
Procurement impactBT Group spent around £3.1 billion with suppliers based in London in 2019/20. The largest item was activities of head offices/management consultancy activities, as illustrated in the chart below.
4
Total spend
£3.1billion
£511m activities of head offices, management consultancy activities
£386m computer programming, consultancy & related activities
£369m sports activities, amusement & recreation activities
£337m office administrative, office support & other business support activities
£303m other professional, scientific & technical activities
£1,194m supplier spend with other sectors
•••••
Figure 4-1: Top five supplier sectors in London by value of expenditure Source: BT Group Procurement data
1
2
3
4
5

19
BT Group’s spend with suppliers results in significant benefits for the London economy, including knock-on or multiplier benefits as a result of supplier spend. This is summarised below.
4
45,700FTE
Employment supportedamongst suppliers
£5,110million
£1,600million
£2,780million
Output generatedamongst suppliers
£££Income of supply chain employees
£££GVA generated in
London
£££Figure 4-2: Indirect supply chain impact in London Source: Hatch
BT Group supply chain spend in London = £3,140 million
1
2
3
4
5

20
4Impact of employee expenditureBT Group employees and contractors living in London earned £490 million in 2019/20. In turn, their expenditure supports further employment and output in consumer industries in the region. Figure 4-3 below illustrates the wider induced employment and output supported through this employee expenditure.
13,400FTE
Employment supportedin consumer industries
£2,330million
£595million
£1,290million
Output generatedin consumer industries
£££Income of supported
employees
£££GVA generated in
London
£££Figure 4-3: Induced (wage expenditure) impacts in London Source: Hatch
Salaries of BT Group employees and contractors in London = £490 million
1
2
3
4
5

21
4Total impact in London Combining BT Group’s direct impact and employment with the indirect supply chain impact and induced wage expenditure impact gives the total impact of the firm’s operations in London. This is summarised in Figure 4-4 below.
Londonemployment impact
Londongross output
£££London gross
employment income
£££London
total GVA
£££
£1,290m INDUCED
£595m INDUCED
£2,330m INDUCED
13,400 INDUCED
£2,780m INDIRECT
£1,600m INDIRECT
£5,110m INDIRECT45,700 INDIRECT
£2,0
50m
DIR
ECT
£634m DIRECT
£3,6
20m
D
IRECT
14,5
00 DIRECT
£11,100million
£2,830million
£6,120million
73,600FTE
Figure 4-4: Total impact of BT Group in London Source: Hatch
1
2
3
4
5

22
4Sub-regional impactThe table below illustrate the impact BT Group has within sub-regions in London. BT Group has employees living and working in every London borough. BT Group also spends money on suppliers based in every borough.
BT Group employees & contractors Total impact
Work in area Resident Employment Output GVA in area £ million £ million
Central London 10,000 3,230 49,700 7,720 4,280
North London 534 952 696 127 72
East London 1,870 3,490 4,670 745 415
West London 822 1,890 15,000 1,950 1,070
South London 1,230 2,610 3,490 519 289
Inner London 11,200 4,900 54,500 8,420 4,670
Outer London 3,320 7,270 19,000 2,640 1,460
Table 4-1: Sub-regional impacts within London Source: Hatch
1
2
3
4
5
23
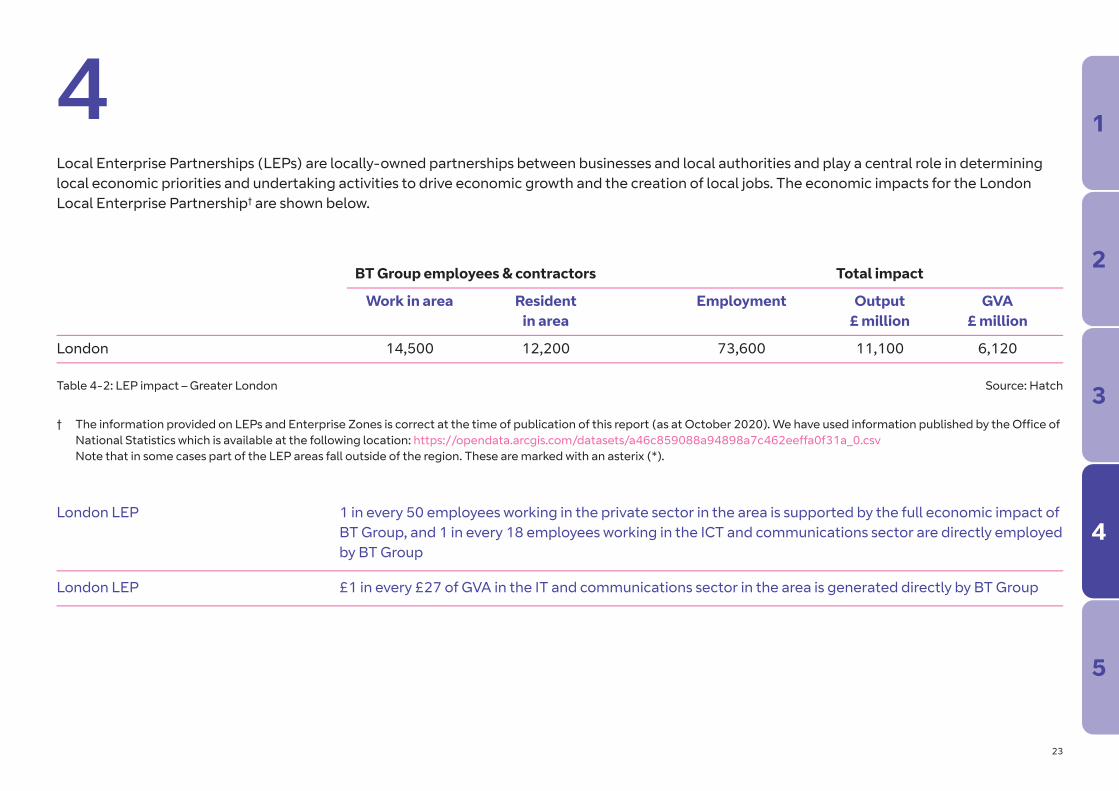
4Local Enterprise Partnerships (LEPs) are locally-owned partnerships between businesses and local authorities and play a central role in determining local economic priorities and undertaking activities to drive economic growth and the creation of local jobs. The economic impacts for the London Local Enterprise Partnership† are shown below.
Table 4-2: LEP impact – Greater London Source: Hatch
BT Group employees & contractors Total impact
Work in area Resident Employment Output GVA in area £ million £ million
London 14,500 12,200 73,600 11,100 6,120
† The information provided on LEPs and Enterprise Zones is correct at the time of publication of this report (as at October 2020). We have used information published by the Office of National Statistics which is available at the following location: https://opendata.arcgis.com/datasets/a46c859088a94898a7c462eeffa0f31a_0.csvNote that in some cases part of the LEP areas fall outside of the region. These are marked with an asterix (*).
London LEP 1 in every 50 employees working in the private sector in the area is supported by the full economic impact of BT Group, and 1 in every 18 employees working in the ICT and communications sector are directly employed by BT Group
London LEP £1 in every £27 of GVA in the IT and communications sector in the area is generated directly by BT Group
1
2
3
4
5
24
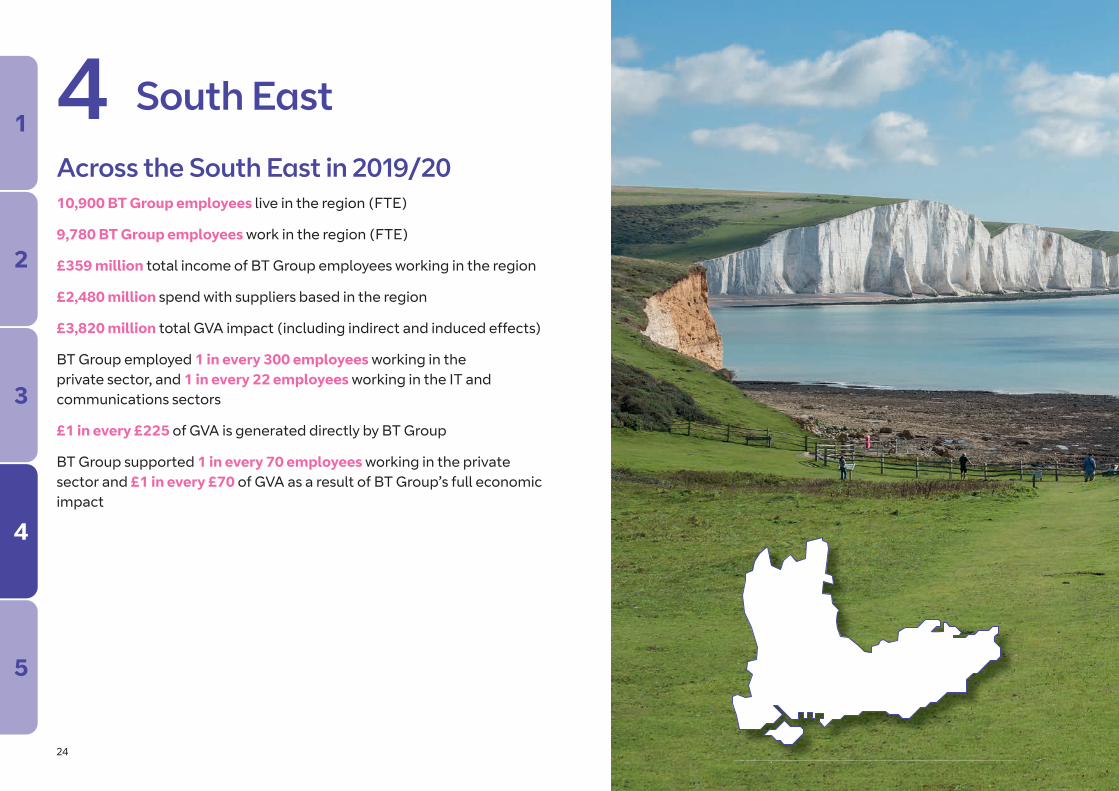
Across the South East in 2019/20 10,900 BT Group employees live in the region (FTE)
9,780 BT Group employees work in the region (FTE)
£359 million total income of BT Group employees working in the region
£2,480 million spend with suppliers based in the region
£3,820 million total GVA impact (including indirect and induced effects)
BT Group employed 1 in every 300 employees working in the private sector, and 1 in every 22 employees working in the IT and communications sectors
£1 in every £225 of GVA is generated directly by BT Group
BT Group supported 1 in every 70 employees working in the private sector and £1 in every £70 of GVA as a result of BT Group’s full economic impact
4 South East1
2
3
4
5

25
Regional impactsDirect impactBT Group directly employs a total of 7,710 people in the South East, with a further 2,070 employed as contractors. These employees earned £359 million in wages and salaries.
Procurement impactBT Group spent around £2.5 billion with suppliers based in the South East in 2019/20. The majority was spent on telecommunications, as illustrated in the chart below.
4
Total spend
£2.5billion
£984m telecommunications
£536m manufacture of computer, electronic & optical products
£333m computer programming, consultancy & related activities
£129m wholesale trade, except of motor vehicles & motorcycles
£71m other personal service activities
£447m supplier spend with other sectors
•••••
Figure 4-5: Top five supplier sectors in the South East by value of expenditure Source: BT Group Procurement data
1
2
3
4
5

26
BT Group’s spend with suppliers results in significant benefits for the South East’s economy, including knock-on or multiplier benefits as a result of supplier spend. This is summarised below.
4
23,700FTE
Employment supportedamongst suppliers
£3,930million
£1,180million
£2,010million
Output generatedamongst suppliers
£££Income of supply chain employees
£££GVA generated in
the South East
£££Figure 4-6: Indirect supply chain impact in the South East Source: Hatch
BT Group supply chain spend in the South East = £2,480 million
1
2
3
4
5

27
4Impact of employee expenditureBT Group employees and contractors living in the South East earned £437 million in 2019/20. In turn, their expenditure supports further employment and output in consumer industries in the region. Figure 4-7 below illustrates the wider induced employment and output supported through this employee expenditure.
8,050FTE
Employment supportedin consumer industries
£1,360million
£295million
£641million
Output generatedin consumer industries
£££Income of supported
employees
£££GVA generated in
the South East
£££Figure 4-7: Induced (wage expenditure) impacts in the South East Source: Hatch
Salaries of BT Group employees and contractors in the South East = £437 million
1
2
3
4
5

28
4Total impact in South EastCombining BT Group’s direct impact and employment with the indirect supply chain impact and induced wage expenditure impact gives the total impact of the firm’s operations in the South East. This is summarised in Figure 4-8 below.
South Eastemployment impact
South Eastgross output
£££South East gross
employment income
£££South Easttotal GVA
£££
£641m INDUCED
£295m INDUCED
£1,360m INDUCED
8,050 INDUCED
£2,010m INDIRECT
£1,180m INDIRECT
£3,930m INDIRECT
23,700 INDIRECT
£1,1
60m
DIRECT
£359m DIRECT
£2,0
50m
DIRECT
9,780 DIRECT
£7,350million
£1,840million
£3,820million
41,600FTE
Figure 4-8: Total impact of BT Group in the South East Source: Hatch
1
2
3
4
5

29
4Sub-regional impactThe table below illustrate the impact BT Group has at a sub-regional level in the South East, focusing on key counties and local authority areas across the region. BT Group has employees working and living in every local authority area in the region, and also sources goods and services from suppliers located in all of the region’s local authority areas.
Table 4-3: Sub-regional impact - South East Source: Hatch
BT Group employees & contractors Total impact
Work in area Resident Employment Output GVA in area £ million £ million
Berkshire 984 1,140 17,100 2,900 1,470
Buckinghamshire 1,700 1,770 3,280 597 321
Milton Keynes 1,180 1,130 1,790 321 175
East Sussex 796 753 950 204 114
Brighton and Hove 533 217 653 143 80
Hampshire 1,790 1,700 6,230 1,130 589
Isle of Wight 49 59 49 9 5
Kent 2,040 2,200 2,850 584 322
Oxfordshire 354 470 434 88 49
Surrey 1,530 1,920 9,970 1,690 868
West Sussex 541 921 729 147 81
1
2
3
4
5

30
4Local Enterprise Partnerships (LEPs) are locally-owned partnerships between businesses and local authorities and play a central role in determining local economic priorities and undertaking activities to drive economic growth and the creation of local jobs. A total of eight Local Enterprise Partnerships† fall in full or in part within the South East region and the economic impacts which relate to these areas are shown below.
Table 4-4: LEP impact – South East Source: Hatch
BT Group employees & contractors Total impact
Work in area Resident Employment Output GVA in area £ million £ million
South East Midlands 2,510 2,810 5,570 790 437
South East * 4,070 5,180 6,510 1,130 635
Thames Valley Berkshire 984 1,140 17,100 2,900 1,470
Buckinghamshire Thames Valley 516 632 1,490 276 146
Solent 1,140 1,140 3,020 551 292
Enterprise M3 2,060 2,110 12,800 2,190 1,130
Oxfordshire 354 470 434 88 49
Coast to Capital * 1,240 1,570 1,850 376 206
† The information provided on LEPs and Enterprise Zones is correct at the time of publication of this report (as at October 2020). We have used information published by the Office of National Statistics which is available at the following location: https://opendata.arcgis.com/datasets/a46c859088a94898a7c462eeffa0f31a_0.csvNote that in some cases part of the LEP areas fall outside of the region. These are marked with an asterix (*).
1
2
3
4
5
31
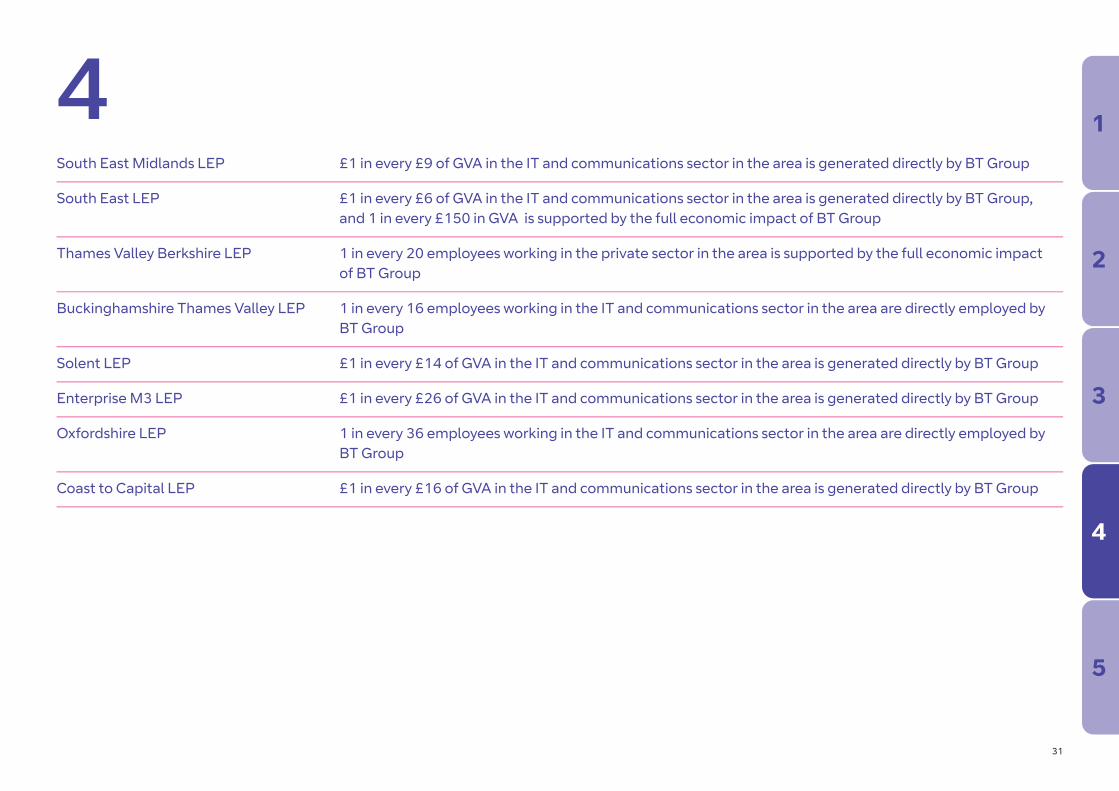
4South East Midlands LEP £1 in every £9 of GVA in the IT and communications sector in the area is generated directly by BT Group
South East LEP £1 in every £6 of GVA in the IT and communications sector in the area is generated directly by BT Group, and 1 in every £150 in GVA is supported by the full economic impact of BT Group
Thames Valley Berkshire LEP 1 in every 20 employees working in the private sector in the area is supported by the full economic impact of BT Group
Buckinghamshire Thames Valley LEP 1 in every 16 employees working in the IT and communications sector in the area are directly employed by BT Group
Solent LEP £1 in every £14 of GVA in the IT and communications sector in the area is generated directly by BT Group
Enterprise M3 LEP £1 in every £26 of GVA in the IT and communications sector in the area is generated directly by BT Group
Oxfordshire LEP 1 in every 36 employees working in the IT and communications sector in the area are directly employed by BT Group
Coast to Capital LEP £1 in every £16 of GVA in the IT and communications sector in the area is generated directly by BT Group
1
2
3
4
5

32
Across the Midlands & East of England in 2019/2020,500 BT Group employees live in the region (FTE)
19,500 BT Group employees work in the region (FTE)
£751 million total income of BT Group employees working in the region
£2,270 million spend with suppliers based in the region
£5,450 million total GVA impact (including indirect and induced effects)
BT Group employed 1 in every 270 employees working in the private sector, and 1 in every 10 employees working in the IT and communications sectors
£1 in every £160 of GVA is generated directly by BT Group
BT Group supported 1 in every 60 employees working in the private sector and £1 in every £70 of GVA as a result of BT Group’s full economic impact
4 Midlands & East of England
WestMidlands
EastMidlands
East ofEngland
1
2
3
4
5

33
Across the East of England in 2019/20 9,580 BT Group employees live in the region (FTE)
8,950 BT Group employees work in the region (FTE)
£377 million total income of BT Group employees working in the region
£1,510 million spend with suppliers based in the region
£3,130 million total GVA impact (including indirect and induced effects)
BT Group employed 1 in every 220 employees working in the private sector, and 1 in every 10 employees working in the IT and communications sectors
£1 in every £125 of GVA is generated directly by BT Group
BT Group supported 1 in every 40 employees working in the private sector and £1 in every £50 of GVA as a result of BT Group’s full economic impact
4 East of England1
2
3
4
5

34
Regional impactsDirect impactBT Group directly employs a total of 8,560 people in the East of England region, with a further 394 employed as contractors. These employees earned £377 million in wages and salaries.
Procurement impactBT Group spent £1,510 million with suppliers based in the East of England in 2019/20. The largest item of spend was in education, as illustrated in the chart below.
4
Total spend
£1,510million
£984m education
£215m telecommunications
£70m office administrative, office support & other business support activities
£54m construction
£47m manufacture of motor vehicles, trailers & semi-trailers
£140m supplier spend with other sectors
•••••
Figure 4-9: Top five supplier sectors in the East of England by value of expenditure Source: BT Group Procurement data
1
2
3
4
5

35
BT Group’s spend with suppliers results in significant benefits for the East of England economy, including knock-on or multiplier benefits as a result of supplier spend. This is summarised below.
4
32,200FTE
Employment supportedamongst suppliers
£2,220million
£933million
£1,350million
Output generatedamongst suppliers
£££Income of supply chain employees
£££GVA generated in
the East of England
£££Figure 4-10: Indirect supply chain impact in the East of England Source: Hatch
BT Group supply chain spend in the East of England = £1,510 million
1
2
3
4
5
36
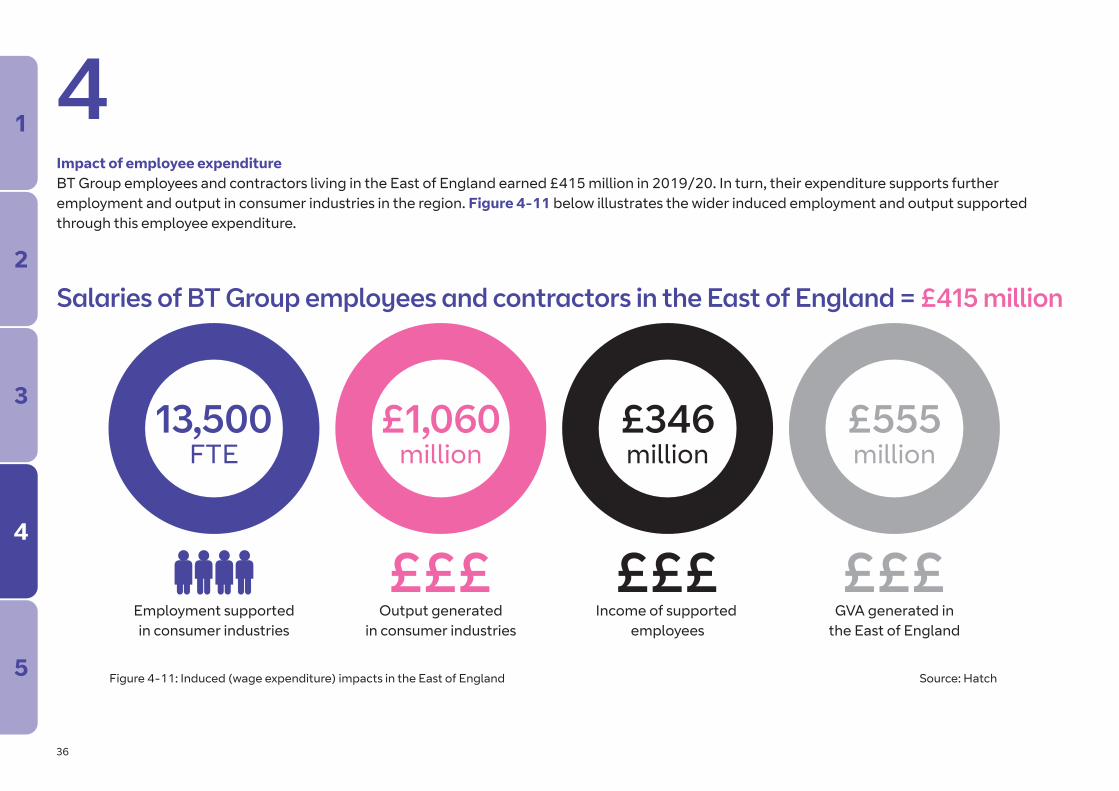
4Impact of employee expenditureBT Group employees and contractors living in the East of England earned £415 million in 2019/20. In turn, their expenditure supports further employment and output in consumer industries in the region. Figure 4-11 below illustrates the wider induced employment and output supported through this employee expenditure.
13,500FTE
Employment supportedin consumer industries
£1,060million
£346million
£555million
Output generatedin consumer industries
£££Income of supported
employees
£££GVA generated in
the East of England
£££Figure 4-11: Induced (wage expenditure) impacts in the East of England Source: Hatch
Salaries of BT Group employees and contractors in the East of England = £415 million
1
2
3
4
5
37
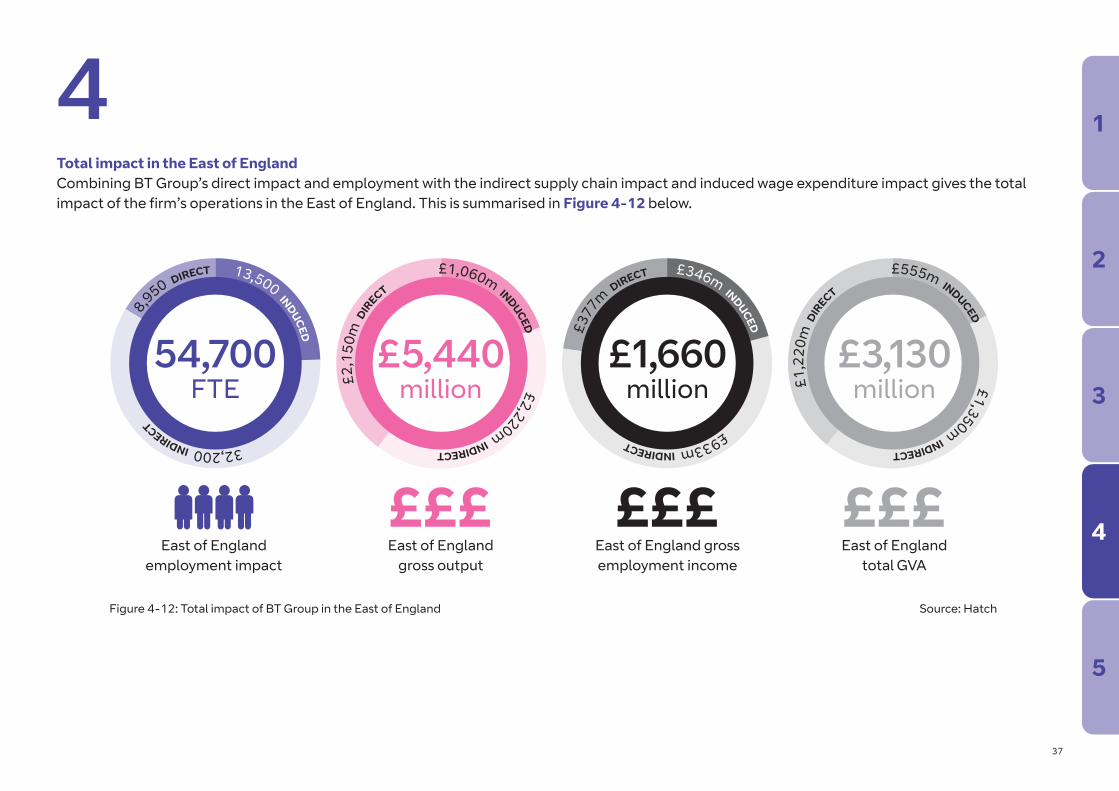
4Total impact in the East of England Combining BT Group’s direct impact and employment with the indirect supply chain impact and induced wage expenditure impact gives the total impact of the firm’s operations in the East of England. This is summarised in Figure 4-12 below.
East of Englandemployment impact
East of Englandgross output
£££East of England grossemployment income
£££East of England
total GVA
£££
£555m INDUCED
£346m INDUCED
£1,060m INDUCED
13,500 INDUCED
£1,350m INDIRECT
£933m INDIRECT
£2,220m INDIRECT32,200 INDIRECT
£1,2
20m
DIR
ECT
£377m DIRECT
£2,1
50m
DIR
ECT
8,950 DIRECT
£5,440million
£1,660million
£3,130million
54,700FTE
Figure 4-12: Total impact of BT Group in the East of England Source: Hatch
1
2
3
4
5

38
4Sub-regional impactThe table below illustrates the economic impact of BT Group at a sub-regional level in the East of England.
Table 4-5: County impact – East of England Source: Hatch
BT Group employees & contractors Total impact
Work in area Resident Employment Output GVA in area £ million £ million
Bedfordshire 610 860 2,050 234 134
Cambridgeshire 720 722 3,260 342 196
Essex 1,780 2,520 3,480 500 285
Hertfordshire 1,960 1,920 11,200 1,170 672
Norfolk 685 803 30,800 2,300 1,340
Suffolk 3,190 2,750 3,950 889 505
1
2
3
4
5

39
4Local Enterprise Partnerships (LEPs) are locally-owned partnerships between businesses and local authorities and are intended to play a central role in determining local economic priorities and undertaking activities to drive economic growth and the creation of local jobs. A total of five Local Enterprise Partnerships† fall in full or in part within the East of England region and the economic impacts which relate to these areas are shown below.
Table 4-6: LEP impact – East of England Source: Hatch
BT Group employees & contractors Total impact
Work in area Resident Employment Output GVA in area £ million £ million
Hertfordshire 1,960 1,920 11,200 1,170 672
New Anglia 3,880 3,560 34,800 3,190 1,840
Greater Cambridge & Greater Peterborough * 814 898 3,440 370 212
South East Midlands * 2,510 2,810 5,570 790 437
South East * 4,070 5,180 6,510 1,130 635
† The information provided on LEPs and Enterprise Zones is correct at the time of publication of this report (as at October 2020). We have used information published by the Office of National Statistics which is available at the following location: https://opendata.arcgis.com/datasets/a46c859088a94898a7c462eeffa0f31a_0.csvNote that in some cases part of the LEP areas fall outside of the region. These are marked with an asterix (*).
1
2
3
4
5

40
4Hertfordshire LEP £1 in every £60 of GVA in the area is supported by BT Group’s full economic impact
New Anglia LEP 1 in every 4 employees working in the IT and communications sector in the area are directly employed by BT Group
Greater Cambridge and Peterborough LEP 1 in every 28 employees working in the IT and communications sector in the area are directly employed by BT Group
South East Midlands LEP 1 in every 110 private sector employees working in the area is supported by BT Group’s full economic impact, and 1 in every 10 employees working in the IT and Communications sector are directly employed by BT Group
South East LEP 1 in every 10 employees working in the IT and communications sector in the area are directly employed by BT Group
1
2
3
4
5
41
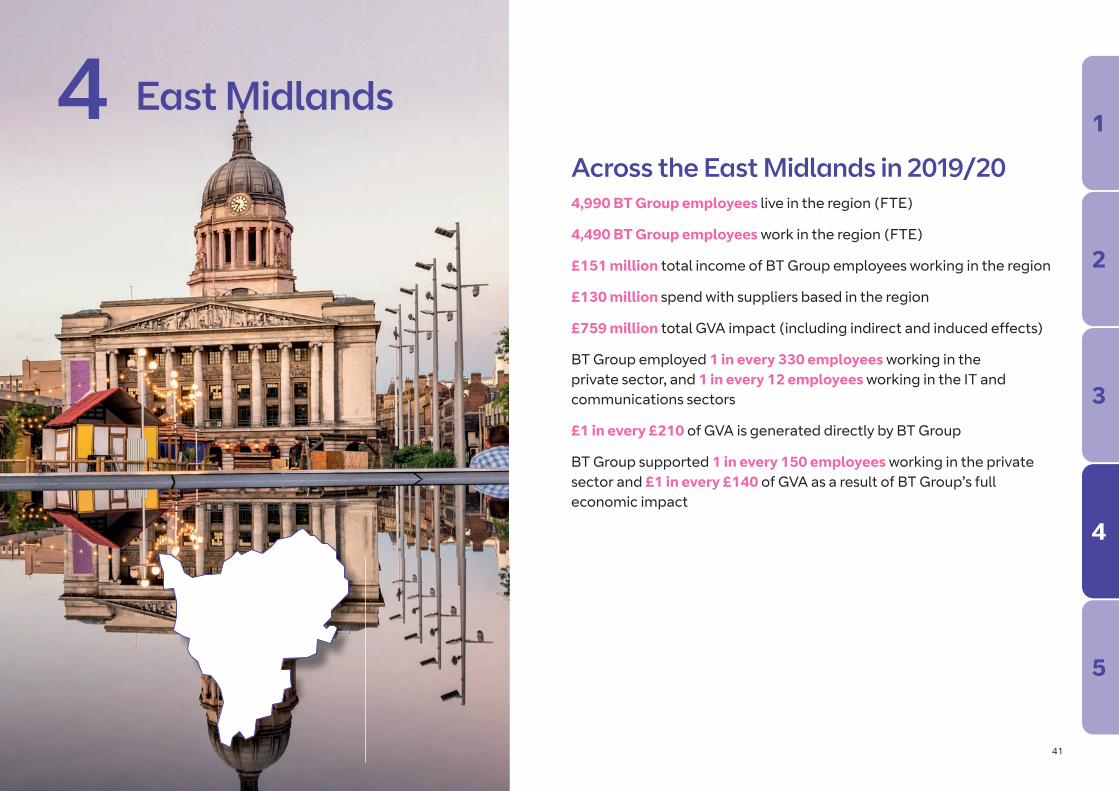
Across the East Midlands in 2019/20 4,990 BT Group employees live in the region (FTE)
4,490 BT Group employees work in the region (FTE)
£151 million total income of BT Group employees working in the region
£130 million spend with suppliers based in the region
£759 million total GVA impact (including indirect and induced effects)
BT Group employed 1 in every 330 employees working in the private sector, and 1 in every 12 employees working in the IT and communications sectors
£1 in every £210 of GVA is generated directly by BT Group
BT Group supported 1 in every 150 employees working in the private sector and £1 in every £140 of GVA as a result of BT Group’s full economic impact
4 East Midlands1
2
3
4
5

42
Regional impactsDirect impactBT Group directly employs a total of 3,750 people in the East Midlands region, with a further 738 employed as contractors. This results in £151 million in wages and salary spend across the region.
Procurement impactBT Group spent £130 million with suppliers based in the East Midlands in 2019/20. The majority was spent on telecommunications, as illustrated in the chart below.
4
Total spend
£130million
£27m telecommunications
£21m film, video, music & broadcasting activities
£10m construction
£9m computer programming, consultancy & related activities
£9m manufacture of machinery & equipment N.E.C
£54m supplier spend with other sectors
•••••
Figure 4-13: Top five supplier sectors in the East of Midlands by value of expenditure Source: BT Group Procurement data
1
2
3
4
5
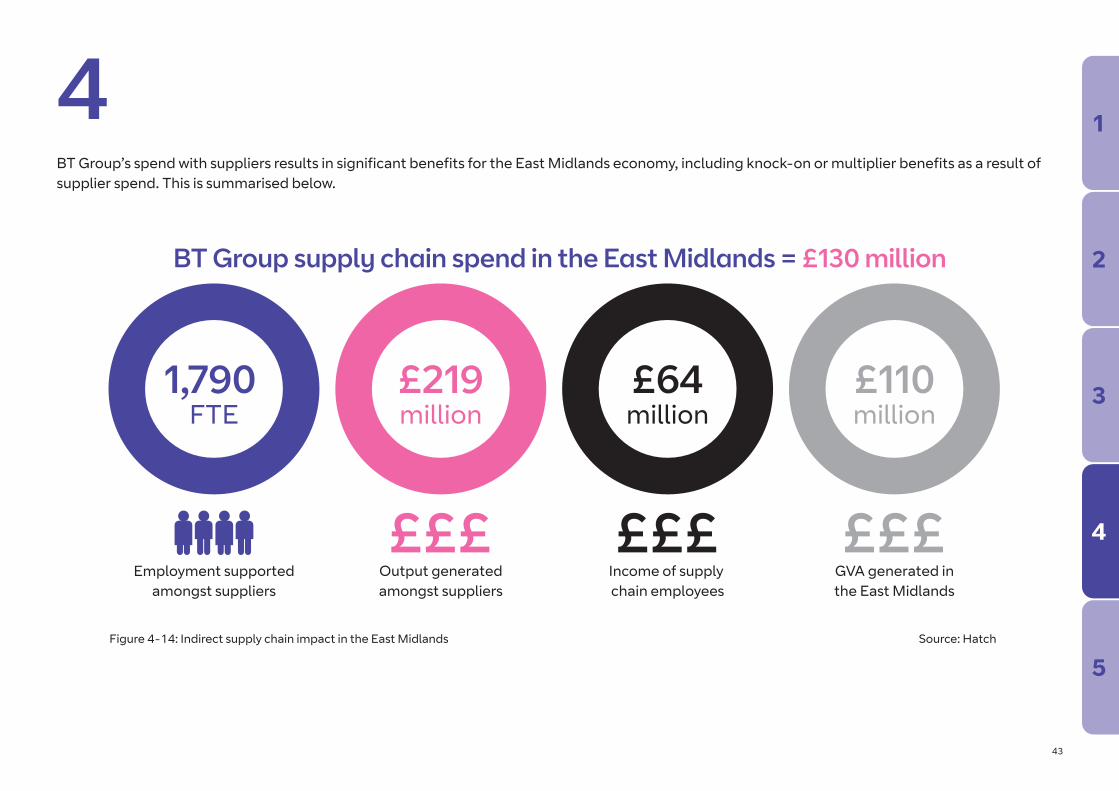
43
BT Group’s spend with suppliers results in significant benefits for the East Midlands economy, including knock-on or multiplier benefits as a result of supplier spend. This is summarised below.
4
1,790 FTE
Employment supportedamongst suppliers
£219million
£64million
£110million
Output generatedamongst suppliers
£££Income of supply chain employees
£££GVA generated inthe East Midlands
£££Figure 4-14: Indirect supply chain impact in the East Midlands Source: Hatch
BT Group supply chain spend in the East Midlands = £130 million
1
2
3
4
5
44
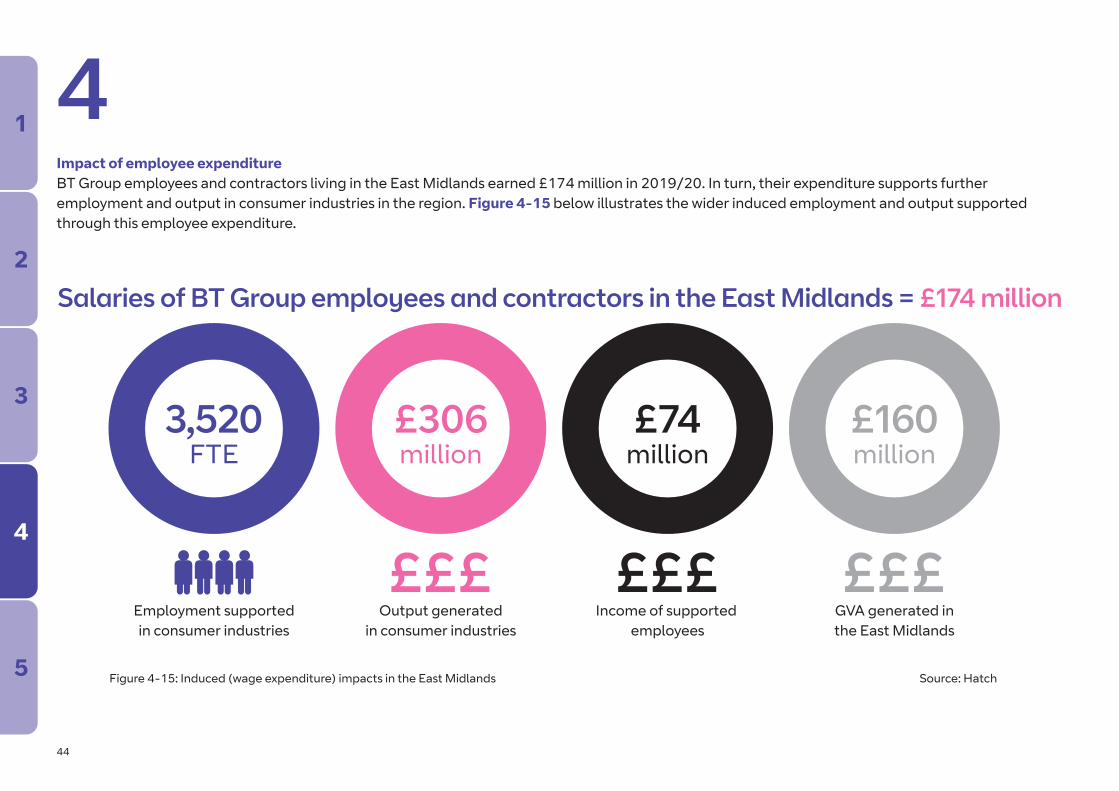
4Impact of employee expenditureBT Group employees and contractors living in the East Midlands earned £174 million in 2019/20. In turn, their expenditure supports further employment and output in consumer industries in the region. Figure 4-15 below illustrates the wider induced employment and output supported through this employee expenditure.
3,520FTE
Employment supportedin consumer industries
£306million
£74million
£160million
Output generatedin consumer industries
£££Income of supported
employees
£££GVA generated inthe East Midlands
£££Figure 4-15: Induced (wage expenditure) impacts in the East Midlands Source: Hatch
Salaries of BT Group employees and contractors in the East Midlands = £174 million
1
2
3
4
5

45
4Total impact in the East Midlands Combining BT Group’s direct impact and employment with the indirect supply chain impact and induced wage expenditure impact gives the total impact of the firm’s operations in the East Midlands. This is summarised in Figure 4-16 below.
East Midlandsemployment impact
East Midlandsgross output
£££East Midlands gross
employment income
£££East Midlands
total GVA
£££
£160m INDUCED
£74m INDUCED
£306m INDUCED
3,520 IND
UC
ED
£110m IN
DIRECT
£64m INDIRECT
£219m IN
DIRECT
1,790 INDIRECT£489m
DIR
ECT
£151m
DIR
ECT
£862m D
IREC
T
4,49
0 D
IREC
T
£1,390million
£289million
£759million
9,800FTE
Figure 4-16: Total impact of BT Group in the East Midlands Source: Hatch
1
2
3
4
5

46
4Sub-regional impactThe table below illustrates the economic impact of BT Group at a sub-regional level in the East Midlands.
Table 4-7: County impact – East Midlands Source: Hatch
BT Group employees & contractors Total impact
Work in area Resident Employment Output GVA in area £ million £ million
Derbyshire 927 1,040 1,680 268 148
Leicestershire 1,470 1,500 2,480 376 208
Lincolnshire 622 740 925 146 81
Northamptonshire 719 819 1,730 235 128
Nottinghamshire 737 870 2,900 353 189
1
2
3
4
5

47
4Local Enterprise Partnerships (LEPs) are locally-owned partnerships between businesses and local authorities and play a central role in determining local economic priorities and undertaking activities to drive economic growth and the creation of local jobs. A total of five Local Enterprise Partnerships† fall in full or in part within the East Midlands region and the economic impacts which relate to these areas are shown below.
Table 4-8: LEP impact – East Midlands Source: Hatch
BT Group employees & contractors Total impact
Work in area Resident Employment Output GVA in area £ million £ million
South East Midlands 2,510 2,810 5,570 790 437
Greater Cambridge & Greater Peterborough 814 898 3,440 370 212
Leicester & Leicestershire 1,470 1,500 2,480 376 208
Derby, Derbyshire, Nottingham & Nottinghamshire 1,660 1,910 4,580 622 337
Greater Lincolnshire 792 951 1,110 184 102
Note: The Greater Cambridge and Greater Peterborough, Greater Lincolnshire and South East Midlands LEP areas are not wholly contained within the East Midlands region.
† The information provided on LEPs and Enterprise Zones is correct at the time of publication of this report (as at October 2020). We have used information published by the Office of National Statistics which is available at the following location: https://opendata.arcgis.com/datasets/a46c859088a94898a7c462eeffa0f31a_0.csvNote that in some cases part of the LEP areas fall outside of the region. These are marked with an asterix (*).
1
2
3
4
5

48
4South East Midlands LEP 1 in every 120 employees working in the area is supported by BT Group’s full economic impact
Greater Cambridge & 1 in every 28 employees working in the IT and communications sector in the area are directly employed by Greater Peterborough LEP BT Group
Leicester & Leicestershire LEP 1 in every 8 employees working in the IT and communications sector in the area are directly employed by BT Group
Derby, Derbyshire, Nottingham & 1 in every 16 employees working in the IT and communications sector in the area are directly employed by Nottinghamshire LEP BT Group
Greater Lincolnshire LEP 1 in every 8 employees working in the IT and communications sector in the area are directly employed by BT Group
1
2
3
4
5
49
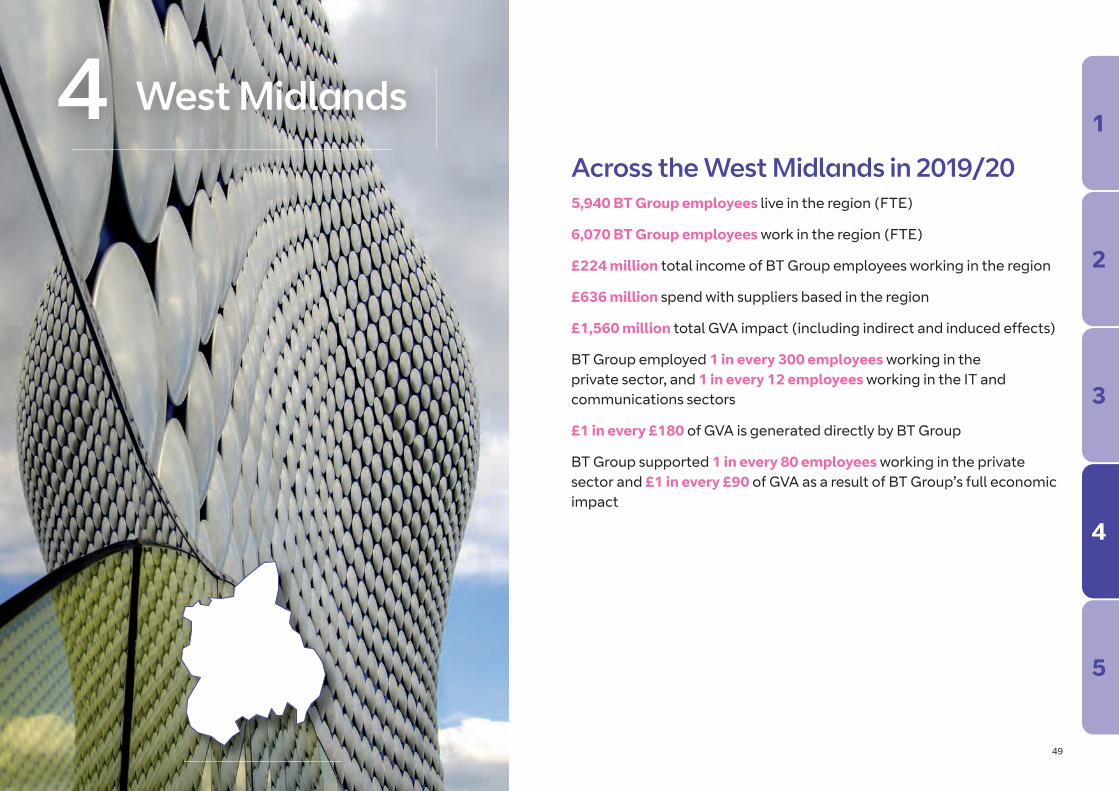
Across the West Midlands in 2019/20 5,940 BT Group employees live in the region (FTE)
6,070 BT Group employees work in the region (FTE)
£224 million total income of BT Group employees working in the region
£636 million spend with suppliers based in the region
£1,560 million total GVA impact (including indirect and induced effects)
BT Group employed 1 in every 300 employees working in the private sector, and 1 in every 12 employees working in the IT and communications sectors
£1 in every £180 of GVA is generated directly by BT Group
BT Group supported 1 in every 80 employees working in the private sector and £1 in every £90 of GVA as a result of BT Group’s full economic impact
4 West Midlands1
2
3
4
5

50
Regional impactsDirect impactBT Group directly employs a total of 5,470 people in the West Midlands region, with a further 600 employed as contractors. These employees earned £224 million in wages and salaries.
Procurement impactBT Group spent £636 million with suppliers based in the West Midlands in 2019/20. The largest single item was repair and maintenance of aircraft and spacecraft, as illustrated in the chart below.
4
Total spend
£636million
£287m repair and maintenance of aircraft & spacecraft
£133m wholesale/retail/repair of motor vehicles & motorcycles
£56m employment activities
£34m telecommunications
£20m construction
£106m supplier spend with other sectors
•••••
Figure 4-17: Top five supplier sectors in the West of Midlands by value of expenditure Source: BT Group Procurement data
1
2
3
4
5

51
BT Group’s spend with suppliers results in significant benefits for the West Midlands economy, including knock-on or multiplier benefits as a result of supplier spend. This is summarised below.
4
11,100FTE
Employment supportedamongst suppliers
£1,120million
£345million
£526million
Output generatedamongst suppliers
£££Income of supply chain employees
£££GVA generated in
the West Midlands
£££Figure 4-18: Indirect supply chain impact in the West Midlands Source: Hatch
BT Group supply chain spend in the West Midlands = £636 million
1
2
3
4
5

52
4Impact of employee expenditureBT Group employees and contractors living in the West Midlands earned £219 million in 2019/20. In turn, their expenditure supports further employment and output in consumer industries in the region. Figure 4-19 below illustrates the wider induced employment and output supported through this employee expenditure.
4,450 FTE
Employment supportedin consumer industries
£586million
£143million
£309million
Output generatedin consumer industries
£££Income of supported
employees
£££GVA generated in
the West Midlands
£££Figure 4-19: Induced (wage expenditure) impacts in the West Midlands Source: Hatch
Salaries of BT Group employees and contractors in the West Midlands = £219 million
1
2
3
4
5

53
4Total impact in the West Midlands Combining BT Group’s direct impact and employment with the indirect supply chain impact and induced wage expenditure impact gives the total impact of the firm’s operations in the West Midlands. This is summarised in Figure 4-20 below.
West Midlandsemployment impact
West Midlandsgross output
£££West Midlands grossemployment income
£££West Midlands
total GVA
£££
£309m INDUCED
£143m INDUCED
£586m INDUCED
4,450 INDUCED
£526m INDIRECT
£345m INDIRECT
£1,120m
INDIRECT
11,100 INDIRECT
£725
m D
IREC
T
£224
m D
IRECT
£1,2
80m
DIR
ECT
6,07
0 DIR
ECT
£2,980million
£711million
£1,560million
21,700FTE
Figure 4-20: Total impact of BT Group in the West Midlands Source: Hatch
1
2
3
4
5

54
4Sub-regional impactThe table below illustrates the economic impact BT Group has at a sub-regional level in the West Midlands, focusing on key counties and areas across the region.
Table 4-9: County impact – West Midlands Source: Hatch
BT Group employees & contractors Total impact
Work in area Resident Employment Output GVA in area £ million £ million
Birmingham 1,730 1,150 2,680 480 264
Coventry 489 336 638 123 68
Herefordshire 228 245 355 60 33
Shropshire 784 746 1,010 201 112
Solihull 395 311 4,790 569 286
Staffordshire 827 1,080 1,370 220 120
Warwickshire 213 516 7,710 864 427
Worcestershire 392 543 677 112 61
1
2
3
4
5

55
4Local Enterprise Partnerships (LEPs) are locally-owned partnerships between businesses and local authorities and play a central role in determining local economic priorities and undertaking activities to drive economic growth and the creation of local jobs. A total of six Local Enterprise Partnerships†
fall in full within the West Midlands region and the economic impacts which relate to these areas are shown below.
Table 4-10: LEP impact – West Midlands Source: Hatch
BT Group employees & contractors Total impact
Work in area Resident Employment Output GVA in area £ million £ million
Marches 1,010 992 1,360 262 145
Stoke & Staffordshire 827 1,080 1,370 220 120
Greater Birmingham & Solihull 2,450 2,070 8,030 1,140 601
Coventry & Warwickshire 702 853 8,350 987 495
Black Country 1,010 1,020 2,420 353 188
Worcestershire 392 543 677 112 61
† The information provided on LEPs and Enterprise Zones is correct at the time of publication of this report (as at October 2020). We have used information published by the Office of National Statistics which is available at the following location: https://opendata.arcgis.com/datasets/a46c859088a94898a7c462eeffa0f31a_0.csvNote that in some cases part of the LEP areas fall outside of the region. These are marked with an asterix (*).
1
2
3
4
5

56
4Marches LEP 1 in every 8 employees working in the IT and communications sector in the area are directly employed by
BT Group
Stoke and Staffordshire LEP £1 in every £260 of GVA in the area is generated directly by BT Group
Greater Birmingham and Solihull LEP 1 in every 10 employees working in the IT and communications sector in the area are directly employed by BT Group
Coventry and Warwickshire LEP 1 in every 22 employees working in the IT and communications sector in the area are directly employed by BT Group
Black Country LEP 1 in every 6 employees working in the IT and communications sector in the area are directly employed by BT Group
Worcestershire LEP 1 in every 20 employees working in the IT and communications sector in the area are directly employed by BT Group
1
2
3
4
5

57
Across the North of England in 2019/2025,500 BT Group employees live in the region (FTE)
25,700 BT Group employees work in the region (FTE)
£813 million total income of BT Group employees working in the region
£876 million spend with suppliers based in the region
£4,150 million total GVA impact (including indirect and induced effects)
BT Group employed 1 in every 180 employees working in the private sector, and 1 in every 6 employees working in the IT and communications sectors
£1 in every £130 of GVA is generated directly by BT Group
BT Group supported 1 in every 90 employees working in the private sector and £1 in every £80 of GVA as a result of BT Group’s full economic impact
4 North of England
NorthEast
NorthWest
Yorkshire &The Humber
1
2
3
4
5

58
Across the North East in 2019/20 9,280 BT Group employees live in the region (FTE)
9,290 BT Group employees work in the region (FTE)
£262 million total income of BT Group employees working in the region
£41 million spend with suppliers based in the region
£1,090 million total GVA impact (including indirect and induced effects)
BT Group employed 1 in every 70 employees working in the private sector, and 1 in every 4 employees working in the IT and communications sectors
£1 in every £60 of GVA is generated directly by BT Group
BT Group supported 1 in every 50 employees working in the private sector and £1 in every £50 of GVA as a result of BT Group’s full economic impact
4 North East1
2
3
4
5

59
Regional impactsDirect impactBT Group directly employs a total of 8,170 people in the North East region, with a further 1,110 employed as contractors. This results in £262 million in wages and salary spend across the region.
Procurement impactBT Group spent around £41 million with suppliers based in the North East in 2019/20. The majority was spent on construction, as illustrated in the chart below.
4
Total spend
£41million
£19m construction
£6m office administrative, office support & other business support activities
£5m telecommunications
£3m computer programming, consultancy & related activities
£2m other professional, scientific & technical activities
£6m supplier spend with other sectors
•••••
Figure 4-21: Top five supplier sectors in the North East by value of expenditure Source: BT Group Procurement data
1
2
3
4
5

60
BT Group’s spend with suppliers results in significant benefits for the North East economy, including knock-on or multiplier benefits as a result of supplier spend. This is summarised below.
4
522FTE
Employment supportedamongst suppliers
£72million
£6million
£34million
Output generatedamongst suppliers
£££Income of supply chain employees
£££GVA generated in
the North East
£££Figure 4-22: Indirect supply chain impact in the North East Source: Hatch
BT Group supply chain spend in the North East = £41 million
1
2
3
4
5

61
4Impact of employee expenditureBT Group employees and contractors living in the North East earned £262 million in 2019/20. In turn, their expenditure supports further employment and output in consumer industries in the region. Figure 4-23 below illustrates the wider induced employment and output supported through this employee expenditure.
3,880FTE
Employment supportedin consumer industries
£401million
£107million
£205million
Output generatedin consumer industries
£££Income of supported
employees
£££GVA generated in
the North East
£££Figure 4-23: Induced (wage expenditure) impacts in the North East Source: Hatch
Salaries of BT Group employees and contractors in the North East = £262 million
1
2
3
4
5

62
4Total impact in the North East Combining BT Group’s direct impact and employment with the indirect supply chain impact and induced wage expenditure impact gives the total impact of the firm’s operations in the North East. This is summarised in Figure 4-24 below.
North Eastemployment impact
North Eastgross output
£££North East gross
employment income
£££North Easttotal GVA
£££
£205m INDUCED
£107m INDU
CED
£401m INDUCED
3,880 INDU
CED *
*
*
*
£849m DIRECT
£262m D
IREC
T
£1,500m DIR
ECT
9,290 DIR
ECT
£1,970million
£375million
£1,090million
13,700FTE
* 522 INDIRECT
* £72mINDIRECT
* £6mINDIRECT
* £34mINDIRECT
Figure 4-24: Total impact of BT Group in the North East Source: Hatch
1
2
3
4
5

63
4Sub-regional impactThe table below illustrates the impact BT Group has at a sub-regional level in the North East.
Table 4-11: County impact – North East Source: Hatch
BT Group employees & contractors Total impact
Work in area Resident Employment Output GVA in area £ million £ million
Durham 102 1,120 479 60 31
Northumberland 101 994 170 27 15
Tyne and Wear 6,410 4,990 7,450 1,150 645
Tees Valley 2,680 2,180 5,590 735 397
1
2
3
4
5

64
4Local Enterprise Partnerships (LEPs) are locally-owned partnerships between businesses and local authorities and play a central role in determining local economic priorities and undertaking activities to drive economic growth and the creation of local jobs. Two Local Enterprise Partnerships† fall within the North East region and the economic impacts that relate to these areas are shown below.
Table 4-12: LEP impact – North East Source: Hatch
BT Group employees & contractors Total impact
Work in area Resident Employment Output GVA in area £ million £ million
Tees Valley 2,680 2,180 5,590 735 397
North Eastern 6,610 7,100 8,100 1,240 691
† The information provided on LEPs and Enterprise Zones is correct at the time of publication of this report (as at October 2020). We have used information published by the Office of National Statistics which is available at the following location: https://opendata.arcgis.com/datasets/a46c859088a94898a7c462eeffa0f31a_0.csvNote that in some cases part of the LEP areas fall outside of the region. These are marked with an asterix (*).
Tees Valley LEP 1 in 2 employees working in the IT and communications sector in the area are directly employed by BT Group
North Eastern LEP 1 in 4 employees working in the IT and communications sector in the area are directly employed by BT Group
1
2
3
4
5

65
Across the North West in 2019/20 9,690 BT Group employees live in the region (FTE)
9,720 BT Group employees work in the region (FTE)
£322 million total income of BT Group employees working in the region
£410 million spend with suppliers based in the region
£1,710 million total GVA impact (including indirect and induced effects)
BT Group employed 1 in every 240 employees working in the private sector, and 1 in every 8 employees working in the IT and communications sectors
£1 in every £160 of GVA is generated directly by BT Group
BT Group supported 1 in every 120 employees working in the private sector and £1 in every £100 of GVA as a result of BT Group’s full economic impact
4 North West1
2
3
4
5

66
Regional impactsDirect impactBT Group directly employs a total of 8,280 people in the North West region, with a further 1,440 employed as contractors. These employees earned £322 million in wages and salaries.
Procurement impactBT Group spent around £410 million with suppliers based in the North West in 2019/20. The majority was spent on telecommunications, as illustrated in the chart below.
4
Total spend
£410million
£181m telecommunications
£31m rental & leasing activities
£31m manufacture of electrical equipment
£29m other professional, scientific & technical activities
£23m repair and maintenance of aircraft & spacecraft
£115m supplier spend with other sectors
•••••
Figure 4-25: Top five supplier sectors in the North West by value of expenditure Source: BT Group Procurement data
1
2
3
4
5

67
BT Group’s spend with suppliers results in significant benefits for the North West economy, including knock-on or multiplier benefits as a result of supplier spend. This is summarised below.
4
5,420FTE
Employment supportedamongst suppliers
£663million
£195million
£338million
Output generatedamongst suppliers
£££Income of supply chain employees
£££GVA generated in
the North West
£££Figure 4-26: Indirect supply chain impact in the North West Source: Hatch
BT Group supply chain spend in the North West = £410 million
1
2
3
4
5

68
4Impact of employee expenditureBT Group employees and contractors living in the North West earned £322 million in 2019/20. In turn, their expenditure supports further employment and output in consumer industries in the region. Figure 4-27 below illustrates the wider induced employment and output supported through this employee expenditure.
4,650FTE
Employment supportedin consumer industries
£625million
£151million
£329million
Output generatedin consumer industries
£££Income of supported
employees
£££GVA generated in
the North West
£££Figure 4-27: Induced (wage expenditure) impacts in the North West Source: Hatch
Salaries of BT Group employees and contractors in the North West = £322 million
1
2
3
4
5

69
4Total impact in the North West Combining BT Group’s direct impact and employment with the indirect supply chain impact and induced wage expenditure impact gives the total impact of BT Group’s operations in the North West. This is summarised in Figure 4-28 below.
North Westemployment impact
North Westgross output
£££North West gross
employment income
£££North West
total GVA
£££
£329m INDUCED
£151m INDUCED
£625m INDUCED
4,650 INDUCED £338m IN
DIRECT
£195m INDIRECT
£663m IN
DIRECT
5,420 INDIRECT£1,0
40m D
IREC
T
£322
m D
IREC
T
£1,840
m D
IREC
T
9,72
0 D
IREC
T
£3,130million
£668million
£1,710million
19,800FTE
Figure 4-28: Total impact of BT Group in the North West Source: Hatch
1
2
3
4
5

70
4Sub-regional impactThe table below illustrates the economic impact of BT Group at a sub-regional level in the North West, focusing on key local authorities and areas across the region.
Table 4-13: County impact – North West Source: Hatch
BT Group employees & contractors Total impact
Work in area Resident Employment Output GVA in area £ million £ million
Cheshire East 147 236 408 62 34
Cheshire West & Chester 314 293 497 91 51
Cumbria 397 411 422 83 47
Greater Manchester 4,020 3,950 7,470 1,230 674
Lancashire 1,980 2,030 3,320 529 292
Merseyside 1,880 2,070 5,430 814 439
Warrington 955 468 2,150 307 167
1
2
3
4
5

71
4Local Enterprise Partnerships (LEPs) are locally-owned partnerships between businesses and local authorities and play a central role in determining local economic priorities and undertaking activities to drive economic growth and the creation of local jobs. A total of five Local Enterprise Partnerships† fall within the North West region and the economic impacts which relate to these areas are shown below.
Table 4-14: LEP impact – North West Source: Hatch
BT Group employees & contractors Total impact
Work in area Resident Employment Output GVA in area £ million £ million
Lancashire 1,980 2,030 3,320 529 292
Cheshire & Warrington 1,420 997 3,060 461 251
Liverpool City region 1,900 2,300 5,520 828 447
Cumbria 397 411 422 83 47
Greater Manchester 4,020 3,950 7,470 1,230 674
† The information provided on LEPs and Enterprise Zones is correct at the time of publication of this report (as at October 2020). We have used information published by the Office of National Statistics which is available at the following location: https://opendata.arcgis.com/datasets/a46c859088a94898a7c462eeffa0f31a_0.csvNote that in some cases part of the LEP areas fall outside of the region. These are marked with an asterix (*).
1
2
3
4
5

72
4Lancashire LEP 1 in every 6 employees working in the IT and communications sector in the area are directly employed by
BT Group
Cheshire and Warrington LEP £1 in every £130 of GVA in the area is generated by BT Group’s full economic impact
Liverpool City Region LEP 1 in every 6 employees working in the IT and communications sector in the area are directly employed by BT Group
Cumbria LEP 1 in every 6 employees working in the IT and communications sector in the area are directly employed by BT Group
Greater Manchester LEP 1 in every 10 employees working in the IT and communications sector in the area are directly employed by BT Group
1
2
3
4
5

73
Across Yorkshire & The Humber in 2019/20 6,550 BT Group employees live in the region (FTE)
6,660 BT Group employees work in the region (FTE)
£229 million total income of BT Group employees working in the region
£424 million spend with suppliers based in the region
£1,350 million total GVA impact (including indirect and induced effects)
BT Group employed 1 in every 250 employees working in the private sector, and 1 in every 10 employees working in the IT and communications sectors
£1 in every £160 of GVA is generated directly by BT Group
BT Group supported 1 in every 100 employees working in the private sector and £1 in every £90 of GVA as a result of BT Group’s full economic impact
4 Yorkshire & The Humber 1
2
3
4
5

74
Regional impactsDirect impactBT Group directly employs a total of 6,160 people in the Yorkshire & The Humber region, with a further 500 employed as contractors. These employees earned £229 million in wages and salaries.
Procurement impactBT Group spent £424 million with suppliers based in Yorkshire & The Humber in 2019/20. The majority was spent on telecommunications, as illustrated in the chart below.
4
Total spend
£424million
£151m telecommunications
£82m manufacture of computer, electronic & optical products
£41m computer programming, consultancy & related activities
£31m construction
£26m buying and selling, renting & operating of own or leased real estate (exc. imputed rent)
£93m supplier spend with other sectors
•••••
Figure 4-29: Top five supplier sectors in Yorkshire & The Humber by value of expenditure Source: BT Group Procurement data
1
2
3
4
5

75
BT Group’s spend with suppliers results in significant benefits for the Yorkshire & The Humber economy, including knock-on or multiplier benefits as a result of supplier spend. This is summarised below.
4
5,510FTE
Employment supportedamongst suppliers
£713million
£203million
£352million
Output generatedamongst suppliers
£££Income of supply chain employees
£££GVA generated in
Yorkshire & The Humber
£££Figure 4-30: Indirect supply chain impact in Yorkshire & The Humber Source: Hatch
BT Group supply chain spend in Yorkshire & The Humber = £424 million
1
2
3
4
5

76
4Impact of employee expenditureBT Group employees and contractors living in Yorkshire & The Humber earned £225 million in 2019/20. In turn, their expenditure supports further employment and output in consumer industries in the region. Figure 4-31 below illustrates the wider induced employment and output supported through this employee expenditure.
3,640FTE
Employment supportedin consumer industries
£403million
£118million
£253million
Output generatedin consumer industries
£££Income of supported
employees
£££GVA generated in
Yorkshire & The Humber
£££Figure 4-31: Induced (wage expenditure) impacts in Yorkshire & The Humber Source: Hatch
Salaries of BT Group employees and contractors in Yorkshire & The Humber = £225 million
1
2
3
4
5

77
4Total impact in Yorkshire & The Humber Combining BT Group’s direct impact and employment with the indirect supply chain impact and induced wage expenditure impact gives the total impact of the firm’s operations in Yorkshire & The Humber. This is summarised in Figure 4-32 below.
Yorkshire & The Humberemployment impact
Yorkshire & The Humbergross output
£££Yorkshire & The Humber
gross employment income
£££Yorkshire & The Humber
total GVA
£££
£253m INDUCED
£118m INDUCED
£403m INDUCED
3,640 INDUCED
£352m IN
DIRECT£203m INDIRECT
£713m IN
DIRECT
5,510 INDIRECT
£741m
DIR
ECT
£229
m D
IRECT
£1,310
m D
IREC
T
6,66
0 D
IREC
T
£2,420million
£550million
£1,350million
15,800FTE
Figure 4-32: Total impact of BT Group in Yorkshire & The Humber Source: Hatch
1
2
3
4
5
78
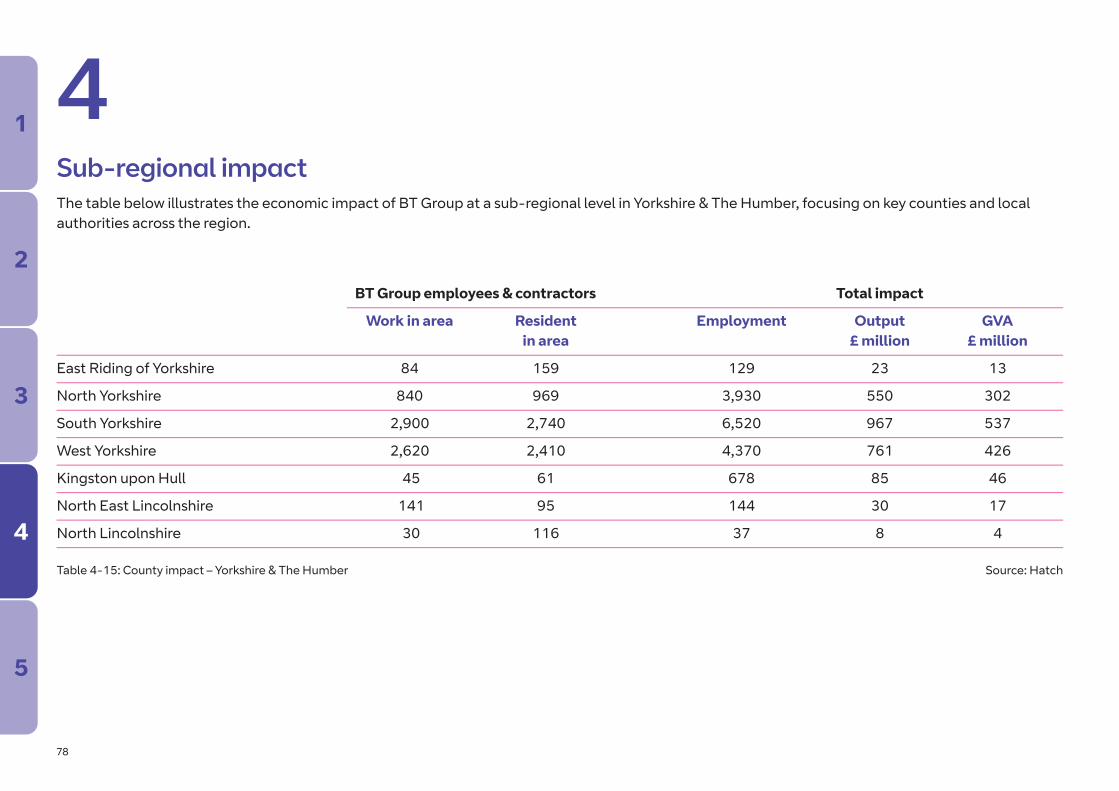
4Sub-regional impactThe table below illustrates the economic impact of BT Group at a sub-regional level in Yorkshire & The Humber, focusing on key counties and local authorities across the region.
Table 4-15: County impact – Yorkshire & The Humber Source: Hatch
BT Group employees & contractors Total impact
Work in area Resident Employment Output GVA in area £ million £ million
East Riding of Yorkshire 84 159 129 23 13
North Yorkshire 840 969 3,930 550 302
South Yorkshire 2,900 2,740 6,520 967 537
West Yorkshire 2,620 2,410 4,370 761 426
Kingston upon Hull 45 61 678 85 46
North East Lincolnshire 141 95 144 30 17
North Lincolnshire 30 116 37 8 4
1
2
3
4
5

79
4Local Enterprise Partnerships (LEPs) are locally-owned partnerships between businesses and local authorities and play a central role in determining local economic priorities and undertaking activities to drive economic growth and the creation of local jobs. A total of five Local Enterprise Partnerships† fall in full within the Yorkshire & The Humber region and the economic impacts which relate to these areas are shown below.
Table 4-16: LEP impact – Yorkshire & The Humber Source: Hatch
BT Group employees & contractors Total impact
Work in area Resident Employment Output GVA in area £ million £ million
Greater Lincolnshire * 792 951 1,110 184 102
Humber 299 430 988 145 80
Leeds City region 3,100 2,930 7,910 1,240 690
York & North Yorkshire 840 969 3,930 550 302
Sheffield City region 2,900 2,740 6,520 967 537
† The information provided on LEPs and Enterprise Zones is correct at the time of publication of this report (as at October 2020). We have used information published by the Office of National Statistics which is available at the following location: https://opendata.arcgis.com/datasets/a46c859088a94898a7c462eeffa0f31a_0.csvNote that in some cases part of the LEP areas fall outside of the region. These are marked with an asterix (*).
1
2
3
4
5
80
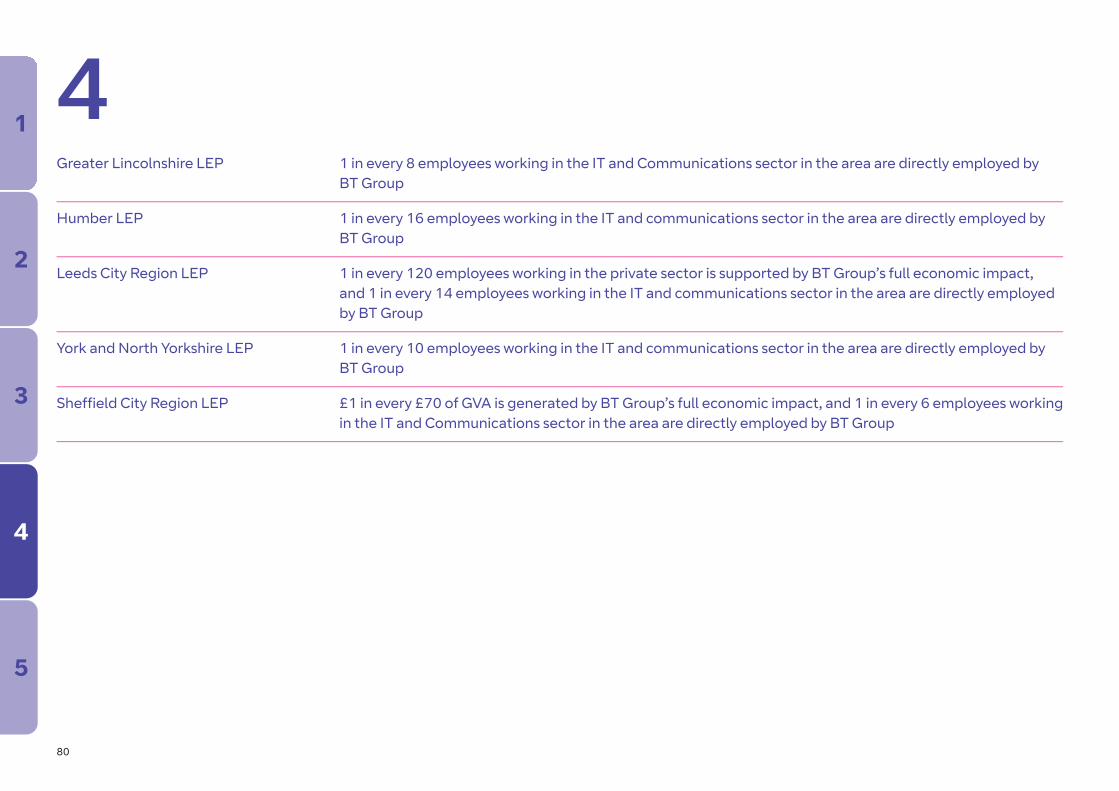
4Greater Lincolnshire LEP 1 in every 8 employees working in the IT and Communications sector in the area are directly employed by
BT Group
Humber LEP 1 in every 16 employees working in the IT and communications sector in the area are directly employed by BT Group
Leeds City Region LEP 1 in every 120 employees working in the private sector is supported by BT Group’s full economic impact, and 1 in every 14 employees working in the IT and communications sector in the area are directly employed by BT Group
York and North Yorkshire LEP 1 in every 10 employees working in the IT and communications sector in the area are directly employed by BT Group
Sheffield City Region LEP £1 in every £70 of GVA is generated by BT Group’s full economic impact, and 1 in every 6 employees working in the IT and Communications sector in the area are directly employed by BT Group
1
2
3
4
5

81
Across the South West in 2019/20 8,350 BT Group employees live in the region (FTE)
8,560 BT Group employees work in the region (FTE)
£321 million total income of BT Group employees working in the region
£634 million spend with suppliers based in the region
£1,840 million total GVA impact (including indirect and induced effects)
BT Group employed 1 in every 200 employees working in the private sector, and 1 in every 8 employees working in the IT and communications sectors
£1 in every £130 of GVA is generated directly by BT Group
BT Group supported 1 in every 100 employees working in the private sector and £1 in every £75 of GVA as a result of BT Group’s full economic impact
4 South West1
2
3
4
5

82
Regional impactsDirect impactBT Group directly employs a total of 8,050 people in the South West, with a further 511 employed as contractors. These employees earned £321 million in wages and salaries.
Procurement impactBT Group together spent £634 million with suppliers based in the South West in 2019/20. The largest item of expenditure was on telecommunications, as illustrated in the chart below.
4
Total spend
£634million
£237m telecommunications
£231m electric power generation, transmission & distribution
£56m computer programming, consultancy & related activities
£24m wholesale trade, except of motor vehicles & motorcycles
£16m other personal service activities
£70m supplier spend with other sectors
•••••
Figure 4-33: Top five supplier sectors in the South West by value of expenditure Source: BT Group Procurement data
1
2
3
4
5

83
BT Group’s spend with suppliers results in significant benefits for the South West’s economy, including knock-on or multiplier benefits as a result of supplier spend. This is summarised below.
4
4,770FTE
Employment supportedamongst suppliers
£1,230million
£232million
£470million
Output generatedamongst suppliers
£££Income of supply chain employees
£££GVA generated in
the South West
£££Figure 4-34: Indirect supply chain impact in the South West Source: Hatch
BT Group supply chain spend in the South West = £634 million
1
2
3
4
5

84
4Impact of employee expenditureBT Group employees and contractors living in the South West earned £313 million in 2019/20. In turn, their expenditure supports further employment and output in consumer industries in the region. Figure 4-35 below illustrates the wider induced employment and output supported through this employee expenditure.
4,410FTE
Employment supportedin consumer industries
£630million
£147million
£326million
Output generatedin consumer industries
£££Income of supported
employees
£££GVA generated in
the South West
£££Figure 4-35: Induced (wage expenditure) impacts in the South West Source: Hatch
Salaries of BT Group employees and contractors in the South West = £313 million
1
2
3
4
5

85
4Total impact in South WestCombining BT Group’s direct impact and employment with the indirect supply chain impact and induced wage expenditure impact gives the total impact of the firm’s operations in the South West. This is summarised in Figure 4-36 below.
South Westemployment impact
South Westgross output
£££South West gross
employment income
£££South West
total GVA
£££
£326m INDUCED
£147m INDUCED
£630m INDUCED
4,410 INDUCED
£470m IN
DIRECT
£232m INDIRECT
£1,230m INDIRECT
4,770 INDIRECT
£1,040
m D
IREC
T
£321
m D
IREC
T
£1,840m D
IREC
T
8,56
0 D
IREC
T
£3,700million
£700million
£1,840million
17,700FTE
Figure 4-36: Total impact of BT Group in the South West Source: Hatch
1
2
3
4
5

86
4Sub-regional impactThe table below illustrates the economic impact BT Group has at a sub-regional level in the South West, focusing on key counties and local authority areas.
Table 4-17: Sub-regional impact - South West Source: Hatch
BT Group employees & contractors Total impact
Work in area Resident Employment Output GVA in area £ million £ million
Bristol 1,070 795 1,210 296 164
Cornwall & the Isles of Scilly 638 732 664 130 73
Devon 2,720 2,450 2,840 490 274
Dorset 464 532 862 184 93
Gloucestershire 2,420 1,850 6,820 1,500 728
Somerset 656 1,120 960 200 105
Wiltshire 594 880 4,370 894 401
1
2
3
4
5

87
4Local Enterprise Partnerships (LEPs) are locally-owned partnerships between businesses and local authorities and play a central role in determining local economic priorities and undertaking activities to drive economic growth and the creation of local jobs. A total of six Local Enterprise Partnerships†
fall within the South West region and the economic impacts which relate to these areas are shown below.
Table 4-18: LEP impact – South West Source: Hatch
BT Group employees & contractors Total impact
Work in area Resident Employment Output GVA in area £ million £ million
West of England 3,170 2,530 7,070 1,590 793
Dorset 464 532 862 184 93
Cornwall & the Isles of Scilly 638 732 664 130 73
Heart of the South West 3,130 2,990 3,410 610 338
Swindon & Wiltshire 594 880 4,370 894 401
Gloucestershire 560 694 1,350 287 141
† The information provided on LEPs and Enterprise Zones is correct at the time of publication of this report (as at October 2020). We have used information published by the Office of National Statistics which is available at the following location: https://opendata.arcgis.com/datasets/a46c859088a94898a7c462eeffa0f31a_0.csvNote that in some cases part of the LEP areas fall outside of the region. These are marked with an asterix (*).
1
2
3
4
5

88
4West of England LEP £1 in every £5 of GVA in the IT and communications sector in the area is generated directly by BT Group
Dorset LEP £1 in every £12 of GVA in the IT and communications sector in the area is generated directly by BT Group
Cornwall and Isles of Scilly LEP 1 in every 6 employees working in the IT and communications sector in the area are directly employed by BT Group
Heart of the South West LEP £1 in every £4 of GVA in the IT and communications sector in the area is generated directly by BT Group
Swindon and Wiltshire LEP £1 in every £50 of GVA in the area is supported by BT Group’s full economic impact
Gloucestershire LEP £1 in every £15 of GVA in the IT and communications sector in the area is generated directly by BT Group
1
2
3
4
5

89
Across Scotland in 2019/207,480 BT Group employees live in the nation (FTE)
7,440 BT Group employees work in the nation (FTE)
£254 million total income of BT Group employees working in the nation
£167 million spend with suppliers based in the nation
£1,210 million total GVA impact (including indirect and induced effects)
BT Group employed 1 in every 220 employees working in the private sector, and 1 in every 10 employees working in the IT and communications sectors
£1 in every £170 of GVA is generated directly by BT Group
BT Group supported 1 in every 130 employees working in the private sector and £1 in every £115 of GVA as a result of BT Group’s full economic impact
4 Scotland1
2
3
4
5
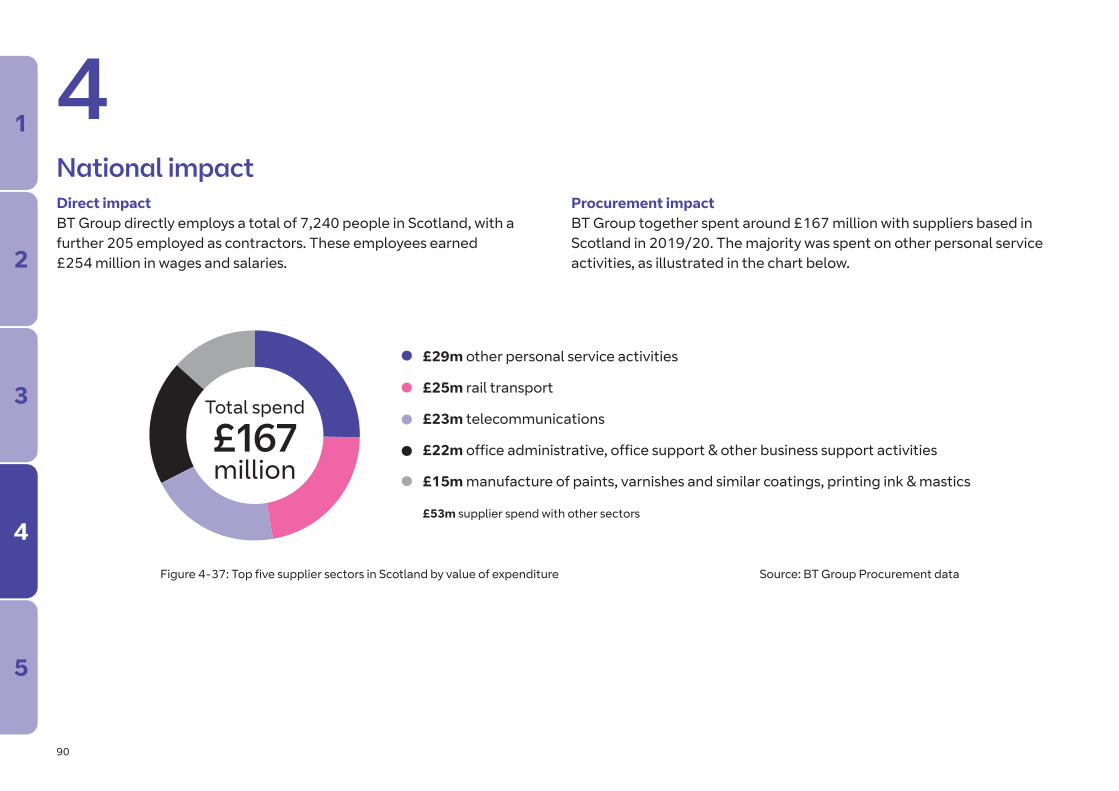
90
National impactDirect impactBT Group directly employs a total of 7,240 people in Scotland, with a further 205 employed as contractors. These employees earned £254 million in wages and salaries.
Procurement impactBT Group together spent around £167 million with suppliers based in Scotland in 2019/20. The majority was spent on other personal service activities, as illustrated in the chart below.
4
Total spend
£167million
£29m other personal service activities
£25m rail transport
£23m telecommunications
£22m office administrative, office support & other business support activities
£15m manufacture of paints, varnishes and similar coatings, printing ink & mastics
£53m supplier spend with other sectors
•••••
Figure 4-37: Top five supplier sectors in Scotland by value of expenditure Source: BT Group Procurement data
1
2
3
4
5

91
BT Group’s spend with suppliers results in significant benefits for the Scottish economy, including knock-on or multiplier benefits as a result of supplier spend. This is summarised below.
4
2,060FTE
Employment supportedamongst suppliers
£287million
£78million
£143million
Output generatedamongst suppliers
£££Income of supply chain employees
£££GVA generated in
Scotland
£££Figure 4-38: Indirect supply chain impact in Scotland Source: Hatch
BT Group supply chain spend in Scotland = £167 million
1
2
3
4
5

92
4Impact of employee expenditureBT Group employees and contractors living in Scotland earned £257 million in 2019/20. In turn, their expenditure supports further employment and output in consumer industries in the nation. Figure 4-39 below illustrates the wider induced employment and output supported through this employee expenditure.
2,920FTE
Employment supportedin consumer industries
£455million
£105million
£237million
Output generatedin consumer industries
£££Income of supported
employees
£££GVA generated in
Scotland
£££Figure 4-39: Induced (wage expenditure) impacts in Scotland Source: Hatch
Salaries of BT Group employees and contractors in Scotland = £257 million
1
2
3
4
5
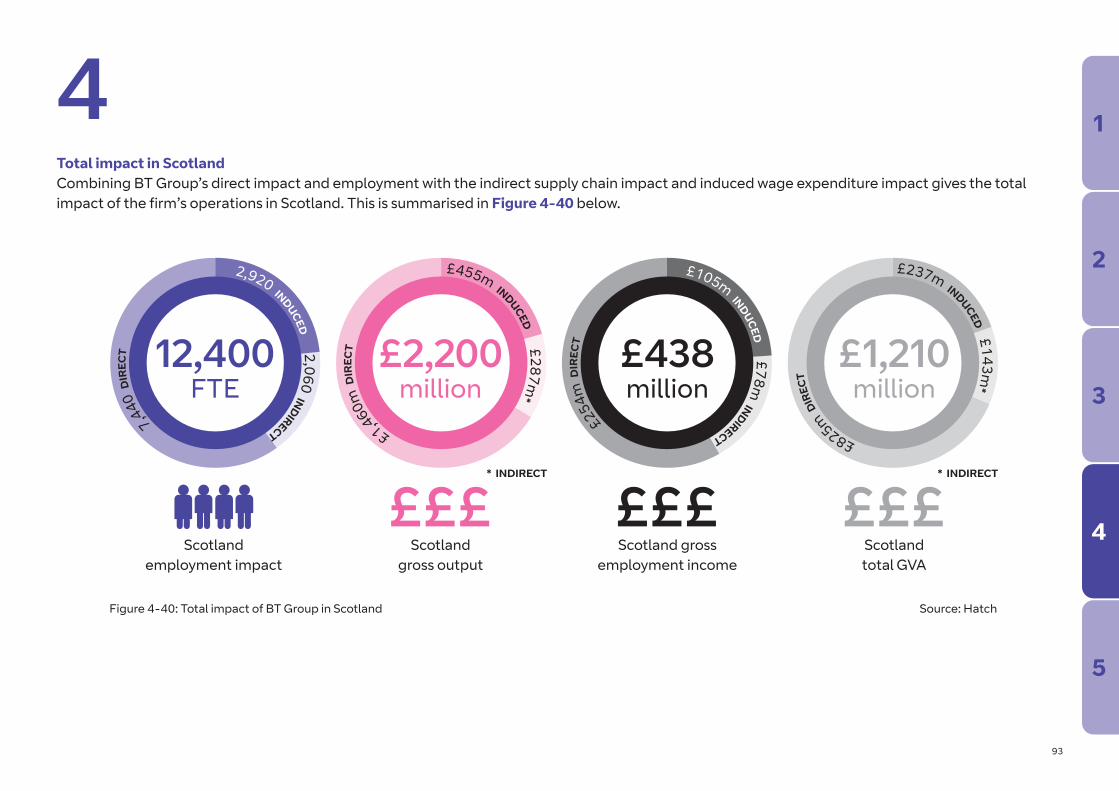
93
4Total impact in Scotland Combining BT Group’s direct impact and employment with the indirect supply chain impact and induced wage expenditure impact gives the total impact of the firm’s operations in Scotland. This is summarised in Figure 4-40 below.
Scotlandemployment impact
Scotlandgross output
£££Scotland gross
employment income
£££Scotlandtotal GVA
£££
£237m INDUCED
£105m INDUCED
£455m INDUCED
2,920 INDUCED
£143m*
£78m INDIRECT
£287m*
2,060 INDIRECT
£825m D
IREC
T
£254m
DIR
ECT
£1,460m D
IREC
T
7,440
DIR
ECT £2,200
million£438million
£1,210million
12,400FTE
* INDIRECT * INDIRECT
Figure 4-40: Total impact of BT Group in Scotland Source: Hatch
1
2
3
4
5

94
4Sub-national impactTable 4-19 below shows BT Group’s economic impact by local authority area in Scotland, ranked by the scale of impact (focusing on those ten local authorities which generate the greatest levels of impact).
Table 4-19: Sub-national impacts within Scotland Source: Hatch
BT Group employees & contractors Total impact
Work in area Resident Employment Output GVA in area £ million £ million
Glasgow City 1,890 765 2,630 494 274
Edinburgh, City of 898 449 1,420 285 157
Dundee City 1,170 878 1,180 199 113
Inverclyde 573 516 573 80 45
Highland 613 607 634 123 69
West Lothian 105 201 1,440 220 114
Scottish Borders 84 108 543 86 45
Aberdeen City 304 228 337 66 37
Renfrewshire 110 285 1,090 168 87
1
2
3
4
5

95
Across Wales in 2019/205,060 BT Group employees live in the nation (FTE)
4,600 BT Group employees work in the nation (FTE)
£146 million total income of BT Group employees working in the nation
£340 million spend with suppliers based in the nation
£971 million total GVA impact (including indirect and induced effects)
BT Group employed 1 in every 170 employees working in the private sector, and 1 in every 4 employees working in the IT and communications sectors
£1 in every £130 of GVA is generated directly by BT Group
BT Group supported 1 in every 70 employees working in the private sector and £1 in every £60 of GVA as a result of BT Group’s full economic impact
4 Wales1
2
3
4
5
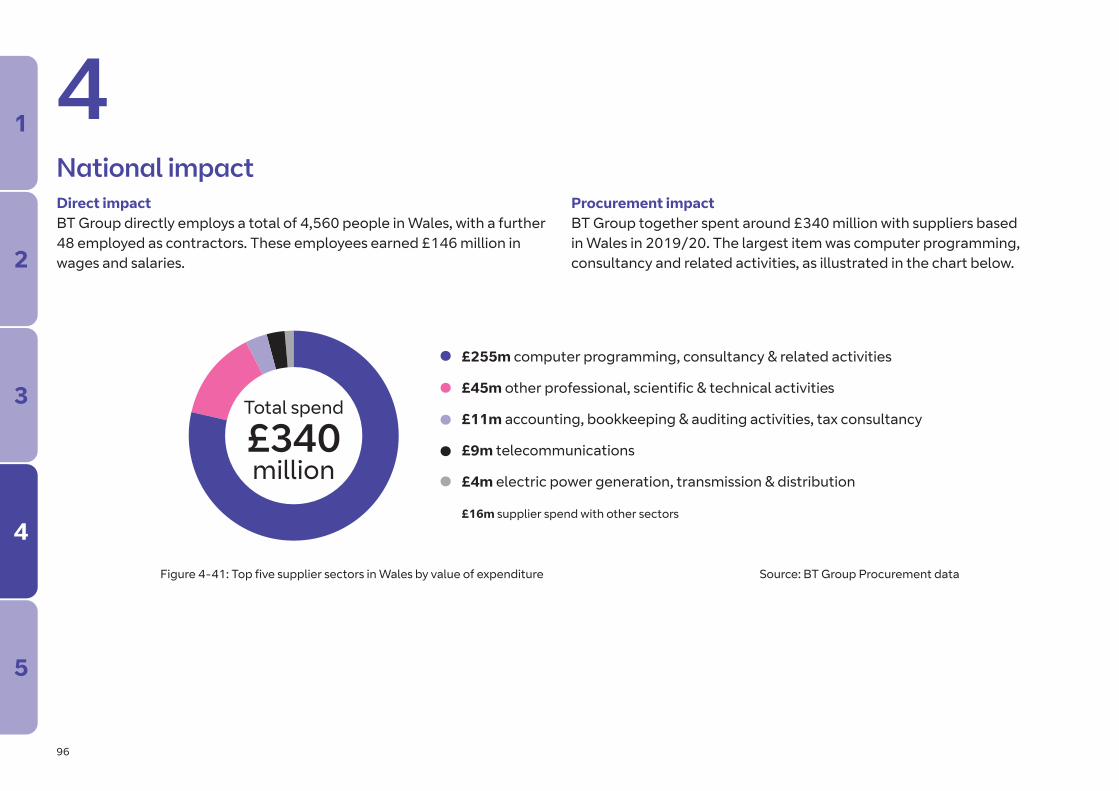
96
National impactDirect impactBT Group directly employs a total of 4,560 people in Wales, with a further 48 employed as contractors. These employees earned £146 million in wages and salaries.
Procurement impactBT Group together spent around £340 million with suppliers based in Wales in 2019/20. The largest item was computer programming, consultancy and related activities, as illustrated in the chart below.
4
Total spend
£340million
£255m computer programming, consultancy & related activities
£45m other professional, scientific & technical activities
£11m accounting, bookkeeping & auditing activities, tax consultancy
£9m telecommunications
£4m electric power generation, transmission & distribution
£16m supplier spend with other sectors
•••••
Figure 4-41: Top five supplier sectors in Wales by value of expenditure Source: BT Group Procurement data
1
2
3
4
5

97
BT Group’s spend with suppliers results in significant benefits for the Welsh economy (including knock-on or multiplier benefits as a result of supplier spend). This is summarised below.
4
4,660FTE
Employment supportedamongst suppliers
£532million
£194million
£305million
Output generatedamongst suppliers
£££Income of supply chain employees
£££GVA generated in
Wales
£££Figure 4-42: Indirect supply chain impact in Wales Source: Hatch
BT Group supply chain spend in Wales = £340 million
1
2
3
4
5

98
4Impact of employee expenditureBT Group employees and contractors living in Wales earned £164 million in 2019/20. In turn, their expenditure supports further employment and output in consumer industries in the nation. Figure 4-43 below illustrates the wider induced employment and output supported through this employee expenditure.
2,900FTE
Employment supportedin consumer industries
£273million
£88million
£194million
Output generatedin consumer industries
£££Income of supported
employees
£££GVA generated in
Wales
£££Figure 4-43: Induced (wage expenditure) impacts in Wales Source: Hatch
Salaries of BT Group employees and contractors in Wales = £164 million
1
2
3
4
5

99
4Total impact in Wales Combining BT Group’s direct impact and employment with the indirect supply chain impact and induced wage expenditure impact gives the total impact of the firm’s operations in Wales. This is summarised in Figure 4-44 below.
Walesemployment impact
Walesgross output
£££Wales gross
employment income
£££Wales
total GVA
£££
£194m INDUCED
£88m INDUCED
£273m INDUCED
2,900 INDUCED
£305m INDIRECT
£194m INDIRECT
£532m INDIRECT
4,660 INDIRECT
£472
m D
IREC
T
£146
m D
IR
ECT
£833m
DIR
ECT
4,60
0 D
IRECT
£1,640million
£428million
£971million
12,200FTE
Figure 4-44: Total impact of BT Group in Wales Source: Hatch
1
2
3
4
5

100
4Sub-national impactTable 4-20 below shows the economic impact of BT Group for four key regions within Wales.
Table 4-20: Sub-national impacts within Wales Source: Hatch
BT Group employees & contractors Total impact
Work in area Resident Employment Output GVA in area £ million £ million
South East Wales 2,830 2,980 9,160 1,180 704
South West Wales 992 1,060 1,110 185 106
North Wales 573 746 1,690 228 136
Mid Wales 213 267 217 45 26
1
2
3
4
5
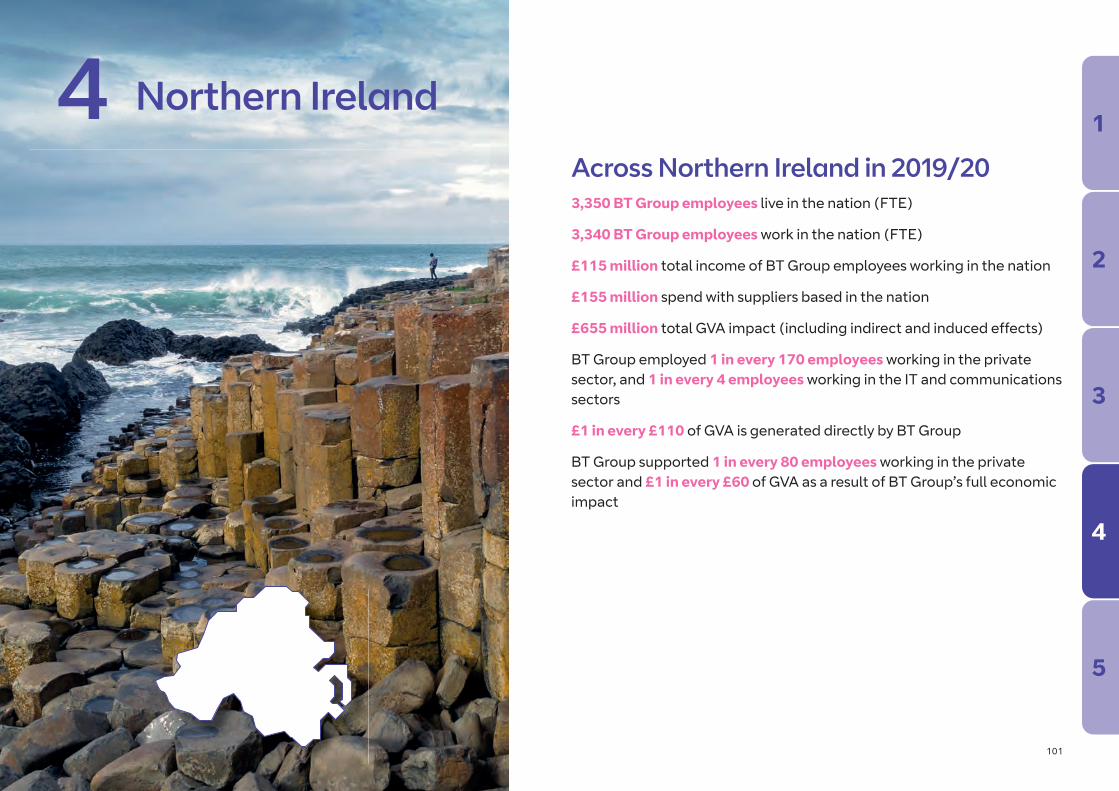
101
Across Northern Ireland in 2019/203,350 BT Group employees live in the nation (FTE)
3,340 BT Group employees work in the nation (FTE)
£115 million total income of BT Group employees working in the nation
£155 million spend with suppliers based in the nation
£655 million total GVA impact (including indirect and induced effects)
BT Group employed 1 in every 170 employees working in the private sector, and 1 in every 4 employees working in the IT and communications sectors
£1 in every £110 of GVA is generated directly by BT Group
BT Group supported 1 in every 80 employees working in the private sector and £1 in every £60 of GVA as a result of BT Group’s full economic impact
4 Northern Ireland1
2
3
4
5

102
National impactDirect impactBT Group directly employs a total of 2,900 people in Northern Ireland, with a further 436 employed as contractors. This results in £115 million in wages and salary spend across the nation.
Procurement impactBT Group spent around £155 million with suppliers based in Northern Ireland in 2019/20. The majority is spent on construction, as illustrated in the chart below.
4
Total spend
£155million
£100m construction
£26m telecommunications
£11m rental & leasing activities
£7m buying and selling, renting & operating of own or leased real estate (exc. imputed rent)
£3m other mining & quarrying
£8m supplier spend with other sectors
•••••
Figure 4-45: Top five supplier sectors in Northern Ireland by value of expenditure Source: BT Group Procurement data
1
2
3
4
5
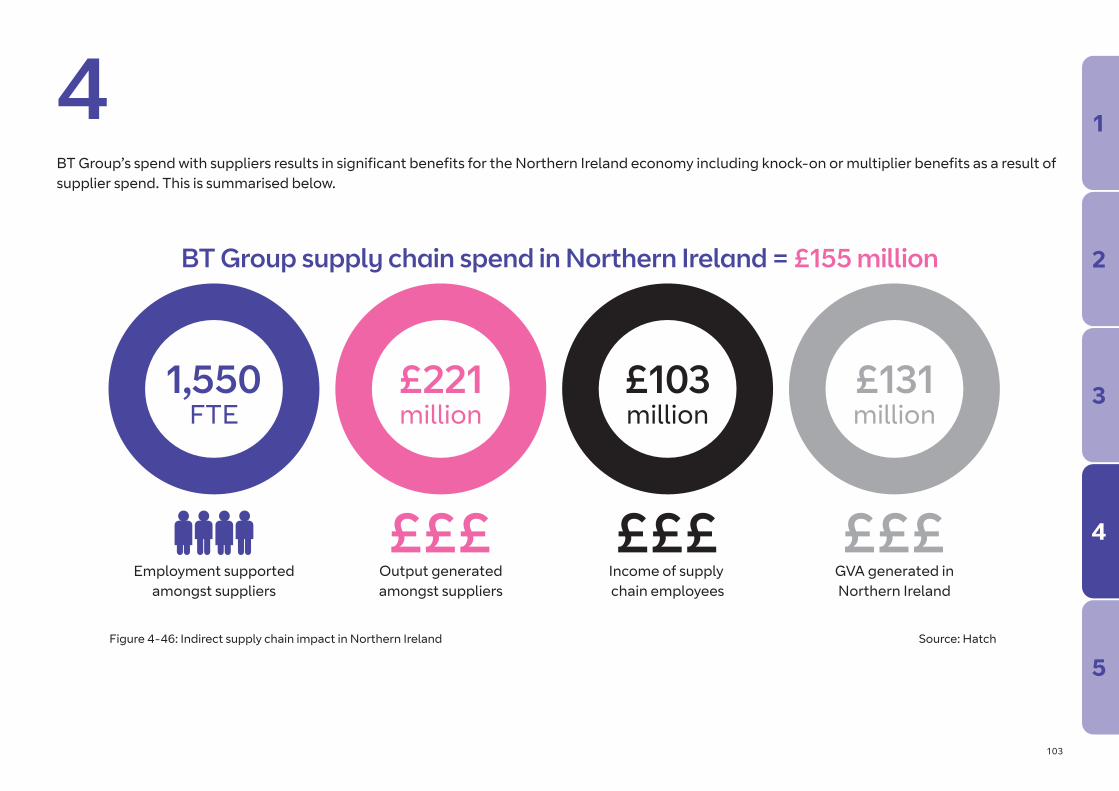
103
BT Group’s spend with suppliers results in significant benefits for the Northern Ireland economy including knock-on or multiplier benefits as a result of supplier spend. This is summarised below.
4
1,550FTE
Employment supportedamongst suppliers
£221million
£103million
£131million
Output generatedamongst suppliers
£££Income of supply chain employees
£££GVA generated inNorthern Ireland
£££Figure 4-46: Indirect supply chain impact in Northern Ireland Source: Hatch
BT Group supply chain spend in Northern Ireland = £155 million
1
2
3
4
5

104
4Impact of employee expenditureBT Group employees and contractors living in Northern Ireland earned £116 million in 2019/20. In turn, their expenditure supports further employment and output in consumer industries in Northern Ireland. The figure below illustrates the wider induced employment and output supported through this employee expenditure.
2,380FTE
Employment supportedin consumer industries
£315million
£86million
£152million
Output generatedin consumer industries
£££Income of supported
employees
£££GVA generated inNorthern Ireland
£££Figure 4-47: Induced (wage expenditure) impacts in Northern Ireland Source: Hatch
Salaries of BT Group employees and contractors in Northern Ireland = £116 million
1
2
3
4
5

105
4Total impact in Northern Ireland Combining BT Group’s direct impact and employment with the indirect supply chain impact and induced wage expenditure impact gives the total impact of the firm’s operations in Northern Ireland. This is summarised in Figure 4-48 below.
Northern Irelandemployment impact
Northern Irelandgross output
£££Northern Ireland gross
employment income
£££Northern Ireland
total GVA
£££
£152m INDUCED
£86m INDUC
ED
£315m INDUC
ED
2,380 IND
UC
ED £131m INDIRECT
£103m INDIRECT
£221m INDIRECT
1,550 INDIRECT
£373m
DIR
ECT
£115
m D
IRECT
£657m
DIR
ECT
3,34
0 D
IREC
T
£1,190million
£304million
£655million
7,270FTE
Figure 4-48: Total impact of BT Group in Northern Ireland Source: Hatch
1
2
3
4
5

106
4Sub-national impactKey statistics for selected local authorities within Northern Ireland are presented in the charts and tables below.
Table 4-21: Sub-national impacts within Northern Ireland Source: Hatch
BT Group employees & contractors Total impact
Work in area Resident Employment Output GVA in area £ million £ million
Antrim and Newtownabbey 193 315 247 46 26
Ards and North Down 43 225 66 12 7
Armagh City, Banbridge and Craigavon 184 293 283 41 23
Belfast 1,970 992 3,090 566 315
Causeway Coast and Glens 43 108 80 14 8
Derry City and Strabane 343 355 344 57 33
Fermanagh and Omagh 355 364 503 80 45
Lisburn and Castlereagh 57 250 73 14 8
Mid Ulster 37 114 2,470 339 179
Newry, Mourne and Down 56 141 57 12 7
1
2
3
4
5

5Technical appendices

108
Here we set out the methodology used to estimate the economic impact of BT Group and the data sources that have been drawn upon.
DefinitionsThere are three sources of economic impact that a company like BT Group generates.
Direct impactsThese are the impacts arising as a direct consequence of the company’s activities, in the form of output and wealth creation, employment within the firm and associated employment income.
Indirect impactsAlso known as the supply chain impact, this contribution arises from BT Group’s purchasing of goods and services from suppliers in the UK, who in turn make further purchases from their suppliers, and so on. This chain of procurement spending resulting from BT Group’s initial expenditure injection creates further wealth, and supports jobs and income.
Induced impactsFurther economic activity and employment is created as BT Group employees and those whose jobs are supported through supply chain effects spend their wages and salaries on goods and services.
The economic effects from this consumer spending are known as the induced effect.
Throughout the report these impacts are measured using four key indicators:
Output This refers to the turnover/sales revenue that is generated directly within BT Group or within other firms in the economy through indirect and induced effects.
Gross value added (GVA)This is the key measure of wealth creation within an economy and is used by the government to monitor economic performance. It refers to the residual value created by firms once non-labour costs have been paid, which is then distributed to owners/shareholders in the form of profits and to employees via wages and salaries. It is measured in two ways:
• GVA = turnover minus bought in goods and services (known as the production approach)
• GVA = operating profit + depreciation and amortisation + taxes less subsidies on production + compensation of employees (i.e. wages plus social security contributions) (known as the income approach)
Employment This is the quantity of jobs supported by BT Group’s activities. Since these jobs are a mix of full time and part time positions, throughout the report we refer to Full Time Equivalent (FTE) posts, in order to express all jobs in a common currency.
Employment incomeThese are the gross wages and salaries paid to employees whose jobs are supported by BT Group, including NI and pension contributions, and PAYE taxes.
5 Technical appendices1
2
3
4
5

109
Methodology and data sourcesThe methodology used to estimate BT Group’s economic impacts for 2019/20 has been designed to be consistent with previous reports. Further information is provided below.
Direct impactsThe two data sources used to estimate this are BT Group’s financial accounts for 2019/20 and BT Group’s HR database.
Output has been taken directly from the accounts, as revenue from external customers in the UK. This removes both internal revenue resulting from internal transfers between BT Group companies and sales made outside the UK.
GVA has been calculated using the income approach, as the sum of gross operating profits before tax, interest, depreciation and amortisation, and compensation of employees. We have estimated UK gross operating profit using global EBITDA* from the accounts, and estimated the UK portion by factoring down by the UK share of total revenues. Compensation of employees has been estimated using data on gross wages and salaries (sourced from BT Group), plus social security costs (sourced from BT Group).
* Earnings before interest, tax, depreciation and amortisation
Employment numbers have been sourced from a snapshot of information provided by BT Group, with data on the number of people employed directly by BT Group and the number of contractors employed through agencies, along with their contracted hours. These have then been converted to FTEs based on one full time job being equivalent to a 37.5 hour per week contract. The data indicates both the place of residence and place of work of each employee. For direct employment we have used workplace based figures. The employment numbers are consistent with those in the 2019/20 annual accounts.
The BT Group data provided the home and workplace postcode for each employee. These were used to allocate employees to regions and local authorities for the residence and workplace based analysis. Home postcodes were not available for agency staff and contractors. The assumption was made that these members of staff were resident in the same Local Authority and Region as their workplace.
Information on contractor staff was supplied by BT Group.
Employment income has been estimated using data from BT Group, using gross wages and salaries of employees and contractors by place of work, again adjusted to be consistent with the averages wages and salaries bill quoted in the accounts in the same way as for employment numbers.
5 1
2
3
4
5

110
Indirect impactsThe data source used to estimate indirect impacts has been provided by BT Group by location and by sector. Each supplier to BT Group was allocated to a region and local authority based on the invoicing address. Suppliers were then allocated to sectors using the following process:
• All suppliers were matched to the Companies House Database. This provides the sector for each supplier at the 2 digit Standard Industrial Classification (SIC) code.
As expenditure on contract and agency staff is encompassed by the employment element of the direct impact assessment, all identifiable procurement expenditure with employment agencies has been removed from the supplier spend analysis, in order to avoid double counting.
Impacts have been estimated using Hatch Urban Solutions’ input-output tables for the UK and the regions.
Induced impactsData on wages and salaries of BT Group employees and contractors by place of residence has been used to calculate induced impacts, along with the employment income of indirect employees estimated above.
The regional and local dimensionEstimating regional and local impactsThe results are presented for the former Government Office Regions as well as Local Enterprise Partnership (LEPs). Wherever possible this has been informed by actual data for these areas, but where this data is not available, we have apportioned results to local areas using suitable apportionment factors, drawn from other BT Group data. This should therefore be borne in mind when interpreting results at these geographical levels.
The HQ effectNational procurement contracts are often allocated to a location according to the supplier’s HQ address. However, it may be that these services are actually provided from a series of locations around the country. This process of allocating the procurement expenditure to the HQ location, rather than the location of the depot where activity is taking place, may skew impacts to the HQ region and consequently under-estimate impacts elsewhere. We have adopted this approach as in previous year’s assessment. It does mean that the results pertaining to indirect impacts in particular may be subject to significant margins of error, particularly at the local level.
51
2
3
4
5

111
5Benchmarking the resultsThe report sets the key results in their wider socio-economic context, in order to illustrate the relative scale of BT Group’s contribution to the local, regional and national economy. To do this we have drawn down nationally published statistics. The data sources used are as follows:
1. Total employees in employment: The total number of people employed by all businesses with operations in the area. This excludes working proprietors and is presented as Full Time Equivalent employees (it excludes the self-employed). (Source: ONS, BRES, 2018).
2. Total IT and communications sector employees in employment: The total number of people employed by ICT businesses with operations in the area. This excludes working proprietors and is presented as Full Time Equivalent employees (it excludes the self-employed). (Source: ONS, BRES, 2018).
3. Total private sector employees in employment: The total number of people employed by private sector businesses with operations in the area. This excludes working proprietors and is presented as Full Time Equivalent employees (it excludes the selfemployed). (Source: ONS, BRES, 2018).
4. Total gross earnings from all residents in employment: This has been derived using the total number of residents in employment (source: Annual Population Survey, 2019) multiplied by the average gross annual pay for all employees in that geographical area (source: Annual Survey of Hours and Earnings, 2019).
5. Total gross earnings from all employees in employment: This has been derived using the total number of people employed by businesses in the area (source: BRES, 2018) multiplied by the average gross annual pay for all employees in that geographical area (source: Annual Survey of Hours and Earnings, 2019).
6. Total GVA - Total gross value added generated by businesses based in the area: GVA data has been provided for regions and selected LEP areas (source: ONS, Headline Workplace Based GVA at Current Basic Prices, 2018 and ONS, GVA for Local Enterprise Partnerships, 1998-2018).
1
2
3
4
5

O� ces Worldwide
The services described in this publication are subject to availability and may be modified from time to time. Services and equipment are provided subject to British Telecommunications plc’s respective standard conditions of contract. Nothing in this publication forms any part of any contract. © British Telecommunications plc 2020.
Registered office: 81 Newgate Street, London EC1A 7AJ. Registered in England No: 1800000. Designed by Strata