Embed Size (px)
Citation preview
The Economic Effects of Special Purpose Entities on Corporate Tax Avoidance
Paul Demeré [email protected] University of Georgia
Michael P. Donohoe
[email protected] University of Illinois at
Urbana-Champaign
Petro Lisowsky* [email protected] University of Illinois at Urbana-Champaign and Norwegian Center for
Taxation
September 2017
Abstract
This study provides the first large-sample evidence on the economic tax effects of special purpose entities (SPEs). Unlike transactions that directly generate tax savings, these increasingly common components of corporate organizational structures facilitate tax savings by enabling sponsor-firms to conduct a greater level of tax-advantaged transactions and/or enhance the tax efficiency (i.e., relative tax savings) of such transactions. Using path analysis, we find that SPEs facilitate a greater level of specific transactions such that 1.8% of the cash tax savings from leverage, 3.3% from net operating loss carryforwards, 8.7% from research and development (R&D), 6.1% from intangibles, and all cash tax savings from tax havens occur within SPEs. We estimate that SPEs facilitate incremental cash tax savings of about $82.4 billion for our sample of 10,284 SPE users, or roughly 2% of total U.S. federal corporate tax collections during 1997-2011. Finally, moderation analysis reveals that SPEs enhance the total tax efficiency of transactions involving R&D and intangibles by 92.6% and 72.5%, respectively. Overall, these findings provide economic insight into complex organizational structures facilitating corporate tax avoidance. Keywords: organizational structure; special purpose entity; tax avoidance JEL Classification: H25; L22; M40 *Corresponding author: 1206 S. Sixth Street, MC-706; Champaign, IL 61820. We appreciate helpful comments from participants at the American Taxation Association Midyear Meeting, the AAA Annual Meeting, the National Tax Association Annual Conference, the Berlin-Vallendar Conference on Tax Research, and the PhD seminar at the EIASM/University of Münster Conference on Current Taxation. We also thank workshop participants at Arizona State University, Fordham University, the University of Connecticut, the University of Illinois at Urbana-Champaign, Vienna University of Economics and Business, as well as Andrew Bauer, Jenny Brown, Hye Sun Chang, Raluca Chiorean, Keith Czerney, Will Demeré, Katharine Drake, Brian Gale, Danielle Green, Jost Heckemeyer, Ryan Huston, Laura Li, Jeremy Lill, Sean McGuire, Tom Neubig, Tom Omer, George Plesko, Liora Schulman, and Jaron Wilde. Special thanks to Richard Crowley for data collection assistance, and Mei Feng, Jeff Gramlich, and Sanjay Gupta for providing special purpose entity data. Paul Demeré gratefully acknowledges financial support from the AICPA Accounting Doctoral Scholars Program. Michael Donohoe gratefully acknowledges financial support from the PricewaterhouseCoopers Faculty Fellowship. Petro Lisowsky appreciates financial support from the MIT Sloan School of Management, as well as the PricewaterhouseCoopers Faculty Fellowship and Professor Ken Perry Fellowship at the University of Illinois at Urbana-Champaign.
1
The Economic Effects of Special Purpose Entities on Corporate Tax Avoidance
1. Introduction
Both academic research and government reports study the tax effects of many different tax-
advantaged transactions.1 However, few studies evaluate the organizational structures facilitating
such transactions, while those that do examine tax incentives and general determinants rather than the
tax effects (Shevlin 1987; Beatty et al. 1995; Feng et al. 2009; Donohoe et al. 2013). Empirical
evidence on the tax effects of organizational structures is important because, while lawmakers and
regulators call for changes in the tax and financial reporting policies for organizational structures
(JCT 2003; Basel Committee on Banking Supervision 2009; OECD 2013, 2015a, 2015b), existing
knowledge about the tax revenue losses attributable to such structures is largely anecdotal. We fill
this void by examining whether, how, and the extent to which increasingly common components of
organizational structures—special purpose entities (SPEs)—facilitate corporate tax avoidance.2
SPEs are separate legal entities created by a sponsor-firm to perform narrow, predefined
business activities or series of transactions (Feng et al. 2009).3 Corporate use of SPEs is large and
growing, with nearly a quarter of all Compustat firms and one-half of S&P 500 firms using at least
one SPE (Zion and Carcache 2003). The number of SPE users in our sample has also increased by
more than 600% from 1997 to 2011. While SPEs are used in common financial arrangements, such
as leases and securitizations, anecdotes suggest companies use them to facilitate corporate tax
avoidance; that is, reduce explicit taxes (JCT 2003). To this end, critics consider special purpose
entities a “series of dirty words” in taxation (Forbes and Sharma 2008), while many other groups,
including researchers (Mills et al. 2012; Zion and Carcache 2003), global tax authorities (Internal 1 See U.S. Treasury (1999); Graham (2000); Hanlon and Heitzman (2010); Government Accountability Office [GAO] (2011); Organisation for Economic Co-Operation and Development [OECD] (2011); and U.S. Congress Joint Committee on Taxation [JCT] (2011). 2 Tax avoidance does not necessarily imply improper behavior as managing tax costs is an appropriate component of a firm’s long-term strategy (Atwood et al. 2012). Section 2 describes how SPEs facilitate tax avoidance. 3 SPEs are also known as variable interest entities (VIEs) or special purpose vehicles (SPVs). VIEs are a subset of SPEs subject to consolidation under Financial Interpretation No. 46 (Financial Accounting Standards Board [FASB] 2006) and subsequent pronouncements (Chasteen 2005). We use the term “SPE” to refer to all such entities.
2
Revenue Bulletin 2011-39; Inland Revenue 2013), and regulators (FASB 2003; JCT 2003, 2011;
OECD 2013, 2015a, 2015b; United Nations 2013) suspect that SPEs contribute to the continuing
decline in corporate tax revenues.
Unlike tax-advantaged transactions, SPEs are organizational structures that do not directly
generate tax savings, but instead facilitate tax savings in two ways.4 The first way is by allowing
sponsors to conduct a greater level of tax-advantaged transactions. By separating high risk assets
from the sponsor, SPEs can enable greater (1) debt capacity, resulting in more tax deductible interest
expense (Mills and Newberry 2005), (2) external financing, leading to more research and
development (R&D) deductions and tax credits (Shevlin 1987); and (3) synthetic leases, increasing
depreciation deductions (Zechman 2010). The second way that SPEs facilitate tax savings is by
enhancing tax efficiency, or the relative tax savings from existing tax-advantaged transactions (i.e.,
holding level constant). For example, SPEs allow firms to (1) shift profits to jurisdictions with low
tax rates (Drucker 2007; Forbes and Sharma 2008; Dyreng et al. 2013), (2) design and operate tax
shelters (Graham and Tucker 2006; Wilson 2009; Lisowsky 2010), and (3) structure intercompany
transactions that result in tax credit and loss duplication (JCT 2003; Sheppard 2017).
It is important to understand the ways in which SPEs facilitate tax-advantaged transactions
(i.e., by changing their level or efficiency) because they shed light on the tax-motivated business
strategies to achieve tax savings (Scholes et al. 2014). For example, if SPEs enable a firm to engage
in a greater level of tax-advantaged transactions, such as R&D, then this tax avoidance may be within
the bounds of tax law and beneficial to corporate stakeholders. However, if SPEs enable a firm to
enhance the tax efficiency of a transaction, such as shifting R&D-related profits to tax havens or
implementing a tax shelter that results in R&D credit duplication, then this tax avoidance may be
pushing the bounds of tax law and exposing corporate stakeholders to additional costs (e.g., tax 4 A tax-advantaged transaction reduces tax costs independent of taxpayer motives. For example, the debt-tax shield of leverage and tax credits from R&D expense reduce taxes, but do not necessarily result from intentional tax planning. We discuss this concept further in Section 2, and map empirical proxies to such transactions in Section 3.
3
audits and penalties).
Despite our focus on taxes, some experts argue that obtaining tax savings is not the main
objective of common SPEs (e.g., for asset financing), suggesting these organizational structures play
a minor role in corporate tax avoidance (Soroosh and Ciesielski 2004). Even when tax savings are a
primary objective, SPEs are not necessarily optimal once all costs are considered (Scholes et al.
2014). For example, in addition to legal setup costs, SPEs can reduce information quality (Feng et al.
2009), increase regulatory scrutiny (Internal Revenue Bulletin 2011-39; Inland Revenue 2013),
enhance public pressure (Dyreng et al. 2016), and result in large tax penalties (Wilson 2009).
Accordingly, we investigate whether and under what circumstances the tax effects of SPEs
are economically significant by answering three open empirical questions. First, to what extent do
SPEs enable sponsor-firms to conduct a greater level of tax-advantaged transactions? That is, we
examine which specific transactions are commonly used within SPE-structures for tax avoidance.
Second, how large are the tax savings facilitated by SPEs? Third, for which specific transactions do
SPEs enhance tax efficiency, or relative tax savings? Directly measuring the level and efficiency of
tax savings facilitated by SPEs will empirically answer important tax policy questions; namely,
whether, how, and the extent to which organizational structures enable corporate tax avoidance.
We begin our analyses by providing the first large-sample empirical evidence on the overall
relation between SPEs and corporate tax avoidance. Specifically, we regress two different forward-
looking effective tax rates (ETRs) estimated over a three-year horizon (t to t+2) on both a binary and
continuous measure of SPEs derived from Exhibit 21 of Form 10-K during 1997-2011. We use fixed-
effects estimation (a generalized difference-in-differences framework), which measures the effect of
changes in SPE use on ETRs; that is, the incremental tax savings attributable to SPEs (Wooldridge
2010; Roberts and Whited 2013). We find that both the number of SPEs and the use of SPEs are
negatively and significantly associated with future GAAP ETRs (i.e., total tax expense scaled by
pretax income) and cash ETRs (i.e., cash taxes paid scaled by pretax income), suggesting that SPEs
4
facilitate tax avoidance incremental to common tax-advantaged transactions and other controls.
Next, we use path analysis to decompose the overall relation between SPEs and ETRs into
direct and indirect paths. While regression analysis gauges overall effects, path analysis considers the
existence and relative importance of alternative (indirect) paths of influence that jointly create overall
effects (Bhattacharya et al. 2012). As a class of structural equation models, path analysis allows us to
investigate the extent to which tax-advantaged transactions captured in our model are used within
SPEs to avoid taxes. In other words, path analysis estimates the extent to which SPEs incrementally
increase the level of tax-advantaged transactions, and provides a focused setting in which to estimate
the total tax savings facilitated by SPEs.
We find that several tax-advantaged transactions are used within SPEs to avoid corporate
taxes. Specifically, we estimate that SPEs facilitate 1.8% of the cash tax savings from leverage, 3.3%
from net operating loss (NOL) carryforwards, 8.7% from R&D, 6.1% from intangibles, and all of the
cash tax savings from tax havens. Thus, the path analysis indicates that SPEs increase the level of
several specific tax-advantaged transactions in an economically meaningful way.
The path analysis also reveals that SPEs facilitate an economically significant amount of total
tax savings. Among our principal results, we find that firms using the mean number of SPEs (5.48)
have cash ETRs that are 4.4% lower than non-users. At the firm-level, these effects indicate that SPE
users realize $7.8 million more in cash tax savings per year than firms not using SPEs. In aggregate,
we estimate total cash tax savings of $82.4 billion for our sample of 10,284 SPE users, or
approximately 2% of total U.S. federal corporate income tax collections during the sample period.5
These estimates are considerably larger than those for other complex planning strategies, including
tax shelters (Wilson 2009), tax havens (Dyreng and Lindsey 2009), round-tripping (Hanlon et al.
2015), and financial derivatives (Donohoe 2015). 5 U.S. federal corporate income tax collections totaled approximately $4.46 trillion from 1997 to 2013 (irs.gov/uac/SOI-Tax-Stats-Collections-and-Refunds,-by-Type-of-Tax-IRS-Data-Book-Table-1). While our sample spans 1997-2011, our tests use data through 2013 to calculate forward-looking effective tax rate measures.
5
We next use moderation analysis to estimate the extent to which SPEs enhance the relative
tax savings (i.e., tax efficiency) of tax-advantaged transactions. Moderation analysis considers if the
relation between two variables depends on a third variable, allowing us to examine if specific
transactions (as captured by model covariates) generate more or less tax savings when performed
within versus outside SPEs. While the path analysis reveals that an economically large portion of the
tax savings from leverage, NOLs carryforwards, and tax havens occur within SPEs by contributing to
increased debt capacity, loss deductibility, and income shifting opportunities, respectively, the
moderation analysis shows that SPEs do not enhance the tax efficiency of these transactions.
However, SPEs enable a greater level and efficiency of total tax savings for R&D and intangibles-
based transactions by 92.6% and 72.5%, respectively.
Finally, we perform several other tests to provide further insight on the tax effects of SPEs.
First, we consider the link between SPEs and tax aggressiveness. We find that SPE use has a positive
relation with unrecognized tax benefits (Lisowsky et al. 2013), but not the likelihood of tax shelter
participation (Lisowsky 2010), suggesting that, on average, SPEs facilitate some tax uncertainty, but
not extremely aggressive positions.6 Second, we find that the GAAP ETR results are stronger for
U.S. multinationals compared to U.S. domestic firms, and a majority of the tax savings of SPEs
comes from avoiding U.S. federal, rather than foreign or state, income taxes. Our results also hold
across several industries, suggesting that SPE-facilitated tax avoidance is pervasive and not simply
confined to high-tech or intangible-intensive firms. Third, we mitigate alternative explanations by
showing that our results are not driven by (1) the endogenous choice to use SPEs; (2) the financial
reporting of minority owners of SPEs; (3) variation in firms’ subsidiary reporting over time; or (4)
potential increases in overall organizational complexity.
This study contributes to the literatures on SPEs (Shevlin 1987; Beatty et al. 1995; Feng et al.
6 Tax aggressiveness is typically considered the use of tax positions which “push the envelope of tax law” (Hanlon and Heitzman 2010) and is a subset of tax avoidance (Lisowsky et al. 2013).
6
2009) and corporate tax avoidance (see Hanlon and Heitzman 2010) in three ways. First, we differ
from traditional tax avoidance research in that we consider whether, how, and the extent to which tax
avoidance is facilitated by increasingly common and uniquely complex organizational structures. In
doing so, we identify some of the transactions used within such structures to facilitate tax savings,
which is relevant to market participants as they analyze firms’ tax profiles (Weber 2009), and tax
authorities as they evaluate enforcement efforts to combat declining corporate tax revenues (Fox and
Luna 2005; Inland Revenue 2013; Bozanic et al. 2017; Dyreng et al. 2017). Second, by providing the
first large-sample estimates of the total tax savings facilitated by SPEs, we clarify inconclusive
anecdotal evidence routinely cited by experts (e.g., Zion and Carcache 2003; Soroosh and Ciesielski
2004; Forbes and Sharma 2008) and researchers (e.g., Chasteen 2005; Desai and Dharmapala 2006;
Feng et al. 2009; Zechman 2010), as well as help move the literature beyond the notion that firms
simply can use SPEs to facilitate tax savings. Further, while prior research finds that tax incentives
are an important, but not leading determinant of SPE use, we show that SPEs facilitate economically
significant tax savings nonetheless. Finally, our study is the first to use both path and moderation
analysis to (1) evaluate the tax effects of organizational structure and (2) separate level from
efficiency effects. It can thus guide future research examining the economic outcomes of other
corporate organizational structures.
Section 2 provides background on SPEs and develops our research questions. We discuss
research design, results, and other tests in Sections 3, 4, and 5, respectively. Section 6 concludes.
2. Background and research questions
2.1 Corporate tax avoidance
Prior research has extensively examined cross-sectional variation in firms’ transactions to
identify determinants of corporate tax avoidance (see Hanlon and Heitzman 2010). For example,
studies show that tax avoidance is greater in firms with greater leverage, international operations,
R&D, intangibles, and financial derivatives (e.g., Gupta and Newberry 1997; Graham and Tucker
7
2006; Rego 2003; Lisowsky 2009; Donohoe 2015). Additional research examines the link between
tax avoidance and ownership type. For example, tax avoidance is lower in family-owned than non-
family-owned firms (Chen et al. 2010) and in firms owned by private equity shareowners
(Badertscher et al. 2013) or hedge funds (Cheng et al. 2012). Another stream of research examines
the link between tax avoidance and managerial incentives. For instance, tax avoidance is greater
when managers are compensated based on after-tax earnings (Phillips 2003), with stock options
(Lisowsky 2009; Rego and Wilson 2012), or when they have less debt-like retirement wealth tied to
the firm (Chi et al. 2017). A particular manager, especially a tax director, also matters in generating
corporate tax savings (Armstrong et al. 2012; Dyreng et al. 2010). Finally, other research finds that
internal tax departments, external tax advisors, and tax authorities can increase or constrain corporate
tax avoidance (Robinson et al. 2010; Hoopes et al. 2012; Beck and Lisowsky 2014; Klassen et al.
2016; Klassen et al. 2017). Overall, these studies provide important insights into what companies and
managers do—and to some extent why—to generate tax savings.
However, there is a noticeable void in the literature pertaining to how corporations facilitate
tax avoidance. It is well-known that firms employ complex structures, such as using corporate and
pass-through subsidiary entities, some with multiple tiers, to operate and invest in various activities
and locations (GAO 2011; OECD 2011; Donohoe et al. 2013). What is less-known is whether, how,
and how much corporations use these structures to avoid tax. Only recently do some studies examine
the link between corporate organizational structure and tax avoidance, although the focus is on
multinational corporations. For example, Dyreng and Lindsey (2009) find that U.S. firms with a
subsidiary in a tax haven country report lower effective tax rates than other firms. Hope et al. (2013)
find that the lack of disclosures on organizational complexity (measured by geographic business
segments) facilitates greater tax avoidance. In several working papers, Blouin and Krull (2015)
investigate the role of the U.S.’s “check-the-box” rules on how entity type choice reported on the tax
return affects firms’ foreign operations, while Lewellen and Robinson (2014) examine internal
8
ownership structures of U.S. multinationals.7 Wagener and Watrin (2014) and Amberger and
Kohlhase (2017) show in a European setting that choices over organizational structures are likely
tax-motivated.
Even considering this recent research, no study identifies or estimates the tax effects of
organizational structure regardless of corporations’ domestic or multinational activities. The lack of
empirical evidence on these issues is largely due to the challenges researchers face with (1)
identifying organizational structures, and (2) separating the tax avoidance effects of transactions from
the organizational structures that facilitate the transactions. Our specific examination of SPEs used
by U.S. public corporations in a path analysis framework addresses these challenges.
2.2 Special purpose entities (SPEs)
In general, SPEs are created by a sponsor-firm for a specific business purpose or series of
transactions (Feng et al. 2009). Although they serve many purposes, SPEs are often used to obtain
external financing for corporate activities. For example, a sponsor might contribute “high-risk”
assets, such as construction or R&D projects, to a SPE, which is legally separate from the sponsor by
name, financial reports, and legal liability. The SPE can then obtain financing via equity or
securitized debt, ultimately increasing the financing ability of the entire corporate group.8 Along
these lines, prior research finds higher leverage among firms that use SPEs (Mills and Newberry
2005; Feng et al. 2009), and suggests that separating assets with different risks and matching them
with investor risk preferences can lead to more favorable financing terms (Shevlin 1987; Beatty et al.
1995). In asset securitizations, the sponsor uses SPEs to create new types of financing that can reduce
7 The “check-the-box” regulations (IRC §7701) permit certain business entities to choose their classification for federal income tax purposes. These regulations can create discrepancies in how pass-through entities (e.g., partnerships) are treated for tax purposes across U.S. and foreign jurisdictions, enabling some tax avoidance strategies (Munden et al. 2002). For instance, the IRS has targeted SPEs in conjunction with schemes that duplicate foreign tax credits (Internal Revenue Bulletin 2011-39). New Zealand tax authorities also consider SPEs as audit red-flags for multinational companies (Inland Revenue 2013), and, as of 2009, the Chinese government restricts the use of SPEs by foreign firms to obtain tax-favorable outcomes with regards to tax treaty benefits when exiting Chinese investments (KPMG 2010). 8 See Hartgraves and Benston (2002), Chasteen (2005), and Feng et al. (2009) for further details.
9
capital costs, provide incentives to use debt over equity, and attract different types of investors
(Schwarcz 1994; Landsman et al. 2008).
Corporate use of SPEs has flourished over time for at least two reasons. First, from a tax
perspective, the U.S. Supreme Court permitted sponsor-firms to deduct SPE expenses from taxable
income after 1974, increasing the tax planning capabilities of SPEs.9 Second, from a financial
reporting perspective, “bright-line” tests in ARB No. 51 (AICPA 1959) made it relatively easy for
sponsors to avoid the consolidation of SPEs (Soroosh and Ciesielski 2004; Callahan et al. 2012,
2013).10 As a result, SPEs became a popular way to move debt, expenses, and high-risk assets off-
balance-sheet to reduce taxes, enhance profitability, and reduce perceptions of risk.
For these reasons, Feng et al. (2009) investigate the use, determinants, and earnings effects of
SPEs. Using a novel measure of SPEs, they find a two-and-a-half fold increase in the percentage of
firms using at least one SPE during 1997-2004. They also show that SPE activity increases with a
firm’s intangible assets and marginal tax rate (MTR), and decreases with foreign activity and the
quality of governance. Firms also use more SPEs when facing higher financial reporting pressures,
primarily those related to debt obligations. Finally, they document that SPEs arranged for financial
reporting purposes (rather than economic reasons) are linked to earnings management.
Not surprisingly, the ability of SPEs to help sponsors “manage” financial reports has led to
high-profile cases of earnings manipulation and fraud. For example, some sponsors used SPEs to
create related-party income not eliminated in the consolidation process. This type of manipulation
was largely behind the Enron fraud, which involved income overstatements of $591 million during
1997-2000 (Thomas 2002). SPEs have also played a role in other scandals, such as Dynegy (Desai
9 Snow v. Commissioner, 416 U.S. 500 (1974), allowed limited partners to deduct partnership expenses from taxable income. A corporation that is a limited partner in a SPE structured as a partnership can thus deduct SPE expenses. 10 ARB No. 51 required consolidation of an entity in the sponsor’s financial statements if the sponsor held more than 50% of the outstanding voting shares of the entity. Many sponsors simply limited their ownership of SPE voting shares to less than 50% and used other mechanisms, such as lease agreements and debt covenants, to maintain effective control of the SPE while avoiding financial statement consolidation (Chasteen 2005).
10
and Dharmapala 2006), PNC Financial (SEC 2002), and Olympus (Verschoor 2012). In the cases of
Enron and Dynegy, SPEs were used to avoid a substantial amount of corporate taxes (McGill and
Outslay 2004). More recently, SPEs were an integral factor in the financial crisis, with several banks
using SPEs to hold, package, and sell mortgage-backed securities (Kothari and Lester 2012).
2.3 Tax advantages of SPEs
Tax avoidance represents a continuum of tax planning strategies, where relatively benign
strategies lie at one end, and aggressive or illegal strategies (e.g., tax shelters) lie at the other end
(Lisowsky et al. 2013). Despite many aggressive ways in which SPEs can be used for tax avoidance
(McGill and Outslay 2004), SPEs can promote tax planning along the entire continuum. However,
regardless of where tax planning falls on the continuum, the mere inclusion of a SPE in a firm’s
organizational structure does not automatically generate tax savings. For example, while SPEs often
use legal forms that are not subject to entity-level taxes on profits (e.g., partnerships), the net
income/loss of such forms “flow through” to the sponsor’s tax return. Similarly, tax savings are
seemingly generated when non-consolidated SPEs face higher tax rates than the sponsor; but,
different tax rates do not necessarily result in cash tax savings when the entire group (sponsor and
SPE) is viewed as a whole.11 Thus, rather than generate tax savings, SPEs facilitate tax savings by
allowing sponsors to (1) conduct a greater level of tax-advantaged transactions, and/or (2) enhance
the tax efficiency (i.e., relative tax savings) of such transactions. Eq. (1) stylizes this logic:
𝑇𝑇𝑇𝑇𝑇𝑇𝑇𝑇𝑇𝑇 𝑇𝑇𝑇𝑇𝑇𝑇 𝑆𝑆𝑇𝑇𝑆𝑆𝑆𝑆𝑆𝑆𝑆𝑆𝑆𝑆 = 𝑓𝑓(𝐿𝐿𝐿𝐿𝑆𝑆𝐿𝐿𝑇𝑇,𝐸𝐸𝑓𝑓𝑓𝑓𝑆𝑆𝐸𝐸𝑆𝑆𝐿𝐿𝑆𝑆𝐸𝐸𝐸𝐸) (1)
By allowing sponsors to conduct a greater level of tax-advantaged transactions (Level in Eq.
(1)), SPEs facilitate tax savings in many ways. For example, by holding high-risk assets, SPEs can
11 Financial reporting consolidation standards changed during our sample period from a 50% ownership test before 2003, to a majority of rewards, losses, or risks threshold from 2003 to 2009 (FIN 46), to a qualitative test of a sponsor’s ability to direct the activities or absorb the losses of an entity after 2009 (SFAS 167). For tax reporting purposes, entities can be consolidated if they are owned 80% or more, unless “check-the-box” regulations apply. Inferences remain the same across these reporting regimes, suggesting that our results are not driven by the inclusion or exclusion of SPEs with lower effective tax rates than those of the consolidated group.
11
increase a sponsor’s debt capacity which, in turn, can lead to greater tax deductible interest
expenditures and fewer cash tax payments (Graham 2000; Blouin et al. 2010). Due to their ability to
attract additional financing, SPEs can also acquire and hold depreciable assets, R&D projects
(Shevlin 1987; Beatty et al. 1995), and securitized assets (Landsman et al. 2008), which further
increase a sponsor’s depreciation deductions, tax credits, and bad debt deductions, respectively.
SPEs also facilitate tax savings across the tax avoidance continuum by enhancing the tax
efficiency of transactions (Efficiency in Eq. (1)). In particular, SPEs can help sponsors enhance the
relative tax savings of transfer pricing and profit shifting to more tax-favorable jurisdictions. For
example, in the “Double Irish With a Dutch Sandwich” tax planning strategy pioneered by Apple,
Inc., a sponsor uses a SPE to relocate intangibles (e.g., patents) to other countries (e.g., Ireland) to
benefit from lower tax rates and advantageous tax treatments of intangibles (Forbes and Sharma
2008; Duhigg and Kocieniewski 2012).12 These types of strategies have become so popular that the
OECD (2013) now views legal ownership of intangibles as merely a reference point for determining
actual ownership, and has labeled SPEs as a major source of international tax treaty abuse in Action
6 of its Base Erosion and Profit Shifting Project (OECD 2015a).
U.S. domestic firms can similarly enhance the tax efficiency of tax-advantaged transactions
by using SPEs in low-tax states. Gupta and Mills (2002) find that firms operating in multiple states
reduce taxes by exploiting differences in state tax rates and rules. One example is Wal-Mart’s use of
captive real estate investment trusts, a specific type of SPE, to shift profits from high-tax states into
low-tax states (Drucker 2007). In addition, Dyreng et al. (2013) find that corporate subsidiaries in
Delaware and opportunities to shift profits between states are associated with lower state ETRs, and
Fox and Luna (2005) show a decrease in state tax collections as the number of limited liability
companies (a common legal form of SPEs) in a state increases. Overall, these examples show how
12 More generally, firms are able to transfer property with untaxed built-in gains to low-tax jurisdictions without paying tax on the transfer if they use a pass-through SPE to complete the transfer (Madara 2017).
12
SPEs enhance the relative tax savings of transactions by facilitating the movement of taxable profit
from high-tax to low-tax jurisdictions.
Lastly, at the aggressive end of the tax avoidance continuum, SPEs can enhance the relative
tax savings of tax shelters. In the early 2000s, the IRS caught some firms using SPEs to accelerate
the cost recovery of fixed assets, resulting in greater tax depreciation deductions (JCT 2003). More
complex shelters used SPEs to generate “double deductions” for a single loss. For instance, using
losses from prior asset sales (along with dividends subject to the dividends received deduction),
Enron Corp. sold low tax basis SPEs (sometimes to other Enron SPEs) at a loss. These transactions
resulted in federal tax savings of $2.2 billion, about 85% of which was facilitated by SPEs.13
In sum, the examples above illustrate how SPEs can increase the level of tax-advantaged
transactions or enhance the relative tax savings of transactions. These examples also illustrate that
interpreting the tax effects of SPEs is nuanced. Most level-increasing tax savings of SPEs may arise
in conjunction with other non-tax benefits (e.g., greater debt capacity), while efficiency-increasing
effects of SPEs may reflect a more tax-motivated business strategy to achieve tax savings (Scholes et
al. 2014). SPEs can also increase both the level and efficiency of transactions concurrently. See
Appendix A for more examples.
2.4 Tax disadvantages of SPEs
Despite the vast potential for tax planning, SPEs might not facilitate an economically large
amount of tax savings. SPEs enable a wide variety of transactions, many of which are not tax-
advantaged or for which tax savings is not the primary objective. Such transactions can include
securitizations (Landsman et al. 2008), synthetic leases with similar book/tax reporting (Zechman
2010; Callahan et al. 2013), asset-backed commercial paper conduits (Bens and Monahan 2008), and
13 JCT (2003) provide further details on this transaction, and SPEs and tax shelters more generally. The tax savings amounts are estimates as Enron went bankrupt before realizing all of the tax savings from these structures. Even though Enron is a classic example, transactions that use SPEs set up as partnerships to generate “double deductions” have persisted into recent years (Sheppard 2017).
13
others (Zion and Carcache 2003; Soroosh and Ciesielski 2004; Basel 2009). In addition, many firms
use parent-subsidiary organizational structures, particularly in states with favorable laws, to both
limit and contain legal liability from business operations (Davis et al. 2002). More generally, Feng et
al. (2009) find that financial reporting pressures, governance, and other non-tax factors drive SPE
use, implying that tax avoidance may not be a primary objective. Aside from setup costs, SPEs can
reduce information quality (Feng et al. 2009), increase regulatory scrutiny (Internal Revenue Bulletin
2011-39; Inland Revenue 2013), and heighten public pressure (Dyreng et al. 2016), among other
costs.14 Thus, SPEs are not necessarily an optimal tax planning tool once all non-tax costs are
considered (Scholes et al. 2014).
SPEs can even lead to higher taxes, especially if ex post events affect the realization of
expected tax savings. For instance, tax authorities can disallow tax positions upon audit and levy
severe penalties. Wilson (2009) finds that interest and penalties arising from tax shelters account for
49% of total assessed deficiencies. Transfer prices in cross-border transactions can also be adjusted
by tax authorities upon audit. If a jurisdiction does not allow for an offsetting adjustment, double-
taxation of the same transaction can be a costly outcome (Wittendorff 2010).
2.5 Research questions
We focus on three related research questions, which are novel because prior research
primarily considers the tax effects of different transactions rather than the organizational structures
facilitating such transactions. As separate legal entities, SPEs do not directly generate tax savings,
but instead facilitate tax savings via the level and efficiency effects discussed earlier. Accordingly,
our questions consider both of these effects, as well as the incremental tax savings from SPEs.
First, Section 2.3 (and Appendix A) highlights a number of tax-advantaged transactions
involving SPEs. However, aside from anecdotes in the financial press and government reports, no 14 For example, Enron paid external tax advisors $87.6 million to ensure its SPEs were structured to obtain robust tax savings (JCT 2003). This amount does not include the internal costs of establishing the transactions or the time-value of money effects of paying fees upfront while waiting years to realize any tax benefits.
14
empirical evidence exists on the extent to which these transactions are systematically facilitated by
SPEs. For this reason, and because tax-advantaged transactions vary in the degree to which they can
generate tax savings, we first examine the extent to which SPEs enable sponsors to conduct a greater
level of such transactions (Level in Eq. (1)). Our first research question is as follows:
RQ1: To what extent are specific transactions used within SPEs for tax avoidance?
Second, prior research directly examines the link between SPEs and taxes. Shevlin (1987)
and Beatty et al. (1995) evaluate whether firms with low marginal tax rates (MTRs) are more likely
to use R&D limited partnerships (a specific type of SPE) under the hypothesis that such firms can
transfer tax benefits to affiliates facing higher MTRs. Both studies find evidence consistent with this
hypothesis, suggesting that incentives for tax avoidance (in the form of MTRs) explain SPE use.
However, neither study estimates the magnitude of any resulting tax savings.
In contrast, Feng et al. (2009) find an association between high MTRs and SPE use. Aside
from considering a wider array of SPE organizational forms than the other two studies, Feng et al.
examine the more recent period of 1997-2004 (versus 1975-1984 in Shevlin (1987) and 1978-1992 in
Beatty et al. (1995)). While the opposite results could be explained by examining different types of
SPEs, their findings may suggest a change in how sponsors use SPEs over time, consistent with the
changing role of corporate tax departments over this period (Donohoe et al. 2014). However, Feng et
al. do not estimate the tax savings facilitated by SPEs.
While these three studies offer evidence on the tax incentives for SPE use, we are interested
in whether tax outcomes change (namely, total tax expense and cash taxes paid) as a result of SPE
use. We do not formalize a hypothesis due to the volume of anecdotal evidence (Section 2.3 and
Appendix A) suggesting a positive relation between SPEs and tax avoidance. Instead, we seek to
measure the magnitude of total tax savings facilitated by SPEs (Total Tax Savings in Eq. (1)), which
could be economically small due to the non-tax costs and objectives of SPEs (Section 2.4). Our
second research question is as follows:
15
RQ2: How economically significant are the total corporate tax savings facilitated by SPEs?
Third, due to the paucity of research on the tax outcomes of SPEs, only anecdotes indicate
which transactions generate more tax savings when conducted within (rather than outside) SPEs.
Because the use of SPEs to increase the relative tax savings of transactions likely reflects firms’
motivation to enhance tax avoidance, we also evaluate the extent to which SPEs enhance the tax
efficiency of specific transactions (Efficiency in Eq. (1)). We state our final research question as
follows:
RQ3: For which transactions do SPEs enhance relative corporate tax savings?
3. Research design
3.1 Measures of SPE use
Prior research uses a variety of methods to identify the existence of SPEs, which often rely
on unique data from sponsor directories (Shevlin 1987), DealScan transactions (Zechman 2010), or
searches of financial statement footnotes (Beatty et al. 1995; Landsman et al. 2008; Callahan et al.
2013). Although these methods can identify specific sets of SPE transactions (low Type I error), they
do not always capture the full range of SPEs (high Type II error) because SPEs facilitate a wide
variety of transactions and their existence is disclosed voluntarily in such data sources.
To identify SPEs, we follow Feng et al. (2009) by developing a Python script that counts the
total number of subsidiaries listed in Exhibit 21 (a mandatory filing) whose names contain “Limited
Partnership,” “Limited Liability Partnership,” “Limited Liability Company,” or “trust” for all
electronically-filed Form 10-Ks. Because the SEC’s Office of Chief Accountant and many anecdotes
indicate that SPEs are primarily organized as one of these types of pass-through entities (Feng et al
2009), the script does not count corporate subsidiaries.15 Feng et al. extensively validate this
15 A list of subsidiaries must be disclosed to the SEC as Exhibit 21 to Form 10-K. We also include subsidiaries whose names contain the abbreviations ‘‘L.P.’’, ‘‘LP’’, ‘‘LLP’’, ‘‘L.L.P.’’, ‘‘LLC’’, or ‘‘L.L.C.’’ Consistent with Feng et al. (2009), we do not include non-English-language pass-through subsidiaries. Jurisdictions that use English subsidiary designations include The Bahamas, Bermuda, Canada, Jordan, Singapore, and the U.S., among others.
16
approach to ensure it captures SPEs. In particular, they find that the number of SPEs in Exhibit 21 is
associated with press mentions of SPE use, asset securitizations, and the voluntary mention of SPEs
in financial statements. The advantages of their approach include its (1) ability to identify virtually
all SPEs; (2) mitigation of selection bias by relying on mandatory disclosures; and (3) computational
ease. However, there are two key limitations. First, a company could misclassify its subsidiary list as
something other than Exhibit 21. Second, a company could file Form 10-K in such a way that the
SEC cannot parse out the various exhibits (e.g., as a single text document).
Feng et al. (2009) search directly within Form 10-Ks to overcome the second concern (i.e.,
some exhibits may not be correctly parsed by the SEC). However, their approach is still susceptible
to misclassified subsidiary lists (i.e., the first concern). Therefore, we obtain Exhibit 21 disclosures
from the Filing Exhibits database in the Wharton Research Data Services (WRDS) SEC Analytics
Suite, which only includes exhibits that are correctly classified by the SEC in their filings library. We
then fill missing observations with data kindly provided to us by Feng et al.16 These data, along with
the increase in electronic filing quality during the sample period (e.g., XBRL), mitigate both
limitations noted above and ensure we identify the vast majority of SPE users. Should our approach
fail to identify a SPE user, the economic tax effects we observe will be understated because SPE
users will be incorrectly classified as non-users. In addition, while some SPEs might not be
consolidated in a firm’s financial reports, SEC regulations require the disclosure of consolidated as
Any omission of SPEs organized as corporations understates our estimates of the economic effects of SPE-related tax avoidance. Our Python script was unable to reliably collect the total number of subsidiaries or match specific SPEs and jurisdictions, so we cannot control for total subsidiaries or analyze geographic patterns in SPEs. 16 To obtain as many subsidiary listings as possible, we collect all exhibits in the WRDS SEC Analytics Suite and search among those labeled “EX-21*”, “EX-22*”, or containing “sub” in the description. We also examine all exhibits other than Exhibit 21 by hand and retain those that contain the subsidiary listing, where the firm-year did not otherwise report Exhibit 21 or the exhibit labeled “Exhibit 21” was not a subsidiary list. We find many misclassifications in the early years of the sample, which further motivates our SPE search procedure. Our searches are not affected by HTML quality or readability because the Python script was adapted to accommodate all HTML schema and file types.
17
well as non-consolidated entities in Exhibit 21.17 Because these regulations remain relatively
unchanged since implementation, our approach captures SPE use consistently across time.18
We construct two measures of SPE use: (1) the log of (one plus) the total number of SPE
subsidiaries (SPETOT); and (2) a binary variable (SPEBIN) that equals one for firm-years with a SPE
subsidiary (0 otherwise). Consistent with Feng et al. (2009), we winsorize SPETOT at the top 1% to
reduce the influence of outliers. Both of our measures are highly correlated (ρ>0.98) with those of
Feng et al. across common years (untabulated).19
3.2 Measures of tax avoidance
We use two forward-looking ETRs estimated over three years (t to t+2) to measure tax
avoidance: (1) GAAP ETR (GETR), total tax expense scaled by pre-tax book income less special
items; and (2) cash ETR (CETR), worldwide cash taxes paid scaled by pre-tax book income less
special items (Dyreng et al. 2008; Hanlon and Heitzman 2010). GETR captures tax strategies that
generate permanent differences between book and tax income, as well as tax credits, while CETR
captures tax strategies that generate both permanent and temporary differences between book and tax
(i.e., that affect book income and defer cash tax payments to later periods), as well as tax credits. We
use forward-looking ETRs to capture the diverse effects of SPEs along the entire tax avoidance
continuum (e.g., Lisowsky et al. 2013), which can occur contemporaneously or with a delay.20
17 Under SEC Regulation S-K, a registrant must provide a list of all its material subsidiaries, whether or not they are consolidated for income statement or balance sheet reporting purposes. Under SEC Regulation S-X, the definition of control that is used to determine if an entity is a subsidiary is “the possession, direct or indirect, of the power to direct or cause the direction of the management and policies of a person, whether through the ownership of voting shares, by contract, or otherwise.” However, because disclosure of ownership details is not mandatory, we cannot observe or infer organizational hierarchies (i.e., whether an SPE is owned by the sponsor or another subsidiary). 18 We increase our sample size with the Feng et al. data, but add only 28 SPE observations for 2004 (3%), consistent with an increase in the quality of Exhibit 21 classifications in the SEC electronic filing system over time. 19 By searching the population of Form 10-Ks, Feng et al. (2009) capture Exhibit 21 information regardless of classification errors (i.e., a subsidiary list is not separately identified by the SEC) in the annual report. However, the SEC Analytics Suite allows us to identify subsidiary lists that use file headers other than Exhibit 21. As such, we find subsidiary lists where a keyword search for Exhibit 21 finds no results. In such cases, we obtain some SPE observations where Feng et al. do not, which contributes to the less-than perfect correlation across common years. 20 Consistent with prior studies (McGuire et al. 2012; Donohoe 2015), we drop observations with negative ETR denominators as unprofitable firms are unlikely to have a significant tax liability. Our results are robust to separately
18
3.3 Empirical model
We estimate the following fixed-effects model (i.e., a generalized difference-in-difference
model) for firm i at time t:
𝐸𝐸𝑇𝑇𝐸𝐸𝑖𝑖𝑖𝑖 𝑖𝑖𝑡𝑡 𝑖𝑖+2 = 𝛽𝛽𝑖𝑖0 + 𝛽𝛽1𝑆𝑆𝑆𝑆𝐸𝐸𝑖𝑖𝑖𝑖 + ∑ 𝛽𝛽𝑗𝑗11𝑗𝑗=2 𝑇𝑇𝑇𝑇𝑇𝑇𝑗𝑗𝑖𝑖𝑖𝑖 + ∑ 𝛽𝛽𝑗𝑗20
𝑗𝑗=12 𝐶𝐶𝑇𝑇𝐸𝐸𝐿𝐿𝑗𝑗𝑖𝑖𝑖𝑖 + 𝛿𝛿0𝑖𝑖 + 𝜖𝜖𝑖𝑖𝑖𝑖, (2)
where the dependent variable (ETR) is one of the future-period ETRs described above (GETR or
CETR). The variable of interest, SPE, is alternately SPETOT and SPEBIN. Consistent with SPE use
facilitating tax avoidance, we expect β1<0.
Including firm and year fixed-effects creates a generalized difference-in-differences model,
where β1 is the difference-in-differences estimator of interest. β1 thus captures the effect of changes
in SPE use on ETRs by using each firm as its own control, and can be interpreted as the incremental
effect of SPEs on the tax savings attributable to a transaction. This specification allows for more
robust modeling of time- and firm-effects, and captures a wide range of firm changes (Wooldridge
2010; Roberts and Whited 2013).21 In Section 4, we explain how we adapt this baseline model to
address each of our research questions.
TAT is a vector of tax-advantaged transactions known to influence ETRs (McGuire et al.
2012; Donohoe 2015). To capture elements of corporate borrowing, we include leverage (LEV), net
debt issuances (DISS), and the current portion of long-term debt (CLTD). We include R&D expense
(RDE) and fixed assets (PPE) to reflect both depreciable assets and basis-shifting to tax preferred
assets. Similarly, intangible assets (INTANG) capture amortizable assets, as well as elements of both
(1) controlling for special items and (2) including special items in ETR denominators. We use three-year ETRs to control for variation in tax laws over time, long-run strategies employed by the firm, and settlement of disputes over previously filed tax returns (Dyreng et al. 2008). By doing so, the measures are three-year forward-looking averages of ETRs (t to t+2) computed as of year t while our SPE (and control) variables are generally measured in year t. This design aligns with our research question regarding whether SPE use in year t influences future tax avoidance. 21 We select a fixed-effects estimator over a first-differences estimator because our data is an unbalanced panel (Wooldridge 2010). Results using a first-differences estimator are similar, but statistically weaker than those obtained from fixed-effects estimation, suggesting that fixed-effects is a more efficient estimator. Hausman (1978) tests (untabulated) reject the null hypothesis that replacing firm fixed-effects with industry fixed-effects, or modeling firm effects as random effects, provide an estimator with comparable consistency (p<0.01). F-tests (untabulated) also suggest that firm fixed-effects are statistically significant (p<0.01).
19
U.S. domestic and foreign profit shifting. Net operating loss carryforwards (NOL) capture tax loss
duplication, and mergers and acquisitions (M&A) reflect basis shifting to tax-preferred assets.
Foreign income (FINC) captures elements of foreign profit shifting. Finally, the number of tax haven
subsidiaries (HAVEN; Dyreng and Lindsey 2009) controls for foreign tax deferrals and ensures our
results are not driven by SPEs located in tax haven countries.
CTRL is a vector of control variables. Following prior research (Feng et al. 2009; Donohoe
2015), we include total assets (SIZE), profitability (ROA), book-to-market (BM), cash holdings
(CASH), interest coverage ratio (INTCOV), stock return volatility (SVOL), internal funds (IFUND),
and discretionary accruals (DACC). We also include business segments (BUSSEG) to ensure our
results are not driven by operational complexity.22 All variables are defined in Appendix B.
3.4 Sample selection
We begin with Compustat observations for fiscal years 1997-2011 meeting the following
criteria: (1) publicly traded; (2) domestically incorporated; and (3) positive total assets. Fiscal year
1997 coincides with the effective date of the check-the-box regulations, which permit some entities
to choose a classification for federal income tax purposes, and is also the first year that registrants
electronically filed annual reports with the SEC, a necessity for computing our SPE measures. From
this initial sample, we remove observations with (1) negative three-year pre-tax income; (2)
insufficient data to estimate ETRs; and (3) regulated and financial firms (NAICS codes 22 and 52).23
We require two future years of data to estimate the three-year forward-looking ETRs (i.e., ETRs for
2011 also require data from 2012 and 2013). These screens result in a sample of 54,887 firm-year
observations. Further data criteria for control variables yield 25,533 observations from 4,566 unique
22 Prior research finds that corporate governance explains both tax avoidance (Desai and Dharmapala 2006) and SPE use (Feng et al. 2009). Because governance characteristics are “sticky” over time and the relevant data reduces our sample by 66%, we include firm fixed-effects in Eq. (2) instead. Nevertheless, in untabulated tests, we find similar results after controlling for the (1) bonus portion of executive compensation, (2) percentage of shares held by executives, (3) percentage of shares held by independent board members, and (4) proportion of independent board directors. Also, estimating Eq. (2) on this smaller sample (without governance variables) yields similar results. 23 We exclude regulated and financial firms as they face fundamentally different financial and tax reporting rules.
20
firms. Table 1 summarizes the sample selection process.
4. Main results
4.1 Descriptive statistics and univariate tests
Panel A of Table 2 reports the temporal distribution of the number of SPEs and SPE users,
which exhibit nearly monotonically-increasing growth over the sample period. From 1997 to 2011,
the total number of SPEs used by sample firms increased from 605 to 18,436 (a growth rate of over
3,000%), while the number of firms using SPEs increased by over 600% (from 165 to 999). Only
9.4% of sample firms used SPEs in 1997, but 62.1% used SPEs by 2011. Feng et al. (2009) document
several firm-level determinants of this growth in SPE use; however, another potential explanation is
the enactment of the check-the-box regulations in 1997, which increased the tax advantages of
subsidiaries structured as pass-through entities (Munden et al. 2002).
<INSERT TABLES 1-2 & FIGURE 1 ABOUT HERE>
Recent research finds that ETRs are decreasing over time (Dyreng et al. 2017), consistent
with the changing role of corporate tax planning from a compliance-focused activity to a profit
enhancing objective to a risk management function (Donohoe et al. 2014). This finding inversely
mirrors the temporal growth in SPEs shown in Panel A of Table 2. To further illustrate, Figure 1
plots average GAAP ETRs (GETR) and the total number of SPEs used by sample firms over time.
The strong negative relation provides univariate evidence that corporate use of SPEs coincides with
the decline in ETRs over (at least) the 15-year sample period.24
Panel B of Table 2 reports industry distributions for the number of SPEs, SPE users, and non-
users by two-digit NAICS code. Industries with a higher concentration of SPEs are those with more
intangibles (arts and entertainment), legal risk (construction), or both (health care), whereas
industries with fewer intangibles (agriculture, transportation) have a lower concentration of SPEs.
Firm fixed-effects in Eq. (2) control for any industry-related confounds. 24 We find a similar, yet slightly more volatile, pattern using cash ETRs (CETR).
21
<INSERT TABLE 3 ABOUT HERE>
Table 3 reports descriptive statistics for measures of tax avoidance (ETR), SPE use (SPE),
tax-advantaged transactions (TAT), and controls (CTRL), along with t-statistics for mean tests of
differences between SPE users and non-users, where GETR is the dependent variable.25 Means and
medians of GETR and CETR are between 24.1% and 30.1%, similar to prior studies. Relative to non-
users, SPE users have significantly smaller mean GETR (27.2% vs. 28.4%) and CETR (24.7% vs.
27.2%). These tests suggest that SPE users avoid more taxes than non-users. Further, about 41.5% of
sample firms use SPEs (SPEBIN), with about 5 SPEs (SPETOT) per user (1.869 in log form).
Statistics for other variables are similar to prior studies and suggest that SPE users and non-
users differ across several features. For example, relative to non-users, SPE users are larger (SIZE),
more levered (LEV), less profitable (ROA), and have less R&D (RDE). We include firm fixed-effects
in Eq. (2) to model observable (and unobservable) differences.26 Pearson correlations (untabulated)
indicate that SPE use is negatively related to both ETRs (p<0.01), consistent with expectations. Also,
business segments (BUSSEG) and tax havens subsidiaries (HAVEN) are positively correlated with
SPEBIN (ρ=0.079 and 0.382, respectively), suggesting it is important to control for these structures.
Variance Inflation Factors (untabulated) reveal no issues with multicollinearity.
4.2 Relation between SPEs and corporate tax avoidance
We begin our multivariate analyses by providing the first large-sample empirical evidence on
the overall relation between SPEs and corporate tax avoidance. Table 4 reports estimates of Eq. (2)
for both measures of ETRs and SPEs. We find that both the change in the number of SPEs (SPETOT)
and use of SPEs (SPEBIN) are negatively and significantly associated with future GAAP (GETR) and
cash (CETR) ETRs across the four columns. These results suggest SPEs facilitate tax avoidance
above and beyond common tax-advantaged transactions (vector TAT) and other controls (vector 25 When CETR is the dependent variable, there are 23,543 observations in the full sample, 10,284 SPE Users, and 13,259 Non-Users. All statistics are similar across both sets of subsamples and t-statistics remain significant. 26 We evaluate the endogeneity surrounding the choice to use SPEs in Section 5.3.
22
CTRL) included in the model. The coefficients for explanatory variables are largely consistent with
prior research. For example, ETRs are negatively associated with leverage (LEV), net operating loss
carryforwards (NOL), and foreign income (FINC). However, coefficients for R&D (RDE) and tax
haven subsidiaries (HAVEN) are not significant.27 In sum, consistent with the anecdotes discussed
earlier, SPEs are strongly associated with greater corporate tax avoidance.
<INSERT TABLE 4 ABOUT HERE>
4.3 Path analysis (RQ1 and RQ2)
Path analysis belongs to a class of structural equation models that provide explanations of
correlation structures (Bhattacharya et al. 2012; Gow et al. 2016). We use it to decompose the
relation between the source (causal) variables, our TAT vector, and outcome variable, ETR, shown in
Table 4 into direct and indirect paths. Recall that as separate entities, SPEs do not directly generate
tax savings. Rather, they facilitate tax savings, in part, by allowing sponsors to conduct a greater
level of tax-advantaged transactions. Using path analysis, we evaluate the extent to which the tax-
advantaged transactions measured by vector TAT in Eq. (2) are used within SPEs to incrementally
avoid more taxes (RQ1; Level in Eq. (1)). We then use the results to estimate the total tax savings
likely facilitated by SPEs (RQ2; Total Tax Savings in Eq. (1)).
Bhattacharya et al. (2012) compare path analysis to regression analysis, noting two relevant
issues for our study. First, like regression analysis, path analysis requires the researcher to postulate
source, mediating, and outcome variables. This ex ante specification can be based on theory and/or
substantive knowledge-based reasoning about the linkages among the variables. Figure 2 diagrams
the recursive path (links flow in only one direction) that we consider among manifest (observable)
27 In untabulated tests, we drop SPE from Eq. (2) and find that the coefficient for HAVEN is negative and significant (insignificant) in regressions of GETR (CETR). We find similar results for non-users. The SPE results also hold for observations without a tax haven subsidiary. Collectively, this evidence suggests that the effect of HAVEN on tax avoidance is subsumed by SPE and other controls, and SPE has an incremental effect on tax avoidance beyond HAVEN. This outcome likely occurs when firms structure their tax haven (and other) subsidiaries as SPEs.
23
variables, which is guided by the anecdotal evidence discussed in Section 2.3 and Appendix A.28
Second, whereas regression analysis evaluates overall effects, path analysis considers the
existence and relative importance of alternative (indirect) paths of influence that jointly create the
overall effects. For example, with SPE in Eq. (2), the coefficients for the vector of tax-advantaged
transaction variables (TAT) capture the direct effect of each measured transaction on ETRs absent the
use of SPEs (i.e., the solid arrows in Figure 2). Thus, if TAT variables perfectly measure every tax-
advantaged transaction facilitated by SPEs, the coefficient for SPE will equal zero because (1) the
direct effects of each transaction are captured by TAT variable coefficients, and (2) regression
analysis ignores indirect effects (i.e., the dashed arrows in Figure 2). However, because it is
inherently difficult to measure the array of transactions facilitated by SPEs, the coefficient for SPE
captures the direct and indirect effects of unmeasured transactions (i.e., those not captured by TAT
due to measurement error or omission). Path analysis identifies and measures the relative importance
of such indirect effects, ultimately allowing us to infer the incremental effect of SPEs on the level of
tax-advantaged transactions captured by TAT as well as those not captured by TAT.
4.3.1 Level of tax-advantaged transactions used within SPEs (RQ1)
The output of path analysis includes path coefficients that link the postulated variables. In our
setting, we are interested in three sets of path coefficients: (1) Total coefficients, which reflect the
total (direct and indirect) effect of each tax-advantaged transaction measured by vector TAT on
ETRs; (2) Direct coefficients, which reflect the direct effect of each measured transaction on ETRs
absent SPEs; and (3) Indirect coefficients, which reflect the indirect (incremental) effect of each
measured transaction on ETRs within (i.e., facilitated by) SPEs. To gauge the relative importance of
the indirect effects and address RQ1 (Level in Eq. (1)), we also estimate the proportion of the total
effect that is incrementally facilitated by SPEs, which we term Indirect% (i.e., the ratio of the
28 SPEs are the mediator of interest because they do not result in tax savings without having tax-advantaged transactions within them. Thus, switching the order of our path analysis would result in invalid inferences.
24
indirect effect to total effect).
<INSERT FIGURE 2 & TABLE 5 ABOUT HERE>
We conduct our path analysis in three steps. First, we map each tax-advantaged transaction in
Section 2 and Appendix A to at least one variable in vector TAT (see Figure 2).29 For example, NOL
reflects loss duplication by firms with NOLs, while INTANG and FINC reflect tax avoidance via
transfer pricing. Second, we standardize each variable (subtract the mean and divide by standard
deviation) to simplify the coefficient comparisons. Third, consistent with methodological best
practices (Iacobucci 2009; LeBreton et al. 2009; Zhao et al. 2010), we estimate Eq. (2) as a full-
information maximum likelihood structural equations model to obtain coefficients of interest that
explain the causal path illustrated in Figure 2 (further details below).
Table 5 presents path coefficients. For brevity, we only report results for SPETOT (results for
SPEBIN are similar). In the Total columns, we estimate Eq. (2) without SPETOT to examine the total
(direct and indirect) effect of each variable on GETR (Panel A) and CETR (Panel B). In the Direct
columns, we estimate Eq. (2) with SPETOT such that the coefficients for other variables capture the
direct effect of each variable on ETRs, controlling for the use of SPEs. Finally, the Indirect columns
report the difference between Total and Direct, which reflects the incremental effect of each variable
on ETRs within, or incrementally facilitated by, SPEs.30 A negative (positive) indirect effect
indicates that SPEs result in more (less) tax avoidance for a given variable.31 For instance, the
29 We separately examine tax shelters in Section 5.1. 30 The total effect represents the sum of the direct and indirect effects; thus, the indirect effect is measured as the total effect less the direct effect. 31 We compute standard errors for indirect effects using the Sobel Multivariate Delta Method (Sobel 1982), adjusted for firm-level clustering. However, because Sobel standard errors rely on strict normality assumptions, in untabulated tests we re-estimate Eq. (2) using bootstrapped standard errors (Preacher and Hayes 2004; Zhao et al. 2010). Inferences remain the same (with improved statistical significance in many cases). Because the t-statistics for total and direct effects are based only on the information in a single regression, while the t-statistics for indirect effects use information from both the total and direct regressions, thus giving them more power, it is not unusual to find statistically significant indirect effects even when only one (or neither) of the total and direct effects is statistically significant. Traditionally, a four-part test was used to infer statistically significant mediation (Baron and Kenny 1986). However, recent research shows that a significant indirect effect from a path analysis is sufficient to indicate mediation (LeBreton et al. 2009; Zhao et al. 2010).
25
negative indirect coefficients for LEV and RDE suggest firms facilitate tax avoidance by placing a
portion of debt and R&D, respectively, within a SPE. To gauge the effects, Indirect% reports the
proportion of the total effect occurring within SPEs (|Indirect/Total|). This ratio is interpreted, for
example, as follows: a one standard deviation increase in leverage (LEV) results in a 0.030 standard
deviation decrease in GETR, where 0.001 of such decrease occurs from leverage located in SPEs and
0.029 occurs from leverage not located in SPEs. That is, 3.6% (0.001/0.029) of the total tax savings
from leverage is incrementally facilitated by debt located within SPEs.
The results in Table 5 indicate that the tax savings from several tax-advantaged transactions
measured by vector TAT are incrementally greater when located within rather than outside of SPEs.
That is, the relation between ETRs and several TAT variables are facilitated by SPEs. Specifically,
3.6% of total tax expense (GETR) and 1.8% of cash tax savings (CETR) generated by leverage (LEV)
occurs within (i.e., is facilitated by) SPEs. In addition, 2.0% of tax expense and 3.3% of the cash tax
savings from NOLs (NOL), 6.6% and 8.7% of the tax savings from R&D (RDE), and 3.5% and 6.1%
of the tax savings from intangibles (INTANG) are facilitated by SPEs.
The results also indicate that 34.6% of tax expense (GETR) and 331.2% of cash tax savings
from tax havens (HAVEN) are facilitated by SPEs. The amount of cash tax savings is large because
tax havens are not associated with lower ETRs in our sample (Table 4), implying that tax havens
combined with SPEs reduce ETRs more than tax haven jurisdictions alone. In other words, because
only the indirect effect of HAVEN is significant for CETR, most of the cash tax savings from tax
havens likely occurs within SPEs. This result is consistent with recent anecdotes of firms using SPEs
to place specific assets (e.g., intangibles) in tax haven jurisdictions (Forbes and Sharma 2008;
Duhigg and Kocieniewski 2012). Similarly, the insignificant total effect combined with the negative
and significant indirect effect for HAVEN can occur when tax haven transactions not held within
SPEs increase ETRs. This situation arises when non-SPE tax haven subsidiaries incur large financial
penalties and related interest charges from tax authorities (perhaps by attracting scrutiny), experience
26
double taxation of transactions due to transfer pricing adjustments by tax authorities, or otherwise
structure transactions in a tax inefficient manner.
Finally, SPEs reduce the (1) scale effects of assets (SIZE), (2) ability to use cash holdings
(CASH) to obtain tax savings; and (3) tax savings from debt issuances (DISS) likely by improving
financing terms (Mills and Newberry 2005). Overall, these findings are consistent with SPEs
facilitating a greater level of the tax-advantaged transactions in an economically meaningful way.
4.3.2 Total tax savings facilitated by SPEs (RQ2)
The path analysis provides a setting in which to estimate the total tax savings facilitated by
SPEs (RQ2; Total Tax Savings in Eq. (1)). We use coefficient estimates in each column of Table 5 to
compute average firm-level and sample-level tax savings. We also compute maximum firm-level and
sample-level tax savings using the untabulated lower (most negative) bound of the 95% coefficient
confidence interval.32 To estimate the direct effects—the tax savings attributable to SPE-facilitated
transactions not captured by vector TAT—we use the coefficient for SPETOT to compute the effect
that moving from zero SPEs to the mean number of SPEs (5.48) held by sample firms has on GETR
and CETR (i.e., the percentage point reduction in each ETR).33 To estimate the indirect effects—the
tax savings attributable to SPE-facilitated transactions—we sum coefficients for all TAT and CTRL
variables in the Indirect column of Table 5, and compute the effect that moving from zero to the
mean number of SPEs has on ETRs. Finally, to estimate the total effects—the direct and indirect
effect of SPE-facilitated transactions—we sum the direct and indirect ETR effects. We then compute
average firm-level (sample-level) tax savings as the product of the (a) absolute value of the ETR
effects and (b) average firm-level (sample-level) sum of pre-tax book income less special items for
SPE users ($624.5 million and $6.621 trillion for firm-level and sample-level estimates,
32 We focus on the lower bound because tests reported in Section 5 suggest the coefficient estimates are understated. 33 Specifically, because variables are standardized, we multiply ETR coefficients by the standard deviation of GETR and CETR (0.190 and 0.207, respectively), divide by the standard deviation of SPETOT (1.150), and then multiply by the mean of SPETOT (1.869).
27
respectively). This approach is similar to Donohoe (2015).
<INSERT TABLE 6 ABOUT HERE>
Panel A of Table 6 reports estimates of the tax savings due to SPE-facilitated transactions (1)
not captured by vector TAT (direct effects); (2) captured by vector TAT (indirect effects); and (3)
combined (total effects). For the direct effects, we find that moving from no SPEs to the average
number of SPEs is related to GAAP (GETR) and cash (CETR) ETRs that are 1.1 and 0.9 percentage
points lower than non-users, respectively. For the indirect effects, moving from no SPEs to the mean
number of SPEs results in a 0.4 and 0.3 percentage point reduction in GAAP and cash ETRs,
respectively. Thus, in total, SPE users have GAAP and cash ETRs that are 1.6 and 1.2 percentage
points lower than non-users, respectively. As a percentage of mean ETRs (see Table 2), SPE users
have GAAP and cash ETRs that are 5.6% and 4.4% lower than non-users, respectively. At the firm-
level, these total effects equate to average GAAP and cash tax savings of $9.84 million and $7.77
million per year, respectively. At the sample-level, the cash tax savings is over $82.4 billion, or 1.9%
of total U.S. federal corporate tax collections during 1997-2013. However, these average amounts
could be as large as $165 billion.
To place the estimates in perspective, Panel B of Table 6 compares the total SPE-facilitated
tax savings to the savings from other types of tax planning. Both the aggregate and annual cash tax
savings facilitated by SPEs are markedly larger than the savings from “round-tripping” (Hanlon et al.
2015), tax shelters (Wilson 2009), derivatives (Donohoe 2015), subsidiaries in tax havens (Dyreng
and Lindsey 2009), and deferral of U.S. taxes by placing non-U.S. income in tax havens (Dyreng and
Lindsey 2009). These comparisons help explain why global regulators (JCT 2011; Basel Committee
on Bank Supervision 2009), tax authorities (Internal Revenue Bulletin 2011-39; Inland Revenue
2013), and investors (Feng et al. 2009) are interested in the tax effects of SPEs.
4.4 Moderation analysis (RQ3)
Moderation analysis considers whether the relation between two variables depends on (is
28
moderated by) a third variable. Recall that as separate entities, SPEs do not generate tax savings,
rather they facilitate tax savings by allowing sponsors to conduct a greater level of tax-advantaged
transactions and/or enhance the tax efficiency of such transactions. We use moderation analysis to
estimate the extent to which SPEs enhance the tax efficiency, or relative tax savings, of tax-
advantaged transactions (RQ3; Efficiency in Eq. (1)). That is, we evaluate if transactions generate
more or less tax savings when performed within versus outside of SPEs, holding level constant.
In general, moderation and path analysis can produce similar results if, all else equal, firms
conduct transactions within SPEs when SPEs make the transactions more tax-advantaged. This
outcome would suggest that tax savings are a primary goal for placing a transaction within a SPE.
Results will differ, however, when SPEs contain tax-advantaged transactions, but ultimately make
the related tax avoidance less efficient (i.e., the non-tax benefits of SPEs exceed any loss in tax
savings; see example 2 in Appendix A). Similarly, results will differ if the firm does not use SPEs for
tax-advantaged transactions, even if SPEs would make tax avoidance more efficient (i.e., the non-tax
costs of SPEs exceed any gain in tax savings). As a result, moderation analysis provides insight into
the tax and non-tax costs of facilitating SPE-based transactions (Scholes et al. 2014).
We implement moderation analysis by estimating Eq. (2) with an interaction term between
SPETOT and each covariate, where all variables are demeaned and standardized.34 Table 7 presents
the results for GETR and CETR in Panels A and B, respectively, where column (1) reports the main
effect of each covariate, column (2) reports the interaction between SPETOT and the relevant
covariate, and column (3) reports estimates of the extent to which SPEs enhance the tax efficiency
savings of tax-advantaged transactions captured by each covariate.
The results are interpreted as follows. First, the main effect for SPETOT (column (1)) reflects
the effect of SPEs on ETRs at the mean level of both SPEs and all covariates. For example, in Panel 34 We find similar results when interactions between SPETOT and each covariate are added one at a time in separate model estimations. The results are also robust to (1) including interactions between SPETOT and vector CTRL (rather than only vector TAT) and (2) substituting SPEBIN for SPETOT.
29
A, a one standard deviation increase in SPETOT (1.150, or 2.2 SPEs unlogged; Table 3) results in a
0.038 standard deviation decrease in GETR (measured at the mean of SPEs and other variables).
Likewise, a one standard deviation increase in LEV (0.183; Table 3) is associated with a 0.034
standard deviation decrease in GETR. Second, the interaction effect (column (2)) captures the effect
of SPEs on GETR changes as each covariate changes. For instance, for a one standard deviation
increase in SPETOT, the effect of a one standard deviation increase in LEV is associated with a
further 0.002 standard deviation reduction in GETR (totaling 0.036=0.034+0.002) at the mean of
LEV and other covariates (except SPETOT, which increased by one standard deviation).35 Third, the
percentage change (column (3)) measures the relative increase in tax savings from SPEs. For
example, at the mean of SPETOT, a one standard deviation increase in RDE results in a 0.027
standard deviation decrease in GETR (column (1)). If SPETOT increases by one standard deviation,
the effect of a one standard deviation increase in RDE is a 0.052 (0.027+0.025) standard deviation
decrease in GETR. The incremental reduction in GETR (0.025) due to the increase in SPETOT
reflects a 92.6% increase in tax savings relative to no change in SPETOT (0.025/0.027).
<INSERT TABLE 7 ABOUT HERE>
The path analysis (Table 5) indicates that a portion of the total tax savings from debt (LEV)
occurs within SPEs. However, the positive interaction coefficients (column (2)) for LEV in Panel B
and CLTD in Panel A of Table 7 indicate that debt within SPEs is 47.8–53.8% less efficient at
generating tax savings than debt elsewhere in the organizational structure (Efficiency in Eq. (1)),
although this result does not consider that SPEs can increase a firm’s financing capacity (Level, as
estimated in Table 5). Similarly, the positive interaction for NOL in Panel A reveals 47.5% more total
tax savings (GETR) when transactions related to NOLs are conducted outside of SPEs.
Conversely, R&D (RDE) and intangibles (INTANG) are associated with 92.6% and 72.5%
greater total tax savings, respectively, when held within SPEs. This result occurs when SPEs are used 35 In this example, the 0.002 additional reduction in GETR is not statistically significant.
30
to shift profits or duplicate tax credits, losses, and deductions relating to R&D and intangibles. In
such cases, profit shifting is likely between U.S. states or between the U.S. and non-tax havens given
that HAVEN is included in Eq. (2). Moreover, because these results hold for GETR but not CETR, the
tax savings from R&D and intangibles transactions are likely due to permanent book-tax differences.
Finally, the negative interaction coefficient for M&A in Panel B suggests SPEs facilitate cash tax
savings (CETR) from mergers/acquisitions by 53.3%, even though the overall magnitude of such
savings is not large (as shown in Table 5). In contrast to R&D and intangibles-based transactions,
these tax savings are likely due to temporary (timing) book-tax differences that accelerate deductions
or delay income recognition for tax reporting purposes relative to GAAP.
Overall, while the path analysis (Table 5) indicates that an economically large portion of the
tax savings from leverage, NOL carryforwards, and tax havens occur within SPEs, the moderation
analysis (Table 7) reveals that SPEs do not also enhance the tax efficiency of these transactions. That
is, SPEs facilitate tax avoidance by enabling sponsors to conduct a greater level of these tax-
advantaged transactions (Level in Eq. (1)) rather than by enhancing their relative tax savings
(Efficiency in Eq. (1)). For R&D and intangibles, however, SPEs both enable a greater level of
transactions and enhance the total tax efficiency of these transactions.36
We acknowledge that our tests focus on tax costs/benefits. If non-tax benefits (e.g., lower
financing costs, limited liability) exceed the potential tax savings, then conducting leverage, NOL
carryforwards, and tax haven transactions within SPEs could still be optimal for a sponsor (Scholes
et al. 2014). This reasoning likely explains why sponsors still use SPEs to conduct a greater level of
these types of transactions. For R&D and intangibles, however, the increase in tax savings from an
SPE is likely a primary motive for using SPEs.
36 It is econometrically (and conceptually) challenging to investigate any cross-sectional variation of these findings. For example, testing whether firms with higher R&D have a greater increase in the tax efficiency of R&D than firms with lower R&D requires partitioning the dependent variable on the independent variable of interest, which biases any estimates of the moderation effect.
31
5. Other tests
5.1 Tax aggressiveness
We use GETR and CETR to capture tax positions along the entire tax avoidance continuum.
However, because SPEs have played a prominent role in many corporate tax shelters, we directly
consider the relation between SPEs and aggressive tax planning; that is, tax positions with weak legal
support that push the envelope of tax law (Hanlon and Heitzman 2010). We re-estimate Eq. (2) after
replacing ETR with two measures of tax aggressiveness: (1) natural log of the FIN 48 tax reserve
(LNUTB), available for fiscal years 2007-2011 (Lisowsky et al. 2013); and (2) predicted tax shelter
score (TSSCORE), available for the entire sample period (Lisowsky 2010). We report the results in
columns (1) and (2) of Table 8, respectively.
<INSERT TABLE 8 ABOUT HERE>
The results in column (1) suggest firms using more SPEs have larger reserves for uncertain
tax positions, which aligns with the main result that SPEs facilitate transactions along the entire tax
avoidance continuum. In column (2), the results reveal a negative relation between SPEs and the
likelihood of tax shelter participation. As such, uncertain and/or aggressive tax positions other than
tax shelters (e.g., transfer pricing, basis replication) likely drive our main results. The negative
relation also suggests that SPEs possibly substitute for tax shelters; however, we leave further
analysis on these links for future research.37
5.2 Location of SPE-based tax avoidance
To examine where SPE-based tax avoidance occurs, we re-estimate Eq. (2) after adding an
indicator variable, DOM, equal to one for U.S. domestic firms (i.e., no foreign income); 0 otherwise,
and its interaction with SPETOT. We report the results in columns (3) and (4) of Table 8. The
37 In untabulated tests, we find an insignificant coefficient for SPEBIN when TSSCORE is the dependent variable. We also remove control variables from Eq. (2) that are inputs of TSSCORE (Lisowsky 2010) and re-estimate using both SPE measures. We find an insignificant coefficient for SPETOT and a positive and significant (p<0.05) coefficient for SPEBIN. Because the omitted controls include many key determinants of tax avoidance, we conclude that there is weak evidence of a relation between SPEs and the likelihood of tax shelter participation.
32
interaction coefficients suggest less or similar levels of tax avoidance facilitated by SPEs for
domestic-only firms relative to multinational firms, highlighting the need for research on the tax
effects of organizational structures beyond its current focus on multinational firms (see Section 2.1).
Further, because GETR does not capture tax savings that will reverse in the future (but CETR does),
the interactions also imply that U.S. multinational SPE users obtain tax savings primarily through
permanent book-tax differences.38
To evaluate the primary jurisdiction in which SPEs facilitate tax savings, we replace ETR
with a firm’s U.S. federal ETR (FED), foreign ETR (FRN), and state ETR (STA), and report results
in columns (5), (6), and (7) of Table 8, respectively. The sample size for these tests declines as not all
firms disclose these components, and the foreign ETR applies only to U.S. multinationals. We only
find a negative and significant coefficient for SPETOT when the U.S. federal ETR (FED) is the
dependent variable. Thus, we conclude that the tax savings facilitated by SPEs is likely driven by a
reduction in U.S. federal income tax liabilities.
We also consider if SPE-based tax avoidance predominantly occurs in one or more specific
industries. For instance, anecdotes suggest that high-tech and/or high-intangible firms (e.g., Apple,
Inc.) use SPEs to relocate patents to tax favorable jurisdictions (Forbes and Sharma 2008). We re-
estimate Eq. (2) separately for the eight largest industries in our sample (based on the number of
observations to ensure sufficient statistical power).39 The (untabulated) coefficients for SPETOT and
SPEBIN are significantly negative for many of these industries when either GETR or CETR is the
dependent variable. Thus, we conclude that SPE-based tax avoidance is pervasive and not simply
confined to high-tech or intangibles-intensive firms.
38 For example, domestic firms could have more temporary differences (e.g., accelerated depreciation) than multi-national firms, which decrease cash ETRs (by lowering cash taxes paid) but not GAAP ETRs because of deferred tax accounting rules under ASC 740, Income Taxes. 39 Specifically, we examine the following industries: (1) Mining, Oil, and Gas Extraction; (2) Food and Apparel Manufacturing; (3) Woods and Petroleum Products Manufacturing; (4) Other Manufacturing; (5) Consumer Retail; (6) Transportation; (7) Information; and (8) Professional Services.
33
5.3 Endogeneity
Endogeneity is an issue for our study because firms choose whether and to what extent they
use SPEs. While firm and year fixed-effects in Eq. (2) control for the endogeneity linked to firm-and
time-invariant factors, respectively, the tax savings estimates in Table 5 can be biased if other
unobservable factors affect the decisions to use SPEs and avoid taxes. We consider this issue with a
two-stage control function procedure known as an endogenous switching model (Heckman 1979;
Maddala 1991; Vella and Verbeek 1999; Tucker 2010).40 To be a consistent estimator, all variables
from the second-stage regression must be included in the first-stage binary choice model (e.g.,
SPEBIN=1 or 0). However, binary choice models (e.g., probit) cannot be “identified” with firm
fixed-effects, which we include in Eq. (2), because they can theoretically expand to infinity under
regression asymptotics. Therefore, we use an industry fixed-effects model (at the two-digit NAICS
level) for this analysis, which is identified because of the fixed number of industries.
Our first-stage model of the decision to use SPEs (i.e., SPEBIN) includes the variables in Eq.
(2) and an exclusion restriction variable defined as the percentage of SPE users in the same two-digit
NAICS industry (%SPEIND). Our second stage model is the first-stage model without %SPEIND,
but including a self-selection bias correction term (inverse Mills ratio). The exclusion restriction
meets the necessary econometric requirements as it is insignificant in the second-stage using industry
fixed-effects, but highly significant in the first stage (p<0.01).41 Conceptually, %SPEIND is a valid
exclusion restriction as other firms’ SPE choices should not directly affect a firm’s tax avoidance.
The (untabulated) results for the first stage indicate sufficient discriminatory power for the
model, with an area under the ROC curve of 0.83. The results for the second stage show that, while
some endogeneity exists, the relation between SPEBIN and ETR remains negative and significant. In
40 This technique is also known as a treatment effects model (e.g., Leuz and Verrecchia 2000). 41 In untabulated tests, we calculate the exclusion-restriction variable as mean SPETOT in the same two-digit NAICS industry, and alternately include and exclude a given firm’s values in the calculation. Results are similar across these specifications. In all cases, diagnostic tests reveal no evidence of significant multicollinearity.
34
addition, the magnitude and significance level of the coefficients for SPEBIN are greater than or
equal to coefficients obtained by excluding the control function adjustment, suggesting any
endogeneity understates the economic significance of our results. For this reason, and because the
two-stage method does not accommodate firm fixed-effects which Hausman and F-tests indicate are
necessary, we use Eq. (2) to conduct our primary analyses.42
In a second set of tests, we use propensity score matching (PSM) to evaluate how ETRs
change for SPE users as they change their SPE use. Table 2 indicates significant differences in
control variables across SPE users and non-users. PSM allows us to control for time- and firm-
variant factors, and observable differences between SPE users and non-users (Tucker 2010). The
untabulated coefficient for SPETOT is negative and significant, consistent with our main results.43
5.4 Minority ownership interest and consolidation issues
If a SPE is wholly owned by a sponsor, then ETRs reflect the related tax effects of the SPE.
However, measuring the tax effects of a SPE is more nuanced when a sponsor has a non-controlling
minority interest in a SPE. For instance, if a sponsor does not wholly own a SPE and the minority
interest portion of the SPE ownership is not consolidated into pre-tax income and tax expense/cash
taxes paid, ETRs will not capture the tax effects of the SPE. Although possible, this situation would
understate the economic significance of our main results. More critical for our study is the situation
where the minority interest portion of pre-tax income from a SPE is consolidated while that for tax
expense/cash taxes paid is not, creating a mechanical negative relation between SPE use and ETRs.
42 Although prior research finds that MTRs are determinants of SPE use, we exclude them from our first-stage model because they are highly correlated with ETR, and including them in the first-stage requires that they also be included in the second-stage model. Thus, controlling for MTRs in an ETR regression will eliminate much of the variation in ETRs and reduce the power of our tests. Nevertheless, in untabulated tests, we include MTRs (as measured by Blouin et al. 2010) in both models. As expected, the coefficients for many independent variables are smaller; however, the coefficients for SPE remain negative and significant, consistent with our main results. 43 We match over common support, without replacement, using a caliper of 0.01. Diagnostic tests indicate a successful and robust matching process. We also use entropy balancing (Hainmueller 2012) with industry fixed-effects to ensure convergence; inferences remain the same. Because we match SPE users to non-users, and use firm and year fixed-effects to capture changes in the number of SPEs, we cannot estimate a model with SPEBIN for these tests.
35
To evaluate this possibility, we separately (1) include a control variable for minority interest, and (2)
perform our tests on firms without minority interest. In both cases, the results are similar or stronger.
To further mitigate concerns about consolidation, we estimate Eq. (2) around changes in
book consolidation rules; specifically, the implementation of FIN 46 (FASB 2003) in 2003 and SFAS
Nos. 166 and 167 (FASB 2009) in 2009. The results (untabulated) are economically significant in
both pre- and post-implementation periods for these reporting regimes, suggesting that our results are
not influenced by exogenous changes in GAAP consolidation standards.
5.5 Subsidiary disclosures
A recent study finds that some firms have reduced disclosures of subsidiaries in Exhibit 21
(Gramlich and Whitaker-Poe 2013). Although this change has little effect on our binary measure of
SPE use (SPEBIN), it could influence our continuous measure (SPETOT). We investigate this
possibility by removing all firm-years in which the previous firm-year has (1) ten or more SPEs, and
(2) 200% or more of the current year number of SPEs (SPETOT). Our results (untabulated) are
stronger when these firms are omitted from the sample.
Similarly, to consider changes in the quality of Exhibit 21 disclosures across time, we also
limit our analyses to firms that begin or end SPE use at most once during the sample period (i.e.,
firms with one change in SPEBIN across the sample period). Inferences remain the same. Another
interpretation of this finding is that our results are not driven by changes in overall organizational
complexity that may be correlated with SPE use. Including controls for the number of business
segments, tax haven use, and firm and year fixed effects in the model also mitigate this concern.
6. Conclusion
Prior research considers the tax outcomes of different tax-advantaged transactions (Hanlon
and Heitzman 2010). However, few studies consider organizational structures that facilitate such
transactions, while those that do primarily focus on incentives and general determinants rather than
tax outcomes (Shevlin 1987; Beatty et al. 1995; Feng et al. 2009). We study the tax outcomes of
36
SPEs, increasingly complex and common organizational structures that facilitate (rather than
generate) tax savings by allowing firms to conduct a greater level of tax-advantaged transactions
and/or enhance the tax efficiency (i.e., relative tax savings) of such transactions.
Using path analysis and well-validated measures of SPEs (Feng et al. 2009), we first show
that SPEs facilitate a greater level of specific tax-advantaged transactions. Specifically, SPEs
incrementally increase the cash tax savings from transactions involving leverage (1.8%), NOL
carryforwards (2.0%), R&D (8.7%), intangibles (6.1), and tax havens (all). Next, we estimate that
SPEs facilitate total incremental cash tax savings of about $82.4 billion for our sample of 10,284 SPE
users, or roughly 2% of U.S. federal corporate tax collections during 1997-2011. Finally, moderation
analysis reveals that SPEs enhance the total tax efficiency (i.e., relative tax savings) of transactions
involving intangibles and R&D, suggesting strong tax motivations to use SPEs for these activities.
Overall, our study provides economic insight into complex organizational structures that facilitate
corporate tax avoidance, and offers an empirical “roadmap” using path analysis for future research on
organizational structure.
37
References Amberger, H., and S. Kohlhase. 2017. International Taxation and the Role of Organizational Form
Choices for Group Structures Multinationals. Working Paper, Vienna University of Economics and Business and Erasmus University Rotterdam.
American Institute of Certified Public Accountants (AICPA) Committee on Accounting Practices. 1959. Consolidated Financial Statements. Accounting Research Bulletin (ARB) No. 51. New York, NJ: AICPA.
Armstrong, C., J. Blouin, and D. Larcker. 2012. The incentives for tax planning. Journal of Accounting and Economics 53: 391-411.
Atwood, T.J., M. Drake, J. Myers, and L. Myers. 2012. Home Country Tax System Characteristics and Corporate Tax Avoidance: International Evidence. The Accounting Review 87(6): 1831-1860.
Badertscher, B., S. Katz, and S. Rego. 2013. The Separation of Ownership and Control and Its Impact on Corporate Tax Avoidance. Journal of Accounting and Economics 56: 228-250.
Baron, R., and D. Kenny. 1986. The Moderator-Mediator Variable Distinction in Social Psychological Research: Conceptual, Strategic, and Statistical Considerations. Journal of Personality and Social Psychology 51(6): 1173-1182.
Basel Committee on Banking Supervision (Basel). 2009. Report on Special Purpose Entities. Bank for International Settlements: Basel, Switzerland.
Beatty, A., P. Berger, and J. Magliolo. 1995. Motives for Forming Research & Development Financing Organizations. Journal of Accounting and Economics 19: 411-442.
Beck, P.J., and P. Lisowsky. 2014. Tax Uncertainty and Voluntary Real-Time Tax Audits. The Accounting Review 89 (3): 867–901.
Bens, D. and S. Monahan. 2008. Altering Investment Decisions to Manage Financial Reporting Outcomes: Asset-Backed Commercial Paper Conduits and FIN 46. Journal of Accounting Research 46(5): 1017-1055.
Bhattacharya, N., F. Ecker, P. Olsson, and K. Schipper. 2012. Direct and Mediated Associations among Earnings Quality, Information Asymmetry, and the Cost of Equity. The Accounting Review 87(2): 449-482.
Blouin, J., J. Core, and W. Guay. 2010. Have the Tax Benefits of Debt Been Overestimated? Journal of Financial Economics 98: 195-213.
Blouin, J., and L. Krull. 2015. Does Organizational Form Affect Firms’ Foreign Operations? The Role of ‘Check-the-Box’ on Multinational Tax Planning. Working paper, University of Pennsylvania and University of Oregon.
Bozanic, Z., J. Hoopes, J. Thornock, and B. Williams. 2017. IRS Attention. Journal of Accounting Research 55 (1): 79-114.
Callahan, C., R. Smith, and A.W. Spencer. 2012. An Examination of the Cost of Capital Implications of FIN 46. The Accounting Review 87(4): 1105-1134.
Callahan, C., R. Smith, and A.W. Spencer. 2013. The Valuation and Reliability Implications of FIN 46 for Synthetic Lease Liabilities. Journal of Accounting and Public Policy 32: 271-291.
Chasteen, L. 2005. Teaching Variable Interest Entities under FIN 46: Untangling Risks, Expected Losses, and Expected Residual Returns. Journal of Accounting Education 23: 47-66.
Chen, S., Chen, X., Cheng, Q., and T. Shevlin. 2010. Are family firms more tax aggressive than non-family firms? Journal of Financial Economics 95: 41-61.
Cheng, C., H. Huang, Y. Li, and J. Stanfield. The Effect of Hedge Fund Activism on Corporate Tax Avoidance. The Accounting Review 87(5): 1493-1526.
Chi, S., S. Huang, and J. M. Sanchez. 2017. CEO Inside Debt Incentives and Corporate Tax Sheltering. Journal of Accounting Research 55(4): 837-876.
38
Davis, A., S. Humes, and C. Lin. 2002. When Is The Parent Company Liable? A Lesson in Corporations, Subsidiaries, and Environmental Problems. American Bar Association Business Law Section 12 (2): 1-3.
Dechow, P., R. Sloan, and A. Sweeney. 1995. Detecting Earnings Management. The Accounting Review 70(2): 193-225.
Desai, M., and D. Dharmapala. 2006. Corporate Tax Avoidance and High-Powered Incentives. Journal of Financial Economics 79: 145-179.
Donohoe, M. 2015. The Economic Effects of Financial Derivatives on Corporate Tax Avoidance. Journal of Accounting and Economics 59: 1-24.
Donohoe, M. G. McGill, and E. Outslay 2013. Back to the drawing board: The structural and accounting consequences of a switch to a territorial tax system. National Tax Journal 66 (3): 713-744.
Donohoe, M., G. McGill, and E. Outslay. 2014. Risky business: The prosopography of corporate tax planning. National Tax Journal 64 (4): 851-874.
Drucker, J. 2007. Wal-Mart Cuts Taxes by Paying Rent to Itself. Wall Street Journal February 1. Duhigg, C. and D. Kocieniewski. 2012. How Apple Sidesteps Billions in Taxes. New York Times
(April 29), page A1. Dyreng, S., M. Hanlon, and E. Maydew. 2008. Long-Run Corporate Tax Avoidance. The Accounting
Review 83(1): 61-82. Dyreng, S., M. Hanlon, and E. Maydew. 2010. The effects of executives on corporate tax
avoidance. The Accounting Review 85 (4): 1163-1189. Dyreng, S., J. Hoopes, and J. Wilde. 2016. Public Pressure and Corporate Tax Behavior. Journal of
Accounting Research 54(1): 147-185. Dyreng, S., M. Hanlon, E. Maydew, and J. Thornock. 2017. Changes in Corporate Effective Tax
Rates Over the Past 25 Years. Journal of Financial Economics 124: 441-463. Dyreng, S. and B. Lindsey. 2009. Using Financial Accounting Data to Examine the Effect of Foreign
Operations Located in Tax Havens and Other Countries on U.S. Multinational Firms’ Tax Rates. Journal of Accounting Research 47(5): 1283-1316.
Dyreng, S., B. Lindsey, and J. Thornock. 2013. Exploring the Role Delaware Plays as a Tax Haven. Journal of Financial Economics 108: 751-772.
Feng, M., J. Gramlich, and S. Gupta. 2009. Special Purpose Vehicles: Empirical Evidence on Determinants and Earnings Management. The Accounting Review 84(6): 1833-1876.
Financial Accounting Standards Board (FASB). 2003. Consolidation of Variable Interest Entities - An Interpretation of ARB No. 51. FASB Interpretation No. 46 (revised). Norwalk, CT: FASB.
Financial Accounting Standards Board (FASB). 2006. Accounting for Uncertainty in Income Taxes - An Interpretation of FASB Statement No. 109. FASB Interpretation No. 48. Norwalk, CT: FASB.
Financial Accounting Standards Board (FASB). 2009. Amendments to FASB Interpretation No. 46(R). Statement of Financial Accounting Standards No. 167. Norwalk, CT: FASB.
Forbes, T., and R. Sharma. 2008. Getting Tax Value from Intangibles and SPVs. International Tax Review 19(9): 16-17.
Fox, W. and L. Luna. 2005. Do Limited Liability Companies Explain Declining State Corporate Tax Revenues? Public Finance Review 33(6): 690-720.
Gow, I., D. Larcker, and P. Reiss. 2016. Causal Inference in Accounting Research. Journal of Accounting Research 54(2): 477-523.
Graham, J. 2000. How Big Are the Tax Benefits of Debt? The Journal of Finance 55(5): 1901-1941. Graham, J., and A. Tucker. 2006. Tax Shelters and Corporate Debt Policy. Journal of Financial
Economics 81: 563-594. Gramlich, J., and J. Whiteaker-Poe. 2013. Disappearing Subsidiaries: The Cases of Google and
Oracle. Working paper, Washington State University.
39
Gupta, S., and L. Mills. 2002. Corporate Multistate Tax Planning Benefits of Multiple Jurisdictions. Journal of Accounting and Economics 33: 117-139.
Gupta, S., and K. Newberry. 1997. Determinants and the Variability in Corporate Effective Tax Rates: Evidence from Longitudinal Data. Journal of Accounting and Public Policy 16: 1-34.
Hainmueller, J. 2012. Entropy Balancing for Causal Effects: A Multivariate Reweighting Method to Produce Balanced Samples in Observational Studies. Political Analysis 20: 25-46.
Hanlon, M., and S. Heitzman. 2010. A Review of Tax Research. Journal of Accounting and Economics 50: 127-178.
Hanlon, M., E. Maydew, and J. Thornock. 2015. Taking the Long Way Home: U.S. Tax Evasion and Offshore Investments in U.S. Equity and Debt Markets. Journal of Finance 70(1): 257-287.
Hartgraves, A., and G. Benston. 2002. The Evolving Accounting Standards for Special Purpose Entities and Consolidations. Accounting Horizons 16(3): 245-258.
Hausman, J. 1978. Specification Tests in Econometrics. Econometrica 46(6): 1251-1271. Heckman, J. 1979. The Sample Selection Bias as a Specification Error. Econometrica 47: 153-162. Hoopes, J. L., D. Mescall, and J. A. Pittman. 2012. Do IRS audits deter corporate tax avoidance? The
Accounting Review 87 (5): 1603–39. Hope, O-K., M. Ma, and W. Thomas. 2013. Tax Avoidance and Geographic Earnings Disclosure.
Journal of Accounting and Economics 56: 170-189. Inland Revenue. 2013. Multinational Enterprises: Compliance Focus (IR 947). New Zealand
Government Inland Revenue. October 2013. Iacobucci, D. 2009. Everything You Always Wanted to Know about SEM (Structural Equations
Modeling) but Were Afraid to Ask. Journal of Consumer Psychology 19: 673-680. Klassen, K., P. Lisowsky, and D. Mescall. 2016. The Role of Auditors, Non-Auditors, and Internal
Tax Departments in Corporate Tax Aggressiveness. The Accounting Review 91(1): 179-205. Klassen, K., P. Lisowsky, and D. Mescall. 2017. Transfer Pricing: Strategies, Practices, and Tax
Minimization. Contemporary Accounting Research 34 (1): 455-493. Kothari, S.P., A. Leone, and C. Wasley. 2005. Performance Matched Discretionary Accrual
Measures. Journal of Accounting and Economics 39: 163-197. Kothari, S.P., and R. Lester. 2012. The Role of Accounting in the Financial Crisis: Lessons for the
Future. Accounting Horizons 26(2): 335-351. KPMG. 2010. PRC Non-Resident Enterprise Tax Series: Beneficial Ownership & Indirect Disposals. Landsman, W., K. Peasnell, and C. Shakespeare. 2008. Are Asset Securitizations Sales or Loans?
The Accounting Review 83(5): 1251-1272. LeBreton, J., J. Wu, and M. Bing. 2009. The Truth(s) on Testing for Mediation in the Social and
Organizational Sciences. In Statistical and Methodological Myths and Urban Legends: Doctrine, Verity, and Fable in the Organizational and Social Sciences, edited by C. Lance and R. Vandenberg, 107-140. New York: Routledge.
Lewellen, K., and L. Robinson. 2014. Ownership Structures of Multinational Firms. Working paper, Dartmouth College.
Leuz, C. and R. Verrecchia. 2000. The Economic Consequences of Increased Disclosure. Journal of Accounting Research 38(Supplement): 91-124.
Lisowsky, P. 2009. Inferring U.S. Tax Liability from Financial Statement Information. Journal of the American Taxation Association 31(1): 29-63.
Lisowsky, P. 2010. Seeking Shelter: Empirically Modeling Tax Shelters Using Financial Statement Information. The Accounting Review 85(5): 1693-1720.
Lisowsky, P., L. Robinson, and A. Schmidt. 2013. Do Publicly Disclosed Tax Reserves Tell Us About Privately Disclosed Tax Shelter Activity? Journal of Accounting Research 51(3): 583-629.
Madara, M. 2017. Officials Discuss Thinking Behind Cross-Border Partnership Rules. Tax Notes (May 29): 1228-1229.
40
Maddala, G. 1991. A Perspective on the Use of Limited-Dependent and Qualitative Variables Models in Accounting Research. The Accounting Review 66(4): 788-807.
McGill, G. and E. Outslay. 2004. Lost in Translation: Detecting Tax Shelter Activity in Financial Statements. National Tax Journal 57(3): 739-756.
McGuire, S., T. Omer, and D. Wang. 2012. Tax Avoidance: Does Tax-Specific Industry Expertise Make a Difference? The Accounting Review 87(3): 975-1003.
McGuire, S., D. Wang, and R. Wilson. 2014. Dual Class Ownership and Tax Avoidance. The Accounting Review 89(4): 1487-1516.
Mills, L., K. Newberry, and W. Trautman. 2002. Trends in Book-Tax Income and Balance Sheet Differences. Tax Notes 96: 1109-1124.
Mills, L., and K. Newberry. 2005. Firms’ Off-Balance Sheet and Hybrid Debt Financing: Evidence from Their Book-Tax Reporting Differences. Journal of Accounting Research 43(2): 251-282.
Munden, J., R. Zimmermann, and P. Eason. 2002. Tax Planning for U.S. Multinationals and the Impact of the Check-the-Box Regulations. International Tax Journal 28(3): 51-69.
Organization for Economic Co-operation and Development (OECD). 2013. Revised Discussion Draft on Transfer Pricing Aspects of Intangibles. July 30, 2013.
Organization for Economic Co-operation and Development (OECD). 2015a. Action 6: Preventing The Granting of Treaty Benefits in Inappropriate Circumstances. October 5, 2015.
Organization for Economic Co-operation and Development (OECD). 2015b. Action 11: Measuring and Monitoring BEPS. October 5, 2015.
Phillips, J. 2003. Corporate Tax-Planning Effectiveness: The Role of Compensation-Based Incentives. The Accounting Review 78: 847-874.
Preacher, K. and A. Hayes. 2004. SPSS and SAS Procedures for Estimating Indirect Effects in Simple Mediation Models. Behavior Research Methods, Instruments, & Computers 36(4): 717-731.
Rego, S. 2003. Tax Avoidance Activities of U.S. Multinational Corporations. Contemporary Accounting Research 20: 805-833.
Rego, S., and R. Wilson. 2012. Equity Risk Incentives and Corporate Tax Aggressiveness. Journal of Accounting Research 50 (3): 775-809.
Roberts, M. and T. Whited. 2013. Endogeneity in Empirical Corporate Finance. Handbook of the Economics of Finance 2(A): 1-798.
Robinson, J., S. Sikes, and C. Weaver. 2010. Performance measurement of corporate tax departments. The Accounting Review 85(3): 1035–64.
Scholes, M., M. Wolfson, M. Erickson, M. Hanlon, E. Maydew, and T. Shevlin. 2014. Taxes and Business Strategy: A Planning Approach. Pearson Education, Inc.: Upper Saddle River, NJ.
Schwarcz, S. 1994. The Alchemy of Asset Securitization. Stanford Journal of Law, Business & Finance (133) 1994-1995: 133-154.
Securities and Exchange Commission (SEC). 2002. The SEC Takes Enforcement Action with Respect to the PNC Financial Services Group, Inc. Arising Out of PNC’s Improper Accounting and Disclosures Regarding the Transfer of $762 Million of Loans and Other Assets to Special Purpose Entities. Press Release 2002-109.
Sheppard, L. 2017. Partnership Basis Stripping Inside a Consolidated Return. Tax Notes (July 24): 385-394.
Shevlin, T. 1987. Taxes and Off-Balance-Sheet Financing: Research and Development Limited Partnerships. The Accounting Review 62(3): 480-509.
Sobel, M. 1982. Asymptotic Confidence Intervals for Indirect Effects in Structural Equation Models. Sociological Methodology 13: 290-312.
Soroosh, J., and J. Ciesielski. 2004. Accounting for Special Purpose Entities Revised: FASB Interpretation 46(R). The CPA Journal 74(7): 30-37.
41
Thomas, C.W. 2002. The Rise and Fall of Enron. Journal of Accountancy April 2002. Tucker, J. 2010. Selection Bias and Econometric Remedies in Accounting and Finance Research.
Journal of Accounting Literature 29: 31-57. U.S. Congress Joint Committee on Taxation (JCT). 2003. Report of Investigation of Enron
Corporation and Related Entities Regarding Federal Tax and Compensation Issues, and Policy Recommendations (JCS-3-03), February 2003.
United Nations. 2013. World Investment Report. United Nations Conference on Trade and Development. United National Publication: Switzerland.
Vella, F. and M. Verbeek. 1999. Estimating and Interpreting Models with Endogenous Treatment Effects. Journal of Business & Economic Statistics 17(4): 473-478.
Verschoor, C. 2012. Ethics: Olympus Scandal Shows Need for U.S. Standards. Strategic Finance 93(8): 12-16.
Wagener, T. and C. Watrin. 2014. The Relevance of Complex Group Structures for Income Shifting and Investors’ Valuation of Tax Avoidance. Working paper, University of Münster.
Weber, D. 2009. Do Analysts and Investors Fully Appreciate the Implications of Book-Tax Differences for Future Earnings? Contemporary Accounting Research 26 (4): 1175-1206.
Wilson, R. 2009. An Examination of Corporate Tax Shelter Participants. The Accounting Review 84(3): 969-999.
Wittendorff, J. 2010. Transfer Pricing and the Arm’s Length Principle in International Tax Law. Series on International Taxation, Volume 35. Kluwer Law International BV: The Netherlands.
Wooldridge, J. 2010. Econometric Analysis of Cross Section and Panel Data. Second Edition. The MIT Press: Cambridge, MA.
Zechman, S. 2010. The Relation Between Voluntary Disclosure and Financial Reporting: Evidence from Synthetic Leases. Journal of Accounting Research 48(3): 725-765.
Zhao, X., J. Lynch, and Q. Chen. 2010. Reconsidering Baron and Kenny: Myths and Truths about Mediation Analysis. Journal of Consumer Research 37(2): 197-206.
Zion, D. and B. Carcache. 2003. FIN 46: New Rule Could Surprise Investors. Credit Suisse/First Boston Equity Research (June 24, 2003).
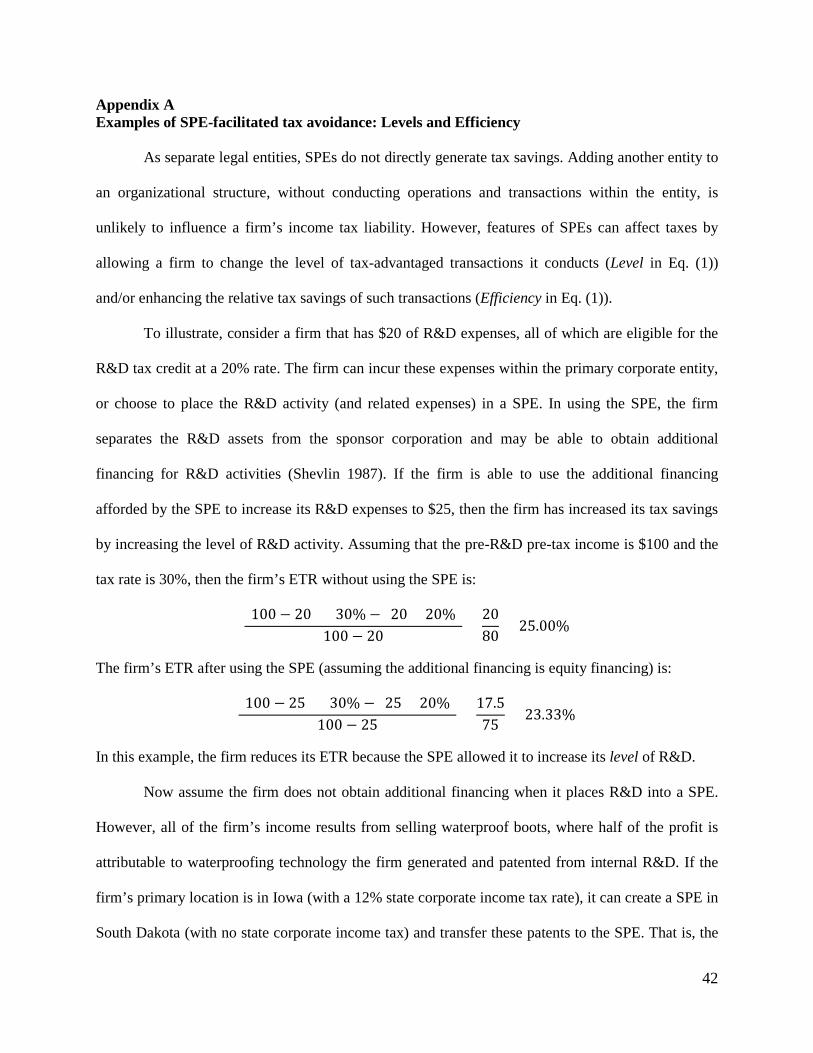
42
Appendix A Examples of SPE-facilitated tax avoidance: Levels and Efficiency
As separate legal entities, SPEs do not directly generate tax savings. Adding another entity to
an organizational structure, without conducting operations and transactions within the entity, is
unlikely to influence a firm’s income tax liability. However, features of SPEs can affect taxes by
allowing a firm to change the level of tax-advantaged transactions it conducts (Level in Eq. (1))
and/or enhancing the relative tax savings of such transactions (Efficiency in Eq. (1)).
To illustrate, consider a firm that has $20 of R&D expenses, all of which are eligible for the
R&D tax credit at a 20% rate. The firm can incur these expenses within the primary corporate entity,
or choose to place the R&D activity (and related expenses) in a SPE. In using the SPE, the firm
separates the R&D assets from the sponsor corporation and may be able to obtain additional
financing for R&D activities (Shevlin 1987). If the firm is able to use the additional financing
afforded by the SPE to increase its R&D expenses to $25, then the firm has increased its tax savings
by increasing the level of R&D activity. Assuming that the pre-R&D pre-tax income is $100 and the
tax rate is 30%, then the firm’s ETR without using the SPE is:
(100 − 20) × 30% − (20 × 20%)100 − 20
=2080
= 25.00%
The firm’s ETR after using the SPE (assuming the additional financing is equity financing) is:
(100 − 25) × 30% − (25 × 20%)100 − 25 =
17.575 = 23.33%
In this example, the firm reduces its ETR because the SPE allowed it to increase its level of R&D.
Now assume the firm does not obtain additional financing when it places R&D into a SPE.
However, all of the firm’s income results from selling waterproof boots, where half of the profit is
attributable to waterproofing technology the firm generated and patented from internal R&D. If the
firm’s primary location is in Iowa (with a 12% state corporate income tax rate), it can create a SPE in
South Dakota (with no state corporate income tax) and transfer these patents to the SPE. That is, the
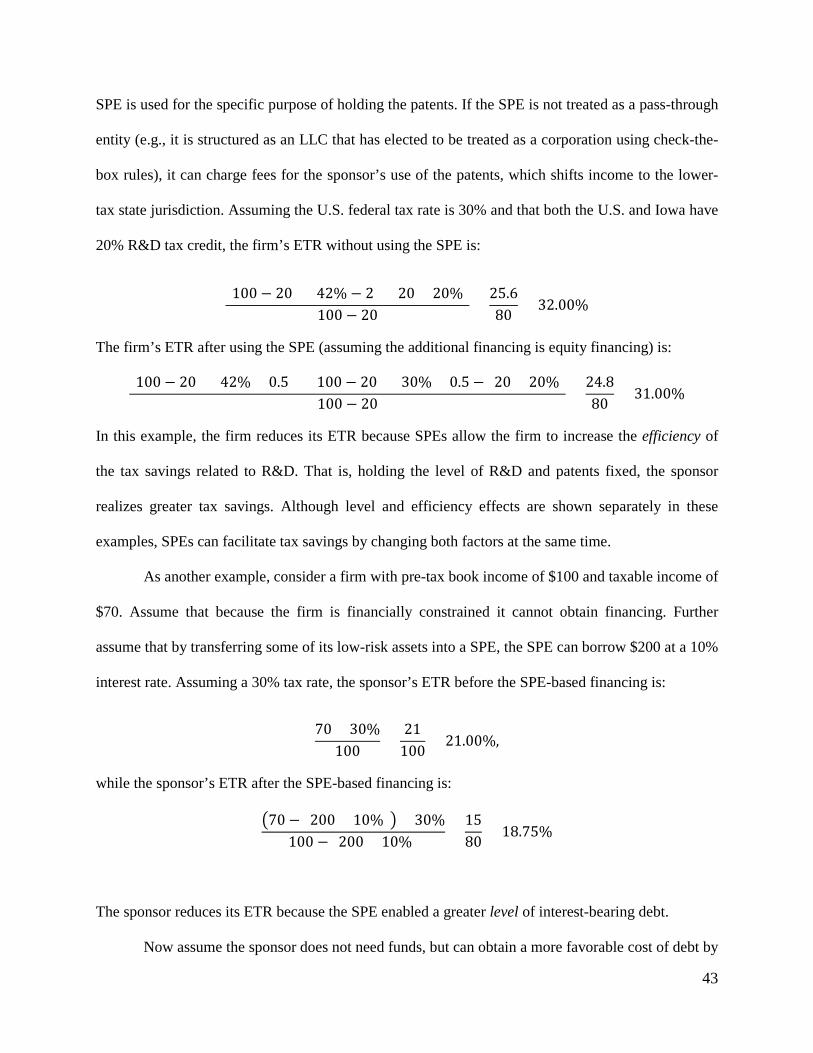
43
SPE is used for the specific purpose of holding the patents. If the SPE is not treated as a pass-through
entity (e.g., it is structured as an LLC that has elected to be treated as a corporation using check-the-
box rules), it can charge fees for the sponsor’s use of the patents, which shifts income to the lower-
tax state jurisdiction. Assuming the U.S. federal tax rate is 30% and that both the U.S. and Iowa have
20% R&D tax credit, the firm’s ETR without using the SPE is:
(100 − 20) × 42% − 2 × (20 × 20%)100 − 20 =
25.680 = 32.00%
The firm’s ETR after using the SPE (assuming the additional financing is equity financing) is:
(100 − 20) × 42% × 0.5 + (100 − 20) × 30% × 0.5 − (20 × 20%)100 − 20 =
24.880 = 31.00%
In this example, the firm reduces its ETR because SPEs allow the firm to increase the efficiency of
the tax savings related to R&D. That is, holding the level of R&D and patents fixed, the sponsor
realizes greater tax savings. Although level and efficiency effects are shown separately in these
examples, SPEs can facilitate tax savings by changing both factors at the same time.
As another example, consider a firm with pre-tax book income of $100 and taxable income of
$70. Assume that because the firm is financially constrained it cannot obtain financing. Further
assume that by transferring some of its low-risk assets into a SPE, the SPE can borrow $200 at a 10%
interest rate. Assuming a 30% tax rate, the sponsor’s ETR before the SPE-based financing is:
70 × 30%100
=21
100 = 21.00%,
while the sponsor’s ETR after the SPE-based financing is:
�70 − (200 × 10%)� × 30%100 − (200 × 10%) =
1580 = 18.75%
The sponsor reduces its ETR because the SPE enabled a greater level of interest-bearing debt.
Now assume the sponsor does not need funds, but can obtain a more favorable cost of debt by
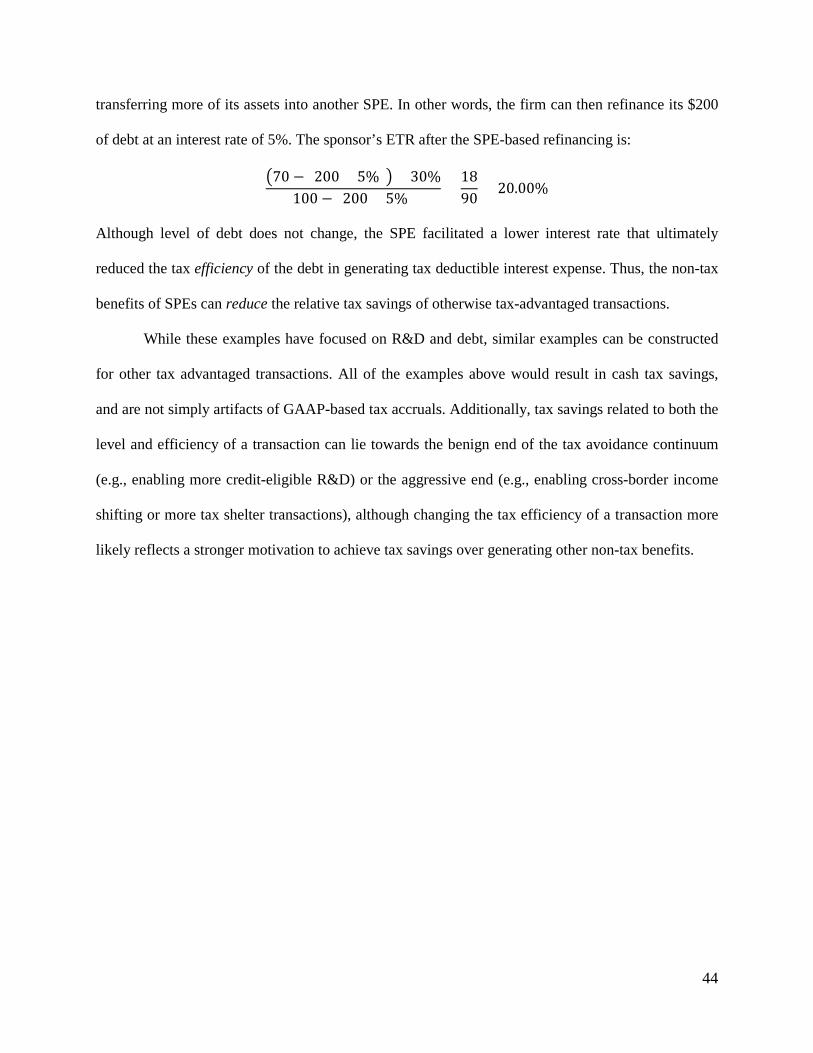
44
transferring more of its assets into another SPE. In other words, the firm can then refinance its $200
of debt at an interest rate of 5%. The sponsor’s ETR after the SPE-based refinancing is:
�70 − (200 × 5%)� × 30%100 − (200 × 5%) =
1890 = 20.00%
Although level of debt does not change, the SPE facilitated a lower interest rate that ultimately
reduced the tax efficiency of the debt in generating tax deductible interest expense. Thus, the non-tax
benefits of SPEs can reduce the relative tax savings of otherwise tax-advantaged transactions.
While these examples have focused on R&D and debt, similar examples can be constructed
for other tax advantaged transactions. All of the examples above would result in cash tax savings,
and are not simply artifacts of GAAP-based tax accruals. Additionally, tax savings related to both the
level and efficiency of a transaction can lie towards the benign end of the tax avoidance continuum
(e.g., enabling more credit-eligible R&D) or the aggressive end (e.g., enabling cross-border income
shifting or more tax shelter transactions), although changing the tax efficiency of a transaction more
likely reflects a stronger motivation to achieve tax savings over generating other non-tax benefits.

45
Appendix B Variable definitions Measures of SPE use (SPE)
SPETOT Total number of SPEs, defined as the natural log of one plus the total number of subsidiaries in Exhibit 21 of Form 10-K meeting relevant criteria (see Section 3).
SPEBIN Indicator variable equal to 1 if the firm-year has at least one SPE subsidiary in Exhibit 21 of Form 10-K; 0 otherwise.
Measures of tax avoidance (ETR)
GETR GAAP effective tax rate (3-year), defined as the three-year sum (t to t+2) of total tax expense (txt) divided by the three-year sum (t to t+2) of pre-tax book income (pi) less special items (spi). Observations with negative denominators are dropped. ETRs are reset to 1 (0) if greater (less) than 1 (0).
CETR Cash effective tax rate (3-year), defined as the three-year sum (t to t+2) of cash taxes paid (txpd) divided by the three-year sum (t to t+2) of pre-tax book income (pi) less special items (spi). Observations with negative denominators are dropped. ETRs are reset to 1 (0) if greater (less) than 1 (0).
Tax-advantaged transactions (TAT)
LEV Leverage, defined as long-term debt (dltt) divided by total assets (at).
DISS Debt issuance, defined as net debt issuance/reduction (dltis−dltr) divided by total assets (at).
CLTD Debt renegotiation costs, defined as the current portion of long-term debt (dlc) divided by total assets (at).
RDE Research and development expense, defined as research and development expense (xrd) divided by lagged total assets (at). Missing values are set equal to 0.
PPE Capital intensity, defined as gross property, plant, and equipment (ppegt) divided by total assets (at).
INTANG Intangible assets, defined as intangibles (intan) divided by total assets (at).
NOL Net operating loss, defined as tax-loss carryforwards (tlcf) divided by lagged total assets (at). Missing observations are set equal to 0.
M&A Indicator variable equal to 1 if cash flow from mergers and acquisitions (aqc) does not equal 0; 0 otherwise.
FINC Foreign income, defined as pre-tax foreign income (pifo) divided by lagged total assets (at). Missing observations are set equal to 0.
HAVEN Indicator variable equal to 1 for firm-years with at least one subsidiary listed in Exhibit 21 of Form 10-K that is located in a tax haven country; 0 otherwise. See Dyreng and Lindsey (2009).
Control variables (CTRL)
SIZE Firm size, defined as the natural log of total assets (at).
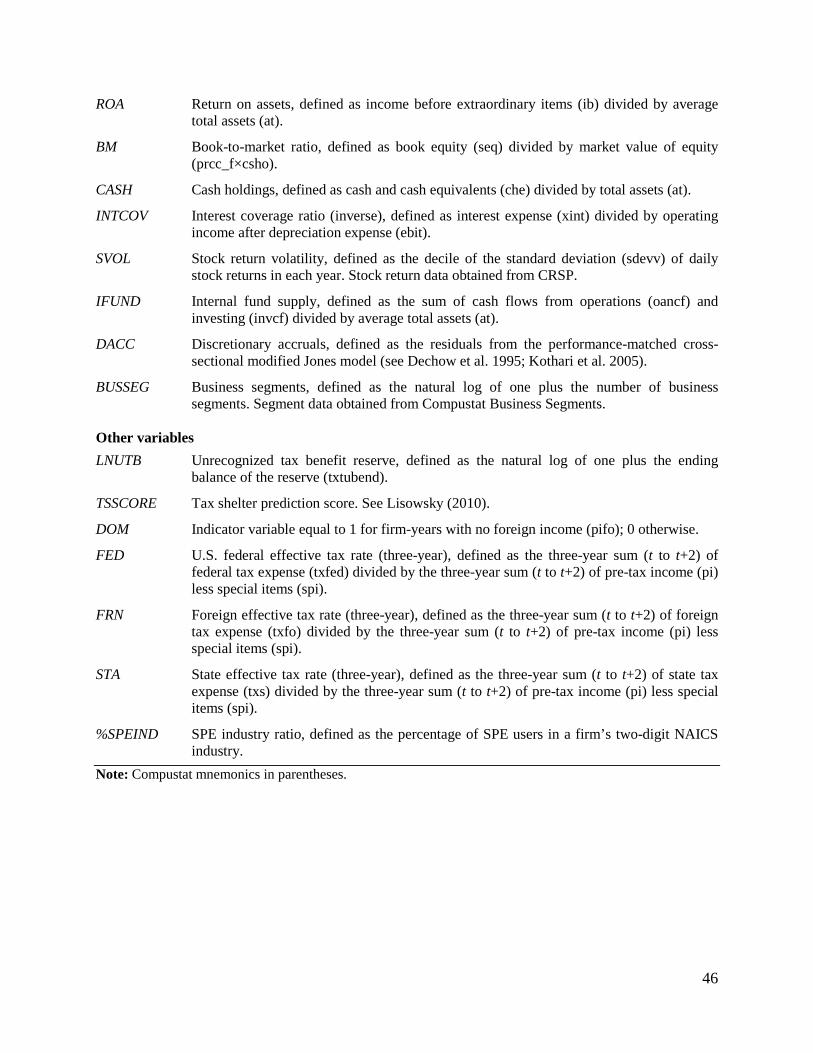
46
ROA Return on assets, defined as income before extraordinary items (ib) divided by average total assets (at).
BM Book-to-market ratio, defined as book equity (seq) divided by market value of equity (prcc_f×csho).
CASH Cash holdings, defined as cash and cash equivalents (che) divided by total assets (at).
INTCOV Interest coverage ratio (inverse), defined as interest expense (xint) divided by operating income after depreciation expense (ebit).
SVOL Stock return volatility, defined as the decile of the standard deviation (sdevv) of daily stock returns in each year. Stock return data obtained from CRSP.
IFUND Internal fund supply, defined as the sum of cash flows from operations (oancf) and investing (invcf) divided by average total assets (at).
DACC Discretionary accruals, defined as the residuals from the performance-matched cross-sectional modified Jones model (see Dechow et al. 1995; Kothari et al. 2005).
BUSSEG Business segments, defined as the natural log of one plus the number of business segments. Segment data obtained from Compustat Business Segments.
Other variables
LNUTB Unrecognized tax benefit reserve, defined as the natural log of one plus the ending balance of the reserve (txtubend).
TSSCORE Tax shelter prediction score. See Lisowsky (2010).
DOM Indicator variable equal to 1 for firm-years with no foreign income (pifo); 0 otherwise.
FED U.S. federal effective tax rate (three-year), defined as the three-year sum (t to t+2) of federal tax expense (txfed) divided by the three-year sum (t to t+2) of pre-tax income (pi) less special items (spi).
FRN Foreign effective tax rate (three-year), defined as the three-year sum (t to t+2) of foreign tax expense (txfo) divided by the three-year sum (t to t+2) of pre-tax income (pi) less special items (spi).
STA State effective tax rate (three-year), defined as the three-year sum (t to t+2) of state tax expense (txs) divided by the three-year sum (t to t+2) of pre-tax income (pi) less special items (spi).
%SPEIND SPE industry ratio, defined as the percentage of SPE users in a firm’s two-digit NAICS industry.
Note: Compustat mnemonics in parentheses.
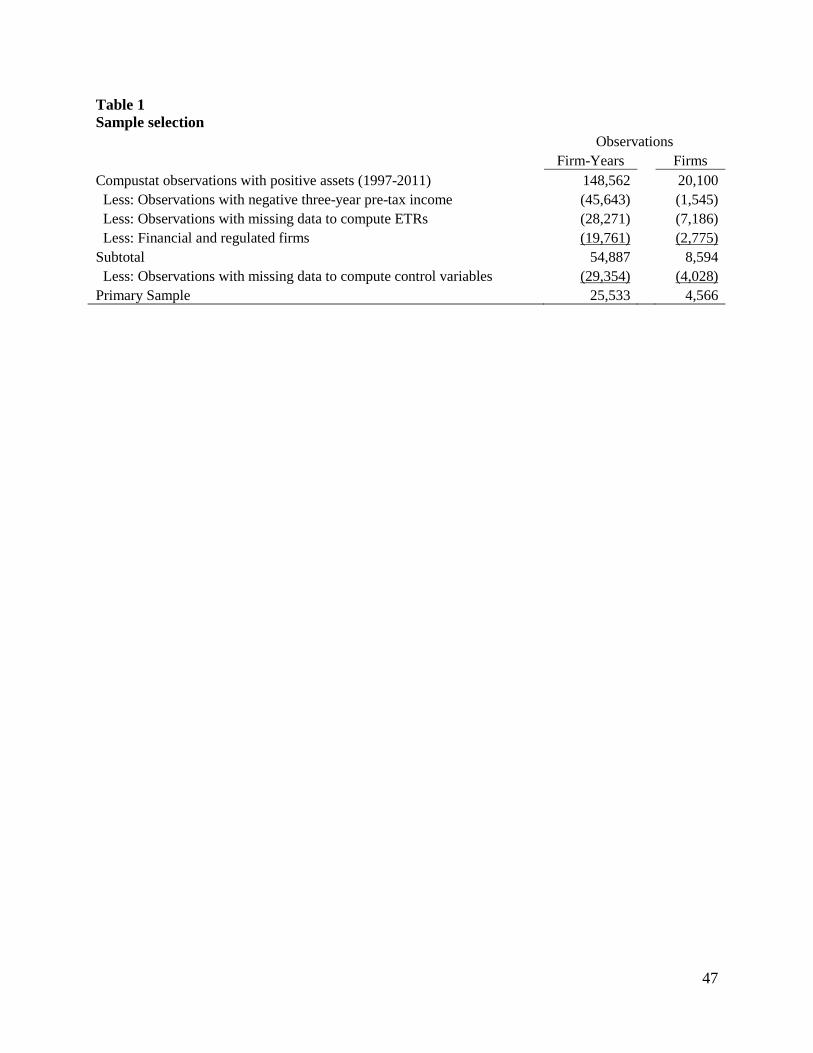
47
Table 1 Sample selection
Observations Firm-Years Firms
Compustat observations with positive assets (1997-2011) 148,562 20,100 Less: Observations with negative three-year pre-tax income (45,643) (1,545) Less: Observations with missing data to compute ETRs (28,271) (7,186) Less: Financial and regulated firms (19,761) (2,775) Subtotal 54,887 8,594 Less: Observations with missing data to compute control variables (29,354) (4,028) Primary Sample 25,533 4,566
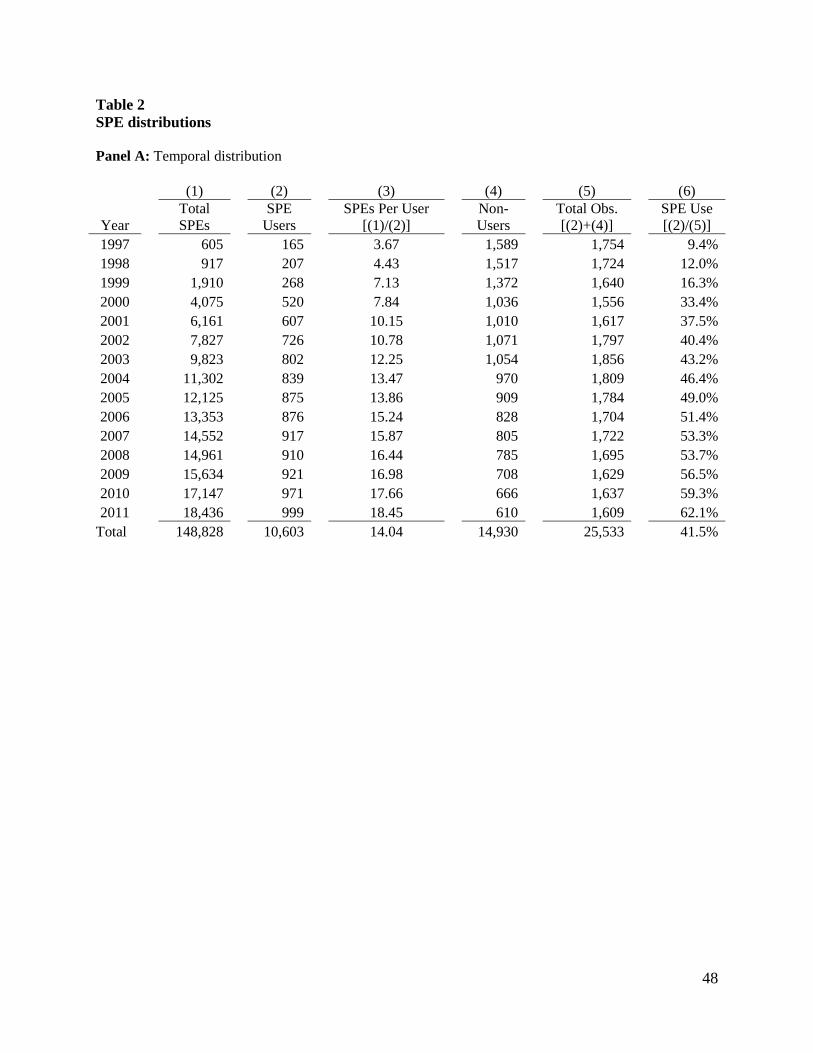
48
Table 2 SPE distributions Panel A: Temporal distribution
(1) (2) (3) (4) (5) (6)
Year Total SPEs
SPE Users
SPEs Per User [(1)/(2)]
Non- Users
Total Obs. [(2)+(4)]
SPE Use [(2)/(5)]
1997 605 165 3.67 1,589 1,754 9.4% 1998 917 207 4.43 1,517 1,724 12.0% 1999 1,910 268 7.13 1,372 1,640 16.3% 2000 4,075 520 7.84 1,036 1,556 33.4% 2001 6,161 607 10.15 1,010 1,617 37.5% 2002 7,827 726 10.78 1,071 1,797 40.4% 2003 9,823 802 12.25 1,054 1,856 43.2% 2004 11,302 839 13.47 970 1,809 46.4% 2005 12,125 875 13.86 909 1,784 49.0% 2006 13,353 876 15.24 828 1,704 51.4% 2007 14,552 917 15.87 805 1,722 53.3% 2008 14,961 910 16.44 785 1,695 53.7% 2009 15,634 921 16.98 708 1,629 56.5% 2010 17,147 971 17.66 666 1,637 59.3% 2011 18,436 999 18.45 610 1,609 62.1%
Total 148,828 10,603 14.04 14,930 25,533 41.5%
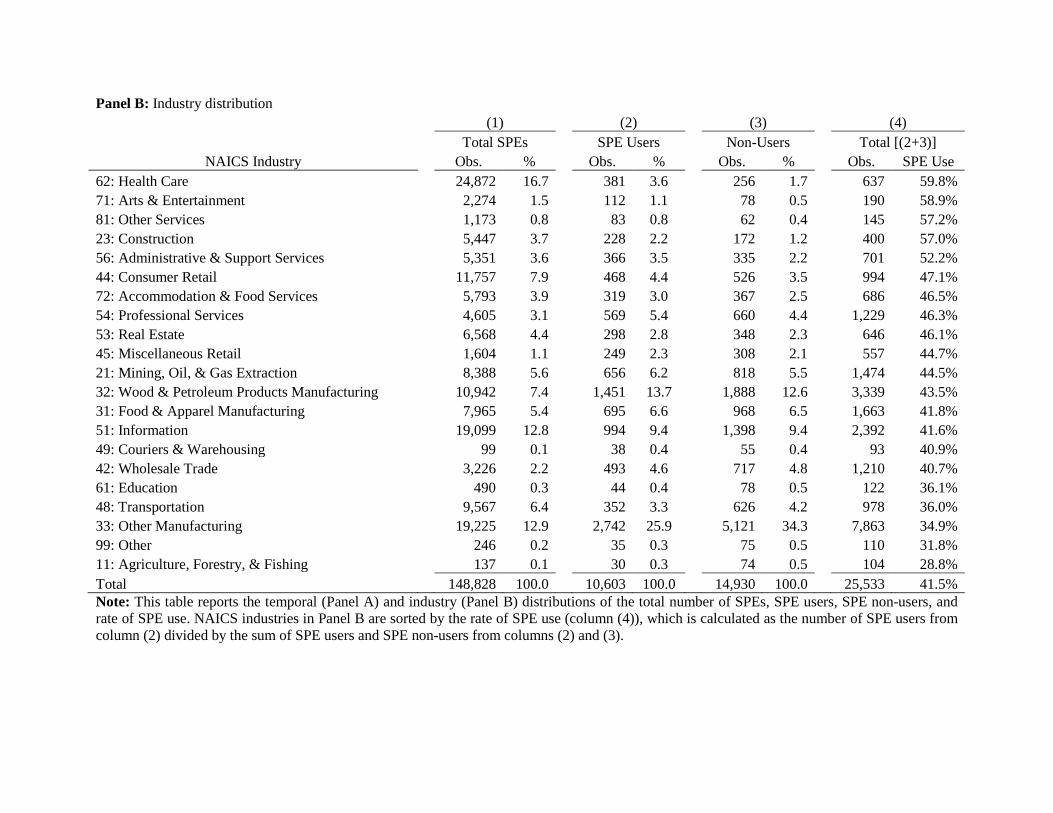
Panel B: Industry distribution (1) (2) (3) (4)
Total SPEs SPE Users Non-Users Total [(2+3)] NAICS Industry Obs. % Obs. % Obs. % Obs. SPE Use
62: Health Care 24,872 16.7 381 3.6 256 1.7 637 59.8% 71: Arts & Entertainment 2,274 1.5 112 1.1 78 0.5 190 58.9% 81: Other Services 1,173 0.8 83 0.8 62 0.4 145 57.2% 23: Construction 5,447 3.7 228 2.2 172 1.2 400 57.0% 56: Administrative & Support Services 5,351 3.6 366 3.5 335 2.2 701 52.2% 44: Consumer Retail 11,757 7.9 468 4.4 526 3.5 994 47.1% 72: Accommodation & Food Services 5,793 3.9 319 3.0 367 2.5 686 46.5% 54: Professional Services 4,605 3.1 569 5.4 660 4.4 1,229 46.3% 53: Real Estate 6,568 4.4 298 2.8 348 2.3 646 46.1% 45: Miscellaneous Retail 1,604 1.1 249 2.3 308 2.1 557 44.7% 21: Mining, Oil, & Gas Extraction 8,388 5.6 656 6.2 818 5.5 1,474 44.5% 32: Wood & Petroleum Products Manufacturing 10,942 7.4 1,451 13.7 1,888 12.6 3,339 43.5% 31: Food & Apparel Manufacturing 7,965 5.4 695 6.6 968 6.5 1,663 41.8% 51: Information 19,099 12.8 994 9.4 1,398 9.4 2,392 41.6% 49: Couriers & Warehousing 99 0.1 38 0.4 55 0.4 93 40.9% 42: Wholesale Trade 3,226 2.2 493 4.6 717 4.8 1,210 40.7% 61: Education 490 0.3 44 0.4 78 0.5 122 36.1% 48: Transportation 9,567 6.4 352 3.3 626 4.2 978 36.0% 33: Other Manufacturing 19,225 12.9 2,742 25.9 5,121 34.3 7,863 34.9% 99: Other 246 0.2 35 0.3 75 0.5 110 31.8% 11: Agriculture, Forestry, & Fishing 137 0.1 30 0.3 74 0.5 104 28.8% Total 148,828 100.0 10,603 100.0 14,930 100.0 25,533 41.5% Note: This table reports the temporal (Panel A) and industry (Panel B) distributions of the total number of SPEs, SPE users, SPE non-users, and rate of SPE use. NAICS industries in Panel B are sorted by the rate of SPE use (column (4)), which is calculated as the number of SPE users from column (2) divided by the sum of SPE users and SPE non-users from columns (2) and (3).
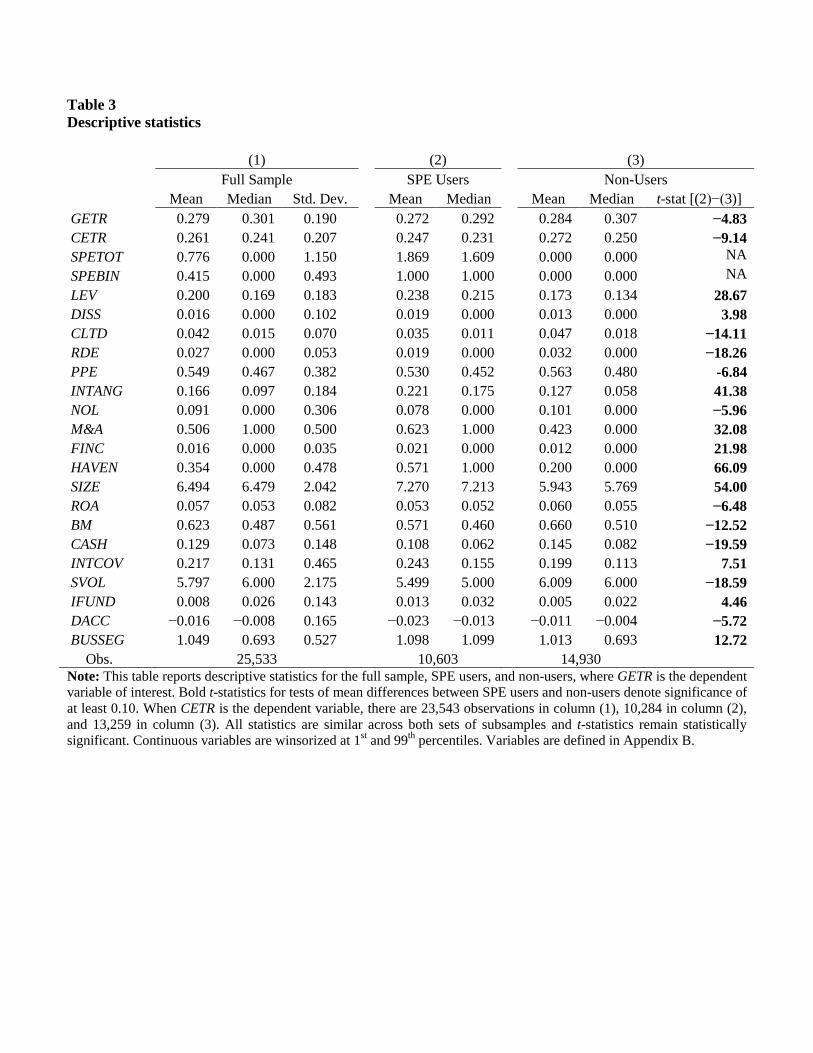
Table 3 Descriptive statistics
(1) (2) (3) Full Sample SPE Users Non-Users Mean Median Std. Dev. Mean Median Mean Median t-stat [(2)−(3)]
GETR 0.279 0.301 0.190 0.272 0.292 0.284 0.307 −4.83 CETR 0.261 0.241 0.207 0.247 0.231 0.272 0.250 −9.14 SPETOT 0.776 0.000 1.150 1.869 1.609 0.000 0.000 NA SPEBIN 0.415 0.000 0.493 1.000 1.000 0.000 0.000 NA LEV 0.200 0.169 0.183 0.238 0.215 0.173 0.134 28.67 DISS 0.016 0.000 0.102 0.019 0.000 0.013 0.000 3.98 CLTD 0.042 0.015 0.070 0.035 0.011 0.047 0.018 −14.11 RDE 0.027 0.000 0.053 0.019 0.000 0.032 0.000 −18.26 PPE 0.549 0.467 0.382 0.530 0.452 0.563 0.480 -6.84 INTANG 0.166 0.097 0.184 0.221 0.175 0.127 0.058 41.38 NOL 0.091 0.000 0.306 0.078 0.000 0.101 0.000 −5.96 M&A 0.506 1.000 0.500 0.623 1.000 0.423 0.000 32.08 FINC 0.016 0.000 0.035 0.021 0.000 0.012 0.000 21.98 HAVEN 0.354 0.000 0.478 0.571 1.000 0.200 0.000 66.09 SIZE 6.494 6.479 2.042 7.270 7.213 5.943 5.769 54.00 ROA 0.057 0.053 0.082 0.053 0.052 0.060 0.055 −6.48 BM 0.623 0.487 0.561 0.571 0.460 0.660 0.510 −12.52 CASH 0.129 0.073 0.148 0.108 0.062 0.145 0.082 −19.59 INTCOV 0.217 0.131 0.465 0.243 0.155 0.199 0.113 7.51 SVOL 5.797 6.000 2.175 5.499 5.000 6.009 6.000 −18.59 IFUND 0.008 0.026 0.143 0.013 0.032 0.005 0.022 4.46 DACC −0.016 −0.008 0.165 −0.023 −0.013 −0.011 −0.004 −5.72 BUSSEG 1.049 0.693 0.527 1.098 1.099 1.013 0.693 12.72
Obs. 25,533 10,603 14,930 Note: This table reports descriptive statistics for the full sample, SPE users, and non-users, where GETR is the dependent variable of interest. Bold t-statistics for tests of mean differences between SPE users and non-users denote significance of at least 0.10. When CETR is the dependent variable, there are 23,543 observations in column (1), 10,284 in column (2), and 13,259 in column (3). All statistics are similar across both sets of subsamples and t-statistics remain statistically significant. Continuous variables are winsorized at 1st and 99th percentiles. Variables are defined in Appendix B.
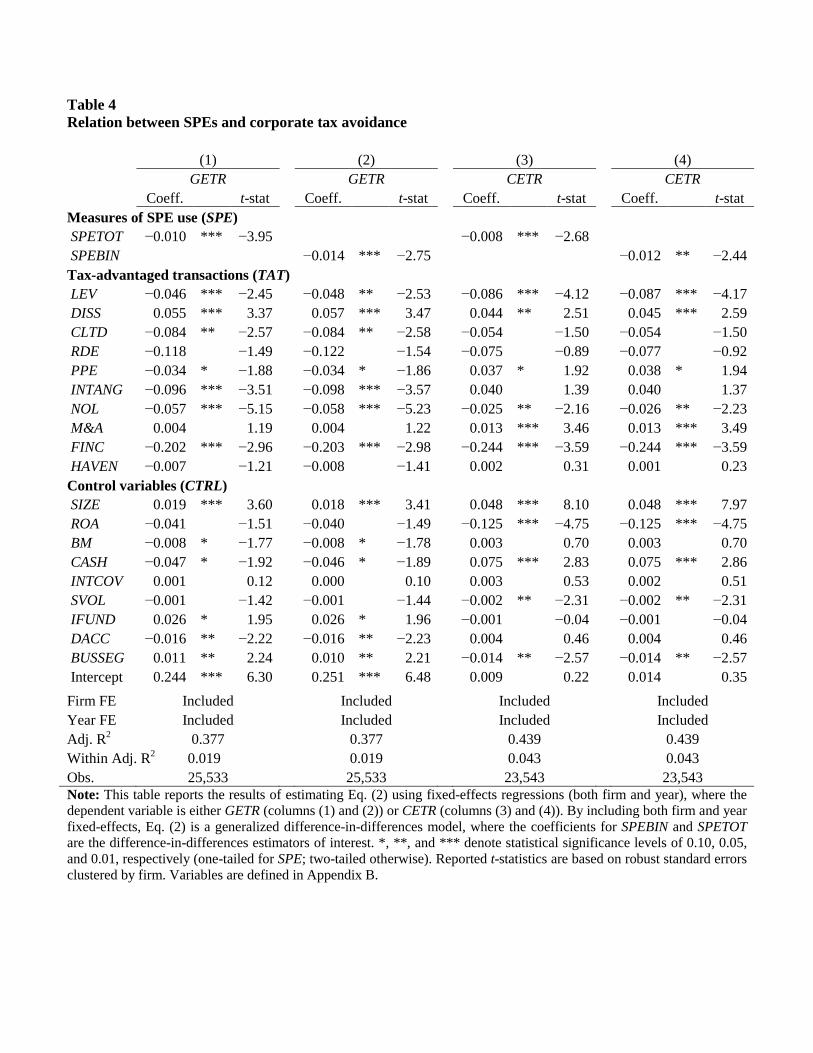
Table 4 Relation between SPEs and corporate tax avoidance (1) (2) (3) (4) GETR GETR CETR CETR Coeff. t-stat Coeff. t-stat Coeff. t-stat Coeff. t-stat Measures of SPE use (SPE) SPETOT −0.010 *** −3.95 −0.008 *** −2.68 SPEBIN −0.014 *** −2.75 −0.012 ** −2.44 Tax-advantaged transactions (TAT) LEV −0.046 *** −2.45 −0.048 ** −2.53 −0.086 *** −4.12 −0.087 *** −4.17 DISS 0.055 *** 3.37 0.057 *** 3.47 0.044 ** 2.51 0.045 *** 2.59 CLTD −0.084 ** −2.57 −0.084 ** −2.58 −0.054 −1.50 −0.054 −1.50 RDE −0.118 −1.49 −0.122 −1.54 −0.075 −0.89 −0.077 −0.92 PPE −0.034 * −1.88 −0.034 * −1.86 0.037 * 1.92 0.038 * 1.94 INTANG −0.096 *** −3.51 −0.098 *** −3.57 0.040 1.39 0.040 1.37 NOL −0.057 *** −5.15 −0.058 *** −5.23 −0.025 ** −2.16 −0.026 ** −2.23 M&A 0.004 1.19 0.004 1.22 0.013 *** 3.46 0.013 *** 3.49 FINC −0.202 *** −2.96 −0.203 *** −2.98 −0.244 *** −3.59 −0.244 *** −3.59 HAVEN −0.007 −1.21 −0.008 −1.41 0.002 0.31 0.001 0.23 Control variables (CTRL) SIZE 0.019 *** 3.60 0.018 *** 3.41 0.048 *** 8.10 0.048 *** 7.97 ROA −0.041 −1.51 −0.040 −1.49 −0.125 *** −4.75 −0.125 *** −4.75 BM −0.008 * −1.77 −0.008 * −1.78 0.003 0.70 0.003 0.70 CASH −0.047 * −1.92 −0.046 * −1.89 0.075 *** 2.83 0.075 *** 2.86 INTCOV 0.001 0.12 0.000 0.10 0.003 0.53 0.002 0.51 SVOL −0.001 −1.42 −0.001 −1.44 −0.002 ** −2.31 −0.002 ** −2.31 IFUND 0.026 * 1.95 0.026 * 1.96 −0.001 −0.04 −0.001 −0.04 DACC −0.016 ** −2.22 −0.016 ** −2.23 0.004 0.46 0.004 0.46 BUSSEG 0.011 ** 2.24 0.010 ** 2.21 −0.014 ** −2.57 −0.014 ** −2.57 Intercept 0.244 *** 6.30 0.251 *** 6.48 0.009 0.22 0.014 0.35 Firm FE Included Included Included Included Year FE Included Included Included Included Adj. R2 0.377 0.377 0.439 0.439 Within Adj. R2 0.019 0.019 0.043 0.043 Obs. 25,533 25,533 23,543 23,543 Note: This table reports the results of estimating Eq. (2) using fixed-effects regressions (both firm and year), where the dependent variable is either GETR (columns (1) and (2)) or CETR (columns (3) and (4)). By including both firm and year fixed-effects, Eq. (2) is a generalized difference-in-differences model, where the coefficients for SPEBIN and SPETOT are the difference-in-differences estimators of interest. *, **, and *** denote statistical significance levels of 0.10, 0.05, and 0.01, respectively (one-tailed for SPE; two-tailed otherwise). Reported t-statistics are based on robust standard errors clustered by firm. Variables are defined in Appendix B.
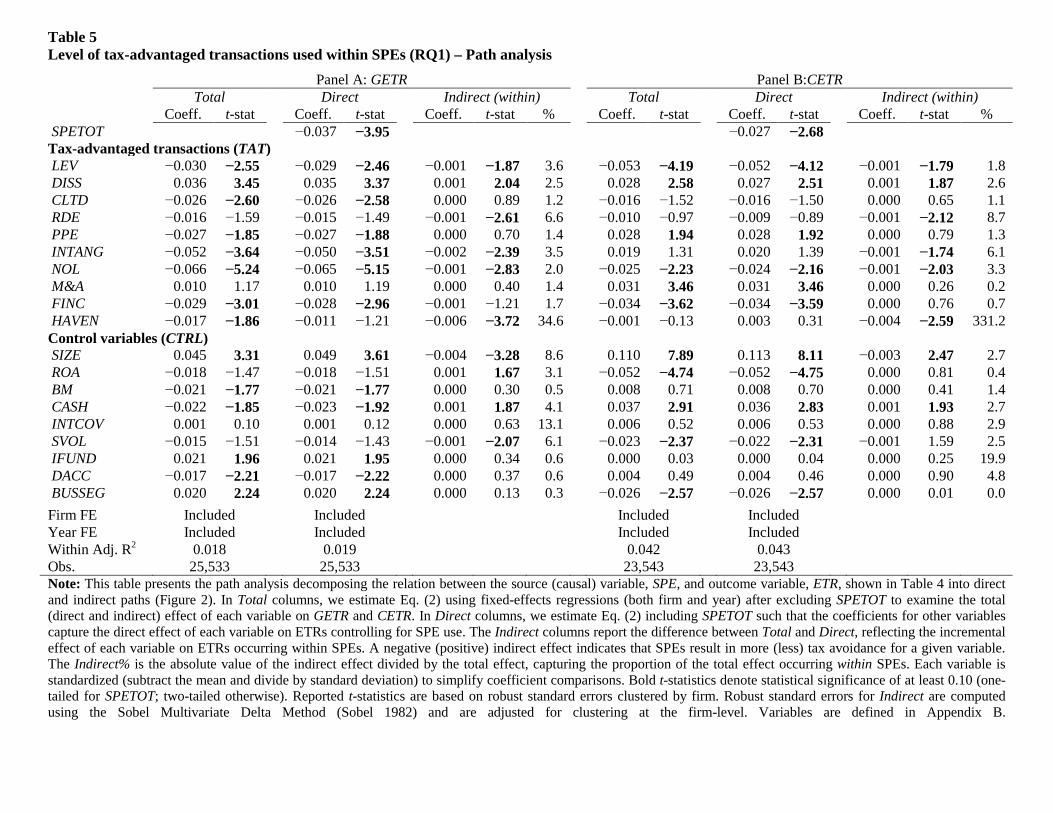
Table 5 Level of tax-advantaged transactions used within SPEs (RQ1) – Path analysis
Panel A: GETR Panel B:CETR Total Direct Indirect (within) Total Direct Indirect (within) Coeff. t-stat Coeff. t-stat Coeff. t-stat % Coeff. t-stat Coeff. t-stat Coeff. t-stat % SPETOT −0.037 −3.95 −0.027 −2.68 Tax-advantaged transactions (TAT) LEV −0.030 −2.55 −0.029 −2.46 −0.001 −1.87 3.6 −0.053 −4.19 −0.052 −4.12 −0.001 −1.79 1.8 DISS 0.036 3.45 0.035 3.37 0.001 2.04 2.5 0.028 2.58 0.027 2.51 0.001 1.87 2.6 CLTD −0.026 −2.60 −0.026 −2.58 0.000 0.89 1.2 −0.016 −1.52 −0.016 −1.50 0.000 0.65 1.1 RDE −0.016 −1.59 −0.015 −1.49 −0.001 −2.61 6.6 −0.010 −0.97 −0.009 −0.89 −0.001 −2.12 8.7 PPE −0.027 −1.85 −0.027 −1.88 0.000 0.70 1.4 0.028 1.94 0.028 1.92 0.000 0.79 1.3 INTANG −0.052 −3.64 −0.050 −3.51 −0.002 −2.39 3.5 0.019 1.31 0.020 1.39 −0.001 −1.74 6.1 NOL −0.066 −5.24 −0.065 −5.15 −0.001 −2.83 2.0 −0.025 −2.23 −0.024 −2.16 −0.001 −2.03 3.3 M&A 0.010 1.17 0.010 1.19 0.000 0.40 1.4 0.031 3.46 0.031 3.46 0.000 0.26 0.2 FINC −0.029 −3.01 −0.028 −2.96 −0.001 −1.21 1.7 −0.034 −3.62 −0.034 −3.59 0.000 0.76 0.7 HAVEN −0.017 −1.86 −0.011 −1.21 −0.006 −3.72 34.6 −0.001 −0.13 0.003 0.31 −0.004 −2.59 331.2 Control variables (CTRL) SIZE 0.045 3.31 0.049 3.61 −0.004 −3.28 8.6 0.110 7.89 0.113 8.11 −0.003 2.47 2.7 ROA −0.018 −1.47 −0.018 −1.51 0.001 1.67 3.1 −0.052 −4.74 −0.052 −4.75 0.000 0.81 0.4 BM −0.021 −1.77 −0.021 −1.77 0.000 0.30 0.5 0.008 0.71 0.008 0.70 0.000 0.41 1.4 CASH −0.022 −1.85 −0.023 −1.92 0.001 1.87 4.1 0.037 2.91 0.036 2.83 0.001 1.93 2.7 INTCOV 0.001 0.10 0.001 0.12 0.000 0.63 13.1 0.006 0.52 0.006 0.53 0.000 0.88 2.9 SVOL −0.015 −1.51 −0.014 −1.43 −0.001 −2.07 6.1 −0.023 −2.37 −0.022 −2.31 −0.001 1.59 2.5 IFUND 0.021 1.96 0.021 1.95 0.000 0.34 0.6 0.000 0.03 0.000 0.04 0.000 0.25 19.9 DACC −0.017 −2.21 −0.017 −2.22 0.000 0.37 0.6 0.004 0.49 0.004 0.46 0.000 0.90 4.8 BUSSEG 0.020 2.24 0.020 2.24 0.000 0.13 0.3 −0.026 −2.57 −0.026 −2.57 0.000 0.01 0.0 Firm FE Included Included Included Included Year FE Included Included Included Included Within Adj. R2 0.018 0.019 0.042 0.043 Obs. 25,533 25,533 23,543 23,543 Note: This table presents the path analysis decomposing the relation between the source (causal) variable, SPE, and outcome variable, ETR, shown in Table 4 into direct and indirect paths (Figure 2). In Total columns, we estimate Eq. (2) using fixed-effects regressions (both firm and year) after excluding SPETOT to examine the total (direct and indirect) effect of each variable on GETR and CETR. In Direct columns, we estimate Eq. (2) including SPETOT such that the coefficients for other variables capture the direct effect of each variable on ETRs controlling for SPE use. The Indirect columns report the difference between Total and Direct, reflecting the incremental effect of each variable on ETRs occurring within SPEs. A negative (positive) indirect effect indicates that SPEs result in more (less) tax avoidance for a given variable. The Indirect% is the absolute value of the indirect effect divided by the total effect, capturing the proportion of the total effect occurring within SPEs. Each variable is standardized (subtract the mean and divide by standard deviation) to simplify coefficient comparisons. Bold t-statistics denote statistical significance of at least 0.10 (one-tailed for SPETOT; two-tailed otherwise). Reported t-statistics are based on robust standard errors clustered by firm. Robust standard errors for Indirect are computed using the Sobel Multivariate Delta Method (Sobel 1982) and are adjusted for clustering at the firm-level. Variables are defined in Appendix B.
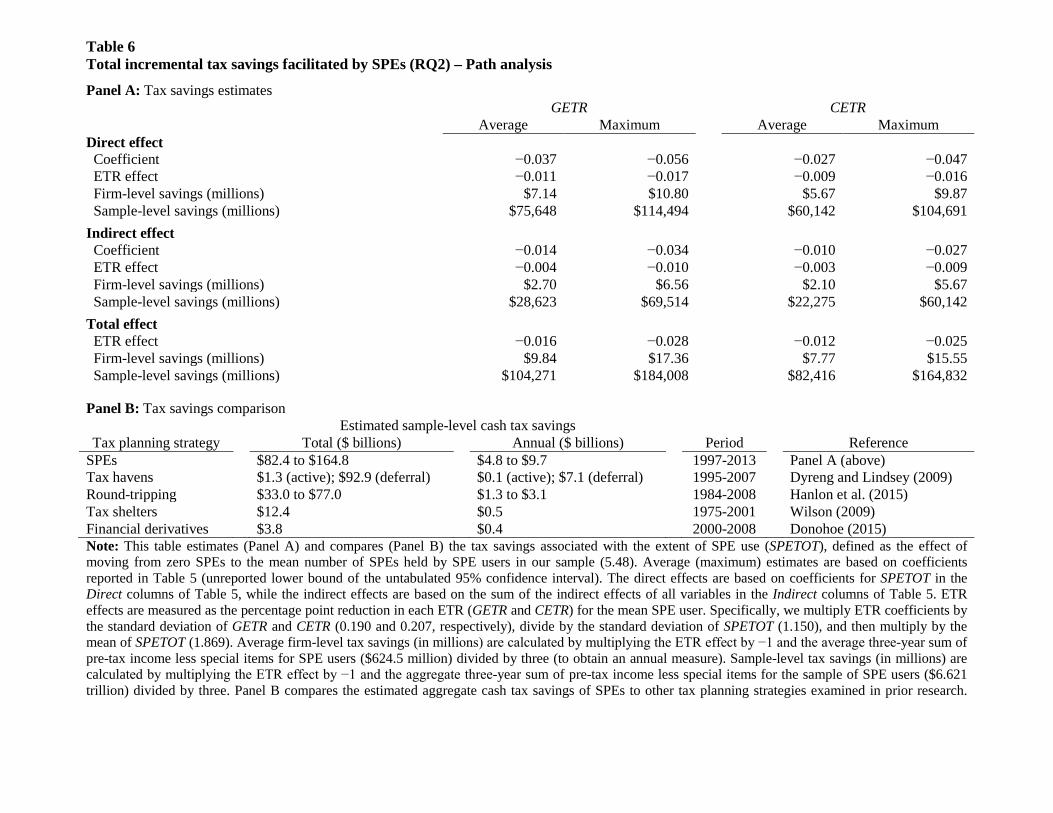
Table 6 Total incremental tax savings facilitated by SPEs (RQ2) – Path analysis
Panel A: Tax savings estimates GETR CETR Average Maximum Average Maximum
Direct effect Coefficient −0.037 −0.056 −0.027 −0.047 ETR effect −0.011 −0.017 −0.009 −0.016 Firm-level savings (millions) $7.14 $10.80 $5.67 $9.87 Sample-level savings (millions) $75,648 $114,494 $60,142 $104,691 Indirect effect Coefficient −0.014 −0.034 −0.010 −0.027 ETR effect −0.004 −0.010 −0.003 −0.009 Firm-level savings (millions) $2.70 $6.56 $2.10 $5.67 Sample-level savings (millions) $28,623 $69,514 $22,275 $60,142 Total effect ETR effect −0.016 −0.028 −0.012 −0.025 Firm-level savings (millions) $9.84 $17.36 $7.77 $15.55 Sample-level savings (millions) $104,271 $184,008 $82,416 $164,832 Panel B: Tax savings comparison
Estimated sample-level cash tax savings Tax planning strategy Total ($ billions) Annual ($ billions) Period Reference
SPEs $82.4 to $164.8 $4.8 to $9.7 1997-2013 Panel A (above) Tax havens $1.3 (active); $92.9 (deferral) $0.1 (active); $7.1 (deferral) 1995-2007 Dyreng and Lindsey (2009) Round-tripping $33.0 to $77.0 $1.3 to $3.1 1984-2008 Hanlon et al. (2015) Tax shelters $12.4 $0.5 1975-2001 Wilson (2009) Financial derivatives $3.8 $0.4 2000-2008 Donohoe (2015) Note: This table estimates (Panel A) and compares (Panel B) the tax savings associated with the extent of SPE use (SPETOT), defined as the effect of moving from zero SPEs to the mean number of SPEs held by SPE users in our sample (5.48). Average (maximum) estimates are based on coefficients reported in Table 5 (unreported lower bound of the untabulated 95% confidence interval). The direct effects are based on coefficients for SPETOT in the Direct columns of Table 5, while the indirect effects are based on the sum of the indirect effects of all variables in the Indirect columns of Table 5. ETR effects are measured as the percentage point reduction in each ETR (GETR and CETR) for the mean SPE user. Specifically, we multiply ETR coefficients by the standard deviation of GETR and CETR (0.190 and 0.207, respectively), divide by the standard deviation of SPETOT (1.150), and then multiply by the mean of SPETOT (1.869). Average firm-level tax savings (in millions) are calculated by multiplying the ETR effect by −1 and the average three-year sum of pre-tax income less special items for SPE users ($624.5 million) divided by three (to obtain an annual measure). Sample-level tax savings (in millions) are calculated by multiplying the ETR effect by −1 and the aggregate three-year sum of pre-tax income less special items for the sample of SPE users ($6.621 trillion) divided by three. Panel B compares the estimated aggregate cash tax savings of SPEs to other tax planning strategies examined in prior research.
54
Each estimate is reported as it is in the referenced study. The comparison is not intended to be a comprehensive summary of all tax avoidance strategies, but to provide context for our results.
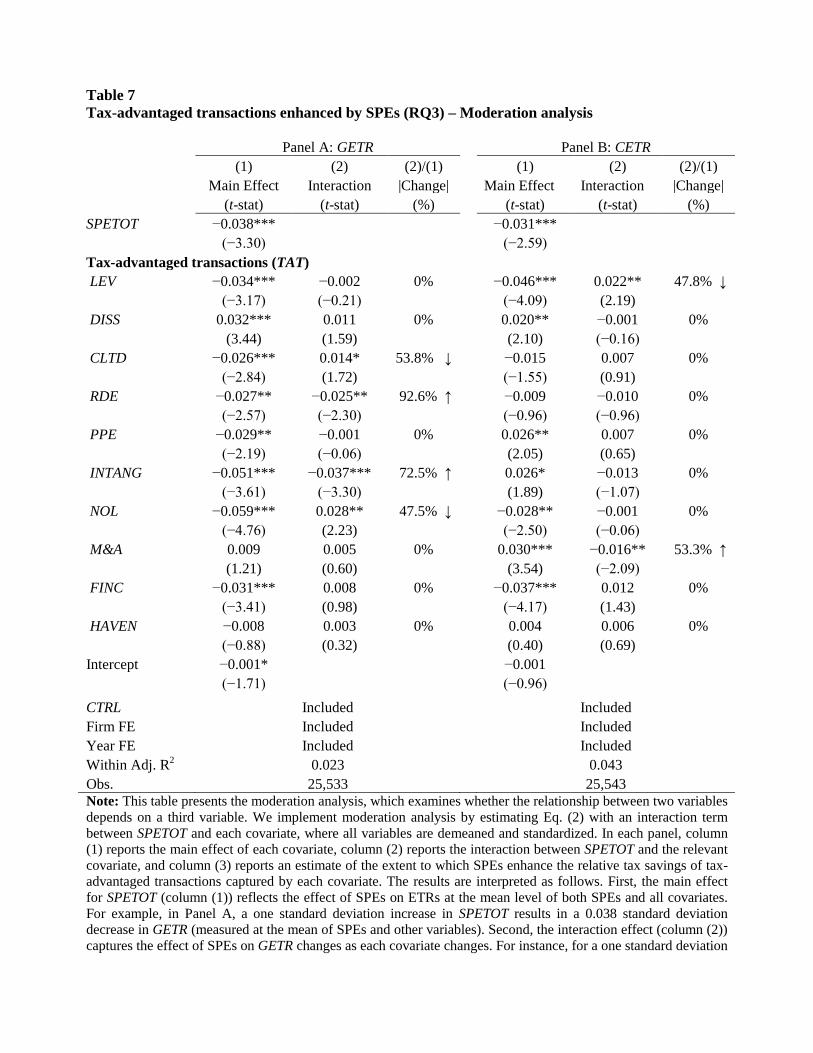
Table 7 Tax-advantaged transactions enhanced by SPEs (RQ3) – Moderation analysis Panel A: GETR Panel B: CETR (1) (2) (2)/(1) (1) (2) (2)/(1) Main Effect Interaction |Change| Main Effect Interaction |Change| (t-stat) (t-stat) (%) (t-stat) (t-stat) (%) SPETOT −0.038*** −0.031*** (−3.30) (−2.59) Tax-advantaged transactions (TAT) LEV −0.034*** −0.002 0% −0.046*** 0.022** 47.8% ↓ (−3.17) (−0.21) (−4.09) (2.19) DISS 0.032*** 0.011 0% 0.020** −0.001 0% (3.44) (1.59) (2.10) (−0.16) CLTD −0.026*** 0.014* 53.8% ↓ −0.015 0.007 0% (−2.84) (1.72) (−1.55) (0.91) RDE −0.027** −0.025** 92.6% ↑ −0.009 −0.010 0% (−2.57) (−2.30) (−0.96) (−0.96) PPE −0.029** −0.001 0% 0.026** 0.007 0% (−2.19) (−0.06) (2.05) (0.65) INTANG −0.051*** −0.037*** 72.5% ↑ 0.026* −0.013 0% (−3.61) (−3.30) (1.89) (−1.07) NOL −0.059*** 0.028** 47.5% ↓ −0.028** −0.001 0% (−4.76) (2.23) (−2.50) (−0.06) M&A 0.009 0.005 0% 0.030*** −0.016** 53.3% ↑ (1.21) (0.60) (3.54) (−2.09) FINC −0.031*** 0.008 0% −0.037*** 0.012 0% (−3.41) (0.98) (−4.17) (1.43) HAVEN −0.008 0.003 0% 0.004 0.006 0% (−0.88) (0.32) (0.40) (0.69) Intercept −0.001* −0.001 (−1.71) (−0.96) CTRL Included Included Firm FE Included Included Year FE Included Included Within Adj. R2 0.023 0.043 Obs. 25,533 25,543 Note: This table presents the moderation analysis, which examines whether the relationship between two variables depends on a third variable. We implement moderation analysis by estimating Eq. (2) with an interaction term between SPETOT and each covariate, where all variables are demeaned and standardized. In each panel, column (1) reports the main effect of each covariate, column (2) reports the interaction between SPETOT and the relevant covariate, and column (3) reports an estimate of the extent to which SPEs enhance the relative tax savings of tax-advantaged transactions captured by each covariate. The results are interpreted as follows. First, the main effect for SPETOT (column (1)) reflects the effect of SPEs on ETRs at the mean level of both SPEs and all covariates. For example, in Panel A, a one standard deviation increase in SPETOT results in a 0.038 standard deviation decrease in GETR (measured at the mean of SPEs and other variables). Second, the interaction effect (column (2)) captures the effect of SPEs on GETR changes as each covariate changes. For instance, for a one standard deviation
56
increase in LEV, the effect of a one standard deviation increase in SPETOT is associated with a further 0.002 standard deviation reduction in GETR (for a total of 0.040=0.038+0.002) about the mean of SPEs and other covariates except LEV, which increased by one standard deviation. Third, the percentage change (column (3)) measures the relative increase in tax savings from SPEs. For example, at the mean of SPETOT, a one standard deviation increase in RDE results in a 0.027 standard deviation decrease in GETR (column (1)). If SPETOT increases by one standard deviation, the effect of a one standard deviation increase in RDE is a 0.063 (0.038+0.025) standard deviation decrease in GETR. The incremental reduction (0.025) in GETR due to the increase in SPETOT reflects a 92.6% increase in tax savings relative to no change in SPETOT (0.025/0.027). The arrows denote whether transactions captured by the covariate are more (↑) or less (↓) efficient at generating tax savings when conducted within SPEs. *, **, and *** denote statistical significance levels of 0.10, 0.05, and 0.01, respectively. Reported t-statistics are based on robust standard errors clustered by firm. Variables are defined in Appendix B.
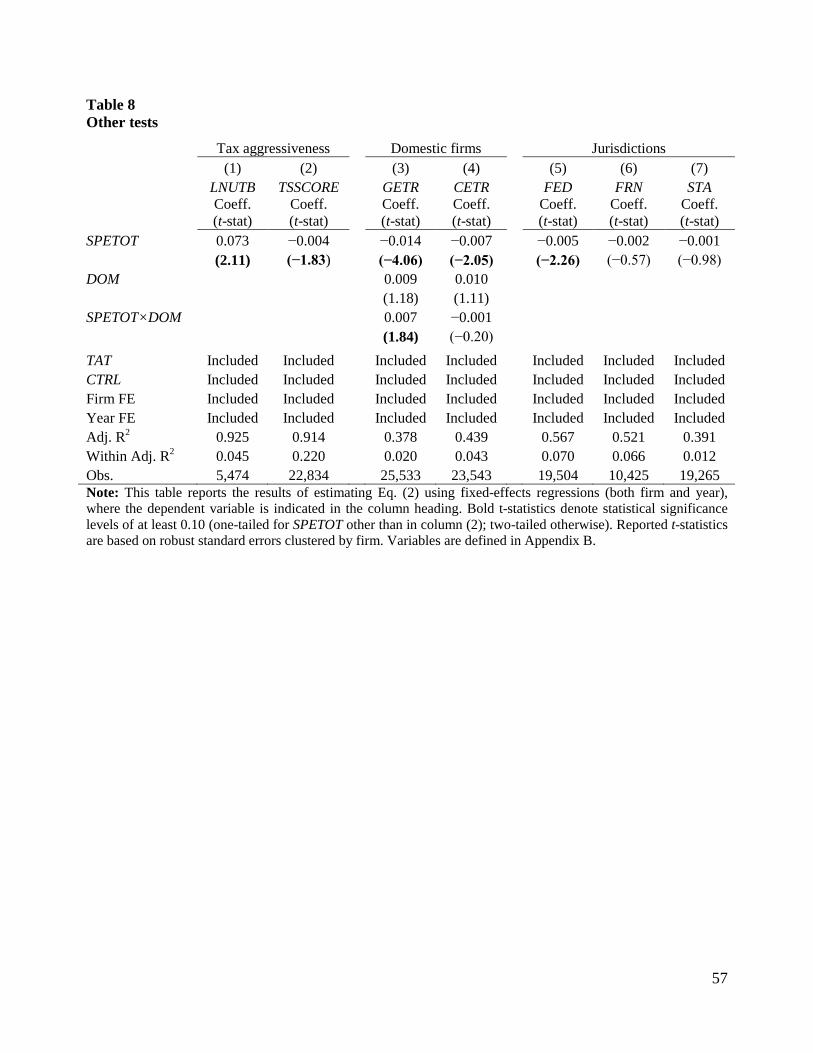
57
Table 8 Other tests
Tax aggressiveness Domestic firms Jurisdictions (1) (2) (3) (4) (5) (6) (7) LNUTB TSSCORE GETR CETR FED FRN STA
Coeff. (t-stat)
Coeff. (t-stat)
Coeff. (t-stat)
Coeff. (t-stat)
Coeff. (t-stat)
Coeff. (t-stat)
Coeff. (t-stat)
SPETOT 0.073 −0.004 −0.014 −0.007 −0.005 −0.002 −0.001 (2.11) (−1.83) (−4.06) (−2.05) (−2.26) (−0.57) (−0.98) DOM 0.009 0.010 (1.18) (1.11) SPETOT×DOM 0.007 −0.001 (1.84) (−0.20) TAT Included Included Included Included Included Included Included CTRL Included Included Included Included Included Included Included Firm FE Included Included Included Included Included Included Included Year FE Included Included Included Included Included Included Included Adj. R2 0.925 0.914 0.378 0.439 0.567 0.521 0.391 Within Adj. R2 0.045 0.220 0.020 0.043 0.070 0.066 0.012 Obs. 5,474 22,834 25,533 23,543 19,504 10,425 19,265 Note: This table reports the results of estimating Eq. (2) using fixed-effects regressions (both firm and year), where the dependent variable is indicated in the column heading. Bold t-statistics denote statistical significance levels of at least 0.10 (one-tailed for SPETOT other than in column (2); two-tailed otherwise). Reported t-statistics are based on robust standard errors clustered by firm. Variables are defined in Appendix B.
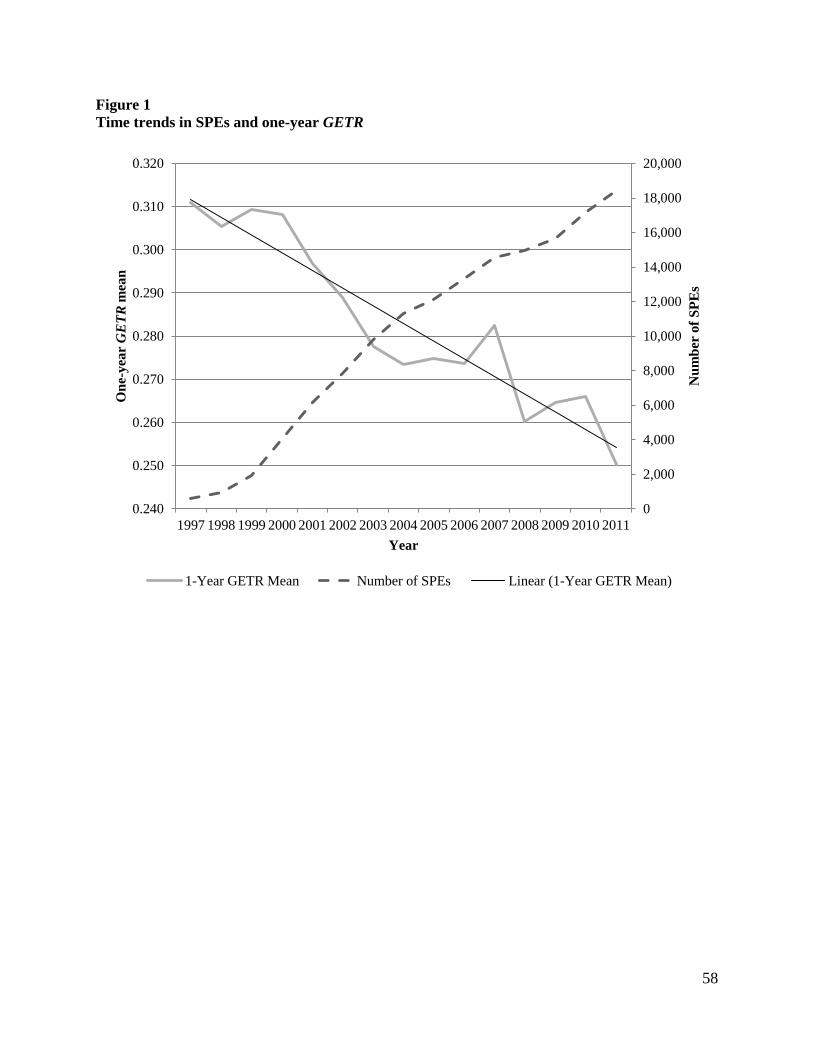
58
Figure 1 Time trends in SPEs and one-year GETR
0
2,000
4,000
6,000
8,000
10,000
12,000
14,000
16,000
18,000
20,000
0.240
0.250
0.260
0.270
0.280
0.290
0.300
0.310
0.320
1997 1998 1999 2000 2001 2002 2003 2004 2005 2006 2007 2008 2009 2010 2011
Num
ber
of S
PEs
One
-yea
r G
ETR
mea
n
Year
1-Year GETR Mean Number of SPEs Linear (1-Year GETR Mean)
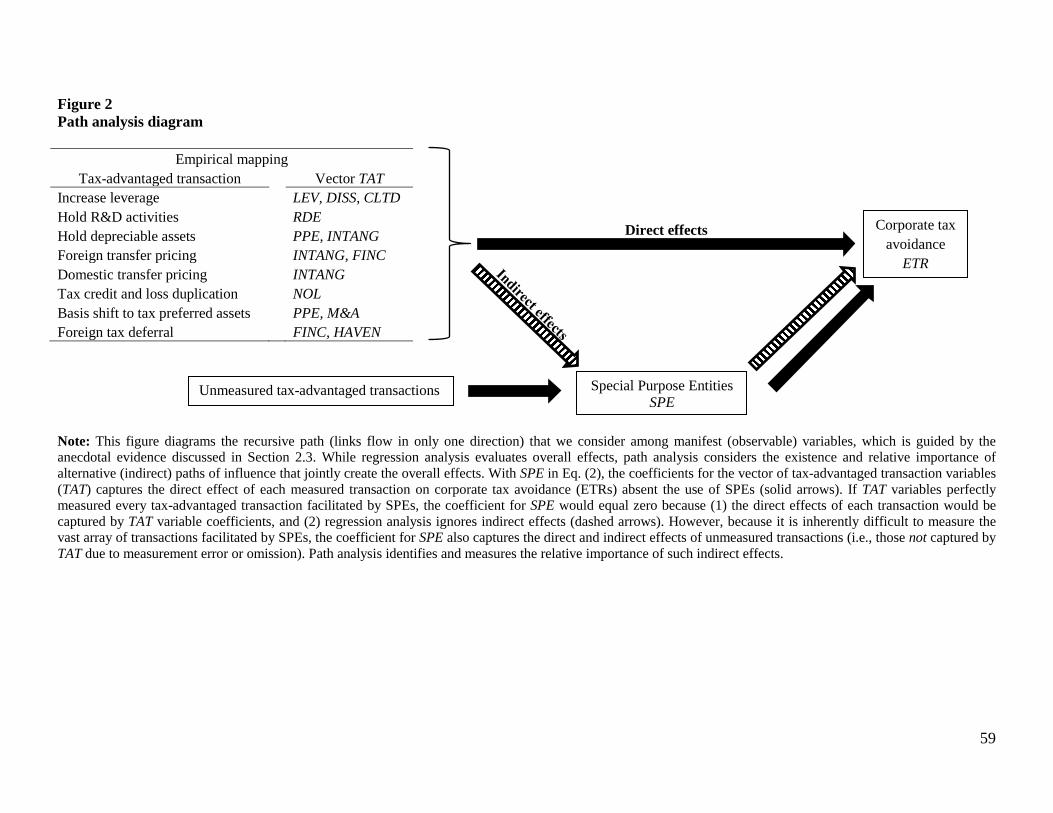
59
Figure 2 Path analysis diagram
Empirical mapping Tax-advantaged transaction Vector TAT
Increase leverage LEV, DISS, CLTD Hold R&D activities RDE Hold depreciable assets PPE, INTANG Foreign transfer pricing INTANG, FINC Domestic transfer pricing INTANG Tax credit and loss duplication NOL Basis shift to tax preferred assets PPE, M&A Foreign tax deferral FINC, HAVEN Note: This figure diagrams the recursive path (links flow in only one direction) that we consider among manifest (observable) variables, which is guided by the anecdotal evidence discussed in Section 2.3. While regression analysis evaluates overall effects, path analysis considers the existence and relative importance of alternative (indirect) paths of influence that jointly create the overall effects. With SPE in Eq. (2), the coefficients for the vector of tax-advantaged transaction variables (TAT) captures the direct effect of each measured transaction on corporate tax avoidance (ETRs) absent the use of SPEs (solid arrows). If TAT variables perfectly measured every tax-advantaged transaction facilitated by SPEs, the coefficient for SPE would equal zero because (1) the direct effects of each transaction would be captured by TAT variable coefficients, and (2) regression analysis ignores indirect effects (dashed arrows). However, because it is inherently difficult to measure the vast array of transactions facilitated by SPEs, the coefficient for SPE also captures the direct and indirect effects of unmeasured transactions (i.e., those not captured by TAT due to measurement error or omission). Path analysis identifies and measures the relative importance of such indirect effects.
Direct effects
Special Purpose Entities SPE
Corporate tax avoidance
ETR
Unmeasured tax-advantaged transactions