Embed Size (px)
Citation preview

The Economic Argument for Cleaning Up the Chesapeake Bay and its Rivers

The Economic Argument for Cleaning Up the Chesapeake Bay and its Rivers
CONTENTS
INTRODUCTION ..................................................................................................................................................1
SPOTLIGHT: IMPROVING SEWAGE PLANTS BOOSTS ECONOMY .........................................................................3
CHEAPEAKE BAY FISHERIES ..............................................................................................................................5
WATER QUALITY IMPACT ON FISHERIES .............................................................................................................6
SPOTLIGHT: CONTROLLING POLLUTED RUNOFF CREATES LOCAL JOBS ............................................................7
SPOTLIGHT: POLLUTION AND DISEASE THREATEN PENNSYLVANIA'S FISHING INDUSTRY ...............................11
WATER-QUALITY IMPACT ON PUBLIC HEALTH AND LOCAL ECONOMIES ..........................................................13
SPOTLIGHT: REDUCING POLLUTION FROM FARMS BENEFITS LOCAL ECONOMY ............................................15
CONCLUSION ....................................................................................................................................................17
END NOTES .......................................................................................................................................................18

The Economic Argument for Cleaning Up the Chesapeake Bay and its Rivers
CHESAPEAKE BAY FOUNDATION, MAY 2012 cbf.org/economicreport
1
The Economic Argument for Cleaning Up the Chesapeake Bay and its Rivers
INTRODUCTION
The Chesapeake Bay is the largest and once most productive estuary in the United States. Its beauty is legendary. Congress has recognized it as a “national treasure and resource of worldwide significance.”1 Respected economists have valued it at over one trillion dollars related to fishing, tourism, property values, and shipping activities.2, 3
But the Bay and the rivers and streams in its six-state, 64,000-square-mile watershed are polluted, even listed on the Clean Water Act’s “impaired waters” list. Indeed, the Chesapeake is a system grossly out of balance. Each of the 17 million (and growing) people who live in the Chesapeake’s watershed pays the price. Human health is at risk, and jobs are lost. Iconic Bay wildlife is threat-ened in many cases.
Failure to “Save the Bay” threatens the Bay’s value as an economic driver. Con-versely, investing in clean-water technology creates jobs, generates economic ac-tivity, and saves money in the long run. Hence, the protection and restoration of the Chesapeake is essential for a healthy and vibrant regional economy.
Efforts to delay restoration of the Bay will only exacerbate the economic losses this region has already experienced due to poor water quality.
INVESTMENT IN CLEAN-WATER TECHNOLOGIES CREATES JOBS AND STIMULATES LOCAL ECONOMIES
According to the World Resources Institute, annual costs for clean air and wa-ter regulations issued by the U.S. Environmental Protection Agency (EPA) from October 1, 1999, to September 30, 2009, ranged from $26 to $29 billion, while benefits ranged from $82 to $533 billion.4
Currently, a clean water blueprint for the Chesapeake Bay and its rivers and streams is in place. The blueprint includes science-based pollution limits and the Bay states’ plans to achieve them. In 2010, EPA established pollution limits (known legally as a Total Maximum Daily Load or TMDL) quantifying the amount of nitrogen, phosphorus, and sediment pollution the Bay could accommodate and still meet water-quality standards. EPA allocated specific numeric pollution-reduction targets for each of the six Bay states and the District of Columbia and established a 2025 goal for implementing programs to achieve those target reductions. Each of the jurisdictions has written its own unique plan (Watershed Implementation Plan or WIP) for how it will meet its targets. At this point in time, the jurisdictions are refining and beginning to implement their plans.

The Economic Argument for Cleaning Up the Chesapeake Bay and its Rivers
CHESAPEAKE BAY FOUNDATION, MAY 2012 cbf.org/economicreport
2
The plans call for investments in upgrades to wastewater treatment plants, im-provements to stormwater and wastewater infrastructure, and implementation of agricultural conservation practices. These investments will all create local jobs and contribute to local economies.
For example, an analysis of the value of investing in water and sewer infrastructure concluded that these investments typically yield greater returns than most other types of public infrastructure.5 A $1 investment in water and sewer infrastructure increases private output (Gross Domestic Product) in the long term by $6.35. Furthermore, adding a job in water and sewer creates 3.68 jobs to support that one.
More specifically, upgrading sewage treatment plants and wastewater and stormwater infrastructure across the watershed has created hundreds of construc-tion jobs, and will create thousands more as the program grows.6 Also, upgrad-ing individual septic systems has employed installers, electricians, and others involved in the business. These upgrades have pumped millions of dollars into the region’s economy. A real-life example is Mayer Brothers, Inc., in Elkridge, Maryland.7 This company staved off significant layoffs when it won a contract from the Maryland Department of the Environment (MDE) to help supply new septic technology throughout Maryland.
On the flip side, cuts to funding programs for clean-water infrastructure will lead to job losses. Carter B. McCamy says he would probably have to lay off over 20 workers from his Arbutus company if the Maryland legislature cuts the Chesa-peake and Atlantic Coastal Bays Trust Fund.8 The firm has received significant contracted work through the Trust Fund and employs 115 full-time workers and supports an additional 100 subcontractors who provide trucking materials, con-crete, paving, and fencing required for stormwater mitigation projects.
Investments in agricultural conservation practices also lead to job creation and stimulate economic activity in rural communities. A study by the University of Virginia found that implementation of agricultural practices, such as livestock stream exclusion, buffers, and cover crops, would generate significant econom-ic impacts.9 Every $1 of state and/or federal funding invested in agricultural best management practices would generate $1.56 in economic activity in Virginia. Implementing agricultural practices in Virginia to the levels neces-sary to restore the Bay would create nearly 12,000 jobs of approximately one year’s duration.
Furthermore, a recent poll in Virginia found that an overwhelming majority be-lieve the state can protect water quality and still have a strong economy. Eighty percent of respondents agreed with the statement, “we can protect the water quality in rivers, creeks, and the Chesapeake Bay and have a strong economy with good jobs for Virginians, without having to choose one over the other.” Of those
INVESTMENT$1 of water and sewer infrastructure investment increases private output (Gross Domestic Product) in the long term by $6.35.

The Economic Argument for Cleaning Up the Chesapeake Bay and its Rivers
CHESAPEAKE BAY FOUNDATION, MAY 2012 cbf.org/economicreport
3
The District of Columbia Water and Sewer Authority is upgrading the largest sewer
treatment plant in the Bay region. This will mean cleaner
water (as shown by senior process engineer Nick
Passarelli), and tens of thousands of
jobs created.
Improving Sewage Plants Boosts Economy
Tens of thousands of jobs for engineers, laborers, computer technicians, and others are being created as part of more than $3 billion in construction projects at the largest sewage treatment plant in the Chesapeake Bay region.
Blue Plains Advanced Wastewater Treatment Plant in Washington, D.C., serves about two million people in the District of Columbia and suburban Maryland and Virginia. The plant releases 370 million gallons of effluent a day into the Potomac River and has a ma-jor impact on water quality.
To implement the clean water blueprint for the Chesapeake Bay and its rivers and streams, the District of Columbia Water and Sewer Authority is building an advanced nitrogen pollution removal system that will cut the amount of nitrogen the plant releases by 44 percent (or 3.7 million pounds annually) by 2014.
In addition, starting in August 2012, a caterpillar-shaped machine the length of a football field will begin digging a 13-mile-long sewage-control tunnel from Blue Plains under the Anacostia River and D.C.
The tunnel will be 23 feet wide—as big as a Metro tunnel. The massive tube will catch about three billion gallons a year of sewage mixed with stormwater that right now overflows into the Potomac and Anacostia Rivers during rain storms.
Previous upgrades at Blue Plains during the 1980s had a dramatic impact on water quality in the Potomac River, which went from being a national disgrace to the site of national bass fishing tournaments.
George Hawkins, General Manager of the District of Columbia Water and Sewer Author-ity, said the most recent round of upgrades will not only continue those improvements, but also boost the local economy.

The Economic Argument for Cleaning Up the Chesapeake Bay and its Rivers
CHESAPEAKE BAY FOUNDATION, MAY 2012 cbf.org/economicreport
4
Antoine Blair (above), a construction worker from Washington, D.C. was unemployed when he was hired to help DC Water improve its pollution control systems. "It's creating a lot of jobs," he said.
“What people are sending down the pipes to us is valuable, and we can convert it to clean-green renewable energy.”Chris Peot, Manager at DC Water
“Tens of thousands of jobs will be created by this proj-ect, and there is also all the machinery and equipment that needs to be purchased—all the pipes, for example,” Hawkins said. “So there will be a ripple effect of econom-ic consequences even greater than just the people hired.”
Each $1 billion invested in water and sewage projects can generate 20,000 jobs in construction, engineering, and manufacturing in a chain reaction that has a multiplier effect through the economy, according to a 2009 report by the Clean Water Council.
One of the people hired for the D.C. tunnel project is Chris Turner, a technician from Vienna, Virginia, who specializes in computer-assisted drafting and design. “I was out of work for almost two years before I got this job,” said Turner, who works for Delon Hampton and Associates. “So I really appreciate being able to help with the proj-ect. I absolutely take pride in not just the paycheck, but also the knowledge that it is contributing to the environment.”
Antoine Blair, a construction worker from Washington, D.C., was out of work for two months when he was hired last August. “It was hard, trying to pay bills on unemploy-ment,” said Blair, a father of five who works as a laborer for Traylor Skanska Jay Dee Joint Venture. “This work came along at just the right time. It’s creating a lot of jobs for people who really need it.”
About 20,000 truckloads of concrete are being supplied for the project by Monumental Concrete, a minority-owned firm located near Blue Plains in Southwest D.C. that pro-vides work to three employees and 20 contract workers.
“This is a major portion of our business right now. We are immeasurably thankful for it,” said Pat Banks DeVeaux, an owner and manager of Monumental Concrete. “We are thrilled to be part of the solution to clean up D.C.’s waterways. To contribute to this project is something that is very close to my heart.”
The Blue Plains construction project is also a showcase for technological innovation. DC Water is investing more than $400 million to build a renewable energy system called a thermal hydrolysis digester that will extract methane from the solid waste that is left over after the sewage is filtered.
This methane will be burned in generators to create 13 megawatts of electricity—nick-named “people power”—enough to light 10,000 homes, said Chris Peot, a manager at DC Water. The agency will use the electricity to save about $10 million to $20 million a year in electric bills.
“What people are sending down the pipes to us is valuable, and we can convert it to clean-green renewable energy,” Peot said.
The digester will reduce by half the 60 truckloads of solid waste a day coming out of the sewage plant, and this will mean less land filled or spread on fields as fertilizer, Peot said. The reduction could also save ratepayers $10 million a year in hauling costs.

The Economic Argument for Cleaning Up the Chesapeake Bay and its Rivers
CHESAPEAKE BAY FOUNDATION, MAY 2012 cbf.org/economicreport
5
polled, 92 percent believe the Bay is “important for Virginia’s economy.” Imple-mentation of the clean water blueprint for the Chesapeake Bay and its rivers and streams will result in clean water, a healthy Bay, and a strong regional economy.
THE CHESAPEAKE BAY SUPPORTS ECONOMICALLY AND ECOLOGICALLY IMPORTANT COMMERCIAL AND RECREATIONAL FISHERIES
The Chesapeake’s fisheries industry, including both shellfish and finfish, is a significant part of the region’s local economy. The 2009 Fisheries Economics of the U.S. Report by the National Oceanic and Atmospheric Administration (NOAA) indicates that the commercial seafood industry in Maryland and Virginia contributed $3.39 billion in sales, $890 million in income, and almost 34,000 jobs to the local economy.10
The annual economic benefits of salt-water recreational fishing are equally impressive, contributing $1.34 billion in sales that in turn contributed almost $700 million of additional economic activity and roughly 11,000 jobs.11 The ma-jority (90-98 percent) of the commercial and recreational saltwater landings in the Mid-Atlantic region come from the Chesapeake Bay.12
Crabs
Arguably no other creature exemplifies the Chesapeake Bay better than the blue crab, Callinectes sapidus. For more than a half century, the blue crab has been the most iconic of the Bay’s commercial fisheries. Over one-third of the nation’s blue crab harvest comes from the Bay. The average annual commercial harvest in Maryland and Virginia between 2000 and 2009 was over 55 million pounds.13
The dockside value of the blue crab harvest Bay-wide in 2009 was approximate-ly $78 million.14 The recreational crab fishery also provides a significant finan-cial offset for Bay residents—the cost of catching crabs is far less than having to buy them.
Oysters
Another critical Bay species, commercially, recreationally, and ecologically, is the American oyster, Crassostrea virginica. From the late 1800s to the mid-1900s, the commercial oyster industry employed thousands of people in the Bay re-gion catching, selling, shucking, and shipping oysters to market. Hundreds of skipjacks—sail-powered dredge boats—plied the waters of the Bay in search of the delectable oyster. The industry generated millions of dollars a year for the Bay economy. Until the mid-1980s, oysters supported the leading commercial
FISHERIESThe 2009 Fisheries Economics of the U.S. report by the National Oceanic and Atmospheric Administration (NOAA) indicates that the commercial seafood industry in Maryland and Virginia contributed $3.39 billion in sales, $890 million in income, and almost 34,000 jobs to the local economy.
to the local economy.
=

The Economic Argument for Cleaning Up the Chesapeake Bay and its Rivers
CHESAPEAKE BAY FOUNDATION, MAY 2012 cbf.org/economicreport
6
fishery in the Bay.15 Like the blue crab, Chesapeake oysters spawned a rich cultural heritage.
In addition to their commercial and recreational value, oysters im-prove water quality because they are filter feeders. An individual adult oyster can pump over 50 gallons of water a day through its gills, which strain out food and pollutants: chemicals, nitrogen, phosphorus, and sediment. In addition, oyster reefs provide valu-able habitat for countless Bay creatures—most notably finfish—and serve as popular fishing areas. In 2010 the harvest of over one million pounds of oysters from the Chesapeake was valued at $9.4 million.16
Rockfish
Rockfish or striped bass, Morone saxatilis, has been and remains the most popular commercial and recreational finfish in the Bay, generating roughly $500 million of economic activity related to fishing expenditures, travel, lodging, etc. per year.17
EACH OF THESE CRITICAL FISHERIES HAS BEEN DEGRADED BY POOR WATER QUALITY WITH SIGNIFICANT RESULTING ECONOMIC LOSSES
The economic losses associated with the decline in fisheries resources in the Bay are substantial. Between 1994 and 2004, the value of Virginia’s seafood harvest decreased by 30 percent18 with Maryland’s commercial landings exhibiting a similar decline during that time.19 Jobs declined as well. In 1974 there were 136 oyster shucking houses, today only about half a dozen remain.20
Crabs
For the last three years, the Chesapeake Bay blue crab population has been on the rebound, thanks in large part to aggressive management measures; however, prior to this, the overall crab trend since the 1990s had been a decrease in land-ings despite increased crabbing efforts.21
In addition, the number of crabs one year and older had dropped from 276 mil-lion in 1990 to 131 million in 2008.22 When the broader impact on restaurants, crab processors, wholesalers, grocers, and watermen is added up, the decline of crabs in the Bay has meant a cumulative loss to Maryland and Virginia of about $640 million between 1998 and 2006.23
As a result of the low population level, in 2008, Maryland and Virginia issued severe crabbing restrictions, in an attempt to restore the population. These re-strictions placed severe economic hardship on Chesapeake Bay crabbers. In
The decline of the Bay oyster has been a huge economic loss for
Maryland and Virginia.
© 2
010
Mor
gan
Heim
/iLC
P
The Economic Argument for Cleaning Up the Chesapeake Bay and its Rivers
CHESAPEAKE BAY FOUNDATION, MAY 2012 cbf.org/economicreport
7
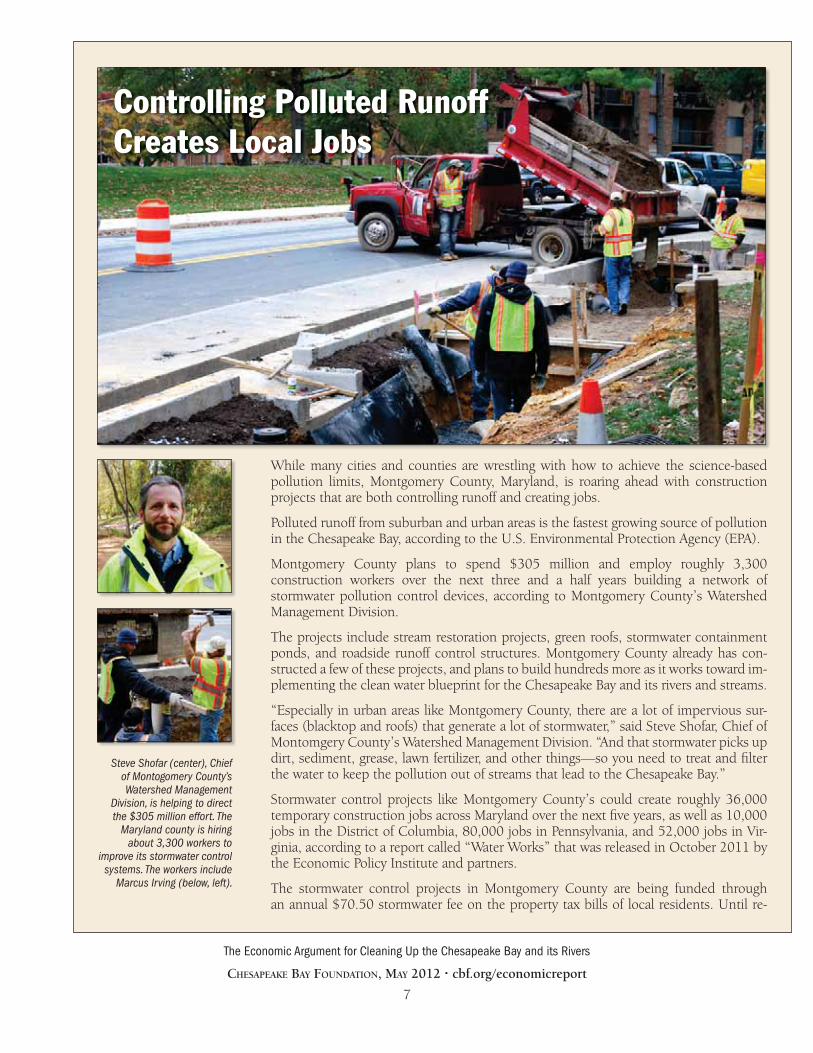
While many cities and counties are wrestling with how to achieve the science-based pollution limits, Montgomery County, Maryland, is roaring ahead with construction projects that are both controlling runoff and creating jobs.
Polluted runoff from suburban and urban areas is the fastest growing source of pollution in the Chesapeake Bay, according to the U.S. Environmental Protection Agency (EPA).
Montgomery County plans to spend $305 million and employ roughly 3,300 construction workers over the next three and a half years building a network of stormwater pollution control devices, according to Montgomery County’s Watershed Management Division.
The projects include stream restoration projects, green roofs, stormwater containment ponds, and roadside runoff control structures. Montgomery County already has con-structed a few of these projects, and plans to build hundreds more as it works toward im-plementing the clean water blueprint for the Chesapeake Bay and its rivers and streams.
“Especially in urban areas like Montgomery County, there are a lot of impervious sur-faces (blacktop and roofs) that generate a lot of stormwater,” said Steve Shofar, Chief of Montomgery County’s Watershed Management Division. “And that stormwater picks up dirt, sediment, grease, lawn fertilizer, and other things—so you need to treat and filter the water to keep the pollution out of streams that lead to the Chesapeake Bay.”
Stormwater control projects like Montgomery County’s could create roughly 36,000 temporary construction jobs across Maryland over the next five years, as well as 10,000 jobs in the District of Columbia, 80,000 jobs in Pennsylvania, and 52,000 jobs in Vir-ginia, according to a report called “Water Works” that was released in October 2011 by the Economic Policy Institute and partners.
The stormwater control projects in Montgomery County are being funded through an annual $70.50 stormwater fee on the property tax bills of local residents. Until re-
Steve Shofar (center), Chief of Montogomery County’s Watershed Management
Division, is helping to direct the $305 million effort. The
Maryland county is hiring about 3,300 workers to
improve its stormwater control systems. The workers include
Marcus Irving (below, left).
Controlling Polluted Runoff Creates Local Jobs

The Economic Argument for Cleaning Up the Chesapeake Bay and its Rivers
CHESAPEAKE BAY FOUNDATION, MAY 2012 cbf.org/economicreport
8
cently, only a few local governments in the Bay water-shed—including Washington, D.C.; Takoma Park; Rock-ville; Annapolis; and Richmond—have such fees or aggressive policies for managing stormwater, according to EPA. The good news is that this is changing. In its 2012 legislative session, Maryland passed a bill that will require the state’s nine most populous counties and Bal-timore to begin collecting stormwater fees of their choice by July 1, 2013.
“It’s a key priority of the Environmental Protection Agen-cy and the Bay states to get a better handle on what we call wet-weather pollution, or stormwater pollution,” said Jon Capacasa, Director of the Water Protection Division for EPA Region III. “Clearly, Montgomery County, Mary-land, is one of the leaders in meeting the challenge.”
A February 2010 stormwater control permit approved by the Maryland Department of the Environment requires Montgomery County to rebuild or add stormwater pollution devices to 20 percent of its impervious surfaces, such as blacktop and roofs. That means about 4,300 acres.
The county is also building cutting-edge stormwater control devices called “bump outs,” which are patterned after a system pioneered in Portland, Oregon. These devices, which cost from $30,000 to $50,000 each, are built a few feet out into the parking lane of a roadway, with openings at both ends to collect runoff that gurgles down a gutter.
Plants growing in a bump-out’s ditch-like indentation absorb pollution, while small dams slow the flow of water. A gravel bed and perforated pipes under the ditch allows water to seep down into the ground.
Mike Peny, Construction Division Manager for Angler Environmental, said his company boosted its employment by 12 percent this year, hiring 10 workers just to keep up with Montgomery County’s efforts to implement the clean water blueprint for the Chesa-peake Bay and its rivers and meet the terms of its state stormwater permit.
Peny said the clean water blueprint for the Chesapeake Bay and its rivers and streams has been nothing but a help for his company. “This really creates jobs for us,” Peny said, as he stood beside a once-eroded stream called Booze Creek in Montgomery County that his company rebuilt. “These types of projects are what drive our ability to hire and stay in business.”
One of the laborers hired to build roadside stormwater control devices in Montgomery County is Marcus Irving, who works for Highway and Safety Services, Inc. “Before I got this job two months ago, I was out of work for eight months,” said Irving, a 34-year-old father of two from Montomery County.
He said he had been laid off from a job laying cable for a television cable company. “It was extremely tough, living day to day, basically,” Irving recalled. “But then this job opportunity became available, and it was a blessing. It’s a beautiful thing for me to be working again, feeling like an adult again, and putting food on the table for my family.”
Marcus Irving, a worker at Highway and Safety Services, Inc., was unemployed before being hired to help build stormwater control systems for Montgomery County.
“It’s a beautiful thing for me to be working again, feeling like an adult again, and putting food on the table for my family.”Marcus Irving, Highway and Safety Services, Inc. Worker

The Economic Argument for Cleaning Up the Chesapeake Bay and its Rivers
CHESAPEAKE BAY FOUNDATION, MAY 2012 cbf.org/economicreport
9
response, members of Congress from Maryland and Virginia requested federal disaster relief for Bay crab fishermen. In September 2008, the Secretary of Commerce determined that the Chesapeake Bay soft shell blue crab fishery had undergone a com-mercial failure as defined under the Magnuson-Ste-vens Fishery Conservation and Management Act (16 USC § 1861). In January 2009, the Department of Commerce allocated $10 million of disaster relief to each state.24
Because of the restrictions on catching female crabs imposed by Virginia and Maryland in 2008, the esti-mated number of blue crabs in the Bay nearly tripled between 2007 and 2011, rising to 764 million in 2011.25 Nonetheless, scientists believe that poor water quality may be limiting crab populations in the Chesapeake Bay. On average, over the last 10 years, more than 75 percent of the Chesapeake Bay and its tidal rivers have had insufficient levels of dissolved oxygen.26 Low oxygen levels drive blue crabs from their pre-ferred habitat and kill many of the small bottom organisms on which they feed.27 The low dissolved oxygen conditions caused by nitrogen and phosphorus pollu-tion are the primary reason large sections of the Bay have become unsuitable as blue crab habitat. A study by the University of Maryland confirms that decreases in dissolved oxygen can reduce crab harvests and revenue to watermen.28
Poor water clarity also has hurt crab populations. This pollution-driven prob-lem has reduced the acreage of underwater grasses necessary to protect juvenile crabs, molting crabs, and adult crabs from predation. Studies have shown that crabs living in areas with little or no coverage of underwater grasses suffer higher mortality.29 Water clarity in the Bay has been decreasing since the 1990s and in 2009, only 26 percent of it had acceptable water clarity.
The conclusion is clear. Until water quality improves, the blue crab population will not fully recover.30
Oysters
A combination of overharvesting, disease, and pollution has decimated the oys-ter population in the Chesapeake Bay. Silt washed by rain from urban areas and agricultural fields can bury oyster beds, particularly those that have been flat-tened by dredges.31 Extended periods of zero-oxygen conditions can be fatal to oysters.32 In addition, recent studies have indicated that low oxygen levels can stress the oysters’ immune systems, making them more susceptible to disease.33 Pollution has also resulted in the closure of shellfish beds to commercial harvest-ing. Threats from sewage and bacteria forced Maryland and Virginia to close or restrict oyster harvesting in 223,864 acres of the Bay and its tributaries in 2008,
Until water quality improves, the blue crab population will not fully recover.
© 2010 Karine Aigner/iLCP

The Economic Argument for Cleaning Up the Chesapeake Bay and its Rivers
CHESAPEAKE BAY FOUNDATION, MAY 2012 cbf.org/economicreport
10
about eight percent of the total shellfish beds.34 The decline of the Bay oyster over the last 30 years has meant a loss of more than $4 billion for Maryland and Virginia.35
Rockfish
Faced with a catastrophic collapse in the fishery, Maryland banned commercial and recreational fishing for rockfish in its portion of the Bay from 1985-90, and Virginia followed suit with a one-year mora-torium in 1989.36 The dramatic decline of the population was due to several factors, including heavy overfishing and low dissolved ox-ygen in many parts of the Bay. Today, the rockfish population is at its highest in decades because of tight catch restrictions. However, scientists are concerned about high prevalence of the usually fatal wasting disease Mycobacteriosis. The fishes’ current susceptibility to it appears to come from environmental stress generated by poor water quality and limited availability of preferred prey.37
Studies by Lipton and Hicks38,39 have estimated the impact of dis-solved oxygen on rockfish catch rates in the Chesapeake Bay, as
well as the impact of higher catch rates on the value of a fishing day. They found that a 2.4 mg/L improvement in dissolved oxygen could increase striped bass catch rates by 95 percent. Furthermore, the value of catching more fish was roughly $11 per trip (in 2007 dollars).
THESE ECONOMIC LOSSES ARE NOT RESTRICTED TO THE TIDAL REGIONS OF THE BAY WATERSHED
According to the Pennsylvania Fish and Boat Commission (PFBC), nearly two million people go fishing in Pennsylvania each year, contributing over $1.6 billion to the economy. Among the most popular fish for anglers are warm-water species, especially smallmouth bass, and coldwater species, especially na-tive brook trout. On January 1, 2012, PFBC enacted a mandate for total catch-and-release of smallmouth bass in certain areas of the Susquehanna River and bans it completely between May 1 and June 15 in parts of the river because of population declines associated with water-quality problems. Degraded stream habitat has restricted the Pennsylvania brook trout to a small fraction of its historical distribution.
Virginia, and to a lesser extent Maryland, also support significant freshwater recreational fisheries, with roughly one million anglers participating and con-tributing millions to local economies.40 By way of example, a fish kill in the Shenandoah River watershed in 2005—likely caused in part by poor water qual-ity—resulted in roughly a $700,000 loss in retail sales and revenues.41
The rockfish, or striped bass, is the most popular
commercial and recreational finfish in the Bay.
Emm
y Ni
cklin
/CBF
Sta
ff

The Economic Argument for Cleaning Up the Chesapeake Bay and its Rivers
CHESAPEAKE BAY FOUNDATION, MAY 2012 cbf.org/economicreport
11
Near the Susquehanna River in Middletown, Pennsylvania, a handmade sign hangs on a small, vinyl-sided home, reading: “Clouser’s Fly Shop.”
Inside, Bob Clouser grips a fish hook and delicately ties thread through tiny black eyes and a golden tail. It’s one of his famous Clouser Minnows, crafted by hand with animal hair.
Clouser makes a living selling flies to fishermen around the world. But he no longer works as a fishing guide in the Susquehanna River because of repeated fish kills that scientists suspect may be linked to water pollution.
“When I was a kid, the water sparkled, clear,” Clouser recalled as he assembled flies at a brightly lit desk lined with spools of colored thread. “There were layers and layers of blue damselflies across that river, dancing all day long. Today, the water has a still, dead look, and you can’t even see in six inches of water.”
His fishing guide business closed because of fish kills that devastated the river in 2005, 2007, 2008, and 2012. Scientists believe that baby bass in the Susquehanna River have lost their resistances to disease and they are investigating possible links to pollutants, ac-cording to Geoffrey Smith, a biologist with the Pennsylvania Fish and Boat Commission (PFBC). With little resistance to disease, bacteria in the water that are normally harmless are killing the fish.
The commission is banning fishing for smallmouth in much of the Susquehanna from May 1 to June 15, 2012, to help the fish recover.
The end of Clouser’s career as a fishing guide and the banning of smallmouth bass fish-ing are examples of the economic damage that can be caused by poor water quality. They also illustrate why federal and state funding and support of the clean water blueprint for the Chesapeake Bay and its rivers streams are critical for the repair of the region’s economic engine.
Bob Clouser (above) is a legend among makers of
fishing flies. But he no longer works as a guide on
the Susquehanna River because of fish kills.
Pollution and Disease Threaten Pennsylvania's Fishing Industry

The Economic Argument for Cleaning Up the Chesapeake Bay and its Rivers
CHESAPEAKE BAY FOUNDATION, MAY 2012 cbf.org/economicreport
12
Nearly two million people a year go fishing in Pennsyl-vania, contributing over $1.6 billion to the economy. But water pollution has restricted fishing in many streams. And since 1990, the number of fishing licenses sold in the state has dropped by 31 percent, from 1,163,758 in 1990 to 806,159 in 2011, state figures show.
Freshwater recreational fishing is also popular in Mary-land and Virginia, with about one million anglers in these states contributing millions of dollars to local economies, according to the U.S. Fish and Wildlife Service. If commercial fishing is taken into account, the seafood industry contributes about $2 billion in sales annually and more than 41,000 jobs to the regional economy, the National Oceanic and Atmospheric Ad-ministration (NOAA) reports.
Although nobody knows for sure what is killing the fish in the Susquehanna, Clouser knows one thing. The river he inherited from his father—the cascading ribbon, full of life, which flows from the forests of upstate New York to the Chesapeake Bay—will not be there for his children or grandchildren unless we reduce pollution.
“We need to get the Susquehanna River cleaned up and the Chesapeake Bay cleaned up,” Clouser said. “Every one of my kids loved fishing. But today, I have no grandchil-dren who like to fish. They are bored because they can catch no fish."
Nearly two million people a year go fishing in Pennsylvania.
“When I was a kid, the water sparkled, clear...Today, the water has a still, dead look, and you can’t even see in six inches of water.”Bob Clouser, Owner of Clouser’s Fly Shop
Photoxpress

The Economic Argument for Cleaning Up the Chesapeake Bay and its Rivers
CHESAPEAKE BAY FOUNDATION, MAY 2012 cbf.org/economicreport
13
A 2001 study compared the 1996 water quality of the Bay with what it would have been without the Clean Water Act. Results indicated that benefits of water-quality im-provements to annual recreational boating, fishing, and swimming ranged from $357.9 million to $1.8 billion.42 Fisheries declines since the 1990s indicate that early prog-ress reducing pollution hasn’t been sustained. We must reverse this trend. If pollution to the Bay is left unabated, we will see continued decline of the region’s fisheries and the resulting economic impacts.
POLLUTED WATERS ALSO HURT PUBLIC HEALTH AND LOCAL ECONOMIES
Unhealthy waters increase public health burdens associated with consuming tainted fish or shellfish and exposure to waterborne infectious disease while rec-reating. One study estimated the cost associated with exposure to polluted recre-ational marine waters to be $37 per gastrointestinal illness, $38 per ear ailment, and $27 per eye ailment due to lost wages and medical care.43
Furthermore, although closing a beach is meant to prevent illness, it directly and indirectly results in an economic loss for local businesses and the county where the beach is located. A National Oceanic and Atmospheric Administra-tion (NOAA) study indicated that a one-day beach closure in Huntington Beach, California, was expected to result in thousands of dollars of lost income for lo-cal communities.44 There are hundreds of beach closures in the Bay region each year,45 potentially resulting in hundreds of thousands of dollars of lost income for local economies.
NATURE-BASED RECREATION—SUCH AS WILDLIFE WATCHING, ECOTOURISM, AND BOATING THAT ARE DEPENDENT ON CLEAN WATER—IS A VITAL ECONOMIC DRIVER FOR THE BAY REGION
Roughly eight million wildlife watchers spent $636 million, $960 million, and $1.4 billion in Maryland, Virginia, and Pennsylvania, respectively, in 2006 on trip-related expenses and equipment.46 These estimates do not include other economic benefits of these expenditures, such as job creation and the multiplier effect on local economies. Improvements to water quality through land preservation, reforestation, and wetlands restoration will increase and enhance wildlife populations. A study of the Great Lakes indicates there would be substantial improvement in wildlife-watching opportunities and associated economic benefits by improvements to wildlife habitat.47
Fishing in Pennsylvania con-tributes over $1.6 billion to the economy.
© 2010 Neil Ever Osbourne/iLCP
The Economic Argument for Cleaning Up the Chesapeake Bay and its Rivers
CHESAPEAKE BAY FOUNDATION, MAY 2012 cbf.org/economicreport
14
PROPERTY VALUESAn EPA study indicated that clean water can increase the value of single family homes up to 4,000 feet from the shoreline by up to 25 percent.
Recreational boating is also a strong economic driver in Maryland, Pennsylvania, and Virginia. The total impact on the Maryland economy from recreational boat-ing is estimated to be about $2.03 billion and 35,025 jobs annually.48 Similarly, Pennsylvania residents spend $1.7 billion on boating annually. The average ex-penditure per recreational boater each year is $274. Of this amount, roughly $113 is spent in direct boating-related expenses and $161 is spent on trip-related expenses, including: auto fuel, meals, lodging, and admission/entrance fees.49
A recent study in Hampton, Virginia, found that resident and non-resident boaters were responsible for $55 million in economic benefit annually rep-resenting $32.5 million in new value added, $22.5 million in incomes, and 698 jobs.50 The majority of expenditures were spent by out-of-region boat-ing visitors, so they represent an inflow of “new” capital to the community. The study also indicated that “water quality, fishing quality, and other environ-mental factors” ranked among the most important influences on a boater’s deci-sion of where to keep his or her boat.
CLEAN WATERWAYS INCREASE PROPERTY VALUES
A U.S. Environmental Protection Agency (EPA) study indicated that clean wa-ter can increase the value of single family homes up to 4,000 feet from the
water’s edge by up to 25 percent.51 A 2000 study concluded that improvements in water quality along Maryland’s western shore to levels that meet state bacteria standards could raise property values six per-cent.52 A study conducted on home sales in St. Mary’s County, Maryland, between 1999 and 2003 indicated that property values increased with decreases in ni-trogen concentrations and suspended sediments in
nearby waterways.53 Homes situated near seven California stream restoration projects had three to 13 percent higher property values than similar homes located on damaged streams.54 A study by the Brookings Institute projected a 10 percent increase in property values for homes that would abut a proposed $26 billion Great Lakes restoration project.55 The City of Philadelphia esti-mates that installation of green stormwater infrastructure in the city will raise property values two to five percent, generating $390 million over the next 40 years in increased values for homes near green spaces.56
POLLUTION REDUCTIONS LOWER DRINKING WATER AND OTHER UTILITY COSTS
Reducing pollution inputs from pipes and land-based sources can reduce locality costs to treat drinking water sources to safe standards. New York City’s expendi-

The Economic Argument for Cleaning Up the Chesapeake Bay and its Rivers
CHESAPEAKE BAY FOUNDATION, MAY 2012 cbf.org/economicreport
15
MARYLAND
Virginia cattle farmers Dan and Quentin King (top photo, left and right) are implement-ing practices to reduce pollu-
tion from their farm.
Wayne Mitchell (bottom) is one of 10 workers helping
to improve the farm.
Feeding cattle can be a muddy business on the rolling hillsides of Virginia’s Shenan-doah Valley.
On Dan King’s farm north of Harrisonburg, 180 cows rip up the grass as they cluster around feeders holding hay. Rain washes the loose dirt, mixed with manure, downhill into a pond. During large storms, the pond sometimes overflows into a stream bed that flows toward the Shenandoah River and eventually the Chesapeake Bay.
When the cows drink, they wade into the pond, creating a potential health threat for their nursing calves, said King, a 54-year-old farmer who runs a 500-acre beef and poul-try operation with his son Quentin.
“If the cattle stomp in there and get their udders covered with mud and animal waste, they can get a disease called mastitis,” an infection of the udders, King explained.
King is tackling the problem with a series of projects that will reduce erosion and runoff pollution, improving water quality and the efficiency of his business, the health of his animals—and the health of the Chesapeake Bay.
He is constructing four open barn-like buildings in which his cattle will be fed on concrete pads before they return to the hillsides to graze. Nearby, he is also building manure storage facilities to contain runoff until it can be spread on fields as fertilizer.
Builders are also installing more than a half-mile of fences to keep his cows out of the pond. Four automatic water-dispensing devices in the fields provide an alternative clean water supply for the cattle, so they don’t have to wade into the pond to drink.
“The farm was an environmental nightmare when we bought it,” King said. “We have been able to do a lot of things to reduce runoff on the farm. Our goal is to stabilize the soil, and keep it here on the farm, to prevent it from being a part of the ‘chocolate milk’ of silt that runs into the Bay during storms.”
Reducing Pollution from Farms Benefits Local Economy

The Economic Argument for Cleaning Up the Chesapeake Bay and its Rivers
CHESAPEAKE BAY FOUNDATION, MAY 2012 cbf.org/economicreport
16
“My job is dependent on clean water. It’s a good business to be in because you are accomplishing something so much more than a paycheck.”David Bogue, Sales Manager for Fiberweb
Farmer Quentin King demonstrates a new cattle watering device installed recently so that his animals don’t have to drink out of a muddy pond.
The $300,000 in improvements on King’s farm will save him and his son labor and time by making it easier to feed the livestock. Keeping the cattle out of the ponds will likely also reduce veterinary bills.
About 70 percent of the project is being funded through a federal program run by the Natural Resources Conser-vation Service. The rest King is paying for through a low-interest loan.
The project is providing a lift to the local economy, because it requires the hiring of 10 workers, including construction workers, an excavator, and fence builders.
“These farm projects have really helped me out a lot in a down time,” said Wayne Mitchell, owner of D & D Ex-cavating, which performed grading work for King’s new buildings. “Other construction work has been very slow. But this has kept me working.”
King purchased the cattle watering devices and plumbing from the May Supply Com-pany of Harrisonburg, Virginia. Sales Manager, Mike Heatwole, said his company sold 350 similar fountains in Virginia last year, about 65 percent of them for farm runoff- control projects.
“These farm conservation programs drive a large portion of our sales, and have definitely helped to keep us afloat,” Heatwole said. “This part of our business has gone up, while housing construction went down.”
A 2010 study by the University of Virginia concluded that the equivalent of 11,751 tem-porary jobs lasting one year each would be created if the state and federal governments invested $804 million in farm conservation projects like the one on King’s farm.
Projects that reduce farm runoff to implement the clean water blueprint for the Chesa-peake Bay and its rivers and streams are producing a chain reaction through the economy.
Conservation Services Inc., of Verona, Virginia, plants trees along streams and takes other steps to reduce runoff. Jeff Brower, Vice President of the firm, said the company has grown from two employees to seven—and is now looking to hire an eighth.
“We are not just planting trees—we are buying all the products that we need for (runoff-control projects),” Brower said. “For example, we buy 300,000 oak stakes a year from saw mills in Pennsylvania and Virginia. We buy 300,000 plastic tubes a year to protect the saplings we plant from deer and other animals.”
The company he buys these tree-sheltering tubes from is Fiberweb of Old Hickory, Tennessee. “The bulk of our business goes toward reducing agricultural runoff,” said David Bogue, Sales Manager for Fiberweb. “My job is dependent on clean water. It’s a good business to be in, because you are accomplishing something so much more than a paycheck.”

The Economic Argument for Cleaning Up the Chesapeake Bay and its Rivers
CHESAPEAKE BAY FOUNDATION, MAY 2012 cbf.org/economicreport
17
ture of $1 billion over the last decade to protect the watersheds north of the city that supply its drinking water avoided the need to build a $6 billion treatment plant.57 An EPA study of drinking water source protection efforts concluded that every $1 spent on source-water protection saved an average of $27 in water treat-ment costs.58 Similarly, a study by the Brookings Institute suggested that a one percent decrease in sediment loading will lead to a 0.05 percent reduction in water-treatment costs.59
Proactive efforts to lessen stormwater flows today reduce future public costs needed to maintain navigation channels, remediate pollution and hazard flooding, and repair infrastructure and property damage caused by excessive runoff. Philadelphia estimates that after 40 years, their installation of green infrastructure will create more than $2 in benefits for every dollar invested, generating $500 million in economic benefits, $1.3 billion in social benefits, and $400 million in environmental benefits.60
CONCLUSION
2012 is the moment in time for the Chesapeake Bay. With a clean-water blue-print for the Chesapeake Bay and its rivers and streams in place and the states working hard to refine and implement their plans to achieve specific pollution-reduction targets, restoration is in sight.
Saving the Bay and restoring clean water will not just benefit us; it will benefit our children, future generations, and iconic Bay wildlife. Investing in the Chesapeake will pay tremendous economic returns too. Conversely, if we do not keep making progress, we will continue to have polluted water, human health hazards, and lost jobs—at a huge cost to society.
Efforts to delay implementation of the clean water blueprint for the Chesapeake Bay and its rivers and streams, therefore, will only exacerbate the economic im-pacts this region has already experienced due to poor water quality.
UTILITY COSTSAn EPA study of drinking water source protection efforts oncluded that every $1 spent on source-water protection saved an average of $27 in water treatment costs.
$27$1SAVINGS
The Economic Argument for Cleaning Up the Chesapeake Bay and its Rivers
CHESAPEAKE BAY FOUNDATION, MAY 2012 cbf.org/economicreport
18
END NOTES 1 Chesapeake Bay Restoration Act of 2000, Nov. 7, 2000, P.L. 106-457, Title II, § 202, 114 Stat.
1967.
2 Maryland Department of Economic and Employment Development. 1989. Economic Impor-tance of the Chesapeake Bay.
3 2004 Chesapeake Bay Watershed Blue Ribbon Economic Panel Report, “Saving a National Treasure: Financing the Cleanup of the Chesapeake Bay,” p. 9.
4 World Resources Institute, WRI Factsheet: For EPA Regulations, Cost Predictions are Over-stated, November 2010.
5 Krop, R.A., C. Hernick, and C. Frantz. 2008. Local Government Investment in Water and Sewer Infrastructure: Adding Value to the National Economy. The U.S. Conference of Mayors, Mayors Water Council.
6 Green For All. 2011. Water Works: Rebuilding Infrastructure, Creating Jobs, Greening the Environment. http://greenforall.org.s3.amazonaws.com/pdf/Water-Works.pdf.
7 Letter from Nancy Mayor, President of Mayer Bros., Inc., to Senator James DeGrange, Chair of Public Safety, Transportation, and Environment Committee, February 12, 2010.
8 Testimony by Carter B. McCarry, Chief Operation Officer, Environmental Quarterly Resources, LLC to the Senate Budget and Taxation Committee S.B. 141/H.B. 151, Maryland General As-sembly 2010.
9 Rephann, T. J. 2010. Economic Impacts of Implementing Agricultural Best Management Practices to Achieve Goals Outlined in Virginia’s Tributary Strategy. Weldon Cooper Center for Public Service, University of Virginia. www.coopercenter.org/sites/default/files/publications/BMP_ paper_final.pdf.
10 National Oceanic and Atmospheric Administration. 2009 Fisheries Economics of the U.S. www.st.nmfs.noaa.gov/st5/publication/fisheries_economics_2009.html.
11 Ibid.
12 Lellis-Dibble, K.A., K.E. McGlynn, and T.E. Bigford. 2008. Estuarine Fish and Shellfish Species in U.S. Commercial and Recreational Fisheries: Economic value as an incentive to protect and restore estuarine habitat. NOAA Technical Memorandum. http://spo.nwr.noaa.gov/tm/TM90.pdf.
13 Same as #10.
14 Same as #10.
15 www.st.nmfs.noaa.gov/st1/commercial/landings/annual_landings.html.
16 Ibid.
17 Southwick Associates. 2005. The Economics of Recreational and Commercial Striped Bass Fishing. www.southwickassociates.com/freereports/default.aspx.
18 Kirkley, et al. 2005. Economic Contributions of Virginia’s Commercial Seafood and Recreational Fishing Industries: A User’s Manual for Assessing Economic Impacts. Virginia Institute of Marine Science Report No. 2005-9.
19 Same as #10.

The Economic Argument for Cleaning Up the Chesapeake Bay and its Rivers
CHESAPEAKE BAY FOUNDATION, MAY 2012 cbf.org/economicreport
19
20 Telephone interview on May 17, 2010, with Dr. Douglas Lipton, Associate Professor of Resource Economics at the University of Maryland, College Park.
21 Tom Horton. 2003. Turning the Tide: Saving the Chesapeake Bay. Second Edition. Island Press. Washington, D.C. 2003.
22 Chesapeake Bay Program. 2012. www.chesapeakebay.net/indicators/indicator/blue_crab_abundance_adults.
23 Unpublished data. Dr. James Kirkley, Virginia Institute of Marine Science.
24 www.nefsc.noaa.gov/press_release/2009/MediaAdv/MA0906/.
25 www.dnr.state.md.us/fisheries/news/story.asp?story_id=237.
26 www.chesapeakebay.net/status_dissolvedoxygen.aspx?menuitem=19647.
27 Diaz, R.J. and R. Rosenberg. 2008. “Spreading Dead Zones and Consequences for Marine Eco-systems.” Science. Vol. 321.
28 Mistiaen, J.A., I.E. Strand, and D. Lipton. 2003. “Effects of environmental stress on blue crab (Callinectes sapidus) harvest in Chesapeake Bay tributaries.” Estuaries. Vol. 26:316-322.
29 www.chesapeakebay.net/crabs.aspx?menuitem=14700.
30 www.mdsg.umd.edu/issues/chesapeake/blue_crabs/about/.
31 U.S. Army Corps of Engineers. 2008. Oyster Environmental Impact Statement. http://www.nao.usace.army.mil/OysterEIS/FINAL_PEIS/homepage.asp.
32 Chesapeake Bay Foundation. 2010. On the Brink: Chesapeake’s Native Oysters. What it will take to bring them back.
33 R.S. Anderson. 1988. “Effects of tributyltin and hypoxia on the progression of Perkinsus mari-nus infections and host defense mechanisms in the oyster, Crassostrea virginica.” Journal of Fish Disease. Vol. 21:371-379.
34 Data from Departments of Health in Virginia and Maryland cited in #29.
35 Same as #31.
36 Atlantic States Marine Fisheries Commission. Striped Bass: Restoring a Legacy.
37 www.chesapeakebay.net/stripedbassharvest.aspx?menuitem=15316.
38 Lipton, D.W. and R. Hicks. 1999. “Boat Location Choice: The Role of Boating Quality and Excise Taxes.” Coastal Management 27(1):81-90.
39 Lipton, D.W. and R.Hicks. 2003. “The cost of stress: Low dissolved oxygen and recreational striped bass (Morone saxatilis) fishing in the Patuxent River.” Estuaries. 26(2a):310-315.
40 U.S. Department of the Interior, Fish and Wildlife Service, and U.S. Department of Commerce, U.S. Census Bureau. 2006 National Survey of Fishing, Hunting, and Wildlife-Associated Recreation.
41 Papadakis, M. 2006. The Economic Impact of the 2005 Shenandoah Fish Kill: A preliminary eco-nomic assessment. James Madison University. www.dep.state.va.us/export/sites/default/info/documents/fishkillReport-final.pdf.
42 Morgan, et al. 2001. “Benefits of water quality policies: the Chesapeake Bay.” Ecological Econom-ics. Vol. 39: 271-284.

The Economic Argument for Cleaning Up the Chesapeake Bay and its Rivers
CHESAPEAKE BAY FOUNDATION, MAY 2012 cbf.org/economicreport
20
43 R. H. Dwight, et al. 2005. “Estimating the economic burden from illnesses associated with recreational coastal water pollution—a case study in Orange County, California.” Journal of Environmental Management. Vol:95 103.
44 http://stateofthecoast.noaa.gov/coastal_economy/beacheconomics.html.
45 Natural Resource Defense Council. 2010. Testing the Waters: A guide to water quality at vaca-tion beaches. www.nrdc.org/water/oceans/ttw/ttw2010.pdf.
46 Same as #40.
47 Austin, J.C. et al. 2007. America’s North Coast: A Benefit-Cost Analysis of a Program to Protect and Restore the Great Lakes. Brookings Institute, Great Lakes Economic Initiative.
48 Lipton, D. 2007. Economic Impact of Maryland Boating in 2007. University of Maryland Sea Grant Program.
49 www.fish.state.pa.us/promo/funding/fact_economic_impact.htm.
50 Virginia Institute of Marine Science. 2009. Assessment of the Economic Impacts of Recreational Boating in the City of Hampton. http://web.vims.edu/adv/econ/MRR2009_2.pdf.
51 U.S. Environmental Protection Agency. 1973. Benefit of Water Pollution Control on Prop-erty Values. EPA-600/5-73-005. http://yosemite.epa.gov/ee/epa/eermfile.nsf/vwAN/EE0009.pdf/$file/EE0009.pdf.
52 C. G. Leggett, et al. 2000. “Evidence of the effects of water quality on residential land prices.” Journal of Environmental Economics and Management. Vol. 39:121–144.
53 Poor, J.P. et al. 2007. “Exploring the hedonic value of ambient water quality: A local watershed based study.” Ecological Economics. Vol. 60: 797–806.
54 Streiner, C. et al. 1996. Estimating the Benefits of Urban Stream Restoration Using the Hedonic Price Method—a thesis in partial fulfillment of the requirements for the Degree of Master of Science. Depart-ment of Agriculture and Resource Economics. CSU.
55 Same as #47.
56 Philadelphia Water Department. 2009. Green City, Clean Waters: The City of Philadelphia’s Program for Combined Sewer Overflow Control—A Long Term Control Plan Update. Summary Report. www.phillywatersheds.org/ltcpu/LTCPU_Summary_LoRes.pdf.
57 DePalma, A. 2006. “New York’s Water Supply May Need Filtering.” New York Times. June 20, 2006. www.nytimes.com/2006/07/20/nyregion/20water.html?_r=1&hp&ex=1153454400&en=2be183debc88eae7&ei=5094&partner=homepage&oref=slogin.
58 U.S. Environmental Protection Agency. Economics and Source Water Protection. Presentation by Eric Winiecki.
59 Same as #47.
60 Same as #56.

The Economic Argument for Cleaning Up the Chesapeake Bay and its Rivers
CHESAPEAKE BAY FOUNDATION, MAY 2012 cbf.org/economicreport
21
HOW THIS REPORT WAS COMPILEDChesapeake Bay Foundation scientists reviewed and integrated information from pub-lished studies and reports. CBF Senior Writer and Investigative Reporter Tom Pelton wrote the spotlights based on data he received from state and federal environmental agencies; reviewed published studies and reports; and interviewed economics experts, as well as business owners and workers.

MarylandPhilip Merrill Environmental Center6 Herndon AvenueAnnapolis, MD 21403410/268-8816410/269-0481 (from Baltimore metro)301/261-2350 (from D.C. metro)
PennsylvaniaThe Old Water Works Building614 North Front Street, Suite GHarrisburg, PA 17101717/234-5550
VirginiaCapitol Place1108 East Main Street, Suite 1600Richmond, VA 23219804/780-1392
District of Columbia725 8th Street, SEWashington, DC 20003202/544-2232
Web site: cbf.orgE-mail: [email protected] information: 888/SAVEBAY
CHESAPEAKE BAY WATERSHED
The Chesapeake Bay’s 64,000-square-milewatershed covers parts of six states and ishome to more than 17 million people.
October 2008
May 2012
MarylandPhilip Merrill Environmental Center6 Herndon AvenueAnnapolis, MD 21403410/268-8816410/269-0481 (from Baltimore metro)301/261-2350 (from D.C. metro)
PennsylvaniaThe Old Water Works Building614 North Front Street, Suite GHarrisburg, PA 17101717/234-5550
VirginiaCapitol Place1108 East Main Street, Suite 1600Richmond, VA 23219804/780-1392
Hampton Roads142 West York Street, Suite 618Norfolk, VA 23510757/622-1964
Washington, D.C.725 8th Street, SEWashington, DC 20003202/544-2232
All photos taken by Tom Pelton/CBF Staff, unless otherwise noted.Graphics by Jill BeVier Allen/CBF Staff.