Embed Size (px)
Citation preview
The effects of patent and paperevaluation indicators on the nationaltechnology level:The case of smartservices and information protection
Jong-Hak Oh1, Sangbok Lee2 and Jung-Wan Hong3∗
1Dept. of Knowledge Service & Consulting,Hansung University,Korea
2 3∗Dept.of Industrial & Management Engineering,Hansung University,Korea
Abstract
It is important job of every government to inject theproper amount of research and development investment re-garding the economical situation and develop strategies toenhance the efficiency of the budget. However, in invest-ing such budget, there is a lack of concrete measures andobjective grounds that allows each country’s characteristicto assess and reflect. Therefore, in terms of smart servicesand information security technologies, this paper will firstexamine whether the four objective evaluation indicators(patent activity, patent citation, paper activity, and papercitation), which are based on patents and statistics fromacademic literature, have a significant effect on the tech-nology level that is based on the subjective answers of ex-perts. The paper then aims to suggest a practical modelfor evaluating a level of technology based on patent andpaper evaluation indicators, which has a significant effecton the technology level in the Delphi Survey. many coun-tries’ technology level is greatly influenced by patent andpaper citations, that is, the product of R&D, which is re-lated to the quality of patents and papers. In addition, it
International Journal of Pure and Applied MathematicsVolume 118 No. 24 2018ISSN: 1314-3395 (on-line version)url: http://www.acadpubl.eu/hub/Special Issue http://www.acadpubl.eu/hub/
was found that Delphi Survey’s values given by experts dohave a significant effect on the number of patent applica-tions, patent citations, and paper citations, but does notpresent any significant effect on the number of papers. It isbelieved that this is because the exclusive rights to a patenthave a greater direct effect on the market than those of apaper. In other words, a patent application is the ultimateconsequence of the products of a technology to exercise ex-clusive rights in the market. Therefore, all technologies areracing against time for patent applications and filings to se-cure exclusive rights and win the upper hand. Due to suchactivities, patents cause a greater effect on the Delphi Sur-vey’s values compared to papers. It is expected that futureresearch will develop a more holistic model of the technologylevel evaluation of each country that integrates patent andpaper indicators through a further comparative analysis ofa variety of industries.
Key Words : Patent Evaluation Indicator, Paper Com-petitiveness, Technological Level, Paper Indicator, Informa-tion Protection, Smart Service.
1 INTRODUCTION
Developed countries are establishing and executing investment strate-gies for research and development in order to enhance the efficiencyand effectiveness of their massive investments into smart servicesand information security.
To this end, it is essential to evaluate the technology level ofcountries in terms of smart services and information protectiontechnologies. In order to evaluate countries’ technology level, itis necessary to overcome the limits of the survey method which isdependent on the subjective opinions of experts. Accordingly, thereis a growing demand for measurement methods and evaluation ofthe national technology level through patents and paper indicators,which are the result of R&D (Ueno H et al., 2005), (Anastasi G etal., 2005), (Busic A and Fourneau J M, 2002).
This paper will calculate patents and the values of the paperevaluation index for each country using the statistics on smart ser-vices and information protection technologies. By doing so,the aim
International Journal of Pure and Applied Mathematics Special Issue
of the paper is to examine whether the patents and paper eval-uation indicators have a significant effect on the Delphi Survey’stechnology level.
This paper is organized as follows. Section 2 presents thelitera-ture reviewonthe technology level evaluation model, patent evalua-tion indicators, paper evaluation indicators,and technological levels.Section 3 demonstrates a research model which examines the signif-icance of the relationship between patent and paper evaluation indi-cators and Delphi Survey’s technology level. The empirical analysisis described in Section 4 to determine the effect of the patent andpaper evaluation indicators on the Delphi Survey’s technology level.The conclusions are given in Section 5.
2 THEORETICAL BACKGROUND
2.1 Technology Level Evaluation (TLE)
Since the country’s competitiveness in the future depends on sci-entific technology, many indicators have been widely researched tomeasure changes in scientific technology capabilities over decades.As a result, the indicators have also been used to predict nationaltechnological level, assess market environments, and improve na-tional technological level (Porter A Let al., 2001).
However, thus far, no standardized technological level evalua-tion methods have been proposed. The existed methodologies in-clude expert interviews, surveys, and the Delphi method (Cho I Gand Park M C, 2015).
In such evaluations, technology level is defined as the ”measuredvalue of the performance of a specific technology at a specific pointin time” (Cho I G and Lee J M, 2014).
2.2 Patent Indexes
A patent index is a tool to analyze technological properties frommacro and micro perspectives. It explains the grounds that sup-port the national innovation system, tracks the level of knowledgedissemination between states, industries, technology fields, and en-terprises. Furthermore, it is used to measure research and develop-ment outcomes, as well as the structure and development level of
International Journal of Pure and Applied Mathematics Special Issue
specific technologies and industries; ultimately, it can be the mostlogical tool to measure or evaluate technological outcomes (ErnstH, 2003).
A patent indicator is an index that measures the innovationaland technological values of a patent based on bibliographical datafound in the relevantdocuments, that is, the number of patent ap-plications and families, citations, triadic patents, and patents regis-tered in the US.Patent indexes were defined as a tool that measuresthe quality and properties of a patent (Schankerman and M. PakesA, 1996); it is possible to measure the various creditable data that apatent possesses by using the seindicators (Harhoff D et al., 2003).
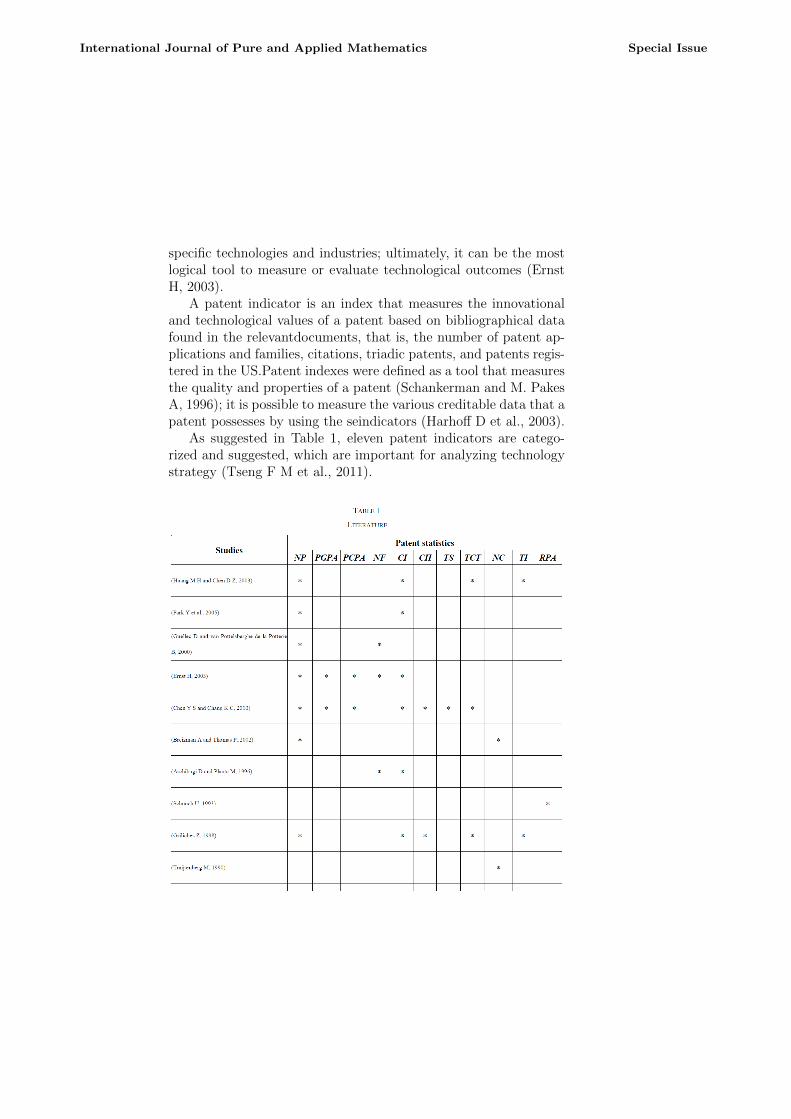
As suggested in Table 1, eleven patent indicators are catego-rized and suggested, which are important for analyzing technologystrategy (Tseng F M et al., 2011).
International Journal of Pure and Applied Mathematics Special Issue
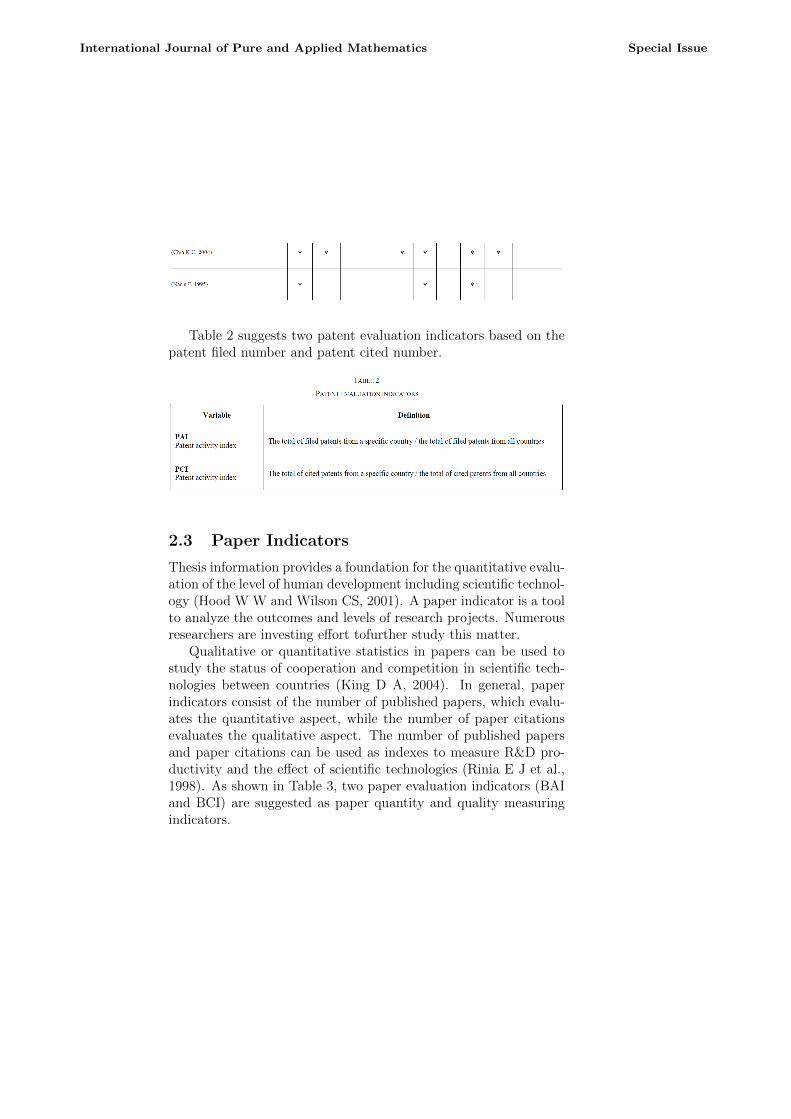
Table 2 suggests two patent evaluation indicators based on thepatent filed number and patent cited number.
2.3 Paper Indicators
Thesis information provides a foundation for the quantitative evalu-ation of the level of human development including scientific technol-ogy (Hood W W and Wilson CS, 2001). A paper indicator is a toolto analyze the outcomes and levels of research projects. Numerousresearchers are investing effort tofurther study this matter.
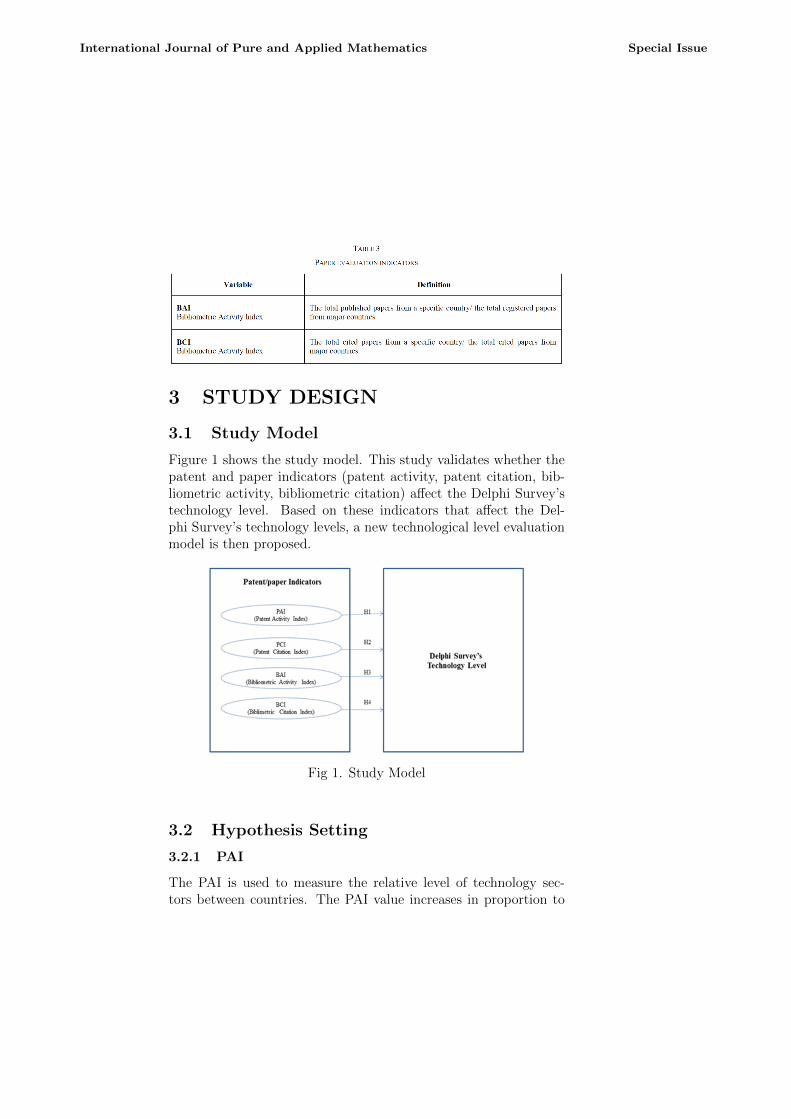
Qualitative or quantitative statistics in papers can be used tostudy the status of cooperation and competition in scientific tech-nologies between countries (King D A, 2004). In general, paperindicators consist of the number of published papers, which evalu-ates the quantitative aspect, while the number of paper citationsevaluates the qualitative aspect. The number of published papersand paper citations can be used as indexes to measure R&D pro-ductivity and the effect of scientific technologies (Rinia E J et al.,1998). As shown in Table 3, two paper evaluation indicators (BAIand BCI) are suggested as paper quantity and quality measuringindicators.
International Journal of Pure and Applied Mathematics Special Issue
3 STUDY DESIGN
3.1 Study Model
Figure 1 shows the study model. This study validates whether thepatent and paper indicators (patent activity, patent citation, bib-liometric activity, bibliometric citation) affect the Delphi Survey’stechnology level. Based on these indicators that affect the Del-phi Survey’s technology levels, a new technological level evaluationmodel is then proposed.
Fig 1. Study Model
3.2 Hypothesis Setting
3.2.1 PAI
The PAI is used to measure the relative level of technology sec-tors between countries. The PAI value increases in proportion to
International Journal of Pure and Applied Mathematics Special Issue
national R&D investment. Thus, the following hypothesis (H1) isformulated.
H1: PAI has a positive effect on Delphi Survey’s technologylevel.
3.2.2 PCI
The number of patent citations of a country on a specific technologyis positively influenced on the national technology level. Thus, thenext hypothesis (H2) is as follows.
H2: PCI has a positive effect on Delphi Survey’s technologylevel.
3.2.3 BAI
The BAI is used to measure the relative level of technology sectorsbetween countries. The BAI value increasesin proportion to R&Dinvestment, thereby resulting in more registered papers. As a result,the BAI is positively influenced on the national technology level.Thus, following hypothesis (H3) is formulated.
H3: BAI has a positive effect on Delphi Survey’s technologylevel.
3.2.4 BCI
The number of paper citations of a country on a specific technologyis positively influenced on the national technology level. Hence, theformulated hypothesis is as follows.
H4: BCI has a positive effect on Delphi Survey’s technologylevel.
3.3 Study Process
To validate the study model proposed herein, this study follows fourstages targeting smart services and information protection tech-nologies in the ICT sector. First, the technology tree of the smartservice and information protection are classified and the search key-words are indentified. Then, patent and paper data are gathered.Based on the collected patent and paper data, four indicators are
International Journal of Pure and Applied Mathematics Special Issue
calculated. Lastly, multiple regression analysis is performed to ana-lyze the effect of the patent and paper indicators on Delphi Survey’stechnology level.
4 EMPIRICAL ANALYSIS
4.1 Technology Tree
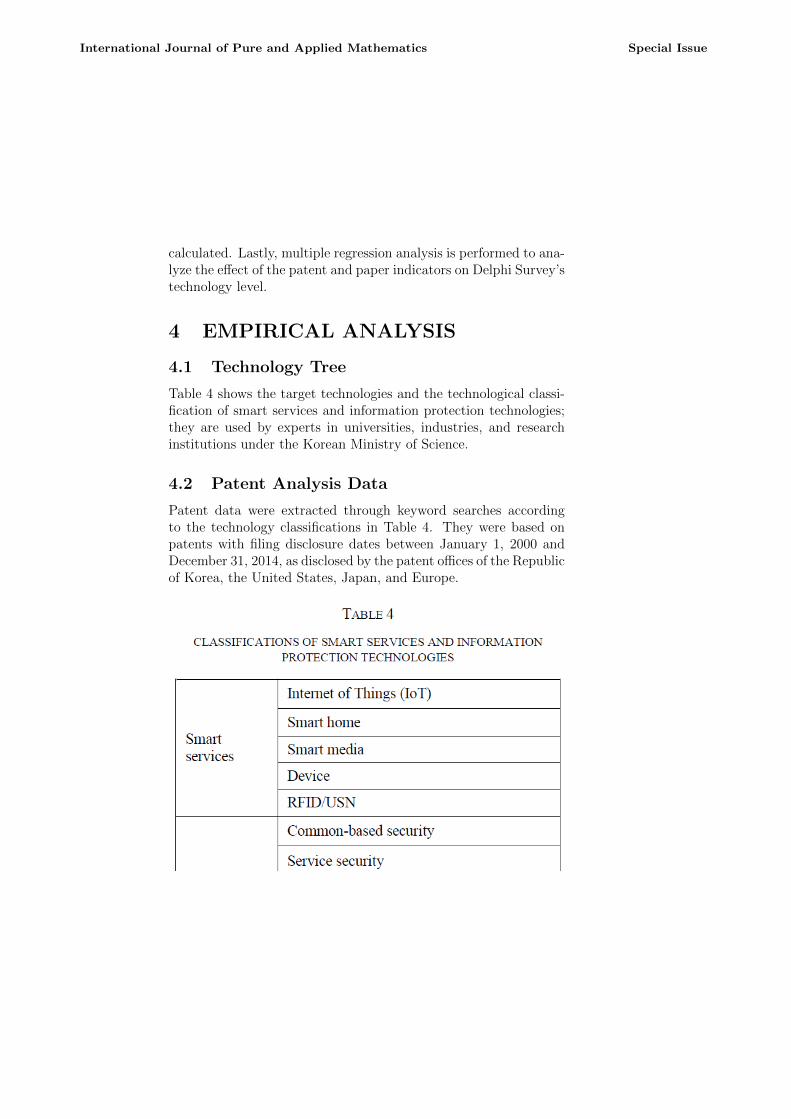
Table 4 shows the target technologies and the technological classi-fication of smart services and information protection technologies;they are used by experts in universities, industries, and researchinstitutions under the Korean Ministry of Science.
4.2 Patent Analysis Data
Patent data were extracted through keyword searches accordingto the technology classifications in Table 4. They were based onpatents with filing disclosure dates between January 1, 2000 andDecember 31, 2014, as disclosed by the patent offices of the Republicof Korea, the United States, Japan, and Europe.
International Journal of Pure and Applied Mathematics Special Issue
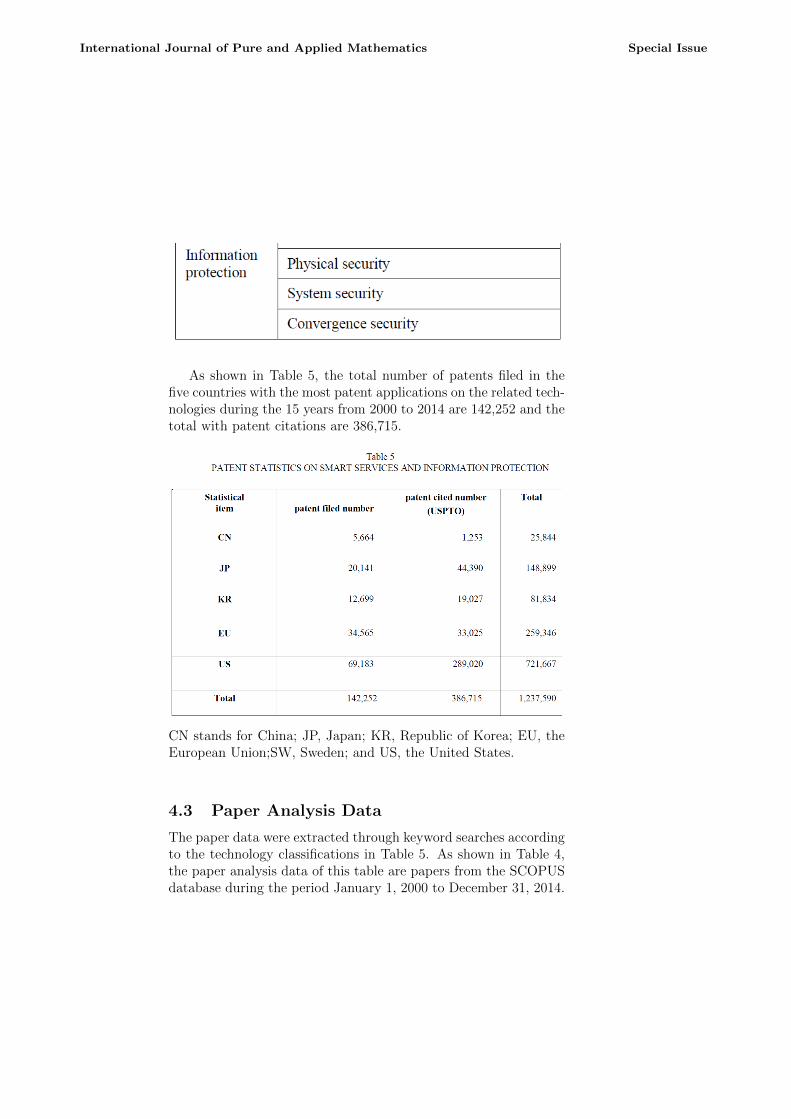
As shown in Table 5, the total number of patents filed in thefive countries with the most patent applications on the related tech-nologies during the 15 years from 2000 to 2014 are 142,252 and thetotal with patent citations are 386,715.
CN stands for China; JP, Japan; KR, Republic of Korea; EU, theEuropean Union;SW, Sweden; and US, the United States.
4.3 Paper Analysis Data
The paper data were extracted through keyword searches accordingto the technology classifications in Table 5. As shown in Table 4,the paper analysis data of this table are papers from the SCOPUSdatabase during the period January 1, 2000 to December 31, 2014.
International Journal of Pure and Applied Mathematics Special Issue
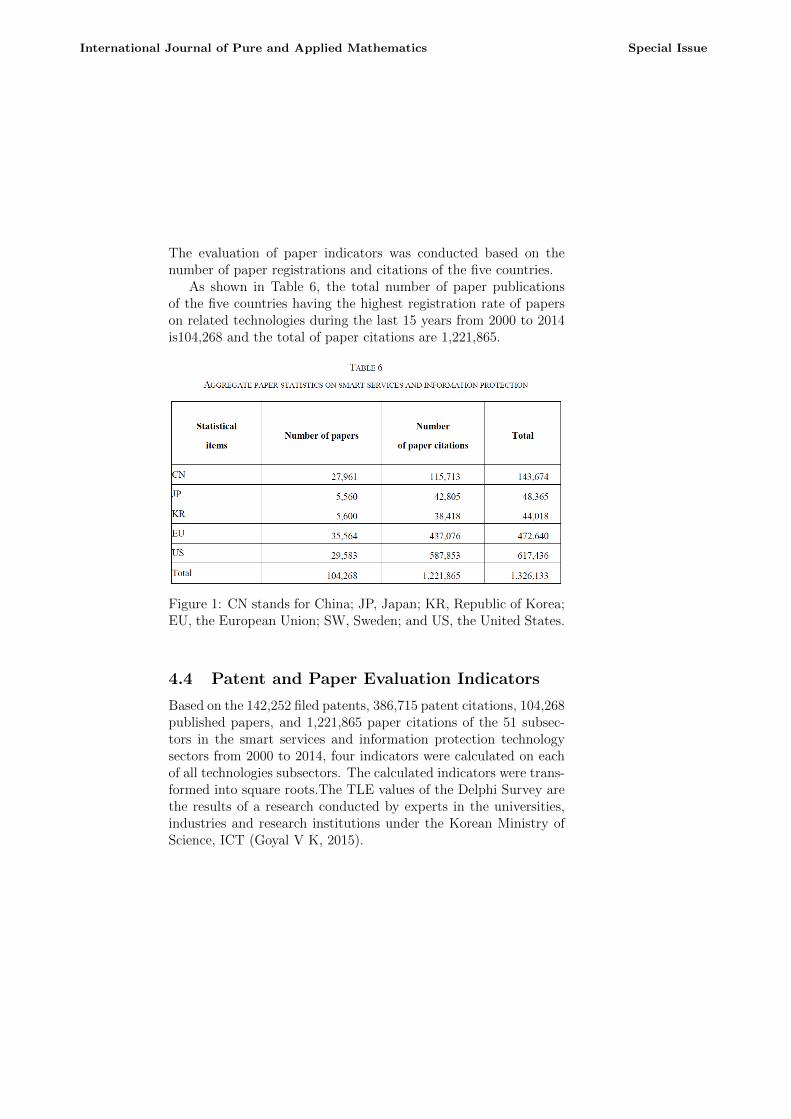
The evaluation of paper indicators was conducted based on thenumber of paper registrations and citations of the five countries.
As shown in Table 6, the total number of paper publicationsof the five countries having the highest registration rate of paperson related technologies during the last 15 years from 2000 to 2014is104,268 and the total of paper citations are 1,221,865.
Figure 1: CN stands for China; JP, Japan; KR, Republic of Korea;EU, the European Union; SW, Sweden; and US, the United States.
4.4 Patent and Paper Evaluation Indicators
Based on the 142,252 filed patents, 386,715 patent citations, 104,268published papers, and 1,221,865 paper citations of the 51 subsec-tors in the smart services and information protection technologysectors from 2000 to 2014, four indicators were calculated on eachof all technologies subsectors. The calculated indicators were trans-formed into square roots.The TLE values of the Delphi Survey arethe results of a research conducted by experts in the universities,industries and research institutions under the Korean Ministry ofScience, ICT (Goyal V K, 2015).
International Journal of Pure and Applied Mathematics Special Issue
4.5 Multiple Regression Analysis
Multiple regression analysis was performed to verify whether thevalues of the four patent and paper evaluation indicators (PAI,PCI, BAI,and BCI) of smart services and information protectionstechnologies have a significant effect on Delphi Survey’s TLE.
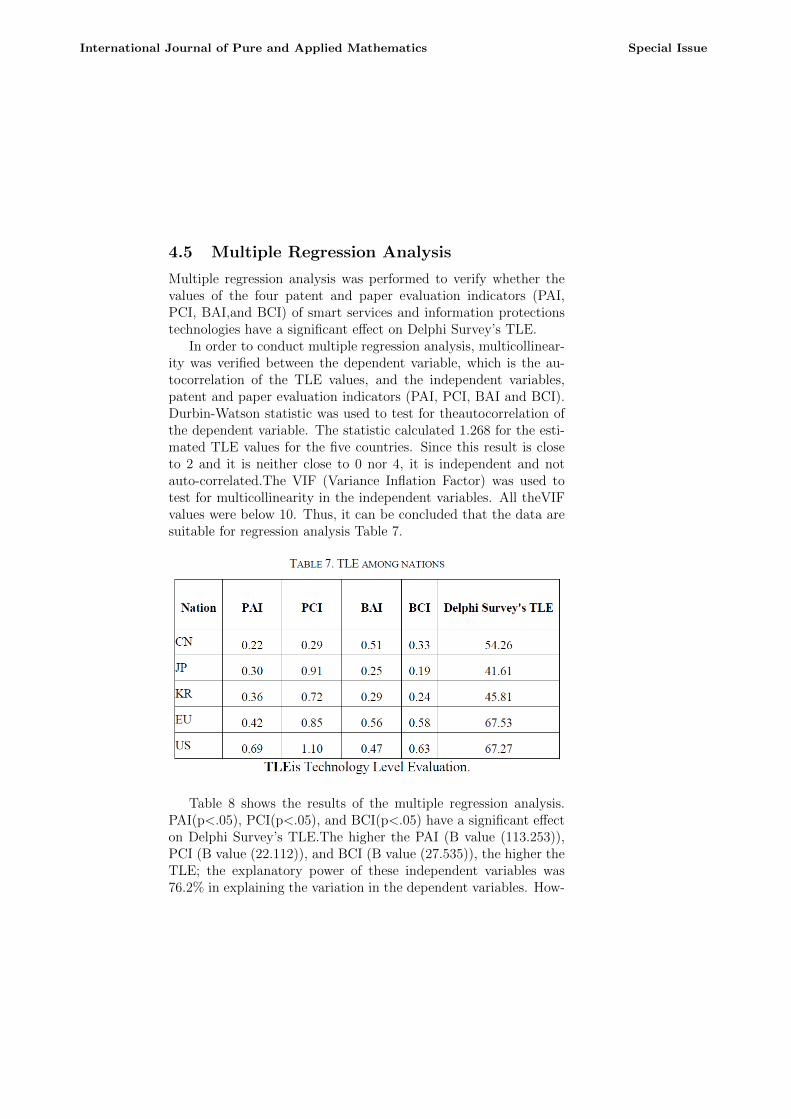
In order to conduct multiple regression analysis, multicollinear-ity was verified between the dependent variable, which is the au-tocorrelation of the TLE values, and the independent variables,patent and paper evaluation indicators (PAI, PCI, BAI and BCI).Durbin-Watson statistic was used to test for theautocorrelation ofthe dependent variable. The statistic calculated 1.268 for the esti-mated TLE values for the five countries. Since this result is closeto 2 and it is neither close to 0 nor 4, it is independent and notauto-correlated.The VIF (Variance Inflation Factor) was used totest for multicollinearity in the independent variables. All theVIFvalues were below 10. Thus, it can be concluded that the data aresuitable for regression analysis Table 7.
Table 8 shows the results of the multiple regression analysis.PAI(p<.05), PCI(p<.05), and BCI(p<.05) have a significant effecton Delphi Survey’s TLE.The higher the PAI (B value (113.253)),PCI (B value (22.112)), and BCI (B value (27.535)), the higher theTLE; the explanatory power of these independent variables was76.2% in explaining the variation in the dependent variables. How-
International Journal of Pure and Applied Mathematics Special Issue
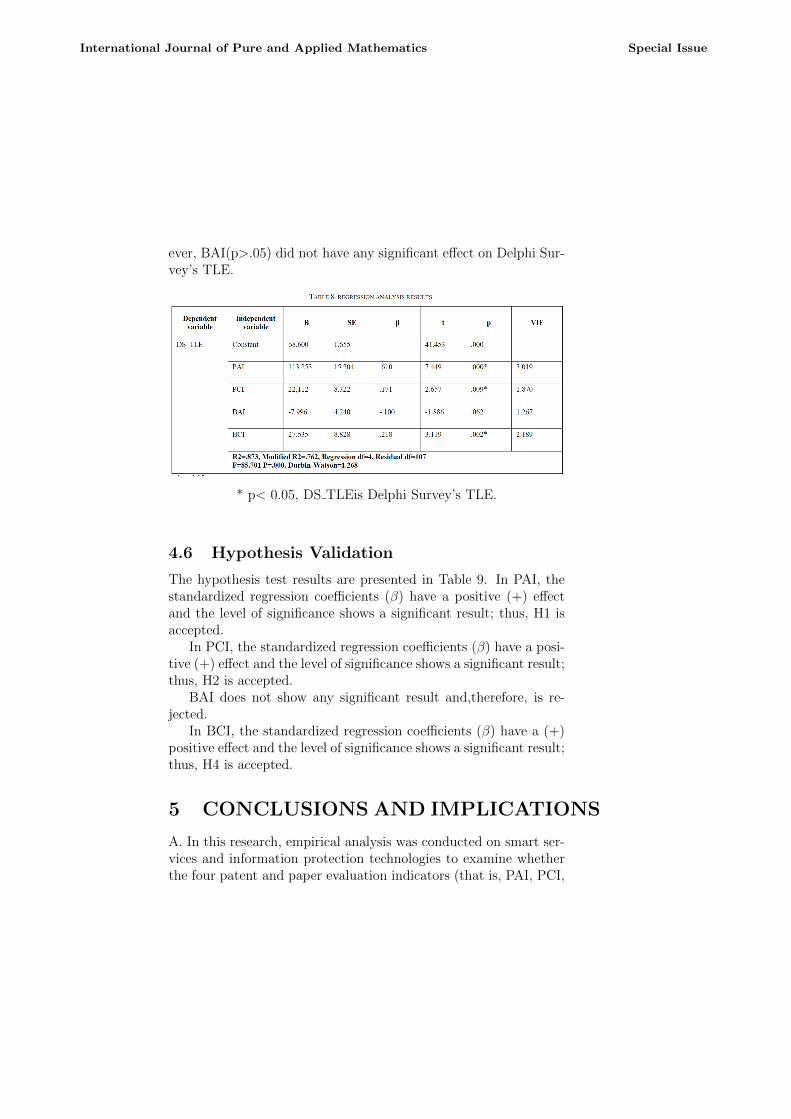
ever, BAI(p>.05) did not have any significant effect on Delphi Sur-vey’s TLE.
* p< 0.05, DS TLEis Delphi Survey’s TLE.
4.6 Hypothesis Validation
The hypothesis test results are presented in Table 9. In PAI, thestandardized regression coefficients (β) have a positive (+) effectand the level of significance shows a significant result; thus, H1 isaccepted.
In PCI, the standardized regression coefficients (β) have a posi-tive (+) effect and the level of significance shows a significant result;thus, H2 is accepted.
BAI does not show any significant result and,therefore, is re-jected.
In BCI, the standardized regression coefficients (β) have a (+)positive effect and the level of significance shows a significant result;thus, H4 is accepted.
5 CONCLUSIONS AND IMPLICATIONS
A. In this research, empirical analysis was conducted on smart ser-vices and information protection technologies to examine whetherthe four patent and paper evaluation indicators (that is, PAI, PCI,
International Journal of Pure and Applied Mathematics Special Issue
BAI and BCI) have a significant effect on Delphi Survey’s TLEvalues.
B. The results of the research are as follows. PAI, PCI, andBCI have a positive (+) effect on Delphi Survey’s TLE values. Incontrast, BAI does not have any significant effect.
The results of this paper show that many countries’ technologylevel is greatly influenced by patent and paper citations, that is,the product of R&D, which are related to the quality of patentsand papers.In addition, it was found that Delphi Survey’s TLE val-ues given by experts do have a significant effect on the numberof patent applications, patent citations, and paper citations, butdoes not present any significant effect on the number of papers.It is believedthat this is because the exclusive rights to a patenthave a greater direct effect on the market than those of a paper.In other words, a patent application is the ultimate consequence ofthe products of a technology to exercise exclusive rights in the mar-ket. Therefore, all technologies are racing against time for patentapplications and filings to secure exclusive rights and win the upperhand. Due to such activities, patents cause a greater effect on theDelphi Survey’s TLE values compared to papers.
Lastly, this research studied the effect of the relations betweenthe Delphi Survey’s TLE values given by experts and the quanti-tative four evaluation indicators of patents and papers. However,there still remains much room to study the effects that patent andpaper evaluation indicators have on a country’s technology level. Itis expected that future research will develop a more holistic modelof the technology level evaluation of each country that integratespatent and paper indicators through a further comparative analysisof a variety of industries.
6 ACKNOWLEDGMENT
This research was financially supported by Hansung University.
References
[1] Anastasi G, Borgia E, Conti M, Gregori E. IEEE 802.11b ad-hoc networks: performance measurements, Cluster Comput-
International Journal of Pure and Applied Mathematics Special Issue
ing, 2005, 8, pp. 135-45.
[2] Archibugi D, Planta M. Measuring technological changethrough patents and innovation surveys, Technovation, 1996,16(9), pp. 451-519.
[3] Breizman A, Thomas P. Using patent citation analysis to tar-get/value ma candidates, Res Technol Manag, 2002, 45(5), pp.28-36.
[4] Busic A, Fourneau J M. Monotonicity and performance evalu-ation: applicationss to high speed and mobile networks, ClusterComputing, 2002, 15, pp. 401-14.
[5] Chen Y S, Chang K C. The relationship between a firm’s patentquality and its market value-the case of US pharmaceutical in-dustry, Technological Forecasting Social Change, 2010, 77(1),pp. 20-33.
[6] Chia K C. Measuring the patent effectiveness in biotech-nology industry, National Central University, Tao-Yuan,2004,19(1),pp.519-28.
[7] Cho I G, Lee J M. Methodology analysis on national tech-nology level in the field of software through patent and biblio-metrics, Information Technology Application in Management,2014, 22(1), pp. 1-15.
[8] Cho I G, Park M C. Technological-level evaluation using patentstatics: model and application in mobile communication, Clus-ter Computing, 2015, 18, pp. 259-68.
[9] Ernst H. Patent information for strategic technology manage-ment, World Patent Information, 2003, 25(3), pp. 233-42.
[10] Goyal V K. Korea Institute for Information &CommunicationTechnology Promotion (IITP): Report on Science and technol-ogy level evaluation. 2015.
[11] Griliches Z. Patent statistics as economic indicators: a sur-vey,R&D and Productivity, The Econometric Evidence, Uni-versity of Chicago Press, Chicago, 1998, pp. 287-343.
International Journal of Pure and Applied Mathematics Special Issue
[12] Guellec D, van Pottelsberghe de la Potterie B. Applications,grants and the value of patent, Economics Letter, 2000, 69(1),pp. 109-14.
[13] Harhoff D, Scherer F M, Volpel K. Exploring the tail of thepatent value distribution, In : Grandstrand, O.(Ed), 2003, pp.279-310.
[14] Hood W W, Wilson CS. The literature of bibliometrics, scien-tometrics, and informetrics, Scientometrics, 2001, 52(2), pp.291-314.
[15] Huang M H, Chen D Z,Chang H W. National science and tech-nology competitiveness: an aspect from Patentometrics, BullLibr Assoc, China, 2003, 70, pp. 18-30.
[16] Jayavardhana G, Rajkumar B, Slaven M, Marimuthu P. In-ternet of things (IoT): a vision, architectural elements, andfuture directions, Future Generation Computer System, 2013,29, pp.1645-60.
[17] King D A. The scientific impact of nations. Nature. 2004 Jul,430, pp.311-316.
[18] Narin F. Patents as indicators for the evaluation of industrialresearch output, Scientometrics, 1995, 34(3), pp. 489-96.
[19] Park Y, Yoon B, Lee S. The idiosyncrasy and dynamismof technological innovation across industries: patent citationanalysis, Technology and Social, 2005, 27(4), pp. 471-85.
[20] Porter A L, Roessner J D,Jin X Y, Newman N C. Changes innational technological competitiveness, 1990, 1993, 1996 and1999 Technology Anal Strategy, 2001, 13(4), pp. 477-96.
[21] Rinia E J, Van Leeuwen T N, Van Vuren H G, Van RaanA F. Comparative analysis of a set of bibliometric indicatiorsand central peer review criteria : Evaluation of condensed mat-ter physics in the Netherlands. Research polocy. 1998, 27(1),pp.95-107.
International Journal of Pure and Applied Mathematics Special Issue
[22] Schankerman, M. Pakes A. Estimate of the value of patentrights on European countries during the post-1950 period, TheEconomic journal, 1996, 96(384), pp. 1052-76.
[23] Schnoch U. Tracing the knowledge transfer from science totechnology as reflected in patent indicators, Scientometrics,1993, 26(1), pp. 193-211.
[24] Sunghee Y, Yenyoo Y. A study on the Effects of small en-terprises motivations to request consulting from the perspec-tive of transaction cost economics and sociological neoinsti-tutionalism, Indian Journal of Science and Technology,2015April,8(S7), pp. 581-89.
[25] Traijtenberg M. A penny for your quotes: patent citations andthe value of innovation, RAND Journal of Economics, 1990,21(1), pp.172-87.
[26] Tseng F M, Hsieh C H, Peng Y N, Chu Y W. Using patentdata to analyze trends and h technological strategies of theamorphous silicon thin-film solar cell industry, TechnoogicalForcasting Social change, 2011, 78(2), pp. 332-45.
[27] Ueno H, Ishikawa N, Sumino H, Takahashi O. Performanceevaluation of WAP and internet protocols over WCDMA net-work, Cluster Computing, 2005, 8, pp. 27-34.
International Journal of Pure and Applied Mathematics Special Issue