Embed Size (px)
Citation preview

Student P.W. (Peter) Cozijn (0557502)
Supervisors On behalf of Eindhoven University of Technology, School
of Innovation Sciences
Dr. Önder Nomaler
Dr. Alessandro Nuvolari
On behalf of Philips Intellectual Property and Standards,
department of Business Intelligence
Piet van Zanten
Program Master’s program Technology and Policy
School of Innovation Sciences
Faculty of Industrial Engineering and Innovation Sciences
Eindhoven University of Technology
Date January, 2009
Estimating the Value of a Patent to a Company using Patent Indicators
M.Sc. thesis
P.W. Cozijn (0557502)

Page i
Summary Because of the increasing volume of trade of patent rights, businesses need to evaluate
increasingly often whether the acquisition of particular patent rights is beneficial to the
company. Such evaluations are complex and therefore costly. This creates a desire for a
smart pre-selection method of patents to evaluate in more detail.
Both from scientific literature and business experience, it is known that certain characteristics
of patents are statistically related to high patent value. Examples of such patent indicators are
the number of countries that a patent has been filed in and the number of later patents that
refer to it. Patents having high values on such indicators may be expected to be of high value.
However, there are several ways to think of the value of a patent. In most scientific literature
on the subject, patent indicators are shown to relate to the social value of a patent, i.e. the
value of the contribution of the patented invention to the world. Other studies relate patent
indicators to other concepts of patent value, such as its market value or simply its “intrinsic
quality”. It is known that a patent’s value can be estimated using patent indicators at
reasonable accuracy – but which value?
When evaluating a patent for possible acquisition by a company, a different value concept
needs to be considered: a patent’s value to the company. This is the value that the company
can derive from holding the patent in the future. It is determined by how well a patent fits the
company’s strategy, competences and facilities. Therefore, it is different between any two
companies.
A number of patent indicators are proposed that are expected to relate to a patent’s value to a
particular company. These indicators are based on:
• Citation of a patent in later patents held by the company
• Citation of a patent in later patents held by the company’s major competitors
• Citation in the patent of earlier patents held by the company
• Citation in the patent of earlier patents held by the company’s major competitors
• Relevance of a patent’s technological classification to the company
The question of whether these indicators do indeed relate to a patent’s value to a company is
answered by way of a survey among patent attorneys of Philips Intellectual Property &
Standards, a company highly active in patenting. The patent attorneys were asked to assess
the relevance and value of four patent families to Philips. For the same patents, values on the
abovementioned indicators were calculated.
Statistical analysis of the survey results leads to two main results:
1. The proposed indicators are statistically related to expert estimates of the relevance
and (to a lesser degree) value of a patent to Philips.

Page ii
2. Existing indicators, which were earlier shown to correspond to inventor estimates of
market value, are not statistically related to the same expert estimates.
These findings lead to two main conclusions:
1. The value of a patent to a particular company is not covered by existing patent
indicators. Is it different from a patent’s social and market value.
2. A number of new patent indicators are shown to be related to a patent’s value to a
particular company
For scientific research on patent indicators, these results imply that future research should be
more precise about which concept of patent value is used: social value, market value, or
value to a particular company.
The main implication for business practice is that one should consciously determine which
patent indicators to use in which situation. For the application of evaluation patents for
possible sale, the proposed new indicators are likely to add value.

Page iii

Page iv
Preface The thesis in your hands is the result of nearly one year of work at the subject of patents and
patent indicators. I am grateful for having had the chance to work within the environment of
Philips IP&S on a subject that combines aspects of intellectual property, IT and statistics. It
also gave me a clearer perspective on what I want to contribute to business.
At the start of my internship at Philips, I was supervised by Cristian Huiban. Unfortunately, his
time and energy were taken by things out of his control. I would like to thank him for inspiring
me during those first weeks. Thanks must also go to Piet van Zanten for taking over
supervision in such a flexible way, to Gerard van der Ligt for the support and for opening
doors, and to my other colleagues at IP&S Business Intelligence for the good times and
lunches. Furthermore, I would like to thank Toon Groenendaal, Eddy Odijk, Jako Eleveld and
Pavel Mulyar for teaching me on IP business through interviews and discussions.
Thanks to my university supervisors, Önder Nomaler and Alessandro Nuvolari, for the
passionate discussions and for dedicating so much of your time to the project.
The thesis in your hands is also the concluding work of my studies. I have been very happy
with the content and multidisciplinary nature of the Technology & Policy program. It was one
of the hardest decisions of my life to quit my earlier studies in Delft and switch to Innovation
Sciences in Eindhoven. Even though I am convinced this subject is closer to my heart and
talents, it was often hard to give up so much for it.
The thesis in your hands is the start of the next part of my life, too. After many years of
studying, I am yearning for new challenges. I believe that I have found a great way to take on
such challenges as an entrepreneurial consultant at Gibbs. Rene and Stephanie, thank you
for the patience you have shown and let’s have a good time!
I would like to thank my parents for their infinite support and my sister and her boyfriend and
kids for making me smile. Finally, I cannot thank my girlfriend Hendrikje enough for always
being there.
Peter Cozijn
Eindhoven, January 9, 2009

Page v
Table of contents 1. Introduction........................................................................................................................ 1
1.1. Research questions ................................................................................................... 3
1.2. Contribution to existing literature ............................................................................... 3
1.3. Thesis structure ......................................................................................................... 4
2. Theoretical background: Patent value and patent indicators ...................................... 5
2.1. Applications of patent information ............................................................................. 5 2.1.1. Business: Source of competitive information ..................................................... 6 2.1.2. Social sciences: Patents as indicator of technological innovation..................... 6 2.1.3. Common interest: patent indicators ................................................................... 7 2.1.4. Differences in approach ..................................................................................... 7
2.2. The value of patents .................................................................................................. 8 2.2.1. Different value concepts .................................................................................... 9 2.2.2. Patent value and mode of usage ..................................................................... 10 2.2.3. Estimating the value of patents using patent indicators .................................. 10
2.3. Survey of literature on indicators of patent value .................................................... 11 2.3.1. Using patent information .................................................................................. 11 2.3.2. Patent renewal ................................................................................................. 11 2.3.3. Patent citation counts ...................................................................................... 12 2.3.4. Other indicators of patent value ....................................................................... 13 2.3.5. Empirical testing of aggregate indices ............................................................. 15
2.4. Conclusion: Which patent value? ............................................................................ 15
3. Usage of patent indicators within Philips Intellectual Property & Standards ........... 17
3.1. Philips Intellectual Property & Standards ................................................................ 17 3.1.1. IP creation and value extraction ...................................................................... 18 3.1.2. IP needs and value contribution ...................................................................... 18 3.1.3. IP Counseling .................................................................................................. 18
3.2. Patent landscaping .................................................................................................. 19 3.2.1. PLATO ............................................................................................................. 20 3.2.2. Patent indicators in PLATO ............................................................................. 20 3.2.3. Overall score .................................................................................................... 21 3.2.4. Different applications ....................................................................................... 22
3.3. Information needs .................................................................................................... 22
4. The value of a patent to a company .............................................................................. 24
4.1. What is a patent worth to a particular company? .................................................... 24
4.2. Determinants of value to a particular company ....................................................... 26
4.3. Examples of patents and value concepts ................................................................ 27
4.4. Indicators of value to a particular company ............................................................. 28 4.4.1. Citation links to and from company C .............................................................. 29 4.4.2. Citations by major competitors ........................................................................ 30 4.4.3. Technological fit ............................................................................................... 31
4.5. Possible application: Evaluation of patents offered for sale .................................... 32
4.6. Conclusion ............................................................................................................... 33
5. Empirical validation ........................................................................................................ 34
5.1. Survey design .......................................................................................................... 34

Page vi
5.2. Adaptation of indicators to Philips ........................................................................... 35 5.2.1. Citation links to/from Philips ............................................................................. 35 5.2.2. Citation links to/from Philips’ major competitors .............................................. 35 5.2.3. Technological fit ............................................................................................... 36
5.3. Survey questions ..................................................................................................... 37
5.4. Invited participants ................................................................................................... 38
5.5. Patent selection ....................................................................................................... 38
5.6. Descriptives of the random sample ......................................................................... 40
5.7. Oversampling ........................................................................................................... 42
5.8. Patent assignment ................................................................................................... 43
6. Results .............................................................................................................................. 45
6.1. Description of survey results.................................................................................... 45
6.2. Response analysis ................................................................................................... 48
6.3. Correlations ............................................................................................................. 49
6.4. Regressions ............................................................................................................. 49 6.4.1. Regressions on Relevance .............................................................................. 50 6.4.2. Regressions on InvestigateFurther .................................................................. 51 6.4.3. Regressions on Value ...................................................................................... 53
7. Conclusions and recommendations ............................................................................. 55
7.1. Implications for business ......................................................................................... 56
7.2. A practical application .............................................................................................. 56
7.3. Implications for social science ................................................................................. 57
7.4. Recommendations for further research ................................................................... 58
Appendices ............................................................................................................................. 62
8. Questionnaire .................................................................................................................. 62
8.1. Invitation e-mail ........................................................................................................ 62
8.2. Questions ................................................................................................................. 63
Page vii
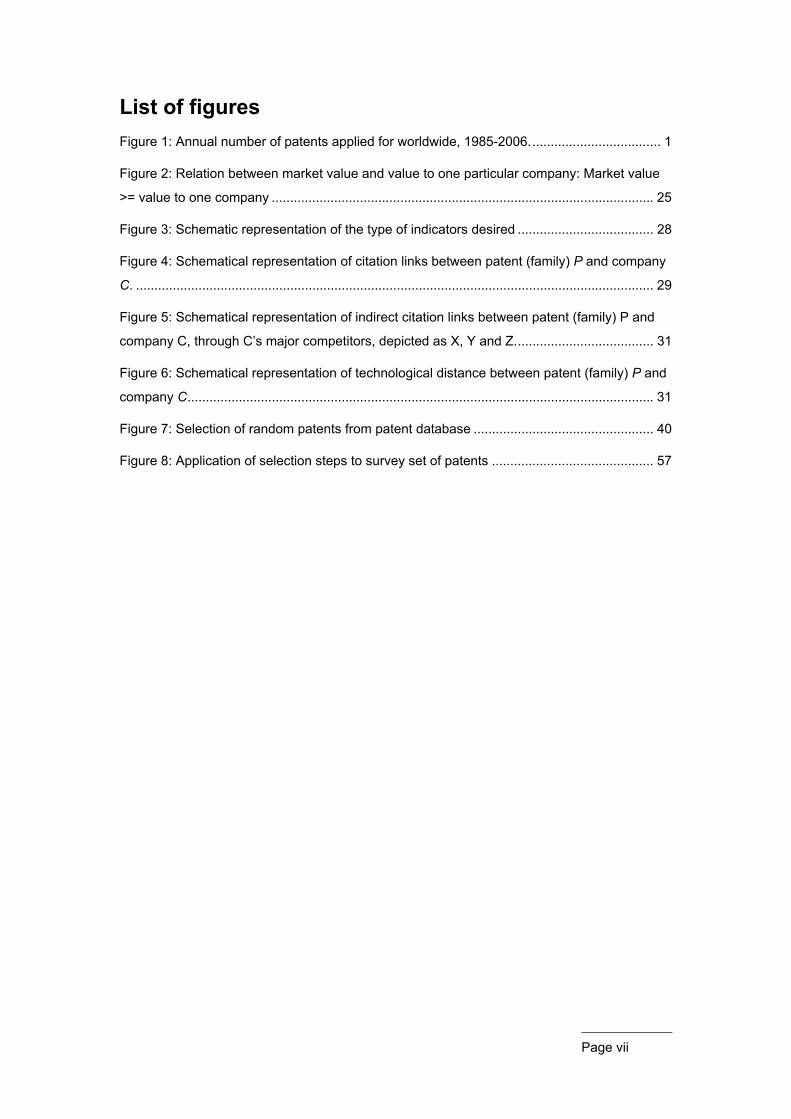
List of figures Figure 1: Annual number of patents applied for worldwide, 1985-2006. ................................... 1
Figure 2: Relation between market value and value to one particular company: Market value
>= value to one company ........................................................................................................ 25
Figure 3: Schematic representation of the type of indicators desired ..................................... 28
Figure 4: Schematical representation of citation links between patent (family) P and company
C. ............................................................................................................................................. 29
Figure 5: Schematical representation of indirect citation links between patent (family) P and
company C, through C’s major competitors, depicted as X, Y and Z. ..................................... 31
Figure 6: Schematical representation of technological distance between patent (family) P and
company C ............................................................................................................................... 31
Figure 7: Selection of random patents from patent database ................................................. 40
Figure 8: Application of selection steps to survey set of patents ............................................ 57

Page viii
List of tables Table 1: Ocean Tomo live auction results. ................................................................................ 2
Table 2: PLATO Indicators ...................................................................................................... 21
Table 3: Illustration of IPC Score list ....................................................................................... 37
Table 4: Criteria for selection of random patents from patent databases ............................... 39
Table 5: Distribution of IPCscore in the pre-selection of 3,286 patent families ....................... 40
Table 6: Distribution of FwdCitByPh in the pre-selection of 3,286 patent families .................. 41
Table 7: Distribution of FwdCitByMC in the pre-selection of 3,286 patent families ................ 41
Table 8: Distribution of overall score in the pre-selection of 3,286 patent families ................. 42
Table 9: Distribution of selected patent families over Overall Score and IPCscore after
oversampling ........................................................................................................................... 43
Table 10: Overview of responses to question 1 of the questionnaire ..................................... 45
Table 11: Overview of responses to question 2 of the questionnaire ..................................... 45
Table 12: Overview of responses to question 3 of the questionnaire ..................................... 46
Table 13: Pearson correlation between responses to questions 1-3. ..................................... 46
Table 14: Response frequencies to question 4 regarding information used in assessment of
patent ....................................................................................................................................... 47
Table 15: Response frequencies to question 5 regarding likely mode of usage for the patent
................................................................................................................................................. 47
Table 16: Response rates by patent family assignment method, patent family level ............. 48
Table 17: Response rates by patent family assignment method, patent attorney level. ......... 48
Table 18: Pearson correlations between indicators (rows) and expert estimates (columns). 49
Table 19: Ordinal logit regressions on Relevance (standard errors in parentheses). ............ 50
Table 20: Binary logistic regressions on InvestigateFurther. .................................................. 52
Table 21: Ordinal logit regressions on Value (standard errors in parentheses). .................... 53

Page ix

Page 1
1. Introduction Intellectual property plays a crucial role in today’s economy. A large portion of the value of
companies consists of intangible assets such as trademarks1 and patent rights. To provide
added value to their customers, it is in many industries essential to differentiate from other
companies through proprietary technologies. This is reflected in the increasing annual rate of
patenting, illustrated in Figure 1.
Not only are patents applied for increasingly often, they are also exploited in new and different
ways. Traditionally, the way to extract value from a patent has been to sell products that
contain the patented technology. Because of this technological advantage, one could sell
larger numbers of the product or sell them at higher profit margins. Occasionally, these
companies would license technologies to competitors in exchange for cash, or cross-license
patents.
During the last decade new business models have emerged. Companies such as Qualcomm
chose to focus on developing technologies and sell licenses to apply these technologies to
other firms. Other companies, commonly referred to as ‘patent trolls’, buy patents with the
objective of obtaining maximum royalties from infringers.
1 As reflected by the InterBrand rankings of trademark value (see www.interbrand.com)
0
500.000
1.000.000
1.500.000
2.000.000
1985 1990 1995 2000 2005
Total annual number of patent applications worldwide
Non‐Resident Applications
Resident Applications
Figure 1: Annual number of patents applied for worldwide, 1985-2006. Grey area
indicates patents applied for in the country where the applicant is located, black area
indicates patent applications abroad. (Source: WIPO World Patent Report, 2008)

Page 2
The last decade has seen a rise in the volume of trade of patent rights, both privately and
through public forums such as websites at which patents can be listed for sale or auctioned2
and live patent auctions3. To illustrate this last phenomenon, Table 1 displays the results of
live auctions by one specific auctioneer.
As a result of these developments it is increasingly often required to determine or estimate
the value of a patent.
A stock owner of a public high-tech company wants to estimate the worth of the company’s
patent portfolio, so he can decide to buy or sell stocks. An entrepreneur holding a patent may
wonder for what amount of money she could sell it.
Similarly, a possible buyer for this patent wants to determine how much it would be willing to
pay for it. However, to know the added value of a patent to a company requires a thorough
assessment of the patent by an experienced patent attorney. It is undesirable for any
company to perform such a complex and costly valuation for every patent offered for sale.
A natural alternative is not to perform a full valuation for each patent offered for sale, but to
make an underpinned preselection. This thesis explores the possible contribution of statistical
methods to this end.
2 Such websites include www.otpba.com (since 2004), www.freepatentauction.com (since 2004), www.shop4patents.com (since 2006), www.ideabuyer.com (since 2008)
3 Such as those organized by Ocean Tomo Auctions, LLC (since 2006) and IP Auctions GmbH (since 2007)
Auction date Lots offered for sale Lots sold Turnover
Spring 2006 78 >= 31 >= $ 8.446.100
Fall 2006 97 >= 25 >= $ 23.903.000
Spring 2007 67 >= 43 >= $ 11.429.000
Summer 2007 51 >= 14 >= $ 8.100.503
Fall 2007 75 >= 38 >= $ 11.599.500
Spring 2008 85 >= 53 >= $ 19.629.500
Summer 2008 60 >= 29 >= $ 12.674.000
Table 1: Ocean Tomo live auction results. Lots include mostly patents, but also some
other forms of IP such as trademarks and domain names (source:
http://www.oceantomo.com/auction_results.html, last accessed November 2, 2008)

Page 3
In both the social sciences and business, research has been conducted into determinants of
patent value. This research has led to a range of indicators of patent quality, some of which
have been shown to be statistically related to high patent value (Van Zeebroeck & Van
Pottelsberghe de la Potterie, 2008). Furthermore, value estimation models based on multiple
indicators have been developed and tested (Harhoff, Scherer, & Vopel, 2003); (Harhoff &
Reitzig, 2004); (Lanjouw & Schankerman, 2004).
After a general discussion of patent indicators and their relation to patent value, the thesis
zooms in on the value of a patent to a particular company. Several new patent indicators are
proposed that are specifically relevant to this concept of the value of a patent. The relevance
of these indicators is tested by way of a survey among patent attorneys employed by Philips
Electronics, a multinational firm active in consumer electronics, healthcare and lighting.
1.1. Research questions The main research question addressed in this thesis is:
How can insight from patent indicators be applied in the evaluation of patents considered
for acquisition by a company?
This main research question can be broken down into the following questions:
1. Which patent indicators are currently known from literature and practice? For which
goals were they developed and what do they signify?
2. How is Philips IP&S organized and in which ways is patent information used?
3. Which patent characteristics and circumstances are relevant when considering
whether or not to acquire a patent?
4. Which existing or new patent indicators can be expected to be of utility to the
evaluation of patents considered for acquisition?
5. How do indicator values on the proposed indicators relate to expert estimates of a
patent’s estimated value to Philips?
1.2. Contribution to existing literature On a theoretical level, the main contribution of this thesis is the clarification it brings into the
relation between patent indicators and the value of patents. The key point is that traditional
patent indicators correspond to the social value of patented inventions, whereas for business

Page 4
practice, the value of a patent to a specific company is of key interest. Several new patent
indicators are hypothesized to correspond to the relevance of a patent to a company.
These hypotheses are tested by way of a survey among 65 patent attorneys of a multinational
high-tech company, Philips. It is shown that the indicators correspond better to their
judgments than do traditional indicators. Thus, the proposed indicators are of value to the
practical business challenge of evaluating patents offered for sale from the standpoint of one
company.
1.3. Thesis structure The second chapter of this thesis presents an overview of patent indicators known from
literature and their relation to patent value. Chapter three introduces Philips IP&S, its activities
and the role of patent indicators in these activities. Chapter four discusses the value of a
patent to a company and introduces the new indicators. The fifth chapter describes how the
relevance of these indicators is tested by way of a survey among Philips patent attorneys.
This is followed by a chapter on the statistical results of this exercise. The thesis rounds off
with conclusions and recommendations for science and business.

Page 5
2. Theoretical background: Patent value and patent indicators
The world’s patent systems spawn large amounts of empirical data on the development of
technological knowledge. Each patent application is published some time after it has been
filed, in order to disclose the latest technological developments to the world. Furthermore,
much information in relation to the patent application process is made publicly available.
Together, this forms a wealth of information on technological innovation.
Because of the many intricacies of patenting practice, extracting meaningful knowledge from
these databases is challenging. But it is nevertheless a goal worth pursuing, because patent
information is a unique source of information that is relevant to both public and business
policy. From a public policy perspective, patent statistics can provide insight into the way
technological development occurs, and it can provide measures on the innovative
performance of countries, regions or companies (Griliches, 1990). For companies, patent
statistics can provide strategic insight into competitors’ patent portfolios and into
developments in a technological field (Ernst, 2003).
This chapter discusses the main developments concerning the usage of patent information to
determine the value or quality of patents. It seeks to answer the following partial research
question:
1. Which patent indicators are currently known from literature and practice? For which
goals were they developed and what do they signify?
As a first step to answering this question, applications of patent information are discussed
from the viewpoints of business and science. After a brief section on the value of patents, the
chapter turns to a survey of scientific literature on patent indicators and their relation to patent
value.
2.1. Applications of patent information Patent information is used for different purposes, both in science and business practice. Each
of these purposes comes with its own requirements for patent information. This section
introduces current applications of patent information in science and business, common
interests and concepts, and differences in approach between the two fields.

Page 6
2.1.1. Business: Source of competitive information
One of the goals of the patent system is to make information on recent technological
discoveries publicly available, so that knowledge spreads and others can take note of the
invention. Thus, patent information is a source of competitive information by design. Patent
attorneys and researchers can take note of the content of patents newly applied for by other
companies in order to know the latest developments in fields of technology they are active in
themselves.
Patent information is also used for other purposes. When an invention is recognized, a
company might perform a novelty search to discover whether the solution really is new. If it is
not, the company can save itself the cost of applying for a patent. A company can also use
patent information to find patents that limit its freedom to operate on a certain market. It could
also use aggregate information from patent databases to evaluate company strategies and to
benchmark its performance alongside relevant competitors.
The IP business community is still expanding its way of using patent information. This is e.g.
reflected in a recent article by Breitman & Mogee (2002) that discusses several applications
of patent analysis. Another example is the emergence of companies that sell patent
valuations through websites, such as www.PatentRatings.com, www.PatentCafe.com and
www.PatentValuePredictor.com.
2.1.2. Social sciences: Patents as indicator of technological innovation
Technological innovation is a driving force of economic growth (Schmookler, 1966). For this
reason, economists and other social scientists are interested in the dynamics of technological
innovation. One of the main challenges in research on this subject is the measurement of the
‘output’ of innovative efforts. It is relatively easy to measure how many people work on an
R&D project and how much money is invested into it, but how do you measure ‘how much
innovation’ is the result of it?
Patent information is a unique source of information on the output of technological innovation.
It provides reasonably complete information on the output of technological development and
individual inventions. This information can be linked to other information about the times they
were invented in, characteristics of inventors, companies and research projects, geographical
aspects, et cetera.

Page 7
2.1.3. Common interest: patent indicators
A common interest of science and business is to develop patent indicators. Patent indicators
are quantitative indicators based on patent information. A patent indicator is a ratio or number
that describes one or more characteristics of a patent or a group of patents. It can be based
on the technical content of one or more patent publications and on information about the
patent4.
The main rationale for using economic indicators is measurability. Some indicators
correspond to tacit, immeasurable factors. To illustrate this, the profits of a company depend
on the buying price of its inputs and on the dedication of its employees. It is impossible to
directly measure ‘dedication’, but one might expect that dedicated employees stay employed
longer. Thus, one could measure the average duration of employment instead. Average
duration of employment is then an indicator of employee dedication.
In a similar way, patenting activity has indicative potential for many economic phenomena.
Invention, research and development influence the immeasurable “rate of technical and
scientific progress”. This rate underlies “economic growth, the rate of technological change,
the competitive position of firms and countries, [and] the dynamism of alternative industrial
structures and arrangements” (Griliches, 1990, p. 1661).
Apart from studies into the value of patents, patent citations have been proposed as
indicators of knowledge flows, and are thus employed in studies of technological spillovers
(Jaffe, Trajtenberg, & Henderson, 1993) and trajectories of technological progress
(Verspagen, 2007) (Von Wartburg, Teichert, Thorsten, & Rost, 2005). Other application areas
for which patent indicators are proposed to be useful are the identification of patents that are
promising for fuelling technology start-ups (Shane, 2001) and analysis of the links between
science and technology (Nomaler & Verspagen, 2007).
2.1.4. Differences in approach
The ways patent indicators are used differ considerably between science and business.
4 The technical content is the description of the invention protected by the patent. It consists of a textual description of the invention along with a number of illustrations. The core element of the text is the ‘claims’ section, in which the boundaries of the protection are precisely defined.
Patent databases not only contain the patent text, but also other information about the patent, which is sometimes called “metadata”. Part of this information is related to the patent application process, such as the date of application for the patent and the names of applicants and inventors. Other information is added by the patent office employees, such as a classification of its technological content.
Page 8
For social scientist working with patent information, the goal is often defined as finding the
potential relations between concepts. Finding such causal relations is often easier in
controlled environments, where the effects of unpredictable external influence factors are
minimized. For these reasons, scientific research of patent indicators often looks at patents
from a single jurisdiction, most prominently the United States. For this reason, patent
indicators in scientific literature are commonly based on the characteristics of a single patent
document.
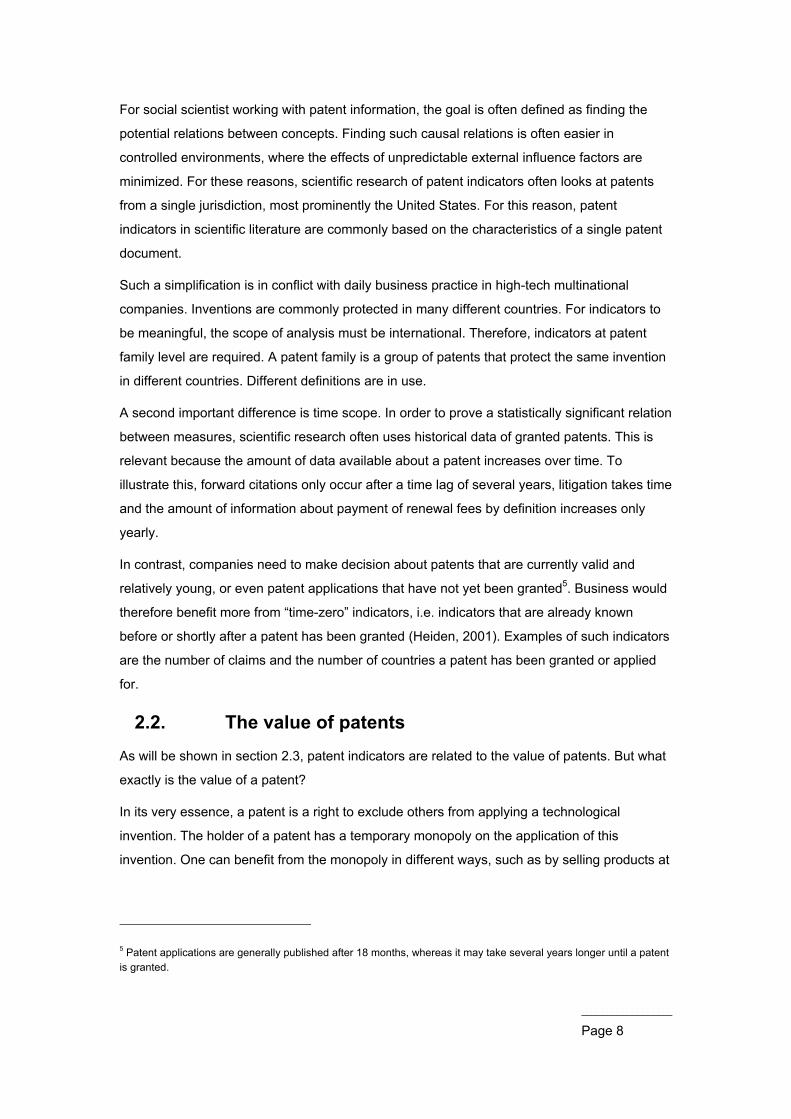
Such a simplification is in conflict with daily business practice in high-tech multinational
companies. Inventions are commonly protected in many different countries. For indicators to
be meaningful, the scope of analysis must be international. Therefore, indicators at patent
family level are required. A patent family is a group of patents that protect the same invention
in different countries. Different definitions are in use.
A second important difference is time scope. In order to prove a statistically significant relation
between measures, scientific research often uses historical data of granted patents. This is
relevant because the amount of data available about a patent increases over time. To
illustrate this, forward citations only occur after a time lag of several years, litigation takes time
and the amount of information about payment of renewal fees by definition increases only
yearly.
In contrast, companies need to make decision about patents that are currently valid and
relatively young, or even patent applications that have not yet been granted5. Business would
therefore benefit more from “time-zero” indicators, i.e. indicators that are already known
before or shortly after a patent has been granted (Heiden, 2001). Examples of such indicators
are the number of claims and the number of countries a patent has been granted or applied
for.
2.2. The value of patents As will be shown in section 2.3, patent indicators are related to the value of patents. But what
exactly is the value of a patent?
In its very essence, a patent is a right to exclude others from applying a technological
invention. The holder of a patent has a temporary monopoly on the application of this
invention. One can benefit from the monopoly in different ways, such as by selling products at
5 Patent applications are generally published after 18 months, whereas it may take several years longer until a patent is granted.
Page 9
a higher price, selling larger volumes of products, deterring competitors from entering the
market, giving licenses in exchange for royalties, or by selling the patent.
The value of a patent depends on many factors. These include characteristics of the invention
itself, such as its essentiality to solve a particular problem and the ease with which
infringement could be detected. The development process of the patented technology is also
of influence, through factors such as the amounts of money and man-hours put into
development of the patented technology and the level of experience of the inventor(s)
(Gambardella, Harhoff, & Verspagen, 2008). Many more factors are important, such as the
size of the market(s) in which the technology could be applied, the exact wording of the
claims, the owner’s willingness to defend the patent in court, other patents held by the same
company, et cetera.
2.2.1. Different value concepts
Several researchers have pointed out that several definitions of patent value can be used.
Heiden (2001, pp. 7-8) summarizes these definitions. The value of patent protection is the
difference between the economic value that the owner of an invention could extract from the
invention with and without patent protection. For a granted patent, this could be calculated as
the total current and future returns when holding the patent, minus total current and future
returns in the situation when the patent is abandoned. This is exactly the situation a patent
holder faces when deciding whether or not to renew a patent for an additional period of time,
thus this value concept is referred to as renewal value. It is what Schankerman & Pakes
(1986) estimated (see section 2.3.2).
A patent’s renewal value is only defined by possible returns to the current owner. In contrast,
its market value or asset value is determined by how much another company is willing to pay
to acquire full rights to the patent. What each company is willing to pay, in turns, depends on
its expectations of future returns when and when not acquiring the patent. A patent’s market
value is the highest amount any third party would be willing to pay to acquire a patent.
Harhoff (2003, pp. 1345-1348) further detailed the relation between renewal value and market
value by pointing out the relevance of blocking power. In case of a sale, the original owner
loses rights to apply the patented invention itself, thus granting the new owner the right to
block the previous owner. Heiden and Harhoff agree that asset value is the concept most
appropriate in determining a patent’s value, because it takes into account strategic options as
well.
A final and important definition is that of the social value of a patent. In fact, researchers often
mean the social value of the patented invention. Its social value is the monetary equivalent of

Page 10
the use the patented invention has brought to the world. This can be calculated in terms of
money saved, time saved, years lived longer, et cetera. Patents having high social value have
been beneficial to the world, even though they might not even be valid anymore. In a manner
of speaking, one could call them “celebrity patents”.
2.2.2. Patent value and mode of usage
Reitzig (2003) performed research within a semiconductor company. He researched latent
value-defining characteristics of patents, such as patent breadth and difficulty of inventing
around. Furthermore, he recognized that a company can use a patent in different ways. Such
‘modes of utilizing patents’ include selling products that implement the patented technology
and use of patents as ‘bargaining chips’. Such patents are held with the objective of
strengthening one’s position in case of negotiations for cross-licenses or standards.
Reitzig performed a study among patent attorneys of the firm. He selected 127 patents that
were held by the company as bargaining chips and asked the patent attorneys to rate these
patents along scales relating to the characteristics and value of the patent. He found that for
this set of patents, novelty (size of the contribution to the prior art) and inventive activity are
the most important factors.
His most important finding in relation to the present research is on a higher level: Namely, his
research suggests that different factors determine the value of a patent, given the mode of
usage chosen for a patent.
2.2.3. Estimating the value of patents using patent indicators
In order to know the value of one particular patent, one needs to take into account all these
factors and more. Two main approaches to patent valuation are common. The ‘white box’
approach is to assess the value of a patent or group of patents as precisely as possible. This
process involves investigating properties of a patent such as listed in the previous section,
and their influence on value.
Several methods can be applied to perform a ‘white box’ valuation. According to Smith & Parr
(2000) the method best suited method to patents is the income method, where discounted
future cash flows as a result of holding a patent are estimated.
The ‘black box’ approach to valuation, on the other hand, is based on patent statistics. This
approach is not to manually interpret the patent in its context, but to use objective, computer-
readable criteria instead. Based on statistical patterns and heuristics, indications are derived
about characteristics of patents such as their quality and value.

Page 11
This approach is clearly less rigorous and precise than ‘white box’ valuation. For a particular
patent, the value estimate could be far off the mark. Nevertheless, it has been shown by
numerous researchers that ‘black box’ value indications are statistically related to patent
value, as summarized by Van Zeebroek and Van Pottelsberghe de la Potterie (2008, p. 9)
and as will be shown in section 2.3.5.
A trade-off exists between cost and precision. For certain applications, it is worth the time and
money to fully investigate all aspects of a patent’s value, because a lack of precision could
cause a costly mistake. For other purposes, some imprecision is acceptable in the light of
cost savings and larger-scale applicability. Patent valuation based on patent statistics has
benefits for those situations, where lower precision is acceptable or the number of patents to
be assessed is relatively large.
2.3. Survey of literature on indicators of patent value Patent indicators, and their relation to patent value, have been the subject of many scholarly
research projects. This section presents an overview of major developments in scientific
literature on patent indicators and indicator-based patent valuation. Section 2.3.2 discusses
early efforts using renewal data, followed by a section on citation data. Section 2.3.4
discusses the use of multiple indicators of patent value. Sections 2.3.5 and the conclusion
focus on the issue of different value constructs and their relation to patent indicators.
2.3.1. Using patent information
The patent system has been used as an information source for techno-economical research
since the 1960s. Amongst other goals, patent counts were employed to analyze determining
factors of economic activity (Schmookler & Brownlee, 1962) and the relation between patents,
new products and R&D expenditures at firm level (Comanor & Scherer, 1969). It was already
recognized in early stages that inventions vary greatly in magnitude (e.g. (Kuznets, 1962)),
which led to the insight that patent counts are noisy descriptors of innovative success.
Increasingly, computing power became available to researchers and patent bureaus started
publishing patent information digitally. This opened to door to further analysis and
manipulation of patent information.
2.3.2. Patent renewal
Schankerman and Pakes (1986) were among the first to derive information about the value of
patents from patent metadata. They used information on patent renewal to estimate the
monetary value of European patents. Their central theorem was that, since renewal of patent
right costs a certain amount of money, each decision to renew a particular patent indicates
Page 12
that it is worth a certain amount to the assignee. They used information on the height of
renewal fees, as well as historical rates of renewal supplied by patent offices, to estimate the
value distribution of patents in the United Kingdom, France and Germany.
They found that the value distribution of patents is highly skewed. For example, they found a
median value of US $ 6,693 for five year old UK patents6, but with extremes of up to US $
82,475. Furthermore, they found that German patents were generally worth more than French
and UK patents, in a way proportional to the sizes of the national economies: a finding that
supports the notion that a patent’s value is related to the size of the market its protection
extends to.
With regard to the methodology applied by Schankerman and Pakes, it should be noted that
they did not measure an empirical patent value, but instead constructed a value distribution
based on theoretical assumptions. These assumptions imply that a patent’s value can only
increase, until it drops to zero after it expires or is no longer renewed. Furthermore, as their
analysis took place at an aggregate level, they did not construct patent indicators for
individual patents.
2.3.3. Patent citation counts
In most jurisdictions, the relevant patent office performs a novelty search for each patent that
is applied for. A patent office employee makes an inventory of the state of the art at the time
of filing. The result of these efforts is a search report, which is usually published together with
the patent application. This search report lists patents and other documents relevant to the
invention for which patent is applied. In some jurisdictions, a distinction is made between
documents listed in the search report as background knowledge, and documents that are
found harmful to novelty and on the grounds of which the patent application has been
rejected.
Seen from the perspective of the cited patent, occurrence of a patent in later search reports (a
‘forward citation’) shows that the patented invention is relevant to later inventions. The
number of forward patent citations was shown to be correlated with the quality of patents
early on. Carpenter, Narin and Woolf (1981) showed that some technologically important
patents had relatively high citation rates. These patents underlied inventions that received the
IR100 Award for “the 100 most significant technical products (..) developed during the year”
(p. 161).
6 At the 1980 price level
Page 13
Trajtenberg (1990) and others showed that forward citation rates are systematically related to
patent value in the area of computer tomography scanners. He used each individual patent’s
forward citation count as weight in patent counts. These weighted counts were significantly
related to a concept of patent value, whereas non-weighted counts seemed unrelated.
Both these studies show that citations are related to patent value. The study by Carpenter,
Narin and Woolf is clear about what is meant with ‘important’ patents: patents underlying
inventions of technological importance as judged by experts. These patents are large
contributions to the state of the art. Trajtenberg uses a similar concept: the “social value” or
“social surplus” (p. 178) of a patent. Like Carpenter et al., Trajtenberg does not distinguish
between the value of a patent and the value of the invention protected by it. By the value of a
patent, Trajtenberg means its contribution to society, or in other words, how much better off
the world is because this patent exists.
When interpreting the result of both studies, it is of key importance to realize that patent
citation counts are shown to correspond to this particular dimension of a patent’s value, which
can be described in several ways: its contribution to overall welfare, its importance of quality,
or simply the intrinsic value of a patent.
2.3.4. Other indicators of patent value
After these defining studies of patent citation counts as indicators of patent value, further links
between indicator values and patent value were investigated. Lanjouw et al. (1998) used
patent renewal data and patent family size in their research. Harhoff et al. (2003) introduced
opposition data, and many more indicators have been proposed and used (see Frame 1).
Whereas early studies used one value estimator at a time, Lanjouw and Schankerman (2004)
sought to combine different estimators into an aggregate index of patent “quality”. They state
that by a patent’s quality, they mean to take into account “both the technological and value
dimensions of an innovation” (p. 443).
The authors constructed their quality index as a linear combination of four indicators
associated with value: Number of claims, forward citations in the first five years after granting
of the patent, number of backward citations, and patent family size. Using common factor
analysis, factor weights were chosen so that the variance in the estimated quality was
minimized. Minimization of variance is the way their measure is calibrated. In other words, it is
assumed that all indicators correspond to the same dimension of “quality”. However, there is
no way to be sure that this common factor accurately reflects an actual quality of patents, i.e.
whether it is externally valid.

Page 14
List of commonly used patent indicators Characteristics of patent p
• Number of forward citations
• Number of backward citations
o Variations of citation counts: within a specific country, having category X/Y,
only patent or non-patent documents, in a specific time period (Hall, Jaffe, &
Trajtenberg, 2005), et cetera
• Number of claims
o Or the number of ‘excess’/non-free claims
• Number of inventors
• “Scope”: Number of different n-digit IPC classes (Lerner, 1994)
• Whether or not opposition has been filed against a patent
o If it has: whether or not the patent was upheld after opposition
• Age or the number of times the patent has been renewed
Characteristics of the patent family that patent p is part of
• Number of patents in the patent family
• Number of countries patent protection is in place
Characteristics of other patents related to patent p
• “Generality”: Number of different IPC classes that the patents that cite patent p
belong to (Trajtenberg, Henderson, & Jaffe, University versus Corporate Patents: A
Window on the Basicness of Invention, 1997)
• “Originality”: Number of different IPC classes that the patents cited by patent p belong
to (Trajtenberg, Henderson, & Jaffe, University versus Corporate Patents: A Window
on the Basicness of Invention, 1997)
Frame 1: List of commonly used patent indicators
Page 15
Van Zeebroeck (2008) also combines multiple patent indicators: citation counts, family size,
renewal, grant rate and opposition. Instead of focusing on the common factor, he stresses
that much of the variation in these indicators is not common. He constructs a composite index
of patent value, to which all five indicators contribute with equal weight. High values of this
composite index should be seen as “a signal that a given patent may be of a higher value
than average” (p. 26). By value, he means the potential market value of a patent.
In order to be more certain of the external validity of value estimates, various research groups
took up the baton of empirically testing value estimates. This is commonly done by performing
surveys of patent right holders.
2.3.5. Empirical testing of aggregate indices
Amongst others, Harhoff et al. (1999) performed a validation exercise by gathering expert
value judgments and relating these to the number of US forward citations for the same
inventions. These value judgments were gathered by contacting the holders of patents and
asking them for what price they would have sold the patent, had they known at the time of
application what they know now. The results displayed a noisy relation, in which important
patents were on the average cited more often, but the explanatory power of citation count was
low.
The largest-scale survey so far has been the PatVal-EU survey, jointly performed by research
groups in six European countries with support of the European Patent Office (Giuri, et al.,
2007). Inventors were invited to provide information on a European patent to their name,
technological and economic success of the patent, and the environment and process
surrounding the patent. They gathered inventor estimates of private monetary value estimates
of around 9,000 European patents. Work is forthcoming in which measures of success from
the PatVal survey, such as inventor estimates of monetary value, are used to test the
explanatory power of various patent indicators.
2.4. Conclusion: Which patent value? Several indicators of patent value have been identified. Easily measurable aspects of patents,
such as citation counts and patent family size, have been shown to be statistically related to
the value of patents. However, because of differences in the definitions of patent indicators,
and in the ways their relation to patent value has been tested, it is ambiguous to what aspect
of patent value they are exactly related to. This limits their usefulness to business practice.
In early studies of the relation between patent citation counts and the value of patents, such
as those by Carpenter et al. (1981) and Trajtenberg (1990), the number of citations relates to

Page 16
the social value of a patent. In later studies, where more patent indicators were used, it has
become less clear which concept of value is estimated by using patent indicators. In some
cases it is (purposefully?) left vague. Across other cases, different authors simply use
different value concepts.
This has the unwanted effect that it is unclear whether patent indicators are related to the
social value or the market value of patents, while these are fundamentally different aspects of
a patent’s value. A patent’s social value is the total value of a patent’s contribution to the
world, whereas its market value is what it would be sold for at one point in time.
An overview of efforts to test the empirical validity of patent indicators for various constructs of
value is given by Van Zeebroeck and Van Pottelsberghe de la Potterie (2008). One of the
results from this study is that relation between patent indicators and patent value differs per
study. This is expected to stem from two causes:
1) Different patent indicators capture different aspects of the quality of patents.
2) In different studies, different concepts of value are used.
For business usage of patent indicators, particular value concepts are expected to be useful
to particular activities. In order to investigate this, chapter 3 introduces the various patent-
related activities performed at Philips, and chapter 4 proposes new patent indicators that
better match the information needs of one of these activities.
Page 17
3. Usage of patent indicators within Philips Intellectual Property & Standards
The previous chapter has made clear that numerous patent indicators can be defined and that
they capture different aspects of patent quality. It has also been shown that by combining
multiple patent indicators, ‘black box’ estimates of the value of patents can be made.
Furthermore, it has been discussed that multiple definitions of the value of a patent can be
used. Finally, it has been shown that the mode of usage of a patent influences its value.
It remains to be answered, however, how business can benefit from these insight and
whether or not ‘black box’ patent value estimation is useful for business purposes.
Furthermore, it is an open issue whether certain indicators are better suited to specific
business processes than others.
As an example of a business to which patent indicators are of use, this chapter looks into the
role of patent indicators in different activities within Philips IP&S. In doing so, the following
question will be answered:
2. How is Philips IP&S organized and in which ways is patent information used?
3.1. Philips Intellectual Property & Standards Koninklijke Philips Electronics N.V. (Philips) is active in three main market sectors: Consumer
Lifestyle, Healthcare, and Lighting. It has over 130.000 employees worldwide and has an
annual turnover of over € 26 billion, of which over € 1.5 billion is reinvested into R&D
annually.
Intellectual property (IP) is of key importance to Philips. The company has a very large IP
portfolio. As of April 2008, Philips holds about 60,000 patent rights, 29,000 trademark
registrations, 43,000 design registrations and some 2,000-domain name registrations. Nearly
all of Philips’ IP affairs, as well as its activities with regards to standardization, are coordinated
by Philips Intellectual Property and Standards (IP&S). To conduct all these activities IP&S has
some 300 IP/IPR professionals and 200 support staff located in 26 offices around the world.
At the core of IP&S’ activities are its IP counsels. They include patent attorneys, trademark
attorneys, and attorneys at law. Their primary responsibilities are the creation, valorization
and management of IP rights.
On a high level of abstraction, the activities performed within Philips IP&S can be divided
along three main strands:

Page 18
3.1.1. IP creation and value extraction
This is the line of activities related to creating intellectual property (applying for patents,
trademarks and domain names) and making a profit out of them.
For the case of patents, this contains the whole chain of activities from recognizing a
patentable invention to valorization of the patent. The chain can be subdivided into different
activities, such as:
• Deciding which inventions to patent
• Filing for patent protection
• Choosing a valorization strategy
• Executing the valorization strategy
• Managing the IP portfolio
In most of these activities, information about patents outside of Philips plays a role. For
example, patent searches are performed in support of the activity ‘deciding which inventions
to patent’. The purpose of patent searching is to investigate whether an invention is already
patented. Philips IP&S employs a 25-person search department for this task (Van der Ligt,
2008).
Dependent on the valorization strategy for a particular patent, different activities are
performed. For instance, if the strategy is to actively claim royalties from other companies,
possible infringements must be detected and proven; if the strategy for a patent is to seek
inclusion of the invention in a technological standard, it will be taken into account in standards
negotiations; et cetera.
3.1.2. IP needs and value contribution
This is the line of activities related to the usage of third party intellectual property in products
and services marketed by Philips. A key task in this range of activities is to manage licenses
to third party IP. The goal for these activities is to employ third party IP in Philips products and
services at minimum cost.
The management of cross-licenses is a special case, because it is a combination of licensing-
in (IP needs) and licensing-out (valorization).
3.1.3. IP Counseling
This encompasses the role that IP&S plays in assisting the various Philips departments with
regards to IP matters. An IP Counsel may for instance be involved in a merger or acquisition
Page 19
of a company to monitor IP issues. Another role may be to assist groups of researchers in
setting goals and focus points based on the state of the art.
3.2. Patent landscaping Within the IP&S organization, the Business Intelligence (BI) department supplies external
information to IP counsels and management. Its mission is “to contribute to the IP&S
processes with reliable high quality market and IP information and analysis”. The department
does so by providing several services, both pro-actively and on request. One of its main tasks
is patent landscaping.
Patent landscaping is a process in which an overview of patent rights is made, that is relevant
to a business question. Typically, such a business question is related to a specific technology,
one or more third parties, or a combination of technologies and actors. The process consists
of two main steps:
1. Making a selection of patent documents relevant to the question.
2. Preparing a report in which the selection of patent documents is presented and
analyzed in the light of the question.
The first step – making selections of patent documents relevant to a specific business
question – is a task that requires considerable knowledge and experience. Requests are
usually phrased in natural language, such as “please give an overview of all patents related to
LED lighting”. Depending on the context and underlying goals, this question may be
interpreted in different ways7. Each such request should be translated into a database search
query with the right balance between recall and precision. It is required to know about the way
specific technologies are typically described in patent documents to make the right selection
of documents.
In the second step of patent landscaping, the resulting set of patents is presented in the form
of a report. Information about these patents is extracted from patent databases and indicator
values are calculated. The patents may be classified in different groups or put in a particular
meaningful order, and remarks may be added to specific patents. Furthermore, those graphs
and other graphical representations of the data are prepared, that are deemed relevant to the
business question.
7 A natural language question such as this leaves plenty of space for different interpretations. Open questions may for instance include: Does this question include lighting electronics? Should oLED (a specific LED technology) patents be included? Should Philips’ own patents be included? Should patents that are still in the application process be included? If a patent is only applied for in one country, should it be included?

Page 20
A software tool, PLATO, has been developed to assist in the second step of patent
landscaping.
3.2.1. PLATO
Philips IP&S Business Intelligence has developed a software tool, PLATO (Patent Landscape
Analysis TOol), which converts raw information on a group of patents into a readable format.
It also provides a user interface for tasks such as classification and maintenance. PLATO can
perform a number of tasks:
1. Selection: Key pieces of information are extracted from patent databases.
2. Calculation of indicators: Indicators are calculated from patent data and metadata.
3. Aggregation: Statistics are calculated per patent family, country, technology, etc.
4. Ranking: Patents and companies are ranked by indicator values and statistics.
5. Presentation: Creation of a report containing the results of the above.
PLATO has been developed in a bottom-up fashion. Insights from social science and
business literature were combined with internal experience, resulting in the implementation of
a wide range of patent indicators.
3.2.2. Patent indicators in PLATO
PLATO contains indicators that are based on various aspects of patent families. According to
the definition used in PLATO, a patent family is a set of patent families that share at least one
priority document8. All patent family indicators are normalized to scale of zero to ten, where
higher numbers are more favorable. The following indicators are calculated for each patent
family:
8 Patents having the same priority document are generally patents in different countries that protect the same invention.

Page 21
Indicator name Indicates
Family size The number of jurisdictions in which the applicant has sought
patent protection
Legal status Legal status of the patents in the family
Opposition status Whether or not opposition has been filed against one or more
patents in the family, and whether this was successful
Backward citations Whether or not search reports for the patents in the family
contain documents marked as harmful to novelty
Forward citations The number of forward citations received by patents in the
family, corrected for age and jurisdiction
Number of inventors The number of inventors named in the patent
Table 2: PLATO Indicators
The definitions used are slightly different from literature. For example, the backward citations
indicator is not based on the number of backward citations, but rather on the presence of
backward citations deemed harmful to novelty of the patent by the examiner. Furthermore,
nonlinear transformations are applied for normalization onto a 0-10 scale. However, it does
not serve the purpose of this thesis to discuss the exact calculation methods of these
indicators in detail.
3.2.3. Overall score
Each of the indicators named in the previous section captures an aspect of the quality of a
patent family. Values of all six indicators are combined into an aggregate measure of quality,
an ‘overall score’ of the patent family. The overall score is a weighted linear average of the
individual indicators. Consequently, it has the same 0-10 scale. By default, patent families are
listed in PLATO reports ordered by descending overall score.
Initially, the weights used for averaging were based on a subjective assessment of the relative
importance of each of the indicators. Currently, the weights have been calibrated to best
match a set of patents with known value9.
9 This calibration has been based on a subset of patents from the PatVal-EU project. As part of this survey, the inventors behind about 9,000 European patents were asked the following question:
“Suppose that on the day in which this patent was granted, the applicant had all the information about the value of the patent that is available today. In case a potential competitor of the applicant was interested in buying the patent, what would be the minimum price (in Euro) the applicant should demand?” (Gambardella, Giuri, & Mariani, The Value of European Patents: Evidence from a Survey of European Inventors; Annex I: Questionnaire, 2005)

Page 22
3.2.4. Different applications
Patent landscapes are generally made to order for IP counsels. The need for an overview of
IP relevant to a particular business may stem from a range of different IP-related activities
that IP counsels within IP&S work on.
People within IP&S widely agree that one “overall score” concept cannot capture the
complexities of the IP business. Certain aspects of a patent are more important in one
situation than in the other. It is expected that selections could be made of patent indicators
that are most relevant for certain activities correspondingly, or that new indicators could be
developed to match the needs inherent to different activities.
In order to look further into these opportunities, the main activities within IP&S are discussed
in the next section.
3.3. Information needs For the many different patent-related activities within a company like Philips, different patent-
related information is relevant. For example:
• For patents that are held for claiming royalties, the main information of interest is
whether or not a third party markets products that infringe the patent.
• In case a research department wants to know in which technological directions main
competitors are focusing their research efforts, one may be especially interested in
the technological content of recently published patent applications from specific
companies or in specific sub-technologies.
• When the decision has to be made of whether or not to renew a patent, the relevant
thing to know is whether or not Philips can derive any value from its existence in the
future. Information that may be helpful for this is whether other companies currently
implement the patented technology in their products or whether they plan to do so in
the future.
• For a strategic overview, one may be most interested in the number of patents certain
competitors have applied for, how much of these have been granted, and how good
they are.
• If a third party patent is offered for sale, a company may want to learn more about in
which way the patent could contribute to the company’s IP portfolio.
The weights of the six patent indicators in the Overall Score aggregation formula have been calibrated to best approximate the inventors’ responses to this question.

Page 23
In some of these activities, factual information is absolutely required. There is no way of
proving infringement without knowing exactly which feature of a product infringes on a
particular claim of a patent. Statistical methods are typically too imprecise to be of use in such
processes, except for in early exploratory phases.
In others activities, gathering and interpreting all facts is too costly and some imprecision is
acceptable. There, patent indicators are of use. The evaluation of patents offered for sale is
such a process. The remainder of the thesis looks into the possible application of patent
indicators to this end.

Page 24
4. The value of a patent to a company As discussed in chapter 3, patent indicators can be of use to various IP-related activities
within high-tech firms such as Philips. It has also been shown that different qualities of
patents are relevant in different contexts. For some business purposes, such as for
comparing patent portfolios and for ranking patents by estimated importance, the idea of
estimating the value of a patent based on patent indicators is useful.
Especially for the subject of evaluation patents for possible acquisition, it is expected that a
method of ranking patents could save time. Therefore, the remainder of the thesis focuses on
such evaluations. The question of how patent indicators can contribute to them will be
answered in two stages. Sections 4.1 thru 4.3 answer the following partial research question:
3. Which patent characteristics and circumstances are relevant when considering
whether or not to acquire a patent?
The second part of the chapter discusses possible patent indicators that may relate to these
characteristics and factors.
4.1. What is a patent worth to a particular company? Since patents are unique, their market values are determined by what people and companies
are willing to pay for acquiring them. The exact relation between the willingness to pay of
companies and the market value is open to discussion.
One could say that if at least one party is willing to pay an amount of money for a particular
patent, then apparently it is worth that amount:
Market Value of patent P = Maximum ( Willingness to pay for full acquisition of P )
In the hypothetical situation of perfect information, it would be sufficient to know who is willing
to pay most for it (say, company C), and how much he or she is willing to pay (say, amount
Y). This would be the market value. Any good trader should be willing to pay anything up to
that amount, because it would always be possible to sell it for amount Y to company C.
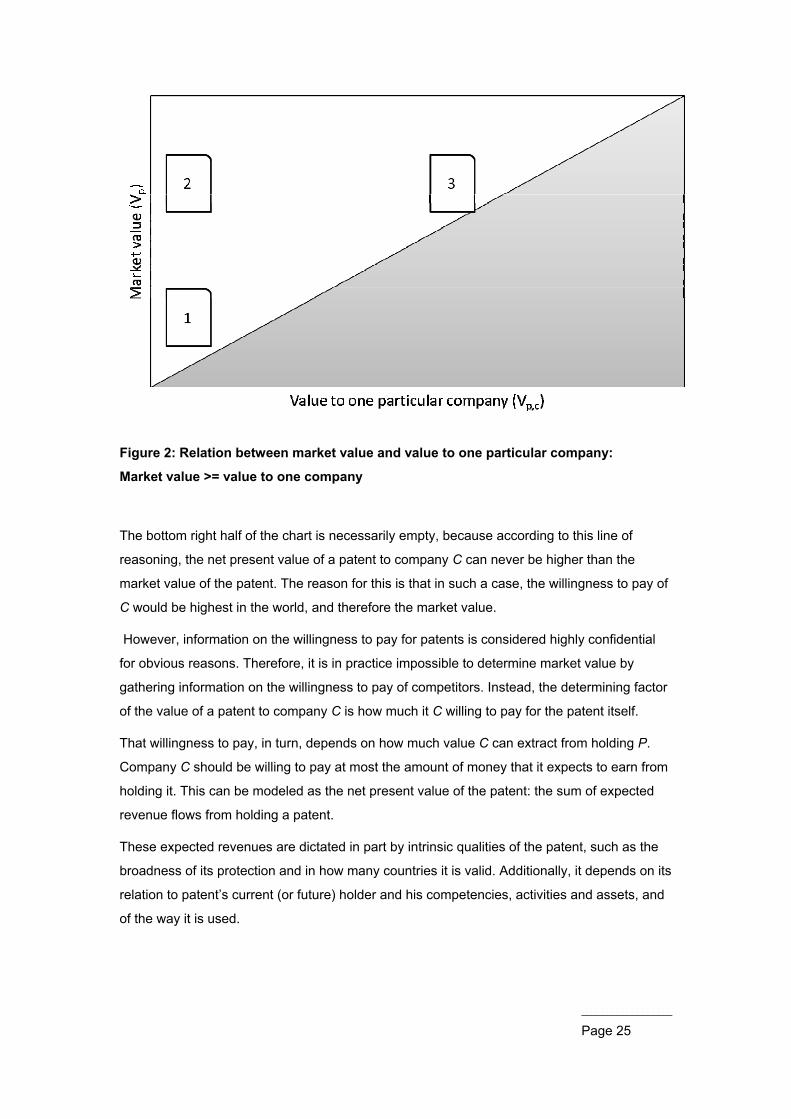
This is illustrated in Figure 2. In this graph, the horizontal axis depicts the value of a patent to
one particular company C. Patent 1 has a low market value and a low net present value to
company, which indicates that it is of low value to everybody. Patent 2 has a high market
value, but a low value to this particular company: It is valuable to one or more others, but not
to the company. Patent 3 is valuable to company C as possible to others and therefore has
high market value.
Page 25
The bottom right half of the chart is necessarily empty, because according to this line of
reasoning, the net present value of a patent to company C can never be higher than the
market value of the patent. The reason for this is that in such a case, the willingness to pay of
C would be highest in the world, and therefore the market value.
However, information on the willingness to pay for patents is considered highly confidential
for obvious reasons. Therefore, it is in practice impossible to determine market value by
gathering information on the willingness to pay of competitors. Instead, the determining factor
of the value of a patent to company C is how much it C willing to pay for the patent itself.
That willingness to pay, in turn, depends on how much value C can extract from holding P.
Company C should be willing to pay at most the amount of money that it expects to earn from
holding it. This can be modeled as the net present value of the patent: the sum of expected
revenue flows from holding a patent.
These expected revenues are dictated in part by intrinsic qualities of the patent, such as the
broadness of its protection and in how many countries it is valid. Additionally, it depends on its
relation to patent’s current (or future) holder and his competencies, activities and assets, and
of the way it is used.
Figure 2: Relation between market value and value to one particular company:
Market value >= value to one company

Page 26
A characteristic of this specification of the relation between market value and value to a
particular company is that it depends on expectations and perception of value. If a fool thinks
he can earn $10 million by acquiring a patent, apparently the market value is $10 million. Is
value in the eye of the beholder?
4.2. Determinants of value to a particular company The expected value of a patent to a company is to a large degree determined by how well it
fits within the company context. The match between a patent and a company influences its
expected value to the company through expected future benefits and cost. This can be
modeled as a “net present value”, i.e., it can be pictured as the depreciated sum of future
cash flows:
Vp,c = ∑ (Expected benefits in year t - Expected cost in year t) Discount rate
Benefits may include such factors as:
• Expected additional sales of products
• Expected higher selling price of products
• Expected royalties from licensing out the patent
• Expected benefits from enhanced bargaining positions
• Expected relief from paying royalties to the current owner
Indeed, it may be that the differences in patent value between modes of utilization, as
suggested by Reitzig (2003), are mediated by factors such as the above.
On the cost side, one should expect factors such as:
• Expected cost of obtaining royalties (litigation, administration)
• Expected cost of applying the technology in the production process
• Expected cost of patent renewal
These factors may in turn be influenced by situational factors, dependent on the specific
patent, buyer and seller. Such factors include:
• Are there any synergies with the existing patent portfolio?
• Are there any synergies with the existing product/service portfolio?
• Does the company have the expertise to use this patent in a profitable way?
• Does change of ownership of the patent lead to a change in the relationship between
the selling and buying party?
These aspects can be summarized as the relevance of a patent to a company. Because
these characteristics differ between any two companies, the value of a patent to a company is

Page 27
different between any two companies. For this reason, any estimate of a concept of patent
value to a company should be made from the perspective of this company.
4.3. Examples of patents and value concepts The difference between the concepts of value to a particular company, market value and
social value can be illustrated by a number of extreme examples. For each patent, the social
value, market value and the value to Philips of the patent rights will be explored.
1. Alfred Nobel’s patent rights on dynamite (US patent no. 78,317 from the year 1867)
has clearly been of large impact on the world. It has been a core patent in the development of
the Nobel company and has indirectly contributed to the annual awarding of the Nobel Prizes.
The invention of detonating nitroglycerin has been used numerous times and has inspired
further inventions. It is clearly of very high social value.
Also, over its lifetime, it has brought significant financial benefits to its holder. However, since
the patent rights have since long expired, both its current market value and its current value to
Philips are currently zero.
2. A recent patent right, granted to Toshiba, on an invention that specifically applies to
the HD-DVD standard.
Since Toshiba has recently decided to ‘give up’ its battle against the competing blu-ray disc
standard, it is unlikely that Toshiba will earn much from owning it. On the moment of this
decision, the market value of this patent was significantly reduced.
Nevertheless, the patent remained the same: the invention may still be valuable in a
technological sense, it may still be well-written and enforceable. Its value to Philips is
probably very low, considering that Philips is one of the participants in the prevailing blu-ray
disc standard. But there may be a company that sees new applications of the technology and
sees new opportunities for it, which may give it higher market value.
3. US patent right no. 6,067,451, held by NTP, Inc.
This is one of the patents, based on which this company managed to reach a settlement
worth US$612.5M with Research in Motion (RIM), the company behind the BlackBerry mobile
e-mail system. RIM has been willing to pay this amount of money (when confronted with the
alternative of shutting down its services). Therefore, the market value of the patent is at least
US$612.5M. Because this has been the price for a non-exclusive license, the value of the full
rights (market value) is expectedly even higher. Its value to Philips would depend on how
much more royalties it could impose from licenses to other infringing parties, would it be the
new holder.

Page 28
By contrast, the social value of this patent is disputable. One may argue that the world
benefited much more from the availability of BlackBerry phones, than from a patent held by a
company that never successfully brought their technology to the market itself.
4. A patent right, that is granted in all countries of the world, and that protects an
improvement of a crop harvesting machine that enables 2 per cent more efficient
harvesting than the current state of the art.
This fictional patent right is of clear value to a large population. Clearly, it is of large interest to
producers of crop harvesting machine. Holding this patent right is a competitive advantage,
which can e.g. be exploited by applying the invention in your own machines. Therefore, it has
a market value of several millions of US dollars. Its social value may be even higher,
depending on how it is used.
However, the invention is in a field of technology, in which Philips is not active. It is unlikely
that Philips would be able to extract much value from it, considering that is does not have
expertise in this technology, does not produce agricultural machines, and has no ties with
likely customers, et cetera. Therefore, the value of this patent to Philips is low.
4.4. Indicators of value to a particular company Now that it is clear that for the evaluation of patents for possible acquisition, the relevant
value dimension is a patent’s value, the question at hand is:
4. Which existing or new patent indicators can be expected to be of utility to the
evaluation of patents considered for acquisition?
Such indicators would need to dependent on the considering party. A patent would need to
“fit” a company, in order to expect a high expected value to it. In other words, patent
indicators of relevance to a company should take into account aspects both of the patent and
company. Schematically, this is depicted in Figure 3.
Figure 3: Schematic representation of the type of indicators desired
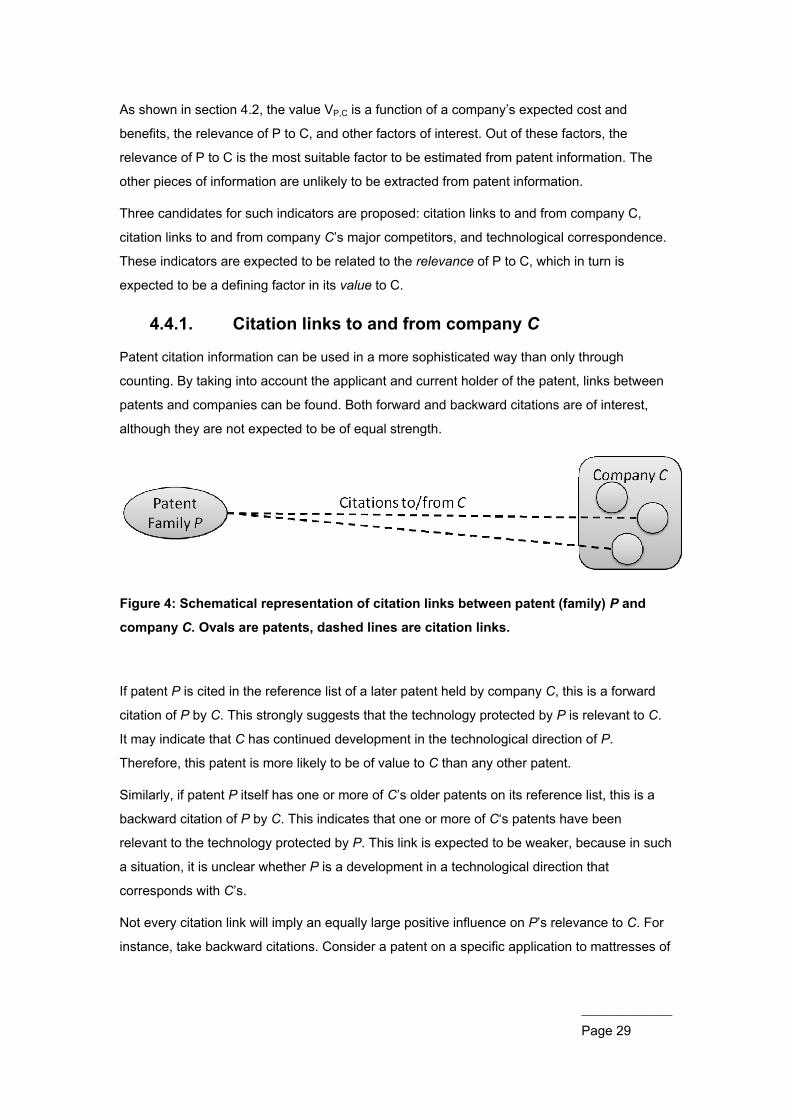
Page 29
As shown in section 4.2, the value VP,C is a function of a company’s expected cost and
benefits, the relevance of P to C, and other factors of interest. Out of these factors, the
relevance of P to C is the most suitable factor to be estimated from patent information. The
other pieces of information are unlikely to be extracted from patent information.
Three candidates for such indicators are proposed: citation links to and from company C,
citation links to and from company C’s major competitors, and technological correspondence.
These indicators are expected to be related to the relevance of P to C, which in turn is
expected to be a defining factor in its value to C.
4.4.1. Citation links to and from company C
Patent citation information can be used in a more sophisticated way than only through
counting. By taking into account the applicant and current holder of the patent, links between
patents and companies can be found. Both forward and backward citations are of interest,
although they are not expected to be of equal strength.
If patent P is cited in the reference list of a later patent held by company C, this is a forward
citation of P by C. This strongly suggests that the technology protected by P is relevant to C.
It may indicate that C has continued development in the technological direction of P.
Therefore, this patent is more likely to be of value to C than any other patent.
Similarly, if patent P itself has one or more of C’s older patents on its reference list, this is a
backward citation of P by C. This indicates that one or more of C‘s patents have been
relevant to the technology protected by P. This link is expected to be weaker, because in such
a situation, it is unclear whether P is a development in a technological direction that
corresponds with C’s.
Not every citation link will imply an equally large positive influence on P’s relevance to C. For
instance, take backward citations. Consider a patent on a specific application to mattresses of
Figure 4: Schematical representation of citation links between patent (family) P and
company C. Ovals are patents, dashed lines are citation links.
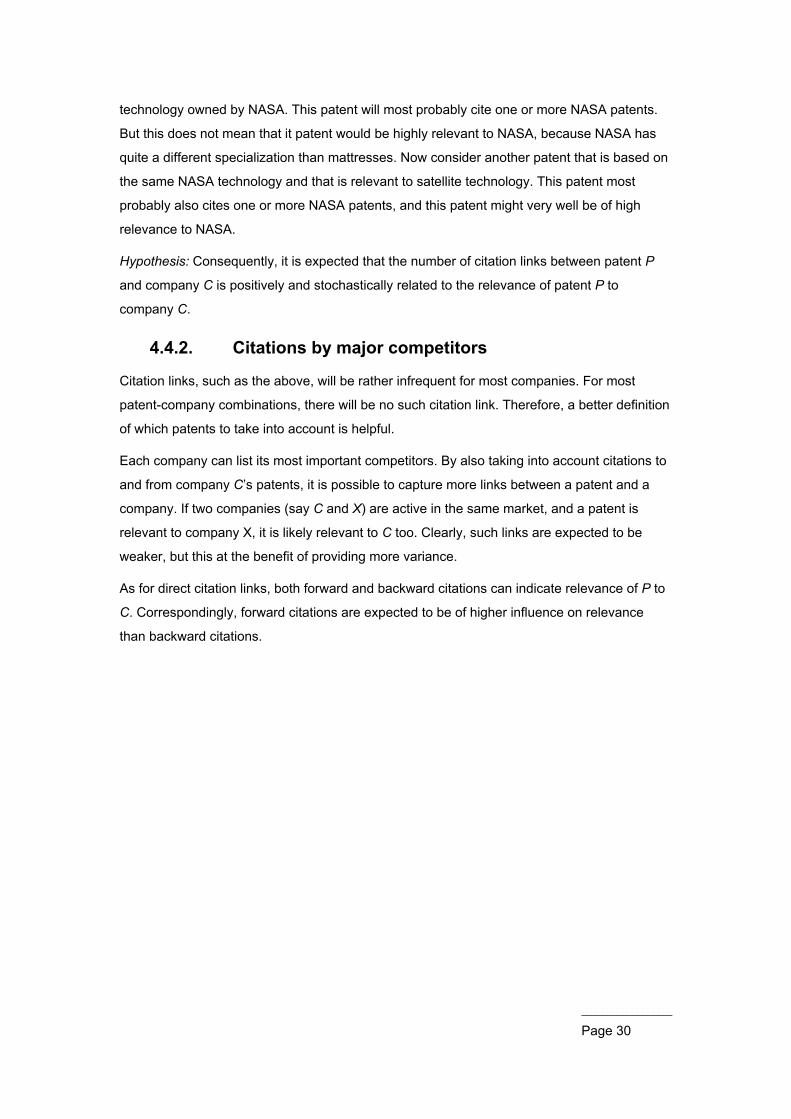
Page 30
technology owned by NASA. This patent will most probably cite one or more NASA patents.
But this does not mean that it patent would be highly relevant to NASA, because NASA has
quite a different specialization than mattresses. Now consider another patent that is based on
the same NASA technology and that is relevant to satellite technology. This patent most
probably also cites one or more NASA patents, and this patent might very well be of high
relevance to NASA.
Hypothesis: Consequently, it is expected that the number of citation links between patent P
and company C is positively and stochastically related to the relevance of patent P to
company C.
4.4.2. Citations by major competitors
Citation links, such as the above, will be rather infrequent for most companies. For most
patent-company combinations, there will be no such citation link. Therefore, a better definition
of which patents to take into account is helpful.
Each company can list its most important competitors. By also taking into account citations to
and from company C’s patents, it is possible to capture more links between a patent and a
company. If two companies (say C and X) are active in the same market, and a patent is
relevant to company X, it is likely relevant to C too. Clearly, such links are expected to be
weaker, but this at the benefit of providing more variance.
As for direct citation links, both forward and backward citations can indicate relevance of P to
C. Correspondingly, forward citations are expected to be of higher influence on relevance
than backward citations.
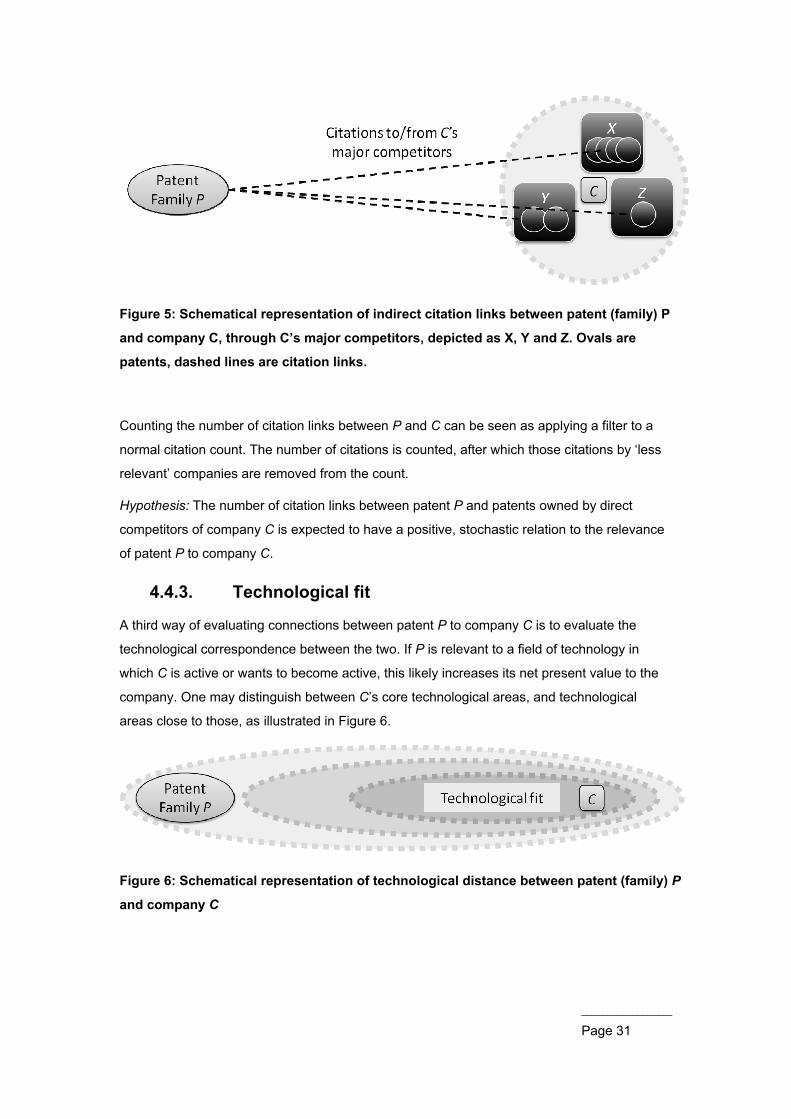
Page 31
Counting the number of citation links between P and C can be seen as applying a filter to a
normal citation count. The number of citations is counted, after which those citations by ‘less
relevant’ companies are removed from the count.
Hypothesis: The number of citation links between patent P and patents owned by direct
competitors of company C is expected to have a positive, stochastic relation to the relevance
of patent P to company C.
4.4.3. Technological fit
A third way of evaluating connections between patent P to company C is to evaluate the
technological correspondence between the two. If P is relevant to a field of technology in
which C is active or wants to become active, this likely increases its net present value to the
company. One may distinguish between C’s core technological areas, and technological
areas close to those, as illustrated in Figure 6.
Figure 5: Schematical representation of indirect citation links between patent (family) P
and company C, through C’s major competitors, depicted as X, Y and Z. Ovals are
patents, dashed lines are citation links.
Figure 6: Schematical representation of technological distance between patent (family) P
and company C

Page 32
In order to implement such a concept of technological distance, the IPC classification system
could be used, in a way similar to Trajtenberg, Henderson, & Jaffe (1997). A list could be
made of IPC classes that correspond to the fields of technology in which the company has
been active, is currently active, or wants to become active. Each patent’s IPC classification
could then be matched to the company list, to evaluate whether there is a technological “fit” of
the patent with the company.
Alternatively, a search query-based solution could be more precise. For a good definition of a
specific field of technology, using only the IPC classification system is a limited approach.
Other information, such as keywords, can be used for a better definition of a technology. A
query could be designed for each field of technology in which a company is active. For each
patent, it could be evaluated whether it falls within one or more of a company’s technology
queries.
Hypothesis: It can be expected that patents having IPC classes relevant to company C are
themselves relevant to C.
4.5. Possible application: Evaluation of patents offered for sale
These indicators could together form an estimator of the relevance of P to C, which is
expected to explain part of the value of P to C. The value of a patent to a company and its
price together determine whether acquisition of a patent at that price would likely be profitable
or not. The net present value of the acquisition of patent P by company C can be represented
as follows:
NPV of acquisition
= Value of P to C - Acquisition price
= ∑ (Expected future benefits - expected future cost) Discount rate - Acquisition price
When the NPV of acquisition is larger than zero, then it is expected that acquisition will be
profitable.
If the patent indicators proposed in section 4.4 are indeed related to the value of a patent to a
company, then these patent indicators are clearly of business use. Given the availability of
information, e.g. access to the required databases, indicator values can be calculated for any
patent. Patents having high values on one or more of these indicators can be expected to be
of high value to a company.
These indicator values could then be used to rank or select patents. This could for instance
be useful in the evaluation of patents offered for sale. When a company considers acquiring a

Page 33
patent, it is indeed the net present value of a patent that is the relevant value concept. The
expected net benefits from acquisition determine whether a patent would be worth acquiring,
and until what price.
4.6. Conclusion As shown in chapter 2, several studies have shown that patent indicators are positively
correlated with patent value. What is exactly meant by a patent’s ‘value’ differs: it may refer to
the social value of a patent, to its market value at a certain point in time, or to a vaguely
defined ‘quality’ or ‘value’.
The value of a patent to a particular company is an alternative value concept, which relates to
the usage of patents in IP practice. It is the depreciated sum of expected future benefits and
cost from holding a patent. The key aspect of this value concept is that is depends on the
identity of the (projected) holder.
A number of new patent indicators are proposed, based on patent citations, patent assignees
and IPC classifications. Each of these indicators takes into account aspects of both the patent
and a particular company. All are expected to be positively correlated with the relevance of a
patent to a company.
Statistical patent valuations based on these new indicators are expected to be of use to the
evaluations of patents offered for sale. A company could rank patents offered for sale along
these indicator values. Such a ranking could be more meaningful than a ranking by market
value, because it corresponds to the investment decision to be made.
This possible application also provides a context for validation of the relation between patent
indicators and value to the company. The next chapter describes how the relation between
these indicators and relevance and value to the company is tested by way of a survey among
patent attorneys within Philips.

Page 34
5. Empirical validation In chapter 4, it is suggested that a number of patent indicators correspond to the value of a
patent to a company. These suggestions are tested by comparing indicator values with
empirical data on the value to a company of a number of patents.
In order to validate these claims, it would be preferable to use a set of patent acquisitions by
one particular company. For these patents, indicator values could then be calculated, and the
indicator values of acquired patents could be compared to those for a random set of patents.
However, it is hard to gather such a dataset within one company, because of confidentiality
issues. A second best option is to ask a company’s own patent attorneys for their hypothetical
value estimate for a number of patents, had they been offered for sale. This approach has the
additional benefit that the selection of patents to be included in the study can be controlled.
Furthermore, because the offer is hypothetical of nature, confidentiality is a smaller issue.
For these reasons, validation of the indicator concepts is performed by way of a survey
among Philips IP&S patent attorneys. This chapter and the next aim to answer the following
partial research question:
5. How do indicator values on the proposed indicators relate to expert estimates of a
patent’s estimated value to Philips?
5.1. Survey design In order to answer this question, as said above, a survey has been conducted among IP
counsels (patent attorneys) who work for Philips IP&S. Each of these IP counsels is
presented with a number of patents, and is asked to assess their relevance and value to
Philips. For each of these patents, indicator values are also calculated. Then, expert
estimates and indicator values are statistically analyzed.
IP Counsels are invited to participate in the survey by way of an invitation e-mail. In this e-
mail, the purpose of the study is made clear and the titles of four patent families are listed. For
each patent family, a hyperlink is provided, which directs to a webpage containing information
on the patent family and digital versions of the related documents. Finally, a link is provided to
a Microsoft Sharepoint intranet webpage, where the invitee is asked to answer five questions
for each patent family.
In order to actually calculate indicator values, a Philips-specific adaptation must be made of
the indicator concepts from section 4.4. These indicators will be described in section 5.2. The
Page 35
following sections discuss the selection of invitees (5.3), the selection of patents for inclusion
in the survey (5.5 to 5.7), and the assignment of patents to invitees (5.8).
5.2. Adaptation of indicators to Philips The proposed indicators of relevance to a particular company need to be applied to Philips’
situation. Only then can indicator values be calculated.
5.2.1. Citation links to/from Philips
Calculating this indicator means counting the number of citation links between a patent and
Philips’ patents. Identification of Philips patents is performed by using two sources of
information: A Philips-internal list of Philips patents and the patent assignee as listed in the
patent database.
If a patent has an entity in the Philips group as assignee, or if the patent is listed in the
internal database of Philips-held patents, it is considered a Philips patent. Patents held jointly
by multiple companies including Philips are counted as full Philips patents.
Thus, FwdCitByPh is the number of times patent P is referenced in patents held by Philips.
BwdCitByPh is the number of Philips-held patents referenced by patent P.
5.2.2. Citation links to/from Philips’ major competitors
In order to calculate these indicators, it is required to identify patents held by Philips’ major
competitors. Philips regularly benchmarks its IP position to a number of competitors in various
markets. The same list of companies is used for calculation of these indicators. For reasons
of confidentiality, the full list of companies cannot be provided.
Unlike in the case of Philips’ own patents, there is no readymade list of all patents held by
major competitors available. Therefore, identification of major competitor-held patents must
be performed on the basis of patent assignee information in the databases.
Patents held by one company are often applied for by different companies within the holding.
These companies may include different national offices, research centers, and joint ventures
with other companies. Furthermore, because of mergers and acquisitions and name changes,
the list of companies that belongs to a holding changes over time. Another complicating factor
is that assignee information in patent databases often contains spelling errors and
ambiguities, many of which are caused by translation.
Taking into account these difficulties, a list of patent assignee strings has been put together,
that are known to correspond to major competitors. In total, 882 assignee strings are
considered as relating to major competitors.
Page 36
Patents that have been assigned to multiple companies are assumed to be held by the
assignees in equal shares. For example, if a patent is assigned to “SONY ELECTRONICS”
and “TOSHIBA CO LTD”, the patent rights are considered to be 50% held by Sony and 50%
by Toshiba. As a result, both indicators can have fractional values.
Thus, FwdCitByMC is the number of times patent P is referenced in patents, that are
assigned to one or more of the companies in the list of Philips’ major competitors. Similarly,
BwdCitByMC is the number of patents that are referenced to in patent P, and that are held
by one or more of the companies in the list.
5.2.3. Technological fit
For the “technological fit” indicator, a list of IPC classes along with their expected relevance to
the company has been created. This list has been developed in two steps. Because of the
sheer number of different IPC classes, first a pre-selection is made of IPC classes that are
likely relevant to Philips. This has been done by gathering the IPC classifications of all Philips-
held patents. This way, a shorter list of classes is reached that does not contain any classes
in which Philips does not have any patents.
Together with the IP acquisition manager, all IPC classes have been ranked by their expected
relevance to Philips. The question asked to the portfolio manager, for each IPC class, was:
How interested should Philips be in acquiring patents having this IPC class? This could be
answered as “not interesting”, corresponding to score zero, and three response categories
corresponding to increasing levels of relevance. The result is a list of IPC classifications along
with their attributed “IPC Scores”, which can vary between 0 and 3.
Because of the tree-like structure of the IPC classification system, these values can be
attributed to classes at different levels of specificity. To illustrate this, please see Table 3. In
this example, IPC classes starting with “A” are judged to be of low relevance to Philips.
However, subclasses starting with A47J are considered to be relevant (score=1), and within
this, especially classes starting with A47J31 are relevant (score=3). In this example a patent
having IPC class A47J29/04 would get score 1, but a patent having IPC class A47J31/34
would get score 3.

Page 37
Attributed
IPC score
0 1 2 3 IPC class IPC class description
x A Human necessities
A47 Furniture, domestic articles or appliances, coffee mills, spice
mills, suction cleaners in general
x A47J Kitchen equipment, coffee mills, spice mills, apparatus for
making beverages
x A47J31 Apparatus for making beverages
A47J31/40 Beverage-making apparatus with dispensing means for adding a
measured quantity of ingredients, e.g. coffee, water, sugar,
cocoa, milk, tea
Table 3: Illustration of IPC Score list
Since a patent usually has more than one IPC class assigned, the highest score is taken as a
patent’s IPC score. The resulting indicator IPCscore is thus an integer between 0 and 3.
5.3. Survey questions The purpose of the survey is to gather expert judgments. Each patent attorney is asked to
assess for four patents:
1. Relevance of the patent to Philips (RelevanceToPhilips)
2. Whether the patent is worth investigating further for possible acquisition
(InvestigateFurther)
3. An estimate of Philips’ willingness to pay (ValueToPhilips)
Two additional questions are asked, which may be included as control variables:
4. Information used for forming opinion in questions 1-3
5. Most likely purpose of the patent for Philips
For both question 4 and 5, a closed list of possible responses is given. Question 4 is asked
out of interest into the sources used by patent attorneys, where question 5 to check for
differences in patent value dependent on mode of usage (see section 2.2.2).

Page 38
5.4. Invited participants The survey has been performed among all IP counsels employed at Philips IP&S at the time
of the survey (August, 2008). This is a heterogeneous group, containing people with different
backgrounds, located in different countries around the world. Most IP counsels have a
technical background and have followed additional education to be qualified patent attorneys.
A majority of them are university graduates, and many have worked in Philips research or
product divisions before.
The group of IP counsels also contains trademark and legal experts. For the purpose of this
survey, only patent attorneys can be expected to give reasonably accurate answers.
Therefore, additional information was gathered in order to exclude IP counsels who are
clearly not patent attorneys. This information was not available for all IP counsels. In cases of
doubt, an invitation was sent anyway.
Altogether, 129 people are invited by e-mail to perform in the study. It is reasonable in terms
of time consumption to ask each patent attorney to assess four patent families. Therefore,
520 patents are selected.
5.5. Patent selection The patent families to be included in the survey were selected from the Derwent World Patent
Index. A number of selection criteria were applied with the objective of presenting the survey
invitees with patent families that could reasonably be expected to be offered for sale to
Philips. Such criteria include that it is from a relevant time frame, in one or more relevant
countries, and that it is classified as being at least remotely related to Philips’ activities. These
criteria are listed in Table 4 as the ones marked for set A.
It should be noted that this selection method includes all published patent documents,
including published patent applications. Therefore, set A may also include patent families, of
which none of the patents has yet been granted.
Furthermore, because of the skewed distribution of patent value that has been discussed in
section 2.3.2, a random sample of patents would be expected to include many patents of low
market value, and only few high-valued patents. In order to draw some patents from the high
value tail, additional criteria were applied to half of the set. The first criterion is that the family
contains at least one granted patent document from a relevant country. The second is that the
patent has been applied for in at least two countries, so as to exclude ‘home inventions’
(patents that have only been applied for in the applicant’s country). The patents retrieved
using these additional criteria are market as set B in Table 4.

Page 39
Set A Set B Criterion
X X The patent family has at least one 4-digit IPC class that is included in a list of
commonly used IPC classes for patents owned by Philips and four major
competitors10.
X X The patent family has at least one member that has a priority date of
January 1, 1996 or later.
X X The patent family has at least one member that is a patent publication (either
published application or grant) from USPTO, EPO, WIPO or SIPO
X The patent family contains at least one granted patent from USPTO, EPO or
SIPO11
X The patent family has members in at least two countries
Table 4: Criteria for selection of random patents from patent databases
Figure 7 shows that from both sets of all patents that matched criteria sets A and B, two
thousand patent families each were selected using a random number generator. For each of
these 4,000 patent families, information was retrieved from patent databases and indicator
values were calculated.
As discussed in section 4.2, a change in the relation between buyer and seller could also
impact the net present value of a patent to a potential buying company. If patents that are
currently held by companies with which Philips has other arrangements (e.g. cross-license
agreements), would be included in the set, this may cause large distortions in value
estimations. Therefore, patent families having one or more of Philips’ major competitors as
assignees are removed from the sample. Families having Philips itself as assignee are
removed too. The resulting set consists of 3,286 patent families.
10 Patents having at a main IPC code that starts with the following 4 digits: A21B A23B A23L A47B A47J A47J A47K A47L A61B A61C A61H A61J A61K A61L A61M A61N A61P A63F B01D B01F B01J B01L B03C B05B B05C B05D B07C B08B B23H B23K B23P B25J B26B B29C B29D B32B B41F B41J B41M B44C B60C B60H B60K B60L B60Q B60R B60T B61C B61D B61L B63H B64C B64F B65G B65H B66B B67D B81B B81C B82B C01B C01F C02F C03B C03C C04B C07B C07F C08F C08G C08J C08K C08L C09D C09J C09K C10J C11D C12M C12N C12Q C22C C23C C23F C23G C25D D06F E03D E05B F01C F01D F01K F01N F02C F02D F02K F02M F02P F03B F03D F04B F04C F04D F16C F16D F16H F16J F16K F16L F16M F17C F21K F21S F21V F21W F21Y F23N F23R F24B F24C F24F F25B F25C F25D F26B F27D F28D F28F G01B G01C G01D G01F G01H G01J G01K G01L G01M G01N G01P G01R G01S G01T G01V G02B G02F G03B G03C G03F G03G G03H G05B G05D G05F G06F G06G G06K G06N G06Q G06T G07B G07C G07D G07F G08B G08C G08G G09C G09F G09G G10H G10K G10L G11B G11C G12B G21C G21K H01B H01C H01F H01G H01H H01J H01K H01L H01M H01P H01Q H01R H01S H02B H02G H02H H02J H02K H02M H02N H02P H03B H03F H03G H03H H03K H03L H03M H04B H04H H04J H04K H04L H04M H04N H04Q H04R H04S H05B H05G H05H H05K
11 Publication types included: EPB1, EPB2, USA, USB1, USB2, CNC

Page 40
5.6. Descriptives of the random sample For these 3,286 patent families, values of the above indicators are calculated. The indicator
values are distributed as follows.
IPCscore
Number of cases Percentage of cases
0 1,803 54.9 %
1 1,072 32.6 %
2 176 5.4 %
3 235 7.2 %
Total 3,286 100 %
Table 5: Distribution of IPCscore in the pre-selection of 3,286 patent families
Clearly, only a minority of patent families (12.6%) has one or more IPC classifications that are
named as highly relevant to the company.
Figure 7: Selection of random patents from patent database

Page 41
FwdCitByPh
Number of cases Percentage of cases
0 3,262 99.3 %
1 23 .7 %
2 1 .0 %
Total 3,286 100 %
Table 6: Distribution of FwdCitByPh in the pre-selection of 3,286 patent families
As would be expected, the distribution of this indicator is extremely skewed. Only 24 patent
families contain patents which have been cited by later Philips patents. Only a single patent in
this sample is cited by two Philips-held patents.
FwdCitByMC
Number of cases Percentage of cases
0 2,881 87.7 %
>0 and <= 1 228 6.9 %
>1 and <= 2 80 2.4 %
>2 and <= 5 72 2.2 %
>5 and <= 10 16 .5 %
>10 and <= 25 8 .2 %
>25 1 .0 %
Total 3,286 100 %
Table 7: Distribution of FwdCitByMC in the pre-selection of 3,286 patent families
Like that of FwdCitByPh, the distribution of FwdCitByMC is skewed, which corresponds to
expectations. There is much greater variation in indicator value, although for the majority of
patents, the indicator value is zero.
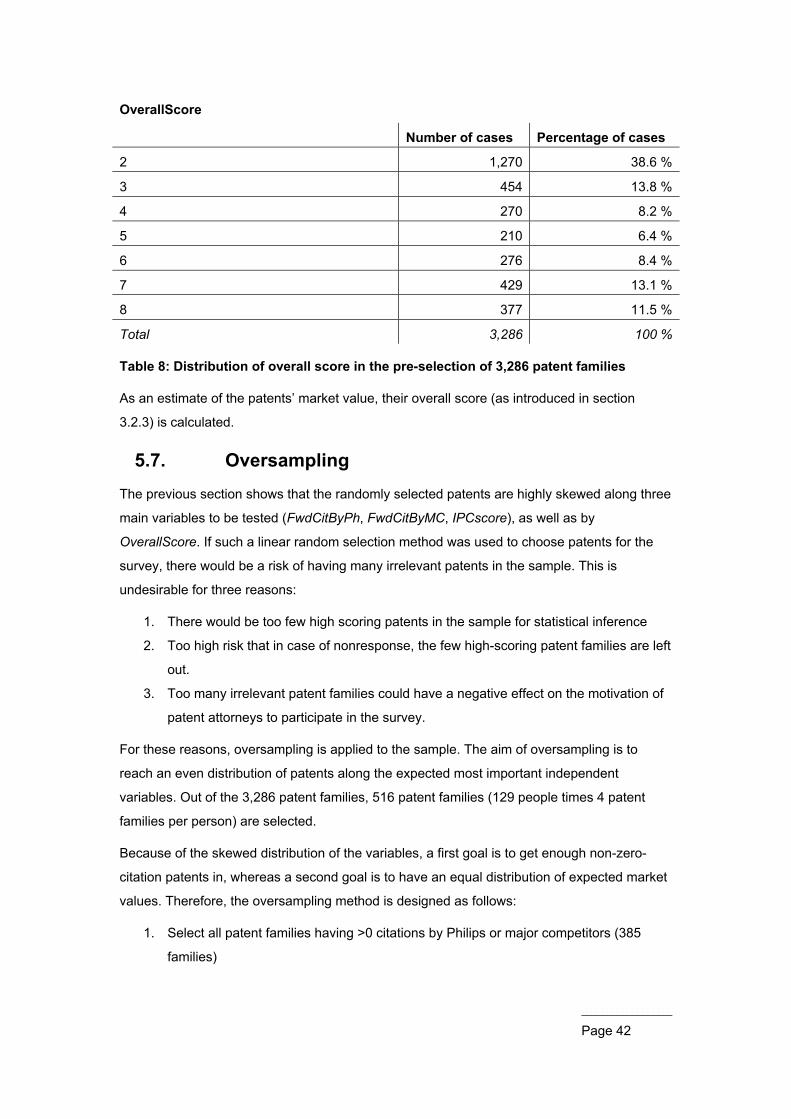
Page 42
OverallScore
Number of cases Percentage of cases
2 1,270 38.6 %
3 454 13.8 %
4 270 8.2 %
5 210 6.4 %
6 276 8.4 %
7 429 13.1 %
8 377 11.5 %
Total 3,286 100 %
Table 8: Distribution of overall score in the pre-selection of 3,286 patent families
As an estimate of the patents’ market value, their overall score (as introduced in section
3.2.3) is calculated.
5.7. Oversampling The previous section shows that the randomly selected patents are highly skewed along three
main variables to be tested (FwdCitByPh, FwdCitByMC, IPCscore), as well as by
OverallScore. If such a linear random selection method was used to choose patents for the
survey, there would be a risk of having many irrelevant patents in the sample. This is
undesirable for three reasons:
1. There would be too few high scoring patents in the sample for statistical inference
2. Too high risk that in case of nonresponse, the few high-scoring patent families are left
out.
3. Too many irrelevant patent families could have a negative effect on the motivation of
patent attorneys to participate in the survey.
For these reasons, oversampling is applied to the sample. The aim of oversampling is to
reach an even distribution of patents along the expected most important independent
variables. Out of the 3,286 patent families, 516 patent families (129 people times 4 patent
families per person) are selected.
Because of the skewed distribution of the variables, a first goal is to get enough non-zero-
citation patents in, whereas a second goal is to have an equal distribution of expected market
values. Therefore, the oversampling method is designed as follows:
1. Select all patent families having >0 citations by Philips or major competitors (385
families)

Page 43
2. Add random patents, with the aim of getting a varied sample in terms of IPC factor
and overall score (131 families)
The result of these efforts is that 520 patents have been selected, having the following overall
score / IPC factor combinations:
Overall Score
2 3 4 5 6 7 8 Total
IPC
sco
re 0 20 16 20 19 19 31 35 160
1 31 34 27 19 19 29 33 192
2 19 9 8 4 1 14 6 61
3 19 19 6 2 19 19 19 103
Total 89 78 61 44 58 93 93 516
Table 9: Distribution of selected patent families over Overall Score and IPCscore after
oversampling
5.8. Patent assignment Now that 516 patent families have been selected through oversampling, they need to be
assigned to patent attorneys. Each patent attorney is assigned four patent families. These
patent families need to be as close as possible to the expertise and experience of the patent
attorney to obtain the best results.
An assignment algorithm has been used to find the best matching patent attorney to each
patent family. The base of this algorithm is the internal administration of Philips patent
families. For each family, a patent attorney is listed as responsible. It is assumed that if a
patent attorney is responsible for a Philips patent having at least one same IPC class as the
patent under study, the patent likely falls within his or her expertise.
One by one, the patent families were assigned to patent attorneys using the following
algorithm:
1. Randomize the order of the patents
2. Retrieve all IPC classifications attributed to patent family P
3. Find a Philips patent family that has at least one full IPC classification (e.g.
H04L15/16) that is identical to one of P’s classifications.
a. If it is found, see which patent attorney is listed as responsible. Have less
than four patents been assigned to this person? Then assign P to this person.
4. For the patent families that have not been assigned in step 2, repeat step 2, but only
take into account the first four segments of the IPC classification (e.g. H04L15)
Page 44
5. For the patent families that have not been assigned in step 2 or 3, repeat step 2, but
only take into account the first three segments of the IPC classification (e.g. H04L)
6. For the patent families that have not been assigned in steps 2 to 4: assign f to a
random patent attorney, until each patent attorney has been assigned four patent
families.
Out of the 516 patent families to be assigned using this method, 361 (70.0 %) were assigned
based on IPC correspondence in steps 3 to 5 of the assignment algorithm. The remainder
was assigned randomly in step 6.
On a patent attorney level, 86 patent attorneys (66.7%) were assigned four patent families
based on IPC correspondence. Nine people (7.0%) were assigned between one and three
families based on IPC correspondence, and the others randomly. The remaining 34 patent
attorneys (26.4%) were assigned random families.

Page 45
6. Results This chapter contains the results of the statistical analysis of the validation exercise. The
judgments of Philips patent attorneys are compared to indicator values for the same patents.
Out of 129 invitees, 65 people responded, leading to a total of 253 assessments.
6.1. Description of survey results In this section, an inventory is made of the patent attorneys’ answers to the questionnaire.
Table 10 shows the estimate of the relevance of patents to Philips. About half of the patents
are estimated to be irrelevant. The distribution is skewed with a bias towards lower relevance.
Relevance
Response category Frequency Percent
Valid
1 (Irrelevant) 116 51.3 %
2 59 26.1 %
3 34 15.0 %
4 15 6.6 %
5 (Highly relevant) 2 .9 %
Total valid 226 100.0 %
Invalid 27
Table 10: Overview of responses to question 1 of the questionnaire
The question of whether the patent would be worth investigating further was answered with
“yes” in just under one third of cases.
InvestigateFurther
Response category Frequency Percent
Valid
No 174 71.0 %
Yes 71 29.0 %
Total valid 245 100.0 %
Invalid 8
Table 11: Overview of responses to question 2 of the questionnaire

Page 46
The distribution of acquisition value to Philips is skewed in a way similar to the Relevance
variable. It can be noted that the higher value categories (6 thru 8) were never chosen.
Value
Response category Frequency Valid Percent
Valid
0: Nothing 121 50.0 %
1: € 1 - € 30,000 54 22.3 %
2: € 30,000 - € 100,000 37 15.3 %
3: € 100,000 - € 300,000 15 6.2 %
4: € 300,000 - € 1,000,000 10 4.1 %
5: € 1,000,000 - € 3,000,000 5 2.1 %
6: € 3,000,000 - € 10,000,000 0 0.0 %
7: € 10,000,000 - € 30,000,000 0 0.0 %
8: € 30,000,000 - € 100,000,000 0 0.0 %
Total 242 100.0 %
Invalid 11
Table 12: Overview of responses to question 3 of the questionnaire
Table 13 presents Pearson correlation efficients between the three value judgment questions.
Each pair of two variables is significantly correlated. InvestigateFurther is slightly more
strongly correlated with Relevance than with Value.
Relevance InvestigateFurther Value
Relevance 1.000***
InvestigateFurther .751*** 1.000***
Value .701*** .664*** 1.000***
Table 13: Pearson correlation between responses to questions 1-3. ***: Significant at
the .01 level (2-tailed)
Tables Table 14 and Table 15 show the answers to questions 4 and 5. Both of these
questions were closed multiple choice questions, showing a limited number of possible
answers. The number of responses are shown in absolute terms and as a percentage of total
cases for which the question was answered.

Page 47
Question 4 was answered for 219 patent families. The response frequencies show that patent
attorneys mainly use information for their assessment that is hard to interpret simply by
number crunching. This shows that the ‘black box’ and ‘white box’ ways of patent assessment
are complementary.
Frequency Percentage
Current applications of the technology 124 56.6 %
Scope of protection 113 51.6 %
Quality of the technology 61 27.9 %
Detectibility of the inventions 57 26.0 %
Legal status 43 19.6 %
Age of the patent family 33 15.1 %
Current holder(s) 20 9.1 %
Backward citations 4 1.8 %
Forward citations 3 1.4 %
Table 14: Response frequencies to question 4 regarding information used in
assessment of patent
Question 5 was answered for 176 patent families. The response frequencies can be found in
Table 15.
Application Frequency Percentage
License in exchange for royalties 64 36.4 %
Enhance the IP portfolio in a certain field of
technology
59 33.5 %
Enhance bargaining position for cross-
licensing or standards-related negotiations
57 32.4 %
Apply the invention in Philips products 27 15.3 %
Ensure other companies (e.g. major
competitors, patent trolls) do not acquire it
24 13.6 %
Block others from inventing around a Philips
invention
14 8.0 %
Table 15: Response frequencies to question 5 regarding likely mode of usage for the
patent

Page 48
6.2. Response analysis Since the survey design allows the invited patent attorneys to decide for themselves whether
to respond or not, it may be the case that the patents for which there are observations differ
from the unobserved. The occurrence of self-selection biases cannot be tested, but it is
possible to find hints of such biases through analysis of response. The question to be
answered is: Were there any differences between the patents that were assessed, and the
ones that people did not respond to?
From data, no such biases appear to be in place, except for the case of the assignment
method as described in section 5.8. From Table 16 and Table 17 it appears that response
rates have been lower for those patent families that were assigned using the IPC
classification-based algorithm. This is unexpected. Possible explanations could be:
1. It is easier for patent attorneys to say that a patent family is clearly not relevant to
Philips, than it is to assess a patent that is relevant. The assignment algorithm gave
people “difficult” patents that would need a nuanced assessment. Therefore, these
patent attorneys spared their time and more relevant patents are not assessed.
2. The randomly assigned patents are less relevant to Philips. Therefore, it has been
easier for patent attorneys to judge them, leading to higher response.
3. The method does not work; i.e. correspondence of at least one IPC class is not a
good way of matching patents.
This possible bias needs to be taken into account when interpreting the results.
Assignment Number of families Response Response rate
By IPC class 361 155 42.9 %
Randomly 155 98 63.2 %
Total 516 253 49.0 %
Table 16: Response rates by patent family assignment method, patent family level
Assignment Nr of invitees Partial response
(1 to 3 families)
Full response
(all 4 families)
Response rate
All by IPC class 86 0 37 43.0 %
Mixed 9 1 5 66.7 %
All randomly 34 2 20 64.7 %
Total 129 3 62 50.4 %
Table 17: Response rates by patent family assignment method, patent attorney level.
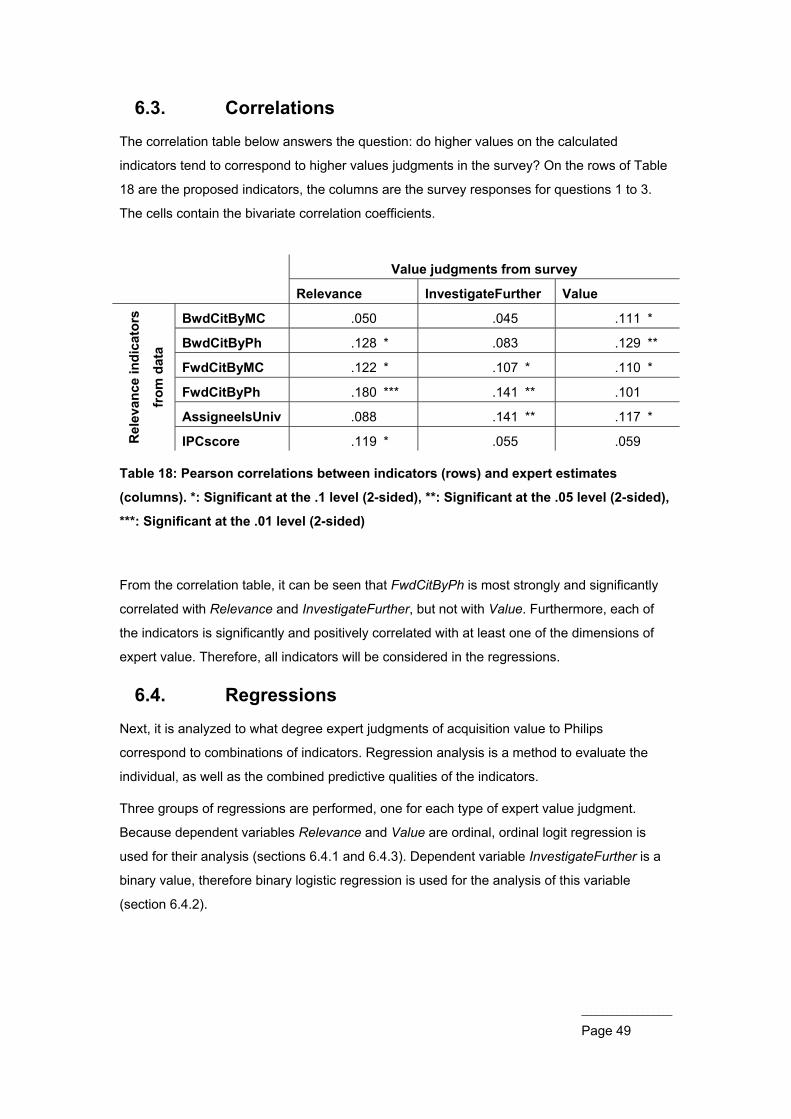
Page 49
6.3. Correlations The correlation table below answers the question: do higher values on the calculated
indicators tend to correspond to higher values judgments in the survey? On the rows of Table
18 are the proposed indicators, the columns are the survey responses for questions 1 to 3.
The cells contain the bivariate correlation coefficients.
Value judgments from survey
Relevance InvestigateFurther Value
Rel
evan
ce in
dica
tors
from
dat
a
BwdCitByMC .050 .045 .111 *
BwdCitByPh .128 * .083 .129 **
FwdCitByMC .122 * .107 * .110 *
FwdCitByPh .180 *** .141 ** .101
AssigneeIsUniv .088 .141 ** .117 *
IPCscore .119 * .055 .059
Table 18: Pearson correlations between indicators (rows) and expert estimates
(columns). *: Significant at the .1 level (2-sided), **: Significant at the .05 level (2-sided),
***: Significant at the .01 level (2-sided)
From the correlation table, it can be seen that FwdCitByPh is most strongly and significantly
correlated with Relevance and InvestigateFurther, but not with Value. Furthermore, each of
the indicators is significantly and positively correlated with at least one of the dimensions of
expert value. Therefore, all indicators will be considered in the regressions.
6.4. Regressions Next, it is analyzed to what degree expert judgments of acquisition value to Philips
correspond to combinations of indicators. Regression analysis is a method to evaluate the
individual, as well as the combined predictive qualities of the indicators.
Three groups of regressions are performed, one for each type of expert value judgment.
Because dependent variables Relevance and Value are ordinal, ordinal logit regression is
used for their analysis (sections 6.4.1 and 6.4.3). Dependent variable InvestigateFurther is a
binary value, therefore binary logistic regression is used for the analysis of this variable
(section 6.4.2).
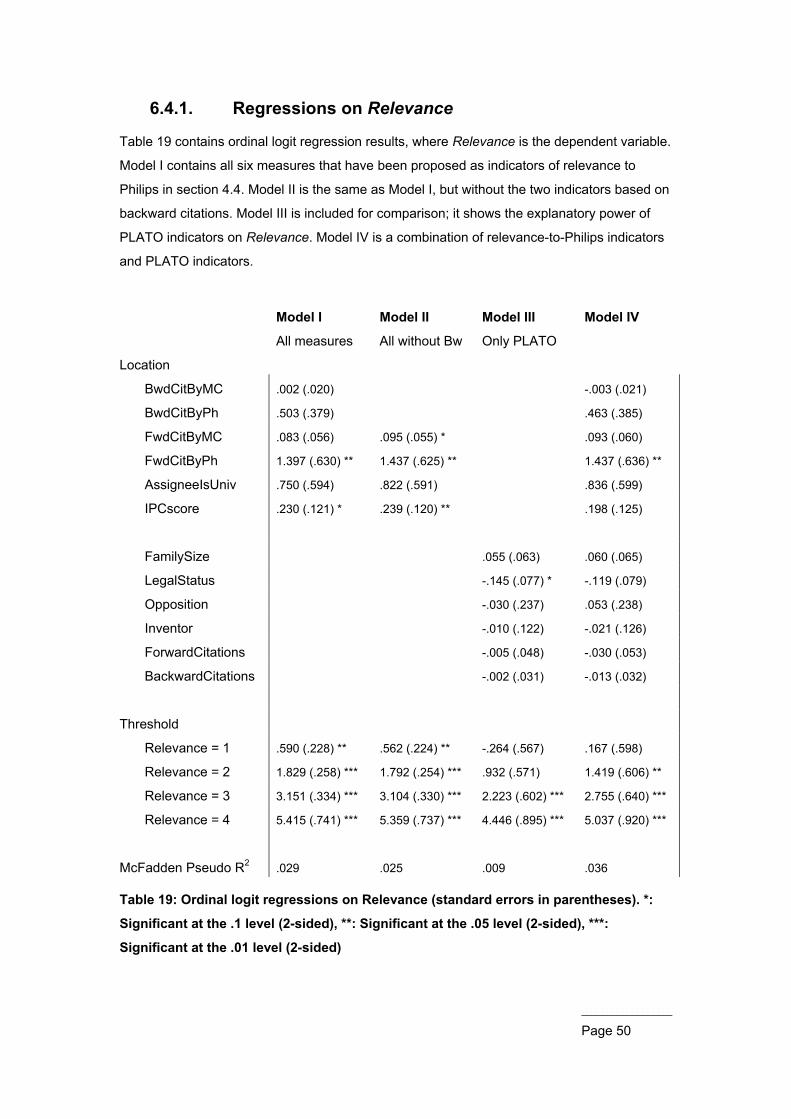
Page 50
6.4.1. Regressions on Relevance
Table 19 contains ordinal logit regression results, where Relevance is the dependent variable.
Model I contains all six measures that have been proposed as indicators of relevance to
Philips in section 4.4. Model II is the same as Model I, but without the two indicators based on
backward citations. Model III is included for comparison; it shows the explanatory power of
PLATO indicators on Relevance. Model IV is a combination of relevance-to-Philips indicators
and PLATO indicators.
Model I Model II Model III Model IV
All measures All without Bw Only PLATO
Location
BwdCitByMC .002 (.020) -.003 (.021)
BwdCitByPh .503 (.379) .463 (.385)
FwdCitByMC .083 (.056) .095 (.055) * .093 (.060)
FwdCitByPh 1.397 (.630) ** 1.437 (.625) ** 1.437 (.636) **
AssigneeIsUniv .750 (.594) .822 (.591) .836 (.599)
IPCscore .230 (.121) * .239 (.120) ** .198 (.125)
FamilySize .055 (.063) .060 (.065)
LegalStatus -.145 (.077) * -.119 (.079)
Opposition -.030 (.237) .053 (.238)
Inventor -.010 (.122) -.021 (.126)
ForwardCitations -.005 (.048) -.030 (.053)
BackwardCitations -.002 (.031) -.013 (.032)
Threshold
Relevance = 1 .590 (.228) ** .562 (.224) ** -.264 (.567) .167 (.598)
Relevance = 2 1.829 (.258) *** 1.792 (.254) *** .932 (.571) 1.419 (.606) **
Relevance = 3 3.151 (.334) *** 3.104 (.330) *** 2.223 (.602) *** 2.755 (.640) ***
Relevance = 4 5.415 (.741) *** 5.359 (.737) *** 4.446 (.895) *** 5.037 (.920) ***
McFadden Pseudo R2 .029 .025 .009 .036
Table 19: Ordinal logit regressions on Relevance (standard errors in parentheses). *:
Significant at the .1 level (2-sided), **: Significant at the .05 level (2-sided), ***:
Significant at the .01 level (2-sided)

Page 51
These regressions show that FwdCitByPh is the strongest estimator of relevance to Philips.
This indicator is significantly related to expert-judged relevance in all three models.
Furthermore, FwdCitByMC and IPCscore are significantly related to Relevance in the
parsimonious Model II.
AssigneeIsUniv is not significantly related to Relevance in any model.
The group of newly suggested indicators is related to Relevance, whereas a sample of legacy
indicators (model III) clearly is not. Only LegalStatus is significant in this model, but it has an
unexpected negative sign. Model IV, which includes all variables from models I and III, hardly
outperforms model I in terms of explained variance.
The low pseudo R2 values show that only a small piece of total variance in the sample is
captured by the indicators. Clearly, these patent indicators cannot replace patent attorneys for
this task.
6.4.2. Regressions on InvestigateFurther
Table 20 shows binary logistic regression results, where InvestigateFurther is the dependent
variable. Thus, it reports each variable’s contribution to the probability that a patent is worth
investigating further for possible acquisition in the eyes of Philips. Models I to IV follow the
same structure as for Relevance.
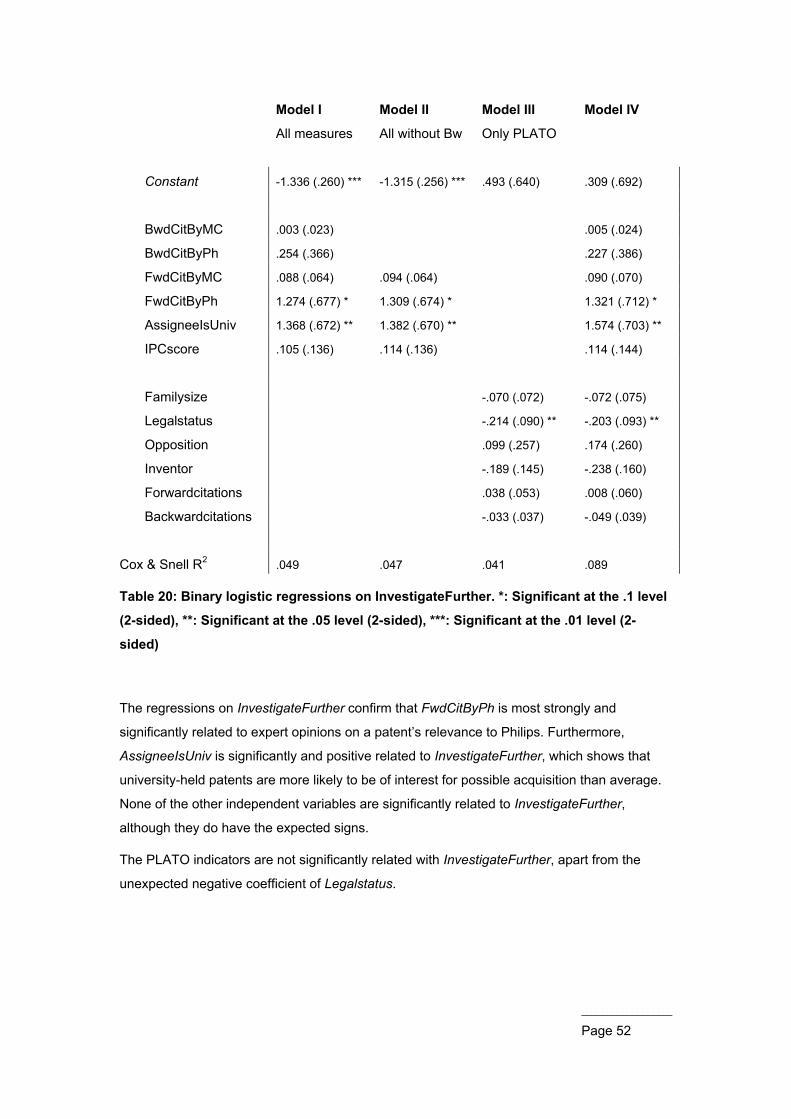
Page 52
Model I Model II Model III Model IV
All measures All without Bw Only PLATO
Constant -1.336 (.260) *** -1.315 (.256) *** .493 (.640) .309 (.692)
BwdCitByMC .003 (.023) .005 (.024)
BwdCitByPh .254 (.366) .227 (.386)
FwdCitByMC .088 (.064) .094 (.064) .090 (.070)
FwdCitByPh 1.274 (.677) * 1.309 (.674) * 1.321 (.712) *
AssigneeIsUniv 1.368 (.672) ** 1.382 (.670) ** 1.574 (.703) **
IPCscore .105 (.136) .114 (.136) .114 (.144)
Familysize -.070 (.072) -.072 (.075)
Legalstatus -.214 (.090) ** -.203 (.093) **
Opposition .099 (.257) .174 (.260)
Inventor -.189 (.145) -.238 (.160)
Forwardcitations .038 (.053) .008 (.060)
Backwardcitations -.033 (.037) -.049 (.039)
Cox & Snell R2 .049 .047 .041 .089
Table 20: Binary logistic regressions on InvestigateFurther. *: Significant at the .1 level
(2-sided), **: Significant at the .05 level (2-sided), ***: Significant at the .01 level (2-
sided)
The regressions on InvestigateFurther confirm that FwdCitByPh is most strongly and
significantly related to expert opinions on a patent’s relevance to Philips. Furthermore,
AssigneeIsUniv is significantly and positive related to InvestigateFurther, which shows that
university-held patents are more likely to be of interest for possible acquisition than average.
None of the other independent variables are significantly related to InvestigateFurther,
although they do have the expected signs.
The PLATO indicators are not significantly related with InvestigateFurther, apart from the
unexpected negative coefficient of Legalstatus.

Page 53
6.4.3. Regressions on Value
Finally, Table 21 contains regression results on Value. The structure of models I-IV is the
same as in the above.
Model I Model II Model III Model IV
All measures All without Bw Only PLATO All + PLATO
Location
BwdCitByMC .021 (.023) .018 (.024)
BwdCitByPh .366 (.313) .374 (.319)
FwdCitByMC .080 (.054) .093 (.054) * .063 (.058)
FwdCitByPh .920 (.586) .987 (.584) * .879 (.591)
AssigneeIsUniv .966 (.584) * 1.040 (.583) * .996 (.588) *
IPCscore .103 (.115) .129 (.114) .103 (.118)
Familysize .012 (.060) .013 (.061)
Legalstatus -.102 (.060) -.088 (.076)
Opposition .004 (.224) .068 (.225)
Inventor -.015 (.106) -.035 (.108)
Forwardcitations .054 (.045) .027 (.049)
Backwardcitations .003 (.030) -.002 (.031)
Threshold
Value = 1 .432 (.216) ** .390 (.212) * -.036 (.528) .214 (.553)
Value = 2 1.445 (.235) *** 1.390 (.230) *** .941 (.531) * 1.233 (.559) **
Value = 3 2.465 (.279) *** 2.400 (.273) *** 1.944 (.547) *** 2.259 (.577) ***
Value = 4 3.236 (.337) *** 3.168 (.331) *** 2.708 (.576) *** 3.033 (.606) ***
Value = 5 4.385 (.497) *** 4.317 (.493) *** 3.851 (.682) *** 4.184 (.707) ***
McFadden Pseudo R2 .022 .018 .008 .026
Table 21: Ordinal logit regressions on Value (standard errors in parentheses). *:
Significant at the .1 level (2-sided), **: Significant at the .05 level (2-sided), ***:
Significant at the .01 level (2-sided)
As expected, the overall explanatory power of the proposed indicators is lower than for the
other indicators. In other words, it is likely that more factors are of influence on Philips’

Page 54
willingness to pay than the ones includes in these models as independent variables. This
agrees with the theoretical finding that relevance to Philips is an important, but not the only
determining factor in a patent’s value to Philips.
In most cases, there are no significant effects of the proposed indicators, except for
FwdCitByPh and FwdCitByMC in model II, and AssigneeIsUniv. Nevertheless, their
coefficients have the expected signs, indicating that they may still be related with Value. This
model does however not exclude the possibility that these relations are incidental.
The small and negative coefficients of the PLATO indicators give a clearer picture that these
indicators are probably not related to a patent’s value to Philips. This seems to be confirmed
by the fact that model IV hardly outperforms model I in terms of pseudo-R2. This is essentially
the same observation as for the regressions on Relevance.

Page 55
7. Conclusions and recommendations The question, with which this research project started out, is:
How can strategic insight from patent indicators be applied in the evaluation of patents
considered for acquisition by a company?
The research described in this thesis leads to two main conclusions:
Conclusion 1: The value of a patent to a particular company is not covered by existing
patent indicators.
The value of a patent has several dimensions. Patent indicators, such as forward citation
counts, are proven to be statistically related to the social value of a patent, i.e. the equivalent
monetary value of the patent’s invention’s contribution to well-being. Aggregate indicators of
patent value have been shown to be related to the market value of patents.
However, for the business problem of evaluating patents for possible acquisition, neither one
of these value concepts is relevant. Instead of a patent’s social or market value, a company
considers the value of a patent to a particular company. This contribution depends on a
patent’s relevance to a company, expected future benefits, necessary investments, cost of
ownership, et cetera. No indicators in literature have been shown to correspond to this value
concept.
This conclusion is supported by the statistical results of a survey among Philips patent
attorneys. They assessed the relevance and value to Philips of a set of 253 patent families. A
selection of patent indicators, proven earlier to correspond to market value, did not
correspond to expert estimates of patents’ value to Philips.
Conclusion 2: A number of new patent indicators are shown to be related to a patent’s
value to a particular company
A number of new patent indicators have been proposed that are hypothesized and found to
be significantly related to expert estimates of relevance to a particular company. They are
also related to the value to a particular company, but slightly less convincingly so.
These indicators are based on publicly available patent information, such as citations,
assignees and IPC classifications. This is combined with company-specific information such
as a company’s name(s), its major competitors, and technological areas it is or wants to
become active in.

Page 56
7.1. Implications for business Because these indicators are significantly related to a patent’s value to a particular company,
and existing indicators are not, it is advisable to use these indicators in evaluating patents for
possible sale. The existing indicators are still informative, but they should be considered as
estimating market value, and may thus have high scores for irrelevant patents.
The explanatory power of indicators of value to a particular company is lower than that of
indicators of market value. Several determining aspects of this value are not captured by the
information used in calculating the indicators. Therefore, using these indicators cannot
replace the judgment of an experienced patent attorney.
It can, however, be used for making informed pre-selections of patents that do and do not
require further screening, by ranking patents by estimated value to the company. As a litmus
test, 3,286 patents were ordered by estimated market value and estimated value to Philips.
According to a senior portfolio manager, 3 patents out of the market value top-10 were
interesting for possible acquisition, contra 9 of the value to Philips top-10.
Furthermore, it can be used as a further source of information in expert judgments. If a patent
seems irrelevant at first sight, but has high scores on one or more value-to-Philips indicators,
this may call for closer inspection of a patent.
7.2. A practical application The application of making pre-selections may be implemented as follows. The starting point of
any analysis would be a list of patents. This list could come from a website, an auction
catalogue, or it may be the result of a search for patents that fulfill certain criteria. For all
these patents, the value-to-Philips indicators are calculated.
Then, step by step, patents least likely to be relevant to Philips are removed from the set. This
may unfortunately include some patents that are in fact valuable to Philips, but that for some
reason have low indicator values. This is the price to pay for ending up with fewer patents to
examine.
A suggestion would be to follow these steps:
1. Gather set of patents
2. Remove patents having FwdCitByPh=FwdCitByMC=BwdCitByPh=BwdCitByMC=0
3. Remove patents having IPCscore=0
4. But keep patents having AssigneeIsUniv=1
5. Remove patents having FwdCitByPh=FwdCitByMC=0
6. Rank by an aggregate indicator
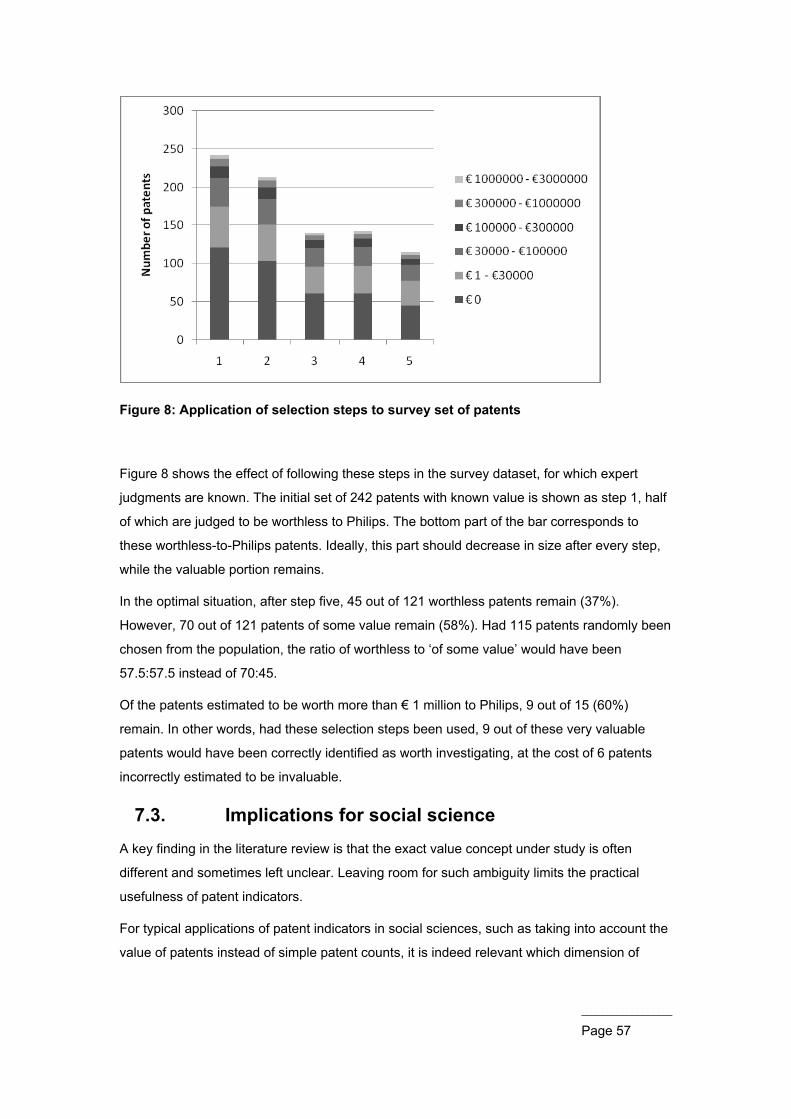
Page 57
Figure 8 shows the effect of following these steps in the survey dataset, for which expert
judgments are known. The initial set of 242 patents with known value is shown as step 1, half
of which are judged to be worthless to Philips. The bottom part of the bar corresponds to
these worthless-to-Philips patents. Ideally, this part should decrease in size after every step,
while the valuable portion remains.
In the optimal situation, after step five, 45 out of 121 worthless patents remain (37%).
However, 70 out of 121 patents of some value remain (58%). Had 115 patents randomly been
chosen from the population, the ratio of worthless to ‘of some value’ would have been
57.5:57.5 instead of 70:45.
Of the patents estimated to be worth more than € 1 million to Philips, 9 out of 15 (60%)
remain. In other words, had these selection steps been used, 9 out of these very valuable
patents would have been correctly identified as worth investigating, at the cost of 6 patents
incorrectly estimated to be invaluable.
7.3. Implications for social science A key finding in the literature review is that the exact value concept under study is often
different and sometimes left unclear. Leaving room for such ambiguity limits the practical
usefulness of patent indicators.
For typical applications of patent indicators in social sciences, such as taking into account the
value of patents instead of simple patent counts, it is indeed relevant which dimension of
Figure 8: Application of selection steps to survey set of patents
Page 58
patent value is used. If the strength of a patent portfolio is assessed based on its estimated
social value, this should lead to a different result than for market value. Where possible, it is
recommended to be specific about this. In order to be able to do so, more comparative
studies should be performed on which indicators relate to which value concepts.
If more specificity does not appear to be reachable, it is perhaps best to main the parentheses
around the “value” or “quality” of a patent, signifying that it is unclear what is actually
measured.
7.4. Recommendations for further research A main conclusion is that the value to a particular company is a value concept worth
investigating further. Indicators of this value concept can be improved. Instead of depending
only on a patent’s IPC classifications in determining a patent’s technological content, a query-
based technology definition could be used. Also, more accuracy could be reached in
determining which patents are held by major competitors. This is difficult though, because
companies are secretive about such information and because assignee information in patent
databases is complex. It would require a good connection between patent databases and
company information databases, which is not available yet.
A further recommendation is to replicate this research using data on patents actually offered
for sale. Such data does not have the drawbacks from asking about fictional cases, and may
provide more precise information. In order to make this possible, it is required to keep track of
information in the acquisition business process, such as: which patents were evaluated, which
of these were investigated in more detail, what is the estimated net present value calculated
for it, has it been acquired, and for what price? After systematically gathering such data for a
period of at least one year, a more precise model may perhaps be developed.

Page 59
References Breitzman, A. F., & Mogee, M. E. (2002). The many applications of patent analysis. Journal of
Information Science 28 , 187-205.
Carpenter, M. P., Narin, F., & Woolf, P. (1981). Citation Rates to Technologically Important
Patents. World Patent Information 3 , 160-163.
Ernst, H. (2003). Patent information for strategic technology management. World Patent
Information 25 , 233-242.
Gambardella, A., Giuri, P., & Mariani, M. (2005). The Value of European Patents: Evidence
from a Survey of European Inventors; Annex I: Questionnaire. Brussels: European
Commission, DG Science & Technology.
Gambardella, A., Harhoff, D., & Verspagen, B. (2008). The Value of European Patents.
European Management Review 5 , 69-84.
Giuri, P., Mariani, M., Brusoni, S., Crespi, G., Francoz, D., Gambardella, A., et al. (2007).
Inventors and invention processes in Europe: Results from the PatVal-EU survey. Research
Policy 36 , 1107-1127.
Griliches, Z. (1990). Patent Indicators as Economic Indicators: A Survey. Journal of Economic
Literature 28 , 1661-1707.
Hall, B. H., Jaffe, A., & Trajtenberg, M. (2005). Market value and patent citations. The RAND
Journal of Economics 36 , 16-38.
Harhoff, D., & Reitzig, M. (2004). Determinants of opposition against EPO patent grants - the
case of biotechnology and pharmaceuticals. International Journal of Industrial Organization
22 , 443-480.
Harhoff, D., Narin, F., Scherer, F. M., & Vopel, K. (1999). Citation Frequency and the Value of
Patented Inventions. The Review of Economics and Statistics 81 , 511-515.
Harhoff, D., Scherer, F. M., & Vopel, K. (2003). Citation, family size, opposition and the value
of patent rights. Research Policy 32 , 1343-1363.
Heiden, B. J. (2001). The Microeconomic Asset Value of a Patent: An Empirical Study of
Highly Valuable Swedish-owned Patents. Göteborg: Center for Intellectual Property Studies.
Jaffe, A. B., Trajtenberg, M., & Henderson, R. (1993). Geographic Localization of Knowledge
Spillovers as Evidenced by Patent Citations. The Quarterly Journal of Economics 108 , 577-
598.

Page 60
Kelley, R. (2006, March 3). BlackBerry maker, NTP ink $612 million settlement. Retrieved
October 8, 2008, from CNNmoney.com:
http://money.cnn.com/2006/03/03/technology/rimm_ntp/
Kuznets, S. (1962). Inventive Activity: Problems of Definition and Measurement. In R. (.
Nelson, The Rate and Direction of Inventive Activity (pp. 19-53). Universities NBER
Conference Series No. 13, Princeton University Press.
Lanjouw, J. O., & Schankerman, M. (2004). Patent Quality and Research Productivity:
Measuring Innovation with Multiple Indicators. The Economic Journal 114 , 441-465.
Lanjouw, J. O., Pakes, A., & Putnam, J. (1998). How to Count Patents and Value Intellectual
Property: The Uses of Patent Renewal and Application Data. The Journal of Industrial
Economics (46) , 405-432.
Lerner, J. (1994). The Importance of Patent Scope: An Empirical Analysis. The RAND Journal
of Economics 25 , 319-333.
Nomaler, Ö., & Verspagen, B. (2007). Knowledge Flows, Patent Citations and the Impact of
Science on Technology. UNU-MERIT working paper series #2007-022 .
Reitzig, M. (2003). What determines patent value? Insights from the semiconductor industry.
Research Policy 32 , 13-26.
Reitzig, M., Henkel, J., & Heath, C. (2007). On sharks, trolls, and their patent prey—
Unrealistic damage awards and firms' strategies of "being infringed". Research Policy 36 ,
134-154.
Schankerman, M., & Pakes, A. (1986). Estimates of the Value of European Patent Rights
During the Post-1950 Period. The Economic Journal 96 , 1052-1076.
Schmookler, J. (1966). Invention and Economic Growth. Cambridge: Harvard University
Press.
Shane, S. (2001). Technological Opportunities and New Firm Creation. Management Science
47 , 205-220.
Smith, G., & Parr, R. (2000). Valuation of Intellectual Property and Intangible Assets. John
Wiley & Sons.
Trajtenberg, M. (1990). A Penny for Your Quotes: Patent Citations and the Value of
Innovations. The RAND Journal of Economics 21 , 172-187.

Page 61
Trajtenberg, M., Henderson, R., & Jaffe, A. (1997). University versus Corporate Patents: A
Window on the Basicness of Invention. Economics of Innovation and New Technology 5 , 19-
50.
Van der Ligt, G. (2008). Establishing a search department in Bangalore. World Patent
Information 30 , 132-134.
Van Zeebroeck, N. (2008, May). The puzzle of patent value indicators. CEB Working Paper
no. 07/023 .
Van Zeebroeck, N., & Van Pottelsberghe de la Potterie, B. (2008, March). Filing strategies
and patent value. CEB Working Paper series No. 08/016 .
Verspagen, B. (2007). Mapping Technological Trajectories as Patent Citation Networks: A
Study on the History of Fuel Cell Research. Advances in Complex Systems 10 , 93-115.
Von Wartburg, I., Teichert, Thorsten, & Rost, K. (2005). Inventive progress measured by
multi-stage patent citation analysis. Research Policy 34 , 1591-1607.

Appendices
8. Questionnaire
8.1. Invitation e-mail On behalf of IP&S Business Intelligence, I would like to kindly ask some of your time for
assessing the relevance to Philips of four 3rd-party patents. This survey is part of a project on
improving our patent landscaping tool, PLATO. This project is warmly supported by (…), (…)
and (…).
The goal is to simulate how you would assess such patent families, had they been offered for
sale to Philips. The main question we would like you to answer is: How relevant are these
patent families to Philips? This way, we hope to gain insight in criteria applied by Philips IP
Counsels in judging patents for possible acquisition.
Please click here to start the survey »12
If you are asked for a password, please log in with your Sharepoint account.
You will be asked to assess the following four patent families: No. Number Title (click to open detail page)
1. (ID 1) (Title 1)13
2. (ID 2) (Title 2)
3. (ID 3) (Title 3)
4. (ID 4) (Title 4)
The survey will take no longer than one hour of your time. Please return your assessments by
September 5, at the latest.
Note that it is possible to store your answers before completing the full survey by clicking
“Save” on the survey page. You can then resume later by clicking this link, selecting your
response and clicking “Edit Response”.
For those interested in reading more information on this project, please refer to this
Sharepoint page with background information.
If you have any questions or remarks, please do not hesitate to contact me using the
information found below.
12 Upon clicking this link, the survey as documented below was opened.
13 Upon clicking one of these links, a web page with this patent + information was opened.

8.2. Questions The aim of this survey is to gain insight into the process of analyzing third party patents as
done within Philips IP&S. The survey examines two properties of the patent family: i)
technological relevance of the invention to the Philips IP portfolio, and ii) potential economic
value of the patent family for Philips.
1. Please inspect the patent family, so that you get a basic grasp of the invention and its
protection.
How relevant is the technology protected by this patent family to Philips'
current interests?
Irrelevant
Highly
relevant
I don’t
know
O O O O O O
Coded as 1 2 3 4 5 missing
2. Please assume that this patent family is offered for sale to Philips by the current right
holder(s). Would you advise to explore in more detail whether this patent family would
be worth acquiring, for example by making a net present value (NPV) calculation?
Yes No
O O
Coded as 1 0
3. The proper assessment of whether to acquire a patent family obviously requires a
thorough examination. However, on the basis of your first impression, what do you
think is the maximum amount of money that Philips should be willing to pay to acquire
the full rights to all patents in this patent family?
Coded as
Nothing 0
€ 1 - € 30,000 1
€ 30,000 - € 100,000 2

€ 100,000 - € 300,000 3
€ 300,000 - € 1,000,000 4
€ 1,000,000 - € 3,000,000 5
€ 3,000,000 - € 10,000,000 6
€ 10,000,000 - € 30,000,000 7
More than € 30,000,000 8
4. Which criteria have been most important to the judgment you gave above? (multiple
answers possible)
• Quality of the technology
• Current holder(s)
• Legal status
• Scope of protection
• Backward citations
• Forward citations
• Detectibility of the inventions
• Current applications of the technology
• Age of the patent family
5. Which would be the most effective use of this patent family to Philips? (multiple
answers possible)
• Enhance the IP portfolio in a certain field of technology
• Apply the invention in Philips products
• License in exchange for royalties
• Block others from inventing around a Philips invention
• Enhance bargaining position for cross-licensing or standards-related negotiations
• Ensure other companies (e.g. major competitors, patent trolls) do not acquire it
Note: These questions were asked for each of four patents, thus in total 20 questions per
invitee.