Embed Size (px)
Citation preview

The efficiency in pricing of initial public offerings: A comparison of Australian and US marketsALEX FRINO†, JEFFREY WONG† AND JAGJEEV DOSANJH*
† Macquarie Graduate School of Management * University of Technology, Sydney

2 Efficiency of IPO Markets: A Comparison between US and Australia
This study examines the pricing of initial public offerings (IPOs) which are listed on the Australian Securities Exchange (ASX) and a comparable sample of IPOs listed on US stock markets. The focus is on a sample of securities which would be too small to qualify for inclusion in the S&P 500 in the USA yet big enough to qualify for inclusion in the ASX 200 in Australia. A comparison of the issue price of the stocks to their price on listing – also known as ‘underpricing’ – is undertaken. Underpricing is the discount on the issue price relative to fair value required to induce investors to fully subscribe for shares in an IPO. Empirical analysis demonstrates that average underpricing is approximately 12 to 15% lower (i.e. the issue price is discounted less) for Australian IPOs compared to a sample of matched US IPOs. This finding holds even after statistically controlling for differences in a large number of variables known to influence underpricing (e.g. deal size, issue price setting mechanism, owner sell-down, etc.). This implies that Australian capital markets are more efficient than US markets in pricing IPOs which do not qualify for inclusion in the S&P 500 but do qualify for inclusion in the ASX 200. These findings support the conclusion that these companies are able to raise more capital, ceteris paribus, in Australian markets.
Summary Introduction
Equities markets in the US are significantly larger than the ASX and they are also perceived to be the most “visible” and “liquid” markets globally. For example, pension assets in the USA are the largest in the world and total almost $USD 19 trillion, while pension funds in Australia total approximately $USD 1.6 trillion and are the fourth-largest in the world.1 Furthermore, at the beginning of 2015, the smallest firm in the ASX 200 had a market capitalisation of $USD 151 million compared to $USD 3.7 billion for the smallest firm in the S&P 500. Given the vast difference in market capitalization requirements, companies that are large enough to qualify for the ASX 200 but not the S&P 500 have an interesting choice. Would it be better to raise capital and list in the US where general market liquidity and visibility is apparently better? Or do they get better value from raising capital and listing in Australia where they can become a component stock of the ASX 200?
Using IPO underpricing as a measure of capital raising efficiency, this study estimates the discount in the issue price provided by Australian IPOs that subsequently qualify for inclusion as component stocks in ASX 200. It compares this to the discount provided by a comparable sample of US IPOs that list outside the S&P 500, but would have made the ASX 200 if listed in Australia (henceforth referred to as ASX 200 ex-S&P 500 stocks).
This study conjectures that the mass of institutional investor money targeting companies in the ASX 200 ex-S&P 500 size bracket may be greater in Australia than the USA. This in turn could lead to a smaller discount in the issue price in order to achieve a fully subscribed offering.
1. Australian Trade Commission, (2014), “Australian pension funds growth the world’s highest”, Data Alert.

MGSM 3
Using a sub-set of companies that made it into the ASX 200 (but did not qualify for the S&P 500 based on the minimum market capitalization of the S&P 500) from 1 Jan 2009 to 30 June 2015, this study investigates the difference in IPO underpricing between a sample of stocks listed on the ASX and a comparable sample listed in US equities markets.
The initial sample is comprised of all IPOs listed on the ASX from 1 January 2009 to 30 June 2015. Of these IPOs, 32 made it into the ASX 200 during the sample period. However, six of these firms were demergers which are structurally different to the bulk of IPOs and are therefore excluded. Of the remaining 26 firms, four were sufficiently large enough to be included in the
S&P 500 based on market capitalisation and were therefore also excluded from the final sample. This procedure produced a final sample of 22 IPOs which were listed on the ASX. This sample is listed in Appendix 1.
Next, all US IPOs1 that are large enough to make it into the ASX 200 (but not S&P 500) are included as possible control firms for matching. The study then pairs each of the 22 ASX listed IPO with a corresponding US IPO that (1) is in the same industrial sector, and (2) is closest in size (market capitalisation) to the Australian IPO. The matched sample of US stocks is also listed in Appendix 1.
The sample selection process is summarised in Table 1 below.
Sample Selection
1. The sample is drawn from both NASDAQ and NYSE.
Table 1: Australian IPOs sampled between 1 January 2009 to 30 June 2015
Sampling Criterion No. of Stocks
IPOs that qualified for ASX 200 32
less
Demergersa 6
Stocks that would have qualified for S&P 500b/other 4 10
Final Sample 22
a. Demergers were Orora Limited, Recall Holdings, Shopping Centres Australasia Limited, South32 Limited, Westfield Retail Trust and New News Corp.
b. Myer Holdings Limited, QR National Limited and Medibank Private Limited were large enough to be included in the S&P 500, while Aston Resources Limited was excluded because of the unusual circumstances around its IPO, rendering unreliable its measure of U.

4 Efficiency of IPO Markets: A Comparison between US and Australia
Analysis and Results
Measurement of underpricing
The underpricing of IPOs is calculated as follows:
U = (P1 – Po ) Po
Where U = underpricing, P1 is the first traded price, and Po is the IPO offer price.
The estimates of underpricing for Australian and US stocks are reported in Figure 1 and Table 2 below. The results demonstrate that for companies choosing to list on the ASX, shares are issued at prices which on average are 8.3% lower than their prices on the first day of listing. In contrast, companies choosing to list on US exchanges are issued at prices which on average are 20.3% lower than their prices on the first day of listing – more than twice that of comparable Australian companies. For robustness, this study also calculates underpricing using the closing price on the 20th trading day following listing (instead of the first traded price).2
The results from this analysis are similar and confirm that underpricing is lower for Australian-listed companies. Table 2 documents the distribution of underpricing for the two countries.
2. This follows Ellul, A., and M.Pagano, 2006, “IPO Underpricing and After-Market Liquidity”, Review of Financial Studies 19(2), 381–421.
0
5
10
15
20
25
First Traded Price 20th DayClosing Price
ASX8.3% ASX
6.4%
US20.3%
US21.0%
Figure 1: IPO Underpricing – ASX vs US
Table 2: The distribution of underpricing of sample companies
< 0% 0–10% 11–20% > 20% Mean Median
Australia 5 11 2 4 8.3% 4.9%
US 1 3 10 8 20.3% 15.5%
MGSM 5
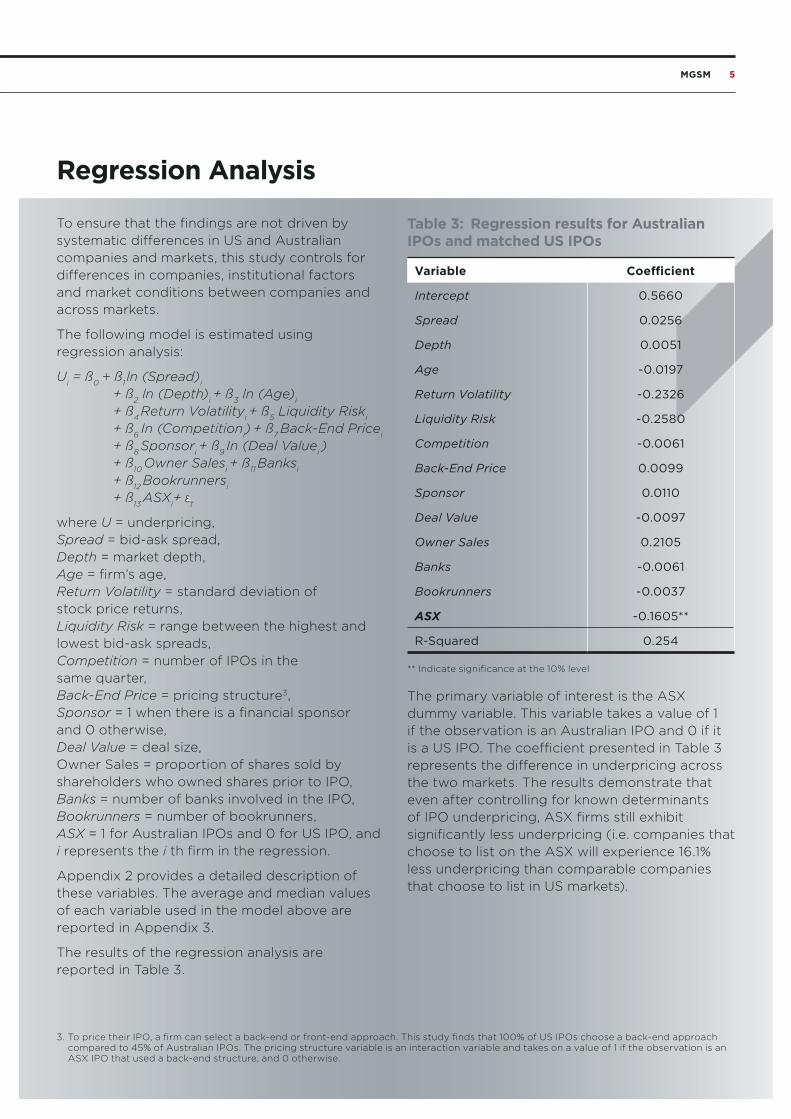
To ensure that the findings are not driven by systematic differences in US and Australian companies and markets, this study controls for differences in companies, institutional factors and market conditions between companies and across markets.
The following model is estimated using regression analysis:
Ui = ß0 + ß1 ln (Spread)i
+ ß2 ln (Depth)i + ß3 ln (Age)i + ß4 Return Volatilityi + ß5 Liquidity Riski
+ ß6 In (Competitioni) + ß7 Back-End Pricei
+ ß8 Sponsori + ß9 In (Deal Valuei )
+ ß10 Owner Salesi + ß11 Banksi
+ ß12 Bookrunnersi
+ ß13 ASXi+ t
where U = underpricing, Spread = bid-ask spread, Depth = market depth, Age = firm’s age, Return Volatility = standard deviation of stock price returns, Liquidity Risk = range between the highest and lowest bid-ask spreads, Competition = number of IPOs in the same quarter, Back-End Price = pricing structure3, Sponsor = 1 when there is a financial sponsor and 0 otherwise, Deal Value = deal size, Owner Sales = proportion of shares sold by shareholders who owned shares prior to IPO, Banks = number of banks involved in the IPO, Bookrunners = number of bookrunners, ASX = 1 for Australian IPOs and 0 for US IPO, and i represents the i th firm in the regression.
Appendix 2 provides a detailed description of these variables. The average and median values of each variable used in the model above are reported in Appendix 3.
The results of the regression analysis are reported in Table 3.
Regression Analysis
Table 3: Regression results for Australian IPOs and matched US IPOs
Variable Coefficient
Intercept 0.5660
Spread 0.0256
Depth 0.0051
Age -0.0197
Return Volatility -0.2326
Liquidity Risk -0.2580
Competition -0.0061
Back-End Price 0.0099
Sponsor 0.0110
Deal Value -0.0097
Owner Sales 0.2105
Banks -0.0061
Bookrunners -0.0037
ASX -0.1605**
R-Squared 0.254
** Indicate significance at the 10% level
The primary variable of interest is the ASX dummy variable. This variable takes a value of 1 if the observation is an Australian IPO and 0 if it is a US IPO. The coefficient presented in Table 3 represents the difference in underpricing across the two markets. The results demonstrate that even after controlling for known determinants of IPO underpricing, ASX firms still exhibit significantly less underpricing (i.e. companies that choose to list on the ASX will experience 16.1% less underpricing than comparable companies that choose to list in US markets).
3. To price their IPO, a firm can select a back-end or front-end approach. This study finds that 100% of US IPOs choose a back-end approach compared to 45% of Australian IPOs. The pricing structure variable is an interaction variable and takes on a value of 1 if the observation is an ASX IPO that used a back-end structure, and 0 otherwise.

6 Efficiency of IPO Markets: A Comparison between US and Australia
Further Analysis
For completeness, this study compares underpricing for the Australian sample against the entire US population of IPOs during the same period. Since Australian and US companies are not matched on size or market capitalisation in this analysis, it becomes important to control for the size of companies. Hence, the following regression model is estimated:
Ui = ß0 + ß1 Market Capi + ß2 Competition1i + ß3 Competition2i + ß4 ASXi + t
where U = underpricing, Market Cap = market capitalization of firm, Competition1 = number of IPOs in the same quarter, Competition2 = additional competition variable that measures the number of IPOs carried out on the exchange in the previous quarter relative to every IPO in the sample, ASX = 1 if Australian-listed IPO and 0 if US-listed IPO, and i represents the i th firm sampled.
The results of the regression analysis are reported in table 4.
Table 4: Regression results for Australian IPOs and all US IPOs
Intercept 0.0227
Market Cap 0.0349**
Competition1 0.0635**
Competition2 0.0312
ASX-US Dummy -0.1187**
R-Squared 0.104
** Indicate significance at the 10% level
The findings are consistent with those reported earlier and indicate that underpricing for Australian firms (for the sample stocks) is 11.87% less than US stocks, after controlling for their size.


8 Efficiency of IPO Markets: A Comparison between US and Australia
Appendix 1
Sample of Australia-listed IPOs in the final sample and matched US-listed IPOs
Australian-listed IPOs
Sector NameMarket
Capitalisation Deal Value
Consumer Staples Asaleo Care Ltd $994,504,597 $616,046,270
Consumer Staples Bega Cheese Ltd $253,419,810 $37,654,653
Information Technology carsales.com Ltd $811,827,810 $139,749,056
Consumer Discretionary Corporate Travel Management Ltd $70,370,000 $21,016,252
Financials Cover-More Group Ltd $635,000,000 $473,895,224
Consumer Discretionary Dick Smith Holdings Ltd $520,324,000 $320,613,854
Health Care Estia Health Ltd $1,040,092,085 $624,116,227
Financials Genworth Mortgage Insurance Au $1,722,500,000 $545,420,526
Health Care Healthscope Ltd $3,637,399,500 $2,116,663,659
Health Care Japara Healthcare Ltd $525,000,000 $323,845,976
Consumer Discretionary Kathmandu Holdings Ltd $340,000,000 $307,904,750
Energy Maverick Drilling and Exploration Ltd $32,540,890 $9,009,187
Financials National Storage REIT $239,999,060 $163,188,488
Consumer Discretionary Nine Entertainment Co Holdings $1,595,316,600 $580,700,060
Financials OzForex Group Ltd $480,000,000 $412,737,777
Materials Pact Group Holdings Ltd $1,117,572,250 $593,867,277
Health Care Regis Healthcare Ltd $1,096,262,900 $440,050,262
Industrials Spotless Group Holdings Ltd $1,757,264,430 $923,926,477
Financials Steadfast Group Ltd $626,865,000 $309,340,773
Consumer Discretionary Trade Me Group Ltd $807,840,000 $454,375,000
Industrials Veda Group Ltd $1,052,569,260 $319,500,813
Health Care Virtus Health Ltd $451,767,890 $333,736,955
Average $900,383,458 $457,607,251

MGSM 9
US-listed IPOs
NameMarket
Capitalisation Deal Value
The Chefs Warehouse $310,000,010 $155,250,000
Primo Water Corporation $228,286,640 $115,000,000
Fortinet Inc $804,924,610 $179,687,500
Chuy’s Holdings Inc $195,564,560 $87,208,316
ServisFirst Bancshares Inc $743,907,890 $56,875,000
Ignite Restaurant Group Inc $346,513,010 $92,884,610
HealthEquity Inc $694,345,470 $146,510,000
CBOE Holdings $2,960,975,570 $390,195,000
VWR Corporation $2,678,172,000 $616,532,700
Agios Pharmaceuticals Inc $528,847,180 $121,900,000
LGI Homes Inc $213,547,940 $113,850,000
Ceres Inc $302,183,360 $74,750,000
HomeTrust Bancshares Inc $211,600,000 $211,600,000
Francesca’s Holdings Corporation $739,938,940 $195,500,000
Financial Engines $474,066,920 $146,280,000
Codexis Inc $441,701,880 $78,000,000
Surgical Care Affiliates Inc $915,428,660 $269,866,656
RPX Corporation $873,683,800 $184,205,000
Solar Capital Ltd $596,635,000 $105,097,483
Skullcandy Inc $535,646,180 $188,833,660
SolarCity Corporation $573,666,910 $105,800,000
Sage Therapeutics Inc $449,314,670 $90,000,000
Average $719,043,236 $169,355,724

10 Efficiency of IPO Markets: A Comparison between US and Australia
The following table provides a description of all variables used in the study
Variable Description Source
Spread The proportional bid-ask spread is calculated by sampling the time-weighted bid-ask spread for each of the first 20 trading days following listing of the company
Thomson Reuters Tick History
Depth Depth is calculated by sampling the time-weighted, best-price depth for each of the first 20 trading days following listing of the company
Thomson Reuters Tick History
Age Age is calculated as number of years since incorporation IPO Prospectus
Return Volatility Return volatility is calculated as the standard deviation of returns using mid-quotes sampled at one-hour intervals over the first 20 trading days following listing of the company
Thomson Reuters Tick History
Liquidity Risk Liquidity risk is calculated as the average range between the daily highest and lowest spread, measured over the first 20 trading days following listing of the company
Thomson Retuers Tick History
Competition Competition is calculated as the number of IPOs carried out on the exchange in the same quarter relative to all IPOs during the sample period
Bloomberg
Back-End Price Back-End Price is an interaction dummy variable that equals 1 if the observation is an ASX IPO that used a back-end pricing structure and 0 otherwise
IPO Prospectus
Sponsor Sponsor is a dummy variable that equals 1 if the IPO has a financial sponsor, and 0 otherwise. An IPO is known as a “financial-sponsor” deal if it is owned by a private equity or venture capital firm.
Dealogic
Deal Value Deal value is the total amount of the offering including overallotment in all tranches accounting for rank eligibility.
Dealogic
Owner Sales Owner Sales is the value of shares sold by shareholders who held shares prior to IPO relative to the total value of shares sold
Dealogic
Banks Banks is the total number of investment banks involved in the IPO IPO Prospectus
Bookrunners Bookrunners is the number of bookrunners involved in the IPO IPO Prospectus
ASX ASX is a dummy variable that equals 1 if the IPO occurs in Australia and 0 if in the US
Bloomberg
Appendix

MGSM 11
Descriptive statistics for ASX-listed IPOs and matched US-listed IPOs
Panel A: Mean and medians of variables
Mean Median
ASX US ASX US
Spread 0.0076% 0.0072% 0.0045% 0.0068%
Depth $228,055 $44,302 $118,589 $17,843
Age 33.87 26.5 23.5 13
Return Volatility 0.0943% 0.0451% 0.0579% 0.0269%
Liquidity Risk 0.0364% 0.0611% 0.0343% 0.0303%
Competition 0.058 0.052 0.057 0.041
Deal Value $457,607,251 $169,355,724 $373,428,178 $146,391,575
Owner Sales 16% 1.44% 10% 0%
Banks 3.68 5.77 2.5 5
Bookrunners 2.14 2.77 2 2
Panel B: Proportion of companies ASX US ASX US
Back-End Price 45% 100% – –
Sponsor 50% 41% – –

For further information please contact:
Dr Alex Frino Professor of Finance, Dean Macquarie Graduate School of Management [email protected] +61 2 9850 6081
Dr Jeffrey Wong Lecturer Macquarie Graduate School of Management [email protected] +61 2 9850 6862
Jagjeev Dosanjh Analyst & Doctoral Candidate Capital Markets CRC Limited University of Technology, Sydney [email protected] +61 2 9850 9933