Embed Size (px)
Citation preview
1
Shake (up), rattle (along), and roll (about)The dynamics of the media and contents sector
/
DisclaimerThe views expressed are those of the presenter and may not in any circumstances be regarded as stating an official position of the European Commission. Neither the European Commission nor any person acting on behalf of the Commission is responsible for the use which might be made of this presentation.
Source: R.Searle
INFSO/ IPTS Meeting: Brussels, November 11, 2011
Jean Paul SimonBased on the team work by Giuditta de Prato,
Esteve Sanz and Jean Paul Simon
2
Summary
BackgroundThe changing nature of competition in the global telecom, media and technology (TMT) ecosystemUpheaval in the mediaChanging cost structures and benefits from technologiesNew business models and value chainCreative destruction: value creationConclusion
3
Background
4
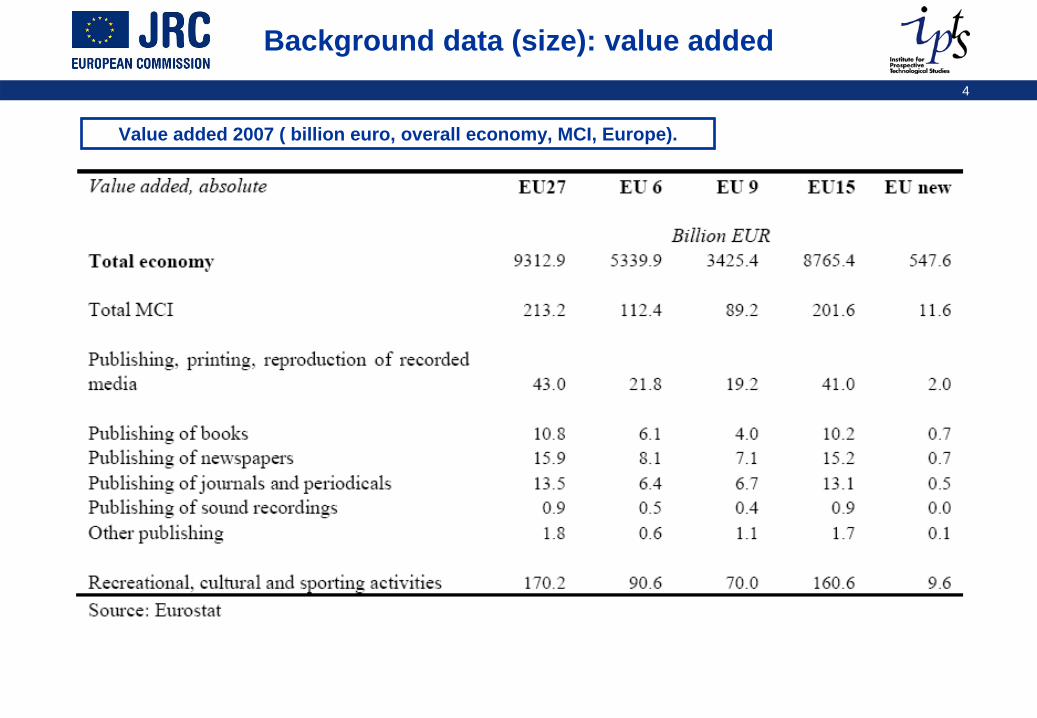
Background data (size): value added
Value added 2007 ( billion euro, overall economy, MCI, Europe).
5
Background data (size): employment
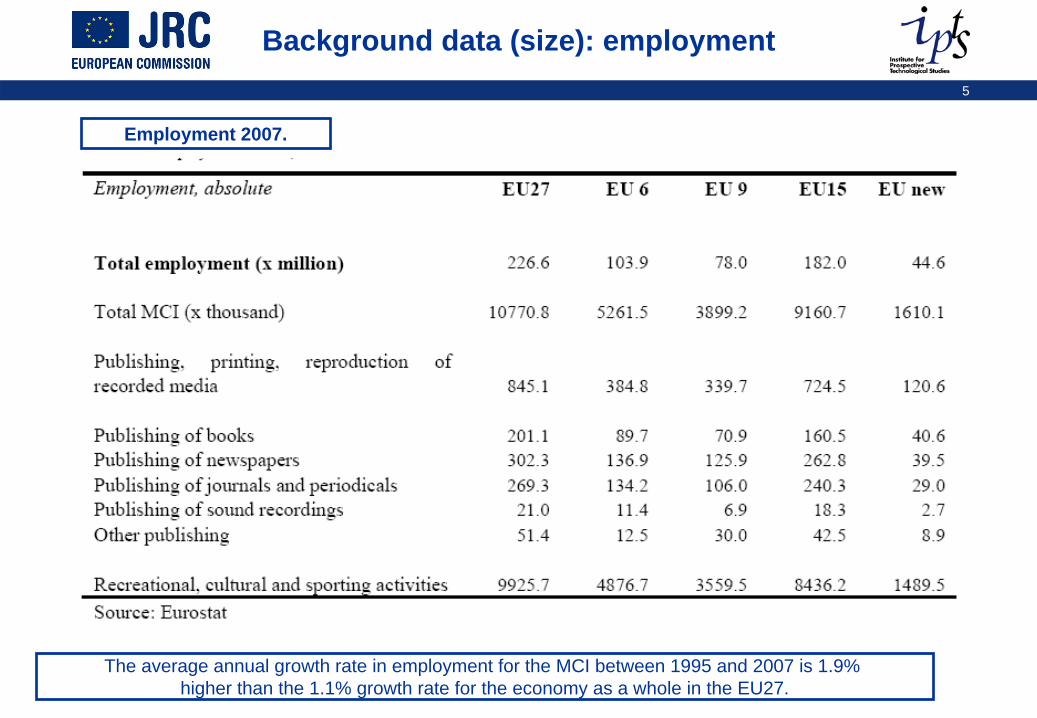
Employment 2007.
The average annual growth rate in employment for the MCI between 1995 and 2007 is 1.9% higher than the 1.1% growth rate for the economy as a whole in the EU27.
6
Background data (size): number of firms
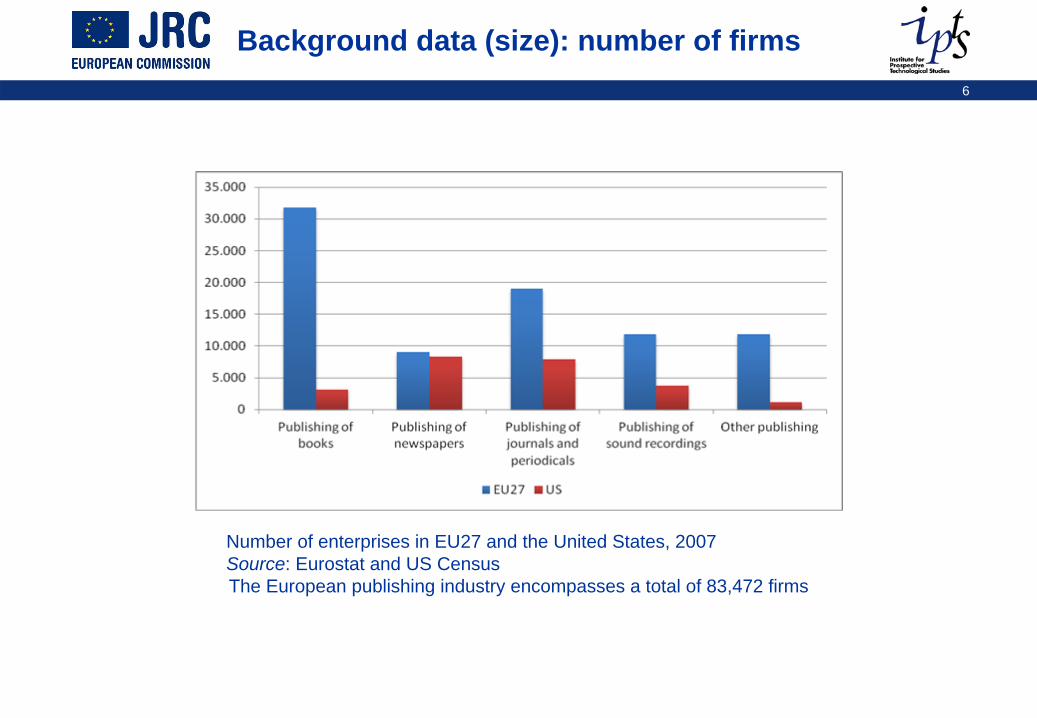
Number of enterprises in EU27 and the United States, 2007Source: Eurostat and US CensusThe European publishing industry encompasses a total of 83,472 firms
7
Background data (size): segments US $
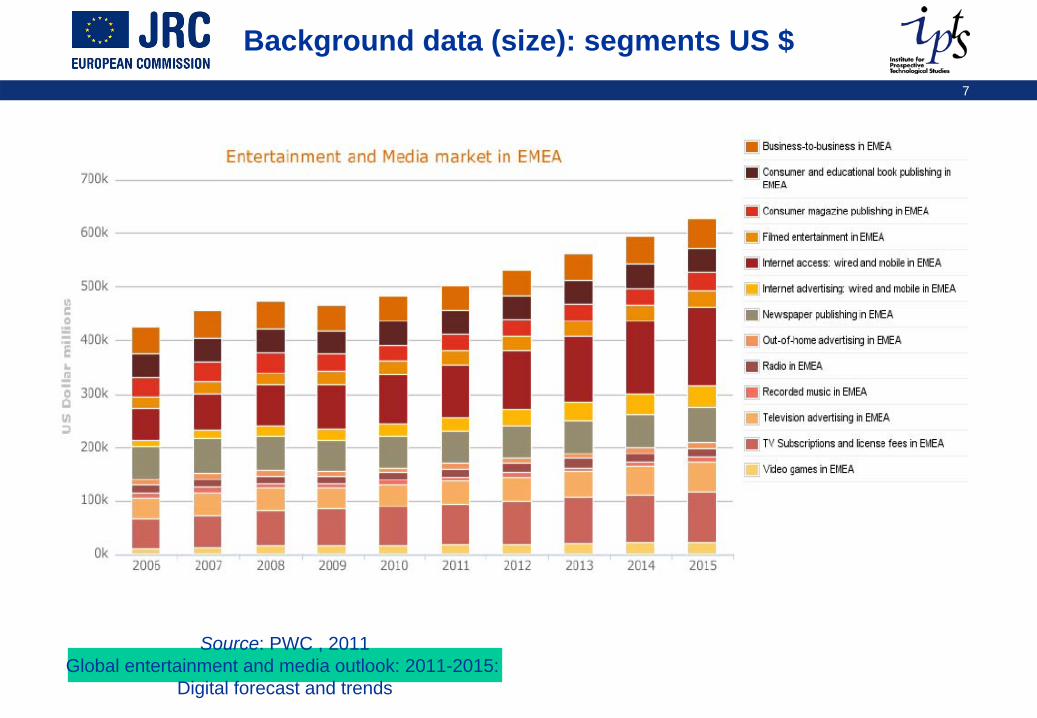
Source: PWC , 2011Global entertainment and media outlook: 2011-2015:
Digital forecast and trends
8
Background
IPTS initiated a research programme on the media and content industries.
Video games report released last yearA study was commissioned in 2009 (TNO-SMIT) to investigate the current status and dynamics affecting specific MCI sub-sectors setup. IPTS decided in 2011 to complement this study, adding a global overview and two case studiesExpected outputs:
a reliable set of data (statistical analysis of the MCI sector) and an industrial and economic analysis
Overview of the dynamics of the sector (IPTS)case studies of subsectors: cinema, newspaper, music (TNO), publishing and TV (IPTS)
The goal:To contribute significantly to the understanding and debate about the economic health and development conditions that would support the future competitiveness of the European MCIs within the digital economy
9
Two workshops (1)
An exploratory workshop (May 2011)Combining different views (academic, industry, policy)Proposing/ reviewing some theoretical approaches
i.e two sided markets
To gauge the economic significance of the MCI To assess the economic impact of digitizationTo explore the relationships between the MCI and the ICT industry, To ascertain its place in the digital economy.
Presentations available: http://is.jrc.ec.europa.eu/pages/ISG/ictI.html
10
Two workshops (2)
A validation workshop ( October 2011) to assess the main outputs of these researchs.Review of the relevant report by our invited experts
Mixing the views from the industryand the view from the academic world.
Bringing their vision of the future of the industry and the main challenges it is facing.
11
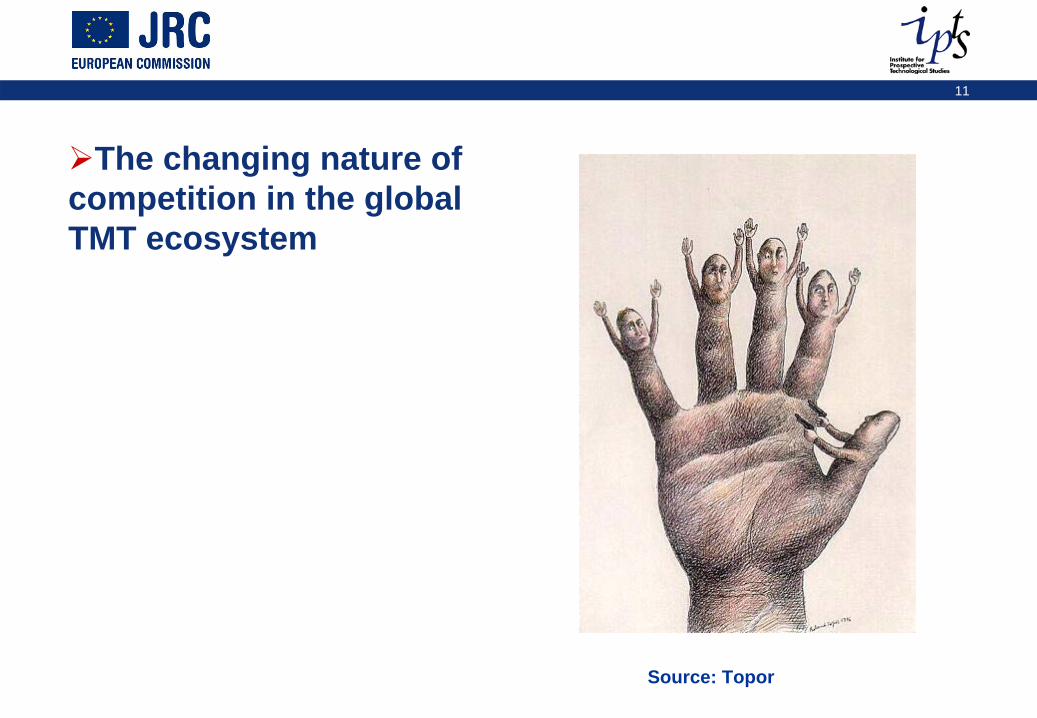
The changing nature of competition in the global TMT ecosystem
Source: Topor
12
An overview of the global ecosystem
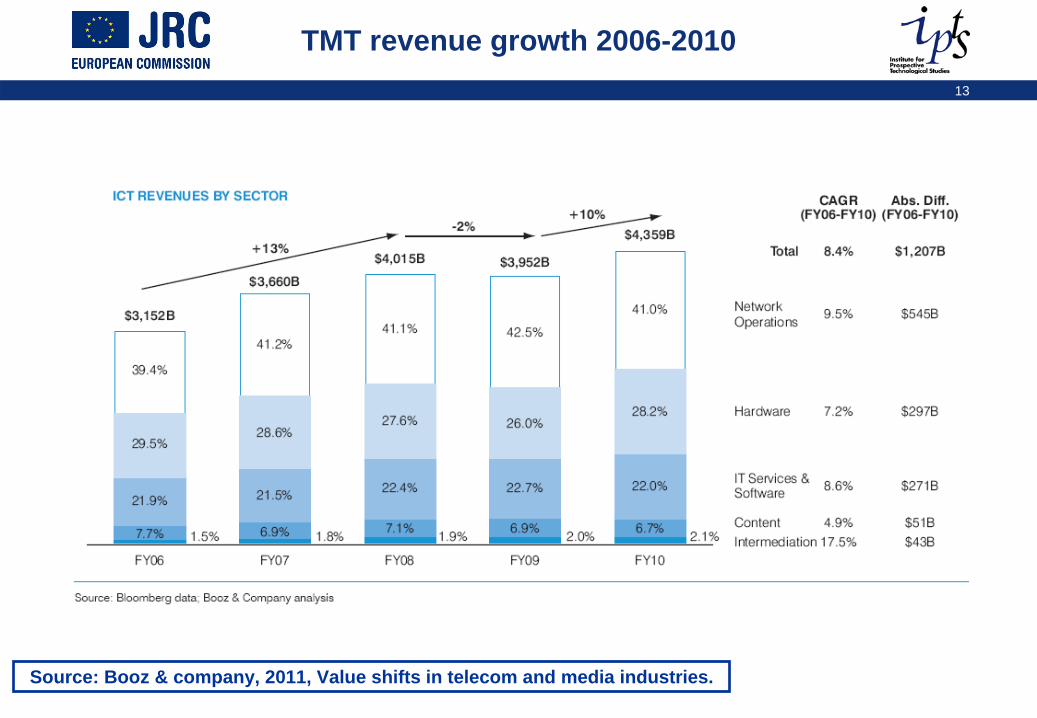
The total sector (network operations, hardware, IT services and software, content and intermediation) still growing from2006 on at a 8.4% rate, up to 1.207 US $ billion
Despite a 2% decline in 2009.To be noted the growing role of emerging markets: growingat a 12.6% with a overall share up from 20 to 24%
Growing three times faster in telecom marketsBut mature markets still accounts for 76% of the total revenues in 2010
Network operators still account for 41% of the total revenuesThe impact of diversification remains limited.Boosting non-core revenues is an issue.
The intermediation sector grew over 17%New devices and emerging markets are fueling the growth of manufacturers
With a low portion of revenues coming from intermediationThe content sector grew 4.9%
A growth mostly due to new digital business modelsTaking into accoung the negative impact of the recession on advertising revenues
13
TMT revenue growth 2006-2010
Source: Booz & company, 2011, Value shifts in telecom and media industries.
14
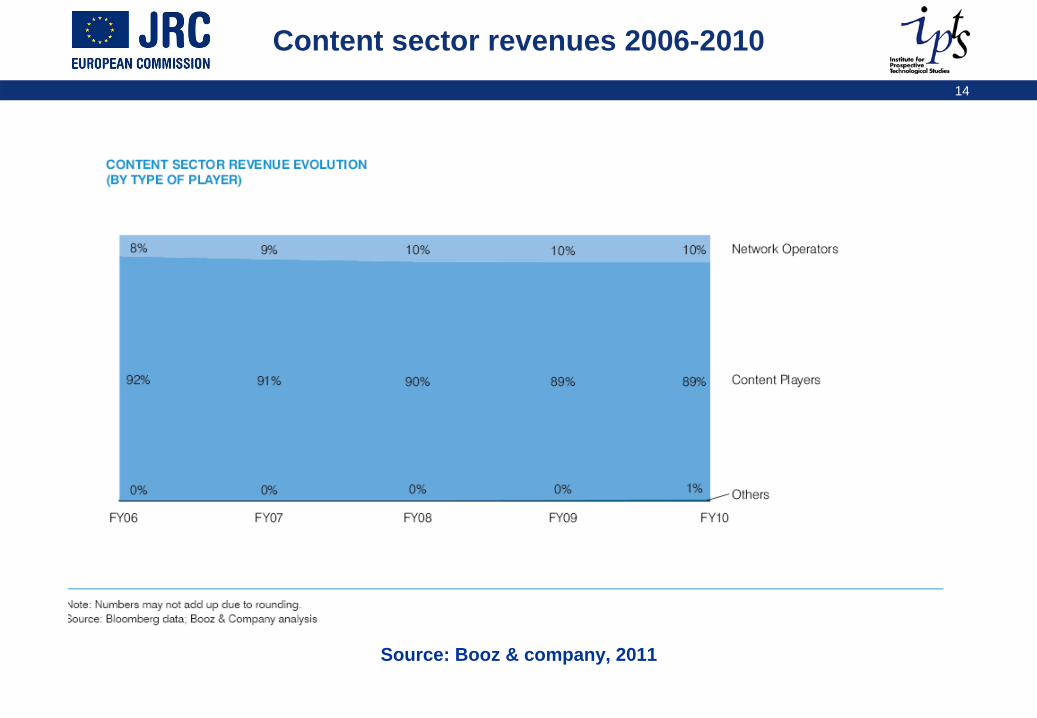
Content sector revenues 2006-2010
Source: Booz & company, 2011
15
Funding the new networks
The current data explosion calling for a deployment of new networks taking place
at a difficult economic time. According to industry voices
on one side we have a declining EU telecom industry (with voice traffic declining 7% per year) and on the other a rising Over-the-Top (OTT) and software sectors dominated by US players (and Asian players to a lesser extent)
a decline of revenues of 1% in 2009 for the distribution segment in the EU but still the biggest segment of the Internet market
Part of the perceived reluctance of the telecom industry to deploy ultra fast broadband is linked to the signals received from the market of a lack of demand for massive additional bandwidth:
no significant signals of consumers' demand a major difference with Asian markets (on line gaming)
16
A misalignment between prices and costs
The telecom industry claims that there is a misalignment between prices and costs in the telecom industry,
Making the existing business models unsustainable. The growth of traffic is now mainly driven by consumer
As opposed to business before,With consumers becoming more and more active as "prosumers".
Looking at the composition the traffic growth, the growth is mainly driven by media,
Video being the driver, generating imbalance in revenues. Consumers are using more and more communications but under highly uneven patterns of use:
80% of the traffic is generated by 25% of the fixed broadband subscribers using 40 GBytes per month, in the mobile world 80% of the traffic is generated by 7% of the customers using 4 Gbytes per month (and this is increasing
17
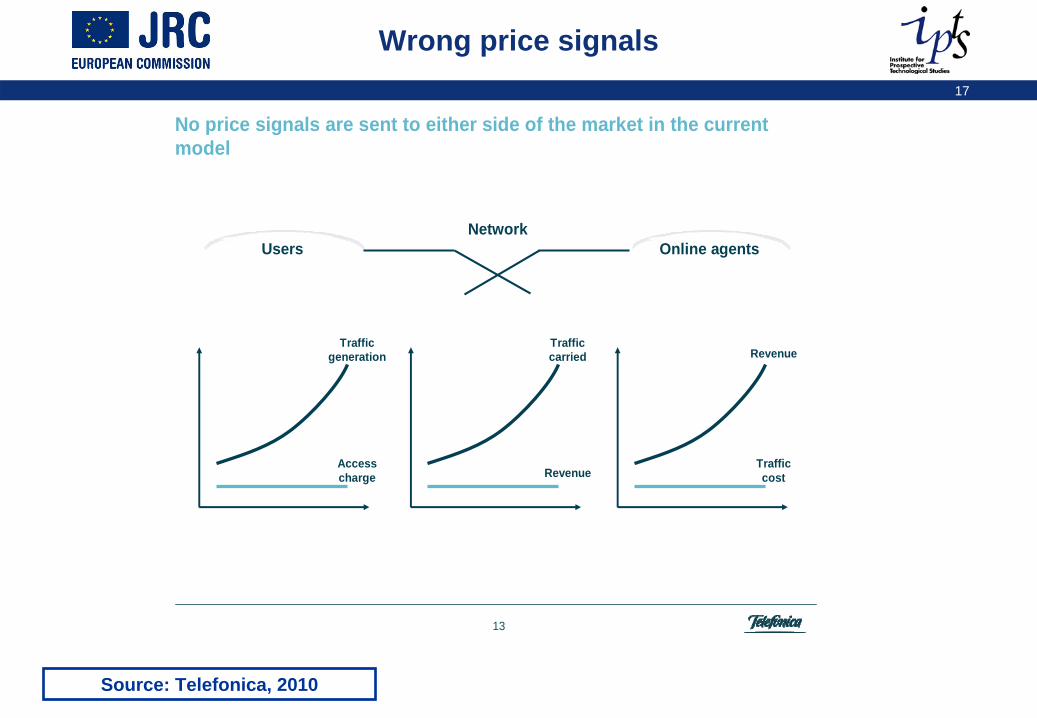
Wrong price signals
13
Online agentsUsers
No price signals are sent to either side of the market in the current model
Traffic generation
Access charge
Network
Traffic carried
Revenue
Revenue
Traffic cost
Source: Telefonica, 2010
18
The smartphone explosion
New devices (tablet, smartphones) have had a huge impact. Smartphones are the biggest contributors to the mobile internet explosion:
the number of applications was multiplied by 6 over just one year, but only 30 applications reach more than 500 000 users.
iPhone users spend almost double the time on data intensive applications as other mobile data uses (AT.Kearney, 2011). So growth is to be expected, The issue is how to monetize this growth as the price signals on both side of the market (users and "online agents") are not sustainableRoom for innovation in multisided markets with creative business models
19
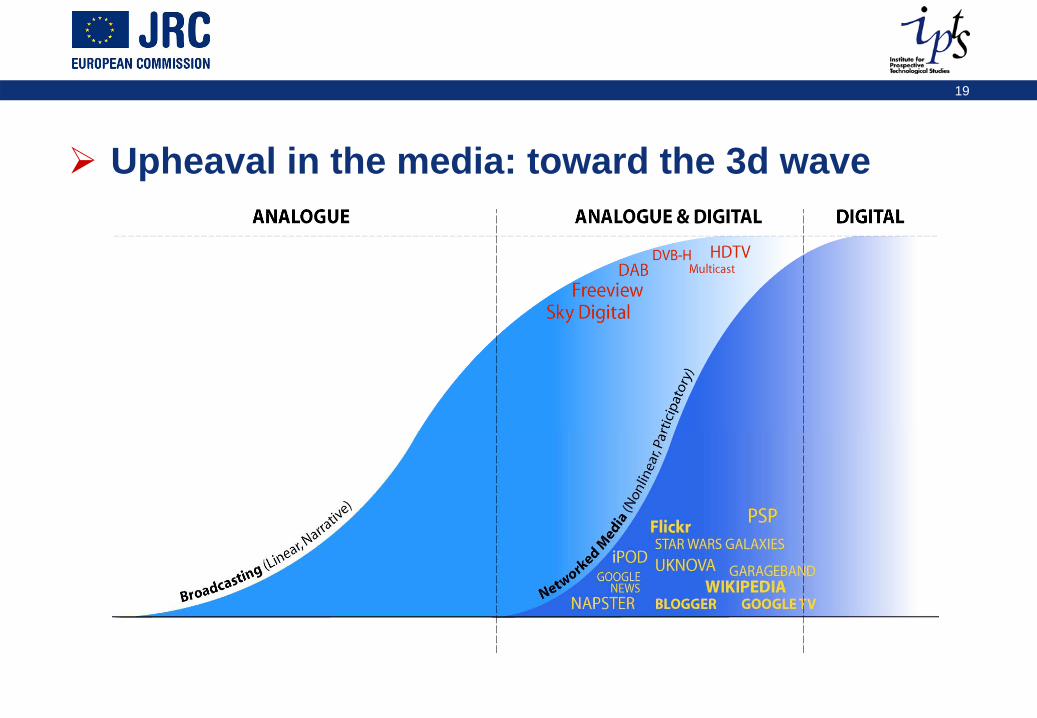
Upheaval in the media: toward the 3d wave
20
Changing demand/ distribution (1)
The two most important factors are:the demand from consumers of contents wherever and whenever they want enabled now by technologies, and the overall distribution models.
For the first time content/ media will be based on an individualistic experience as opposed to the times where such experience has to be shared (theatre, music…). Adding two new dimensions of use:
a widening: i.e expansion of regular TV, more at different time, and a deepening, i.e the extent of signals to sensory receptors, to eyes, ears, nose/skin/mouth.
toward the entertainment of total immersion with the user participation: 3D movies, vidoe games.
The internet, open and flexible, allows interaction at both ends so that the receiver can become the transmitter.Empowering consumers and at the same time blurring of the boarders between professional and amateurs
Role of users still an issue as UGC may be overheatedRicher contents mean more expensive contents and creativitySome room for less mainstream creativity: community models
at least to create the markets: radio in the 20ies, Internet in the 80ies
21
Changing demand/ distribution (2)
The distribution models were formally based on geographic boundaries and scarcity of certain kinds of resources (i.espectrum) are under pressure.Ubiquity and rise of the Internet are turning upside down the legacy media logic:
Media and telecommunication networks were hierarchical and had centralized architectures. Because of its digital architecture and decentralised organization the internet has forged a major schism from that model.
This poses significant challenges for the legacy industry players as easy access to inexpensive tools and web services
Not only allow the new entrants to duplicate the old ones but with lighter weight technologies, But they allow consumers on their own to rate, distribute, share, recommend, comment on content, get it, modify and reuse the content of others legally and illegally.
Even when duplicating familiar services, new entrants will usually provide the services at lower costs, under different business models.
22
Challenging the legacy market structure
The traditional, oligopolistic and vertically integrated market structure of the media industry is being challenged,
The industry is moving towards a value chain with many participants.The traditional value chain was dominated by the publisher/ aggregator segment with most often integrated firms (production/ publishing/ distribution-retail), Some aggregators even owned the technical segments of the industry:
Printers in the case of newspapers and book publishers, Technical industries in the cinema.
The only link that was not under some kind of control from the publisher was the enabling devices (radios, TVs, record, CD and DVD players). The notable exception comes: the "new sector" of videogames
Where hardware manufacturers (consoles: Sony, Microsoft and Nintendo) dominate And also exercise a lot of power over the other segments .
Other middlemen were also active such as agents in the book and cinema sector.
23
Phase 1: Telcoes entering
Working under a closed shop model allowed publishers not only to keep a major influence on the distribution and retail segments but to manage their customer base as a major asset, selling additional services or products, for instance newspapers using their data base for direct and indirect marketing.
It also allows to better protecting other assets like copyrighted contents. The sharp decline to sales of recorded music shows what happens when the value chain is opened up and when the main players are unable to maintain a hold on their strategic assets, for various reasons.
Piracy is one but not to be overestimated, the failure to create a new business models is another, but changing patterns of consumption is key as well with a move toward an itemized, non-linear consumption.
The change came from the outside of the sector It originated initially from the telecom industry looking for new streams of revenues to mitigate the loss of their more traditional revenues from the fixed networks (voice telephony).
They started offering other services when deploying their broadband networks (ADSL) adding to voice telecommunications and access, data and video services sold in bundles (triple or quadruple play). So called « convergence »
24
Then IT companies
In a second phase, IT companies (search engines, e-dealers like Amazon and e-bay), then social networks and manufacturers like Apple took over to lead the process. This second phase of digitisation is disrupting the legacy model in two ways. The switch to digital distribution drastically cuts the need for physical logistics. A whole part of the former business has shrunk, disappeared or will disappear:
physical goods (CDs, DVDs, books), part of the legacy logistics (trucks…), retailers: e.g. Tower records (CDs), Borders (books) and Blockbuster (DVDs) in the US.
25
Moving toward the 3d phase (1): a multiscreen, multichannel world
Legacy media players are becoming more proactive players of the « app » ageestablishing new relationships, signing commercial agreements with new entrantsOffering new services or striking alliances
Hachette, signed a deal with Google for e-books in August 2011 to put a large portion of out-of-print books on its Google Editions eBook store
However, most are still looking for a new pay model
26
Lagardère interactive hybrid business model
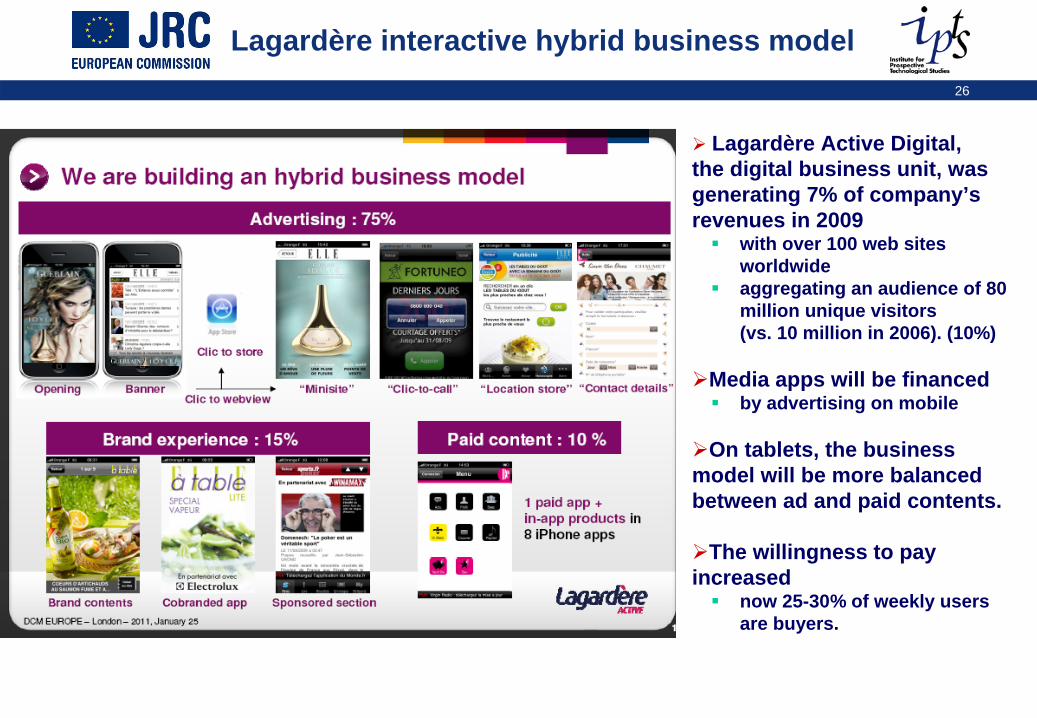
Lagardère Active Digital, the digital business unit, was generating 7% of company’s revenues in 2009
with over 100 web sites worldwide aggregating an audience of 80 million unique visitors (vs. 10 million in 2006). (10%)
Media apps will be financedby advertising on mobile
On tablets, the business model will be more balanced between ad and paid contents.
The willingness to pay increased
now 25-30% of weekly users are buyers.
27
Moving toward the 3d phase (2): a multiscreen, multichannel world
BskyB launched Sky Player (5 million live streams in 2011) but also developed Apps on mobile as companion services. The RTL group reacted with the creation of a family of channels which can be customised
from "masse to niche“.and diversification of its activities to move with their audience and use all relevant digital platforms
38% of RTL Group revenue originate from a broad range of non-advertising activities.
28
Moving toward the 3d phase (3): a multiscreen, multichannel world
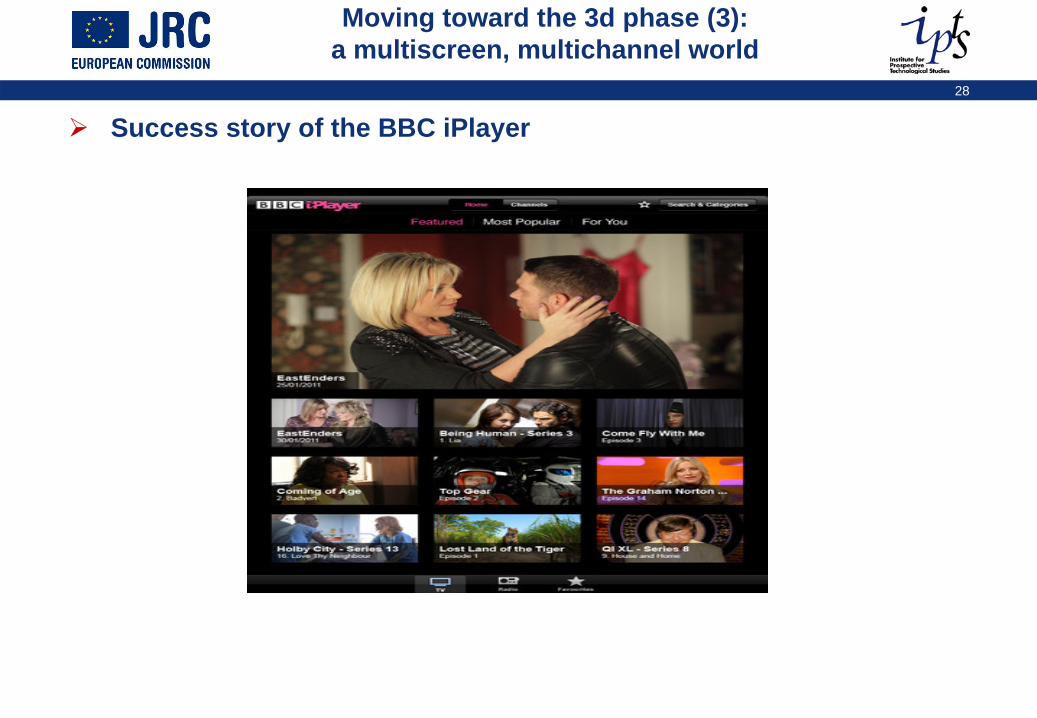
Success story of the BBC iPlayer
29
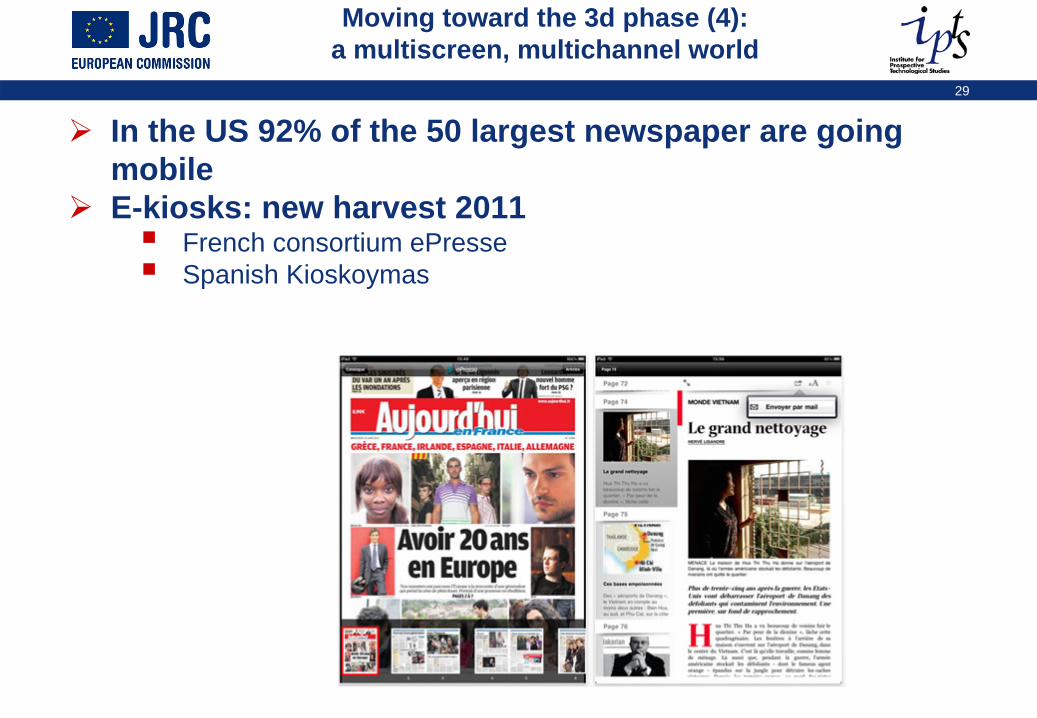
Moving toward the 3d phase (4): a multiscreen, multichannel world
In the US 92% of the 50 largest newspaper are goingmobileE-kiosks: new harvest 2011
French consortium ePresseSpanish Kioskoymas
30
Changing cost structures and benefits from technologies
31
Re-allocating the costs (1)
Some costs disappear: manufacturing of the physical good, physical transportation, storage.
Some costs remain unaffected:creation/ development, editorial process, marketing and sales.
Others are shifted:part of the production in some cases like music with "home studios", promotion with the coming of blogs and other toolsbut may decrease like in music for instance.
New costs are appearing:mostly on the software side of the equation (security, right management…) bringing along a growing segment of enabling technology providers (web hosting, content delivery networks, billing).
The sustainability of the new entrants is uncertainsome of them will grow, others will fade away
phototypesetting shrunk in the book publishing sector after the introduction of desk publishing.
32
Re-allocating the costs (2)
T‐7
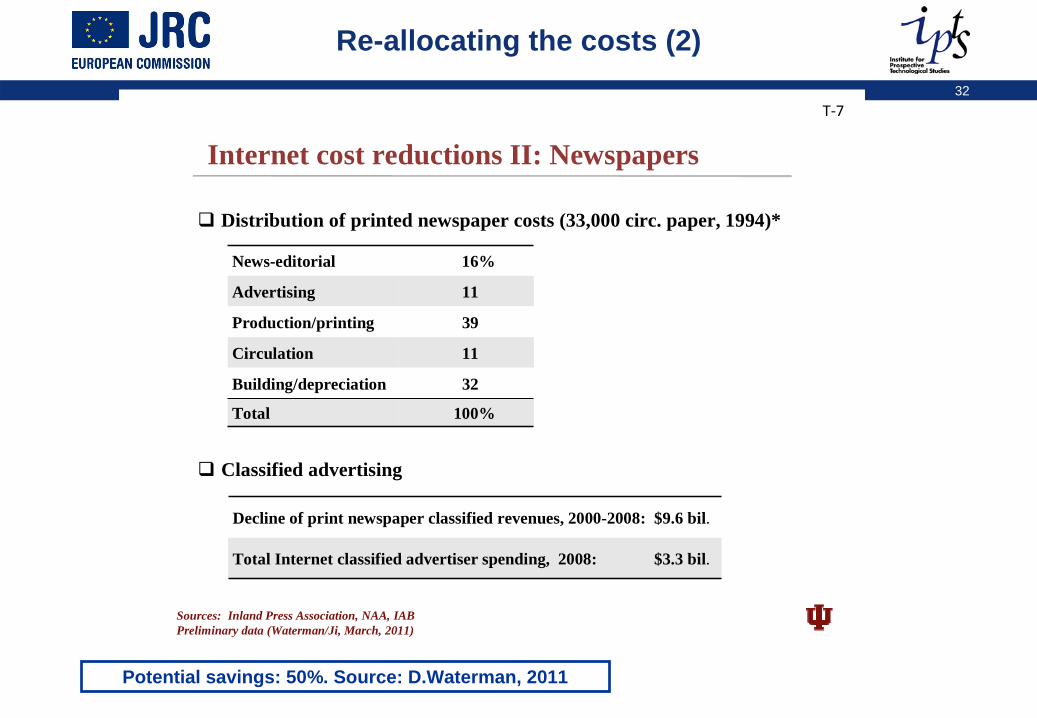
Distribution of printed newspaper costs (33,000 circ. paper, 1994)*
Classified advertising
Internet cost reductions II: Newspapers
News-editorial 16%
Advertising 11
Production/printing 39
Circulation 11
Building/depreciation 32
Total 100%
Decline of print newspaper classified revenues, 2000-2008: $9.6 bil.
Total Internet classified advertiser spending, 2008: $3.3 bil.
Sources: Inland Press Association, NAA, IABPreliminary data (Waterman/Ji, March, 2011)
Potential savings: 50%. Source: D.Waterman, 2011
33
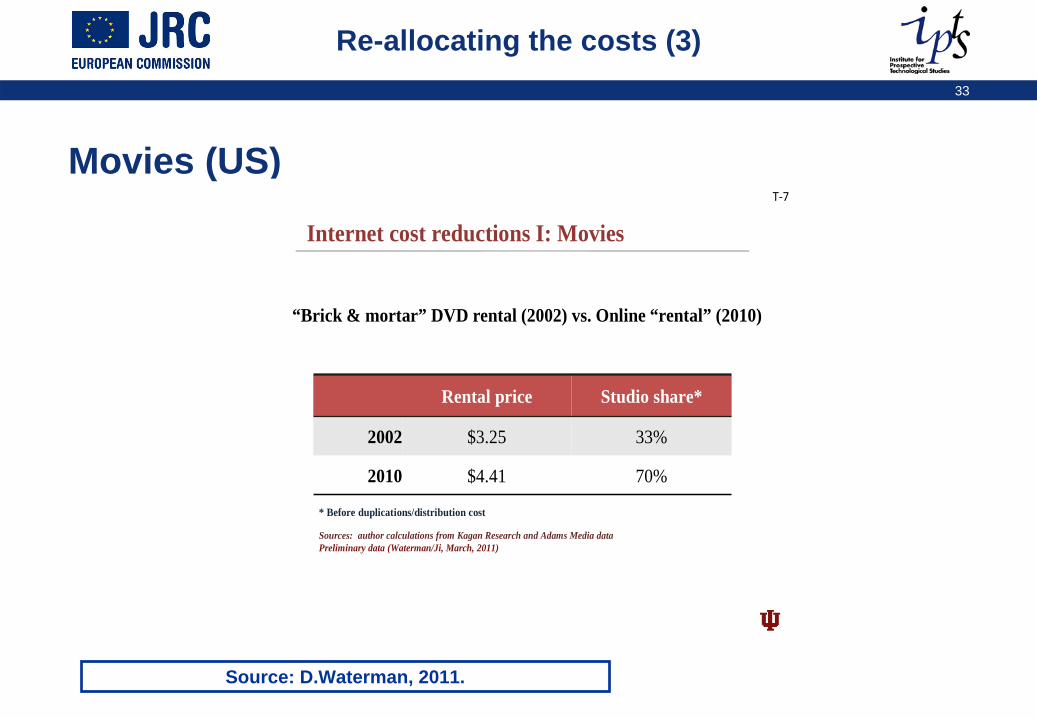
Re-allocating the costs (3)
Movies (US)
Source: D.Waterman, 2011.
T‐7
“Brick & mortar” DVD rental (2002) vs. Online “rental” (2010)
Internet cost reductions I: Movies
Rental price Studio share*
2002 $3.25 33%
2010 $4.41 70%
* Before duplications/distribution cost
Sources: author calculations from Kagan Research and Adams Media dataPreliminary data (Waterman/Ji, March, 2011)
34
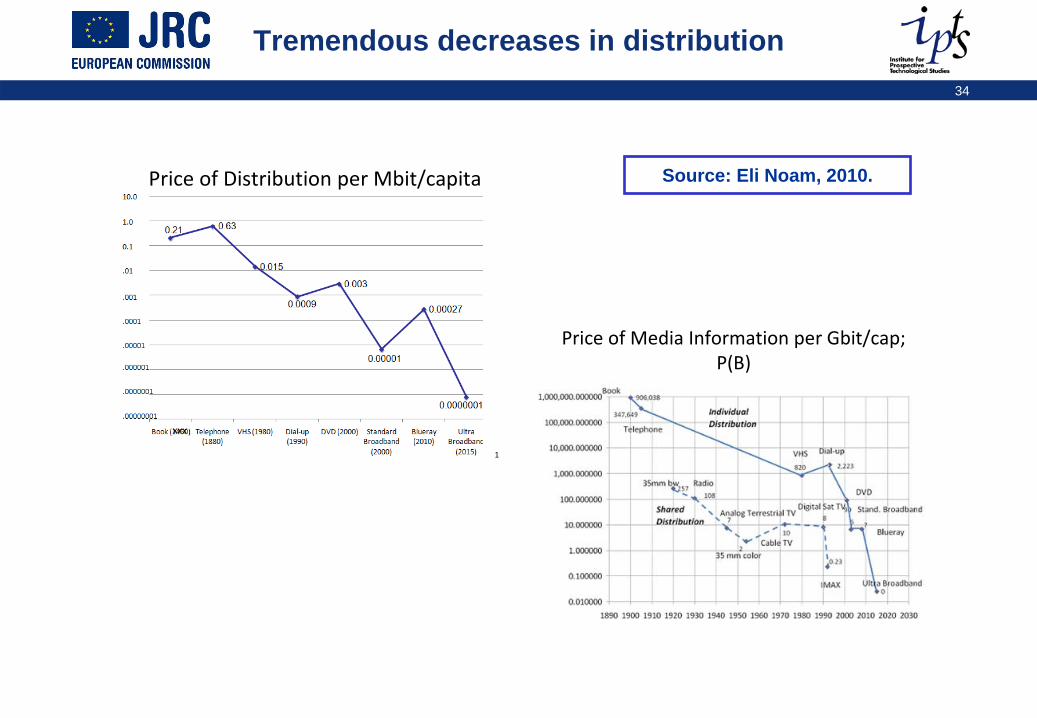
Tremendous decreases in distribution
Price of Distribution per Mbit/capita (Individualized Channels)
1
xxx
Price of Media Information per Gbit/cap; P(B)
101
Source: Eli Noam, 2010.
35
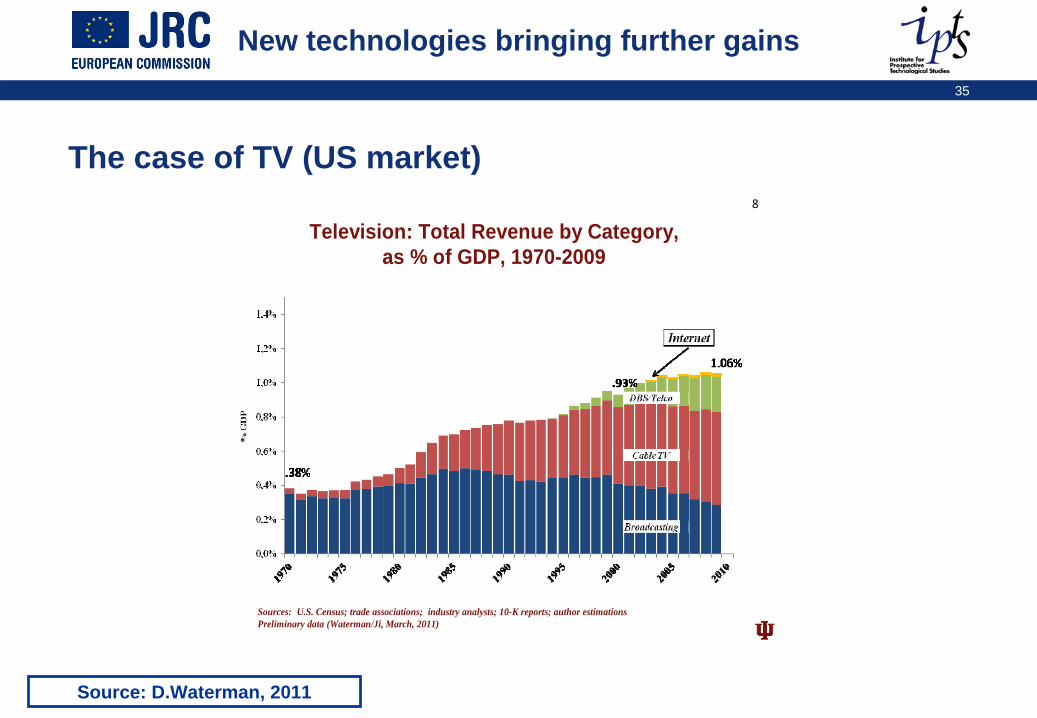
New technologies bringing further gains
The case of TV (US market)8
Television: Total Revenue by Category,as % of GDP, 1970-2009
Sources: U.S. Census; trade associations; industry analysts; 10-K reports; author estimationsPreliminary data (Waterman/Ji, March, 2011)
Source: D.Waterman, 2011
36
New business models and value chain
37
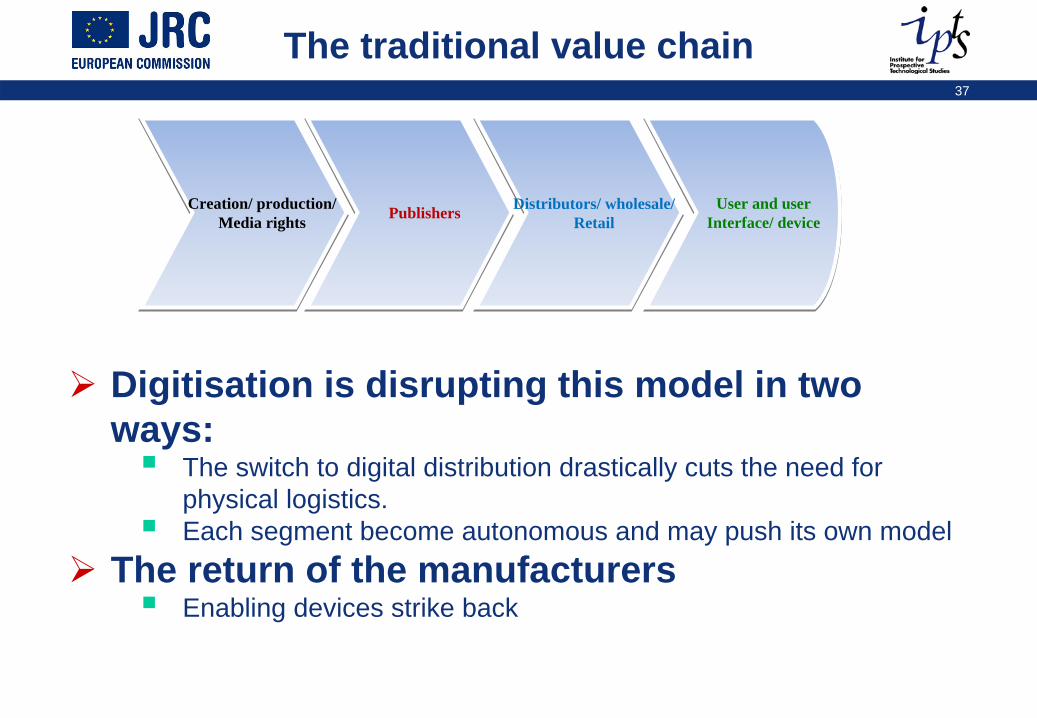
The traditional value chain
Digitisation is disrupting this model in twoways:
The switch to digital distribution drastically cuts the need forphysical logistics. Each segment become autonomous and may push its own model
The return of the manufacturersEnabling devices strike back
Creation/ production/Media rights Publishers Distributors/ wholesale/
RetailUser and user
Interface/ device
38
Stranded value chains
Each segment of the legacy value chain is now competingwith the segments
Under « alien » business modelsThe legacy value chain overlaps with the online value chain
creating a much more complex but so far unstable market structure with the media sector
standing, up to now, for a small slice ( US $ billion 16 + 42) of the entire online pie (US $ billion 732).
A significant change in the dynamics of the sector, shifting the balance of power on a global scale.
The balance of the value is shifting toward the downstream That value may be not only shifted but destroyed in the old media by the capture of consumers and traffic,
it can no longer be regained as was once the case. A drastic move, in sharp contrast to the local/ domestic aspect of legacy media markets (entrenched services)
with the limited exception of music.
39
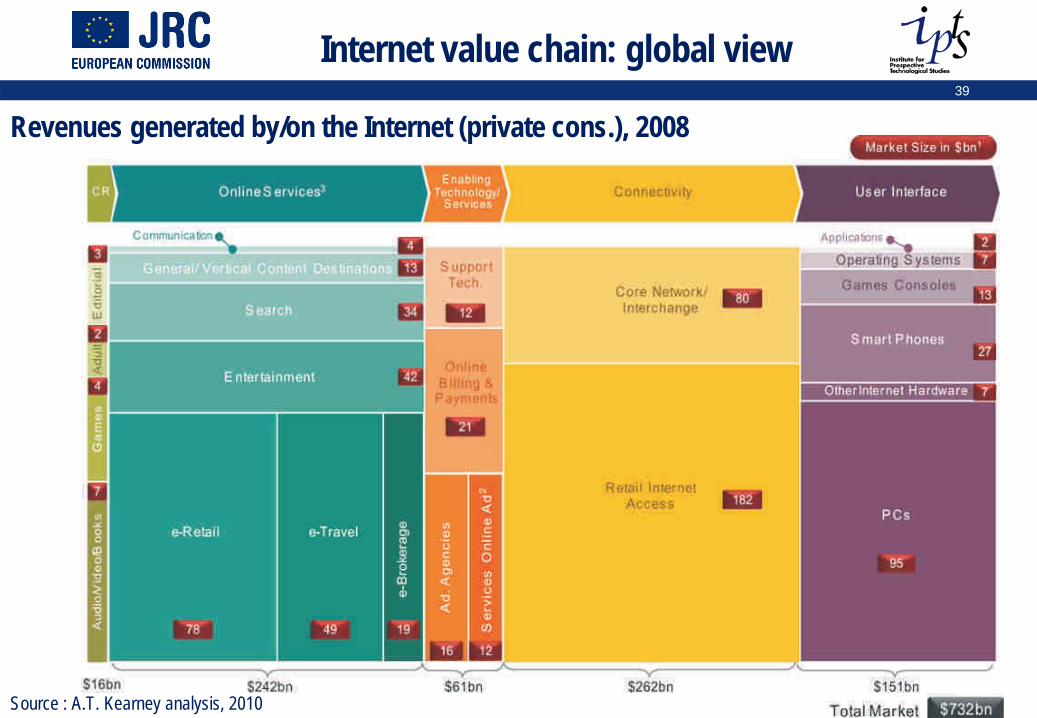
Internet value chain: global view
Source : A.T. Kearney analysis, 2010
Revenues generated by/on the Internet (private cons.), 2008
40
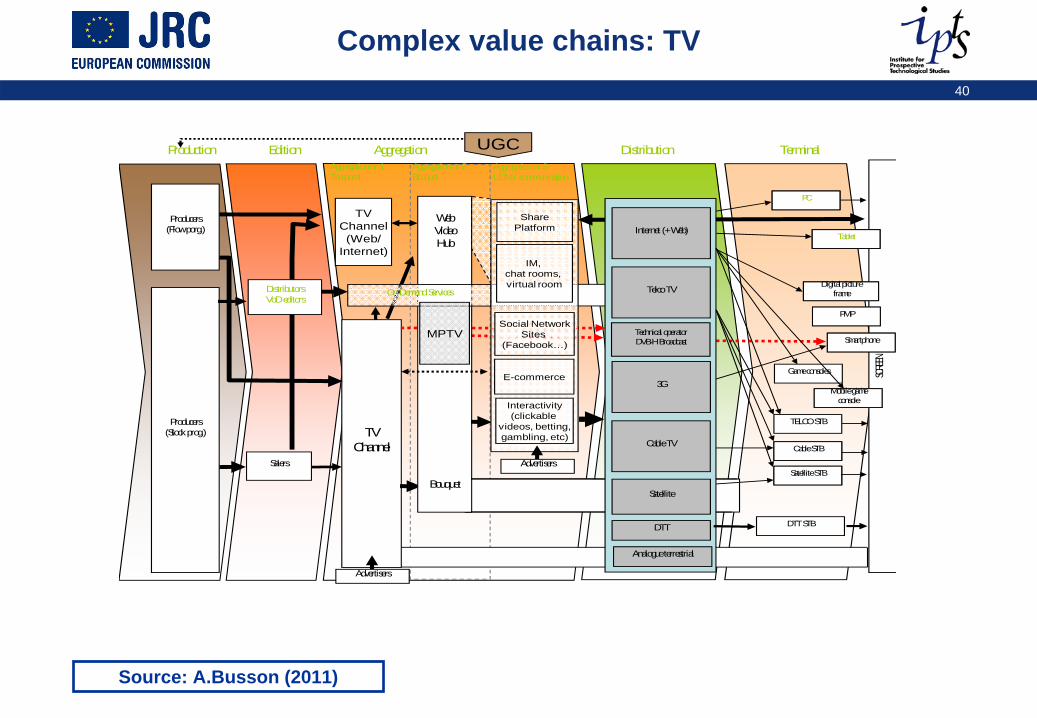
Complex value chains: TV
SCRE
EN
TVChannel
Production
Salers
Aggregation nr 1Temporal
Aggregation nr 2Bouquet
Aggregation Distribution
Advertisers
Edition Terminal
Console de jeuportable
Aggregation nr 3UGM / communication
PC
STB Cable
TVChannel(Web/
Internet)
Producers(Stock prog.)
Producers(Flow porg.)
DistributorsVoD editors
UGC
WebVideoHub
Bouquet
On Demand Services
Internet (+ Web)
Telco TV
Cable TV
3G
Satellite
Technical operatorDVB-H Broadcast
PMP
Smartphone
Tablette
Cadre Photo
STB Satellite
MPTV
Mobile gameconsole
PC
Cable STB
TELCO STB
PMP
Smartphone
Tablet
Digital pictureframe
Satellite STB
Game consoles
IM, chat rooms, virtual room
Social NetworkSites
(Facebook…)
Interactivity(clickable
videos, betting,gambling, etc)
SharePlatform
DTT STBDTT
Analogue terrestrial
Advertisers
E-commerce
Source: A.Busson (2011)
41
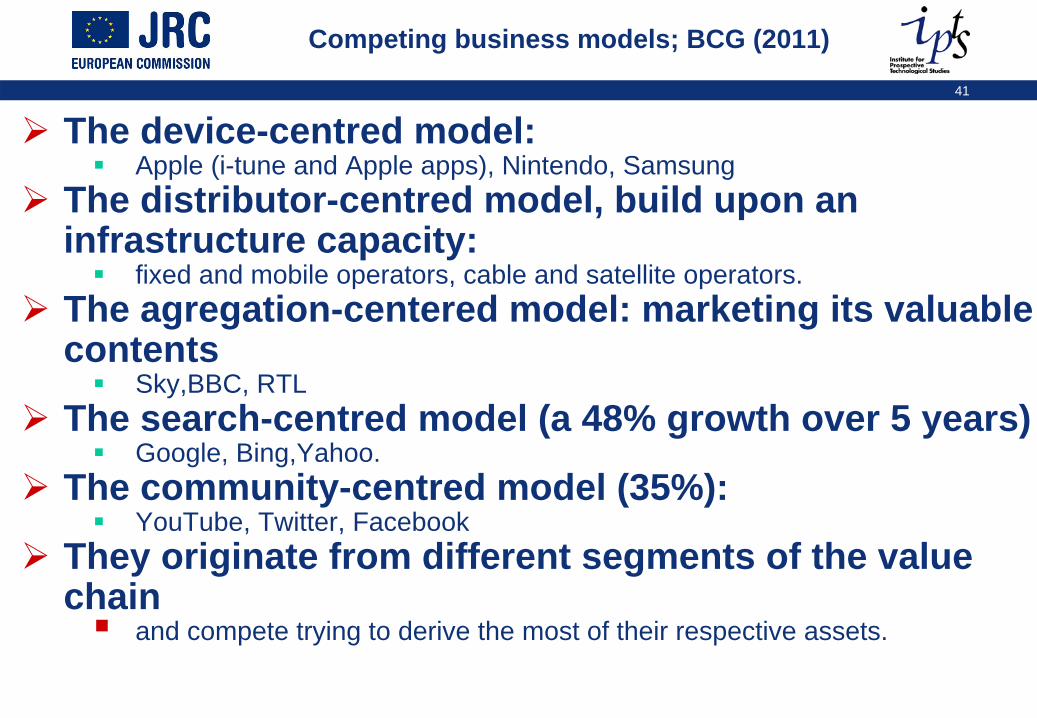
Competing business models; BCG (2011)
The device-centred model: Apple (i-tune and Apple apps), Nintendo, Samsung
The distributor-centred model, build upon an infrastructure capacity:
fixed and mobile operators, cable and satellite operators.The agregation-centered model: marketing its valuable contents
Sky,BBC, RTL The search-centred model (a 48% growth over 5 years)
Google, Bing,Yahoo.The community-centred model (35%):
YouTube, Twitter, FacebookThey originate from different segments of the value chain
and compete trying to derive the most of their respective assets.
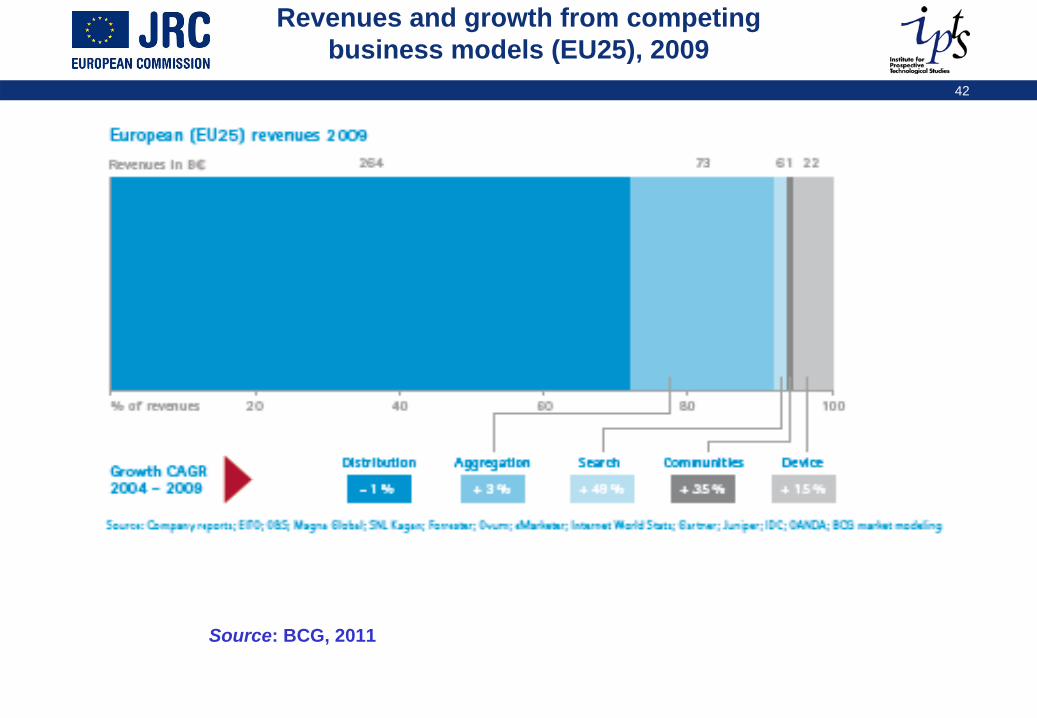
42
Revenues and growth from competing business models (EU25), 2009
Source: BCG, 2011
43
Transitioning away from legacy business models (1)
The "natural" tendency (first phases) is to duplicate the legacy business models from the analogue/physical world to the digital world.Even is the case of the video games industry, video games publishers tried to adopt the "old" video games industry business models to their on line distribution.
Same with mobile games publishers (content providers).
The evolving business models are an output of two simultaneous processes:
the overall trend of transformation of digital products into services,and the processes of disintermediation and re-intermediation.
44
Transitioning away from legacy business models (2)
Disintermediation: Direct sales from the producer/ creator/ developer become possible. In the case of video games, a developer selling directly to the consumer on line will receive 5 euros back, instead of 4 through the legacy retail value chain (the publisher keeps 26 euros, the distributor 10 euros and the retailer another 10 euros) .
Reintermediation: App shops are bringing new streams of secured revenues through their large customer base but they handle the relationship with the customers and set retail prices.
45
The pay models (1)
Pay as you go: on line transactions allow a variety of pay-per-transaction model according to the kind of content that is being bought,Users pay a separate fee for every piece of content they download, listen/watch or play with.
They can pay by download on a temporary (equivalent to rental) basis or on a perennial basis (sale). Example of temporary pay-per-download: Apple’s iTunes Store. Pay-per-listen/view services are mainly streaming based services that prevent users from storing content.
This model, pioneered by iTunes (which had over 100 million accounts in 2009 celebrated its 1 billionth download in February 2010), remains the largest revenue source in the online sector.
Pricing can be left to consumers as experienced by the group Radiohead letting their audience decide how much to pay for a track.
With a clear trend toward more itemized sales (song, article, pages of books, avatars).
46
The pay models (2)
Subscription model: users pay a periodic flat fee and receive the right to download or listen to/watch content (un)limitedly for a certain period of time.
The standard model for cable and satellite TV, often marketed through bundles (tiered offers) also for VOD (S-VOD).
Spotify, an EU firm, and Last.fm. , are streaming platforms in the music sector.Virgin Media UK launched a mobile music store based on the book club model:
for a monthly fee (3.36 euro) subscribers can download five tracks per month (PWC, 2011).
Services (secondary and additional revenue options): in an on line world bundles will more and more include numerous services.
App stores are offering brokerage services, indirect marketing (like newspaper used to do). New entrants, such as telcoes, can offer billing services. Classified ads are a well known source of revenues that shifted on line.
47
The free models (1)
Advertising supported service model: A typical two-side market arrangement, the aggregator charge advertisers to reach the eyeballs of the consumers (economies ofscale).
Streaming takes the place of over-the-air distribution. On-line distribution allowed new forms
such as in-stream or in-page ad with various sharing agreement with the right holders (per click, per hit…) and especially more focused advertising, as well as viral marketing. However, it raised new questions about the kind of metrics to use to charge advertisers (per click, video view, engagement...) rather than the standard “cost per mille” (CPM).
Free on line video providers are nevertheless trying to move toward pay models:
YouTube opened a video rental store in April 2010, Hulu offers a paid version on the iPad.
48
The free models (2)
Freemium: the content is made available for free on line.Some customers may be willing to buy items as illustrated by the example of video games.
The model is build on economies of scale. Bigpoint, a German video games company, distributes free browser games to its customers basis of 110 million users (as of March 2010) out of which 10% will buy some items for a small amount.
This is an innovative use of a two sided market with a segmented pricing (or non pricing scheme).
The video game hit maker firm Zynga (Angry Birds) sums up nicely this approach: "Games should be free. Free games are more social because they’re more accessible to everyone. We’ve also found them to be more profitable. We have created a new kind of customer relationship with new economics— free first, high satisfaction, pay optional".
Non commercial models: maintained by a community (see Wikipedia) or sponsored, as well as public service
the BBC iStore is a notorious model. The public service is not totally free as it funded through a specific tax
license fees in the case of public broadcasting). Public subsidies (often indirect through various funds) are also found in the case of newspaper, cinema or books.
49
Creative destruction: value creation
50
Shift of value
Players, are facing drastic shifts of valueThey still struggle to understand where the source of values liesMost, if not all, existing players have concerns about the shift of value from the "old" (off-line) world to the new on line world.
The more optimistic players are hoping for a zero sum game, the less so claiming this shift of value does not offset the loss of revenues, the more pessimistic highlight value destruction (recorded music trade association, IFPI, 2011).
The data published by PWC (2011) show a clear growth of the digital share of the global entertainment and media spending and a none the less clear decline of the non digital spending
51
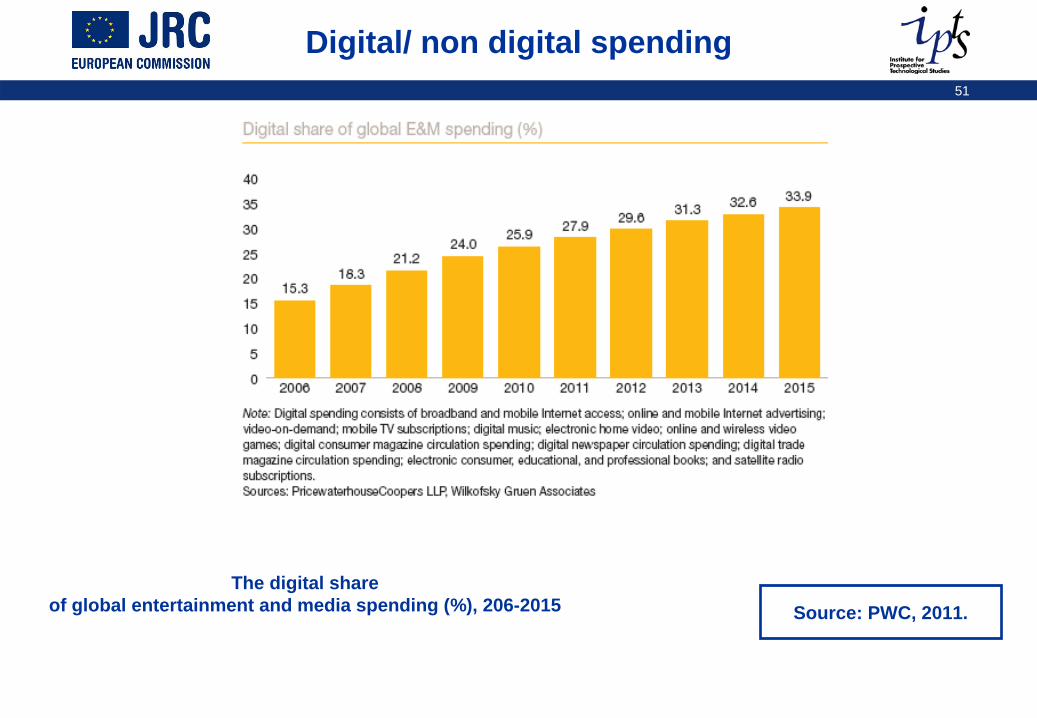
Digital/ non digital spending
The digital share of global entertainment and media spending (%), 206-2015 Source: PWC, 2011.
52
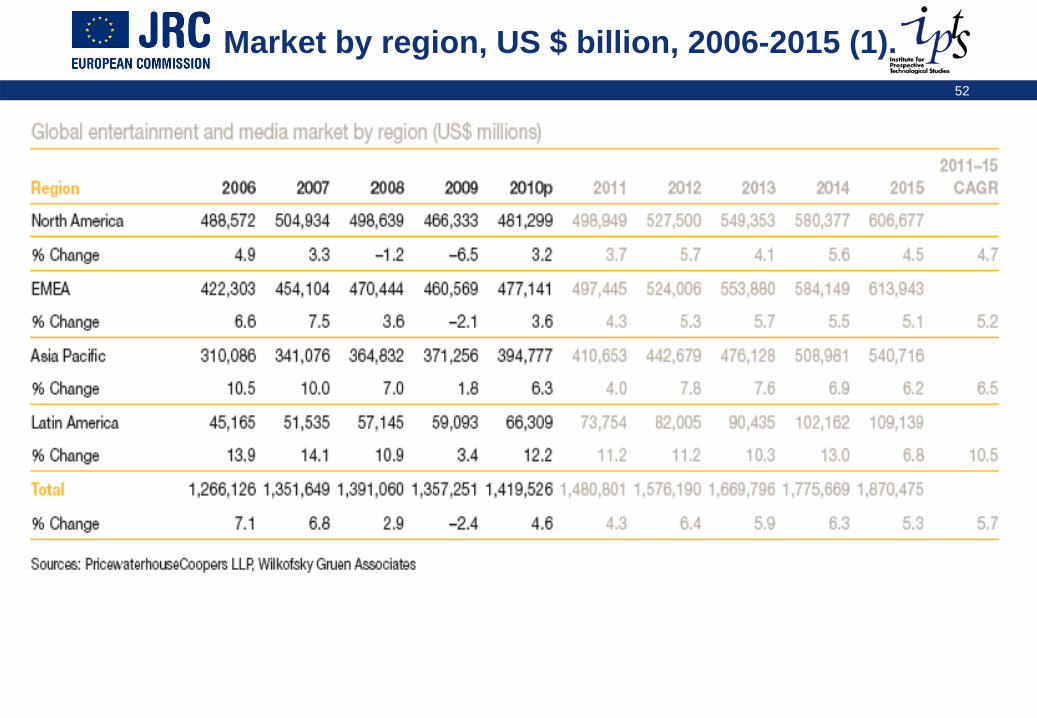
Market by region, US $ billion, 2006-2015 (1).
53
Market by region, US $ billion, 2006-2015 (2).
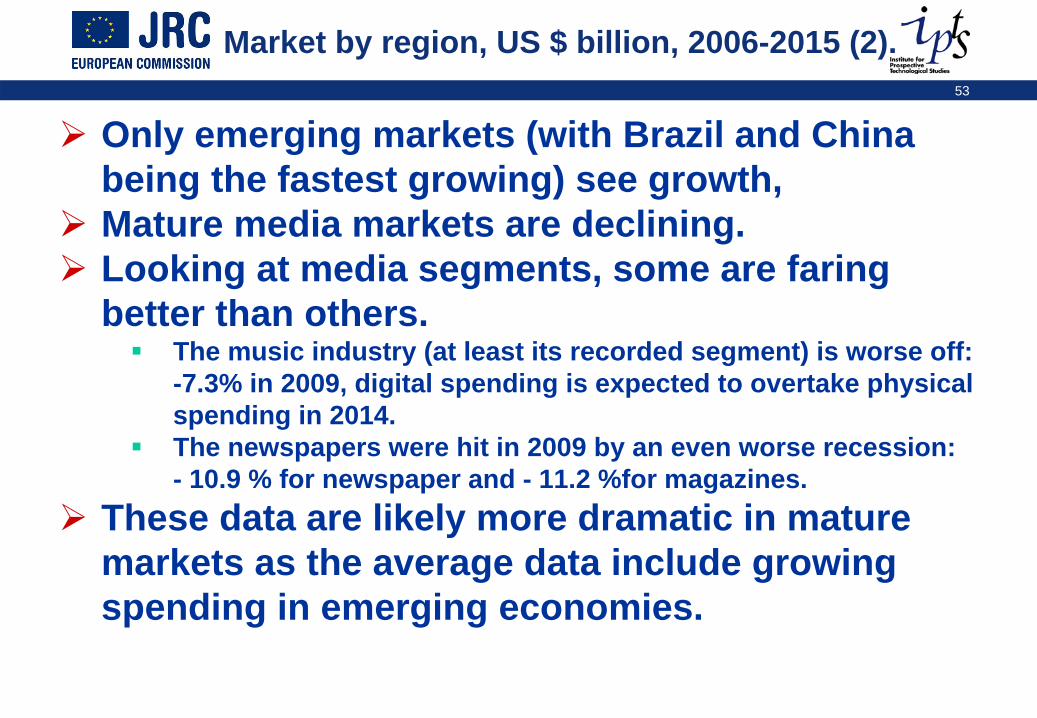
Only emerging markets (with Brazil and China being the fastest growing) see growth, Mature media markets are declining. Looking at media segments, some are faring better than others.
The music industry (at least its recorded segment) is worse off:-7.3% in 2009, digital spending is expected to overtake physical spending in 2014. The newspapers were hit in 2009 by an even worse recession: - 10.9 % for newspaper and - 11.2 %for magazines.
These data are likely more dramatic in mature markets as the average data include growing spending in emerging economies.
54
US long term evolution (1)
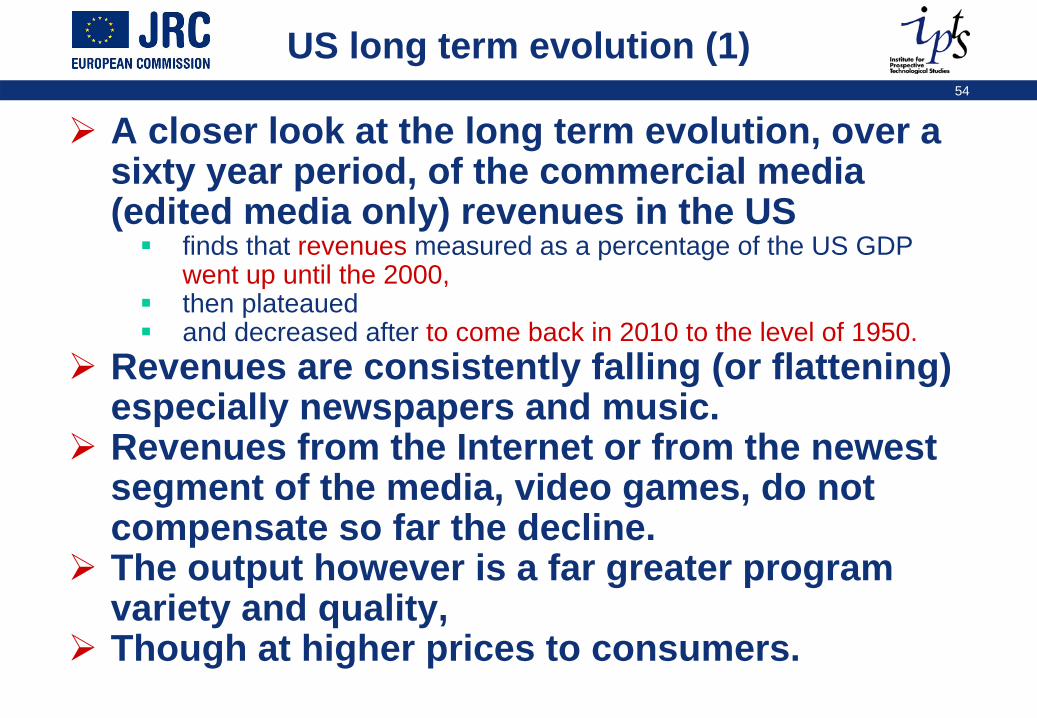
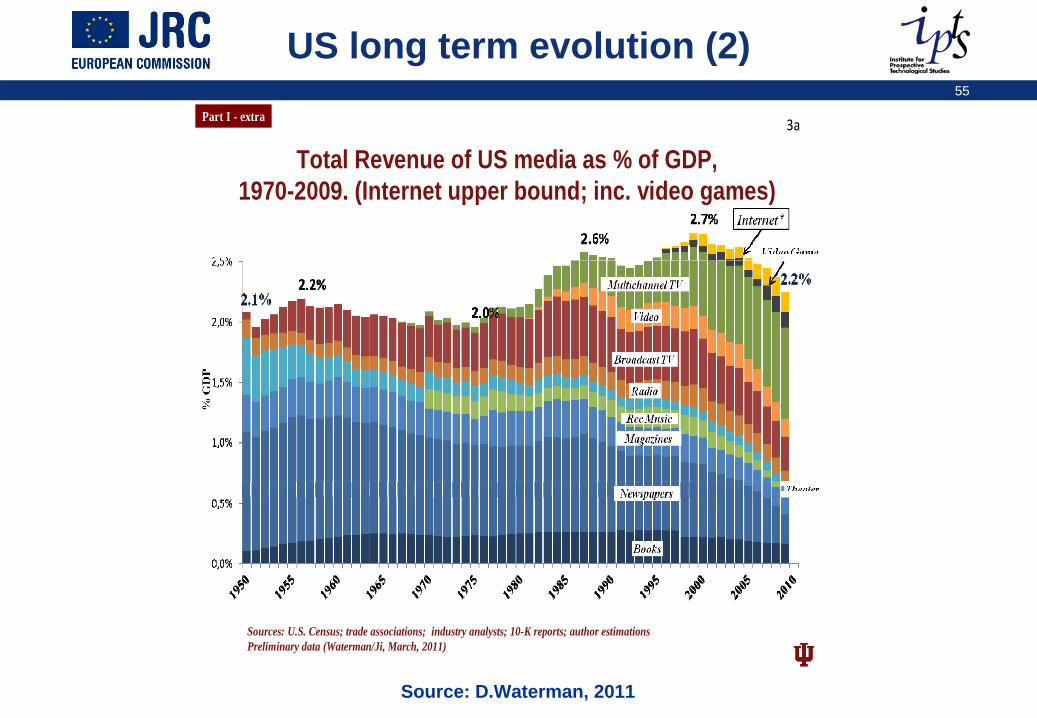
A closer look at the long term evolution, over a sixty year period, of the commercial media (edited media only) revenues in the US
finds that revenues measured as a percentage of the US GDP went up until the 2000, then plateauedand decreased after to come back in 2010 to the level of 1950.
Revenues are consistently falling (or flattening) especially newspapers and music. Revenues from the Internet or from the newest segment of the media, video games, do not compensate so far the decline. The output however is a far greater program variety and quality, Though at higher prices to consumers.
55
US long term evolution (2)
3a
Total Revenue of US media as % of GDP, 1970-2009. (Internet upper bound; inc. video games)
Sources: U.S. Census; trade associations; industry analysts; 10-K reports; author estimationsPreliminary data (Waterman/Ji, March, 2011)
Part I - extra
Source: D.Waterman, 2011
56
Conclusion
Source: Saul Steinberg
57
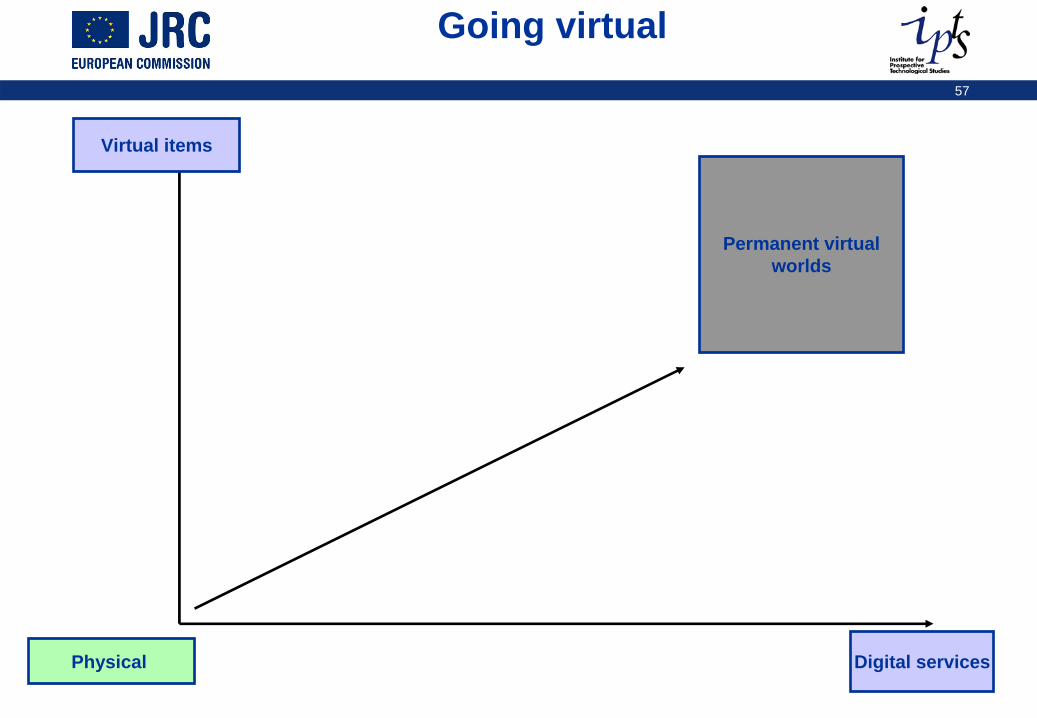
Going virtual
Physical
Virtual items
Digital services
Permanent virtualworlds
58
Conclusion (1)
Moving away from physical goods enables to supply more services (unlimited?)There is already a clear trend toward more itemized sales (song, article, pages of books, avatars).
In a virtual world almost anything can be itemizedAs illustrated with video games: 3 billion virtual items are used every day by Zynga customers
Innovative business models offer novel ways to monetize the serviceWe may not be there yet and the sustainability of most business models is still a question mark.As competition in increasing in the global ecosystem with clashing business modelsgrounded in different assets and business values/ culture
59
Conclusion (2)
Economies of scale matters more and moreExpensive content also exhibits strong economies of scale on the content production side, and network externalities on the demand side. Both favour content providers with big budgets
that can diversify risk, can distribute over other platforms, have a strong brand, and can coordinate specialized inputs.
The major media firms then become mainly coordinators, integrators, and financiers of the specialist firms, and the branders of the final products in a global market.
60
Conclusion (3)
For US economist E.Noam this clearly means: Hollywood in combination with Silicon Valley.
Not the best possible news for the EU industry, taking into account the dominant position of the US in both the audiovisual and the IT sector.
However some EU sub-sectors seem to hold a competitive advantage The EU book sector well placed for global competition, with leading global firms.Some highly creative segments in video games, audiovisual…Watch out for the growing role of emerging countries
Enablers of growth at the global level,But also for media.
61
Conclusion (4)
Core revenues and activities remain keyOne factor accounting for some of the reluctancy of legacyplayers
Transitioning away from legacy business models isdifficult to achieveThe business models are still based on time sequences (windowing) and geographyMost markets remain national
Therefore the EU market is fragmentedWith limited cross-border circulation of worksNo single market for contents with the exception of music?
“As contents have different value in different markets”
62
More work ahead?
Substantial pieces of workBut still need for an overall synthesisAnd policy recommandations
For instance, if distribution is no longer controlled by content producers, or by European players a new approach to support European content producing?
Further work requested to document some of the main aspects for a digital single market
Role and evolution of copyright in a digital worldNo longer only an enabler of content production and distribution?, How to manage the asset: creating and marketing copyright. « the great battle of the digital area » ?
Growth of new segments grounded is some EU strengths: mobile entertainment (over 35 billion euros, mBox 2010)Better understanding of the economics of production v. economicsof distribution of media goods and services (multisided markets)


![Dynamics of bhagidari [bagedari] sector in india](https://img.pdfslide.us/doc/110x75/5589257dd8b42abc2f8b45c6/dynamics-of-bhagidari-bagedari-sector-in-india.jpg)