Embed Size (px)
Citation preview
The DNA of Source-to-Pay: Cracking the Code on a Business Case for Procurement Transformation

Agenda
• About Zycus
• Building the Business Case:
– Source-to-Pay Value Levers
– Establishing Baseline and Target Performance
– Developing the Pro-Forma
• Future State Vision – Procurement Transformed

Comprehensive Source-to-Pay Suite

Recognized Market Leader
Gartner Magic Quadrant 2013
Challengers Leaders
Visionaries Niche players
Abilit
y to
exe
cute
Completeness of vision
Key Gartner Findings
Product Quality “Zycus has the most even product set of all the vendors in the magic quadrant, with no missing modules and all modules scoring in the top 50% of the field.”
Customer Satisfaction “Zycus was the second highest ranked leader’s quadrant vendor in terms of customer satisfaction. “

Customer Vertical Market Focus
Pharmaceuticals
Food & Beverage
Manufacturing
Electronics
BFSI
Oil & Gas

Building the Business Case
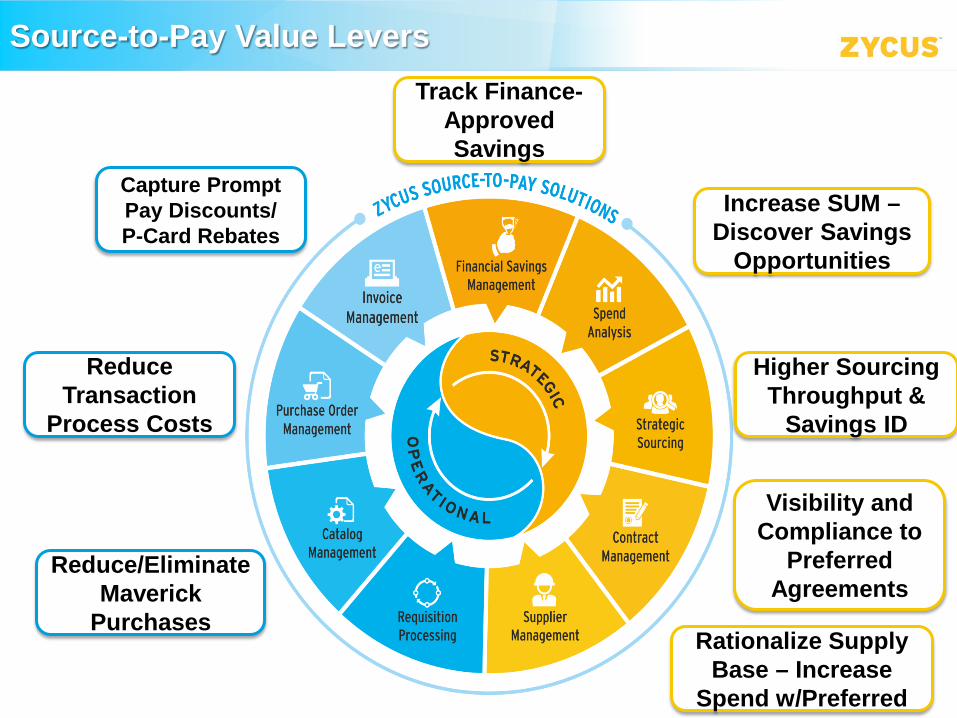
Source-to-Pay Value Levers
Increase SUM –
Discover Savings Opportunities
Higher Sourcing
Throughput & Savings ID
Rationalize Supply Base – Increase
Spend w/Preferred
Visibility and Compliance to
Preferred Agreements
Reduce/Eliminate
Maverick Purchases
Capture Prompt Pay Discounts/ P-Card Rebates
Reduce
Transaction Process Costs
Track Finance-
Approved Savings

Baseline and Target Performance - SUM
Selected Industry Benchmarks
Source: CAPS Research Cross-Industry Benchmarks
Aerospace & Defense
Automotive & Transport
Chemical Manufacturing
Pharmaceutical Financial Services
Industrial Manufacturing
Metals & Mining
Petroleum Utilities
% SUM 93.00% 93.08% 77.70% 82.91% 63.86% 85.18% 83.61% 81.66% 67.91%
Benchmark Laggards Average Best-in-Class
Spend Under Management 22% 62% 80%
Cross-Industry Benchmarks
Establish Baseline - Spend Actively Sourced/Managed by Procurement
Sourceable Spend
Set Target – Goal to Achieve Best-in-Class/Industry Standard
Source: Aberdeen Group

Gartner research shows Top Performers have more than 95% of spend accurately classified to a sufficiently detailed level for procurement to analyze and scope potential sourcing savings.
Baseline and Target Performance – Spend Visibility
Establish Baseline – Current Spend Visibility at Granular Level
Set Target – Goal to Achieve Best-in-Class

Baseline and Target Performance - Savings
2.13% 2.73%
2.30% 2.29% 2.00%
3.06% 3.39%
2.19% 2.93% 2.97%
4.94% 5.54%
4.40% 5.25%
4.80%
7.04% 7.68% 7.56%
6.46%
5.34%
2005 2006 2007 2008 2009 2010 2011 2012 2013 2014
Non World Class World Class
Total Spend Cost Savings Total spend cost savings (reduction and avoidance) as a percent of annual spend
The Hackett Group Procurement Benchmark-2014
Establish Baseline – Identify Current Savings on SUM
Set Target – Incremental Savings By Achieving World-Class
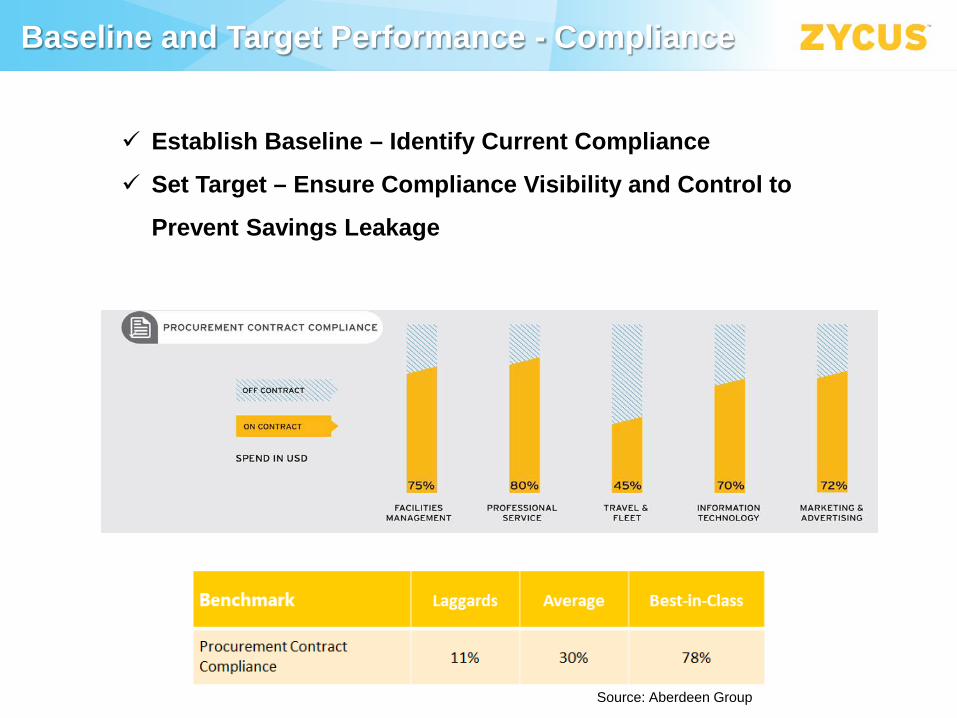
Baseline and Target Performance - Compliance
Source: Aberdeen Group
Establish Baseline – Identify Current Compliance
Set Target – Ensure Compliance Visibility and Control to
Prevent Savings Leakage

Baseline and Target Performance – Transactional Efficiency
Source: Hackett Group Procurement Benchmarks
Establish Baseline – Identify Transaction Cost and
Discount/Rebate Capture Rate
Set Target – Goal to Achieve World-Class
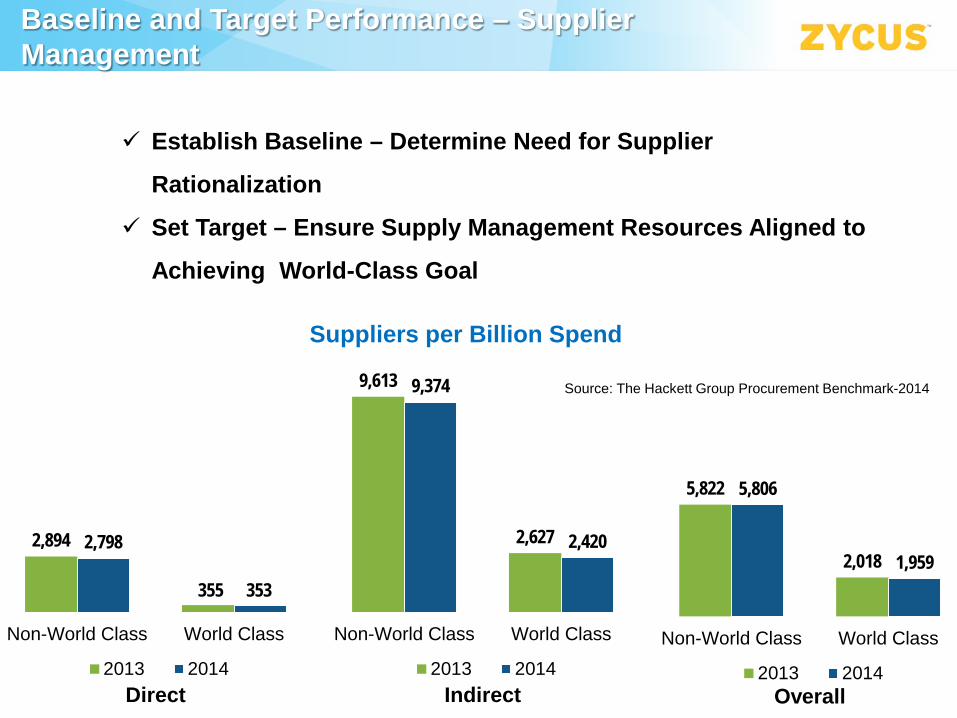
Baseline and Target Performance – Supplier Management
2,894
355
2,798
353
Non-World Class World Class
2013 2014
9,613
2,627
9,374
2,420
Non-World Class World Class
2013 2014
5,822
2,018
5,806
1,959
Non-World Class World Class
2013 2014Direct Indirect Overall
Establish Baseline – Determine Need for Supplier
Rationalization
Set Target – Ensure Supply Management Resources Aligned to
Achieving World-Class Goal
Suppliers per Billion Spend
Source: The Hackett Group Procurement Benchmark-2014

Baseline and Target Performance – Additional Considerations
Increased Revenue from Procurement-led Supplier Innovation 3.5%
7.4% AverageTop Quartile
Source: The Hackett Group Procurement Benchmark, 2014
13
4.5 2
Top Quartile Median Bottom Quartile
Reduced Supply Risk Exposure
Increased Stakeholder Satisfaction
Number of procurement FTEs focused on supply risk

Developing the Pro-Forma `
Pro-Forma Business Case
Total Adressable Spend $350,000,000 Esitmated Spend Not Under Management (%) 43%Estimated Spend Under Management (SUM - %) 57% Targeted SUM (%) 80%Realized Savings (%) 6% Req-to-Order Cycle Time (Days) 1Annual Requisition Volume 45,000 Invoice Processing Cycle Time (Days) 7Annual Purchase Order Volume 60,000 Per PO Processing Cost $11.63Annual Invoice Volume 225,000 Per Invoice Processing Cost $6.67Current Prompt Pay Discounts (% of Spend) $140,000Current P-Card Rebates -
ComponentCurrent Incremental
ImprovementTarget
PerformanceIncremental
Savings
Incremental Negotiated and Realized Savings($) 57% 23% 80% $4,800,000Incremental Prompt Pay Discount Savings ($) 0.04% 0.12% 0.16% $420,000Incremental P-Card Rebates Savings ($) 0.00% 11.00% 11.00% $385,000PO Processing Cost ($) $11.63 59% $4.80 $409,800Invoice Processing Cost ($) $6.67 69% $2.06 $1,037,250
Total Savings $7,052,050Cycle Time Improvement:
Requisition-to-Order Cycle (Days) 3 67% 1 *Invoice Processing Cycle (Days) 25 76% 6 ** Note: Assumes Best-in-Class Cycle Time Achievement with P2P of 1 Day Order and 6 Days Invoice Process Cycle Times
Business Metrics - Annual Spend & Transaction Volume
Business Value - Savings & Process Improvement

Future Vison – Procurement Transformed

Best-in-Class Technology Adoption and Benchmarks
Spend Analysis (80%)
Sourcing (57%)
Contract Management
(68%)
Procure-to-Pay
(65%)
Supplier Management
(63%)
Financial Savings
Management (Emerging)
• Procurement/Finance collaboration 4.35 out of 5 – 3.5 for all others
• 2/3 can track savings impact to Financial Statements
• 72% follow formal/standard process
• 52% higher realized/implemented savings than all others
• 80% adoption rate – 2x
lowest performers • 60% more likely to have
classified/cleansed spend data
• 54% higher contract compliance rates than all others
• 15-20% faster contract creation and approval cycle time (~33 days) than all others
• 86% of POs contract compliant
• 2-3 days to on-board suppliers
• 71% more likely to monitor supplier
risk • 1% duplicated suppliers – 27% for
lowest performers • 2% suppliers catastrophic failure –
5% for lowest performers Source: Aberdeen Group Benchmarks
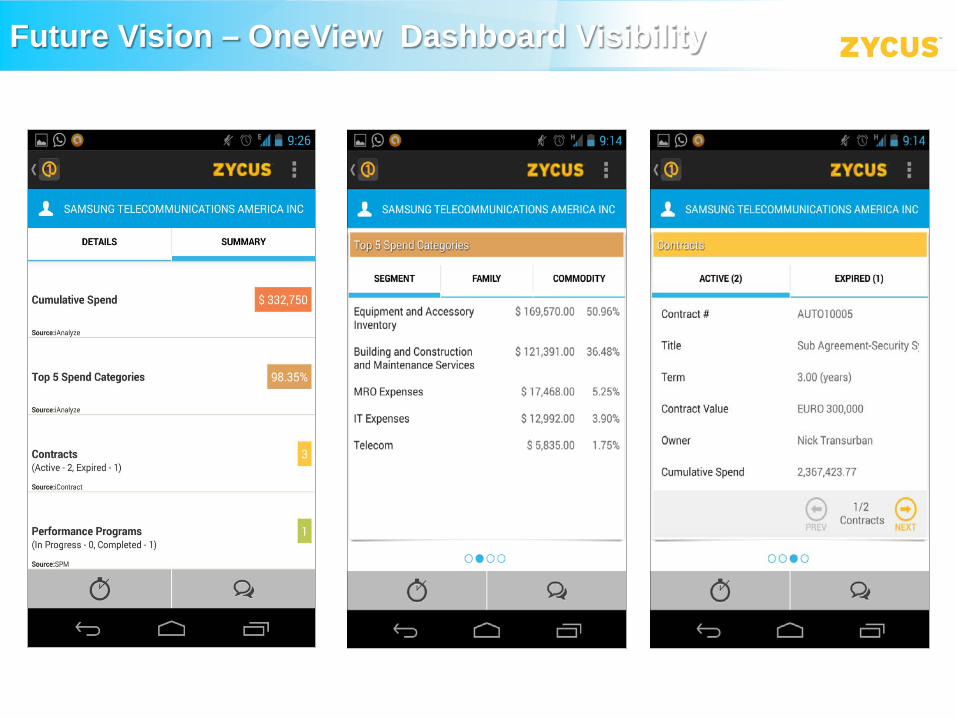
Future Vision – OneView Dashboard Visibility

Spend Management Dashboard
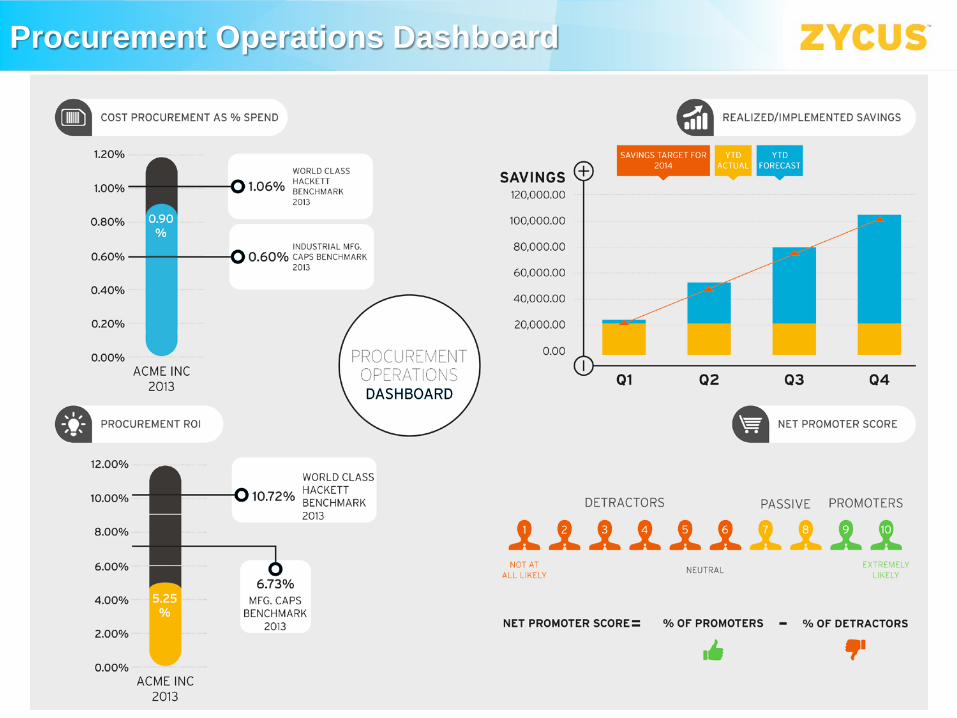
Procurement Operations Dashboard
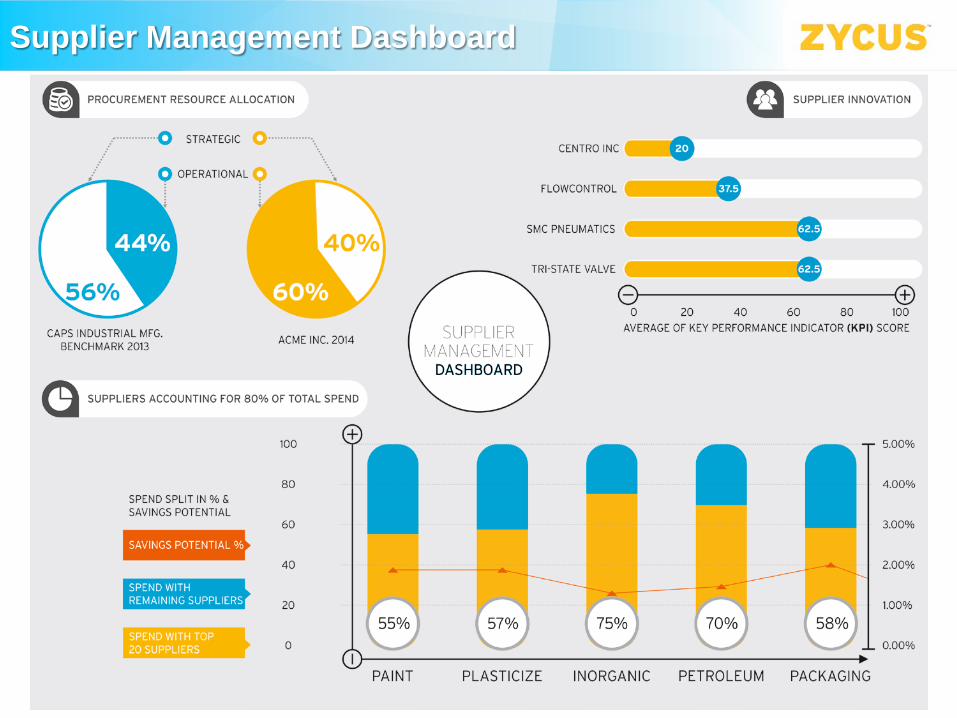
Supplier Management Dashboard

Q&A - Contact
For more information, please contact:
Richard Waugh, VP Corporate Development Zycus Inc. [email protected]