Embed Size (px)
Citation preview

Seediscussions,stats,andauthorprofilesforthispublicationat:https://www.researchgate.net/publication/301294281
TheDiversityofGreenBeanBiochemicalCompoundsinRobustaCoffee(CoffeacanephoraPierreexA.Froehner)asEvaluatedby...
ArticleinAustralianJournalofExperimentalAgriculture·April2016
DOI:10.9734/AJEA/2016/23004
CITATIONS
0
READS
35
10authors,including:
Someoftheauthorsofthispublicationarealsoworkingontheserelatedprojects:
HarnessingthegeneticresourcesofSorghum(SorghumbicolorL)inEasternAfricatoimprovedrought
toleranceandStrigaresistanceoffarmerpreferredcultivarutilizinginnovativegenomic,valuechainand
participatoryapproachesViewproject
KahiuNgugi
UniversityofNairobi
41PUBLICATIONS213CITATIONS
SEEPROFILE
AllcontentfollowingthispagewasuploadedbyKahiuNgugion15April2016.
Theuserhasrequestedenhancementofthedownloadedfile.Allin-textreferencesunderlinedinblueareaddedtotheoriginaldocumentandarelinkedtopublicationsonResearchGate,lettingyouaccessandreadthemimmediately.

_____________________________________________________________________________________________________ *Corresponding author: E-mail: [email protected], [email protected];
American Journal of Experimental Agriculture 12(2): 1-13, 2016, Article no.AJEA.23004
ISSN: 2231-0606
SCIENCEDOMAIN international www.sciencedomain.org
The Diversity of Green Bean Biochemical Compounds in Robusta Coffee (Coffea canephora
Pierre ex A. Froehner) as Evaluated by Near Infrared Spectroscopy
Pauline Aluka1*, Fabrice Davrieux2, Kahiu Ngugi3*, Rose Omaria4,
Fourny Gerard2, Thierry Leroy2, Magali Dufour2 and Pinard Fabrice2
1National Agricultural Research Organization (NARO), National Coffee Resources Research
Institute (NaCORI), P.O.Box 185, Mukono, Uganda. 2UMR AGAP, CIRAD, 34398 Montpellier, France.
3Department of Plant Sciences and Crop Protection, Faculty of Agriculture, College of Agriculture and Veterinary Sciences, University of Nairobi, P.O.Box 30197-00100, Nairobi, Kenya.
4National Agricultural Research organization (NARO), National Livestock Resources Research Institute (NaLIRRI), P.O.Box, Tororo, Uganda.
Authors’ contributions
This work was carried out in collaboration of all authors. Author PA collected samples, conducted the
NIRS experiments, data analysis and paper write up. Authors FD, FG, TL, MD and PF provided the technical expertise of NIRS results at CIRAD, France. Author KN directed, supervised the research,
contributed to paper writing and editing. Author RO assisted in spectra data collection in NaCRRI, Namulonge, Uganda. All authors read and approved the manuscript.
Article Information
DOI: 10.9734/AJEA/2016/23004
Editor(s): (1) Moreira Martine Ramon Felipe, Departamento de Enxeñaría Química, Universidade de
Santiago de Compostela, Spain. Reviewers:
(1) Edward Missanjo, Malawi College of Forestry and Wildlife, Malawi. (2) Shelley Gupta, Pune University, India.
Complete Peer review History: http://sciencedomain.org/review-history/14095
Received 9 th November 2015 Accepted 8 th January 2016
Published 9 th April 2016
ABSTRACT
Aims: This study characterized biochemical compound variability that influence green bean quality in C. canephora as a basis for identifying heterogeneous genotypes for use in crop improvement because genetic erosion aided by climate change effects is gradually threatening the cultivation of
Original Research Article

Aluka et al.; AJEA, 12(2): 1-13, 2016; Article no.AJEA.23004
2
Ugandan Robusta coffee (Coffea canephora) local races. Study Design: Four hundred and fifty four accessions from twenty four districts were analyzed with Near Infra Red Spectroscopy (NIRS) for six biochemical compounds using calibrations developed at CIRAD, France. Place and Duration of Study: This work was conducted at the National Coffee Resources Research Institute (NaCORRI), Uganda between January 2007 and December 2013. Methodology: Spectrometer Nirsystem 6500 Foss- (Denmark) machine and Software ISI NIRS 2 version 4.11 (Infra Soft International, Port Matilda, USA) were used to analyze ground samples in diffuse reflectance from 400 nm to 2500 nm (2 nm steps) and predictive models were used to quantify the biochemical contents in the green beans. Data was analyzed with XLSTAT version 2011.2.05 (Addinsoft), Paris, France. Results: Chlorogenic acid and fat concentrations of 13.26 and 13.19% dry matter respectively reported in this study, were much higher than 5.88 and 9.0% dry matter respectively reported earlier. Caffeine concentrations were positively significantly correlated with cholorogenic acid but negatively significantly correlated with trigonelline, sucrose, fat and dry matter contents. Caffeine and chlorogenic acid concentrations increased with age whereas trigonelline declined as trees aged. Chlorogenic acid and trigonelline concentrations were at their lowest levels in elevations of between 1000- 1200 metres above sea level and like fat and dry matter concentrations, the compounds were at their highest levels in higher elevations of about 1500 metres above sea level. Local landraces, ‘’nganda’’ and ‘’erecta’’ had higher concentrations of chlorogenic acid, sucrose and caffeine than improved, hybrid and commercial types. Conclusions: Ugandan C. canephora caffeine content was lower than that of West-African Robusta coffee but higher than that of Arabica coffee. Four distinct diversity groups derived from the six biochemical compounds represented the major organoleptic categories. The results reported here will be useful in defining the desirable cup qualities of Robusta coffee as demanded by world markets.
Keywords: Biochemical variability; cup quality; green bean; Robusta coffee. 1. INTRODUCTION Biochemical compounds that determine the coffee quality cup arise from precursors in green beans [1,2]. Flavor and aroma of roasted coffee result from the interactions of many different biochemical compounds such as sucrose, trigonelline, chlorogenic acids, caffeine and fat. Increased concentrations of chlorogenic acids and caffeine contents increase bitterness. High sucrose and high trigonelline contents are associated with better aroma. Fat content helps to fix flavor compounds formed during roasting [2,3]. The presence of these compounds helps to discriminate between the different coffee types making them key factors in the determination of organoleptic cup quality. Attributing any of the over 800 aromatic compounds present in roasted coffee to any flavor is not practical [4]. Instead indirect predictors such as sugars, lipids, proteins, chlorogenic acids, and methylxanthines analyzed through the traditional wet chemistry method or through indirect methods such as Near Infra Red Spectroscopy (NIRS) [5] have been recommended. Beverage quality for Robusta coffee could be selected using spectral data derived from biochemical compounds
analyzed during the crop growth period instead of liquor quality which is normally determined at the end of the cycle by wet traditional methods [6,7]. Several analytical methods in coffee biochemistry research have been used to determine the composition of substances, track chemical changes and concentrations in both volatile and stable samples. One of the methods use the High Performance Liquid Chromatography (HPLC) technique whose high sensitivity and resolution power make it suitable for routine chemical analysis, verification and for calibrating analytical instruments such as NIRS [8,9]. However, HPLC is costly and is based on the absorption of electromagnetic radiation at wavelengths in the range of 800–2500 nm. NIRS uses the higher energy near infra red range of 14000-40000 cm-1 (2.5-0.80 µm or 800 to 2500 nm) whose location is beyond the visible wavelength range and has greater penetration depth into the sample. The NIRS measurement is the ability by organic molecules made up of atoms such as carbon, oxygen, hydrogen, and nitrogen (C-H; O-H and N-H) linked to each other by covalent chemical bonds, to absorb light when the frequency of the radiation hitting the bond is equal to the vibration frequency of that bond

Aluka et al.; AJEA, 12(2): 1-13, 2016; Article no.AJEA.23004
3
[8,10]. The quantity of light energy (photons) absorbed follows Beer- Lambert’s Law, which is ;Aג=εCl [(absorbance A=log (1/R) or A = log (1/T) where R; radiation reflected and T; radiation transmitted]. The reflected and transmitted radiation gives an absorbance measurement proportional to concentration of molecules. The NIR analysis of food and agricultural samples is based on calibration against a reference method using a set of samples which represent the variability in the population [10]. In this work, NIRS was used because it is a fast and non-destructive method that does not require adjusting the equipment when determining the concentrations of dry matter, fat, caffeine, chlorogenic acid, trigoneline and sucrose in the coffee bean. NIRS can be used to monitor quality, determine blend levels, predict and quantify biochemical composition and physical properties in many complex products [5,11]. In coffee, NIRS has been used successfully to predict and quantify the biochemical content of green beans as well as identify and authenticate products according to fingerprint [8,9,11,12]. Values obtained from NIRS analyses have been deemed to be comparable to those from HPLC or from Gas Chromatography (GC) analyses. Eighty per-cent of Uganda’s coffee is Robusta which is considered by world markets to be inferior in cup quality to Arabica coffee due to its flavor. Coffee quality is normally a combined factor of seed, liquor and the final roasted product [5]. The overall, small bean size, lack of good flavor and pronounced bitterness are some of the undesirable traits in Robusta coffee that have lowered its prices compared to C. Arabica [16,17]. Despite this, Robusta coffee has some other well rated attributes in international markets such as a mild neutral brew that are comparable with the Arabica coffees [3,13]. Recently, coffee quality genes have been mapped and it is speculated that the high nucleotide diversity within protein nucleotide domain of 3'-untranslated region (3’UTR) for three genes that encode enzyme metabolic pathway for Kaurene Oxydase, Kaurene Synthase and CPS Ent-copalyl diphosphate synthase found in Ugandan Robusta landraces, may be the contributing factor to the biochemical diversity [14]. The aim of this study was to characterize the biochemical compounds variation that determine cup quality in the main Robusta Ugandan local land-races, namely ‘erecta’ and ‘nganda’ and in a few improved research cultivars. Characterizing
green bean biochemical compounds through a standard calibration method provides a means of not only predicting Ugandan Robusta coffee biochemical compound variability but also a foundation for building a coffee quality data base. 2. MATERIALS AND METHODS 2.1 Comparing the Precision of with
HPLC and NIRS Methods in Estimating Biochemical Diversity
Sixteen genotypes from a collection of 135 on-farm accessions were analyzed for their caffeine concentrations obtained through NIRS and HPLC methods as shown in Fig. 1.
2.2 Sample Preparation and NIRS Analysis
Four hundred and fifty four genotypes consisting of 369 from 21 Robusta growing districts, fifty nine from Kawanda Research Station, 10 from Entebbe Botanical gardens and 16 from Kituza were collected for NIRS analysis at NACCRI in stratified manner to minimize duplication, contamination and selfing. In each district, genotypes were sampled within a distance of 5 kilometers between lots of four farmers from trees aged ten years and above and farm records were used to verify age and cultivar type. Samples were dried to maintain, a moisture content of between 8.0 -12% in a silica dehydration chamber. About 20 grams of each green bean sample was chilled to freeze the fat in -20°C freezer for a day. Chilled green beans together with the motorized hand grinder were rapidly frozen with liquid nitrogen (-197°C) before grinding. The sample was ground thrice and sieved with a 1 mm sieve mesh. The grinder, sieve and the work place were cleaned and sterilized using alcohol of over 95% concentration. About 3.0 grams of homogenized powder was sampled randomly and packed in thoroughly cleaned and alcohol sterilized crystal cells with special lenses. Spectrometer Nirsystem 6500 Foss- (Denmark) machine and Software ISI NIRS 2 version 4.11 (Infra Soft International, Port Matilda, USA) were used to analyze samples in diffuse reflectance from 400 nm to 2500 nm (2 nm steps) [2]. Predictive models were used to quantify dry matter, caffeine, chlorogenic acids (CGA), trigonelline, sucrose and fat contents in green beans. A second derivative was used to calculate biochemical compounds with exclusion of water

Aluka et al.; AJEA, 12(2): 1-13, 2016; Article no.AJEA.23004
4
content because prior analysis of water composition in the homogenous ground green coffee showed effects coming from water were reflected in the differences in dry matter. The absorbance spectra for 135 genotypes are shown in Fig. 2. 2.3 Data Analysis The statistical package, XLSTAT version 2011.2.05 (Addinsoft, Paris, France) was used to determine biochemical compound variations as shown in Table 1. Spearman correlation coefficients were calculated to quantify the strength of paired biochemical compound relationship on an ordinal scale at 5% significance level (Table 2). The Principal Component Analysis (PCA) was used to aggregate bean biochemical compound contents into high internal homogeneity and high external heterogeneity. The factorial step discriminant analysis was used to spatially distribute multivariate groups on the principal component as shown in Fig. 6 and calculated the Mahalanobis and Fisher inter-group distances at 95% probability (Table 4). The PCA relationship of tree age, altitude and green bean biochemical compounds was compared with groups derived from factorial step discriminant analysis to
determine where the biochemical compounds were placed as shown in Fig. 7(a, b). The confusion matrix was used to estimate the efficiency of placing genotypes into correct groups in percentages as shown in Table 5. The variance contributed by each of the biochemical compounds to group formation and mean group abundance was estimated using Bray-Curtis distance measure as reflected in Table 6. 3. RESULTS Differences in amounts of caffeine derived from NIRS and HPLC techniques for 16 genotypes were plotted with a bar graph as shown in Fig. 1. The caffeine content from the two techniques was very close and insignificantly different. Robusta ground green coffee absorbance spectra are as shown in Fig. 2. The spectra peaks for genotypes varied in wavelength and amplitude. Table 1 shows a comparison of Ugandan Robusta coffee green bean biochemical compounds data with that reported by other authors. On average, the Ugandan Robusta coffee had more or less similar caffeine content as that reported by [4] but had less caffeine
Fig. 1. Comparison of caffeine values derived from HPLC and NIRS techniques
0.60
1.10
1.60
2.10
2.60
3.10
3.60
4.10
1 2 3 4 5 6 7 8 9 10 11 12 13 14 15 16
Co
nce
ntr
atio
n (%
DM
)
Robusta coffee genotypes
NIR HPLC

Aluka et al.; AJEA, 12(2): 1-13, 2016; Article no.AJEA.23004
5
content than that in West-African Robusta reported by [15]. Chlorogenic acid content was much higher than that reported by the two authors and also higher than that of Arabica coffee. Whereas, trigonelline and sucrose content values of Ugandan Robusta coffee were close to that of Robusta coffee in West Africa, the fat content in Ugandan Robusta coffee was much higher.
The correlations between the various compounds are shown in Table 2 for 452 samples. Caffeine content was significantly positively correlated with chlorogenic acid content but significantly negatively related with trigonelline, sucrose and fat contents. Chlorogenic acid was insignificantly negatively correlated with trigonelline but significantly positively correlated with sucrose and fat contents.
Fig. 2. Uganda ground green coffees absorbance spectra for 135 genotypes- spectra plot of absorbed light at a corresponding wavelength (Red line shown by the arrow is the mean
spectrum) Table 1. Comparison of Ugandan Robusta coffee green bean biochemical compound variability Source Species Range of biochemical values (% dry matter)
Caffeine % dm
CGA % dm Trigonelline % dm
Sucrose % dm
Fat % dm
Uganda Robusta Robusta 1.41-3.29 (Av. 2.33, SD 0.33)
10.88-15.64 (SD 0.71)
0.66-1.03 (SD 0.07)
2.48-7.34 (0.78)
10.44-15.94 (0.78)
W. Africa Ky et al., 2001a
Robusta 1.0–5.0 ** 0.75–1.24 4.05–7.05 **
Wintgens, 2004
Robusta 1.50-2.8 (Av. 2.2)
5.34-6.41 0.60-1.70 5.0-7.0 7.0-11.0
Arabica 0.70-2.2 (Av. 1.4)
4.80-6.14 1.0-1.20 6.0-8.0 13-17
**=values not provided by authors; R= Robusta; A=Arabica; Av.=average; % dm=Percentage dry matter; SD-standard deviation
Table 2. Correlation coefficients of C. canephora green bean biochemical compounds
Variables Caffeine (% dm) CGA (% dm) Trigonelline (% dm) Sucrose (% dm) Fat (% dm) Caffeine 1 CGA 0.51*** 1 Trigonelline -0.43*** -0.06 1 Sucrose -0.12** 0.21*** 0.21*** 1 Fat -0.17*** 0.38*** 0.37*** 0.22*** 1
P **, *** significant at 0.05, 0.0005 levels of probability; CGA= chlorogenic acid
Aluka et al.; AJEA, 12(2): 1-13, 2016; Article no.AJEA.23004
6
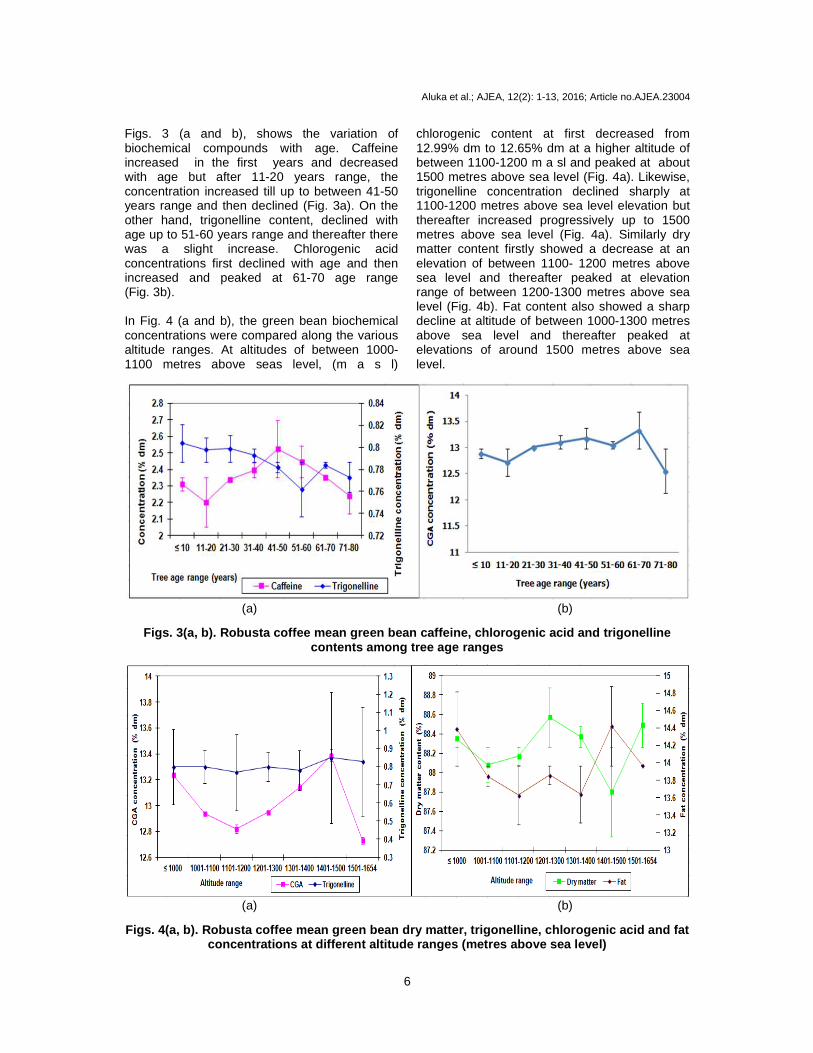
Figs. 3 (a and b), shows the variation of biochemical compounds with age. Caffeine increased in the first years and decreased with age but after 11-20 years range, the concentration increased till up to between 41-50 years range and then declined (Fig. 3a). On the other hand, trigonelline content, declined with age up to 51-60 years range and thereafter there was a slight increase. Chlorogenic acid concentrations first declined with age and then increased and peaked at 61-70 age range (Fig. 3b). In Fig. 4 (a and b), the green bean biochemical concentrations were compared along the various altitude ranges. At altitudes of between 1000-1100 metres above seas level, (m a s l)
chlorogenic content at first decreased from 12.99% dm to 12.65% dm at a higher altitude of between 1100-1200 m a sl and peaked at about 1500 metres above sea level (Fig. 4a). Likewise, trigonelline concentration declined sharply at 1100-1200 metres above sea level elevation but thereafter increased progressively up to 1500 metres above sea level (Fig. 4a). Similarly dry matter content firstly showed a decrease at an elevation of between 1100- 1200 metres above sea level and thereafter peaked at elevation range of between 1200-1300 metres above sea level (Fig. 4b). Fat content also showed a sharp decline at altitude of between 1000-1300 metres above sea level and thereafter peaked at elevations of around 1500 metres above sea level.
(a) (b)
Figs. 3(a, b). Robusta coffee mean green bean caffeine, chlorogenic acid and trigonelline contents among tree age ranges
(a) (b)
Figs. 4(a, b). Robusta coffee mean green bean dry matter, trigonelline, chlorogenic acid and fat concentrations at different altitude ranges (metres above sea level)

Aluka et al.; AJEA, 12(2): 1-13, 2016; Article no.AJEA.23004
7
Figs. 5 (a, b and c) show the distribution of the biochemical compounds in the four predominant Robusta cultivars grown in Uganda. Hybrid coffee types had significantly more dry matter (Fig. 5a) than other cultivars and commercial and hybrid types had significantly reduced caffeine, chlorogenic acid and sucrose content (Figs. 5a,b). The “nganda” types had the most sucrose while the hybrids had the lowest content (Fig. 5b). “Erecta” types had the highest chlorogenic acid and caffeine content whereas the hybrids had the lowest quantities (Fig. 5c). There were 162 genotypes with high amounts of caffeine and trigonelline compounds spread over 24 locations as shown by Table 3. Phenotypes with high chlorogenic acid and fat content were spread in all the 24 sites while beans with more dry matter and sucrose were wide spread in 23 locations. Beans rich in caffeine had high trigonelline content while those with high chlorogenic acid had the most fat content and the densest beans had more sucrose concentration (Table 3). Six green bean biochemical compounds from 452 Robusta coffee genotypes were plotted
using the PCA with a variability of 30.07% in axis 1 and 28.44% in axis 2 as shown in Fig. 6. Four diverse groups were formed, each in a quadrant. One category had more caffeine while another had more chlorogenic acid. Another group had more fat, sucrose and trigonelline. Another group of accessions had low chlorogenic and low fat content. The biochemical compound variability in the PCA plot was dominated by genotypes from Bundibudyo, Bushenyi and Bugiri that are all geographically distantly located to each other. The factorial step discriminant analyses of green bean biochemical compounds was used to calculate Mahalanobis (H) and Fisher inter-group distances at 95% probability as shown in Table 3. Mahalanobis distances between classes were all higher than 3 while all probability values for Fisher distances were highly significant (<0.0001) implying there were major variations in group biochemical compound concentrations. The respective Mahalanobis and Fisher distances of 14.22; 199.53 and 5.17; 72.51 between population 2 and 3 as well as between population 1 and 3 revealed that the former groups were the most unrelated while the latter were closely related.
(a) (b) (c)
Figs. 5(a, b, c). Robusta coffee mean green bean (a) dry matter, (b) caffeine and sucrose
(c) chlorogenic acid
Table 3. Aggregation of 452 genotypes based on highest green bean biochemical compound variance from the principal component analysis
Eigen value Var (%)
Cum % Variables Site Min Max Mean SDEV Total
F1 3.53 50.43 50.43 caf, trig 24 1 12 6.75 2.69 162 F2 0.98 14.02 64.45 CGA, fat 24 1 18 5.63 3.80 135 F3 0.78 11.16 75.61 dm, suc 23 1 9 3.57 2.17 82
F=factor; F1=factor1; Var%=variabilitypercentage; Cum%=cumulative percentage; caf=caffeine; trigo=trigonelline; CGA=chlorogenic acid; dm=dry matter; suc= sucrose

Aluka et al.; AJEA, 12(2): 1-13, 2016; Article no.AJEA.23004
8
Fig. 6. Principal component analysis of biochemical compound contents for 454 Robusta coffee genotypes
BG=Bugiri; BS=Bushenyi; BU=Bundibudyo farming districts
Table 4. Estimated Mahalanobis and fisher distances among Robusta coffee green bean biochemical compound groups as per factorial step discriminant analysis
Gp Mahalanobis distances Fisher distances p-values for Fisher distances 1 2 3 4 1 2 3 4 1 2 3 4
1 0 0 1 2 7.11 0 99.78 0 <0.0001 1 3 5.17 14.22 0 72.51 199.53 0 <0.0001 <0.0001 1 4 11.19 7.80 7.90 0 157.1 109.39 110.90 0 <0.0001 <0.0001 <0.0001 1
The PCA plot of green bean biochemical compounds was compared with the factorial step discriminant analysisgroups to determine the major group biochemical constitution in relation to elevation and age of the tree as shown in Figs. 7(a, b). Group one consisted of beans from young trees that had more dry matter, less caffeine and less chlorogenic acid. Group two were genotypes from low elevation that were deficient in sucrose, trigonelline and fat. Group three comprised genotypes mainly from higher elevation with more sucrose, trigonelline and fat. Group four were genotypes from mainly older trees that had more caffeine and chlorogenic acid.
Fig. 5a and b: Comparison of PCA plot of green bean biochemical compounds, altitude, tree age with groups derived from factorial step discriminant analysis Figs. 7 (a, b). Relationships of bean biochemical compounds with altitude and age (b) bean biochemical compound groups derived from factorial step discriminant analysis. Estimates of genotype correct placement are shown in (Table 5). The chance that genotypes were placed in the correct groups was about 94%.
Table 5. Percentage group placement and pair wise distance comparison for Robusta coffee green bean biochemical compounds using a confusion matrix
Confusion matrix from \ to 1 2 3 4 Total % correct 1 120 2 6 0 128 93.75 2 3 95 0 3 101 94.06 3 5 0 113 2 120 94.17 4 1 5 1 96 103 93.20 Total 129 102 120 101 452 93.80
BU12
BU11
BU10
BU09
BU08
BU07
BU06
BU05
BU04BU03
BU02
BU01BS15 BS11BS06
BS01
BS19BS18BS17 BS16
BS15BS14
BS13
BS12
BS10
BS09D
BS08
BS07BS05
BS04
BS03
BS02
BG17
BG16BG15
BG14BG14
BG13
BG12BG11BG10 BG09
BG08
BG07
BG06
BG05
BG04
BG03
BG02
BG01
Fat
Sucrose
Trigonelline
CGA
Caffeine
Dry matter
-4
-3
-2
-1
0
1
2
3
-6 -5 -4 -3 -2 -1 0 1 2 3 4 5
D1 (30.07 %)
D2 (2
8.44
%)

Aluka et al.; AJEA, 12(2): 1-13, 2016; Article no.AJEA.23004
9
(a) (b)
Figs. 7(a, b). Relationships between bean biochemical compounds with altitude and age
(b) Bean biochemical compound groups derived from factorial step discriminant analysis X and Y axes represent plot variance.
Table 6. Pooled Robusta coffee green bean biochemical compound variance contribution and
mean group content values derived from Bray-Curtis distance measurement Variance Mean group abundance
Contribution Cumulative % 1 2 3 4 Dry matter 0.40 23.27 87.7 87.8 88.4 89.2 Sucrose 0.39 46.15 5.02 4.33 5.85 5.49 Fat 0.38 68.39 13.9 13.3 14.5 13.3 Chlorogenic acid 0.36 89.2 13.5 12.4 13.2 12.4 Caffeine 0.16 98.26 2.53 2.3 2.23 2.23 Trigonelline 0.03 100 0.78 0.77 0.83 0.79
The variance contributed by each attribute to group formation and the mean averages are shown in Table 5. Most variance in the group formation was mainly contributed by dry matter (0.40) sucrose (0.39) and fat (0.38) contents and the least by trigonelline (0.03). Group 1 had more chlorogenic acid and caffeine but had the lowest dry matter content and moderate sucrose, fat and trigonelline contents. Group 2 had the lowest values for dry matter, sucrose, fat, chlorogenic acid and trigonelline but had moderate caffeine. Group 3 was described as having the most sucrose, fat, trigonelline but had moderate amounts of dry matter, chlorogenic acid and caffeine. Group 4 was explained as having high amounts of dry matter but had low values of fat, chlorogenic acid, caffeine and moderate amounts of sucrose and trigonelline. 4. DISCUSSION Estimation of caffeine content using Near Infra Red spectroscopy (NIRS) and High Performance
Liquid Chromatography (HPLC) gave similar results that were insignificantly different (Fig. 1) implying that bean caffeine concentrations can be derived from either HPLC or NIRS analyses in equal measure. Some authors such as [2,5,9] claim that NIRS techniques is more sensitive than HPLC because it has a lower detection limit and that NIRS analyzes many samples in a shorter time. Table 1 shows that Ugandan cultivated Robusta coffee beans had higher caffeine, chlorogenic acid and fat contents than Robusta coffee from West-Africa as reported by [4]. As expected the caffeine content was higher in Robusta coffees than in the Arabicas. Trigonelline and sucrose contents values from West Africa were almost similarto those in Ugandan Robusta coffees The high fat content found in the Ugandan Robusta coffee would bea desirable attribute in fixing flavor in roasted beans [2,3]. Also of interest in Robusta coffee quality is the amount of chlorogenic acid and caffeine alkaloids since

Aluka et al.; AJEA, 12(2): 1-13, 2016; Article no.AJEA.23004
10
they are the main components that contribute to the bitterness and astringency [15]. Correlations among biochemical compounds indicated that caffeine content was positively and significantly correlated with chlorogenic acid content but was negatively correlated with trigonelline, sucrose, fat and dry matter contents. The negative significant correlation between fat content and caffeine concentrations means that selecting genotypes that have a higher fat concentration would yield genotypes with less caffeine and because fat was also significantly positively correlated with chlorogenic acid, sucrose and trigonelline, increased concentrations of these compounds would lead to reduced high flavor and bitterness. Coffee brew with pronounced bitterness is among undesirable traits that make Robusta coffee less competitive than Arabica [16,17]. Caffeine and chlorogenic acid concentrations appear to be reduced during first 10-20 years of the Robusta tree life but thereafter their contents increase progressively until the trees are about 50-60 years old (Fig. 3a). Increase in the biosynthesis of caffeine at old age is likely to occur in response to physiological stress or as a defense mechanism against pests and diseases [18]. The graphical association between chlorogenic acid and caffeine in Fig. 3a, is supported by the strong positive association (r=0.51, Table 2) which would be expected since chlorogenic acid is ultimately converted into caffeine [19]. However, as reported by [19] not all the chlorogenic acid is converted to caffeine chlorogenate complex in the seed. The concentrations of trigonelline, on the other hand declined with tree age reaching the lowest levels during the ages of 50-60 years as shown in Fig. 4b. This lends credence to the finding that Robusta coffee has low levels of trigonelline during its life time compared to Arabica coffee [20]. The negative significant association between trigonelline and caffeine (r=-0.43, Table 2) confirms the inverse relationship observed in Figs. 3(a,b) between trigonelline and caffeine. Altitude appeared to affect the concentrations of chlorogenic acid, trigonelline and fat in an almost similar manner whereby their amounts declined sharply at elevations of about 1000 metres above sea level but increased thereafter peaking at elevations of 1500 metres above sea level. It appears that green beans harvested after 10 years would be expected to have higher caffeine and chlorogenic acid contents while those that are harvested at elevations of about 1200 metres above sea level,
would be expected to have higher amounts of chlorogenic acid, trigonelline and fat. Only trees that are almost 10 years old and those that are planted at 1000 metres above sea level, would have the lowest amounts of all the four biochemical compounds. In Arabica coffee, chlorogenic acid and fat concentration but not caffeine content has been shown to increase with altitude [20]. Ugandan Robusta coffee is cultivated mainly between the altitude range of 1000 to 1500 m above sea level [16], a height which is relatively high compared to cultivation in elevations of between 500-1000 masl in India. Altitude is likely the reason why dry matter, caffeine, chlorogenic acid and fat compounds were significantly high in the Ugandan Robusta. In comparing cultivars, hybrid cultivars had the highest dry matter content, but the lowest caffeine, sucrose and chlorogenic acid contents (Figs. 5a, b,c), the later being the attributes that may contribute to bitterness with reduced aroma and flavor. The popular ‘’nganda’’ and ‘’erecta’’ types had the lowest dry matter contents but the highest amounts of caffeine, sucrose and chlorogenic acid (Figs. 5a, b, c). Selection in hybrid types for vigour, heterosis and less bitterness was likely responsible for the higher dry matter content and lower chlorogenic acid contents respectively compared to the amounts observed in the local races and as suggested by [5,20]. Aggregating the 452 genotypes from the principal component analysis on the green bean biochemical compound variance basis, showed that all the major biochemical compounds were evenly wide spread out in all locations and not restricted to any particular agro-ecological zone (Table 3). The four multivariate green bean biochemical compound groups (Figs. 6; 7a, b) formed implied that a wide range of biochemical compounds do exist among cultivated Ugandan C. canephora. Mahalanobis and Fisher significant distances between groups shown in Table 4 and the confusion matrix mean correct genotype group placement of 94% in Table 5, confirmed that the green bean biochemical compound diversity groups present in the germ-plasm were definitely four in number. Even without including wild Robusta coffee forms that are commonly found growing in agro-ecological zones close to natural forests, there appears to be a wide range of biochemical compound variability among cultivated landraces in Uganda [12]. This variability is

Aluka et al.; AJEA, 12(2): 1-13, 2016; Article no.AJEA.23004
11
enhanced by natural hybridization between ‘erecta’ and ‘nganda’ types [21]. From the results of the multivariate analysis, genotypes that comprised mainly of old trees had significantly more caffeine and chlorogenic acid but reduced, fat, trigonelline and sucrose values (Table 2; Figs. 7a, b) indicating they were likely to produce reduced aroma and flavor with a bitter brew. The implication of grouping biochemical compound diversity (Tables 5 and 6; Figs. 6; 7a, b) would be an indicator of the kind of cup quality preferences that may be provided for in the various markets. For instance in Figs. 7(a, b) and Table 5, group one coffee beans from younger trees with, less caffeine, chlorogenic acid, fat but with moderate sucrose and trigonelline may offer an aromatic and flavory cup which is less bitter. A market niche that requires coffee grown in low altitude with limited sucrose, trigonelline and fat chlorogenic acid amounts but has moderate caffeine contents as given by group 2 beans in Figure 7 b, would produce coffee with reduced aroma, flavor and bitterness whereas genotypes represented by diversity group 3 that had the highest concentration of fat, sucrose, and trigonelline contents but moderate, chlorogenic acid and caffeine (Table 5; Figs. 6 and 7a, b) would potentially offer aromatic, flavoured brew with reduced cup bitterness. Biochemical diversity group 4 with more chlorogenic acid and caffeine but less sucrose, fat and trigonelline would most likely produce bitter coffee liqour with reduced flavor. High concentrations of sucrose, chlorogenic acid and trigonelline concentrations have been associated with the more sunlight effects found in equatorial regions [22,23]. However, there are other factors that could have contributed to the high chlorogenic acid content. In Uganda, most Robusta coffee is grown at an altitude of between 1000 to 1500 metres above sea level [16] and only in the Rift valley it is grown in altitudes of about 1000 metres above sea level or less. It is has been observed by many workers [23] that coffee plants from areas nearer the Equator and tropics require higher altitudes compared to those near the Tropics of Cancer or Capricorn. At higher altitudes, the higher leaf to fruit ratio reported by [23,24] might have been responsible for the increase in carbohydrate supply to berries and subsequently to fat biosynthesis. The slow berry flesh ripening period experienced at lower temperatures in higher elevations, may also have allowed for a longer and better bean filling [23]. Therefore
lower fruit load at higher elevations might have been the cause of improved bean biochemical composition and organoleptic cup quality [5,23,25]. 5. CONCLUSION Ugandan Robusta coffee has a wide spectrum of green bean biochemical compounds suited for the diverse consumer market niches and could also be of use in future cultivar improvement programs. Ugandan Robusta coffee has more fat, sucrose and chlorogenic acid that provide the preferred high fragrance, aroma and flavor. The Near Infra Red Spectroscopy technique is a reliable and cost effective method for assessing and characterizing green bean biochemical compounds in Coffea canephora. ACKNOWLEDGEMENTS We are grateful to NARO for paying the salary of the first author during the study, facilities used and for meeting the cost of this publication. We are indebted to CIRAD for providing technical expertise in NIRS analyses and calibration. We thank Ugandan farmers for providing the green bean samples and Mr. Brian Isabirye for assistance in data analysis. COMPETING INTERESTS The authors declare that in publishing this paper, there is no conflict of interest with other person(s) or organization(s). REFERENCES 1. Thomas AS. Types of robusta coffee and
their selection in Uganda. The East African Agricultural Journal. 1935;174.
2. Davrieux F, Bertrand B, Bastianelli D, Guyot B. Authentication of three green coffee cultivars from Costa Rica by near infrared spectroscopy. 11Th International conference on Near Infrared Spectroscopy, Cordoba, Spain; 2003.
3. Charrier A, Berthaud J. Botanical classification of coffee. In Clifford MN, Wilson KC, editors. Coffee: Botany, Biochemistry and Production of Beans and Beverages Croom Helm, London. 1985;13-47.
4. Wintgens JN. Coffee: Growing, processing, sustainable production. A
Aluka et al.; AJEA, 12(2): 1-13, 2016; Article no.AJEA.23004
12
guidebook for growers, processors, traders, and researchers, Wilet-VCG Verlag GmbH & Co; 2004.
5. Bertrand B, Etienne H, Lashermes P, Guyot G, Davrieux F. Can near-infrared reflectance of green coffee be used to detect introgression in Coffea arabica cultivars? Journal Science Food Agriculture. 2005;85:955-962.
6. Charrier A, Berthaud J. Principles and methods in coffee plant breeding: Coffea canephora Pierre. In Clarke RJ, Macrae R, (eds). Coffee: Agronomy. Elsevier Applied Science Publishers, London and New York, Great Britain. 1988;4:167-198.
7. Leroy T, Ribeyre F, Bertrand B, Charmetant P, Dufour M, Montagnon C, Marraccini P, Pot D. Genetics of coffee quality. Brazilian Journal of plant Physiology. 2006;18(1):229-242.
8. Davrieux F, Manez JC, Durand N, Guyot B. Determination of the content of six major biochemical compounds of green coffee using near infrared spectroscopy. 11th International Conference on Near Infrared Spectroscopy, Cordoba, Spain; 2005.
9. Huck CW, Guggenbichler W, Bonn GK. Analysis of caffeine, theobromine and theophylline in coffee by near infrared spectroscopy (NIRS) compared to high-performance liquid chromatography (HPLC) coupled to mass spectrometry. Analytica Chimica Acta. 2005;538:195–203.
10. Brouwer Peter. Theory of X-ray. PANalytical. 2003;1-66.
11. Downey G, Boussion J, Beauchene D. Authentication of whole and ground coffee beans by near infrared reflectance spectroscopy. Journal of Near Infra Red Spectroscopy. 1994;2:85-92.
12. Dussert S, Lashermes P, Anthony F, Montagnon C, Trouslot P, Combes MC, Berthaud J, Noirot M, Hamon S. Coffee (Coffea canephora). In Hamon P, Seguin M, Perrier X, Glaszmann JC, editors. Genetic diversity of cultivated tropical crops. Collection Repères. CIRAD, Montpellier, France. 2003;239–258.
13. Uganda Coffee Trade Federation, (UCTF) Coffee Year Book; 2008/09.
14. Durand N, De Bellis F, Jourdan I, Rivalan R, Manez JC, Aluka P, Vieira LG, Ogwang J, Billot C, Pot D, Marraccini P, Leroy T, Guyot B. Biochemical and nucleotide
variability in the diterpene metabolism for Coffea canephora genotypes from Uganda. 21st International Conference on Coffee Science, Montpellier, France. 2006;70.
15. Ky CL, Louarn J, Dussert S, Guyot B, Hamon S, Noirot M. Caffeine, trigonelline, chlorogenic acids and sucrose diversity in wild Coffea arabica L. and C. canephora P. accessions. Food Chemistry. 2001;75:223-230.
16. Wrigley G. Coffee, Longman, New York; 1988.
17. Prakash NS, Combes MC, Dussert S, Naveen S, Lashermes P. Analysis of genetic diversity in Indian robusta coffee genepool (Coffea canephora) in comparison with a reprsentative core collection using SSRs and AFLPs. Genetic Resources and Crop Evolution. 2005;52: 333-342.
18. Uefuji H, Ogita S, Yamaguchi Y, Koizumi N, Sano H. Molecular cloning and functional characterization of three distinct N- Methyltransferases involved in the caffeine biosynthetic pathway in coffee plants. Plant Physiology. 2003;132:372–380.
19. Betrand B, Vaast P, Alpizar E, Etienne H, Davrieux F, Charmetant P. Comparison of bean biochemical composition and beverage quality of Arabica hybrids involving Sudanese-Ethiopian origins with traditional varieties at various elevations in Central America. Tree Physiology. 2006; 26(9):1239-48.
20. Campa C, Doulbeau S, Dussert S, Hamon S, Noirot M. Qualitative relationship between caffeine and chlorogenic acid contents among wild Coffea species. Food Chemistry. 2005;93:135–139.
21. Musoli P, Cubry P, Aluka P, Billot C, Dufour M, De Bellis F, Pot D, Bieysse D, Charrier A, Leroy T. Genetic differentiation of wild and cultivated populations: Diversity of Coffea canephora Pierre in Uganda. Genome. 2009;52(7):634-646.
22. Muschler R. Shade improves coffee quality in a sub-optimal coffee zone of Costa Rica. Agroforestry Systems. 2001;51:31–139.
23. Vaast P, Bertrand B, Perriot JJ, Guyot B,Génard M. Fruit thinning and shade influence on bean characteristics and beverage quality of C. arabica in optimal conditions. Journal of Science, Food, Agriculture. 2006;86:197-204.

Aluka et al.; AJEA, 12(2): 1-13, 2016; Article no.AJEA.23004
13
24. De Castro D Renato, Marraccini P. Cytology, biochemistry and molecular changes during coffee fruit development. Brazilian Journal of Plant Physiology. 2006;18(1):175-199.
25. Cannell MGR. Physiology of the coffee crop. In Clifford NM, Willson KC, editors. Coffee: Botany, Biochemistry and Production of Beans and Beverage. Croom Helm, London. 1985;108–134.
_________________________________________________________________________________ © 2016 Aluka et al.; This is an Open Access article distributed under the terms of the Creative Commons Attribution License (http://creativecommons.org/licenses/by/4.0), which permits unrestricted use, distribution, and reproduction in any medium, provided the original work is properly cited.
Peer-review history: The peer review history for this paper can be accessed here:
http://sciencedomain.org/review-history/14095
View publication statsView publication stats