Embed Size (px)
Citation preview
226 | wileyonlinelibrary.com/journal/zsc Zoologica Scripta. 2019;48:226–242.© 2018 Royal Swedish Academy of Sciences
Received: 13 July 2018 | Revised: 21 October 2018 | Accepted: 11 November 2018
DOI: 10.1111/zsc.12333
O R I G I N A L A R T I C L E
The diversification of neopasiphaeine bees during the Cenozoic (Hymenoptera: Colletidae)
Eduardo A. B. Almeida1 | Laurence Packer2 | Gabriel A. R. Melo3 | Bryan N. Danforth4 | Sophie C. Cardinal5 | Fábio B. Quinteiro1,6 | Marcio R. Pie3
1Laboratório de Biologia Comparada e Abelhas (LBCA), Departamento de Biologia, Faculdade de Filosofia, Ciências e Letras, Universidade de São Paulo, Ribeirão Preto, SP, Brazil2Department of Biology, York University, Toronto, ON, Canada3Departamento de Zoologia, Universidade Federal do Paraná, Curitiba, PR, Brazil4Department of Entomology, Comstock Hall, Cornell University. Ithaca, New York5Agriculture and Agri‐Food Canada, Canadian National Collection of Insects, Ottawa, Ontario, Canada6Departamento de Ecologia, Zoologia e Genética, Instituto de Biologia, Universidade Federal de Pelotas, Pelotas, Rio Grande do Sul, Brazil
CorrespondenceEduardo A. B. Almeida, Departamento de Biologia, Faculdade de Filosofia, Ciências e Letras (FFCLRP), Universidade de São Paulo, Ribeirão Preto, SP, Brazil.Email: [email protected]
Funding informationDirectorate for Biological Sciences, Grant/Award Number: DEB-0412176; National Geographic Society, Grant/Award Number: Research and Exploration Grant; Conselho Nacional de Desenvolvimento Científico e Tecnológico, Grant/Award Number: 301636/2016 , 304735/2016-7, 309641/2016-0 and 459826/2014-0 ; Fundação de Amparo à Pesquisa do Estado de São Paulo, Grant/Award Number: 2011/09477-9 and 2012/08479-0; Natural Sciences and Engineering Research Council of Canada
AbstractThe biogeography of colletid bees as a whole can be explained by several South American‐Australian trans‐Antarctic interchanges. Within Colletidae, neopa-siphaeine bees form a large group that has not been adequately studied, even though they are interesting both from the biogeographical viewpoint for fitting well the aus-tral Gondwanan track and for their associations to host plants. The present paper in-tegrates phylogenetic, biogeographic and paleontological data to reconstruct the evolutionary history of Neopasiphaeinae, with special emphasis on the New World taxa, relating the evolution of these bees to changes, such as the Andes uplift and expansion of open vegetation biomes. First, we propose a phylogenetic hypothesis for the Neopasiphaeinae using one mitochondrial and five nuclear loci. Phylogenetic relationships and divergence time estimation were simultaneously inferred in a Bayesian framework, and the tempo of neopasiphaeine diversification was investi-gated using lineage‐through‐time plots. The historical biogeography of neopa-siphaeine bees was investigated in a likelihood framework. The clade represented by Neopasiphaeinae is strongly supported within Colletidae, and the bulk of their genera can be divided into two major sister‐clades that diverged during the Eocene: one endemic to the Australian region and the other to the Neotropical region. Divergence times among most neotropical genera of Neopasiphaeinae indicate that they differen-tiated and started their diversification during the Miocene. Our results depict a com-plex process of geographic evolution in the Neotropical clade, which probably relates to important changes in the neotropical climates and biota beginning at the Oligocene and became more marked in the Miocene. We present a scenario of the neotropical Neopasiphaeinae initially associated with areas of open vegetation in subtropical and temperate portions of South America, followed by multiple separations of lineages east and west of the Andes, and more recent occupations of habitats in tropical por-tions of the continent.
K E Y W O R D SAustralia, biogeography, Colletinae, Neotropics, Paracolletinae, phylogeny
| 227ALMEIDA Et AL.
1 | INTRODUCTION
The study of the diverse neotropical biota and the expla-nations for the processes responsible for its assembly re-quire acknowledging a complex history though time and space (Antonelli & Sanmartin, 2011; Hughes, Pennington, & Antonelli, 2013; Rull, 2011; Turchetto‐Zolet, Pinheiro, Salgueiro, & Palma‐Silva, 2013; Ulloa Ulloa et al., 2017). Such complexity is probably related to events and processes that took place during different time periods but also to the biogeographical connections between the neotropical biota and those from other regions. Considering the time span from the late Paleogene to the present, we can, for example, identify several lineages that diversified in southern South America with close biogeographical links to the biota from the Australian region (midges and southern beeches are clas-sic examples of these connections: Brundin, 1966; Swenson, Hill, & McLoughlin, 2001). After the breakup between South America and Africa during the Cretaceous, a trans‐Antarctic southern connection persisted between South America and Australia. This allowed various groups of animals and plants to exhibit phylogenetic connections between the two conti-nents (Sanmartin & Ronquist 2004). The trans‐Antarctic connection coincided with a period of relatively high aver-age temperatures, which favoured a lush subtropical forest to develop in Antarctica and connected landmasses (Iglesias, Artabe, & Morel, 2011). The present paper focuses on biotic interchanges that took place during the Cenozoic between the Australian and the Neotropical regions (especially South America).
Among the major bee lineages, Colletidae1 has been con-sidered to be a prime example of Gondwanan interchange between Australia and South America (Michener, 1979) and more than six lineage exchanges between Australia and South America were identified by Almeida, Pie, Brady, and Danforth (2012). Within Colletidae, neopasiphaeine bees are an interesting group both from the biogeographical view-point for fitting well the austral Gondwanan track (sensu Cranston, 2005; also known as “amphinotic track”) and as-sociations to their host plants. This biogeographic pattern applies to taxa primarily distributed in the southern conti-nents but absent in southern Africa. The Neopasiphaeinae are a morphologically diverse group of bees ranging in size from 6–18 mm in length, and there are over 400 described species, occurring mainly in subtropical and temperate dry biomes of South America and Australia (Almeida et al., 2012). Neopasiphaeinae may represent a primarily specialist bee clade (Almeida et al., 2012; Wcislo & Cane, 1996) and the subfamily does include examples of narrow oligolectic taxa (Almeida & Gibran, 2017; Carvalho & Schlindwein, 2011; Gimenes, 1991; Houston, 1989, 1990, 2000; Laroca, Michener, & Hoffmeister, 1989; Schlindwein, 1998; Siriani‐Oliveira, Oliveira, & Schlindwein, 2018).
The biogeographical investigation by Almeida et al. (2012) included a discussion of paleoclimatic and paleoveg-etational data from the Late Mesozoic through the Cenozoic of the southern continents in the context of colletid diversi-fication. An increased rate of cladogenesis of colletid bees was detected in the last 25–30 My and a possible scenario that could explain this shift in the diversification rate was the positive impact of increased biome aridification cou-pled with floristic diversification in the southern continents during the Neogene (Iglesias et al., 2011; Insel, Poulsen, & Ehlers, 2010; McElwain, 2018; Ortiz‐Jaureguizar & Cladera, 2006; Strömberg, 2011) on the diversification of these bees (Almeida et al., 2012; Michener, 2007). This general pic-ture of biogeography coupled with lineage diversification of Colletidae was a necessary step to interpret the diversity of these bees. Two subfamilies of Colletidae are primar-ily Australasian: Euryglossinae and Hylaeinae (Kayaalp, Schwarz, & Stevens, 2013; Kayaalp, Stevens, & Schwarz, 2017; Michener, 1979, 2007); three are primarily South American: Colletinae, Diphaglossinae and Xeromelissinae (Kuhlmann, Almeida, Laurene, & Quicke, 2009; Michener, 1979, 2007); and one is African: Scrapterinae. Among these taxa, there are two very widespread genera: Colletes and Hylaeus, each occurring in almost every terrestrial biogeo-graphic realm of the planet.
A different interpretation is required when we appreciate the extant diversity and distribution of the Neopasiphaeinae because this subfamily includes endemic genera in both Australian and Neotropical regions. After the phylogenetic proposal by Almeida and Danforth (2009), the explanation for higher‐level neopasiphaeine biogeography was inti-mately connected to a vicariant history starting in the Late Cretaceous and influenced by the complete breakup of the southern continents, which resulted in disjunctions between extant neotropical and Australian lineages (Almeida et al., 2012).
The biogeography of neopasiphaeines in the New World after the separation of Antarctica and South America (i.e., the opening of Drake Passage followed by expansion of the Antarctic continental ice sheet; Dingle & Lavelle, 1998; Galeotti et al., 2016) was undoubtedly affected by local changes in the habitats available for these organisms as well as local plant diversity. The cooling and drying of continental climates were coupled with the expansion of xeric biomes in South America (Iglesias et al., 2011; Ortiz‐Jaureguizar & Cladera, 2006; Rundel et al., 2016), and the diversity of plant taxa peaked in the Miocene (Insel et al., 2010). The formation of the Andes, starting about 100 Mya with the subduction and convergence between the Nazca Plate and the South American Plate along the western margin of South America (Armijo, Lacassin, Coudurier‐Curveur, & Carrizo, 2015; Cobbold et al., 2007; Mora et al., 2010), was also biogeographically important. During the late Oligocene, the convergence rate
228 | ALMEIDA Et AL.
between plates significantly increased, and the uplift peaked, with intense peaks of Andean mountain building later during the mid‐Miocene and early Pliocene (Hoorn et al., 2010). The uplift of the Andes Cordillera not only resulted in the differentiation of new South American ecosystems, but radi-cally changed climate regimens in the continent, with signif-icant increase in precipitation along the eastern flanks of the Cordillera and more arid conditions along its western flanks (Armijo et al., 2015; Insel et al., 2010; Jordan, Kirk‐Lawlor, Blanco, Rech, & Cosentino, 2014; Mora et al., 2010; Poulsen, Ehlers, & Insel, 2010).
The purpose of this paper is to explore the history of neo-pasiphaeine bees in the New World, leading to a better under-standing of their biogeography, and relate their evolution to changes that occurred in South America, such as the Andes uplift and expansion of open vegetation biomes (both open canopy biomes and those lacking a forested canopy) during the second half of the Tertiary. Having a phylogenetic hy-pothesis with improved taxon sampling for neopasiphaeine bees will also be essential for future refinements in the inter-pretation of fidelity in host plant association through time as well as the host plant shifts, as these phenomena help explain the diversification of neopasiphaeine bees in the New World.
2 | MATERIAL AND METHODS
2.1 | Taxonomy and diversity of Neopasiphaeinae and taxon samplingSuprageneric classification follows Almeida et al. (2012), although the Australian endemic genus Paracolletes is treated as part of Diphaglossinae to reflect the close phy-logenetic proximity of these taxa (Supporting information Table S1). Genus‐ and species‐level taxonomy largely agree with Moure, Urban, & Melo, (2007), Almeida (2008) and Almeida et al. (2012). In the case of the generic classifica-tion of the Neopasiphaeinae, the polyphyly of Leioproctus s.l. (sensu, e.g., Michener, 1989, 2007; Maynard, 2013) is considered based on the phylogenetic hypothesis of Almeida and Danforth (2009; see also comments by Michener [2007]: p. 140–147). A summary of the genus‐level classification fol-lowed here is given in Supporting information Table S2.
Our sample comprises 137 species of Colletidae and Stenotritidae (Supporting information Table S3), with 94 species of Neopasiphaeinae and 43 from among all other colletid subfamilies and tribes—Callomelittinae (1 sp.), Colletinae (7 spp.), Euryglossinae (3 spp.), Hylaeinae (4 spp.), Scrapterinae (5 spp.), Xeromelissinae (6 spp.) and Diphaglossinae s.l.—including Paracolletes (13 spp.) and Stenotritidae (4 spp.). The majority of identifications of var-ious taxa included in the analyses were done by the authors EABA, GARM, LP and BND, as indicated in Supporting information Table S3. Voucher specimens are housed in
Coleção “Prof. J.M.F. Camargo” (RPSP),” Departamento de Biologia, Faculdade de Filosofia, Ciências e Letras de Ribeirão Preto, Universidade de São Paulo (Ribeirão Preto, Brazil); Coleção de Entomologia Pe. J. S. Moure (DZUP), Departamento de Zoologia, Universidade Federal do Paraná (Curitiba, Brazil); Cornell University Insect Collection (CUIC), Cornell University (Ithaca, USA); and the Packer Collection at York University (PCYU), Toronto, Canada.
2.2 | Sampling and data collection: DNA extraction, molecular markers, amplification and sequencingMuscle tissue for DNA extraction was obtained from ethanol preserved specimens by dissecting the thoracic flight muscu-lature or by grinding the whole mesosoma of one specimen. The rest of each specimen was preserved as a voucher and associated with the DNA extractions by the codes provided in Supporting information Table S1. Total genomic DNA was extracted using phenol–chloroform protocols outlined by Danforth (1999). We sequenced fragments from four nu-clear protein‐coding genes (elongation factor‐1 alpha, copy F2: “EF‐1a,” ca. 1550 bp unaligned; LW rhodopsin: “opsin,” 850–1,500 bp; sodium‐potassium ATPase alpha subunit: “NaK,” ca. 1,450 bp; wingless, 750–1,030 bp), one mito-chondrial protein‐coding gene (cytochrome oxidase subunit 1: “COI,” ca. 650 bp) and one nuclear ribosomal gene (28S ribosomal RNA for the large subunit: “28S,” ca. 1,480 bp); length variation among introns of opsin and wingless of some colletid bees explain the wide variation of the fragments am-plified. Maps of all nuclear gene loci except NaK are pro-vided by Almeida and Danforth (2009). Gene fragments were PCR‐amplified using specific primers and reactions accord-ing to Almeida, Packer, and Danforth (2008), Almeida and Danforth (2009) and Cardinal, Straka, and Danforth (2010); primers and PCR conditions are listed in Supporting in-formation Table S4. Automatic DNA sequencing was per-formed using the Applied Biosystems Automated 3730 DNA Analyzer employing Big Dye Terminator chemistry and AmpliTaq‐FS DNA Polymerase at Cornell University Life Sciences Core Laboratories Center.
All taxa and GenBank accession numbers are listed in Supporting information Table S5. All gene fragments were aligned using MAFFT v7.309 with the E‐INS‐i algorithm (Katoh & Standley, 2013). For the protein‐coding genes, honey‐bee (Apis mellifera Linnaeus) sequences were used to establish reading frames and intron/exon boundaries, then annotated in Mesquite v.3.4 (Maddison & Maddison, 2018). Introns from three of the protein‐coding genes sampled (EF‐1a, Opsin, wingless) could only be confidently aligned for neopasiphaeine sequences (introns from all other termi-nals were discarded). Regions of problematic alignment of in-trons and 28S (no distinction between stem and loop regions
| 229ALMEIDA Et AL.
was made a priori) were selected and removed using gBlocks 0.91b (Talavera & Castresana, 2007). Individual gene data sets were concatenated with SequenceMatrix v.1.8 (Vaidya, Lohman, & Meier, 2011). The resulting matrix was 6,244 base‐pairs in length (available as Supporting information), subdivided as follows: 28S: 1,419 bp; COI: 641 bp; opsin: 686 bp (exons) + 64 bp (introns); EF‐1a: 1,064 bp (exons), + 418 bp (introns); wg: 649 bp (exons) + 34 bp (introns): NaK: 1,259 bp (exon).
2.3 | Partitioning the data, phylogenetic analysis and divergence time estimationEvolutionary heterogeneity within the data were accounted for by applying several partition strategies and substitution models and then evaluating their effect on the resulting phy-logenetic tree topologies and posterior probability values at-tributed to clades. The strategies varied from ad hoc defined partitioning scheme assigning each locus (or portions of a gene fragment) to have its substitution model to subdividing the concatenated data matrix into several data blocks based on genomic features (e.g., genes, codon positions, exons and introns) and algorithmically optimising a partitioning scheme and its substitution model simultaneously. In doing so, the possibilities of poor parameter estimation and over‐partition-ing the dataset are reduced (Kainer & Lanfear, 2015).
Models of nucleotide substitution were selected based on the Bayesian Information Criterion (BIC) as determined by jModelTest 2 (Darriba, Taboada, Doallo, & Posada, 2012). Preliminary Bayesian analyses were run for the individual single‐gene matrices to evaluate the congruence between each of the gene‐trees and simultaneous analyses of mul-tiple genes. In all cases, we ran analyses in MrBayes v.3.2 (Huelsenbeck & Ronquist, 2001; Ronquist & Huelsenbeck, 2003) for 3×10⁷ generations (two runs, four chains per run), sampling every 5,000th generation; we then examined the pa-rameter files in Tracer v.1.6 (Rambaut & Drummond, 2007) to ensure stationarity of all parameters over both runs and to determine an appropriate burn‐in. Convergence between both runs was also used as a diagnostic tool: a split frequency value of 0.01 was taken as a threshold. A maximum clade credibility tree was computed using TreeAnnotator v.2.4 (Drummond, Suchard, Xie, & Rambaut, 2012) after remov-ing the burn‐in period from the sample, and resulting trees were visualized in FigTree v.1.4.3 (Rambaut, 2016).
Seven partition schemes were created to assess the in-fluence of non‐coding regions, third‐positions of exons and possible effects of excessive missing sequences for one of the gene loci sampled (we lack NaK‐sequences for 34% of the terminal taxa). These partition strategies are described as follows [numbers between brackets represent the number of partitions in the scheme used]: (a) gene‐by‐gene [n = 6]; (b) gene‐by‐gene, excluding all introns [n = 6]; (c) gene‐by‐gene,
excluding introns, third‐positions of exons of all protein‐cod-ing genes; (d) gene‐by‐gene, excluding introns and 28S—analysis of coding regions only[n = 5]; (e) gene‐by‐gene, excluding introns, 28S, and third‐positions of exons of coding regions [n = 5]; (f) gene‐by‐gene, excluding NaK [n = 5]; and (g) gene‐by‐gene, excluding NaK and all introns [n = 5].
All genes were then concatenated into a single matrix, subdividing them as follows: exons of the five protein‐coding genes were partitioned into character‐sets comprising their more conserved positions (i.e., first and second) separated from their third positions; 28S; and each set of introns of EF‐1a, opsin, and wingless. The resulting dataset contained 14 character‐sets. The best partitioning scheme and models of DNA substitution were determined using PartitionFinder 2 (Lanfear, Frandsen, Wright, Senfeld, & Calcott, 2016—BIC model selection and using the "greedy” algorithm), which in-dicated the number of partitions should be reduced to nine as follows: 28S (1,419 bp, model TVMef + Γ + I); 1st and 2nd positions of COI (428 bp, model GTR + Γ + I); 3rd positions of COI (213 bp, model TrN + Γ + I); 1st and 2nd positions of EF‐1a, NaK and wingless (1988 bp, model TrN + Γ + I); 3rd positions of EF‐1a (358 bp, model TIM + Γ + I); introns of EF‐1a and opsin (482 bp, model HKY + Γ + I); 1st and 2nd positions of opsin (457 bp, model SYM + Γ + I); 3rd positions of opsin and the intron of wingless (263 bp, model K80 + Γ + I); 3rd positions of NaK and wingless (636 bp, model GTR + Γ + I). The partition‐scheme suggested by PartitionFinder was run with the models indicated by the pro-gram. Finally, analyses were run without specifying only one scheme of substitution types and allowing the Markov chain of MrBayes to sample over the space of all possible reversible substitution models using a reversible jump MCMC (“nst=-mixed”). These Bayesian analyses were run with MrBayes as described above.
An issue that has become increasingly important in phylo-genetic inference is the potential incongruence between species trees and their underlying gene trees (Maddison, 1997). In fact, the assumption of a single evolutionary history for all loci that underlies the common practice of concatenation might cause the resulting inference to be statistically inconsistent, partic-ularly near relatively short internodes (Degnan & Rosenberg, 2006; Edwards, Liu, & Pearl, 2007). As a consequence, there has been a progressively stronger reliance on methods based on the multispecies coalescent model (Rannala & Yang, 2003), which assumes that discrepancies between gene trees and the species tree are exclusively due to deep coalescence (i.e., all loci are not under the influence of selection, the popula-tion is panmictic, and there is no recombination within each gene but free recombination between genes). For these rea-sons, we conducted a species‐tree analysis in *BEAST 2.4.5 (Bouckaert et al., 2014) that could be contrasted with the con-catenated approaches described earlier. We chose the closest models chosen by jModeltest that were available on *BEAST,
230 | ALMEIDA Et AL.
namely GTR + Γ (EF‐1a, wingless), SYM + Γ (opsin, 28S) and HKY + Γ (NaK, COI). The shape of the Γ parameter was estimated for each locus using four classes, and the substi-tution rates were estimated separately for each locus. Ploidy was set to autosomal nuclear, except for COI, which was set to
mitochondrial; speciation prior was set to a Yule model; and population size was set to constant, whose mean was estimated during the analysis. MCMC runs were carried out for 3 × 10⁷ generations, sampling every 5,000th generation.
| 231ALMEIDA Et AL.
Phylogenetic relationships and divergence time estima-tion were simultaneously inferred in a Bayesian framework using BEAST 2 (Bouckaert et al., 2014) by employing a re-laxed clock uncorrelated lognormal model (Drummond, Ho, Phillips, & Rambaut, 2006). The partition‐scheme and mod-els suggested by PartitionFinder were used in BEAST, ex-cept for TVMef and TIM models that were replaced by GTR; the substitution and clock models were unlinked among par-titions in BEAUTi (Bouckaert et al., 2014) with the under-lying trees linked. A Yule speciation process with a random starting tree was used for the tree prior. Lognormal or nor-mal a priori age distributions (in My) were assigned to three nodes. Minimum ages for the two lognormal priors are based on stem group calibrations using constituent taxa from the fossil record. The common ancestor of Xenochilicola mami-gna and Chilicola spp., a robustly supported clade within the neotropical subfamily Xeromelissinae (Almeida & Danforth, 2009; Almeida et al., 2008), was given a lognormal prior of log(mean) = 2.708, log(SD) = 0.421, offset = 15 (equivalent to a minimum bound of 15 Ma, median value of 30 My, and a 95% quantile of 45 Ma) based on Chilicola (Hylaeosoma) gracilis Michener & Poinar, 1996 and Chilicola (Hylaeosoma) electrodominicana Engel, 1999 fossils from Dominican amber (Engel, 1999; Michener & Poinar, 1996). The ichnospecies Celliforma curvata Sarzetti, Dinghi, Genise, Bedatou, & Verde, 2014 was assigned to bees of the subfamily Diphaglossinae because of the curved cells built in soil (Sarzetti et al., 2014), and it provides a minimum age for the appearance of the neotropical lineages of this taxon. The oldest record of C. curvata (52–49 Mya) was attributed by Sarzetti et al. (2014) as coming from the early Eocene of North America, which is a caveat for this fossil because the presence of the Diphaglossinae in North America in the early Cenozoic is not supported by any additional evidence. A normal prior age distribution (mean = 21, sigma = 4) was given to the crown group node of Stenotritidae and a normal prior age distribution (mean = 80, sigma = 4) was applied as a secondary calibration to the crown group node for Colletidae based on previous age estimates (Almeida et al., 2012; Cardinal & Danforth, 2013), which employed var-ious fossil calibration points not applicable here, as well as some of the records also used here (i.e., Chilicola spp.). The runs consisted of 100 × 106 generations sampled every 5,000
generations. Convergence and stationarity of the runs were investigated using Tracer as in the MrBayes analyses.
2.4 | Diversification analysesThe tempo of neopasiphaeine diversification was investigated using lineage‐through‐time (LTT) plots, which are graphical representations of the cumulative number of reconstructed lineages over time‐based on a chronogram (in this case, the BEAST tree). Particularly, we tested whether there is suf-ficient evidence to reject a diversification scenario in which speciation and extinction rates remained constant throughout the history of Neopasiphaeinae. The method of Paradis (2003) was used to combine taxonomic and phylogenetic data to esti-mate the speciation and extinction rates during colletid diver-sification, assuming that those rates remained constant, using the function “bd.ext” in APE (Paradis, Claude, & Strimmer, 2004) to generate appropriate LTT confidence intervals. The relative magnitude of the estimated rates was then used to simulate phylogenies under the assumption of a constant birth–‐death process using the “birthdeath.tree” function in GEIGER (Harmon, Weir, Brock, Glor, & Challenger, 2008).
The number of species in each clade considered for the analyses (i.e., the 59 genera or groups of species assumed to be monophyletic or least inclusive suprageneric groups about which monophyly could be assumed shown in Supporting information Figure S1) was based on the respective number of described species, as indicated in the available catalogues for the neotropical and Australasian bee faunas (Almeida, 2008; Moure, Graf, & Urban, 2012) complemented by more recent publications (Batley & Houston, 2012; Gonzalez & Florez, 2011; Maynard, 2013; Almeida & Gibran, 2017; Packer & Ruz, 2017). The shape of the LTT plot is affected by the level of taxon sampling in relation to all extant lin-eages of the investigated clade. In order to take that effect into account, we computed confidence intervals by simulat-ing a phylogeny with constant speciation and extinction rates (as indicated above) until reaching 497 species (the number of known valid neopasiphaeine bee species: the sum of the column labelled “VL” of Supporting information Figure S1). The complete phylogeny was then randomly pruned of 88% of its species to represent the approximate proportion of all extant lineages included in the BEAST tree obtained
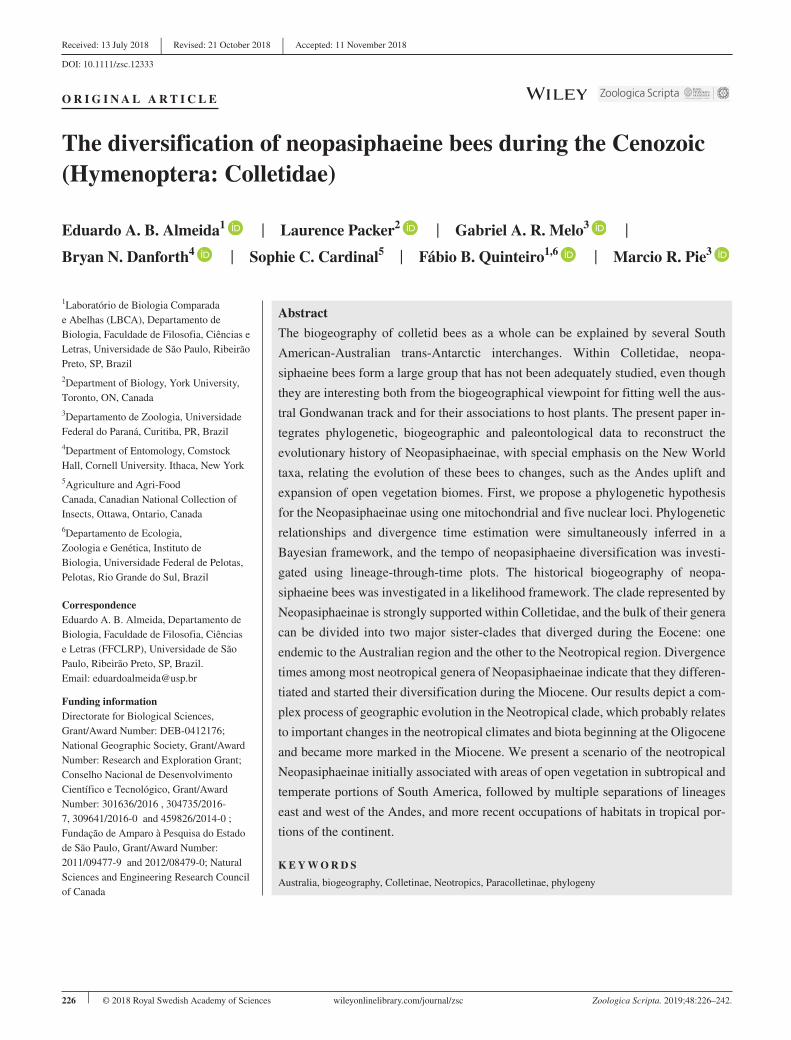
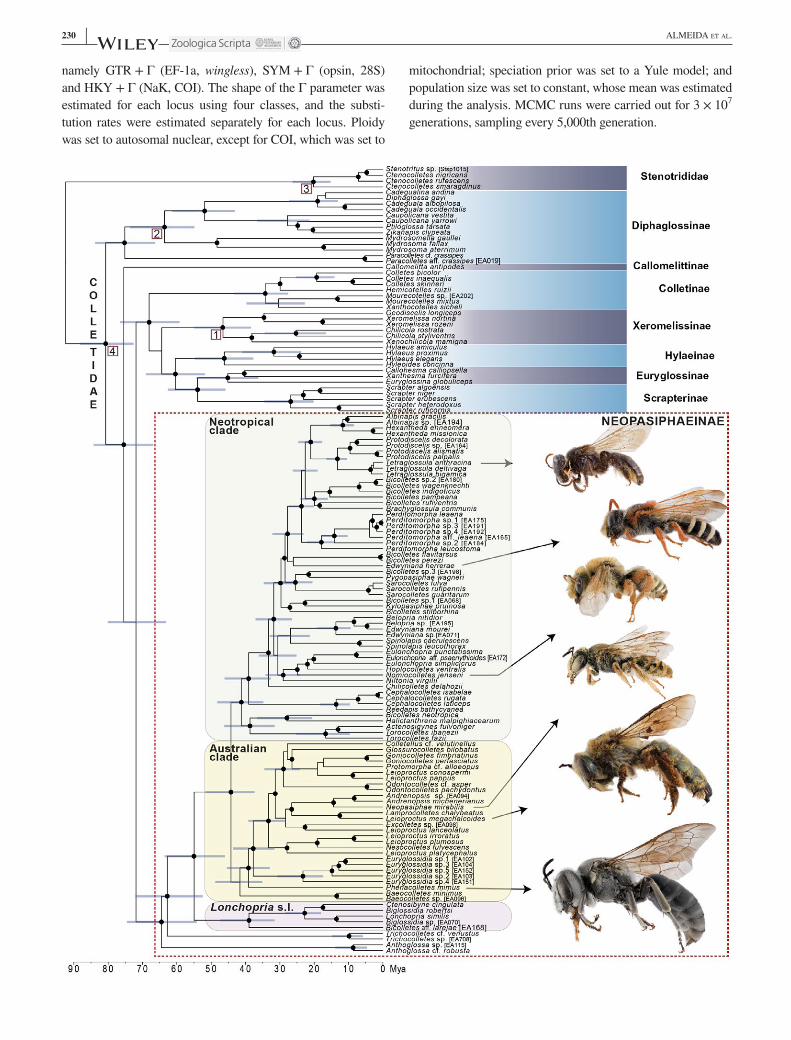
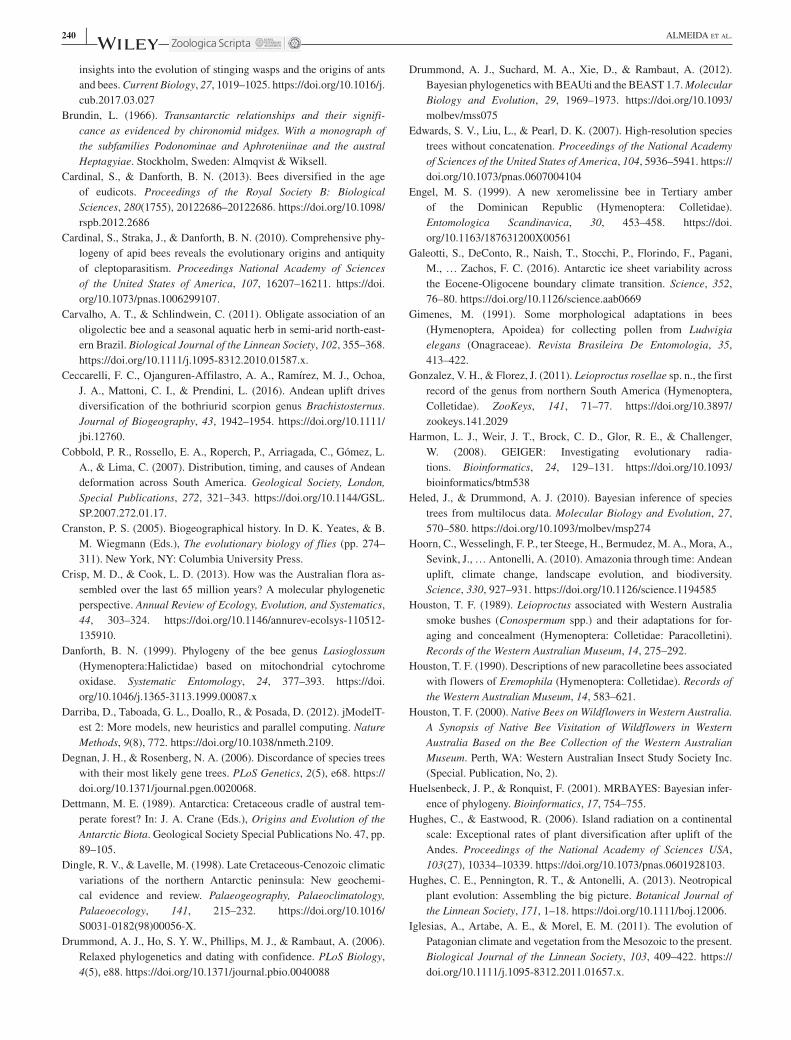
F I G U R E 1 Maximum clade credibility Bayesian chronogram representing phylogenetic relationships and divergence ages for Colletidae (133 species) and Stenotritidae (four species), with emphasis on neopasiphaeine taxa. Six gene loci compose the data set: EF1α, opsin, wingless, COI, NaK and 28S rRNA. Bayesian posterior probability of clades values above 85% indicated by black dot on subtending node (see Supporting information Figure S1 for complete list of probabilities). Blue bars denote height probability density at 95% of selected nodes. Lower scale in million years before present. Morphological diversity within Neopasiphaeinae is illustrated by three representatives of neotropical taxa: Tetraglossula anthracina (Michener, 1989), ♀; Edwyniana herrerae (Toro, 1968), ♂; Nomiocolletes jenseni (Friese, 1906), ♂; and three Australian species: Neopasiphae mirabilis Perkins, 1912, ♂; Leioproctus megachalcoides Michener, 1965, ♀; Phenacolletes mimus Cockerel, 1905, ♂ (figures to scale). Numbers in squares indicate positions of four calibration points listed in the Methods: (1) Xeromelissinae; (2) neotropical clade of Diphaglossinae; (3) Stenotritidae; (4) Colletidae. [Colour figure can be viewed at wileyonlinelibrary.com]
232 | ALMEIDA Et AL.
| 233ALMEIDA Et AL.
in this study. An alternative simulation was conducted with a reduced taxon sampling, in which only species of the main neotropical neopasiphaeine clade were considered (lineages left of the light‐coloured squares on Supporting information Figure S1), which currently comprise 121 valid species; in this case the resulting trees were randomly pruned of 71% of their tips to represent the approximate proportion of all extant lineages included.
All simulations above were repeated 500 times, and the average root age was rescaled to the inferred age (based on the BEAST divergence time estimate) to provide a Monte Carlo approach to determine the confidence intervals of the diversification model (Pie & Tschá, 2009). Finally, the shape of the LTT can be influenced by uncertainty in the process of phylogenetic inference itself. To assess the effect of phy-logenetic uncertainty, an LTT with 1,000 randomly selected post‐burnin phylogenies from the BEAST analyses described above was generated. Comparisons among expected LTTs under different scenarios may be difficult due to the high level of stochasticity in the first few events of cladogenesis, even under constant speciation and extinction rates (Paradis, 2003). Therefore, a final comparison was made of all scenar-ios while rescaling them to coincide at the point where the average number of lineages was equal to five.
2.5 | Biogeographic analysesThe term “neotropical” is used in its broad sense ranging from southern South America to the Mexican desert, as his-torically considered in the early efforts at regionalization of terrestrial biogeographical regions by authors such as Philip Sclater and Alfred Wallace (Morrone, 2014). The particular biogeographic nature of southern South America (Amorim & Pires, 1996; Moreira‐Muñoz, 2007; Morrone, 2014) is not being considered a priori in the operationalization of units used in the analyses that required areas to be specified. Most of the neotropical diversity of Neopasiphaeinae is found in regions of open vegetation in the xeric southern subtropical and temperate regions of the continent, on both sides of the Andes (Michener, 1989).
We pose two major questions regarding the biogeography of Neopasiphaeinae: (a) what was the impact of the Andean uplift on the diversification of these bees?; (b) when did some neopasiphaeine taxa expand their ranges to warm regions of the Neotropics following an initial diversification in the
southern temperate/subtropical region of South America? We specified six areas (modified from Morrone, 2014), which represent an attempt to encompass knowledge about geolog-ical history, geographic separation, and the biomes where neopasiphaeine bees occur. Thus, we adjusted Morrone’s area delimitations to reflect the limits of neopasiphaeine bee distributions and to minimize the number of areas: (A) “Chile”: Andean Region and the western portion of the South American transition zone; (B)”Monte”: Central Argentina, from Salta to northeastern Chubut; (C) “Pampas”: Central western Argentina, Uruguay, southern Paraguay, and south-ern Brazil; (D) “Atlantic coast”: along the Brazilian coast; (E) “Dry diagonal”: area encompassing the Caatinga, Cerrado and Chacoan provinces, and roughly corresponding to three large biomes; and (F) “Nearctic”: central Mexico to south-ern USA (the approximate extension and relative positions of these areas as specified for the taxa herein studied are shown in Figure 3b). An additional seventh area “Australia” was used to code species from the Australian Region, which was not subdivided into smaller areas because our taxonomic and geographic sampling of its neopasiphaine fauna was insuffi-cient sampling to reflect the biogeographic complexity of this region. With the exception of the Atlantic coast, the other six are predominantly open/dry regions, at least seasonally.
We used the R package BioGeoBEARS (Matzke, 2013, 2014) to compare biogeographical models and estimate event ranges in the Neopasiphaeinae through time. BioGeoBEARS uses max-imum likelihood implementations of three commonly used methods in historical biogeography: DEC (Dispersal–Extinction–Cladogenesis: Ree & Smith, 2008), DIVA (DIspersal–Vicariance Analysis: Ronquist, 1997) and BayArea (Bayesian Inference of Historical Biogeography for Discrete Areas: Landis, Matzke, Moore, & Huelsenbeck, 2013). These three methods differ in relation to the optimality criterion adopted in their original im-plementations (likelihood for DEC, parsimony for DIVA and Bayesian posterior probability for BayArea), but are all treated in a common likelihood framework as likelihood models in BioGeoBEARS, thus allowing direct comparisons to be made (Matzke, 2013, 2014). In addition to the default biogeographic events (vicariance, range expansion, within‐area speciation and range contraction), all models were run with and without founder‐event speciation (sensu Matzke, 2014). This speciation mode is expressed by the j‐parameter, which means the explicit incorpora-tion of events of speciation through long‐distance dispersal (syn-onymous with “geodispersal” or simply “dispersal” in its classic
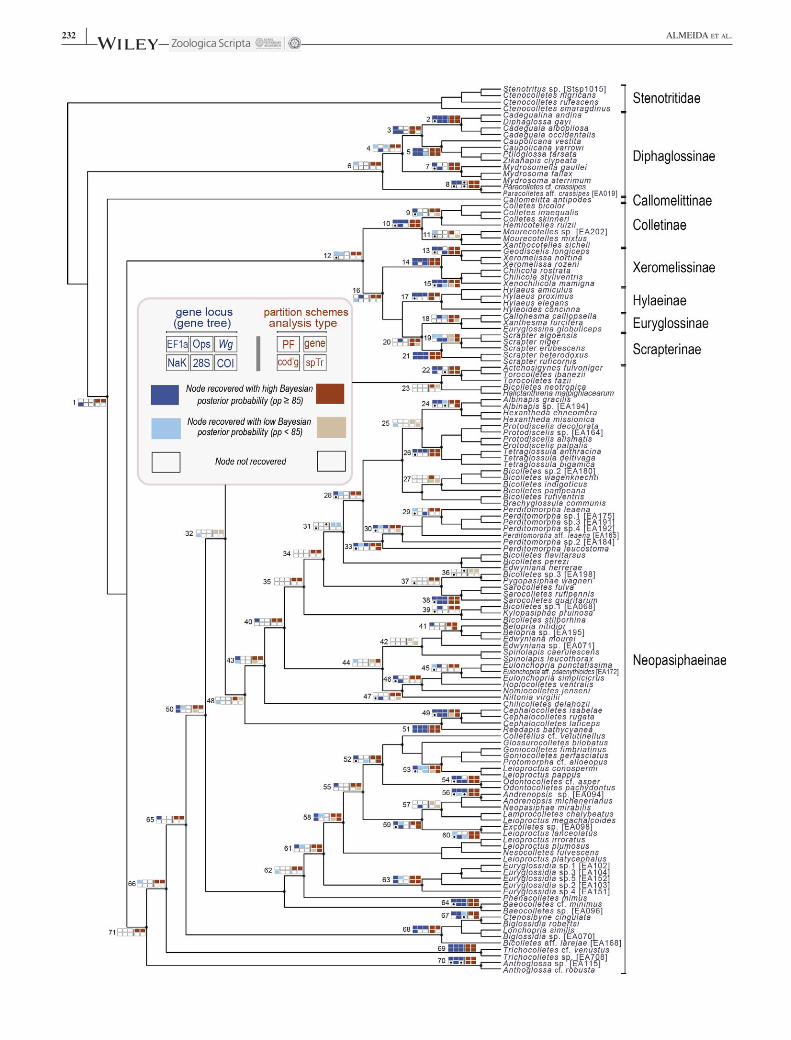
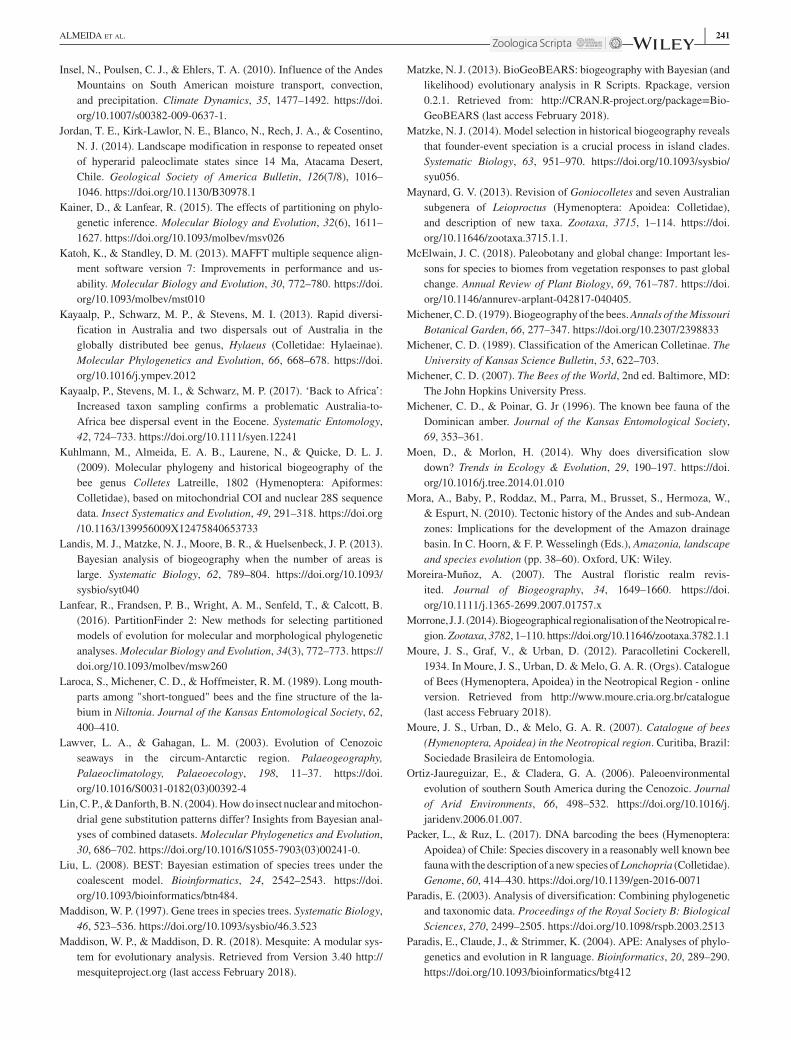
F I G U R E 2 Phylogenetic relationships among 137 species of Colletidae and Stenotritidae resulting from a combined Bayesian analysis of concatenated six gene loci. Seventy‐one nodes were selected to compare the phylogenetic gene‐trees of each locus (EF‐1a, opsin, wingless, COI, NaK and 28S rRNA), as well three partition strategies in concatenated analyses (partition and models defined by PartitionFinder [“PF”], partition by gene locus [“gene”], only coding region [“cod”g’]) and a species tree analysis (“spTr”). Topological congruence with the reference tree and Bayesian probabilities (colour intensities and meaning of each rectangle explained in the box on the upper left) were used to assess the signal and relative decisiveness of each approach. White rectangles with a black dot could not be evaluated because the taxonomic sampling for a given gene was not sufficient for that consideration. [Colour figure can be viewed at wileyonlinelibrary.com]
234 | ALMEIDA Et AL.
(a)
(b)
(c)
(d)
(e)
| 235ALMEIDA Et AL.
sense). These events assume range switching between disjunct areas (e.g., Chile to Monte—separated by the Andes) and occur at a lineage‐splitting event (a node in the phylogeny), leaving one daughter lineage in a new range and the other daughter lineage retaining the ancestral range, and subsequent divergence of col-onizing lineages (Matzke, 2013, 2014). We used likelihood‐ratio tests and AIC values to compare the fit of these models to the data. For the BioGeoBEARS analyses, we used the BEAST max-imum clade credibility tree after pruning all non‐neopasiphaeine taxa, and each terminal species of Neopasiphaeinae was coded for presence/absence in the aforementioned seven geographic areas (Figure 3a).
3 | RESULTS
3.1 | Phylogenetic relationships and divergence time estimatesThe clade represented by Neopasiphaeinae is placed as sister to the species‐rich clade comprising the following five sub-families: Colletinae, Euryglossinae, Hylaeinae, Scrapterinae and Xeromelissinae (Figure 1). Within the neopasiphaeine clade, the earliest divergences have not changed from pre-vious analyses, with Anthoglossa as sister to the remaining genera, followed by Trichocolletes, and then Lonchopria s.l. (i.e., Biglossidia, Ctenosibyne, Lonchopria and Bicolletes aff. larejae) with two new lineages added for the first time: Ctenosibyne cingulata (expected to be part of this clade: e.g., Michener, 1989) and a species similar to Bicolletes larejae (a recently described taxon whose affinities were so far unclear). The bulk of the remaining lineages of Neopasiphaeinae can be divided into two major sister‐clades, which diverged dur-ing the Eocene: one endemic to the Australian region and the other to the Neotropical region (Figure 1). The divergence between these major clades associated with the Neotropical and Australian regions, as shown in Figure 1, is estimated to have occurred during the Eocene (95% HPD: 51.7–37.2 My), and estimated ages of other divergences among colletid bees are discussed in more detail below.
3.1.1 | Signal of the different lociThe phylogenetic analyses considered the signals present in each of the six loci (Figure 2; Supporting information Figures S2–S7), but the conclusions were based on the concatenated as well as species tree analyses based on coalescent methods (Figure 2). Individual loci generally were not able to resolve deeper relationships similar to analyses using combined evi-dence from multiple loci (Figure 2), a finding discussed by Almeida and Danforth (2009) for a smaller number of gene re-gions. In some instances, EF‐1a, opsin and NaK (Supporting information Figures S2, S3 and S5, respectively, see also Figure 2 for comparisons) were exceptions to this rule, although the latter could only be successfully amplified for a relatively small number of species. When comparing the resolution of the gene trees with the combined analyses considering divergence time and Bayesian posterior probabilities, the same three loci showed more interesting results than the remaining two (Supporting in-formation Figure S9: E, F, H vs. G, I, J). The gene tree of COI had the most contradictory results in comparison to the remain-ing loci (Figure 2; Supporting information Figures S7, S9j), but it was particularly effective in resolving shallow divergences, as expected for a mitochondrial gene (Lin & Danforth, 2004). Even if COI conveys phylogenetic signal limited to recent di-vergences when analysed in isolation, when used in combina-tion with nuclear genes it can contribute to the placement of taxa among older divergences (Trunz, Packer, Vieu, Arrigo, & Praz, 2016). We amplified the “barcode region” of COI, which therefore matches the fragment already generated for thousands of individual bees (Packer & Ruz, 2017) and will be useful to expand taxon sampling in colletid studies in the future, as done by Trunz et al. (2016).
3.1.2 | Effect of analytical phylogenetic proceduresPartitioning data according to the best scheme indicated by PartitionFinder (henceforth “PF‐tree”) and using the substitution models indicated therein rendered the most
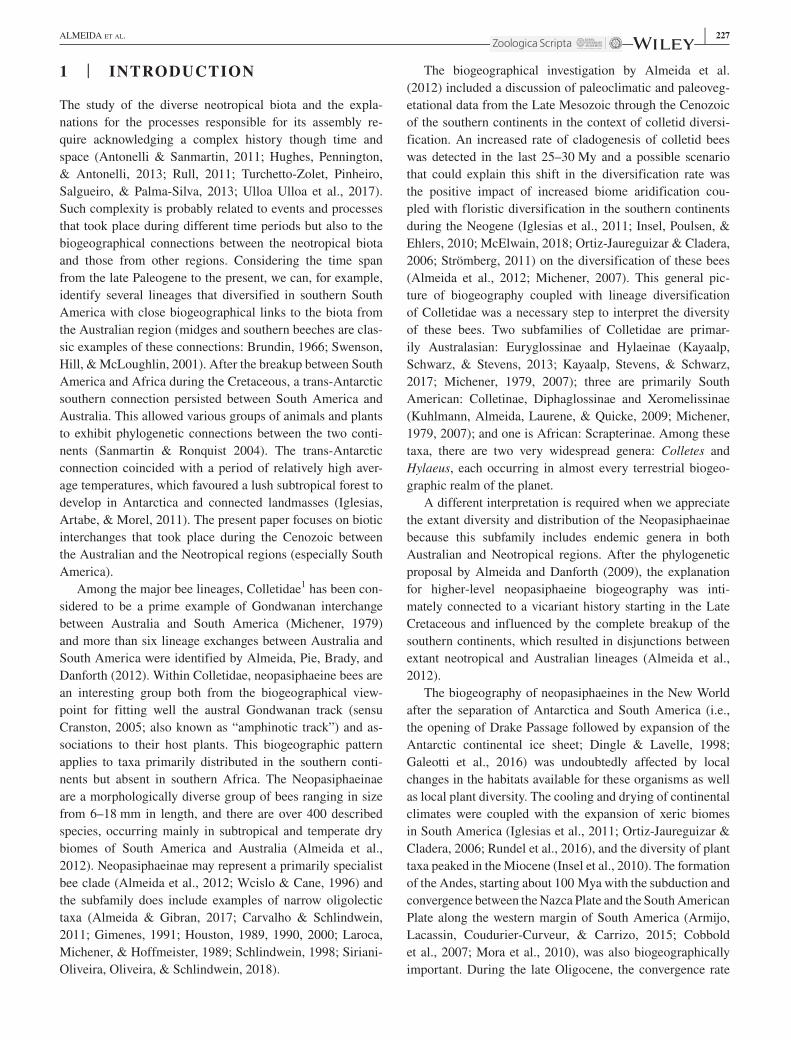
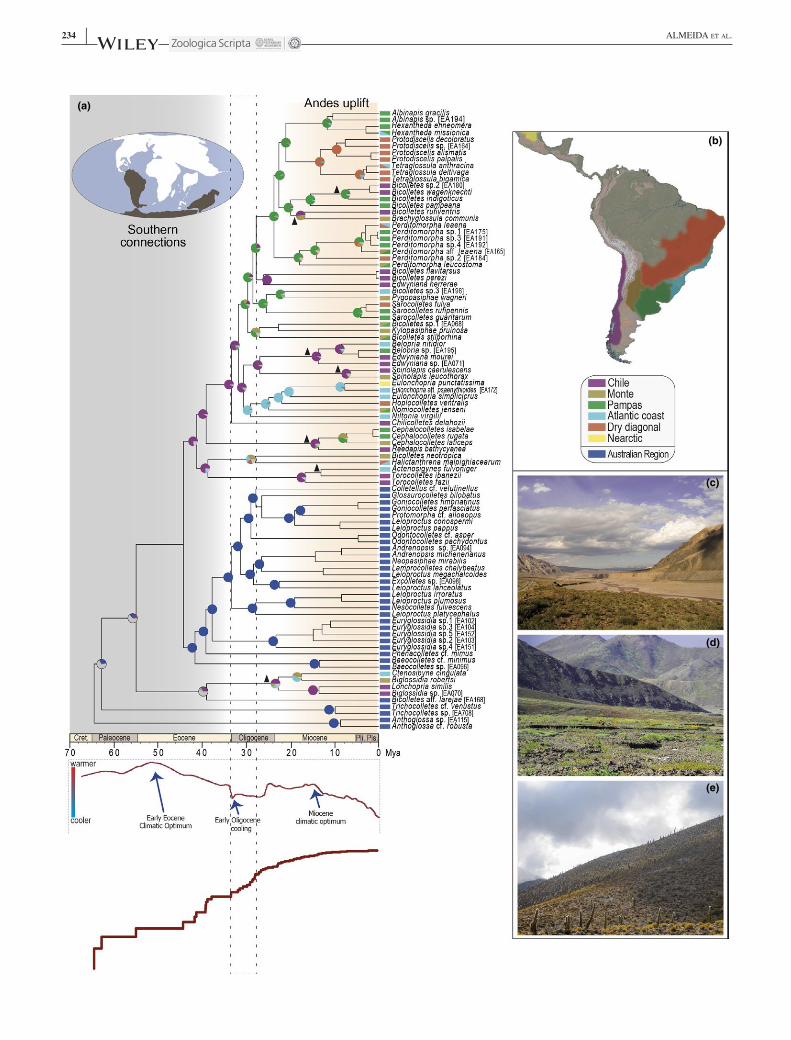
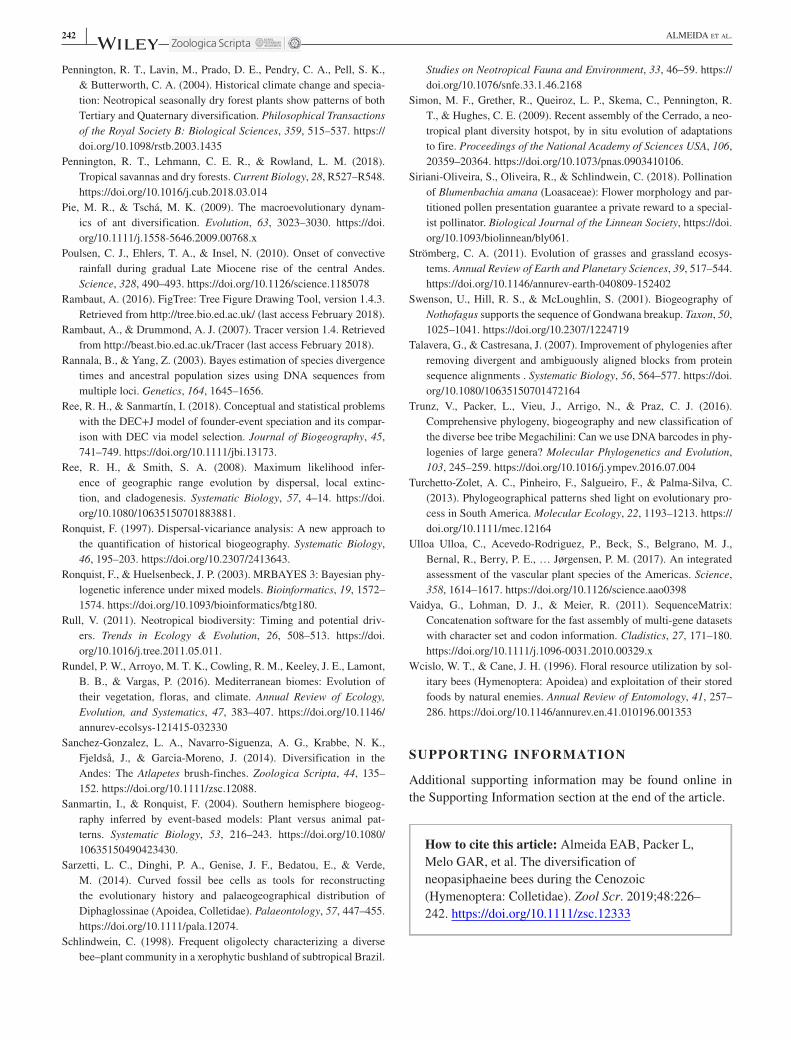
F I G U R E 3 (a) Top: Biogeographic reconstruction of the history of Neopasiphaeinae (Colletidae) under the Dispersal‐Extinction‐Cladogenesis model with founder‐event speciation (DEC + J) as implemented in BioGeoBEARS. The pie diagrams at nodes show the relative probability of the possible states (areas or combinations of areas). The rectangles on the right show the native ranges of each species within these clades in one or more of the seven colour‐coded areas scheme shown in (b) to categorize present distribution of Neopasiphaeinae on South and Central Americas (Australian region not shown in map). Grey slices of the pie diagrams of (a) represent multiple possible conflicting reconstructions for a given node; triangles indicate trans‐Andean clades. Bottom: average temperature curve since the Upper Cretaceous (modified from Zachos et al. 2001) and plot of lineages through time (LTT) for Neopasiphaeinae with the period of inferred increase in diversification demarcated by a dotted line rectangle (see Section 2 and Supporting information Figure S11 for more information). The earlier half of neopasiphaeine diversification took place during a period of higher temperatures and of connectivity among southern continents (shown in grey). For about the last 20 My, the uplift of the Andes changed the topography and climate of various parts of South America, as discussed in the text. (c, d) Examples of three South American habitats representing xeric subtropical/temperate areas where various endemic neopasiphaeine bees species are distributed: (c) vicinity of Cafayate (Salta, Argentina), (d) of Uspallata (Mendoza ‐ Argentina); and (e) of Copiapo (Atacama Region, Chile). For interpretation of the references to colour in this figure legend, the reader is referred to the web version of this article. [Colour figure can be viewed at wileyonlinelibrary.com]
236 | ALMEIDA Et AL.
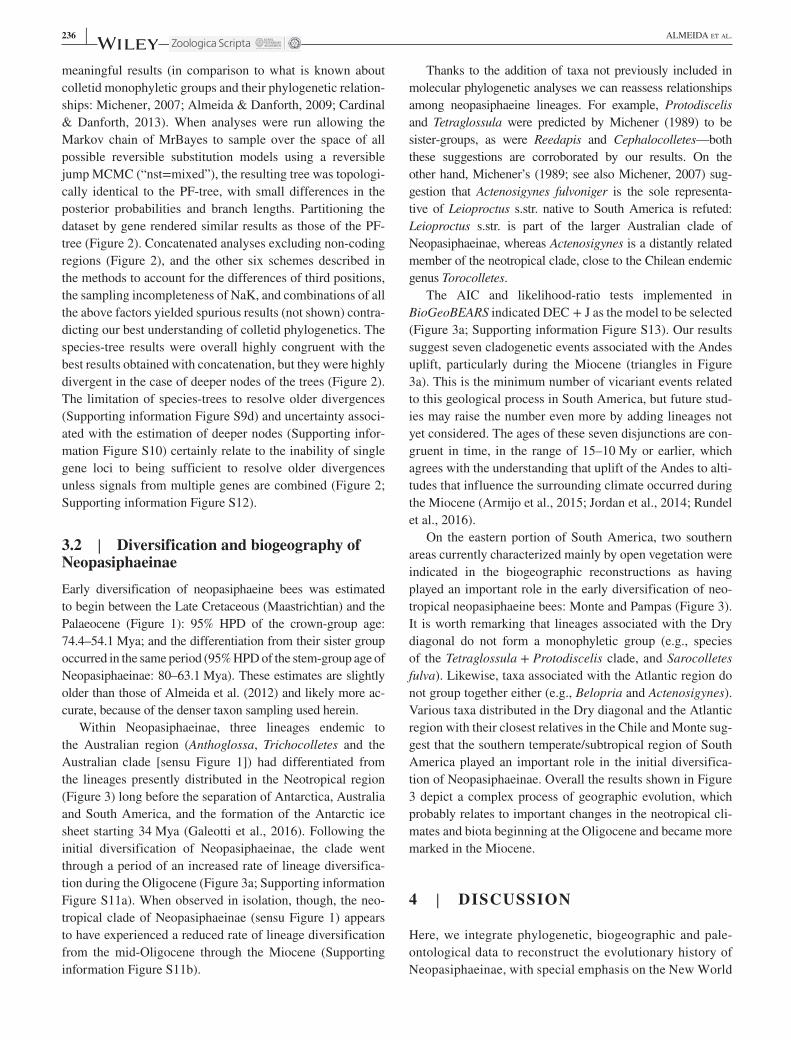
meaningful results (in comparison to what is known about colletid monophyletic groups and their phylogenetic relation-ships: Michener, 2007; Almeida & Danforth, 2009; Cardinal & Danforth, 2013). When analyses were run allowing the Markov chain of MrBayes to sample over the space of all possible reversible substitution models using a reversible jump MCMC (“nst=mixed”), the resulting tree was topologi-cally identical to the PF‐tree, with small differences in the posterior probabilities and branch lengths. Partitioning the dataset by gene rendered similar results as those of the PF‐tree (Figure 2). Concatenated analyses excluding non‐coding regions (Figure 2), and the other six schemes described in the methods to account for the differences of third positions, the sampling incompleteness of NaK, and combinations of all the above factors yielded spurious results (not shown) contra-dicting our best understanding of colletid phylogenetics. The species‐tree results were overall highly congruent with the best results obtained with concatenation, but they were highly divergent in the case of deeper nodes of the trees (Figure 2). The limitation of species‐trees to resolve older divergences (Supporting information Figure S9d) and uncertainty associ-ated with the estimation of deeper nodes (Supporting infor-mation Figure S10) certainly relate to the inability of single gene loci to being sufficient to resolve older divergences unless signals from multiple genes are combined (Figure 2; Supporting information Figure S12).
3.2 | Diversification and biogeography of NeopasiphaeinaeEarly diversification of neopasiphaeine bees was estimated to begin between the Late Cretaceous (Maastrichtian) and the Palaeocene (Figure 1): 95% HPD of the crown‐group age: 74.4–54.1 Mya; and the differentiation from their sister group occurred in the same period (95% HPD of the stem‐group age of Neopasiphaeinae: 80–63.1 Mya). These estimates are slightly older than those of Almeida et al. (2012) and likely more ac-curate, because of the denser taxon sampling used herein.
Within Neopasiphaeinae, three lineages endemic to the Australian region (Anthoglossa, Trichocolletes and the Australian clade [sensu Figure 1]) had differentiated from the lineages presently distributed in the Neotropical region (Figure 3) long before the separation of Antarctica, Australia and South America, and the formation of the Antarctic ice sheet starting 34 Mya (Galeotti et al., 2016). Following the initial diversification of Neopasiphaeinae, the clade went through a period of an increased rate of lineage diversifica-tion during the Oligocene (Figure 3a; Supporting information Figure S11a). When observed in isolation, though, the neo-tropical clade of Neopasiphaeinae (sensu Figure 1) appears to have experienced a reduced rate of lineage diversification from the mid‐Oligocene through the Miocene (Supporting information Figure S11b).
Thanks to the addition of taxa not previously included in molecular phylogenetic analyses we can reassess relationships among neopasiphaeine lineages. For example, Protodiscelis and Tetraglossula were predicted by Michener (1989) to be sister‐groups, as were Reedapis and Cephalocolletes—both these suggestions are corroborated by our results. On the other hand, Michener’s (1989; see also Michener, 2007) sug-gestion that Actenosigynes fulvoniger is the sole representa-tive of Leioproctus s.str. native to South America is refuted: Leioproctus s.str. is part of the larger Australian clade of Neopasiphaeinae, whereas Actenosigynes is a distantly related member of the neotropical clade, close to the Chilean endemic genus Torocolletes.
The AIC and likelihood‐ratio tests implemented in BioGeoBEARS indicated DEC + J as the model to be selected (Figure 3a; Supporting information Figure S13). Our results suggest seven cladogenetic events associated with the Andes uplift, particularly during the Miocene (triangles in Figure 3a). This is the minimum number of vicariant events related to this geological process in South America, but future stud-ies may raise the number even more by adding lineages not yet considered. The ages of these seven disjunctions are con-gruent in time, in the range of 15–10 My or earlier, which agrees with the understanding that uplift of the Andes to alti-tudes that influence the surrounding climate occurred during the Miocene (Armijo et al., 2015; Jordan et al., 2014; Rundel et al., 2016).
On the eastern portion of South America, two southern areas currently characterized mainly by open vegetation were indicated in the biogeographic reconstructions as having played an important role in the early diversification of neo-tropical neopasiphaeine bees: Monte and Pampas (Figure 3). It is worth remarking that lineages associated with the Dry diagonal do not form a monophyletic group (e.g., species of the Tetraglossula + Protodiscelis clade, and Sarocolletes fulva). Likewise, taxa associated with the Atlantic region do not group together either (e.g., Belopria and Actenosigynes). Various taxa distributed in the Dry diagonal and the Atlantic region with their closest relatives in the Chile and Monte sug-gest that the southern temperate/subtropical region of South America played an important role in the initial diversifica-tion of Neopasiphaeinae. Overall the results shown in Figure 3 depict a complex process of geographic evolution, which probably relates to important changes in the neotropical cli-mates and biota beginning at the Oligocene and became more marked in the Miocene.
4 | DISCUSSION
Here, we integrate phylogenetic, biogeographic and pale-ontological data to reconstruct the evolutionary history of Neopasiphaeinae, with special emphasis on the New World
| 237ALMEIDA Et AL.
taxa. The main contribution of our results is a significant increase in the knowledge of phylogenetic relationships among neopasiphaeine bees resulting from the expanded sampling in the Neotropical region. Previous to this work, Almeida et al. (2012) had assembled a dataset with four gene fragments and 59 neopasiphaeine species, and we now included ca. 60% more species (N = 94: Supporting information Table S3). In addition, we sampled two more gene loci (Supporting information Table S5). This im-proved taxon sampling serves as an essential basis for inferences on the biogeography and diversification of the group. Overall the phylogenetic structure of the colletid tree with Diphaglosinae (including Paracolletes) as sister to the remaining lineages, and the Neopasiphaeinae sister to the five subfamilies listed above has been consistently found over the last decade (Almeida & Danforth, 2009; Branstetter et al., 2017; Cardinal & Danforth, 2013), al-though the placement of the enigmatic Callomelittinae has varied considerably.
The main topological change in relation to the hypothe-sis of Almeida et al. (2012) is that Clade 1 + Clade 2 did not form a monophyletic group in that earlier study, whereas here they correspond to the neotropical clade (Figure 1). This means that, according to the current results, Cephalocolletes, Halictanthrena, Reedapis and Bicolletes neotropica are in-terpreted as being more closely related to the remaining neo-tropical taxa than to the Australian clade. Addition of more genetic data and improved taxon sampling have resulted in a phylogenetic hypothesis with a stronger biogeographic signal and higher support values overall (Figure 1; see also Supporting information Figure S8). Species‐tree methods have become increasingly popular during the last decade, but at least in our study, their contribution was meagre in com-parison to traditional approaches based on concatenation of loci. Although it is likely that species tree methods tend to be statistically consistent over a broader range of parameter space, their implementation may incur practical issues related to the level of phylogenetic signal in gene trees; this is par-ticularly a problem for datasets with few loci and in methods that co‐estimate gene trees and species trees, such as BEST (Liu, 2008) and *BEAST (Heled & Drummond, 2010). These practical issues often result in concatenation approaches out-performing species tree methods (Bayzid & Warnow, 2013).
When the credibility intervals estimated for the diver-gence times of 21 nodes of the tree were compared with those from Almeida et al. (2012) and with Cardinal and Danforth (2013), there is a clear agreement among those inferences (Supporting information Figure S12) as indicated by the over-all superposition of these intervals. It should be remarked that Cardinal and Danforth (2013) did not have Colletidae as the focus, but all bees in general, which allowed those authors to have prior ages defined by a larger number of fossil speci-mens (14 calibration points).
The diversification of neopasiphaeine bees during the Cenozoic occurred as a two‐step process. During an early stage of diversification from the Palaeocene until the end of the Eocene, connections between the southern conti-nents allowed components of their taxa to be shared among these land masses. From the Oligocene on, diversification of neopasiphaeines took place in isolation in the Australian Region (mainly Australia) and the New World (mainly South America), respectively.
The trans‐Antarctic interchanges of lineages of Neopasiphaeinae responsible for the close relationship among endemic Australian and neotropical taxa were dis-cussed by Almeida et al. (2012) and had also been addressed by Michener (1979: p. 302): “[p]resumably the separation of South American and Australian Paracolletini dates to at least 38 m.y. BP when more or less direct migration through Antarctica between these two continents became impossible.” Based on our biogeographical results (Figure 3), early neopa-siphaeine divergences occurred during the Palaeocene and Eocene and could be attributed to the end of a period of trans‐Antarctic connectivity. From the Late Cretaceous through much of the Eocene, Antarctica, southern Australasia and southern South America were connected and covered with a podocarp‐ and coniferous‐rich temperate wet forest biome (Crisp & Cook, 2013; Dettmann, 1989). Climate and vegeta-tion were very different in the southern continents before the separation from Antarctica, followed by the formation of a circum‐Antarctic current (Lawver & Gahagan, 2003), which steepened the gradient of temperatures from lower to higher latitudes, resulting in lower temperatures in southern areas. The beginning of the Oligocene was marked by a significant change in the world’s climate caused by the opening of the Southern Ocean when the tectonic separation of Australia and South America from Antarctica was complete. During the Oligocene and Miocene, South America experienced severe climatic changes following the opening of Drake’s Passage, with overall cooler and more arid conditions in comparison with the Eocene epoch (Figure 3a).
The increased diversification of the Neopasiphaeinae in the period after the complete separation of the southern con-tinents (Figure 3; Supporting information Figure S11) could be interpreted as a possible response to the changes in the abiotic as well as biotic conditions of the areas where neopa-siphaeine bees occurred in the Oligocene. A similar scenario had been discussed by Almeida et al. (2012) for the Colletidae as a whole. On the other hand, the diversification slowdown observed for the neotropical clade (Supporting information Figure S11b) is harder to explain because it can have biotic causes, such as increased species‐competition within com-munities and decrease in the rate of niche differentiation. Alternatively, it could be due to increased extinction (Moen & Morlon, 2014). Unfortunately, it is difficult to distinguish among these alternative possibilities given the data at hand.
238 | ALMEIDA Et AL.
4.1 | Into South AmericaFrom an early history in the southern landmasses of Gondwana along the trans‐Antarctic track (sensu Cranston, 2005), two main neopasiphaeine lineages established and diversified in South America: the neotropical clade and the Lonchopria s.l. clade. (Figure 1). There is a single genus, Eulonchopria, dis-tributed from Argentina and Brazil that reaches Central and southern North America (Michener, 1989), while most of the diversity of the subfamily is found in higher latitude areas of South America (25–35°S).
Divergence times among most neotropical genera of Neopasiphaeinae indicate that they differentiated and started their diversification during the Miocene (Figures 1, 3). The divergence of the major clades is chronologically consistent with different events happening in South America during the Tertiary, particularly, the Andes uplift, cooling and drying of various parts of the continent beginning in the Oligocene, and the expansion of open vegetation biomes (and related diver-sification of plant taxa in those habitats (Iglesias et al., 2011; McElwain, 2018; Ortiz‐Jaureguizar & Cladera, 2006; Simon et al., 2009), which become more evident during the Miocene (Insel et al., 2010; Pennington et al., 2004; Pennington, Lehmann, & Rowland, 2018; Strömberg, 2011). The current differentiation of biomes into ten distinctive vegetation units is a distinctly modern phenomenon that likely had its origin in the Mid‐Miocene or later (McElwain, 2018; Pennington et al., 2018; Simon et al., 2009).
In some cases, we find species of sister taxa co‐occurring at least in part of the distribution, such as Tetraglossula and Protodiscelis (95% HPD of the divergence among these gen-era: 16.2–10.2 My). In this case, the clear difference of asso-ciation with specific host plants (i.e., oligolecty) occurring near watercourses and swampy habitats (Almeida & Gibran, 2017) seems to be part of an explanation for the differenti-ation between them—whereas Tetraglossula have Ludwigia (Onagraceae) as their host plants, species of Protodiscelis are associated to Alismataceae and Limnocharitaceae (Almeida & Gibran, 2017; Carvalho & Schlindwein, 2011 and refer-ences therein).
The diversification history of South American Neopasiphaeinae involved, in some instances, geographical (abiotic) forces, and the hypothesis of the Andean uplift as a driver of diversification during the Cenozoic figures as an im-portant explanation for some neopasiphaeine genera, and sev-eral publications have agreed on this hypothesis (Antonelli & Sanmartin, 2011; Antonelli, Nylander, Persson, & Sanmartín, 2009; Ceccarelli et al., 2016; Sanchez‐Gonzalez, Navarro‐Siguenza, Krabbe, Fjeldså, & Garcia‐Moreno, 2014). The changes related to the formation of this Cordillera include the break‐up of ancestral ranges into western and eastern sub-groups. However, the geological processes involved with the uplift of the Andes resulted in higher habitat heterogeneity
(Antonelli & Sanmartin, 2011) associated with changes in climate particularly related to wind circulation and precip-itation, and the formation of a diversity of habitats with a range of vegetation types, especially by the emergence of island‐like habitats (Hughes & Eastwood, 2006). In this con-text, one example of neopasiphaeine bees worth mention-ing is the sister‐group relationship between Reedapis and Cephalocolletes (95% HPD: 17.9–9.4 My; Supporting infor-mation Figure S8) certainly responding to the Andes separa-tion of the ancestor of the former on the western and of the latter in the eastern portions of the cordillera. We estimated that at least seven cladogenetic events in the history of the Neopasiphaeinae could be explained by disjunctions result-ing from the Andes uplift (triangles in Figure 3a). If on the one hand, the break‐up of ancestral ranges is more directly quantifiable, on the other hand, we can appreciate that dif-ferent groups primarily or exclusively associated to habitats at higher altitudes had their history associated to the Andean orogeny (e.g., Brachyglossula, Lonchorhyncha and some spe-cies of Lonchopria s.l.).
In the last two decades, the field of historical biogeogra-phy has been marked by the development of different ana-lytical approaches that stimulated the evaluation of scenarios of geographic range evolution of individual taxa. Time‐cali-brated phylogenetic trees have become increasingly attractive to biogeographers because they offer the opportunity to test different aspects of the history of a group. BioGeoBEARS (Matzke, 2013, 2014) was used here to implement and con-trast three approaches that allow the modelling of processes responsible for changes of distributions of taxa using the tree to provide a temporal framework: DEC, DIVA and BayArea. The possibility of statistically comparing multiple models under the likelihood framework (Matzke, 2013, 2014) is very attractive, but Ree and Sanmartín (2018) recently warned about the pitfalls present in the implementation of the param-eter describing founder event speciation (“jump dispersal”—parameter “J”) in BioGeoBEARS. Testing for jump dispersal as a meaningful process of range evolution is discouraged by Ree and Sanmartín (2018) in an explicit model‐comparison, which does not preclude judgements to be made about the re-constructions output by BioGeoBEARS. Indeed, the preferred model for explaining the geographic range evolution of the South American Neopasiphaeinae here was DEC+J (Figure 3; Supporting information Figure S13). When comparing the five alternative reconstructions, the scenarios did not change much in relation to that shown in the figures, although in some reconstructions without the parameter J (e.g., DEC), more un-certainty can be noted in deeper nodes of the tree because fewer anagenetic changes are assumed and earlier vicariance tends to be more commonly assumed (Ree & Sanmartín, 2018). Overall, the results allow us to present a scenario of neotropical lineages of Neopasiphaeinae initially associated with areas of open vegetation in subtropical and temperate
| 239ALMEIDA Et AL.
portions of South America, followed by multiple separations of lineages east and west of the Andes, and more recent occu-pations of habitats in tropical portions of the continent.
ACKNOWLEDGEMENTS
This project was primarily supported by grants 2011/09477‐9 and 2012/08479‐0, São Paulo Research Foundation (FAPESP) to EABA. Additional funding for this research came from National Science Foundation Research Grants BND (DEB‐0412176), CNPq grants 459826/2014‐0 and 304735/2016‐7 to EABA, CNPq grant 309641/2016‐0 to GARM and CNPQ grant 301636/2016 to MRP; this study was financed in part by the Coordenação de Aperfeiçoamento de Pessoal de Nível Superior ‐ Brasil (CAPES) ‐ Finance Code 001. LP is grateful for funding from the Natural Sciences and Engineering Research Council of Canada and a National Geographic Research and Exploration Grant. We are grateful to Margarita Lopez‐Uribe and Jason Gibbs for their assistance with DNA sequencing. We are indebted to all individuals who graciously supplied specimens used for DNA extraction: Antonio J. C. Aguiar, Dalton S. Amorim, Julia C. Almeida, Isabel Alves‐dos‐Santos, John S. Ascher, Ayrton T. Carvalho, Luis Compagnucci, Torsten Dikow, Paschoal Grossi, Martin Hauser, Terry Houston, Remko Lejs, James K. Liebherr, Karl Magnacca, Paulo Millet, Kelli S. Ramos, Claus Rasmussen, Jerome G. Rozen Jr., Michael Schwarz, Andrew E. Z. Short, Daniela M. Takiya, Lorenzo R. S. Zanette, and Amro Zayed. Assistance for field trips was given by Antonio Aguiar, Paulo Almeida, Julia Almeida, Luis Felipe Delsin, Nádia S. Gibran, Paschoal Grossi, Daercio A. Lucena, Diego S. Porto, Charlotte Skov, José Amilcar Tavares Filho, Alfredo Ugarte, Grazielle Weiss, and Lorenzo Zanette and we are grateful for their invaluable help and companionship. Dalton S. Amorim is acknowledged for discussions about neotropical biogeog-raphy, two reviewers for providing helpful suggestions and comments that improve paper, and Fabiano Stefanello for kindly assisting in the preparation of one Supporting infor-mation Figure S9.
ENDNOTE1One of us (GARM) would prefer to regard Colletidae as a subfamily of
Apidae sensu lato, and the subfamilies herein mentioned would then be treated as tribes of Colletinae, as a way to emphasize the distinc-tiveness of the bee clade in relation to the other families of Apoidea; the remaining authors prefer the traditional bee classification in which seven families are usually recognized for being more widely used.
ORCID
Eduardo A. B. Almeida https://orcid.org/0000-0001-6017-6364
Laurence Packer https://orcid.org/0000-0002-1711-8203 Gabriel A. R. Melo https://orcid.org/0000-0001-9042-3899 Bryan N. Danforth https://orcid.org/0000-0002-6495-428X Fábio B. Quinteiro https://orcid.org/0000-0002-5968-6532 Marcio R. Pie http://orcid.org/0000-0002-2949-4871
REFERENCES
Almeida, E. A. B. (2008). Revised species checklist of the Paracolletinae (Hymenoptera, Colletidae) of the Australian region, with the de-scription of new taxa. Zootaxa, 1891, 1–24. https://doi.org/10.5281/zenodo.184350.
Almeida, E. A. B., & Danforth, B. N. (2009). Phylogeny of colletid bees (Hymenoptera: Colletidae) inferred from four nuclear genes. Molecular Phylogenetics and Evolution, 50, 290–309. https://doi.org/10.1016/j.ympev.2008.09.028.
Almeida, E. A. B., & Gibran, N. S. (2017). Taxonomy of neopasiphaeine bees: Review of Tetraglossula Ogloblin, 1948 (Hymenoptera: Colletidae). Zootaxa, 4303, 521–544. https://doi.org/10.11646/zootaxa.4303.4.5
Almeida, E. A. B., Packer, L., & Danforth, B. N. (2008). Phylogeny of the Xeromelissinae (Hymenoptera: Colletidae) based upon morphol-ogy and molecules. Apidologie, 39, 75–85. https://doi.org/10.1051/apido:2007063.
Almeida, E. A. B., Pie, M. R., Brady, S. G., & Danforth, B. N. (2012). Biogeography and diversification of colletid bees (Hymenoptera: Colletidae): Emerging patterns from the southern end of the world. Journal of Biogeography, 39, 526–544. https://doi.org/10.1111/j.1365-2699.2011.02624.x.
Amorim, D. S., & Pires, M. R. S. (1996). Neotropical biogeography es-timation. In C. E. M. Bicudo, & N. A. Menezes (Eds.), Biodiversity in Brazil. A first approach, proceedings of the workshop methods for the assessment of biodiversity in plants and animals (pp. 183–219). São Paulo, SP: CNPq/Instituto de Botânica.
Antonelli, A., Nylander, J. A. A., Persson, C., & Sanmartín, I. (2009). Tracing the impact of the Andean uplift on Neotropical plant evolution. Proceedings of the National Academy of Sciences of the United States of America, 106, 9749–9754. https://doi.org/10.1073/pnas.0811421106.
Antonelli, A., & Sanmartin, I. (2011). Why are there so many plant spe-cies in the Neotropics? Taxon, 60, 403–414.
Armijo, R., Lacassin, R., Coudurier‐Curveur, A., & Carrizo, D. (2015). Coupled tectonic evolution of Andean orogeny and global cli-mate. Earth‐Science Reviews, 143, 1–35. https://doi.org/10.1016/j.earscirev.2015.01.005.
Batley, M., & Houston, T. F. (2012). Revision of the Australian bee genus Trichocolletes Cockerell (Hymenoptera: Colletidae: Paracolletini). Records of the Australian Museum, 64, 1–50. https://doi.org/10.3853/j.0067-1975.64.2012.1589.
Bayzid, M. S., & Warnow, T. (2013). Naive binning improves phy-logenomic analyses. Bioinformatics, 29, 2277–2284. https://doi.org/10.1093/bioinformatics/btt394.
Bouckaert, R., Heled, J., Kühnert, D., Vaughan, T., Wu, C.‐H., Xie, D., … Drummond, A. J. (2014). BEAST 2: A software platform for Bayesian evolutionary analysis. PLoS Computational Biology, 10(4), e1003537. https://doi.org/10.1371/journal.pcbi.1003537
Branstetter, M. G., Danforth, B. N., Pitts, J. P., Faircloth, B. C., Ward, P. S., Buffington, M. L., … Brady, S. G. (2017). Phylogenomic
240 | ALMEIDA Et AL.
insights into the evolution of stinging wasps and the origins of ants and bees. Current Biology, 27, 1019–1025. https://doi.org/10.1016/j.cub.2017.03.027
Brundin, L. (1966). Transantarctic relationships and their signifi-cance as evidenced by chironomid midges. With a monograph of the subfamilies Podonominae and Aphroteniinae and the austral Heptagyiae. Stockholm, Sweden: Almqvist & Wiksell.
Cardinal, S., & Danforth, B. N. (2013). Bees diversified in the age of eudicots. Proceedings of the Royal Society B: Biological Sciences, 280(1755), 20122686–20122686. https://doi.org/10.1098/rspb.2012.2686
Cardinal, S., Straka, J., & Danforth, B. N. (2010). Comprehensive phy-logeny of apid bees reveals the evolutionary origins and antiquity of cleptoparasitism. Proceedings National Academy of Sciences of the United States of America, 107, 16207–16211. https://doi.org/10.1073/pnas.1006299107.
Carvalho, A. T., & Schlindwein, C. (2011). Obligate association of an oligolectic bee and a seasonal aquatic herb in semi‐arid north‐east-ern Brazil. Biological Journal of the Linnean Society, 102, 355–368. https://doi.org/10.1111/j.1095-8312.2010.01587.x.
Ceccarelli, F. C., Ojanguren‐Affilastro, A. A., Ramírez, M. J., Ochoa, J. A., Mattoni, C. I., & Prendini, L. (2016). Andean uplift drives diversification of the bothriurid scorpion genus Brachistosternus. Journal of Biogeography, 43, 1942–1954. https://doi.org/10.1111/jbi.12760.
Cobbold, P. R., Rossello, E. A., Roperch, P., Arriagada, C., Gómez, L. A., & Lima, C. (2007). Distribution, timing, and causes of Andean deformation across South America. Geological Society, London, Special Publications, 272, 321–343. https://doi.org/10.1144/GSL.SP.2007.272.01.17.
Cranston, P. S. (2005). Biogeographical history. In D. K. Yeates, & B. M. Wiegmann (Eds.), The evolutionary biology of flies (pp. 274–311). New York, NY: Columbia University Press.
Crisp, M. D., & Cook, L. D. (2013). How was the Australian flora as-sembled over the last 65 million years? A molecular phylogenetic perspective. Annual Review of Ecology, Evolution, and Systematics, 44, 303–324. https://doi.org/10.1146/annurev-ecolsys-110512- 135910.
Danforth, B. N. (1999). Phylogeny of the bee genus Lasioglossum (Hymenoptera:Halictidae) based on mitochondrial cytochrome oxidase. Systematic Entomology, 24, 377–393. https://doi.org/10.1046/j.1365-3113.1999.00087.x
Darriba, D., Taboada, G. L., Doallo, R., & Posada, D. (2012). jModelT-est 2: More models, new heuristics and parallel computing. Nature Methods, 9(8), 772. https://doi.org/10.1038/nmeth.2109.
Degnan, J. H., & Rosenberg, N. A. (2006). Discordance of species trees with their most likely gene trees. PLoS Genetics, 2(5), e68. https://doi.org/10.1371/journal.pgen.0020068.
Dettmann, M. E. (1989). Antarctica: Cretaceous cradle of austral tem-perate forest? In: J. A. Crane (Eds.), Origins and Evolution of the Antarctic Biota. Geological Society Special Publications No. 47, pp. 89–105.
Dingle, R. V., & Lavelle, M. (1998). Late Cretaceous‐Cenozoic climatic variations of the northern Antarctic peninsula: New geochemi-cal evidence and review. Palaeogeography, Palaeoclimatology, Palaeoecology, 141, 215–232. https://doi.org/10.1016/S0031-0182(98)00056-X.
Drummond, A. J., Ho, S. Y. W., Phillips, M. J., & Rambaut, A. (2006). Relaxed phylogenetics and dating with confidence. PLoS Biology, 4(5), e88. https://doi.org/10.1371/journal.pbio.0040088
Drummond, A. J., Suchard, M. A., Xie, D., & Rambaut, A. (2012). Bayesian phylogenetics with BEAUti and the BEAST 1.7. Molecular Biology and Evolution, 29, 1969–1973. https://doi.org/10.1093/molbev/mss075
Edwards, S. V., Liu, L., & Pearl, D. K. (2007). High‐resolution species trees without concatenation. Proceedings of the National Academy of Sciences of the United States of America, 104, 5936–5941. https://doi.org/10.1073/pnas.0607004104
Engel, M. S. (1999). A new xeromelissine bee in Tertiary amber of the Dominican Republic (Hymenoptera: Colletidae). Entomologica Scandinavica, 30, 453–458. https://doi.org/10.1163/187631200X00561
Galeotti, S., DeConto, R., Naish, T., Stocchi, P., Florindo, F., Pagani, M., … Zachos, F. C. (2016). Antarctic ice sheet variability across the Eocene‐Oligocene boundary climate transition. Science, 352, 76–80. https://doi.org/10.1126/science.aab0669
Gimenes, M. (1991). Some morphological adaptations in bees (Hymenoptera, Apoidea) for collecting pollen from Ludwigia elegans (Onagraceae). Revista Brasileira De Entomologia, 35, 413–422.
Gonzalez, V. H., & Florez, J. (2011). Leioproctus rosellae sp. n., the first record of the genus from northern South America (Hymenoptera, Colletidae). ZooKeys, 141, 71–77. https://doi.org/10.3897/zookeys.141.2029
Harmon, L. J., Weir, J. T., Brock, C. D., Glor, R. E., & Challenger, W. (2008). GEIGER: Investigating evolutionary radia-tions. Bioinformatics, 24, 129–131. https://doi.org/10.1093/bioinformatics/btm538
Heled, J., & Drummond, A. J. (2010). Bayesian inference of species trees from multilocus data. Molecular Biology and Evolution, 27, 570–580. https://doi.org/10.1093/molbev/msp274
Hoorn, C., Wesselingh, F. P., ter Steege, H., Bermudez, M. A., Mora, A., Sevink, J., … Antonelli, A. (2010). Amazonia through time: Andean uplift, climate change, landscape evolution, and biodiversity. Science, 330, 927–931. https://doi.org/10.1126/science.1194585
Houston, T. F. (1989). Leioproctus associated with Western Australia smoke bushes (Conospermum spp.) and their adaptations for for-aging and concealment (Hymenoptera: Colletidae: Paracolletini). Records of the Western Australian Museum, 14, 275–292.
Houston, T. F. (1990). Descriptions of new paracolletine bees associated with flowers of Eremophila (Hymenoptera: Colletidae). Records of the Western Australian Museum, 14, 583–621.
Houston, T. F. (2000). Native Bees on Wildflowers in Western Australia. A Synopsis of Native Bee Visitation of Wildflowers in Western Australia Based on the Bee Collection of the Western Australian Museum. Perth, WA: Western Australian Insect Study Society Inc. (Special. Publication, No, 2).
Huelsenbeck, J. P., & Ronquist, F. (2001). MRBAYES: Bayesian infer-ence of phylogeny. Bioinformatics, 17, 754–755.
Hughes, C., & Eastwood, R. (2006). Island radiation on a continental scale: Exceptional rates of plant diversification after uplift of the Andes. Proceedings of the National Academy of Sciences USA, 103(27), 10334–10339. https://doi.org/10.1073/pnas.0601928103.
Hughes, C. E., Pennington, R. T., & Antonelli, A. (2013). Neotropical plant evolution: Assembling the big picture. Botanical Journal of the Linnean Society, 171, 1–18. https://doi.org/10.1111/boj.12006.
Iglesias, A., Artabe, A. E., & Morel, E. M. (2011). The evolution of Patagonian climate and vegetation from the Mesozoic to the present. Biological Journal of the Linnean Society, 103, 409–422. https://doi.org/10.1111/j.1095-8312.2011.01657.x.
| 241ALMEIDA Et AL.
Insel, N., Poulsen, C. J., & Ehlers, T. A. (2010). Influence of the Andes Mountains on South American moisture transport, convection, and precipitation. Climate Dynamics, 35, 1477–1492. https://doi.org/10.1007/s00382-009-0637-1.
Jordan, T. E., Kirk‐Lawlor, N. E., Blanco, N., Rech, J. A., & Cosentino, N. J. (2014). Landscape modification in response to repeated onset of hyperarid paleoclimate states since 14 Ma, Atacama Desert, Chile. Geological Society of America Bulletin, 126(7/8), 1016–1046. https://doi.org/10.1130/B30978.1
Kainer, D., & Lanfear, R. (2015). The effects of partitioning on phylo-genetic inference. Molecular Biology and Evolution, 32(6), 1611–1627. https://doi.org/10.1093/molbev/msv026
Katoh, K., & Standley, D. M. (2013). MAFFT multiple sequence align-ment software version 7: Improvements in performance and us-ability. Molecular Biology and Evolution, 30, 772–780. https://doi.org/10.1093/molbev/mst010
Kayaalp, P., Schwarz, M. P., & Stevens, M. I. (2013). Rapid diversi-fication in Australia and two dispersals out of Australia in the globally distributed bee genus, Hylaeus (Colletidae: Hylaeinae). Molecular Phylogenetics and Evolution, 66, 668–678. https://doi.org/10.1016/j.ympev.2012
Kayaalp, P., Stevens, M. I., & Schwarz, M. P. (2017). ‘Back to Africa’: Increased taxon sampling confirms a problematic Australia‐to‐Africa bee dispersal event in the Eocene. Systematic Entomology, 42, 724–733. https://doi.org/10.1111/syen.12241
Kuhlmann, M., Almeida, E. A. B., Laurene, N., & Quicke, D. L. J. (2009). Molecular phylogeny and historical biogeography of the bee genus Colletes Latreille, 1802 (Hymenoptera: Apiformes: Colletidae), based on mitochondrial COI and nuclear 28S sequence data. Insect Systematics and Evolution, 49, 291–318. https://doi.org/10.1163/139956009X12475840653733
Landis, M. J., Matzke, N. J., Moore, B. R., & Huelsenbeck, J. P. (2013). Bayesian analysis of biogeography when the number of areas is large. Systematic Biology, 62, 789–804. https://doi.org/10.1093/sysbio/syt040
Lanfear, R., Frandsen, P. B., Wright, A. M., Senfeld, T., & Calcott, B. (2016). PartitionFinder 2: New methods for selecting partitioned models of evolution for molecular and morphological phylogenetic analyses. Molecular Biology and Evolution, 34(3), 772–773. https://doi.org/10.1093/molbev/msw260
Laroca, S., Michener, C. D., & Hoffmeister, R. M. (1989). Long mouth-parts among "short‐tongued" bees and the fine structure of the la-bium in Niltonia. Journal of the Kansas Entomological Society, 62, 400–410.
Lawver, L. A., & Gahagan, L. M. (2003). Evolution of Cenozoic seaways in the circum‐Antarctic region. Palaeogeography, Palaeoclimatology, Palaeoecology, 198, 11–37. https://doi.org/10.1016/S0031-0182(03)00392-4
Lin, C. P., & Danforth, B. N. (2004). How do insect nuclear and mitochon-drial gene substitution patterns differ? Insights from Bayesian anal-yses of combined datasets. Molecular Phylogenetics and Evolution, 30, 686–702. https://doi.org/10.1016/S1055-7903(03)00241-0.
Liu, L. (2008). BEST: Bayesian estimation of species trees under the coalescent model. Bioinformatics, 24, 2542–2543. https://doi.org/10.1093/bioinformatics/btn484.
Maddison, W. P. (1997). Gene trees in species trees. Systematic Biology, 46, 523–536. https://doi.org/10.1093/sysbio/46.3.523
Maddison, W. P., & Maddison, D. R. (2018). Mesquite: A modular sys-tem for evolutionary analysis. Retrieved from Version 3.40 http://mesquiteproject.org (last access February 2018).
Matzke, N. J. (2013). BioGeoBEARS: biogeography with Bayesian (and likelihood) evolutionary analysis in R Scripts. Rpackage, version 0.2.1. Retrieved from: http://CRAN.R-project.org/package=Bio-GeoBEARS (last access February 2018).
Matzke, N. J. (2014). Model selection in historical biogeography reveals that founder‐event speciation is a crucial process in island clades. Systematic Biology, 63, 951–970. https://doi.org/10.1093/sysbio/syu056.
Maynard, G. V. (2013). Revision of Goniocolletes and seven Australian subgenera of Leioproctus (Hymenoptera: Apoidea: Colletidae), and description of new taxa. Zootaxa, 3715, 1–114. https://doi.org/10.11646/zootaxa.3715.1.1.
McElwain, J. C. (2018). Paleobotany and global change: Important les-sons for species to biomes from vegetation responses to past global change. Annual Review of Plant Biology, 69, 761–787. https://doi.org/10.1146/annurev-arplant-042817-040405.
Michener, C. D. (1979). Biogeography of the bees. Annals of the Missouri Botanical Garden, 66, 277–347. https://doi.org/10.2307/2398833
Michener, C. D. (1989). Classification of the American Colletinae. The University of Kansas Science Bulletin, 53, 622–703.
Michener, C. D. (2007). The Bees of the World, 2nd ed. Baltimore, MD: The John Hopkins University Press.
Michener, C. D., & Poinar, G. Jr (1996). The known bee fauna of the Dominican amber. Journal of the Kansas Entomological Society, 69, 353–361.
Moen, D., & Morlon, H. (2014). Why does diversification slow down? Trends in Ecology & Evolution, 29, 190–197. https://doi.org/10.1016/j.tree.2014.01.010
Mora, A., Baby, P., Roddaz, M., Parra, M., Brusset, S., Hermoza, W., & Espurt, N. (2010). Tectonic history of the Andes and sub‐Andean zones: Implications for the development of the Amazon drainage basin. In C. Hoorn, & F. P. Wesselingh (Eds.), Amazonia, landscape and species evolution (pp. 38–60). Oxford, UK: Wiley.
Moreira‐Muñoz, A. (2007). The Austral floristic realm revis-ited. Journal of Biogeography, 34, 1649–1660. https://doi.org/10.1111/j.1365-2699.2007.01757.x
Morrone, J. J. (2014). Biogeographical regionalisation of the Neotropical re-gion. Zootaxa, 3782, 1–110. https://doi.org/10.11646/zootaxa.3782.1.1
Moure, J. S., Graf, V., & Urban, D. (2012). Paracolletini Cockerell, 1934. In Moure, J. S., Urban, D. & Melo, G. A. R. (Orgs). Catalogue of Bees (Hymenoptera, Apoidea) in the Neotropical Region ‐ online version. Retrieved from http://www.moure.cria.org.br/catalogue (last access February 2018).
Moure, J. S., Urban, D., & Melo, G. A. R. (2007). Catalogue of bees (Hymenoptera, Apoidea) in the Neotropical region. Curitiba, Brazil: Sociedade Brasileira de Entomologia.
Ortiz‐Jaureguizar, E., & Cladera, G. A. (2006). Paleoenvironmental evolution of southern South America during the Cenozoic. Journal of Arid Environments, 66, 498–532. https://doi.org/10.1016/j.jaridenv.2006.01.007.
Packer, L., & Ruz, L. (2017). DNA barcoding the bees (Hymenoptera: Apoidea) of Chile: Species discovery in a reasonably well known bee fauna with the description of a new species of Lonchopria (Colletidae). Genome, 60, 414–430. https://doi.org/10.1139/gen-2016-0071
Paradis, E. (2003). Analysis of diversification: Combining phylogenetic and taxonomic data. Proceedings of the Royal Society B: Biological Sciences, 270, 2499–2505. https://doi.org/10.1098/rspb.2003.2513
Paradis, E., Claude, J., & Strimmer, K. (2004). APE: Analyses of phylo-genetics and evolution in R language. Bioinformatics, 20, 289–290. https://doi.org/10.1093/bioinformatics/btg412
242 | ALMEIDA Et AL.
Pennington, R. T., Lavin, M., Prado, D. E., Pendry, C. A., Pell, S. K., & Butterworth, C. A. (2004). Historical climate change and specia-tion: Neotropical seasonally dry forest plants show patterns of both Tertiary and Quaternary diversification. Philosophical Transactions of the Royal Society B: Biological Sciences, 359, 515–537. https://doi.org/10.1098/rstb.2003.1435
Pennington, R. T., Lehmann, C. E. R., & Rowland, L. M. (2018). Tropical savannas and dry forests. Current Biology, 28, R527–R548. https://doi.org/10.1016/j.cub.2018.03.014
Pie, M. R., & Tschá, M. K. (2009). The macroevolutionary dynam-ics of ant diversification. Evolution, 63, 3023–3030. https://doi.org/10.1111/j.1558-5646.2009.00768.x
Poulsen, C. J., Ehlers, T. A., & Insel, N. (2010). Onset of convective rainfall during gradual Late Miocene rise of the central Andes. Science, 328, 490–493. https://doi.org/10.1126/science.1185078
Rambaut, A. (2016). FigTree: Tree Figure Drawing Tool, version 1.4.3. Retrieved from http://tree.bio.ed.ac.uk/ (last access February 2018).
Rambaut, A., & Drummond, A. J. (2007). Tracer version 1.4. Retrieved from http://beast.bio.ed.ac.uk/Tracer (last access February 2018).
Rannala, B., & Yang, Z. (2003). Bayes estimation of species divergence times and ancestral population sizes using DNA sequences from multiple loci. Genetics, 164, 1645–1656.
Ree, R. H., & Sanmartín, I. (2018). Conceptual and statistical problems with the DEC+J model of founder‐event speciation and its compar-ison with DEC via model selection. Journal of Biogeography, 45, 741–749. https://doi.org/10.1111/jbi.13173.
Ree, R. H., & Smith, S. A. (2008). Maximum likelihood infer-ence of geographic range evolution by dispersal, local extinc-tion, and cladogenesis. Systematic Biology, 57, 4–14. https://doi.org/10.1080/10635150701883881.
Ronquist, F. (1997). Dispersal‐vicariance analysis: A new approach to the quantification of historical biogeography. Systematic Biology, 46, 195–203. https://doi.org/10.2307/2413643.
Ronquist, F., & Huelsenbeck, J. P. (2003). MRBAYES 3: Bayesian phy-logenetic inference under mixed models. Bioinformatics, 19, 1572–1574. https://doi.org/10.1093/bioinformatics/btg180.
Rull, V. (2011). Neotropical biodiversity: Timing and potential driv-ers. Trends in Ecology & Evolution, 26, 508–513. https://doi.org/10.1016/j.tree.2011.05.011.
Rundel, P. W., Arroyo, M. T. K., Cowling, R. M., Keeley, J. E., Lamont, B. B., & Vargas, P. (2016). Mediterranean biomes: Evolution of their vegetation, floras, and climate. Annual Review of Ecology, Evolution, and Systematics, 47, 383–407. https://doi.org/10.1146/annurev-ecolsys-121415-032330
Sanchez‐Gonzalez, L. A., Navarro‐Siguenza, A. G., Krabbe, N. K., Fjeldså, J., & Garcia‐Moreno, J. (2014). Diversification in the Andes: The Atlapetes brush‐finches. Zoologica Scripta, 44, 135–152. https://doi.org/10.1111/zsc.12088.
Sanmartin, I., & Ronquist, F. (2004). Southern hemisphere biogeog-raphy inferred by event-based models: Plant versus animal pat-terns. Systematic Biology, 53, 216–243. https://doi.org/10.1080/ 10635150490423430.
Sarzetti, L. C., Dinghi, P. A., Genise, J. F., Bedatou, E., & Verde, M. (2014). Curved fossil bee cells as tools for reconstructing the evolutionary history and palaeogeographical distribution of Diphaglossinae (Apoidea, Colletidae). Palaeontology, 57, 447–455. https://doi.org/10.1111/pala.12074.
Schlindwein, C. (1998). Frequent oligolecty characterizing a diverse bee–plant community in a xerophytic bushland of subtropical Brazil.
Studies on Neotropical Fauna and Environment, 33, 46–59. https://doi.org/10.1076/snfe.33.1.46.2168
Simon, M. F., Grether, R., Queiroz, L. P., Skema, C., Pennington, R. T., & Hughes, C. E. (2009). Recent assembly of the Cerrado, a neo-tropical plant diversity hotspot, by in situ evolution of adaptations to fire. Proceedings of the National Academy of Sciences USA, 106, 20359–20364. https://doi.org/10.1073/pnas.0903410106.
Siriani‐Oliveira, S., Oliveira, R., & Schlindwein, C. (2018). Pollination of Blumenbachia amana (Loasaceae): Flower morphology and par-titioned pollen presentation guarantee a private reward to a special-ist pollinator. Biological Journal of the Linnean Society, https://doi.org/10.1093/biolinnean/bly061.
Strömberg, C. A. (2011). Evolution of grasses and grassland ecosys-tems. Annual Review of Earth and Planetary Sciences, 39, 517–544. https://doi.org/10.1146/annurev-earth-040809-152402
Swenson, U., Hill, R. S., & McLoughlin, S. (2001). Biogeography of Nothofagus supports the sequence of Gondwana breakup. Taxon, 50, 1025–1041. https://doi.org/10.2307/1224719
Talavera, G., & Castresana, J. (2007). Improvement of phylogenies after removing divergent and ambiguously aligned blocks from protein sequence alignments . Systematic Biology, 56, 564–577. https://doi.org/10.1080/10635150701472164
Trunz, V., Packer, L., Vieu, J., Arrigo, N., & Praz, C. J. (2016). Comprehensive phylogeny, biogeography and new classification of the diverse bee tribe Megachilini: Can we use DNA barcodes in phy-logenies of large genera? Molecular Phylogenetics and Evolution, 103, 245–259. https://doi.org/10.1016/j.ympev.2016.07.004
Turchetto‐Zolet, A. C., Pinheiro, F., Salgueiro, F., & Palma‐Silva, C. (2013). Phylogeographical patterns shed light on evolutionary pro-cess in South America. Molecular Ecology, 22, 1193–1213. https://doi.org/10.1111/mec.12164
Ulloa Ulloa, C., Acevedo‐Rodriguez, P., Beck, S., Belgrano, M. J., Bernal, R., Berry, P. E., … Jørgensen, P. M. (2017). An integrated assessment of the vascular plant species of the Americas. Science, 358, 1614–1617. https://doi.org/10.1126/science.aao0398
Vaidya, G., Lohman, D. J., & Meier, R. (2011). SequenceMatrix: Concatenation software for the fast assembly of multi‐gene datasets with character set and codon information. Cladistics, 27, 171–180. https://doi.org/10.1111/j.1096-0031.2010.00329.x
Wcislo, W. T., & Cane, J. H. (1996). Floral resource utilization by sol-itary bees (Hymenoptera: Apoidea) and exploitation of their stored foods by natural enemies. Annual Review of Entomology, 41, 257–286. https://doi.org/10.1146/annurev.en.41.010196.001353
SUPPORTING INFORMATION
Additional supporting information may be found online in the Supporting Information section at the end of the article.
How to cite this article: Almeida EAB, Packer L, Melo GAR, et al. The diversification of neopasiphaeine bees during the Cenozoic (Hymenoptera: Colletidae). Zool Scr. 2019;48:226–242. https://doi.org/10.1111/zsc.12333


![Neotropical cervidology_12[1]](https://img.pdfslide.us/doc/110x75/547f4ab5b37959a22b8b56e0/neotropical-cervidology121.jpg)