Embed Size (px)
Citation preview
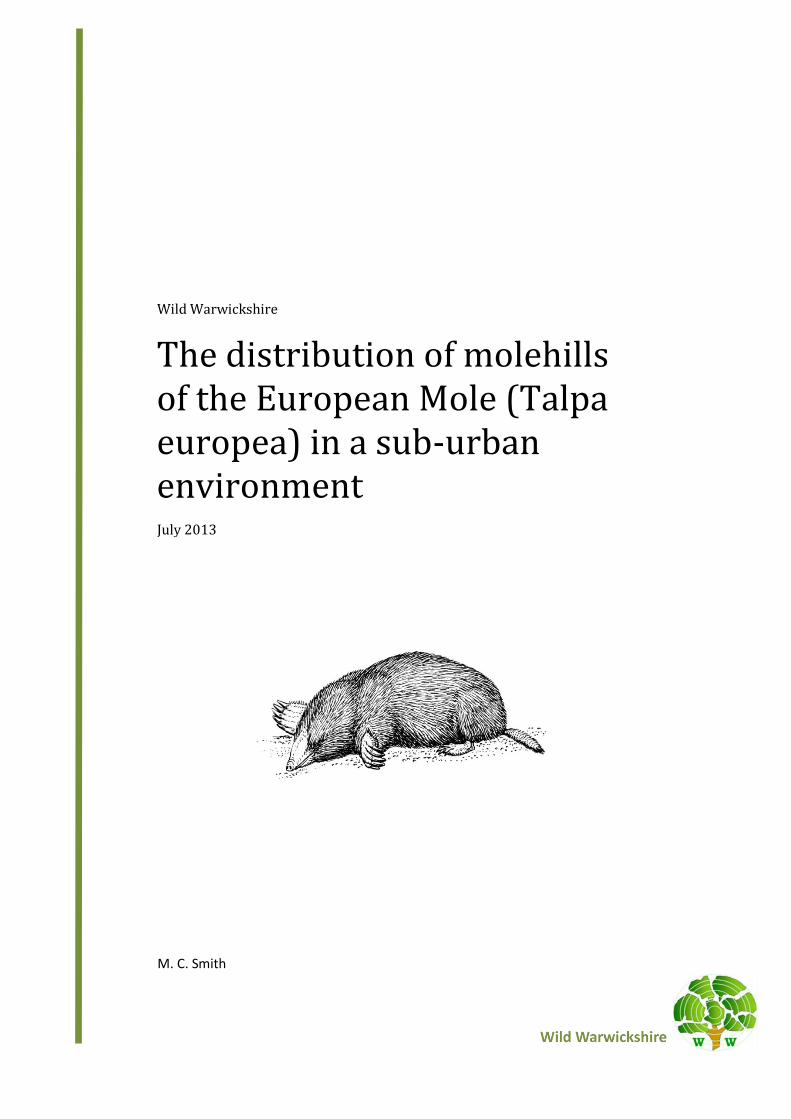
Wild Warwickshire
The distribution of molehills of the European Mole (Talpa europea) in a sub-urban environment July 2013
M. C. Smith
The Distribution of mole hills of the European Mole (Talpa europea) in
a Sub-Urban environment.
By M. Smith
Summary In the late winter of 2012-2013 every molehill within the sub-urban boundary of Warwick were identified and mapped with GPS. Four populations of moles were identified within this survey area with an estimated 107 individual moles. Each population is linked to an outside rural population indicating a species that is sustained from the outside. Examination of the distribution of these molehills indicated a strong preference for open grassland interspersed with trees that have low impact management such as mowing only.
Introduction The European Mole (Talpa europea) is one of nine species of Talpinae moles present in the Western
Palaearctic (Gorman and Stone, 1990; Harris and Yalden, 2008). It is the only species endemic to
Great Britain with records of their presence going back to the Cromerian period (780,000 -400,000
years ago) in the fossil record (Harris and Yalden, 2008).
Despite there being an estimated 31 million moles in the country (Harris et al, 1995; Harris and
Yalden, 2008) they are rarely seen due to their subterranean lifestyle (Stone, 1986). Their presence,
however, is easy to note due to their production of molehills.
The aims of this study are to identify all molehills in the town of Warwick, assess the spread of the
species and analyse their relationship to the local urban and sub-urban habitats.
Molehills
Molehills are created from spoil excavated from deep tunnels. Moles produce two other types of
tunnel, shallow and surface. In both cases the soil is pushed up or compressed meaning there is no
excess soil to form a hill (Stone, 1986).
The tunnels are used as foraging territory. They are regularly patrolled for Earthworms the Moles
primary prey and other invertebrates (Stone, 1986; Gorman et al, 1990; Stone, 1992 and Harris and
Yalden, 2008). Tunnels are often branched and lead to chambers in which a nest for breeding is built
(Stone, 1986 and Harris and Yalden, 2008). Most tunnel networks start with a 15m run in a straight
line before the run branches out (Edwards et al, 1999).
In established territories Molehills tend to appear during extension and repair of existing tunnels
(Gorman and Stone, 1990). The average molehill covers 0.14 square metres (Edwards et al, 1999).
Some molehills can be considerable larger containing up to 50 kg of soil and are termed Fortresses
(Gorman et al, 1990)
Habitat Selection
The European Mole was originally a species of deciduous woodland but quickly colonised pasture
and arable land. Today it can also be found in coniferous woods, verges, moors, meadows gardens
and stable dunes (Stone, 1986 and Funilayo, 1977).
Several studies have linked mole distribution to invertebrate density, with a greater density where
earthworms were abundant (Funilayo, 1977 and Zurawska-seta et al, 2012). Studies by Zurawska-
seta and Barczak (2012) on a Polish population indicated a variety of interactions between field and
margin invertebrates. They showed that farmland tended to be less stable for populations than
grassland and pasture, with field margins acting as a refuge from harvesting and ploughing activities
Zurawska-seta et al, 2012. The Polish population also indicated the species preference for mixed
forests and wide roads with verges (Zurawska-seta et al, 2012).
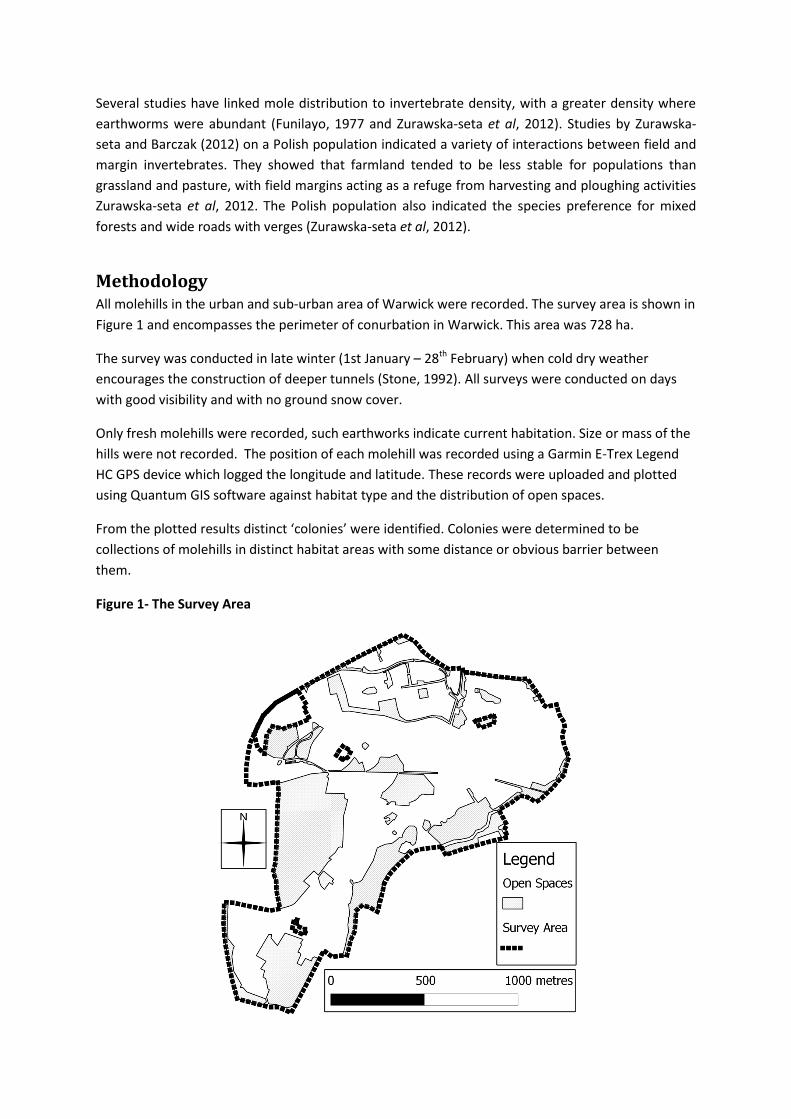
Methodology All molehills in the urban and sub-urban area of Warwick were recorded. The survey area is shown in
Figure 1 and encompasses the perimeter of conurbation in Warwick. This area was 728 ha.
The survey was conducted in late winter (1st January – 28th February) when cold dry weather
encourages the construction of deeper tunnels (Stone, 1992). All surveys were conducted on days
with good visibility and with no ground snow cover.
Only fresh molehills were recorded, such earthworks indicate current habitation. Size or mass of the
hills were not recorded. The position of each molehill was recorded using a Garmin E-Trex Legend
HC GPS device which logged the longitude and latitude. These records were uploaded and plotted
using Quantum GIS software against habitat type and the distribution of open spaces.
From the plotted results distinct ‘colonies’ were identified. Colonies were determined to be
collections of molehills in distinct habitat areas with some distance or obvious barrier between
them.
Figure 1- The Survey Area

Assessing Colonies
Tunnel systems are the functional units of a moles habitat and represent elements of a territory that
could be home to one or more moles. To assess the structure of burrows and hills each colonies
structure was analysed to identify a range of structural elements. The descriptions of these elements
can be seen in figure 2.
Figure 2 – Definitions of Structural Elements
Element Definition Diagrammatic Example
Run Straight row of hills illustrating a tunnel
line (can be straight or curvilinear)
Cluster Group of hills in close proximity indicates
possible nest areas or deeper tunnels
Network System of two or more connected runs
Intersection A point at which two runs cross
Outlier Single hill in isolation from others
Figure 3 – Habitat Classification
Habitat Category Description
Amenity Grassland Short turf managed grassland i.e. Playing Fields and Golf courses.
Deciduous Plantation Deciduous trees planted in regular rows. Managed.
Parkland Short turf managed grassland interspersed with mixed trees randomly spaced.
Scrub/Shrub Mixture of bramble, nettles and ephemeral shrub cover.
Semi-Improved Grassland Mixture of grasses and flowering plants. Can be managed or unmanaged.
Semi-Natural Woodland Mixed woodland.
Semi-Urban Built up area with gardens and green spaces.
Urban Built up area with little or no green spaces.
Verge Similar to Parkland. Managed grassland with assorted trees alongside a linear element such as a road.
Assessing Habitats
A simple assessment of the habitat type within the survey area was made according to a set of
categories as shown in Figure 3. These broad habitat types were taken to investigate the preference
of moles for different habitats.
Electivity
Ivlev (1961) developed a formula for assessing a species preference for a particular food source. This
electivity to food is just as applicable to other niche resources such as habitat. Ivlev’s original
formula has some inherent biases and so in analysing the electivity of moles for habitat Manly’s
Standardised Selection Ratio is shown (Manly et al, 2002). This revised index is Bi =
where,
equals the proportion of the sample of used resource units that are in category i divided by the
proportion of available resource units that are in category i.
For this study the number of molehills per habitat type was recorded and their respective electivity
scores calculated.
Results
Plotting the molehills and identifying colonies
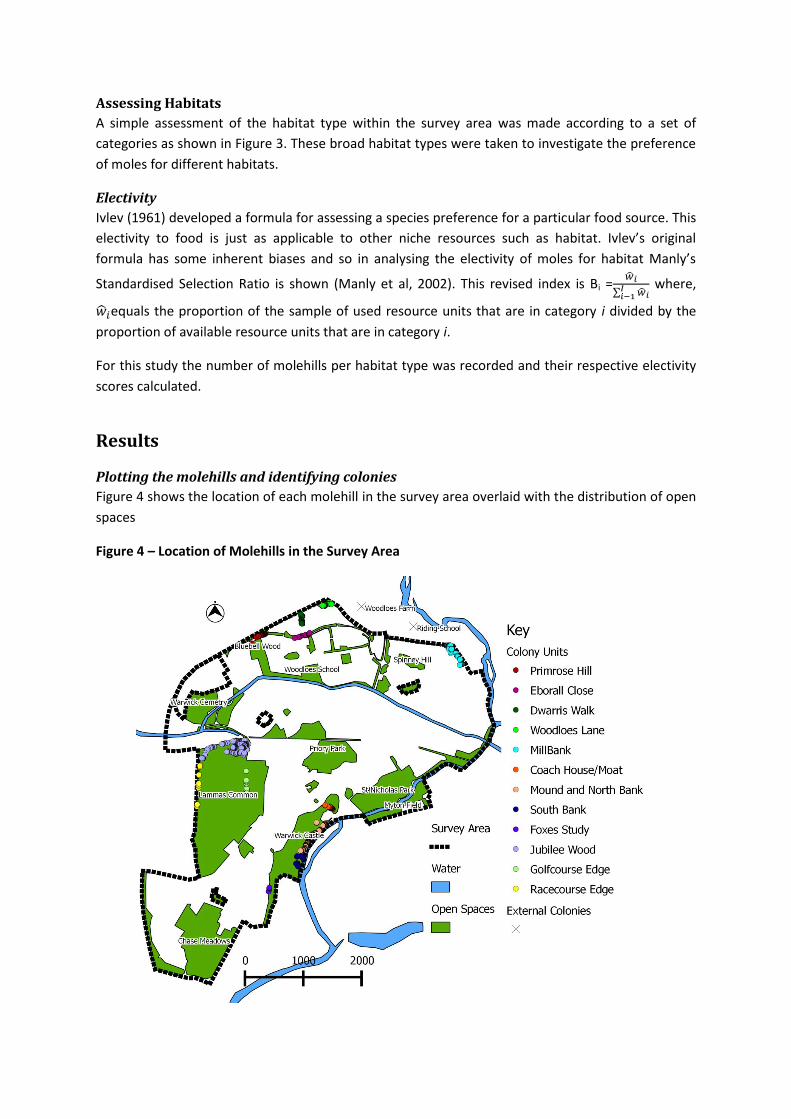
Figure 4 shows the location of each molehill in the survey area overlaid with the distribution of open
spaces
Figure 4 – Location of Molehills in the Survey Area
Fifteen colonies were identified within the survey area. Some of these colonies were more distinct
than others and two have been dropped from the further analysis. Two molehills were found west of
Millbank along a footpath on the edge of the survey area and the town’s boundary. It was decided
that these were in fact outliers of a major population outside of the survey area. Likewise a small
number (10) of extremely isolated hills along the river Avon at Emscote is thought to be an outlier of
populations over the river outside the survey area. Details of the separate colony units are shown in
figure 5.
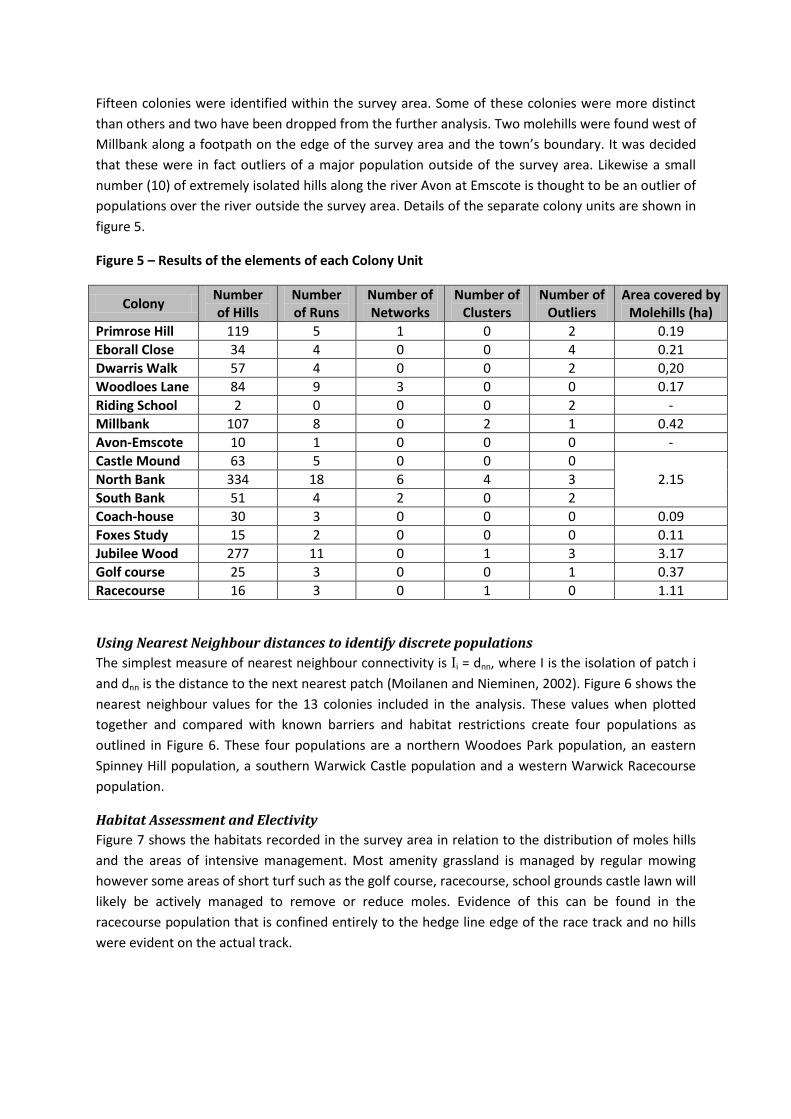
Figure 5 – Results of the elements of each Colony Unit
Colony Number of Hills
Number of Runs
Number of Networks
Number of Clusters
Number of Outliers
Area covered by Molehills (ha)
Primrose Hill 119 5 1 0 2 0.19
Eborall Close 34 4 0 0 4 0.21
Dwarris Walk 57 4 0 0 2 0,20
Woodloes Lane 84 9 3 0 0 0.17
Riding School 2 0 0 0 2 -
Millbank 107 8 0 2 1 0.42
Avon-Emscote 10 1 0 0 0 -
Castle Mound 63 5 0 0 0
2.15 North Bank 334 18 6 4 3
South Bank 51 4 2 0 2
Coach-house 30 3 0 0 0 0.09
Foxes Study 15 2 0 0 0 0.11
Jubilee Wood 277 11 0 1 3 3.17
Golf course 25 3 0 0 1 0.37
Racecourse 16 3 0 1 0 1.11
Using Nearest Neighbour distances to identify discrete populations
The simplest measure of nearest neighbour connectivity is Ii = dnn, where I is the isolation of patch i
and dnn is the distance to the next nearest patch (Moilanen and Nieminen, 2002). Figure 6 shows the
nearest neighbour values for the 13 colonies included in the analysis. These values when plotted
together and compared with known barriers and habitat restrictions create four populations as
outlined in Figure 6. These four populations are a northern Woodoes Park population, an eastern
Spinney Hill population, a southern Warwick Castle population and a western Warwick Racecourse
population.
Habitat Assessment and Electivity
Figure 7 shows the habitats recorded in the survey area in relation to the distribution of moles hills
and the areas of intensive management. Most amenity grassland is managed by regular mowing
however some areas of short turf such as the golf course, racecourse, school grounds castle lawn will
likely be actively managed to remove or reduce moles. Evidence of this can be found in the
racecourse population that is confined entirely to the hedge line edge of the race track and no hills
were evident on the actual track.
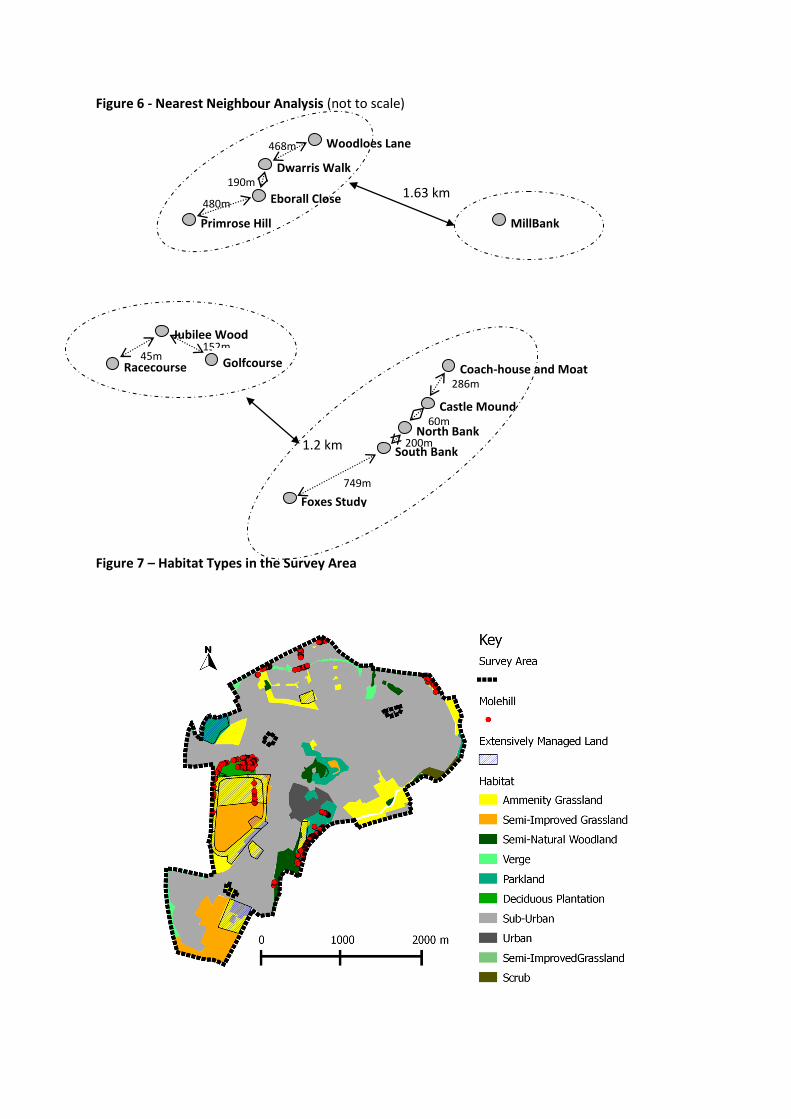
Figure 6 - Nearest Neighbour Analysis (not to scale)
Figure 7 – Habitat Types in the Survey Area
Foxes Study
Dwarris Walk
Eborall Close
468m Primrose Hill
Racecourse
Jubilee Wood
South Bank
North Bank
Castle Mound
468m
Coach-house and Moat
MillBank
468m
190m
480m
45m 152m
286m
60m
200m
749m
Woodloes Lane
Golfcourse
1.63 km
1.2 km
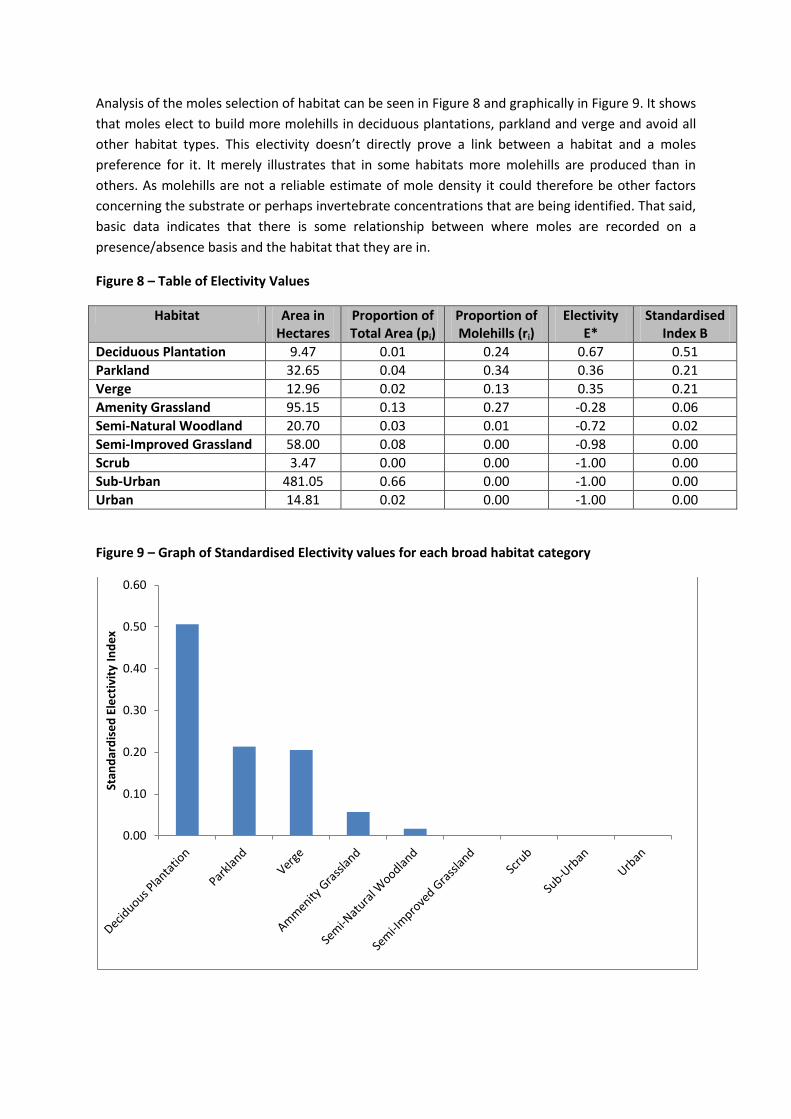
Analysis of the moles selection of habitat can be seen in Figure 8 and graphically in Figure 9. It shows
that moles elect to build more molehills in deciduous plantations, parkland and verge and avoid all
other habitat types. This electivity doesn’t directly prove a link between a habitat and a moles
preference for it. It merely illustrates that in some habitats more molehills are produced than in
others. As molehills are not a reliable estimate of mole density it could therefore be other factors
concerning the substrate or perhaps invertebrate concentrations that are being identified. That said,
basic data indicates that there is some relationship between where moles are recorded on a
presence/absence basis and the habitat that they are in.
Figure 8 – Table of Electivity Values
Habitat Area in Hectares
Proportion of Total Area (pi)
Proportion of Molehills (ri)
Electivity E*
Standardised Index B
Deciduous Plantation 9.47 0.01 0.24 0.67 0.51
Parkland 32.65 0.04 0.34 0.36 0.21
Verge 12.96 0.02 0.13 0.35 0.21
Amenity Grassland 95.15 0.13 0.27 -0.28 0.06
Semi-Natural Woodland 20.70 0.03 0.01 -0.72 0.02
Semi-Improved Grassland 58.00 0.08 0.00 -0.98 0.00
Scrub 3.47 0.00 0.00 -1.00 0.00
Sub-Urban 481.05 0.66 0.00 -1.00 0.00
Urban 14.81 0.02 0.00 -1.00 0.00
Figure 9 – Graph of Standardised Electivity values for each broad habitat category
0.00
0.10
0.20
0.30
0.40
0.50
0.60
Stan
dar
dis
ed
Ele
ctiv
ity
Ind
ex
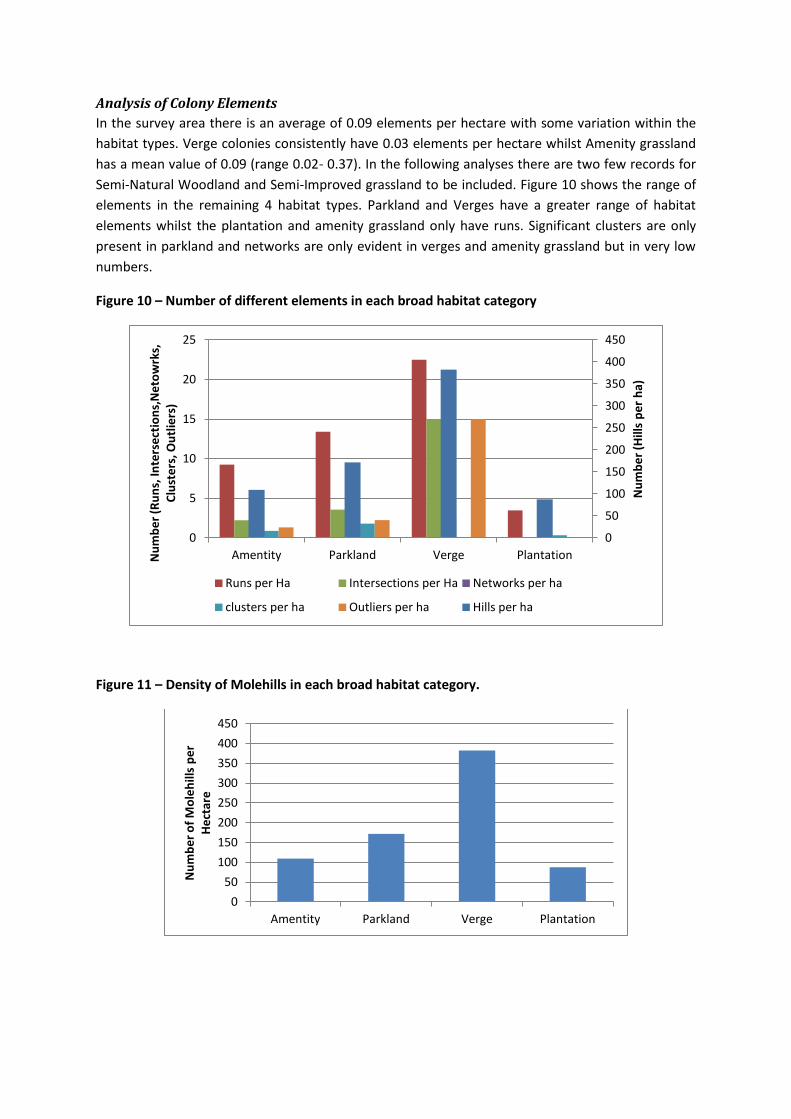
Analysis of Colony Elements
In the survey area there is an average of 0.09 elements per hectare with some variation within the
habitat types. Verge colonies consistently have 0.03 elements per hectare whilst Amenity grassland
has a mean value of 0.09 (range 0.02- 0.37). In the following analyses there are two few records for
Semi-Natural Woodland and Semi-Improved grassland to be included. Figure 10 shows the range of
elements in the remaining 4 habitat types. Parkland and Verges have a greater range of habitat
elements whilst the plantation and amenity grassland only have runs. Significant clusters are only
present in parkland and networks are only evident in verges and amenity grassland but in very low
numbers.
Figure 10 – Number of different elements in each broad habitat category
Figure 11 – Density of Molehills in each broad habitat category.
0
50
100
150
200
250
300
350
400
450
0
5
10
15
20
25
Amentity Parkland Verge Plantation
Nu
mb
er
(Hill
s p
er
ha)
Nu
mb
er
(Ru
ns,
Inte
rse
ctio
ns,
Ne
tow
rks,
C
lust
ers
, Ou
tlie
rs)
Runs per Ha Intersections per Ha Networks per ha
clusters per ha Outliers per ha Hills per ha
0
50
100
150
200
250
300
350
400
450
Amentity Parkland Verge Plantation
Nu
mb
er
of
Mo
leh
ills
pe
r H
ect
are
Hills
Figure 11 illustrates that Verge habitats have the greatest density of molehills with the other
habitats having similar densities.
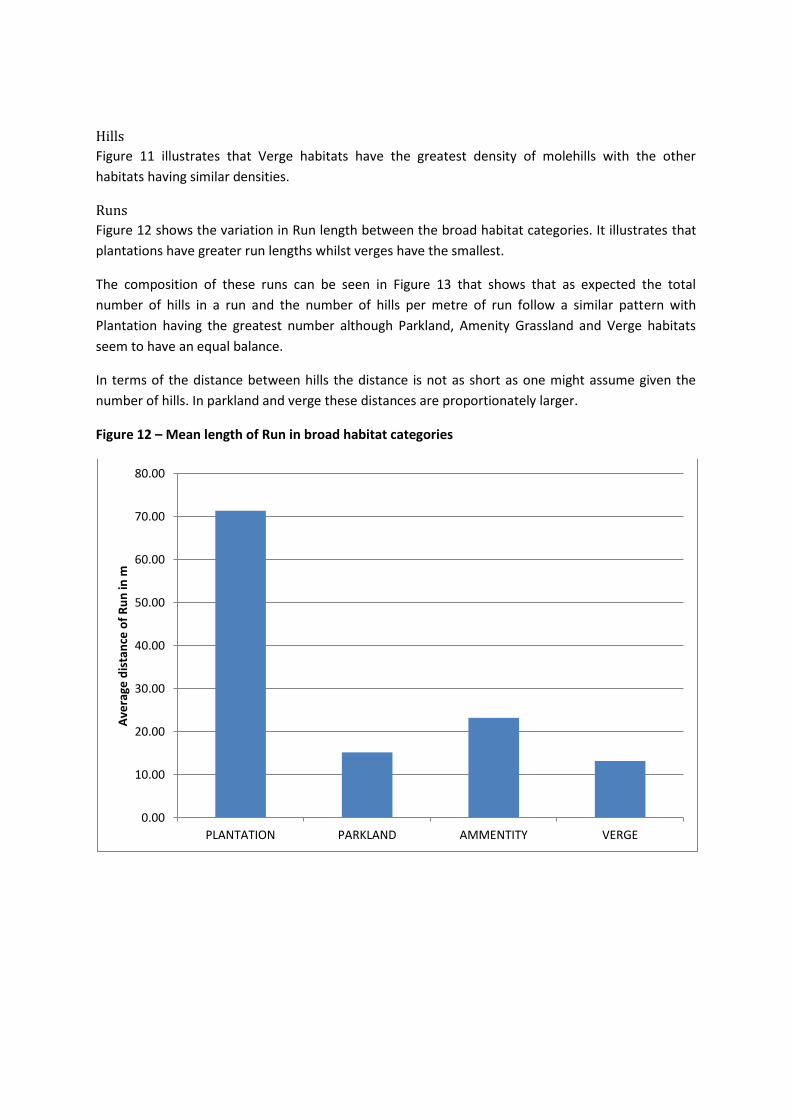
Runs
Figure 12 shows the variation in Run length between the broad habitat categories. It illustrates that
plantations have greater run lengths whilst verges have the smallest.
The composition of these runs can be seen in Figure 13 that shows that as expected the total
number of hills in a run and the number of hills per metre of run follow a similar pattern with
Plantation having the greatest number although Parkland, Amenity Grassland and Verge habitats
seem to have an equal balance.
In terms of the distance between hills the distance is not as short as one might assume given the
number of hills. In parkland and verge these distances are proportionately larger.
Figure 12 – Mean length of Run in broad habitat categories
0.00
10.00
20.00
30.00
40.00
50.00
60.00
70.00
80.00
PLANTATION PARKLAND AMMENTITY VERGE
Ave
rage
dis
tan
ce o
f R
un
in m
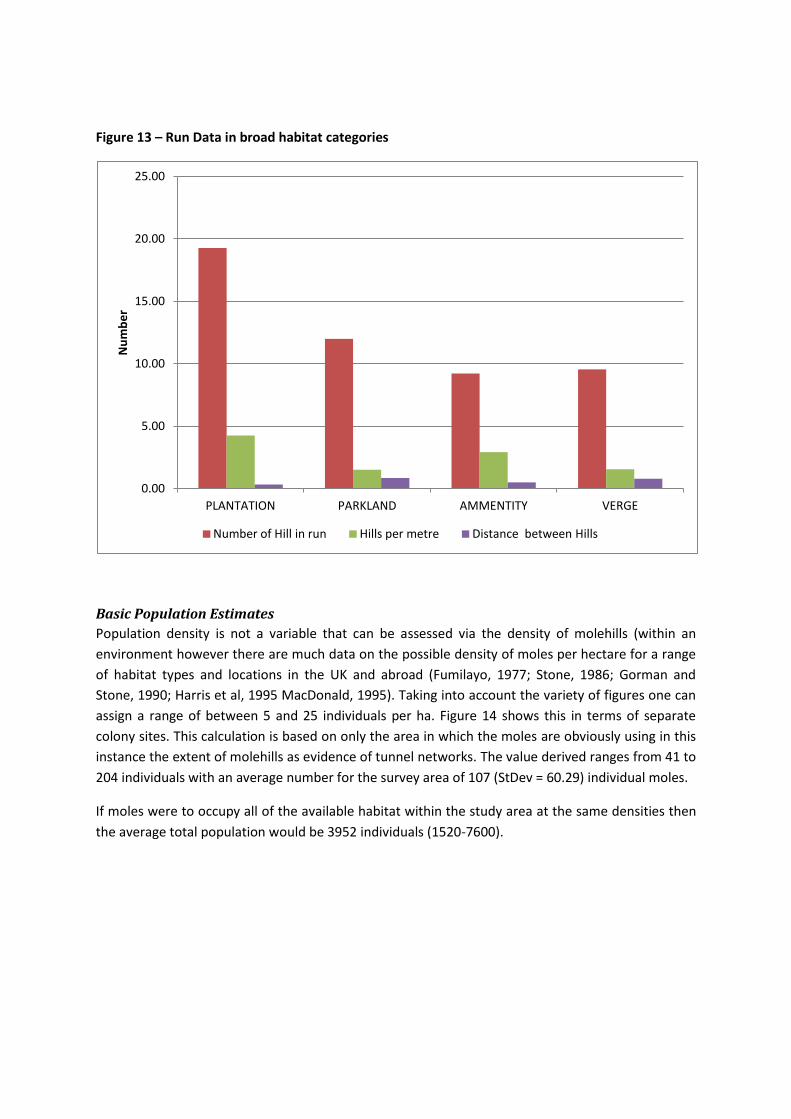
Figure 13 – Run Data in broad habitat categories
Basic Population Estimates
Population density is not a variable that can be assessed via the density of molehills (within an
environment however there are much data on the possible density of moles per hectare for a range
of habitat types and locations in the UK and abroad (Fumilayo, 1977; Stone, 1986; Gorman and
Stone, 1990; Harris et al, 1995 MacDonald, 1995). Taking into account the variety of figures one can
assign a range of between 5 and 25 individuals per ha. Figure 14 shows this in terms of separate
colony sites. This calculation is based on only the area in which the moles are obviously using in this
instance the extent of molehills as evidence of tunnel networks. The value derived ranges from 41 to
204 individuals with an average number for the survey area of 107 (StDev = 60.29) individual moles.
If moles were to occupy all of the available habitat within the study area at the same densities then
the average total population would be 3952 individuals (1520-7600).
0.00
5.00
10.00
15.00
20.00
25.00
PLANTATION PARKLAND AMMENTITY VERGE
Nu
mb
er
Number of Hill in run Hills per metre Distance between Hills
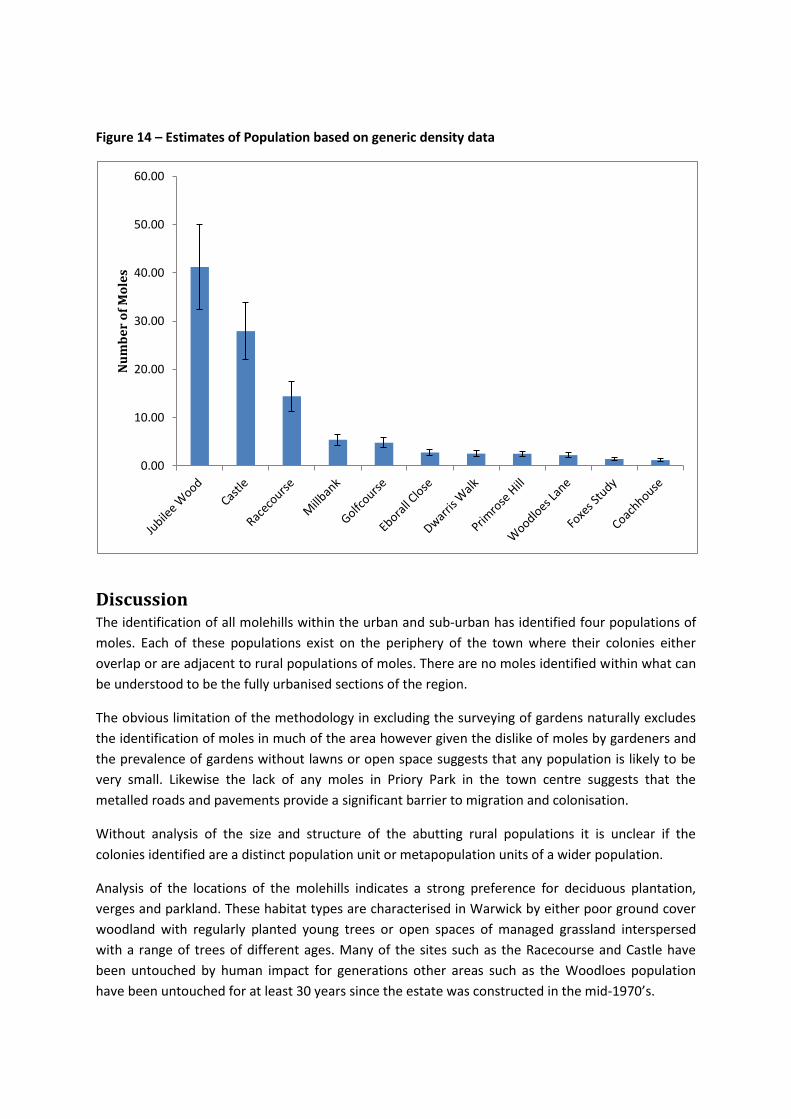
Figure 14 – Estimates of Population based on generic density data
Discussion The identification of all molehills within the urban and sub-urban has identified four populations of
moles. Each of these populations exist on the periphery of the town where their colonies either
overlap or are adjacent to rural populations of moles. There are no moles identified within what can
be understood to be the fully urbanised sections of the region.
The obvious limitation of the methodology in excluding the surveying of gardens naturally excludes
the identification of moles in much of the area however given the dislike of moles by gardeners and
the prevalence of gardens without lawns or open space suggests that any population is likely to be
very small. Likewise the lack of any moles in Priory Park in the town centre suggests that the
metalled roads and pavements provide a significant barrier to migration and colonisation.
Without analysis of the size and structure of the abutting rural populations it is unclear if the
colonies identified are a distinct population unit or metapopulation units of a wider population.
Analysis of the locations of the molehills indicates a strong preference for deciduous plantation,
verges and parkland. These habitat types are characterised in Warwick by either poor ground cover
woodland with regularly planted young trees or open spaces of managed grassland interspersed
with a range of trees of different ages. Many of the sites such as the Racecourse and Castle have
been untouched by human impact for generations other areas such as the Woodloes population
have been untouched for at least 30 years since the estate was constructed in the mid-1970’s.
0.00
10.00
20.00
30.00
40.00
50.00
60.00
Nu
mb
er
of
Mo
les
The impact of disturbance can be seen most clearly in the Castle population. Here the molehills are
restricted to the steep bank sides along the river and upon the mound. No mounds are found on the
main lawn where it is likely that gardening and active management occurs. Likewise moles on the
Racecourse are confined to the hedge line rather than the actual track or the greens of the golf
course. This is not to say that the verges and parkland are not managed at all but in these cases
management is restricted to periodic mowing that only affects the structure of the colony at the
level that some hills are flattened and it is possible that some tunnels collapse or are filled up.
Using aggregated density values we can broadly estimate a current population of 107 moles within
the survey area with a capacity availability of 4000 individuals. The fact that more of the suitable
habitat is not used, and it is unrealistic to expect the total capacity to be reached, suggests either
that the suitable habitat is deficient in food, that expansion occurs outwardly from the survey area
into the rural matrix or that some other population constraint is in action. As molehills are not a long
term structure and reflect seasonal movements and expansions to tunnel networks future repeats of
this study would enable us to begin to explore whether the populations in Warwick are static or
whether they are more fluid with individuals or colonies moving around within a suitable habitat
over time.
The structure of the colonies shows some variation depending on habitat type. The plantation
population has the greatest number of molehills per meter of run which are closer together
indicating greater excavation below ground. This is perhaps due to the quantity of roots that moles
must navigate round or perhaps the scarcity of food available therefore requiring more foraging
territory. The longest runs also occur in the plantation and tend to follow the rows of the trees
where the roots will be the lightest. Elsewhere in the region trees encountered are usually solitary or
in small groups. Here runs tend to be more curvilinear bending around trees or forming clusters
around the base. The largest numbers of hills are found on verges where the structure of the open
linear grassland promotes long uninterrupted runs.
Having now identified some interesting features of the mole populations in Warwick more can only
be learned from future study. Repeated analysis of some of the populations might be able to assess
how the arrangement of hills alters from year to year and give evidence of temperature effects over
seasons. Analysis of each habitats invertebrate soil fauna would also help look at the relative value
of each area to a population of moles.
References
Edwards, G.R; Crawley, M.J and Heard, M.S. (1999). Factors influencing molehill distribution in
grassland: implications for controlling the damage caused by molehills. Journal of Applied Ecology.
36 pp434-442.
Funmilayo, O. (1977) Distribution and abundance of Moles (Talpa europaea L.) in relation to physical
habitat and food supply. Oecologica (Berl.) 30 pp277-283
Gorman, M.L and Stone, R.D. (1990) The Natural History of Moles. Christopher Helm. London.
Harris, S; Morris, P; Wray, S and Yalden, D. (1995). A review of British Mammals: population
estimates and conservation status of British Mammals other than cetaceans. JNCC.
Harris, S and Yalden, D.W. ed. (2008) Mammals of the British Isles. 4th Edition. The Mammal Society.
Ivlev, V. (1961). Experimental ecology of feeding fishes. Yale University Press. New Haven.
Conneticut.
MacDonald, D ed. (1995). The Encyclopaedia of Mammals. Andromeda Oxford Ltd.
Manly, B; MacDonald, L; Thomas, D; MacDonald, T and Erickson, W. (2002) Resource selection by
animals. Statistical design and analysis for field studies. 2nd Edition.
Stone, R.D. (1986). Moles. The Mammal Society.
Stone, R.D. (1992). The Mole. Shire Natural History No.61
Zurawska-Seta, E and Barczak, T (2012). The influence of field margins on the presence and spatial
distribution of the European Mole (Talpa europaea L.) within the agricultural landscape of Northern
Poland. Arch.Biol.Sci, Belgrade, 63 (3) pp971-980