Embed Size (px)
Citation preview

The Direct Costs of A-REIT IPOs
Bill Dimovski
Deakin University Australia

IPO Equity Capital Raising
From 1994 to 2013 over A$15 billion was raised by A-REIT IPOs.
This is around the same as the IPO capital raised by the resources sector.
Also about one third of that raised by all industrial IPOs over this same time period.

Costs of Capital Raising
Direct costs – underwriting, legal, accounting, valuation, listing, printing, distribution, advertising costs
Indirect costs – underpricing (and management time)

Underpricing Costs - Industrial & Mining Company IPOs United States Ibbotson, Sindelar and Ritter 1960-2014 study shows average underpricing of 16.9% Australia Lee, Taylor and Walter, Dimovski and Brooks 1976 - 2004 - around 22% Other Countries Turkey – 9.7%, UK – 16% , Finland 16.9%, Greece – 50.8%, Japan – 41.7%, Italy – 15.2%, Germany – 24.2%, China – 118% Saudi Arabia – 239.8%

Underpricing and REIT IPOs United States Wang, Chan and Gau (1992) 1971-88 negative 2.82% underpricing (loss) Ling and Ryngaert (1997) 1991-94, 3.6% underpricing Bairagi and Dimovski (2011) 1996-2010, 3.18% underpricing
Europe Brounen and Eichholtz (2001) investigate 83 European property share IPOs
during 1990 to 2000. They find a first day return of 3.43 %. Sahi and Lee (2001) 48 UK property investment companies – 1986-1995 –
4%
Australia Dimovski and Brooks (2006b) 58 LPT IPOs report ave 2.6% return
Japanese REITs 2001 to 2006 ave. 0.51% return
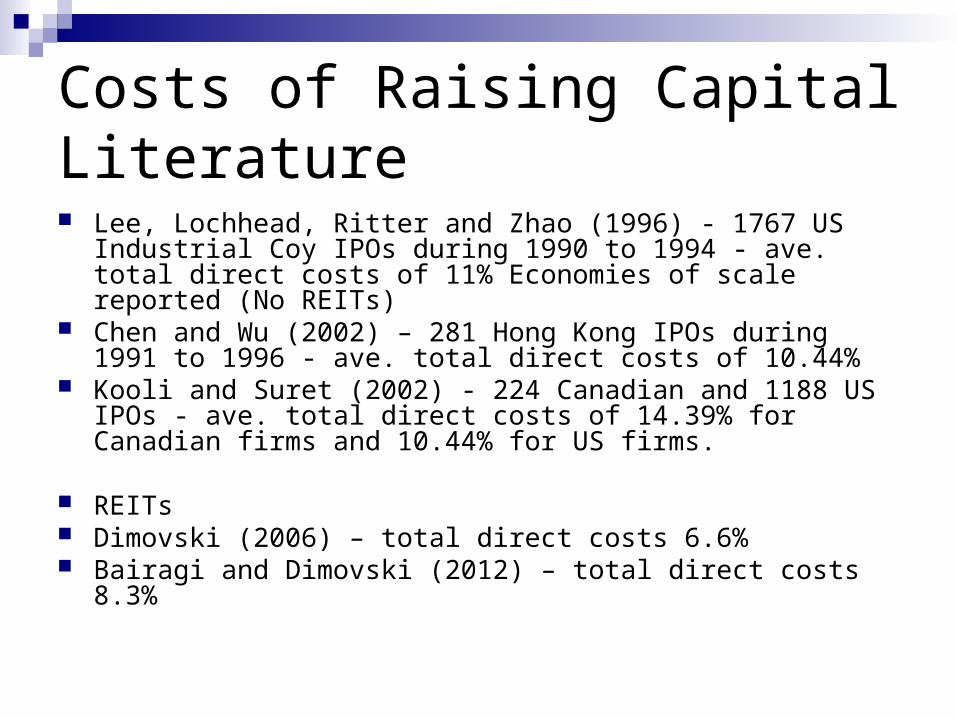
Costs of Raising Capital Literature Lee, Lochhead, Ritter and Zhao (1996) - 1767 US Industrial Coy
IPOs during 1990 to 1994 - ave. total direct costs of 11% Economies of scale reported (No REITs)
Chen and Wu (2002) – 281 Hong Kong IPOs during 1991 to 1996 - ave. total direct costs of 10.44%
Kooli and Suret (2002) - 224 Canadian and 1188 US IPOs - ave. total direct costs of 14.39% for Canadian firms and 10.44% for US firms.
REITs Dimovski (2006) – total direct costs 6.6% Bairagi and Dimovski (2012) – total direct costs 8.3%

Underwriting Cost Literature
Chen and Ritter (2000) - US IPOs US$20m -$80m have underwriter fees cluster at 7%.
Butler and Hwang (2003) – HK IPOs uwriter fees cluster at 2.5% Torstila (2001) – European IPOs uwriter fees cluster at 3.75% (tech IPOs at
6%) How and Yeo (2000) – Australian industrial coy IPOs uwriter fees ave.
3.68% but range from 1% to 8%.
REITs Japanese REITs average 3.74%. US REITs – Chen and Lu (2006) - 6.6%, Bairagi and Dimovski (2012) –
6.5% Aust REITs – 3.3% - companies don’t have to use underwriters to list; they
can simply use stockbrokers to market the issue.

Why investigate the direct costs of A-REIT IPOs? The average underwritten IPO raised around
$221m (Not underwritten n=14 – $44M) The average total direct costs for underwritten
were around 5.88% (not underwritten 8.19%) The average underwriting costs 3.2%
(stockbroker costs 4.1%) Since these costs are substantial costs to A-
REIT IPO issuers it is important to try to identify factors that influence these costs.

Panel A: Underwritten IPOs N Mean SD Min Max
PERCTOTCOST (%) 73 5.881 2.549 1.620 12.060
UWRITPERC (%) 73 3.188 1.278 0.916 6.400
PROCEEDS (A$MILL) 73 221,831 272,090 5,940 2,000,000
LNPROCEEDS 73 11.845 1.003 8.689 14.509
STAPLED 73 0.219 0.417 0 1
RETAIL 73 0.205 0.407 0 1
OFFICE 73 0.260 0.442 0 1
ACCOUNTANT 73 0.877 0.331 0 1
INSTITUT 73 0.452 0.501 0 1
DIVYLD (%) 71 8.946 1.196 0.050 12.040
NAISSPRI 73 0.951 0.110 0.830 1.100
DEBTTOEQ 72 0.467 0.081 0.200 0.650
ISSUE9499 73 0.452 0.501 0 1
ISSUE2010ON 73 0.068 0.254 0 1

Panel B: Stockbroker (not Underwritten) IPOs N Mean SD Min Max
PERCTOTCOST (%) 14 8.193 4.469 3.610 16.710
STOCKPERC (%) 14 4.100 0.801 3.000 5.000
PROCEEDS (A$MILL) 14 44,097 57,033 3,000 225,000
LNPROCEEDS 14 10.161 1.094 8.006 12.324
STAPLED 14 0.071 0.267 0 1
RETAIL 14 0.071 0.267 0 1
OFFICE 14 0.071 0.267 0 1
ACCOUNTANT 14 0.050 0.030 0 1
INSTITUT 14 0.571 0.514 0 1
DIVYLD (%) 13 8.176 2.683 0.000 11.100
NAISSPRI 14 0.947 0.038 0.870 1.02
DEBTTOEQ 13 0.453 0.082 0.270 0.570
ISSUE9499 14 0.286 0.469 0 1
ISSUE2010ON 14 0.071 0.267 0 1

Data
Direct costs data is derived from the prospectuses in Connect 4 Prospectuses and DatAnalysis databases.
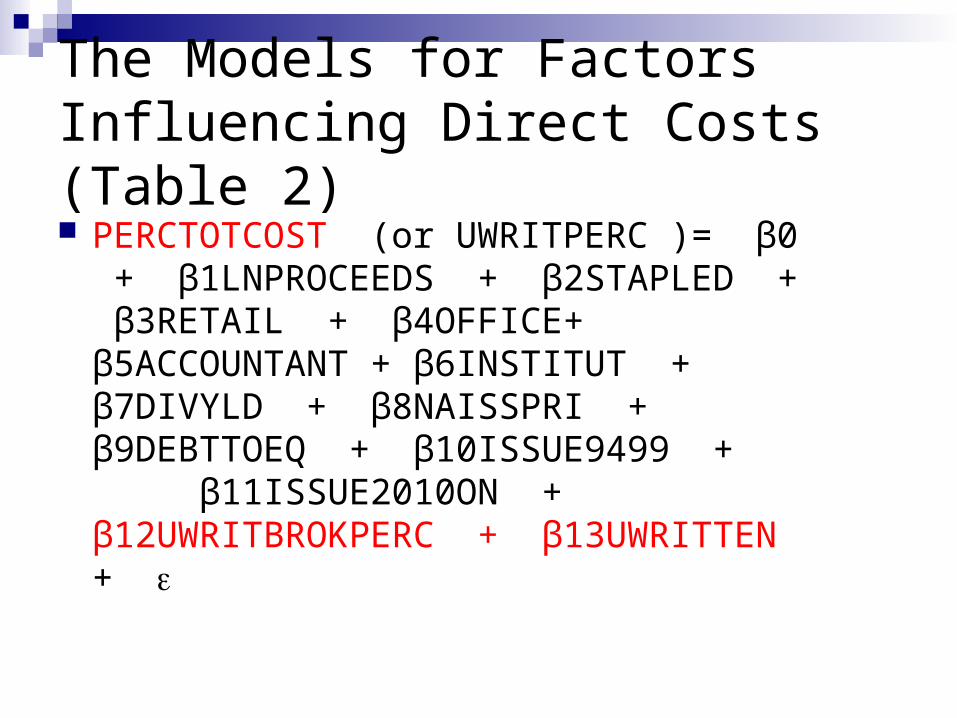
The Models for Factors Influencing Direct Costs (Table 2) PERCTOTCOST (or UWRITPERC )= β0
+ β1LNPROCEEDS + β2STAPLED + β3RETAIL + β4OFFICE+ β5ACCOUNTANT + β6INSTITUT + β7DIVYLD + β8NAISSPRI + β9DEBTTOEQ + β10ISSUE9499 + β11ISSUE2010ON + β12UWRITBROKPERC + β13UWRITTEN +
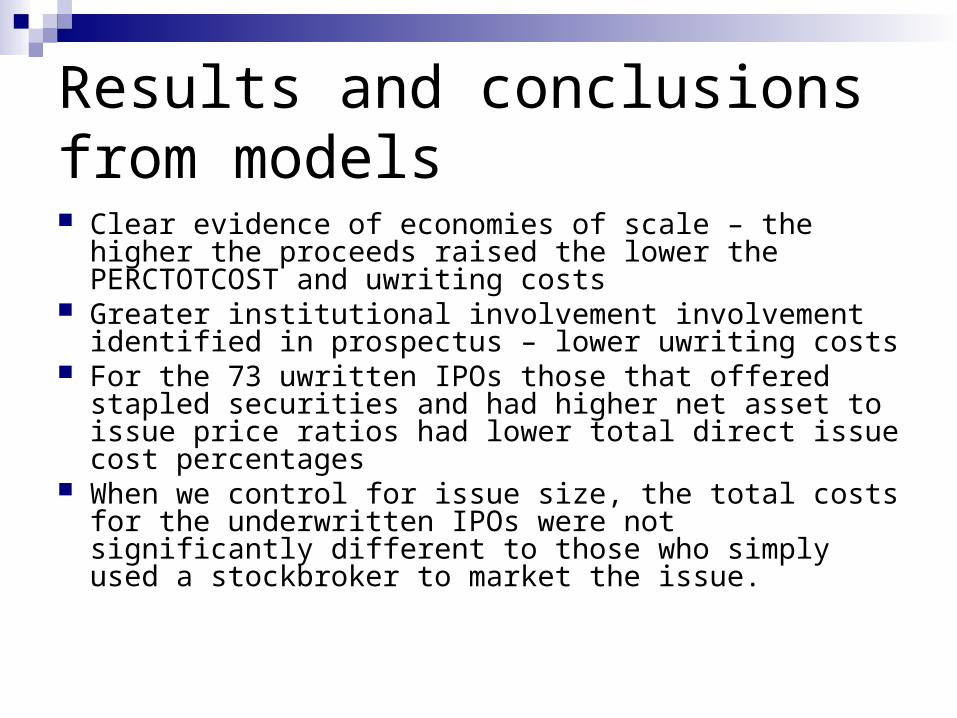
Results and conclusions from models Clear evidence of economies of scale – the higher the
proceeds raised the lower the PERCTOTCOST and uwriting costs
Greater institutional involvement involvement identified in prospectus – lower uwriting costs
For the 73 uwritten IPOs those that offered stapled securities and had higher net asset to issue price ratios had lower total direct issue cost percentages
When we control for issue size, the total costs for the underwritten IPOs were not significantly different to those who simply used a stockbroker to market the issue.