Embed Size (px)
Citation preview
THE DEVELOPMENT OF SOLAR IRRADIATION LEVELLING SYSTEM USING COLOUR CONTOUR APPROACH
FAEZAH BINTI ABD.HADI
A project report submitted in partial fulfillment of the requirement for the award of the Degree of Master of Electrical Engineering
Faculty of Electrical and Electronic Engineering
Universiti Tun Hussein Onn Malaysia
JULY 2012

v
ABSTRACT
This project presents the development of solar irradiance levelling spectrum
using colour contour approach. The system developed by using the General User
Interface (GUI) Matlab. The advantage of the system is irradiation data being easily
analysed by the user. Furthermore, the system reduces the time taken to calculate the
energy of each level and the total energy of solar irradiation. The irradiance levelling is
using three specific colour ranges according to three level of the system. The result from
the GUI Matlab shows the data being levels into maximum, medium and minimum
level. The specific colours uses are red, yellow and green. Microsoft Excel was used to
prove the calculation of energy and total energy and the comparison of the graph in GUI.
vi
ABSTRAK
Projek ini membentangkan pembangunan pengasingan spektrum sinaran
matahari melalui pendekatan kontur warna. Sistem ini dibangunkan dengan
menggunakan Antara Muka Pengguna Umum (GUI) Matlab. Antara kelebihan sistem ini
ialah data penyinaran mudah dianalisis oleh pengguna. Tambahan pula, sistem dapat
mengurangkan masa yang diambil untuk mengira tenaga bagi setiap peringkat dan
jumlah keseluruhan tenaga sinaran matahari.Sinaran ini diasingkan menggunakan tiga
warna tertentu mengikut tiga tahap sistem. Hasil dari Matlab GUI menunjukkan data di
bahagikan kepada tahap maksimum, medium dan tahap minimum dengan menggunakan
warna merah, kuning dan hijau. Microsoft Excel digunakan untuk membuktikan
pengiraan tenaga dan jumlah tenaga serta perbandingan graf dalam GUI.

1
CHAPTER 1
INTRODUCTION
1.1 Project background
Irradiation is the measure of energy density of sunlight and is measured in kWh/m2 and
is the integral of irradiance since the energy is integrated over time. It is often
expressed as peak sun hours (psh). The psh is simply the length of time in hours at an
irradiance level of 1(kW/m2) needed to produce the daily irradiation obtain from the
integration of irradiance over all daylight hours. The irradiation data is important to
estimate how much solar energy is available. Most important, solar energy
technologies rely on it to provide energy and being use for modelling and design
related device or system like photovoltaic (PV) system [1-4].
Spectrum analysis is amongst the most useful techniques in modern science use
in many disciplines like astronomy, geology, medicine and solar system [5]. The
modeling of the clear sky irradiance components of solar radiation is necessary in
many applications of solar energy like systems design and simulation, control process
of the accuracy of radiometers, data quality control, gaps filling process, as well as in
routine engineering practice like the peak cooling load of buildings is determined for
a hot, cloudless, summer day.
2
Furthermore, the effects of the cloud generally induce most of the variability
and uncertainty in radiation calculations, years of hourly data are necessary to
constitute a valid reference data set whenever a general assessment covering all types
of sky conditions is needed.
1.2 Problem statements
Irradiation solar spectrum is a method to recognize the pattern of the solar irradiation
throughout the day. The instruments will calibrated to measure the spectral irradiance
in units of watts per meter squared over the wavelength range in nanometres. This has
helped a lot of the researcher to monitor the irradiation level.
However due to so many data of irradiance in a day, the specific analysis of the
irradiance pattern is time consuming [6]. As an example, when using Solar Data
Logger (SDL) template the user need to upload the data from one application to
another template in Excel before get the pattern. Furthermore, in order to obtain
energy at certain level, manually calculation is needed. It leads an increase of the time
taken to analysed. Moreover, problem may occur on how to read the irradiance level
on the system due to the same colour for all data. Therefore, for the better
understanding of the irradiation pattern, a method of solar irradiance levelling using
colour contour approach will be developed.
1.3 Project objectives
The major objective of this research is to design a solar irradiation levelling spectrum
that can easily be analysed by the user. Its measurable objectives are as follows:
(i) To determine the irradiance pattern through the specific colour spectrum.
(ii) To reduce the time taken by the user to measure the irradiation energy.

3
1.4 Project scope
This project is primarily concerned of irradiance implementation using Matlab- GUI.
The scopes of this project are:
(i) The irradiation data of the solar system will be taken from 8 am until 6 pm.
(ii) The system depends on the three colour level according to the three irradiance
level.
(iii) Matlab software will be used to develop and implement the data.
1.5 Report outlines
Chapter 1 gives a brief introduction of solar irradiation. It personalised explained about
the problem statement which is the main reason of this solar irradiance levelling
system project done. The objectives of the project together with the scopes are also
being explained in this chapter.
Chapter 2 is the literature review, which contains the previous study that has
some contribution to this project. Furthermore, there are methods that will be used in
the project explained. There is explanation about equations that will be used, which is
first for the plotting the colour levelling and second to calculate the energy.
The methodology part in Chapter 3, is about the method use in detail included
with the flow chart to obtain each of the objective specify. The Chapter 4 is the
important part of the project cause contains the result and analysis of the data from the
Chapter 3. In the Chapter 5 is about the conclusion and recommendations.

4
CHAPTER 2
LITERATURE REVIEW
2.1 Introduction
A literature review is a critical compilation of previous research that outlines
established findings, current knowledge and methods used. In this chapter, there will
be an explanation of irradiation parameters and previous researches related to this
project.
In section 2.2, reviews the previous study that has been done by other
researchers. In this section contains two sub section, first section are issues related to
solar irradiation analysis method and second section is about solar irradiation
modelling using several method.
In section 2.3, contains the introduction about the solar irradiance in this
project. In section 2.4, explain the basic of general user interface (GUI). Section 2.5
reviews the colour levelling. Lastly section 2.6 and 2.7 contains the explanations about
the formula and the solar data logger (SDL).

6
2.2 Previous study
There are a few research works had been carried out related to this project to gain
knowledge and further understand about the method, application of technology and
solution of the problem. This review is made referring to the previous work study,
present thesis related and paper which discuss topics about solar spectrum.
2.2.1 Issues that related to solar irradiation analysis
Hilbert Huang Transform (HHT) is a new method of analysing non-stationary and non-
linear time series data [7]. Based on realization of HHT method in MATLAB software,
they find that analytical capacity of HHT to time series in time-frequency domains
stands out.
The results show that solar irradiance is completely decomposed into four
Intrinsic Mode Function (IMF) components and an increasing trend by Empirical Mode
Decomposition (EMD) method. Figure 2.1, shows the Hilbert Spectrum of Solar
Irradiance.
The result of the paper uses the colour spectrum to plot the levelling of its
normalised frequency versus time. The plotting in this paper does not show a big impact
to the user. In this paper colour range cannot emphasize the differences of each level due
to its almost similar colour before or after each range. However, the idea to levelling the
data using the colour still can be used.
Whilst another paper has investigating multifractality of solar irradiance data
through wavelet based multifractal spectral analysis [8]. In this paper they have tried to
detect the irregularity and multifractality in the signal using continuous Wavelet
Transform Modulus Maxima (WTMM) algorithm. The data obtained by Earth
Radiation Budget Satellite (ERBS).

7
Figure 2.1: Hilbert spectrum of solar irradiance.
The scale colour from the MIN to MAX of the colour coded Continuous Wavelet
Transform(CWT) coefficient have use 128 colour from the deep brown to white. This
kind of plotting used the colour coding to plot the data. However, the colour look similar
which is seemed varies from the dense to dim ones. The plot was obtained by using the
Wavelet Toolbox of Matlab Software which is shown in Figure 2.2.
Figure 2.2: Colour coded CWT coefficient plot (Scale Vs. Time)
8
2.2.2 Issues of solar irradiation modelling
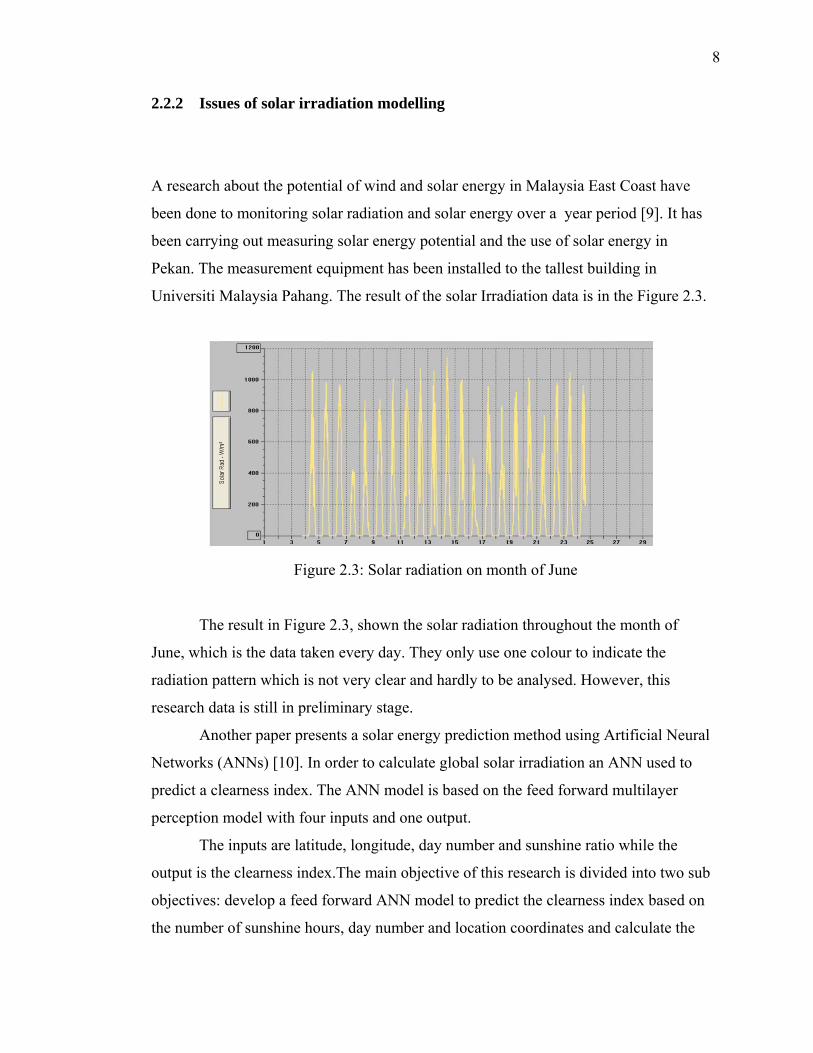
A research about the potential of wind and solar energy in Malaysia East Coast have
been done to monitoring solar radiation and solar energy over a year period [9]. It has
been carrying out measuring solar energy potential and the use of solar energy in
Pekan. The measurement equipment has been installed to the tallest building in
Universiti Malaysia Pahang. The result of the solar Irradiation data is in the Figure 2.3.
Figure 2.3: Solar radiation on month of June
The result in Figure 2.3, shown the solar radiation throughout the month of
June, which is the data taken every day. They only use one colour to indicate the
radiation pattern which is not very clear and hardly to be analysed. However, this
research data is still in preliminary stage.
Another paper presents a solar energy prediction method using Artificial Neural
Networks (ANNs) [10]. In order to calculate global solar irradiation an ANN used to
predict a clearness index. The ANN model is based on the feed forward multilayer
perception model with four inputs and one output.
The inputs are latitude, longitude, day number and sunshine ratio while the
output is the clearness index.The main objective of this research is divided into two sub
objectives: develop a feed forward ANN model to predict the clearness index based on
the number of sunshine hours, day number and location coordinates and calculate the
9
global solar irradiation based on the developed formulas for Malaysia. This work has
been based on long term data for solar irradiations (1984-2004) taken from the 28 sites
in Malaysia.Based on the results, the average mean value percentage error (MAPE),
mean bias error and root mean square error for the predicted global solar irradiation are
5.92%, 1.46% and 7.96%. In this prediction does not provide the prediction of the
energy.
2.3 Solar irradiance
Terms that related to the solar irradiance and the weather constrains that effect the solar
irradiance value.
2.3.1 Irradiance
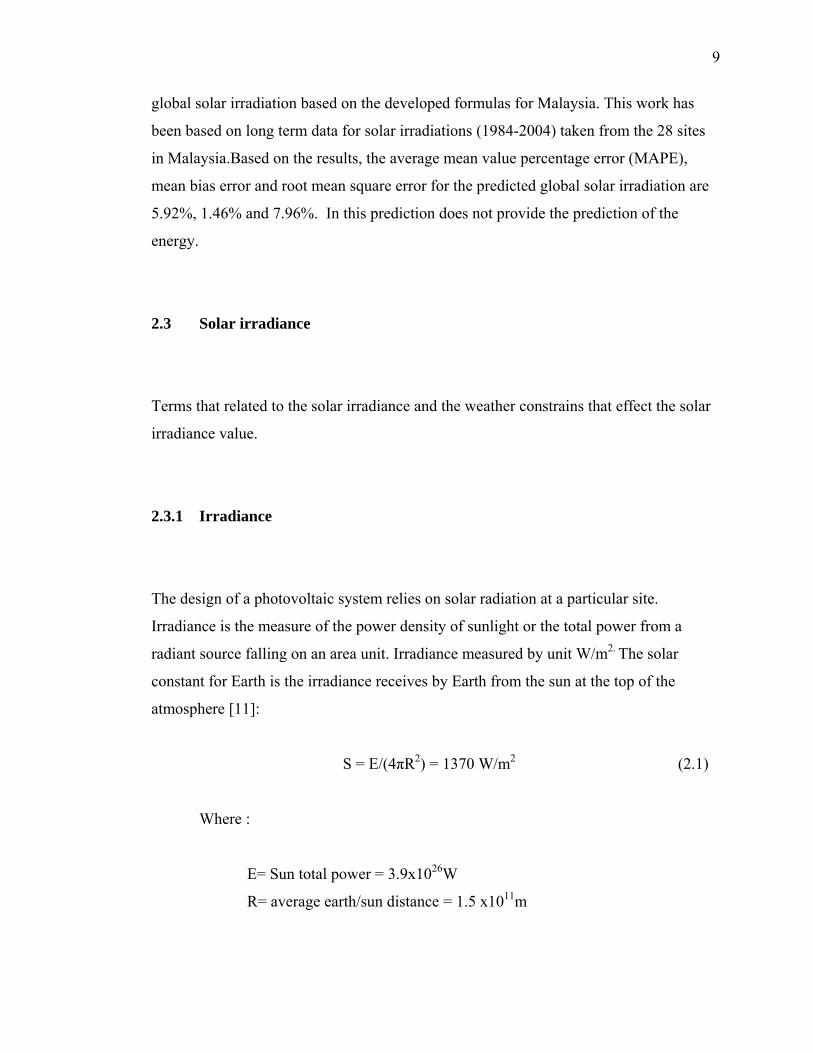
The design of a photovoltaic system relies on solar radiation at a particular site.
Irradiance is the measure of the power density of sunlight or the total power from a
radiant source falling on an area unit. Irradiance measured by unit W/m2. The solar
constant for Earth is the irradiance receives by Earth from the sun at the top of the
atmosphere [11]:
S = E/(4πR2) = 1370 W/m2 (2.1)
Where :
E= Sun total power = 3.9x1026W
R= average earth/sun distance = 1.5 x10¹¹m

10
Whilst the irradiation is the measure of energy density of sunlight and is
measured in kWh/m2. Irradiation is the integral of irradiance since energy is integrated
over time. In Figure 2.4, shows the solar radiate from the sun to the earth surface.
Figure 2.4: Way of solar radiate in the atmosphere
2.3.2 Constrain of weather conditions
The total irradiance of typical solar spectrum on the earth surface on a clear day is 1
kW/m2. However, the availability of the irradiance usually considerably less than 1
kW/m2 due to the rotation of the earth and due to the weather condition. On the sunny
day, the irradiance are more higher than the rainy day.
Sunny is also known as sunshine. The condition when the direct solar radiation
is not blocked by clouds, which is the combination of the bright light and radiant heat.
The term ‘sunshine duration’ has been used to indicate the cumulative time during
which an area receives direct irradiance from the Sun of at least 120 watts per square
meter by World Meteorological Organization [12].
Cloudy is the condition that happens when sun is blocked by the clouds or
reflects off of other objects, it is experienced as diffused light. In the rainy day the
amount of solar radiation available during arainy day is drastically reduced compared
to the sunny day.

11
2.4 The uses of Graphical User Interface (GUI)
The GUI is an illustrative platform and the co-ordinator between the data that user have
uploaded and the simulation. The GUI also able to start the simulation properly and
deliver the result needed. The GUI was created with Matlab, which is the user friendly
interface that gives simplification for the program.
GUI is used in Matlab to perform the task simply by hiding unnecessary clutters
and for the pictorial representation of the program [13]. GUI uses graphic and text input
to make familiar environment for the user to execute the program. Various components
used for the design of the GUI like push button, edit text, static text and axes. The
description of the component use is explained in Table 2.1.
Table 2.1: GUI basic component
NO COMPONENT DESCRIPTION
1 Push Button Created by uicontrolcallback. It triggers a call back
when clicked by mouse
2 Edit Text
Created by uicontrolcallback. It used to display a
string and allow the user to modify the information.
It triggers a call back function when the user click
the enter key
3 Static Text
Created by uicontrolcallback. It is used to display a
string but does not allow the user to modify the
information
4 Axes Used to display the data
There are two basic tasks in process to implement a GUI. The two processes are:
(i) Laying out a GUI where Matlab implement GUIs as figure windows containing
various styles of uicontrol (User Interface) object

12
(ii) Programming the GUI which each object must be program to perform the
intended action once the GUI activated by the user.
2.5 Colour in application
There are a many benefit by using colour in many cases. While for this project the
colour have been use to levelling the solar irradiation pattern. Figure 2.5 shows the basic
of the colour theory form from the colour wheel . The benefits of using colour are:
(i) Colour are attractive and aesthetic
(ii) Colour are easily noted and therefore highlight the differences of each level
Figure 2.5: The colour wheel forms the basis of the colour theory
In order to design a solar irradiation levelling spectrum, parameters colour
approach will be analyse as in Table 2.2. The colour uses for levelling have been
selected from a range of colour. This to make sure the colour levelling is different with
each other.

13
Table 2.2: Colour contour approach
Irradiance
(W/m2)
Colour Contour
Approach
800-1200 Red
400-800 Yellow
0- 400 Green
2.6 Formula to calculate the energy
In this system there are a few formula have been used to calculate the irradiation energy.
The formula use is as equation 2.2. This equation [14] is used to calculate the time
range while plotting the graph:
The energy and total energy of the solar irradiance can be calculated by using
the formula in equation 2.3:

14
2.7 Solar Data Logger (SDL)
The Solar Data Logger in Figures 2.6 and 2.7 is used to measure the irradiance. It is a
self-contained solar energy meter that measures the sun’s irradiance at regular intervals
for up to 170 days at a time. It has a weather proof enclosure that allows it to function
reliably in a wide variety of weather conditions.
A USB interface allows data to be uploaded to a computer for analysis. The
logged data quantifies how much energy could be produced by a solar power system.
The data can also help determine the best location and optimal tilt for an array of solar
panels.
Figure 2.6: SDL-1 solar data logger Figure 2.7: An assemble of SDL
2.8 Summary
In this part the previous study case has been review and the terms of the solar
irradiation has been explained for the better understanding.Moreover, it is about the
intro of the basic of GUI, colour and also the solar data logger.

14
CHAPTER 3
METHODOLOGY
3.1 Introduction
This chapter described the method that will be used to design the solar irradiation
spectrum monitoring system. The chapter is divided into two parts which are design
and simulation. The proposed monitoring system will be designed and simulated by
using MATLAB GUI. In section 3.2, contains the flow chart of the project. It is all
about collecting the data and information and then the implementation with the
software that will be use.
In section 3.3 explained about the data retrieved from the Solar Data Logger
(SDL). It contains brief explanation on how to retrieve the data to be use in the system.
While in section 3.4 is about the design process in GUI Matlab.
The journals and books have been used to collect data and information. Most of
the journal is IEEE papers. The system will be specified and then the design will be
optimize before being design by using the Matlab. Both the PS 1 and PS 2 activity can
be seen in the gantt chart at APPENDIX A.
15
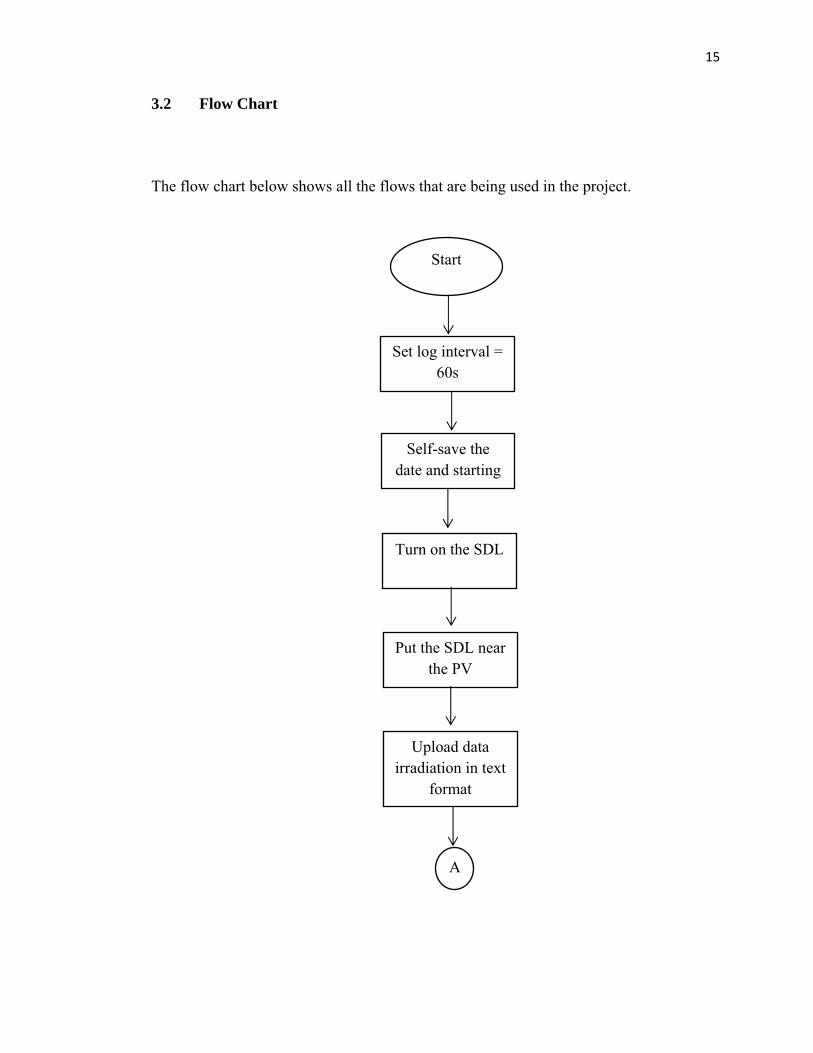
3.2 Flow Chart
The flow chart below shows all the flows that are being used in the project.
Start
Set log interval = 60s
Self-save the date and starting
Turn on the SDL
Put the SDL near the PV
Upload data irradiation in text
format
A

16
A
Open the solar irradiation levelling
system in Matlab
Put the file name, date and starting
time
NO
Levelling system run?
YES
End
Figure 3.1: Basic flow chart for the system
For the Figure 3.1 it is basic flow chart about the design. The flow chart starts
from the collecting data from the solar data logger (SDL) in the Figure 2.7 and 2.8,
then the software development until the colour contour development.The flow chart the
system starts when the Solar Data Logger (SDL) log interval is being set to 60s. The
log interval can be selectable within 10s, 60s, 150s, 300s and 900s and for this system

17
the log interval is fix to 60s or equal to 1 minute. Then the user need to note the date
and starting time as the SDL only logged the solar irradiance data.
User must set the SDL to the LOG mode and press the start button in the device
to start the data logging. The red Led will blink five times to indicate the data logging
have started.
The SDL device is better place near the photovoltaic (PV) panel as the panel
have been set up to get as much solar irradiance as it can. In this project the SDL have
been place near the PV panel at the power laboratory. However, the user can set the
device likely in the Figure 3.2.
Figure 3.2: Tilted collector and horizontal collector
The user needs to switch the mode from LOG to XFER to stop the data logging
session. They need to connect the SDL to the USB port. In order to transfer the data to
the computer the HyperTerminal must be open. The host computer where the data want
to be transfer must install the driver of SDL and configure HyperTerminal. For the
setup the user can refer to the manual of SDL that can be downloading from the SDL-1
website.
The USB interface on the SDL emulates a conventional RS-232 style serial
port. The data that have been transferred must be saving in text (.txt) format. The
method of saving the data is shown in Figure 3.5 and Figure 3.6. User need to create a
SDL folder in their computer desktop. The data that have been saving must be in this
folder. The system will trace the data in this folder.

18
The flow chart continues with the open the solar irradiance levelling system in
Matlab GUI. The developing of the system will be explained from the Figure 3.3. In
this basic flow chart of the system the user will continues by entering the file name that
they have save. Enter that file along with the date and starting time they note before the
logging session begins. The system working if it displays the plotting then the system
is successful and if not working the user need to check the parameter for to system to
work successfully. Push button is click to get the value of the energy.
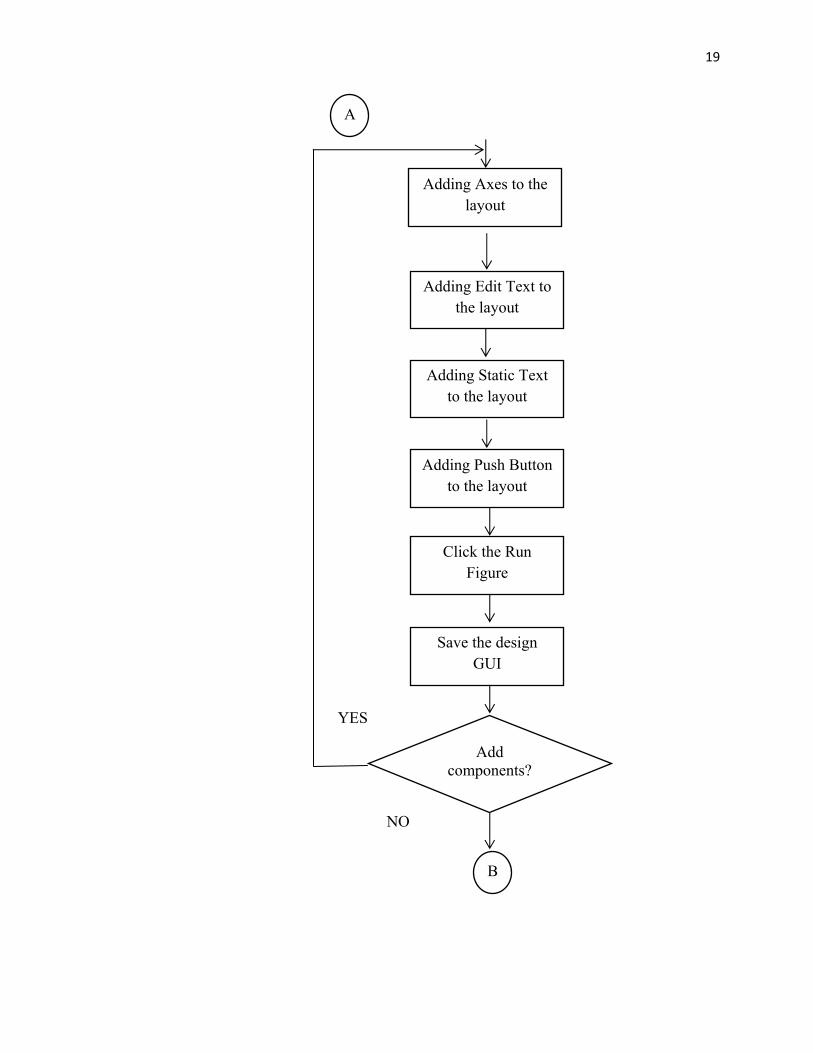
3.2.1 The GUI layout design flow chart
This design flow chart will explain about the how the GUI of the system being design.
Start
Open Matlab
Type guide in the command window
Choose the blank GUI in Create New
GUI
Adding Panel to the layout
A
19
A
Adding Edit Text to the layout
Adding Static Text to the layout
Adding Push Button to the layout
Click the Run Figure
Save the design GUI
NO
Add components?
YES
Adding Axes to the layout
B
20
B
Programming the
code in the generated M-files
Run the M-file
End
YES
NO
The design can execute?
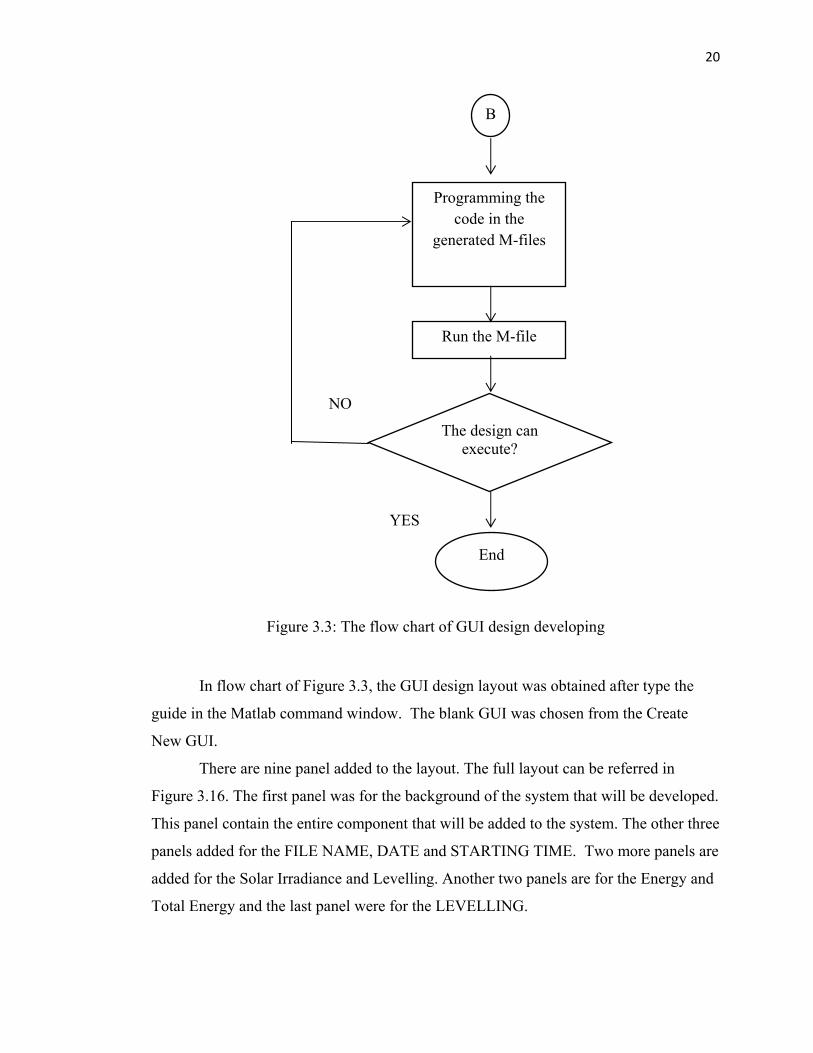
Figure 3.3: The flow chart of GUI design developing
In flow chart of Figure 3.3, the GUI design layout was obtained after type the
guide in the Matlab command window. The blank GUI was chosen from the Create
New GUI.
There are nine panel added to the layout. The full layout can be referred in
Figure 3.16. The first panel was for the background of the system that will be developed.
This panel contain the entire component that will be added to the system. The other three
panels added for the FILE NAME, DATE and STARTING TIME. Two more panels are
added for the Solar Irradiance and Levelling. Another two panels are for the Energy and
Total Energy and the last panel were for the LEVELLING.

21
The two panels of Solar Irradiance and Levelling have been added with the axes.
These axes will be the place for the data display in Irradiation versus Time. The
Levelling that contain SOLAR_axes1 is for the data that have been levelling with colour
while the Solar Irradiation is contain SDL_axes2 is for the original data without being
levelling.
The panel of FILE NAME, DATE and STARTING TIME contains the edit text,
which is when the system is executing the user need to enter the specified data.
Panels for the Energy and Total Energy is being added with static text as the data
that will display is being calculated in the programming GUI. Last panel was inserted
with the three pushbutton that are referring to the different level of the system. This
pushbutton was related with the Energy panel.
Then another four pushbuttons were added without the panel. The ENTER,
HELP, CLEAR and EXIT pushbutton. The pushbutton will use the callback function to
operate with code in M-files.
After finished with the design, click the Run Figure at the layout toolbar. Save
the GUI design with your desire name. The Matlab will generate the comments for
newly generated callback functions. This M-file will be used to add the code in the
component call back function. Another component thatneeds to be adding up can be
done right after the GUI being saved.
All the programming code that want to be generated was added in this M-files.
Run the M- files again and if the system can be execute successfully, no more
programming need to being corrected. That is the end of GUI design developing.
3.2.2 The programming flow chart
This flow chart will explain about the programming after the GUI designing in order for
the system to execute.

22
Start
YES aa = (y>=800)
NO
YES bb= (400≤y<800)
NO
cc= (y<400)
Red level
Yellow level
NO
YES
Green Level
a = load (n)
A

23
A
Sum up the tot=(a*b)/c;
Total Energy
Sum up the tota=(a*b)/c; for
each level
Energy
End
Figure 3.4: The flow chart of programming
The flow chart in the Figure 3.4 is for the programming to be executed in the
system. Its start with the ‘a = load (n)’. n is referring to the file name that have been
enter by the user. In programming the GUI the components must been program to
accomplish the proposed action once the GUI is activated by the user. The flowchart
continues with the data selection.
The program will select the data that more than 800 to be in the red colour level.
If not in the range, then its goes with the data that is below 800 which is in the yellow
colour level. Then if not equal the system will goes to the other state which is the green

24
level. Then the system will calculate the total energy using the ‘tot’ equation in the
programming and for the energy the system will calculate using the ‘ tota’ equation also
in the programming. The energy for each level is using the same formula, except the
equation for each ‘a’ is different. The ‘tot’ and ‘tota’ equation is shown in equation 3.1:
tot=tota= (a*b)/c (3.1)
Where:
a = sum (y) in (w/m2)
b = log interval = 60 s
c = 3.6 x10⁶
In addition for the tota the ‘a’ for each level is different with each other. Where
for the maximum level is like in the equation 3.2.
a =(sum(g.*y)) (3.2)
Where:
g = (y>= 800)
The medium level equation for ‘a’ is slightly different with the maximum. The
equation need to indicate the solar irradiation value between the 400 and 800 range
values. Thus, the ‘a’ equation will be like in the equation 3.3.
a = (sum(h.*y))-(sum(g.*y)); (3.3)

47
REFERENCES
[1] Al Riza, D. F. ,Gilani,S. I. H. &Aris,M. S. (2011). Hourly Solar Radiation Estimation
Using Ambient Temperature and Relative Humidity Data.International Journal of
Environmental Science and Development.2(3).
[2] Shuanghua, C. (2010). Total Daily Solar Irradiance Prediction using Recurrent Neural
Networks with Determinants. Power and Energy Engineering Conference (APPEEC),
Asia-Pacific.
[3] Zaharim, A.,Razali,A. M.,Gim, T. P.,&Sopian,K. ( 2009).Time Series Analysis of Solar
Radiation Data in the Tropics,25 (4) , 672-678.
[4] Karim,S. A. A., Singh,B.S.M.,Razali, R.&Yahya. N.Solar radiation data analysis by
using Daubechies wavelets. Short Term Internal Research Funding (STIRF), No.
76/10.11.
[5] Turpin,T. M. (1981). Spectrum Analysis Using Optical Processing, 69(1).Proceedings of
the IEEE.
[6] Karim,S. A. A., Singh,B.S.M.,Razali,R.&Yahya,N. Data Compression Technique for
Modelling of Global Solar Radiation. Short Term Internal Research Funding (STIRF)
No. 76/10.11
[7] Wang, Y., Ding, Y., He, Y. &Miao, Q. (2010). Realization of HHT Method to Solar
Irradiance Data In MATLAB. Second WRI World Congress on Software Engineering.
[8] Hossain,K. M.,Ghosh, D. N. &K. Ghosh (2009). Investigating Multifractality of Solar
Irradiance Data through Wavelet Based Multifractal Spectral Analysis. Signal
Processing: An International Journal (SPIJ).3(4).
[9] Noor, M.M., Amirruddin,A.K., Kadirgama, K.&K.V.Sharma (2011). The potential of
wind and solar energy in Malaysia East Coast: Preliminary study at Universiti Malaysia
Pahang (UMP). Transactions of the Wessex Institute.

48
[10] Khatib, T., Mohamed,A. Sopian,K. &Mahmoud, M. Modelling of solar energy for
Malaysia using artificial neural networks. Recent researches in power systems and
systems science.
[11] D. R. Brooks (2006). Monitoring Solar Radiation and Its Transmission through the
Atmosphere. Drexel University,Philadelphia,PA, USA.
[12] Wikipedia (2011). Sunlight.Retrieved on October 20, 2011, from
http://en.wikipedia.org/wiki/Sunlight
[13] Kotta, S . S.&Kommineni, B. K. (2012). Acoustic Beamforming for Hearing Aids Using
Multi Microphone Array by Designing Graphical User Interface. Master.Thesis.Blekinge
Institute of Technology
[14] SDL1_Manual_rev1.6.pdf from www.microcircuitslab.com, retrieved on December
8,2011 from http://www.pdfio.com/k-683547.html.
[15] Marchand, P. & Holland, O. T. Graphics and GUIs with MATLAB. 3rd Ed. Chapman &
Hall/CRC. 2003.