Embed Size (px)
Citation preview
1
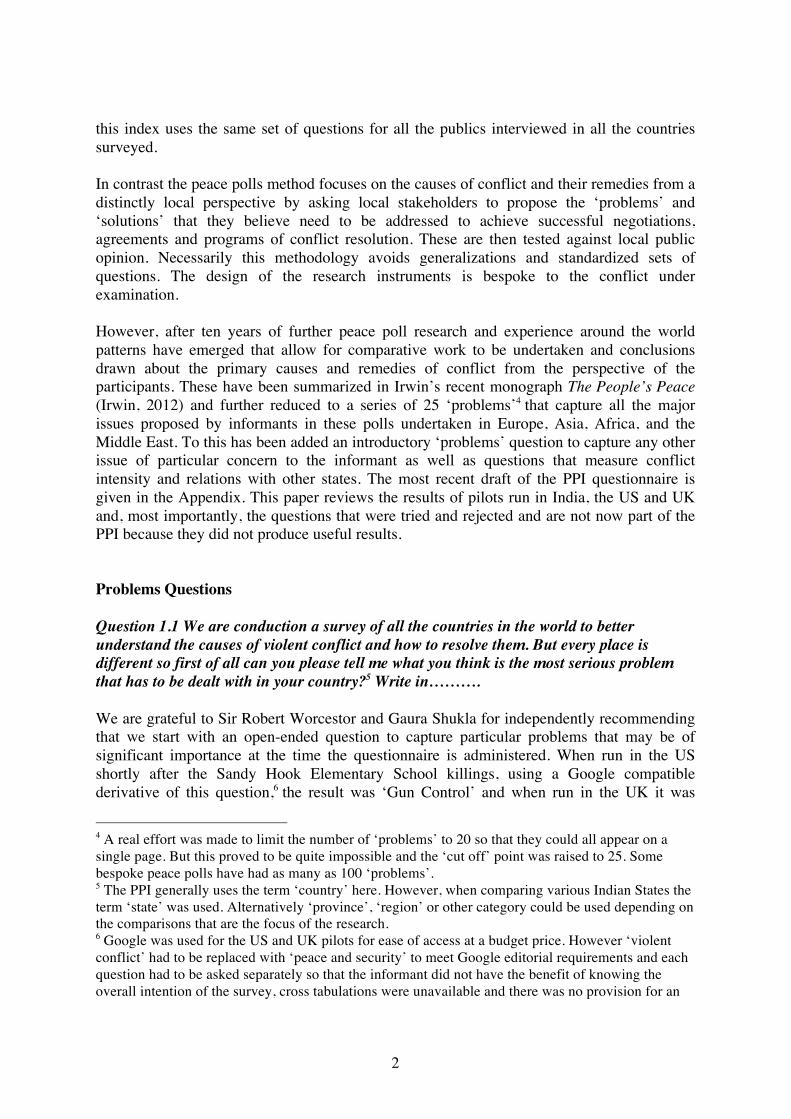
The Development of a ‘People’s Peace Index’ (PPI)1 WAPOR Annual Conference, May 14-16 Boston, MA, USA Dr. Colin Irwin, Department of Politics, University of Liverpool Yashwant Deshmukh, CVoter Foundation, Noida, U.P. India Introduction After completing a series of peace polls in Northern Ireland (Irwin, 2002) and the Balkans between 1996 and 2005 Dr. Irwin was asked if he could develop a peace index that could be used to monitor and analyze conflicts on a global basis (Irwin, 2005).2 At the time he was not able to do so but an Australian philanthropist, Steve Killelea, initiated the Global Peace Index (GPI) in 2007. It has presently become the most widely cited peace index and is produced annually by the Institute for Economics and Peace (IEP) with offices in Sydney, Washington and New York. Using a variety of data from The Economist Intelligence Unit (EIU) various UN agencies and NGOs it employs 23 variables dealing with wars, deaths, crimes, armaments, political stability etc. all weighted for their relative importance by a panel of experts. In 2012 Iceland came out on top of this rank ordered list of 165 states with a score of 1.113 while Somalia came bottom with a score of 3.392. With regards to the analysis of conflicts and policies for their resolution the most well known body of authoritative publicly available research is undertaken by the International Crisis Group (ICG) who produce monthly reviews of all the major conflicts in the world. This is done using the kind of data produced for the GPI plus input from their own analysts in the field. They have offices in Brussels, Washington and New York. Critically the GPI indices and ICG recommendations for conflict resolution are based on third party analysis undertaken by country and international experts using various forms of political and risk assessment. This work creates a valuable source of information for governments and investors to make political and financial calculations and decisions. But the methodologies are distinctly more top down than bottom up and are therefore relatively weak in terms of what could be characterized as the people’s perspective of domestic, regional and global conflict. This would be particularly true from the standpoint of various ethnic and religious groups. By way of contrast the peace polls method emphasizes the opinions of publics and public diplomacy as the primary method of analysis and conflict resolution. At present the most well known international index that uses public opinion as its primary source of data and mode of analysis is the Anholt-GfK Roper National Brands Index3 which rank orders the top 20 industrial states in the world on a variety of criteria such as governance, culture and heritage, tourism, exports etc. Necessarily, for comparative purposes, 1 We had originally planned to run the final draft of the People’s Peace Index (PPI) across India to produce an Indian People’s Peace Index (IPPI) of all states and territories but its development took longer than expected requiring 4 pilots to produce a result we were satisfied with. The IPPI will be run later this year. However, with the launch of Google Consumer Services we were able to run and collect comparative data in the US and UK the results of which have been included in this paper. 2 GMI hoped to develop a peace index along the lines of their Anholt-GMI National Brands Index. 3 The Anholt-GfK National Brands Index was run in partnership with GMI in 2005.
2
this index uses the same set of questions for all the publics interviewed in all the countries surveyed. In contrast the peace polls method focuses on the causes of conflict and their remedies from a distinctly local perspective by asking local stakeholders to propose the ‘problems’ and ‘solutions’ that they believe need to be addressed to achieve successful negotiations, agreements and programs of conflict resolution. These are then tested against local public opinion. Necessarily this methodology avoids generalizations and standardized sets of questions. The design of the research instruments is bespoke to the conflict under examination. However, after ten years of further peace poll research and experience around the world patterns have emerged that allow for comparative work to be undertaken and conclusions drawn about the primary causes and remedies of conflict from the perspective of the participants. These have been summarized in Irwin’s recent monograph The People’s Peace (Irwin, 2012) and further reduced to a series of 25 ‘problems’4 that capture all the major issues proposed by informants in these polls undertaken in Europe, Asia, Africa, and the Middle East. To this has been added an introductory ‘problems’ question to capture any other issue of particular concern to the informant as well as questions that measure conflict intensity and relations with other states. The most recent draft of the PPI questionnaire is given in the Appendix. This paper reviews the results of pilots run in India, the US and UK and, most importantly, the questions that were tried and rejected and are not now part of the PPI because they did not produce useful results. Problems Questions Question 1.1 We are conduction a survey of all the countries in the world to better understand the causes of violent conflict and how to resolve them. But every place is different so first of all can you please tell me what you think is the most serious problem that has to be dealt with in your country?5 Write in………. We are grateful to Sir Robert Worcestor and Gaura Shukla for independently recommending that we start with an open-ended question to capture particular problems that may be of significant importance at the time the questionnaire is administered. When run in the US shortly after the Sandy Hook Elementary School killings, using a Google compatible derivative of this question,6 the result was ‘Gun Control’ and when run in the UK it was
4 A real effort was made to limit the number of ‘problems’ to 20 so that they could all appear on a single page. But this proved to be quite impossible and the ‘cut off’ point was raised to 25. Some bespoke peace polls have had as many as 100 ‘problems’. 5 The PPI generally uses the term ‘country’ here. However, when comparing various Indian States the term ‘state’ was used. Alternatively ‘province’, ‘region’ or other category could be used depending on the comparisons that are the focus of the research. 6 Google was used for the US and UK pilots for ease of access at a budget price. However ‘violent conflict’ had to be replaced with ‘peace and security’ to meet Google editorial requirements and each question had to be asked separately so that the informant did not have the benefit of knowing the overall intention of the survey, cross tabulations were unavailable and there was no provision for an

3
‘Immigration’ (Table 1) this being an item of much discussion at the time in the context of EU expansion. The results for India7 are given in Table 2 along with the results for some individual Indian States. Table 1. With regards to peace and security in your country what is the most serious problem that has to be resolved? Top 10 from Google US and UK pilot samples of 200.
US n=200 Per cent UK n=200 Per cent 1 Gun control 10.9 Immigration 8.3 2 Guns 9.0 Jobs 3.9 3 Economy 3.0 Terrorism 3.9 4 Gun violence 2.5 Drugs 3.4 5 Terrorism 2.5 Crime 2.9 6 Jobs 2.0 Corruption 2.5 7 Poverty 2.0 Economy 2.5 8 Crime 1.5 Guns 2.5 9 Mental illness 1.5 War 2.5 10 Security 1.5 DK 2.0 Table 2. Per cent most serious problems for India, Gujarat, Jammu and Kashmir (J & K) and Tamil Nadu (Top 10 from Indian pilot samples of 174 with boosters for Gujarat, J & K and Tamil Nadu).
India n=174 Per cent Gujarat n=62 Per
cent J & K n=57 Per cent Tamil Nadu
n=55 Per cent
1 Can't say 18.4 No problem 45.2 Corruption 22.8 Electricity problems 50.9
2 Corruption 16.1 Price hike 9.7 Unemployment 17.5 Drinking water 18.2
3 Unemployment 15.5 Unemployment 9.7 No problem 12.3 Can't say 7.3
4 Price hike 6.3 Can't say 8.1 Terrorism 8.8 Corruption 3.6
5 Drinking water 4.6 Corruption 8.1 Casteism 7.0 Irrigation water 3.6
6 No problem 4.6 Drinking water 6.5 Can't say 5.3 Kaveri river conflict 3.6
7 Poor road condition 4.6 Alcoholism 1.6 Basic
development 5.3 No problem 3.6
8 Poverty 4.0 Irrigation water 1.6 India Pakistan conflict 3.5 Poor road
condition 3.6
9 Basic development 3.4 Low price of
crops 1.6 Traffic 3.5 Law and order 1.8
10 Electricity problems 3.4 Political
leaders 1.6 Migration 1.8 Population 1.8
ethnic demographic. No doubt these present limitations will be resolved as this product is developed further. 7 The Indian pilots were completed by the Team CVoter Foundation using RDD by CATI data collection methods. There were four pilots in all running different versions of the questions sometimes in India as a whole for an all India sample and sometimes in various States of India. The size of these various samples are given in the tables whenever the results are presented.
4
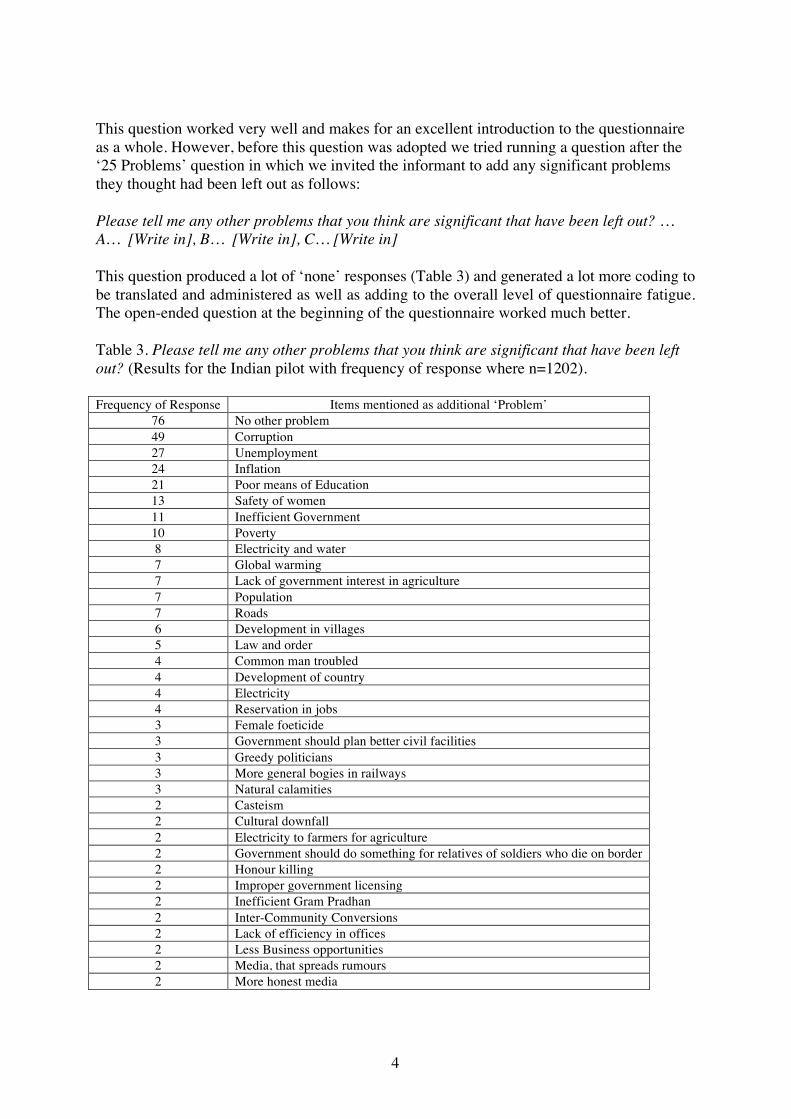
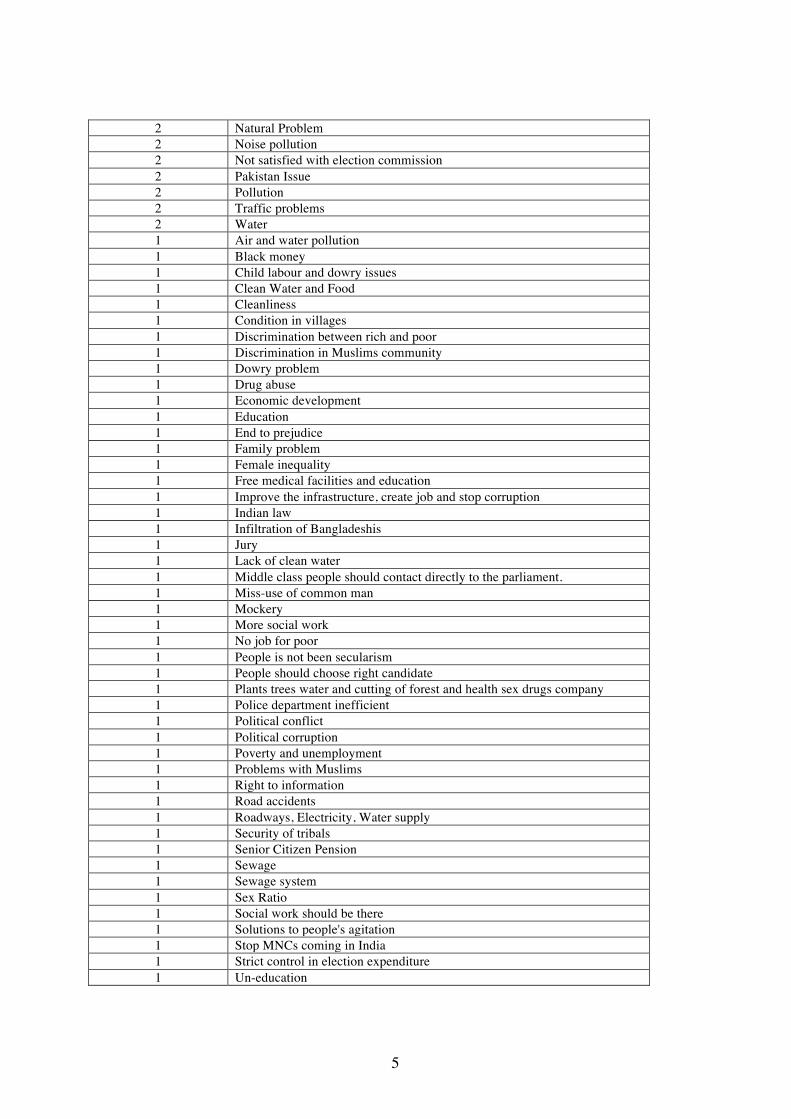
This question worked very well and makes for an excellent introduction to the questionnaire as a whole. However, before this question was adopted we tried running a question after the ‘25 Problems’ question in which we invited the informant to add any significant problems they thought had been left out as follows: Please tell me any other problems that you think are significant that have been left out? … A… [Write in], B… [Write in], C… [Write in] This question produced a lot of ‘none’ responses (Table 3) and generated a lot more coding to be translated and administered as well as adding to the overall level of questionnaire fatigue. The open-ended question at the beginning of the questionnaire worked much better. Table 3. Please tell me any other problems that you think are significant that have been left out? (Results for the Indian pilot with frequency of response where n=1202). Frequency of Response Items mentioned as additional ‘Problem’
76 No other problem 49 Corruption 27 Unemployment 24 Inflation 21 Poor means of Education 13 Safety of women 11 Inefficient Government 10 Poverty 8 Electricity and water 7 Global warming 7 Lack of government interest in agriculture 7 Population 7 Roads 6 Development in villages 5 Law and order 4 Common man troubled 4 Development of country 4 Electricity 4 Reservation in jobs 3 Female foeticide 3 Government should plan better civil facilities 3 Greedy politicians 3 More general bogies in railways 3 Natural calamities 2 Casteism 2 Cultural downfall 2 Electricity to farmers for agriculture 2 Government should do something for relatives of soldiers who die on border 2 Honour killing 2 Improper government licensing 2 Inefficient Gram Pradhan 2 Inter-Community Conversions 2 Lack of efficiency in offices 2 Less Business opportunities 2 Media, that spreads rumours 2 More honest media
5
2 Natural Problem 2 Noise pollution 2 Not satisfied with election commission 2 Pakistan Issue 2 Pollution 2 Traffic problems 2 Water 1 Air and water pollution 1 Black money 1 Child labour and dowry issues 1 Clean Water and Food 1 Cleanliness 1 Condition in villages 1 Discrimination between rich and poor 1 Discrimination in Muslims community 1 Dowry problem 1 Drug abuse 1 Economic development 1 Education 1 End to prejudice 1 Family problem 1 Female inequality 1 Free medical facilities and education 1 Improve the infrastructure, create job and stop corruption 1 Indian law 1 Infiltration of Bangladeshis 1 Jury 1 Lack of clean water 1 Middle class people should contact directly to the parliament. 1 Miss-use of common man 1 Mockery 1 More social work 1 No job for poor 1 People is not been secularism 1 People should choose right candidate 1 Plants trees water and cutting of forest and health sex drugs company 1 Police department inefficient 1 Political conflict 1 Political corruption 1 Poverty and unemployment 1 Problems with Muslims 1 Right to information 1 Road accidents 1 Roadways, Electricity, Water supply 1 Security of tribals 1 Senior Citizen Pension 1 Sewage 1 Sewage system 1 Sex Ratio 1 Social work should be there 1 Solutions to people's agitation 1 Stop MNCs coming in India 1 Strict control in election expenditure 1 Un-education
6
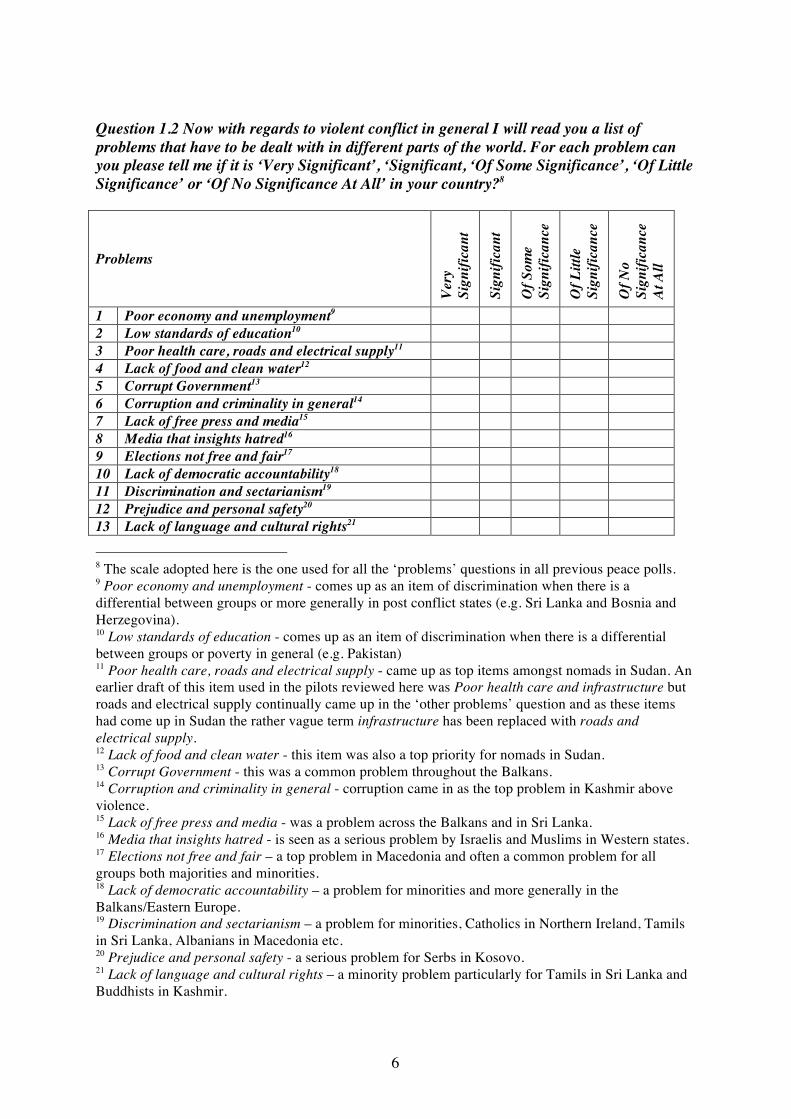
Question 1.2 Now with regards to violent conflict in general I will read you a list of problems that have to be dealt with in different parts of the world. For each problem can you please tell me if it is ‘Very Significant’, ‘Significant, ‘Of Some Significance’, ‘Of Little Significance’ or ‘Of No Significance At All’ in your country?8
Problems
Very
Si
gnifi
cant
Sign
ifica
nt
Of S
ome
Si
gnifi
canc
e
Of L
ittle
Si
gnifi
canc
e
Of N
o
Sign
ifica
nce
At
All
1 Poor economy and unemployment9 2 Low standards of education10 3 Poor health care, roads and electrical supply11 4 Lack of food and clean water12 5 Corrupt Government13 6 Corruption and criminality in general14 7 Lack of free press and media15 8 Media that insights hatred16 9 Elections not free and fair17 10 Lack of democratic accountability18 11 Discrimination and sectarianism19 12 Prejudice and personal safety20 13 Lack of language and cultural rights21
8 The scale adopted here is the one used for all the ‘problems’ questions in all previous peace polls. 9 Poor economy and unemployment - comes up as an item of discrimination when there is a differential between groups or more generally in post conflict states (e.g. Sri Lanka and Bosnia and Herzegovina). 10 Low standards of education - comes up as an item of discrimination when there is a differential between groups or poverty in general (e.g. Pakistan) 11 Poor health care, roads and electrical supply - came up as top items amongst nomads in Sudan. An earlier draft of this item used in the pilots reviewed here was Poor health care and infrastructure but roads and electrical supply continually came up in the ‘other problems’ question and as these items had come up in Sudan the rather vague term infrastructure has been replaced with roads and electrical supply. 12 Lack of food and clean water - this item was also a top priority for nomads in Sudan. 13 Corrupt Government - this was a common problem throughout the Balkans. 14 Corruption and criminality in general - corruption came in as the top problem in Kashmir above violence. 15 Lack of free press and media - was a problem across the Balkans and in Sri Lanka. 16 Media that insights hatred - is seen as a serious problem by Israelis and Muslims in Western states. 17 Elections not free and fair – a top problem in Macedonia and often a common problem for all groups both majorities and minorities. 18 Lack of democratic accountability – a problem for minorities and more generally in the Balkans/Eastern Europe. 19 Discrimination and sectarianism – a problem for minorities, Catholics in Northern Ireland, Tamils in Sri Lanka, Albanians in Macedonia etc. 20 Prejudice and personal safety - a serious problem for Serbs in Kosovo. 21 Lack of language and cultural rights – a minority problem particularly for Tamils in Sri Lanka and Buddhists in Kashmir.
7
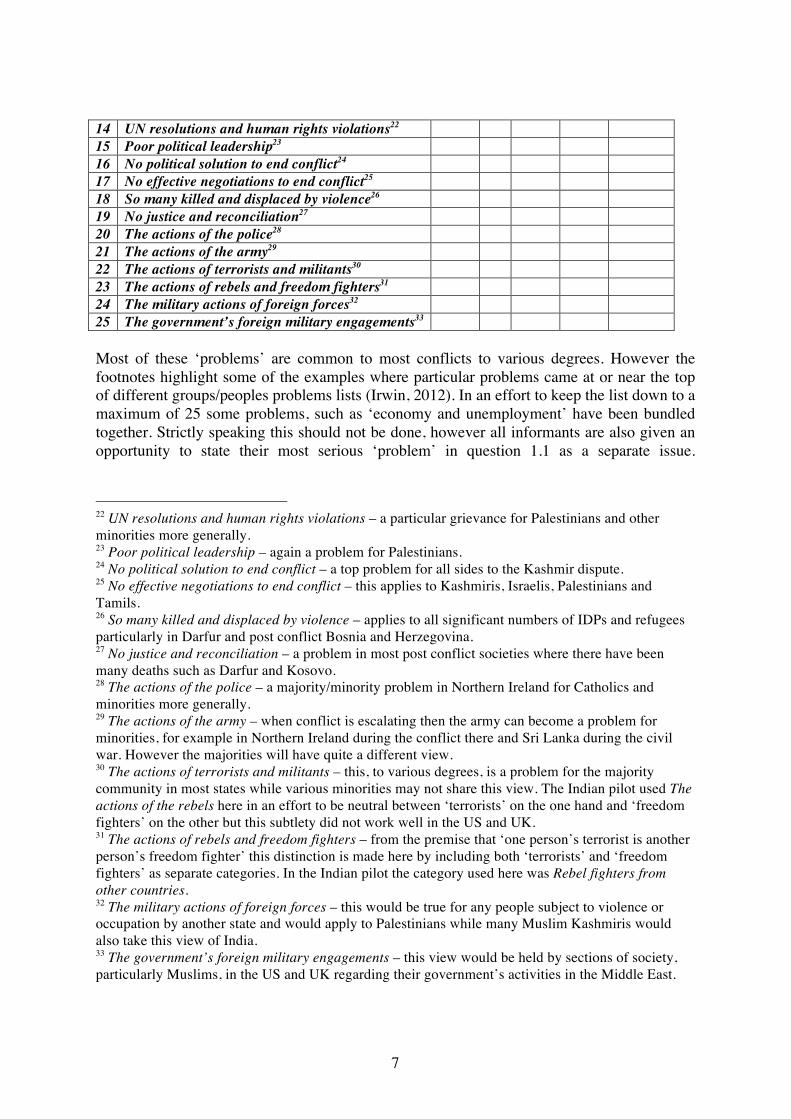
14 UN resolutions and human rights violations22 15 Poor political leadership23 16 No political solution to end conflict24 17 No effective negotiations to end conflict25 18 So many killed and displaced by violence26 19 No justice and reconciliation27 20 The actions of the police28 21 The actions of the army29 22 The actions of terrorists and militants30 23 The actions of rebels and freedom fighters31 24 The military actions of foreign forces32 25 The government’s foreign military engagements33 Most of these ‘problems’ are common to most conflicts to various degrees. However the footnotes highlight some of the examples where particular problems came at or near the top of different groups/peoples problems lists (Irwin, 2012). In an effort to keep the list down to a maximum of 25 some problems, such as ‘economy and unemployment’ have been bundled together. Strictly speaking this should not be done, however all informants are also given an opportunity to state their most serious ‘problem’ in question 1.1 as a separate issue.
22 UN resolutions and human rights violations – a particular grievance for Palestinians and other minorities more generally. 23 Poor political leadership – again a problem for Palestinians. 24 No political solution to end conflict – a top problem for all sides to the Kashmir dispute. 25 No effective negotiations to end conflict – this applies to Kashmiris, Israelis, Palestinians and Tamils. 26 So many killed and displaced by violence – applies to all significant numbers of IDPs and refugees particularly in Darfur and post conflict Bosnia and Herzegovina. 27 No justice and reconciliation – a problem in most post conflict societies where there have been many deaths such as Darfur and Kosovo. 28 The actions of the police – a majority/minority problem in Northern Ireland for Catholics and minorities more generally. 29 The actions of the army – when conflict is escalating then the army can become a problem for minorities, for example in Northern Ireland during the conflict there and Sri Lanka during the civil war. However the majorities will have quite a different view. 30 The actions of terrorists and militants – this, to various degrees, is a problem for the majority community in most states while various minorities may not share this view. The Indian pilot used The actions of the rebels here in an effort to be neutral between ‘terrorists’ on the one hand and ‘freedom fighters’ on the other but this subtlety did not work well in the US and UK. 31 The actions of rebels and freedom fighters – from the premise that ‘one person’s terrorist is another person’s freedom fighter’ this distinction is made here by including both ‘terrorists’ and ‘freedom fighters’ as separate categories. In the Indian pilot the category used here was Rebel fighters from other countries. 32 The military actions of foreign forces – this would be true for any people subject to violence or occupation by another state and would apply to Palestinians while many Muslim Kashmiris would also take this view of India. 33 The government’s foreign military engagements – this view would be held by sections of society, particularly Muslims, in the US and UK regarding their government’s activities in the Middle East.
8
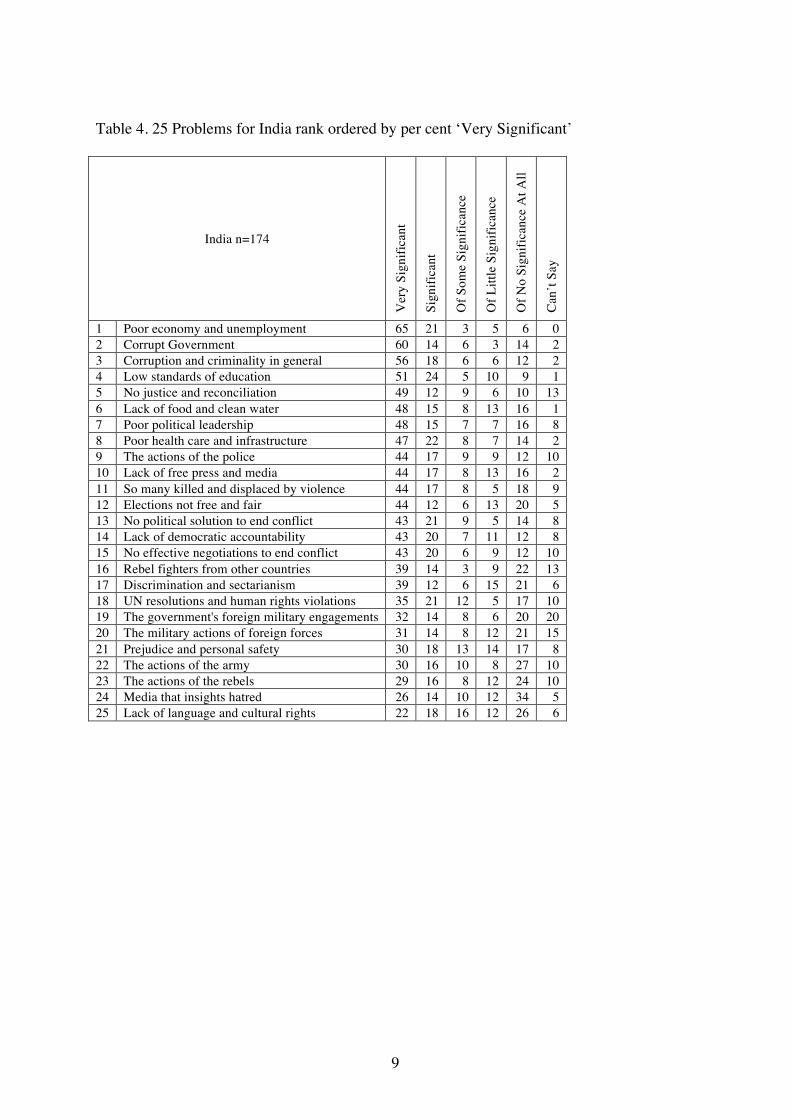
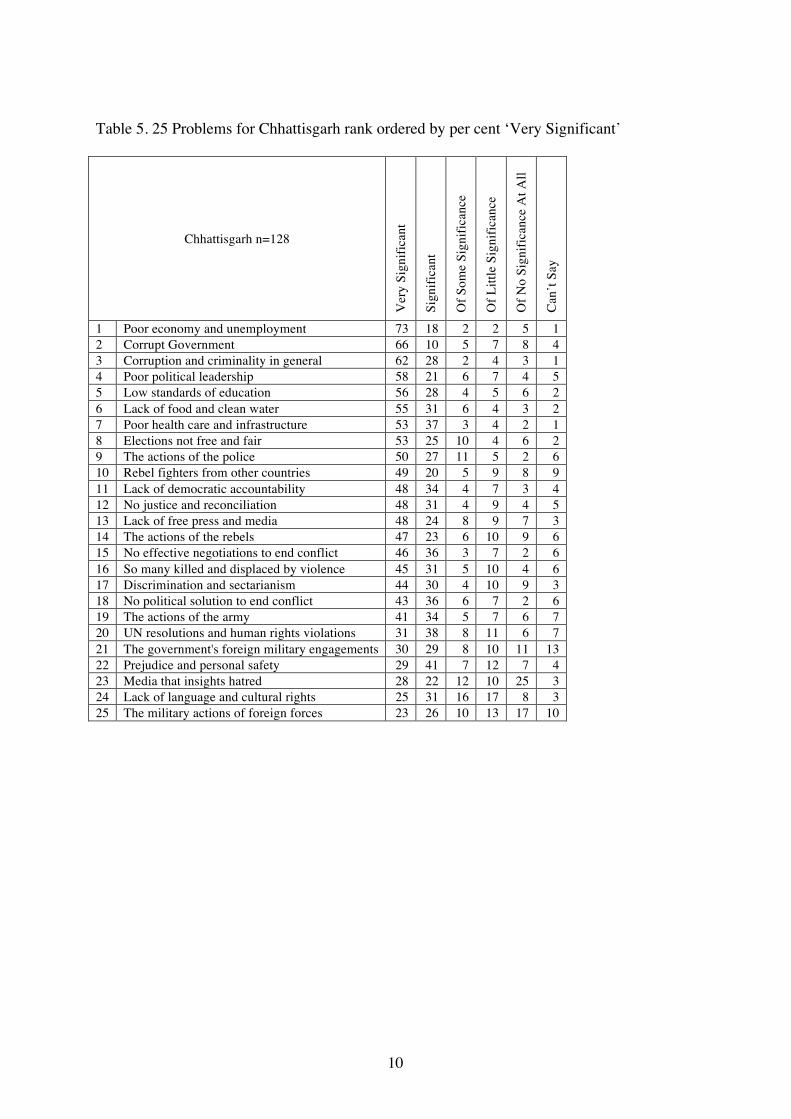
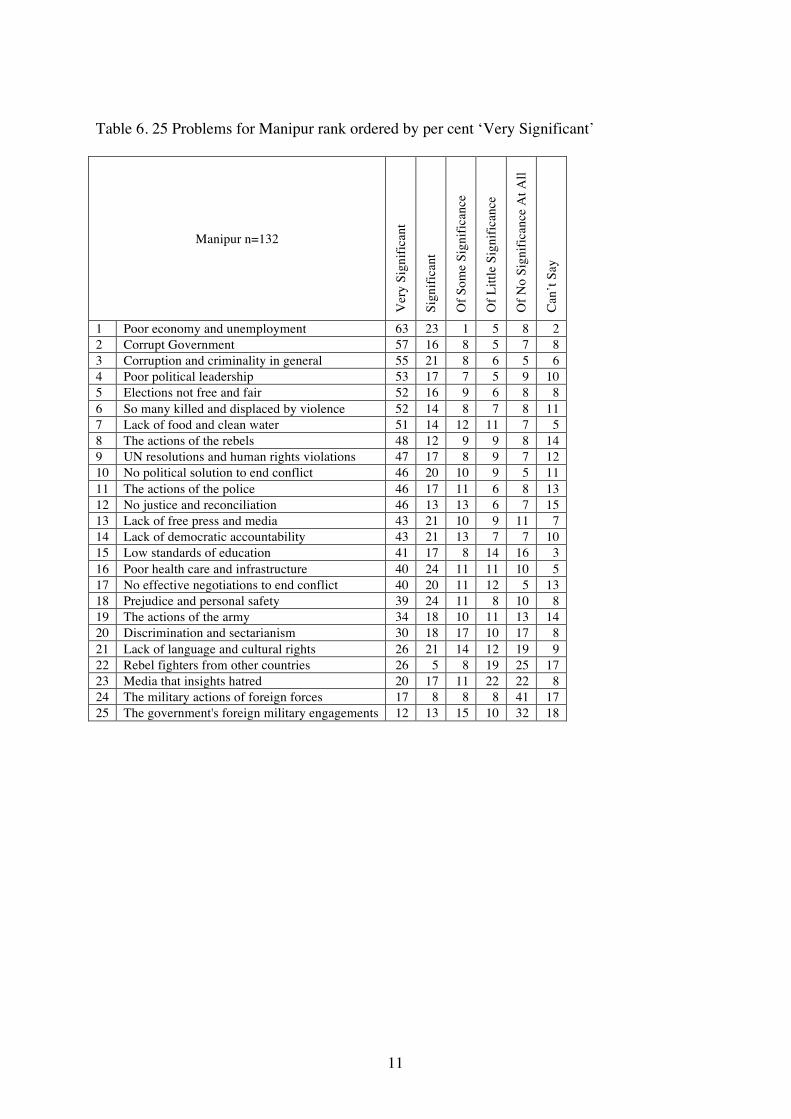
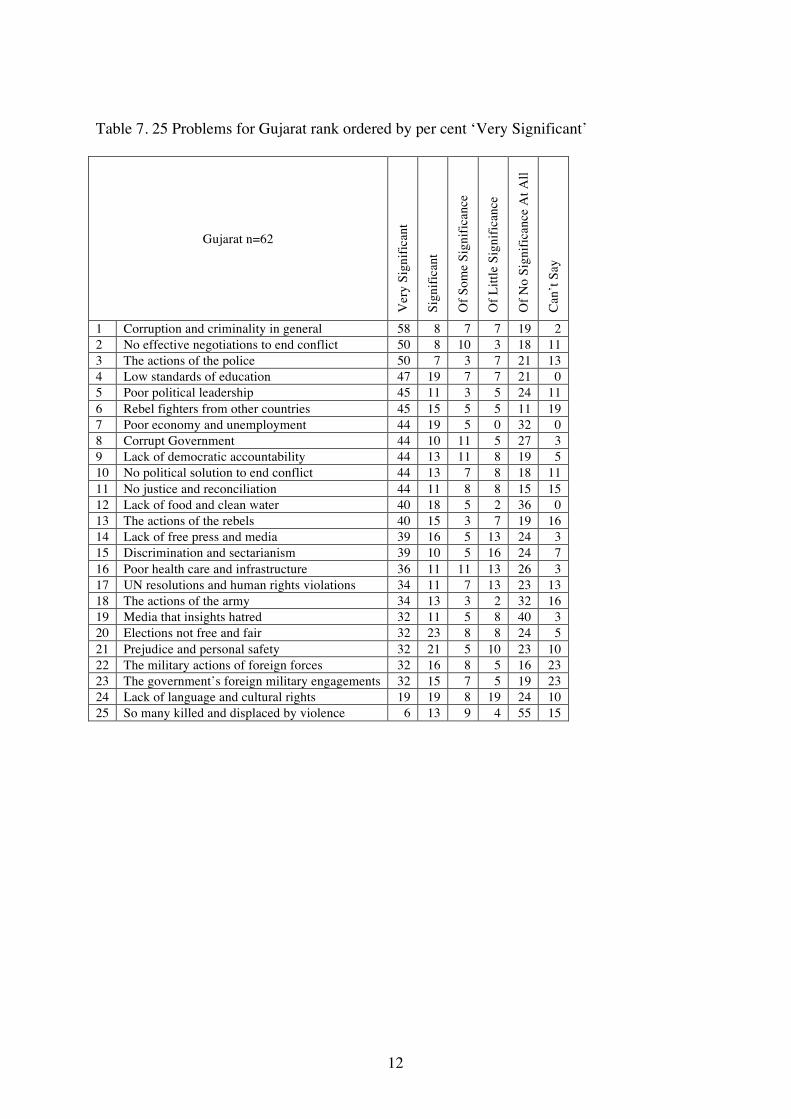
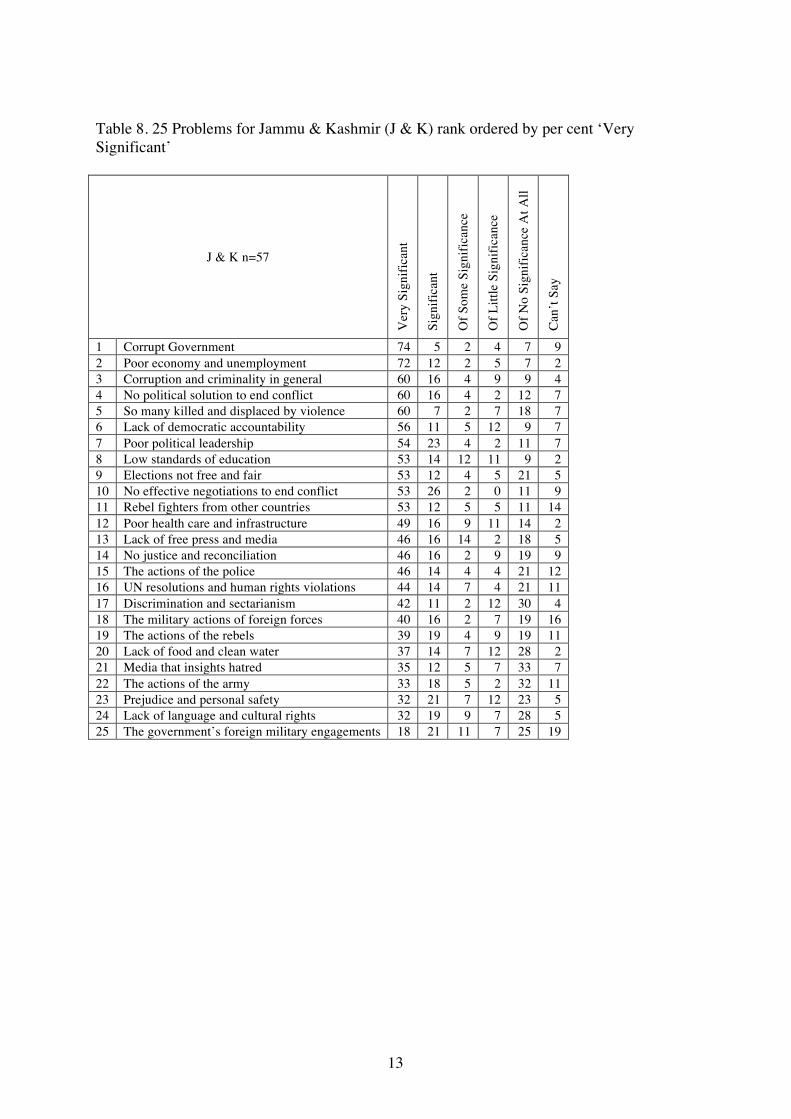
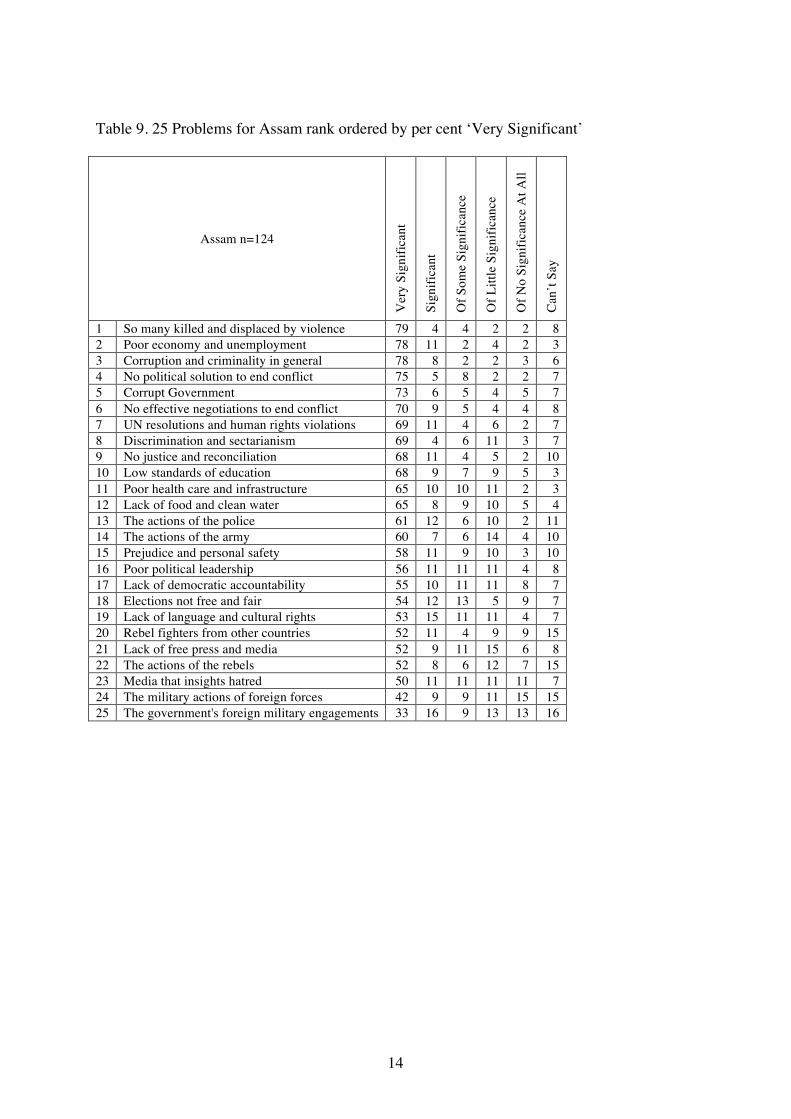
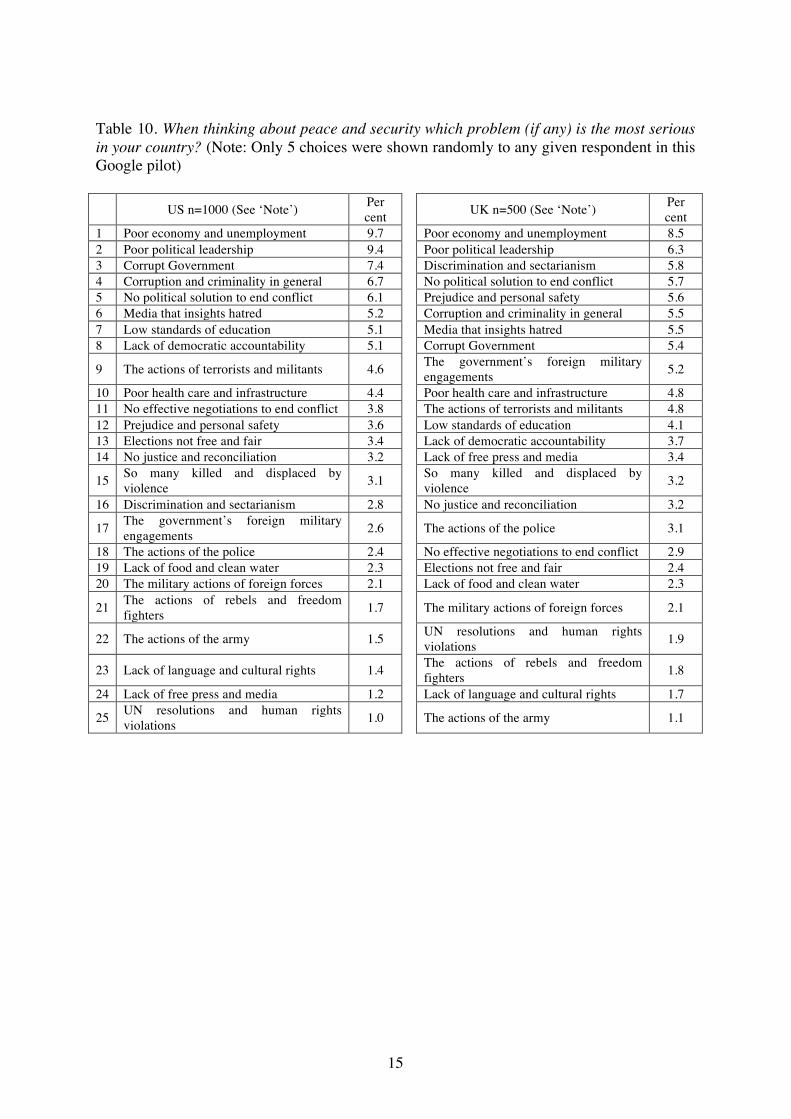
Additionally, for ease of interview, the problems have been arranged from least sensitive to most sensitive. Although the responses to the questions can be used to create indexes such values tend to be influenced by culture. However, these cultural biases that can inflate or deflate such values are for the most part eliminated when the ‘problems’ are rank ordered. This rank ordering can be done for each state, regions within a state, for the majority in a state, and its various minorities to facilitate a conflict analysis, in terms of priorities for what may need to be done to resolve conflict or potential conflict. These rank orders also indicate where the state is in terms of the cycle of conflict (pre-violent, violent, post-violence/peace). A number of critical additional analyses can also be made with respect to various majorities and minorities within each state and ‘flagged up’ for concern and attention if, for example, a ‘problem’ at the top of one groups list is low down on another groups list and so on and so on (Irwin, 2012). Table 4 provides a base line for India as a whole against which other states in the Indian pilot can be compared. Problems of the economy, unemployment and corruption feature at the top of this list as they did in the open-ended question 1.1. The same is true for the Indian States of Chhattisgarh (Table 5) and Manipur (Table 6). However, in Gujarat ‘No effective negotiations to end conflict’ and ‘The actions of the police’ have risen to 2nd and 3rd out of 25 problem items in their list (Table 7) where they were 15th and 9th for India as a whole (Table 4). So although Gujarat may be relatively peaceful ‘…as of today’ (see below Table 12) the sectarian divisions at the centre of the 2002 Gujarat riots have clearly not been resolved to the satisfaction of the general public. Similarly ‘No political solution to end conflict’ is 4th on the Jammu and Kashmir list (Table 8) and 4th again on the Assam list (Table 9). Critically, and most worryingly, ‘So many killed and displaced by violence’ is first on the Assam list at a high of 79 per cent ‘Very Significant’. As hoped this question is able to bring the researchers attention to potential conflict problems in a state and generate some ‘broad brush’ descriptions of those conflicts. Policing, for example, is clearly a problem in Gujarat and this is undoubtedly a majority view given the relatively small size of the pilot sample. What is needed now is more detailed peace polling in Gujarat and Assam undertaken in collaboration with the relevant community stakeholders to identify any significant community differences and common ground solutions. Finally, equivalent sets of questions were asked in the US and UK using the Google pilot (Table 10). Remembering that this is a ‘Peace Index’ it is good to note that ‘UN resolutions and Human Rights violations’ comes down at 22nd on the UK list and bottom at 25th on the US list. However these results do not provide for minority breakdowns (Black, Hispanic, White, Muslim, Catholic, Protestant etc.) for whom these results could be significantly different in places like Louisiana or Northern Ireland or for the Muslim community in both the US and UK.
9
Table 4. 25 Problems for India rank ordered by per cent ‘Very Significant’
India n=174
Ver
y Si
gnifi
cant
Sign
ifica
nt
Of S
ome
Sign
ifica
nce
Of L
ittle
Sig
nific
ance
Of N
o Si
gnifi
canc
e A
t All
Can
’t Sa
y
1 Poor economy and unemployment 65 21 3 5 6 0 2 Corrupt Government 60 14 6 3 14 2 3 Corruption and criminality in general 56 18 6 6 12 2 4 Low standards of education 51 24 5 10 9 1 5 No justice and reconciliation 49 12 9 6 10 13 6 Lack of food and clean water 48 15 8 13 16 1 7 Poor political leadership 48 15 7 7 16 8 8 Poor health care and infrastructure 47 22 8 7 14 2 9 The actions of the police 44 17 9 9 12 10 10 Lack of free press and media 44 17 8 13 16 2 11 So many killed and displaced by violence 44 17 8 5 18 9 12 Elections not free and fair 44 12 6 13 20 5 13 No political solution to end conflict 43 21 9 5 14 8 14 Lack of democratic accountability 43 20 7 11 12 8 15 No effective negotiations to end conflict 43 20 6 9 12 10 16 Rebel fighters from other countries 39 14 3 9 22 13 17 Discrimination and sectarianism 39 12 6 15 21 6 18 UN resolutions and human rights violations 35 21 12 5 17 10 19 The government's foreign military engagements 32 14 8 6 20 20 20 The military actions of foreign forces 31 14 8 12 21 15 21 Prejudice and personal safety 30 18 13 14 17 8 22 The actions of the army 30 16 10 8 27 10 23 The actions of the rebels 29 16 8 12 24 10 24 Media that insights hatred 26 14 10 12 34 5 25 Lack of language and cultural rights 22 18 16 12 26 6
10
Table 5. 25 Problems for Chhattisgarh rank ordered by per cent ‘Very Significant’
Chhattisgarh n=128
Ver
y Si
gnifi
cant
Sign
ifica
nt
Of S
ome
Sign
ifica
nce
Of L
ittle
Sig
nific
ance
Of N
o Si
gnifi
canc
e A
t All
Can
’t Sa
y
1 Poor economy and unemployment 73 18 2 2 5 1 2 Corrupt Government 66 10 5 7 8 4 3 Corruption and criminality in general 62 28 2 4 3 1 4 Poor political leadership 58 21 6 7 4 5 5 Low standards of education 56 28 4 5 6 2 6 Lack of food and clean water 55 31 6 4 3 2 7 Poor health care and infrastructure 53 37 3 4 2 1 8 Elections not free and fair 53 25 10 4 6 2 9 The actions of the police 50 27 11 5 2 6 10 Rebel fighters from other countries 49 20 5 9 8 9 11 Lack of democratic accountability 48 34 4 7 3 4 12 No justice and reconciliation 48 31 4 9 4 5 13 Lack of free press and media 48 24 8 9 7 3 14 The actions of the rebels 47 23 6 10 9 6 15 No effective negotiations to end conflict 46 36 3 7 2 6 16 So many killed and displaced by violence 45 31 5 10 4 6 17 Discrimination and sectarianism 44 30 4 10 9 3 18 No political solution to end conflict 43 36 6 7 2 6 19 The actions of the army 41 34 5 7 6 7 20 UN resolutions and human rights violations 31 38 8 11 6 7 21 The government's foreign military engagements 30 29 8 10 11 13 22 Prejudice and personal safety 29 41 7 12 7 4 23 Media that insights hatred 28 22 12 10 25 3 24 Lack of language and cultural rights 25 31 16 17 8 3 25 The military actions of foreign forces 23 26 10 13 17 10
11
Table 6. 25 Problems for Manipur rank ordered by per cent ‘Very Significant’
Manipur n=132
Ver
y Si
gnifi
cant
Sign
ifica
nt
Of S
ome
Sign
ifica
nce
Of L
ittle
Sig
nific
ance
Of N
o Si
gnifi
canc
e A
t All
Can
’t Sa
y
1 Poor economy and unemployment 63 23 1 5 8 2 2 Corrupt Government 57 16 8 5 7 8 3 Corruption and criminality in general 55 21 8 6 5 6 4 Poor political leadership 53 17 7 5 9 10 5 Elections not free and fair 52 16 9 6 8 8 6 So many killed and displaced by violence 52 14 8 7 8 11 7 Lack of food and clean water 51 14 12 11 7 5 8 The actions of the rebels 48 12 9 9 8 14 9 UN resolutions and human rights violations 47 17 8 9 7 12 10 No political solution to end conflict 46 20 10 9 5 11 11 The actions of the police 46 17 11 6 8 13 12 No justice and reconciliation 46 13 13 6 7 15 13 Lack of free press and media 43 21 10 9 11 7 14 Lack of democratic accountability 43 21 13 7 7 10 15 Low standards of education 41 17 8 14 16 3 16 Poor health care and infrastructure 40 24 11 11 10 5 17 No effective negotiations to end conflict 40 20 11 12 5 13 18 Prejudice and personal safety 39 24 11 8 10 8 19 The actions of the army 34 18 10 11 13 14 20 Discrimination and sectarianism 30 18 17 10 17 8 21 Lack of language and cultural rights 26 21 14 12 19 9 22 Rebel fighters from other countries 26 5 8 19 25 17 23 Media that insights hatred 20 17 11 22 22 8 24 The military actions of foreign forces 17 8 8 8 41 17 25 The government's foreign military engagements 12 13 15 10 32 18
12
Table 7. 25 Problems for Gujarat rank ordered by per cent ‘Very Significant’
Gujarat n=62
Ver
y Si
gnifi
cant
Sign
ifica
nt
Of S
ome
Sign
ifica
nce
Of L
ittle
Sig
nific
ance
Of N
o Si
gnifi
canc
e A
t All
Can
’t Sa
y
1 Corruption and criminality in general 58 8 7 7 19 2 2 No effective negotiations to end conflict 50 8 10 3 18 11 3 The actions of the police 50 7 3 7 21 13 4 Low standards of education 47 19 7 7 21 0 5 Poor political leadership 45 11 3 5 24 11 6 Rebel fighters from other countries 45 15 5 5 11 19 7 Poor economy and unemployment 44 19 5 0 32 0 8 Corrupt Government 44 10 11 5 27 3 9 Lack of democratic accountability 44 13 11 8 19 5 10 No political solution to end conflict 44 13 7 8 18 11 11 No justice and reconciliation 44 11 8 8 15 15 12 Lack of food and clean water 40 18 5 2 36 0 13 The actions of the rebels 40 15 3 7 19 16 14 Lack of free press and media 39 16 5 13 24 3 15 Discrimination and sectarianism 39 10 5 16 24 7 16 Poor health care and infrastructure 36 11 11 13 26 3 17 UN resolutions and human rights violations 34 11 7 13 23 13 18 The actions of the army 34 13 3 2 32 16 19 Media that insights hatred 32 11 5 8 40 3 20 Elections not free and fair 32 23 8 8 24 5 21 Prejudice and personal safety 32 21 5 10 23 10 22 The military actions of foreign forces 32 16 8 5 16 23 23 The government’s foreign military engagements 32 15 7 5 19 23 24 Lack of language and cultural rights 19 19 8 19 24 10 25 So many killed and displaced by violence 6 13 9 4 55 15
13
Table 8. 25 Problems for Jammu & Kashmir (J & K) rank ordered by per cent ‘Very Significant’
J & K n=57
Ver
y Si
gnifi
cant
Sign
ifica
nt
Of S
ome
Sign
ifica
nce
Of L
ittle
Sig
nific
ance
Of N
o Si
gnifi
canc
e A
t All
Can
’t Sa
y
1 Corrupt Government 74 5 2 4 7 9 2 Poor economy and unemployment 72 12 2 5 7 2 3 Corruption and criminality in general 60 16 4 9 9 4 4 No political solution to end conflict 60 16 4 2 12 7 5 So many killed and displaced by violence 60 7 2 7 18 7 6 Lack of democratic accountability 56 11 5 12 9 7 7 Poor political leadership 54 23 4 2 11 7 8 Low standards of education 53 14 12 11 9 2 9 Elections not free and fair 53 12 4 5 21 5 10 No effective negotiations to end conflict 53 26 2 0 11 9 11 Rebel fighters from other countries 53 12 5 5 11 14 12 Poor health care and infrastructure 49 16 9 11 14 2 13 Lack of free press and media 46 16 14 2 18 5 14 No justice and reconciliation 46 16 2 9 19 9 15 The actions of the police 46 14 4 4 21 12 16 UN resolutions and human rights violations 44 14 7 4 21 11 17 Discrimination and sectarianism 42 11 2 12 30 4 18 The military actions of foreign forces 40 16 2 7 19 16 19 The actions of the rebels 39 19 4 9 19 11 20 Lack of food and clean water 37 14 7 12 28 2 21 Media that insights hatred 35 12 5 7 33 7 22 The actions of the army 33 18 5 2 32 11 23 Prejudice and personal safety 32 21 7 12 23 5 24 Lack of language and cultural rights 32 19 9 7 28 5 25 The government’s foreign military engagements 18 21 11 7 25 19
14
Table 9. 25 Problems for Assam rank ordered by per cent ‘Very Significant’
Assam n=124
Ver
y Si
gnifi
cant
Sign
ifica
nt
Of S
ome
Sign
ifica
nce
Of L
ittle
Sig
nific
ance
Of N
o Si
gnifi
canc
e A
t All
Can
’t Sa
y
1 So many killed and displaced by violence 79 4 4 2 2 8 2 Poor economy and unemployment 78 11 2 4 2 3 3 Corruption and criminality in general 78 8 2 2 3 6 4 No political solution to end conflict 75 5 8 2 2 7 5 Corrupt Government 73 6 5 4 5 7 6 No effective negotiations to end conflict 70 9 5 4 4 8 7 UN resolutions and human rights violations 69 11 4 6 2 7 8 Discrimination and sectarianism 69 4 6 11 3 7 9 No justice and reconciliation 68 11 4 5 2 10 10 Low standards of education 68 9 7 9 5 3 11 Poor health care and infrastructure 65 10 10 11 2 3 12 Lack of food and clean water 65 8 9 10 5 4 13 The actions of the police 61 12 6 10 2 11 14 The actions of the army 60 7 6 14 4 10 15 Prejudice and personal safety 58 11 9 10 3 10 16 Poor political leadership 56 11 11 11 4 8 17 Lack of democratic accountability 55 10 11 11 8 7 18 Elections not free and fair 54 12 13 5 9 7 19 Lack of language and cultural rights 53 15 11 11 4 7 20 Rebel fighters from other countries 52 11 4 9 9 15 21 Lack of free press and media 52 9 11 15 6 8 22 The actions of the rebels 52 8 6 12 7 15 23 Media that insights hatred 50 11 11 11 11 7 24 The military actions of foreign forces 42 9 9 11 15 15 25 The government's foreign military engagements 33 16 9 13 13 16
15
Table 10. When thinking about peace and security which problem (if any) is the most serious in your country? (Note: Only 5 choices were shown randomly to any given respondent in this Google pilot)
US n=1000 (See ‘Note’) Per cent UK n=500 (See ‘Note’) Per
cent 1 Poor economy and unemployment 9.7 Poor economy and unemployment 8.5 2 Poor political leadership 9.4 Poor political leadership 6.3 3 Corrupt Government 7.4 Discrimination and sectarianism 5.8 4 Corruption and criminality in general 6.7 No political solution to end conflict 5.7 5 No political solution to end conflict 6.1 Prejudice and personal safety 5.6 6 Media that insights hatred 5.2 Corruption and criminality in general 5.5 7 Low standards of education 5.1 Media that insights hatred 5.5 8 Lack of democratic accountability 5.1 Corrupt Government 5.4
9 The actions of terrorists and militants 4.6 The government’s foreign military engagements 5.2
10 Poor health care and infrastructure 4.4 Poor health care and infrastructure 4.8 11 No effective negotiations to end conflict 3.8 The actions of terrorists and militants 4.8 12 Prejudice and personal safety 3.6 Low standards of education 4.1 13 Elections not free and fair 3.4 Lack of democratic accountability 3.7 14 No justice and reconciliation 3.2 Lack of free press and media 3.4
15 So many killed and displaced by violence 3.1 So many killed and displaced by
violence 3.2
16 Discrimination and sectarianism 2.8 No justice and reconciliation 3.2
17 The government’s foreign military engagements 2.6 The actions of the police 3.1
18 The actions of the police 2.4 No effective negotiations to end conflict 2.9 19 Lack of food and clean water 2.3 Elections not free and fair 2.4 20 The military actions of foreign forces 2.1 Lack of food and clean water 2.3
21 The actions of rebels and freedom fighters 1.7 The military actions of foreign forces 2.1
22 The actions of the army 1.5 UN resolutions and human rights violations 1.9
23 Lack of language and cultural rights 1.4 The actions of rebels and freedom fighters 1.8
24 Lack of free press and media 1.2 Lack of language and cultural rights 1.7
25 UN resolutions and human rights violations 1.0 The actions of the army 1.1
16
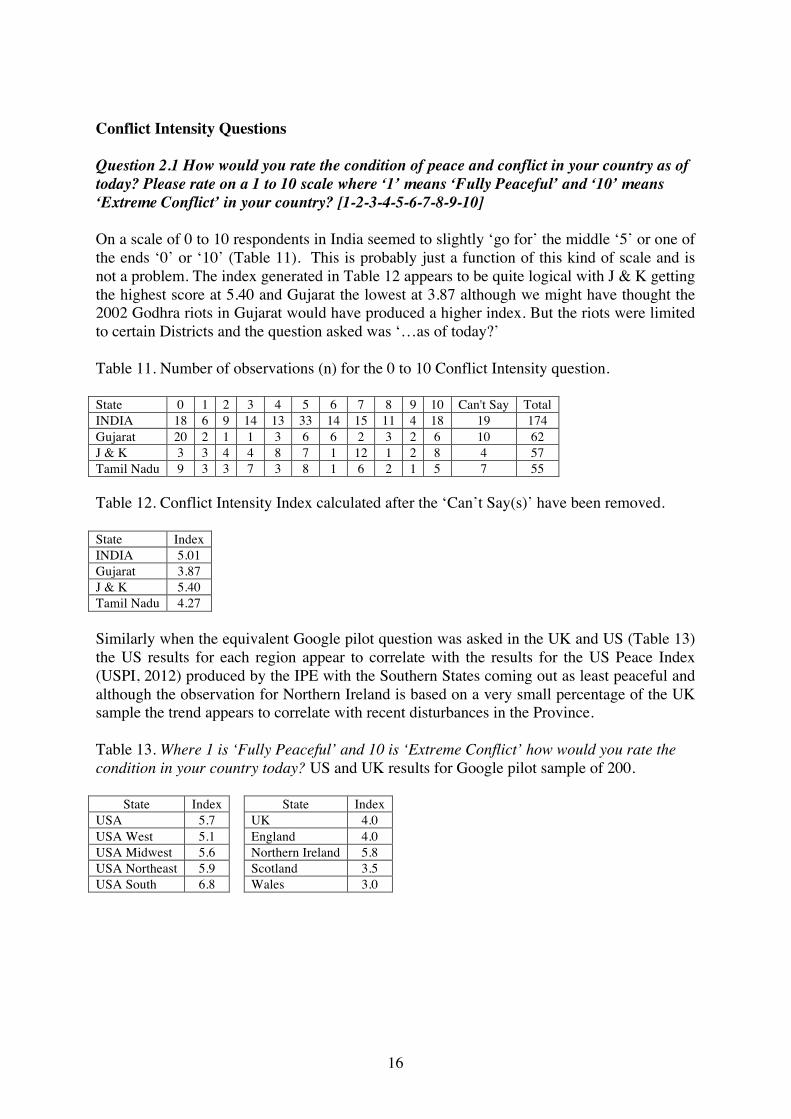
Conflict Intensity Questions Question 2.1 How would you rate the condition of peace and conflict in your country as of today? Please rate on a 1 to 10 scale where ‘1’ means ‘Fully Peaceful’ and ‘10’ means ‘Extreme Conflict’ in your country? [1-2-3-4-5-6-7-8-9-10] On a scale of 0 to 10 respondents in India seemed to slightly ‘go for’ the middle ‘5’ or one of the ends ‘0’ or ‘10’ (Table 11). This is probably just a function of this kind of scale and is not a problem. The index generated in Table 12 appears to be quite logical with J & K getting the highest score at 5.40 and Gujarat the lowest at 3.87 although we might have thought the 2002 Godhra riots in Gujarat would have produced a higher index. But the riots were limited to certain Districts and the question asked was ‘…as of today?’ Table 11. Number of observations (n) for the 0 to 10 Conflict Intensity question. State 0 1 2 3 4 5 6 7 8 9 10 Can't Say Total INDIA 18 6 9 14 13 33 14 15 11 4 18 19 174 Gujarat 20 2 1 1 3 6 6 2 3 2 6 10 62 J & K 3 3 4 4 8 7 1 12 1 2 8 4 57 Tamil Nadu 9 3 3 7 3 8 1 6 2 1 5 7 55 Table 12. Conflict Intensity Index calculated after the ‘Can’t Say(s)’ have been removed. State Index INDIA 5.01 Gujarat 3.87 J & K 5.40 Tamil Nadu 4.27 Similarly when the equivalent Google pilot question was asked in the UK and US (Table 13) the US results for each region appear to correlate with the results for the US Peace Index (USPI, 2012) produced by the IPE with the Southern States coming out as least peaceful and although the observation for Northern Ireland is based on a very small percentage of the UK sample the trend appears to correlate with recent disturbances in the Province. Table 13. Where 1 is ‘Fully Peaceful’ and 10 is ‘Extreme Conflict’ how would you rate the condition in your country today? US and UK results for Google pilot sample of 200.
State Index State Index USA 5.7 UK 4.0 USA West 5.1 England 4.0 USA Midwest 5.6 Northern Ireland 5.8 USA Northeast 5.9 Scotland 3.5 USA South 6.8 Wales 3.0
17
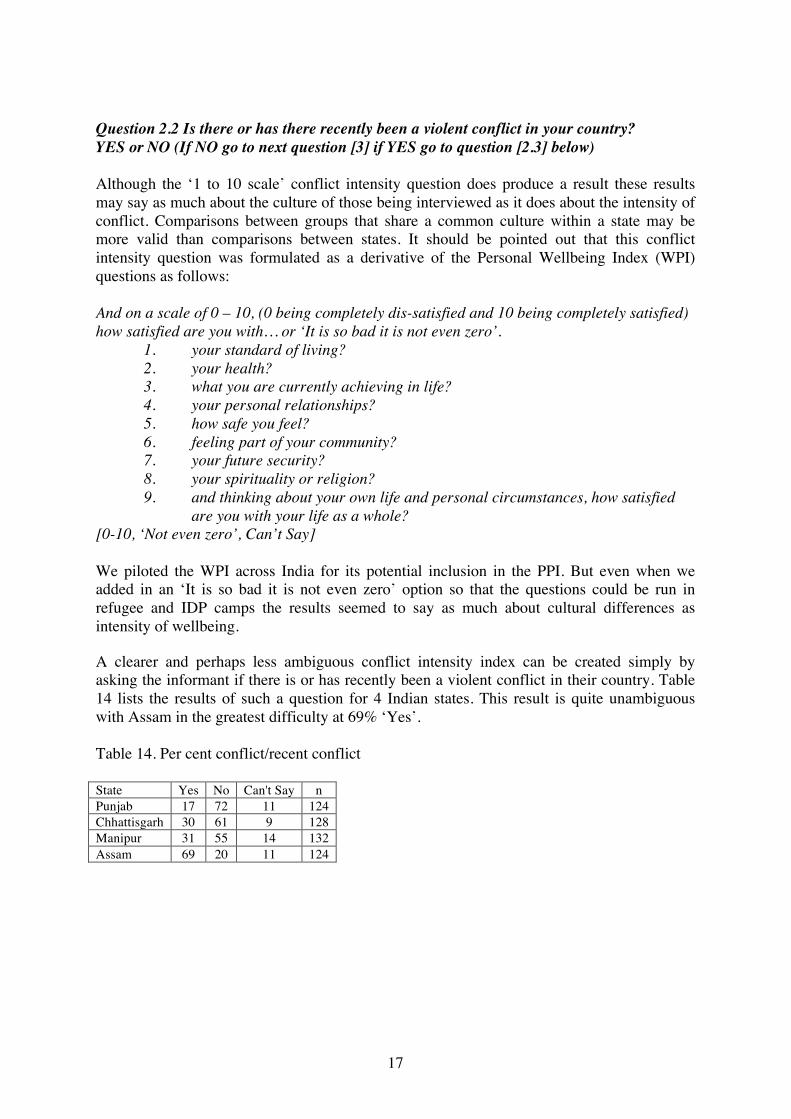
Question 2.2 Is there or has there recently been a violent conflict in your country? YES or NO (If NO go to next question [3] if YES go to question [2.3] below) Although the ‘1 to 10 scale’ conflict intensity question does produce a result these results may say as much about the culture of those being interviewed as it does about the intensity of conflict. Comparisons between groups that share a common culture within a state may be more valid than comparisons between states. It should be pointed out that this conflict intensity question was formulated as a derivative of the Personal Wellbeing Index (WPI) questions as follows: And on a scale of 0 – 10, (0 being completely dis-satisfied and 10 being completely satisfied) how satisfied are you with… or ‘It is so bad it is not even zero’.
1. your standard of living? 2. your health? 3. what you are currently achieving in life? 4. your personal relationships? 5. how safe you feel? 6. feeling part of your community? 7. your future security? 8. your spirituality or religion? 9. and thinking about your own life and personal circumstances, how satisfied are you with your life as a whole?
[0-10, ‘Not even zero’, Can’t Say] We piloted the WPI across India for its potential inclusion in the PPI. But even when we added in an ‘It is so bad it is not even zero’ option so that the questions could be run in refugee and IDP camps the results seemed to say as much about cultural differences as intensity of wellbeing. A clearer and perhaps less ambiguous conflict intensity index can be created simply by asking the informant if there is or has recently been a violent conflict in their country. Table 14 lists the results of such a question for 4 Indian states. This result is quite unambiguous with Assam in the greatest difficulty at 69% ‘Yes’. Table 14. Per cent conflict/recent conflict State Yes No Can't Say n Punjab 17 72 11 124 Chhattisgarh 30 61 9 128 Manipur 31 55 14 132 Assam 69 20 11 124
18
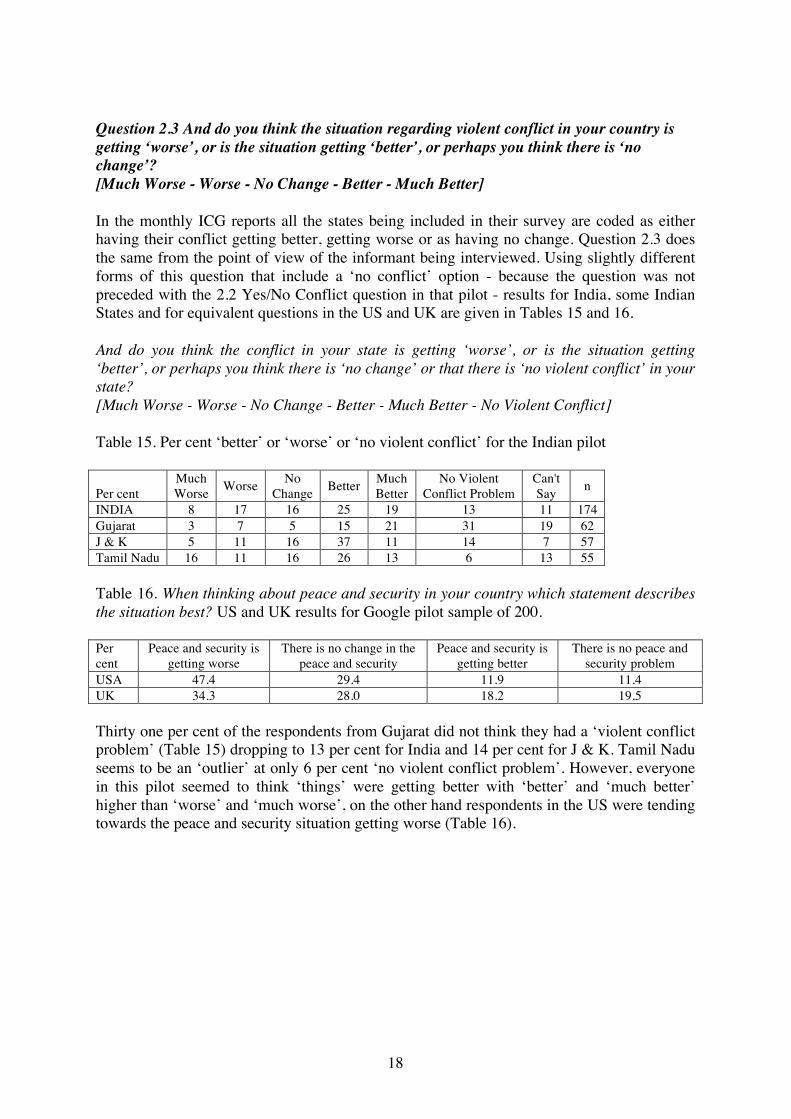
Question 2.3 And do you think the situation regarding violent conflict in your country is getting ‘worse’, or is the situation getting ‘better’, or perhaps you think there is ‘no change’? [Much Worse - Worse - No Change - Better - Much Better] In the monthly ICG reports all the states being included in their survey are coded as either having their conflict getting better, getting worse or as having no change. Question 2.3 does the same from the point of view of the informant being interviewed. Using slightly different forms of this question that include a ‘no conflict’ option - because the question was not preceded with the 2.2 Yes/No Conflict question in that pilot - results for India, some Indian States and for equivalent questions in the US and UK are given in Tables 15 and 16. And do you think the conflict in your state is getting ‘worse’, or is the situation getting ‘better’, or perhaps you think there is ‘no change’ or that there is ‘no violent conflict’ in your state? [Much Worse - Worse - No Change - Better - Much Better - No Violent Conflict] Table 15. Per cent ‘better’ or ‘worse’ or ‘no violent conflict’ for the Indian pilot
Per cent Much Worse Worse No
Change Better Much Better
No Violent Conflict Problem
Can't Say n
INDIA 8 17 16 25 19 13 11 174 Gujarat 3 7 5 15 21 31 19 62 J & K 5 11 16 37 11 14 7 57 Tamil Nadu 16 11 16 26 13 6 13 55 Table 16. When thinking about peace and security in your country which statement describes the situation best? US and UK results for Google pilot sample of 200. Per cent
Peace and security is getting worse
There is no change in the peace and security
Peace and security is getting better
There is no peace and security problem
USA 47.4 29.4 11.9 11.4 UK 34.3 28.0 18.2 19.5 Thirty one per cent of the respondents from Gujarat did not think they had a ‘violent conflict problem’ (Table 15) dropping to 13 per cent for India and 14 per cent for J & K. Tamil Nadu seems to be an ‘outlier’ at only 6 per cent ‘no violent conflict problem’. However, everyone in this pilot seemed to think ‘things’ were getting better with ‘better’ and ‘much better’ higher than ‘worse’ and ‘much worse’, on the other hand respondents in the US were tending towards the peace and security situation getting worse (Table 16).
19
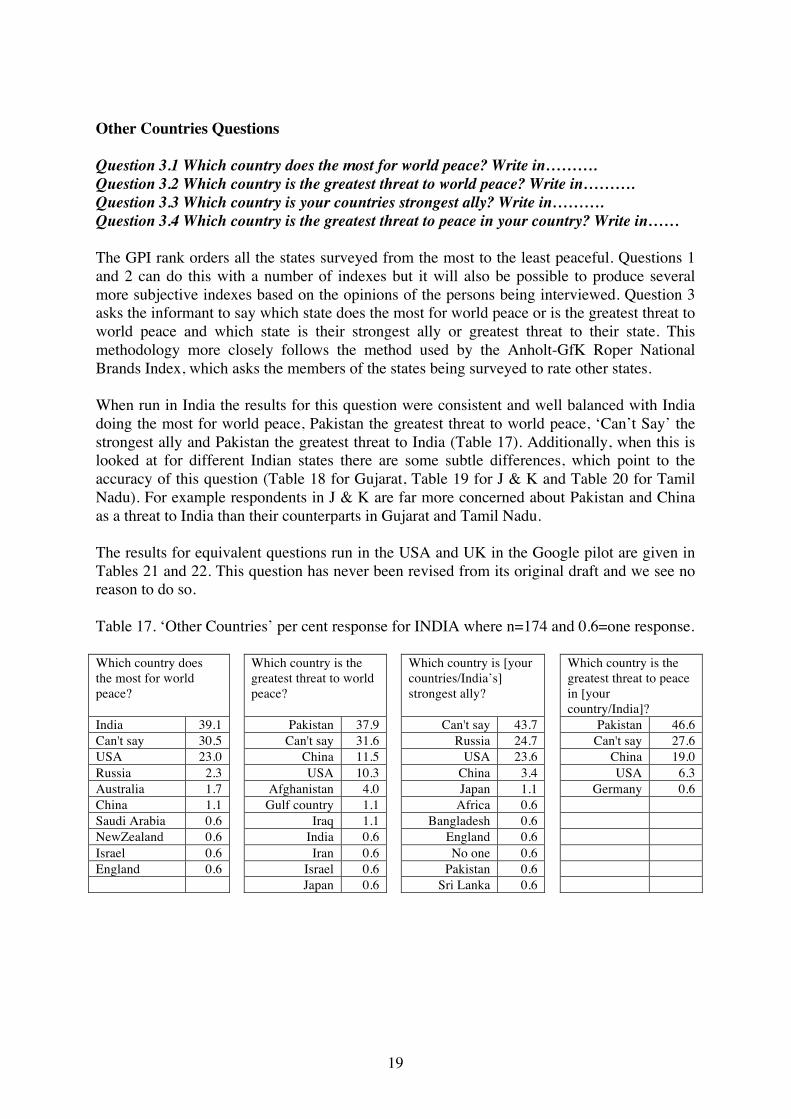
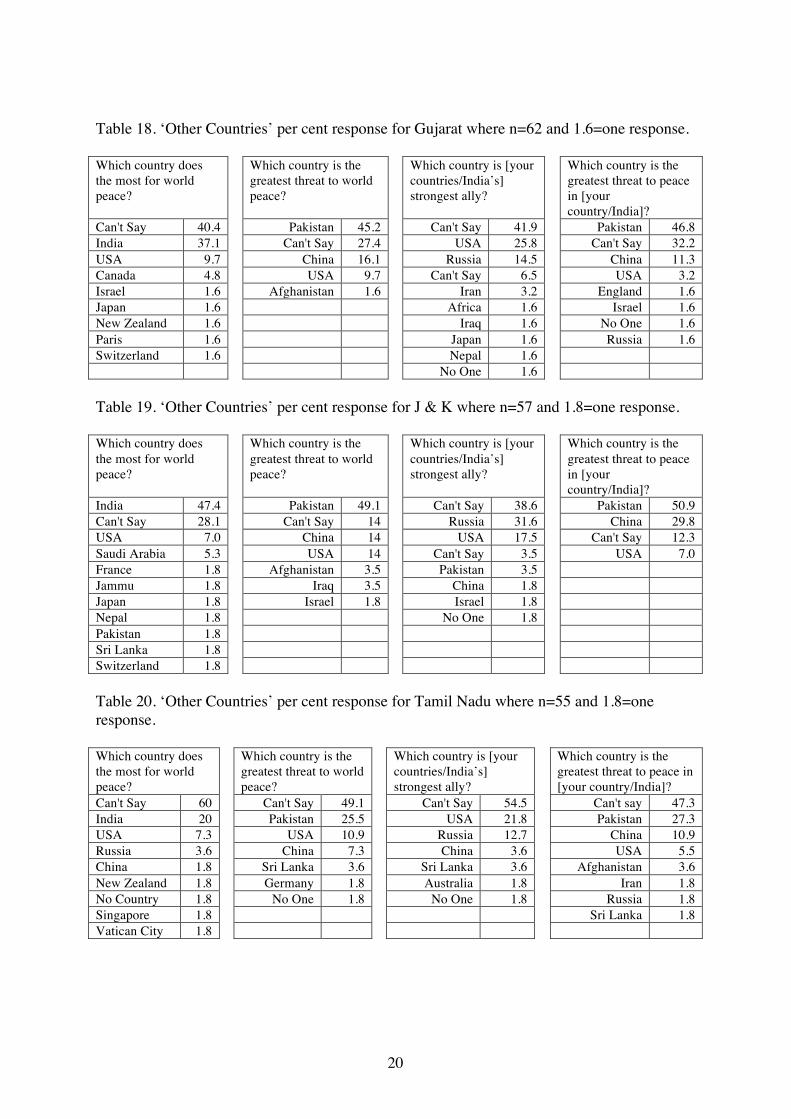
Other Countries Questions Question 3.1 Which country does the most for world peace? Write in………. Question 3.2 Which country is the greatest threat to world peace? Write in………. Question 3.3 Which country is your countries strongest ally? Write in………. Question 3.4 Which country is the greatest threat to peace in your country? Write in…… The GPI rank orders all the states surveyed from the most to the least peaceful. Questions 1 and 2 can do this with a number of indexes but it will also be possible to produce several more subjective indexes based on the opinions of the persons being interviewed. Question 3 asks the informant to say which state does the most for world peace or is the greatest threat to world peace and which state is their strongest ally or greatest threat to their state. This methodology more closely follows the method used by the Anholt-GfK Roper National Brands Index, which asks the members of the states being surveyed to rate other states. When run in India the results for this question were consistent and well balanced with India doing the most for world peace, Pakistan the greatest threat to world peace, ‘Can’t Say’ the strongest ally and Pakistan the greatest threat to India (Table 17). Additionally, when this is looked at for different Indian states there are some subtle differences, which point to the accuracy of this question (Table 18 for Gujarat, Table 19 for J & K and Table 20 for Tamil Nadu). For example respondents in J & K are far more concerned about Pakistan and China as a threat to India than their counterparts in Gujarat and Tamil Nadu. The results for equivalent questions run in the USA and UK in the Google pilot are given in Tables 21 and 22. This question has never been revised from its original draft and we see no reason to do so. Table 17. ‘Other Countries’ per cent response for INDIA where n=174 and 0.6=one response. Which country does the most for world peace?
Which country is the greatest threat to world peace?
Which country is [your countries/India’s] strongest ally?
Which country is the greatest threat to peace in [your country/India]?
India 39.1 Pakistan 37.9 Can't say 43.7 Pakistan 46.6 Can't say 30.5 Can't say 31.6 Russia 24.7 Can't say 27.6 USA 23.0 China 11.5 USA 23.6 China 19.0 Russia 2.3 USA 10.3 China 3.4 USA 6.3 Australia 1.7 Afghanistan 4.0 Japan 1.1 Germany 0.6 China 1.1 Gulf country 1.1 Africa 0.6 Saudi Arabia 0.6 Iraq 1.1 Bangladesh 0.6 NewZealand 0.6 India 0.6 England 0.6 Israel 0.6 Iran 0.6 No one 0.6 England 0.6 Israel 0.6 Pakistan 0.6 Japan 0.6 Sri Lanka 0.6
20
Table 18. ‘Other Countries’ per cent response for Gujarat where n=62 and 1.6=one response. Which country does the most for world peace?
Which country is the greatest threat to world peace?
Which country is [your countries/India’s] strongest ally?
Which country is the greatest threat to peace in [your country/India]?
Can't Say 40.4 Pakistan 45.2 Can't Say 41.9 Pakistan 46.8 India 37.1 Can't Say 27.4 USA 25.8 Can't Say 32.2 USA 9.7 China 16.1 Russia 14.5 China 11.3 Canada 4.8 USA 9.7 Can't Say 6.5 USA 3.2 Israel 1.6 Afghanistan 1.6 Iran 3.2 England 1.6 Japan 1.6 Africa 1.6 Israel 1.6 New Zealand 1.6 Iraq 1.6 No One 1.6 Paris 1.6 Japan 1.6 Russia 1.6 Switzerland 1.6 Nepal 1.6 No One 1.6 Table 19. ‘Other Countries’ per cent response for J & K where n=57 and 1.8=one response. Which country does the most for world peace?
Which country is the greatest threat to world peace?
Which country is [your countries/India’s] strongest ally?
Which country is the greatest threat to peace in [your country/India]?
India 47.4 Pakistan 49.1 Can't Say 38.6 Pakistan 50.9 Can't Say 28.1 Can't Say 14 Russia 31.6 China 29.8 USA 7.0 China 14 USA 17.5 Can't Say 12.3 Saudi Arabia 5.3 USA 14 Can't Say 3.5 USA 7.0 France 1.8 Afghanistan 3.5 Pakistan 3.5 Jammu 1.8 Iraq 3.5 China 1.8 Japan 1.8 Israel 1.8 Israel 1.8 Nepal 1.8 No One 1.8 Pakistan 1.8 Sri Lanka 1.8 Switzerland 1.8 Table 20. ‘Other Countries’ per cent response for Tamil Nadu where n=55 and 1.8=one response. Which country does the most for world peace?
Which country is the greatest threat to world peace?
Which country is [your countries/India’s] strongest ally?
Which country is the greatest threat to peace in [your country/India]?
Can't Say 60 Can't Say 49.1 Can't Say 54.5 Can't say 47.3 India 20 Pakistan 25.5 USA 21.8 Pakistan 27.3 USA 7.3 USA 10.9 Russia 12.7 China 10.9 Russia 3.6 China 7.3 China 3.6 USA 5.5 China 1.8 Sri Lanka 3.6 Sri Lanka 3.6 Afghanistan 3.6 New Zealand 1.8 Germany 1.8 Australia 1.8 Iran 1.8 No Country 1.8 No One 1.8 No One 1.8 Russia 1.8 Singapore 1.8 Sri Lanka 1.8 Vatican City 1.8
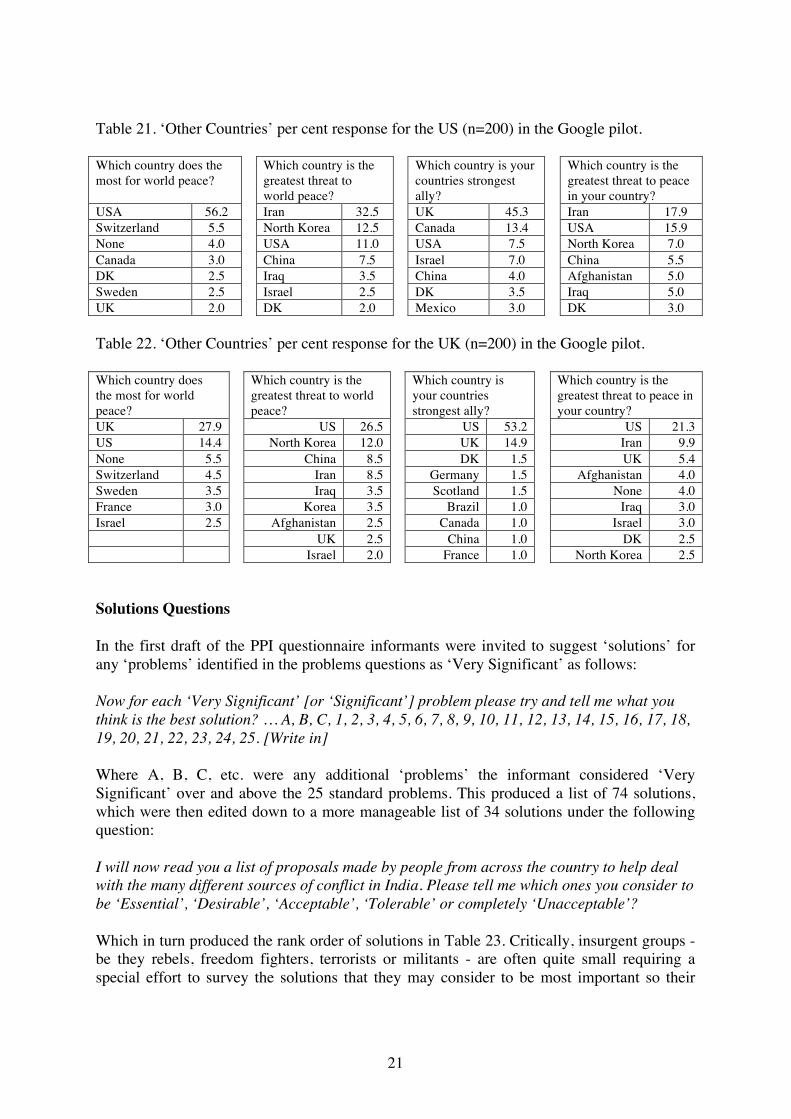
21
Table 21. ‘Other Countries’ per cent response for the US (n=200) in the Google pilot. Which country does the most for world peace?
Which country is the greatest threat to world peace?
Which country is your countries strongest ally?
Which country is the greatest threat to peace in your country?
USA 56.2 Iran 32.5 UK 45.3 Iran 17.9 Switzerland 5.5 North Korea 12.5 Canada 13.4 USA 15.9 None 4.0 USA 11.0 USA 7.5 North Korea 7.0 Canada 3.0 China 7.5 Israel 7.0 China 5.5 DK 2.5 Iraq 3.5 China 4.0 Afghanistan 5.0 Sweden 2.5 Israel 2.5 DK 3.5 Iraq 5.0 UK 2.0 DK 2.0 Mexico 3.0 DK 3.0 Table 22. ‘Other Countries’ per cent response for the UK (n=200) in the Google pilot. Which country does the most for world peace?
Which country is the greatest threat to world peace?
Which country is your countries strongest ally?
Which country is the greatest threat to peace in your country?
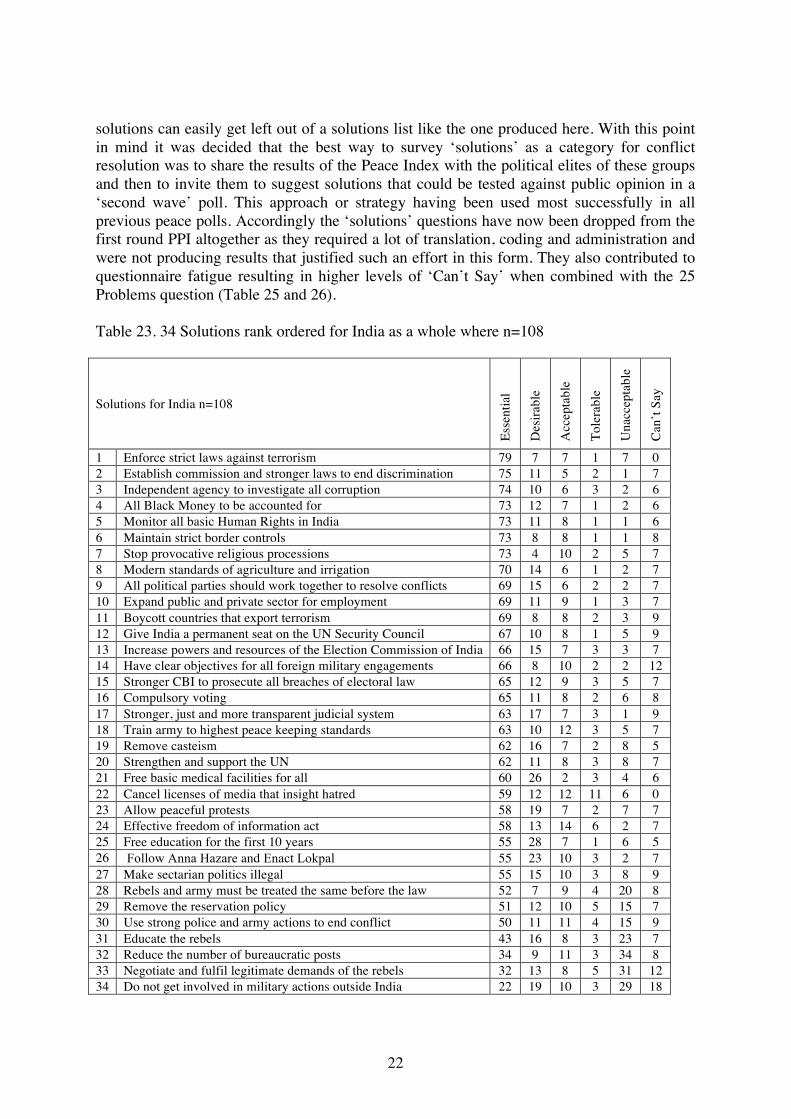
UK 27.9 US 26.5 US 53.2 US 21.3 US 14.4 North Korea 12.0 UK 14.9 Iran 9.9 None 5.5 China 8.5 DK 1.5 UK 5.4 Switzerland 4.5 Iran 8.5 Germany 1.5 Afghanistan 4.0 Sweden 3.5 Iraq 3.5 Scotland 1.5 None 4.0 France 3.0 Korea 3.5 Brazil 1.0 Iraq 3.0 Israel 2.5 Afghanistan 2.5 Canada 1.0 Israel 3.0 UK 2.5 China 1.0 DK 2.5 Israel 2.0 France 1.0 North Korea 2.5 Solutions Questions In the first draft of the PPI questionnaire informants were invited to suggest ‘solutions’ for any ‘problems’ identified in the problems questions as ‘Very Significant’ as follows: Now for each ‘Very Significant’ [or ‘Significant’] problem please try and tell me what you think is the best solution? … A, B, C, 1, 2, 3, 4, 5, 6, 7, 8, 9, 10, 11, 12, 13, 14, 15, 16, 17, 18, 19, 20, 21, 22, 23, 24, 25. [Write in] Where A, B, C, etc. were any additional ‘problems’ the informant considered ‘Very Significant’ over and above the 25 standard problems. This produced a list of 74 solutions, which were then edited down to a more manageable list of 34 solutions under the following question: I will now read you a list of proposals made by people from across the country to help deal with the many different sources of conflict in India. Please tell me which ones you consider to be ‘Essential’, ‘Desirable’, ‘Acceptable’, ‘Tolerable’ or completely ‘Unacceptable’? Which in turn produced the rank order of solutions in Table 23. Critically, insurgent groups - be they rebels, freedom fighters, terrorists or militants - are often quite small requiring a special effort to survey the solutions that they may consider to be most important so their
22
solutions can easily get left out of a solutions list like the one produced here. With this point in mind it was decided that the best way to survey ‘solutions’ as a category for conflict resolution was to share the results of the Peace Index with the political elites of these groups and then to invite them to suggest solutions that could be tested against public opinion in a ‘second wave’ poll. This approach or strategy having been used most successfully in all previous peace polls. Accordingly the ‘solutions’ questions have now been dropped from the first round PPI altogether as they required a lot of translation, coding and administration and were not producing results that justified such an effort in this form. They also contributed to questionnaire fatigue resulting in higher levels of ‘Can’t Say’ when combined with the 25 Problems question (Table 25 and 26). Table 23. 34 Solutions rank ordered for India as a whole where n=108
Solutions for India n=108
Esse
ntia
l
Des
irabl
e A
ccep
tabl
e
Tole
rabl
e
Una
ccep
tabl
e
Can
’t Sa
y
1 Enforce strict laws against terrorism 79 7 7 1 7 0 2 Establish commission and stronger laws to end discrimination 75 11 5 2 1 7 3 Independent agency to investigate all corruption 74 10 6 3 2 6 4 All Black Money to be accounted for 73 12 7 1 2 6 5 Monitor all basic Human Rights in India 73 11 8 1 1 6 6 Maintain strict border controls 73 8 8 1 1 8 7 Stop provocative religious processions 73 4 10 2 5 7 8 Modern standards of agriculture and irrigation 70 14 6 1 2 7 9 All political parties should work together to resolve conflicts 69 15 6 2 2 7 10 Expand public and private sector for employment 69 11 9 1 3 7 11 Boycott countries that export terrorism 69 8 8 2 3 9 12 Give India a permanent seat on the UN Security Council 67 10 8 1 5 9 13 Increase powers and resources of the Election Commission of India 66 15 7 3 3 7 14 Have clear objectives for all foreign military engagements 66 8 10 2 2 12 15 Stronger CBI to prosecute all breaches of electoral law 65 12 9 3 5 7 16 Compulsory voting 65 11 8 2 6 8 17 Stronger, just and more transparent judicial system 63 17 7 3 1 9 18 Train army to highest peace keeping standards 63 10 12 3 5 7 19 Remove casteism 62 16 7 2 8 5 20 Strengthen and support the UN 62 11 8 3 8 7 21 Free basic medical facilities for all 60 26 2 3 4 6 22 Cancel licenses of media that insight hatred 59 12 12 11 6 0 23 Allow peaceful protests 58 19 7 2 7 7 24 Effective freedom of information act 58 13 14 6 2 7 25 Free education for the first 10 years 55 28 7 1 6 5 26 Follow Anna Hazare and Enact Lokpal 55 23 10 3 2 7 27 Make sectarian politics illegal 55 15 10 3 8 9 28 Rebels and army must be treated the same before the law 52 7 9 4 20 8 29 Remove the reservation policy 51 12 10 5 15 7 30 Use strong police and army actions to end conflict 50 11 11 4 15 9 31 Educate the rebels 43 16 8 3 23 7 32 Reduce the number of bureaucratic posts 34 9 11 3 34 8 33 Negotiate and fulfil legitimate demands of the rebels 32 13 8 5 31 12 34 Do not get involved in military actions outside India 22 19 10 3 29 18
23
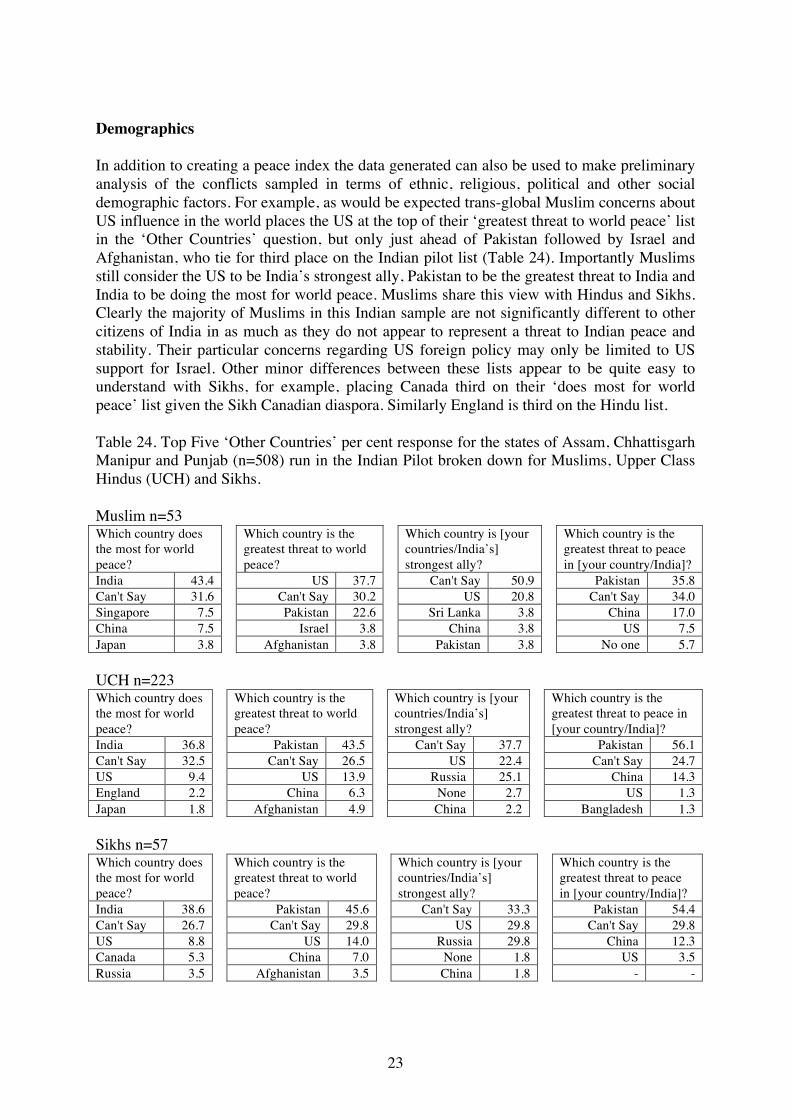
Demographics In addition to creating a peace index the data generated can also be used to make preliminary analysis of the conflicts sampled in terms of ethnic, religious, political and other social demographic factors. For example, as would be expected trans-global Muslim concerns about US influence in the world places the US at the top of their ‘greatest threat to world peace’ list in the ‘Other Countries’ question, but only just ahead of Pakistan followed by Israel and Afghanistan, who tie for third place on the Indian pilot list (Table 24). Importantly Muslims still consider the US to be India’s strongest ally, Pakistan to be the greatest threat to India and India to be doing the most for world peace. Muslims share this view with Hindus and Sikhs. Clearly the majority of Muslims in this Indian sample are not significantly different to other citizens of India in as much as they do not appear to represent a threat to Indian peace and stability. Their particular concerns regarding US foreign policy may only be limited to US support for Israel. Other minor differences between these lists appear to be quite easy to understand with Sikhs, for example, placing Canada third on their ‘does most for world peace’ list given the Sikh Canadian diaspora. Similarly England is third on the Hindu list. Table 24. Top Five ‘Other Countries’ per cent response for the states of Assam, Chhattisgarh Manipur and Punjab (n=508) run in the Indian Pilot broken down for Muslims, Upper Class Hindus (UCH) and Sikhs. Muslim n=53 Which country does the most for world peace?
Which country is the greatest threat to world peace?
Which country is [your countries/India’s] strongest ally?
Which country is the greatest threat to peace in [your country/India]?
India 43.4 US 37.7 Can't Say 50.9 Pakistan 35.8 Can't Say 31.6 Can't Say 30.2 US 20.8 Can't Say 34.0 Singapore 7.5 Pakistan 22.6 Sri Lanka 3.8 China 17.0 China 7.5 Israel 3.8 China 3.8 US 7.5 Japan 3.8 Afghanistan 3.8 Pakistan 3.8 No one 5.7 UCH n=223 Which country does the most for world peace?
Which country is the greatest threat to world peace?
Which country is [your countries/India’s] strongest ally?
Which country is the greatest threat to peace in [your country/India]?
India 36.8 Pakistan 43.5 Can't Say 37.7 Pakistan 56.1 Can't Say 32.5 Can't Say 26.5 US 22.4 Can't Say 24.7 US 9.4 US 13.9 Russia 25.1 China 14.3 England 2.2 China 6.3 None 2.7 US 1.3 Japan 1.8 Afghanistan 4.9 China 2.2 Bangladesh 1.3 Sikhs n=57 Which country does the most for world peace?
Which country is the greatest threat to world peace?
Which country is [your countries/India’s] strongest ally?
Which country is the greatest threat to peace in [your country/India]?
India 38.6 Pakistan 45.6 Can't Say 33.3 Pakistan 54.4 Can't Say 26.7 Can't Say 29.8 US 29.8 Can't Say 29.8 US 8.8 US 14.0 Russia 29.8 China 12.3 Canada 5.3 China 7.0 None 1.8 US 3.5 Russia 3.5 Afghanistan 3.5 China 1.8 - -
24
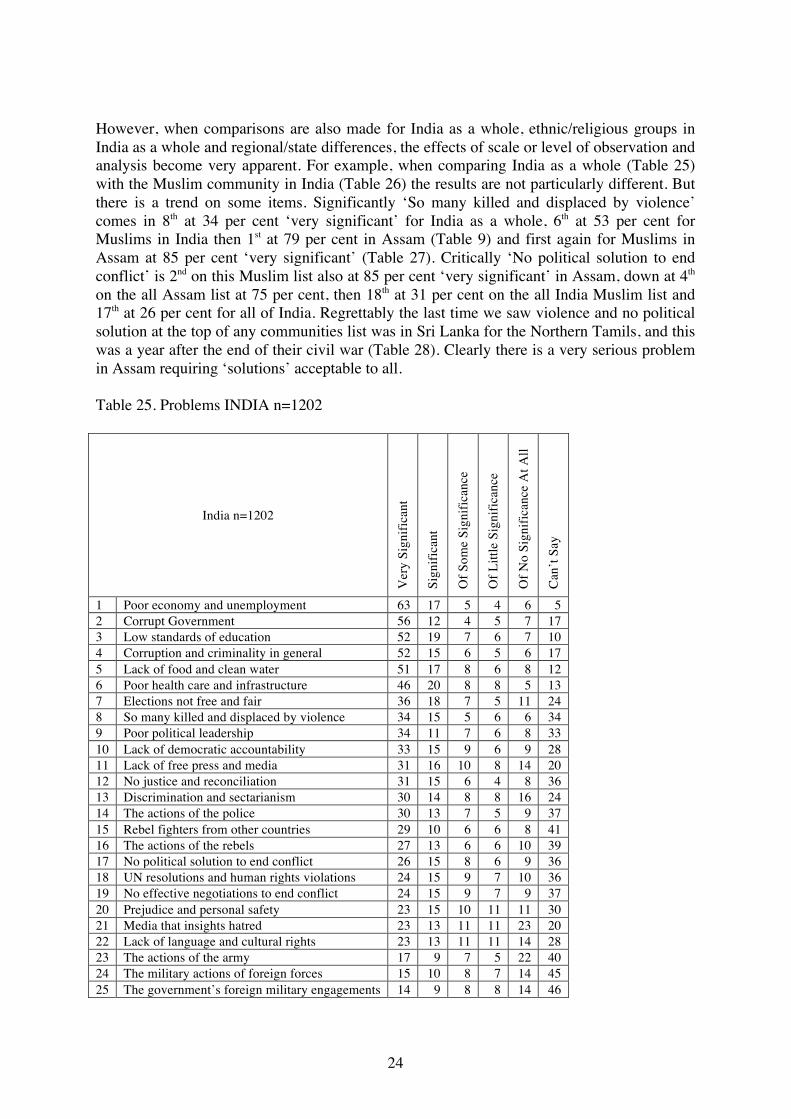
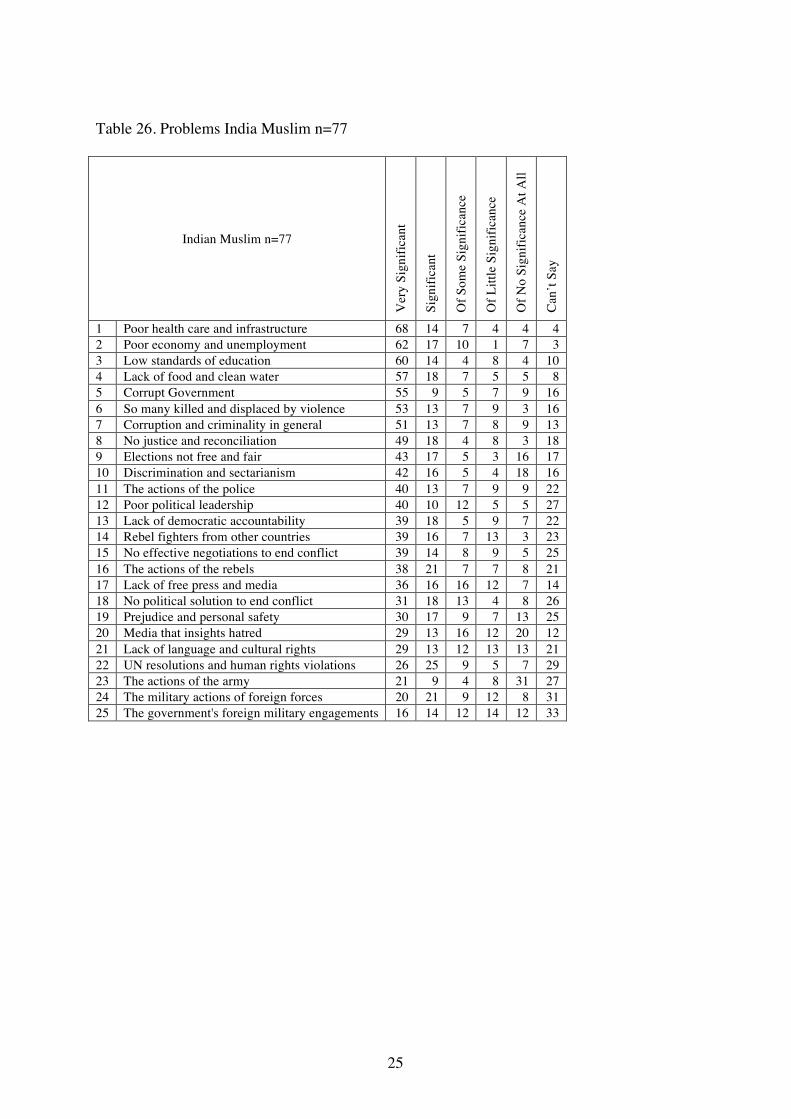
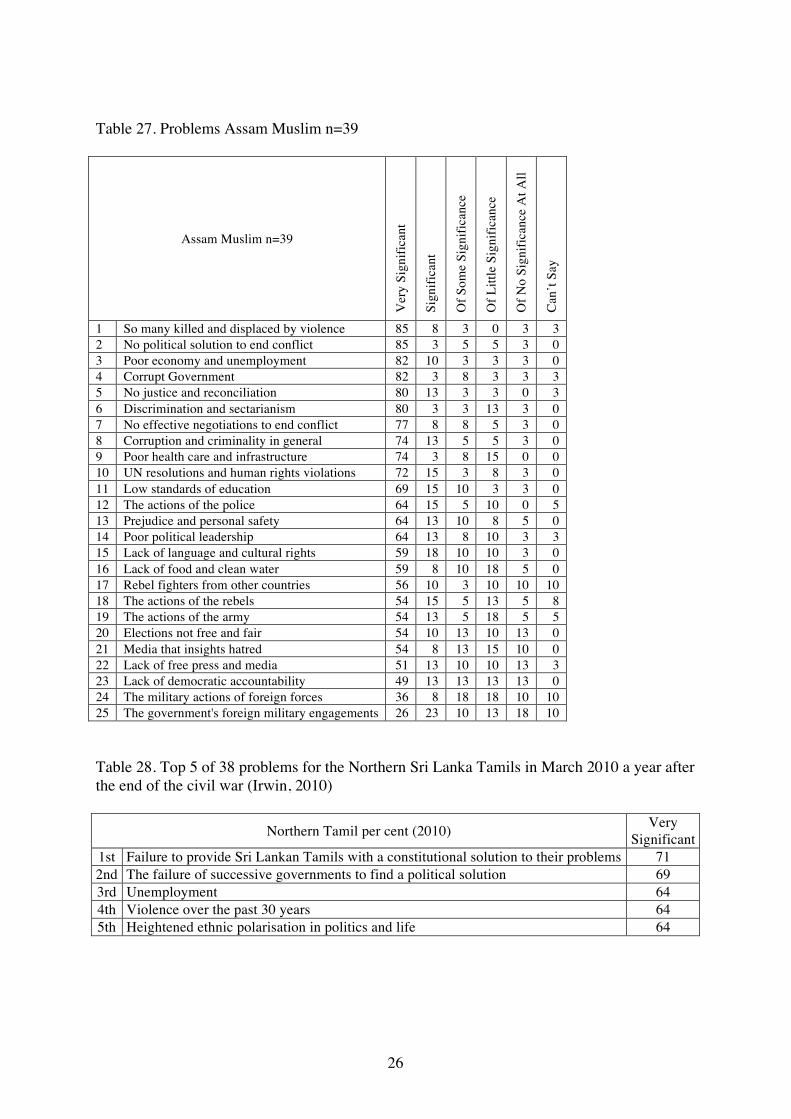
However, when comparisons are also made for India as a whole, ethnic/religious groups in India as a whole and regional/state differences, the effects of scale or level of observation and analysis become very apparent. For example, when comparing India as a whole (Table 25) with the Muslim community in India (Table 26) the results are not particularly different. But there is a trend on some items. Significantly ‘So many killed and displaced by violence’ comes in 8th at 34 per cent ‘very significant’ for India as a whole, 6th at 53 per cent for Muslims in India then 1st at 79 per cent in Assam (Table 9) and first again for Muslims in Assam at 85 per cent ‘very significant’ (Table 27). Critically ‘No political solution to end conflict’ is 2nd on this Muslim list also at 85 per cent ‘very significant’ in Assam, down at 4th on the all Assam list at 75 per cent, then 18th at 31 per cent on the all India Muslim list and 17th at 26 per cent for all of India. Regrettably the last time we saw violence and no political solution at the top of any communities list was in Sri Lanka for the Northern Tamils, and this was a year after the end of their civil war (Table 28). Clearly there is a very serious problem in Assam requiring ‘solutions’ acceptable to all. Table 25. Problems INDIA n=1202
India n=1202
Ver
y Si
gnifi
cant
Sign
ifica
nt
Of S
ome
Sign
ifica
nce
Of L
ittle
Sig
nific
ance
Of N
o Si
gnifi
canc
e A
t All
Can
’t Sa
y
1 Poor economy and unemployment 63 17 5 4 6 5 2 Corrupt Government 56 12 4 5 7 17 3 Low standards of education 52 19 7 6 7 10 4 Corruption and criminality in general 52 15 6 5 6 17 5 Lack of food and clean water 51 17 8 6 8 12 6 Poor health care and infrastructure 46 20 8 8 5 13 7 Elections not free and fair 36 18 7 5 11 24 8 So many killed and displaced by violence 34 15 5 6 6 34 9 Poor political leadership 34 11 7 6 8 33 10 Lack of democratic accountability 33 15 9 6 9 28 11 Lack of free press and media 31 16 10 8 14 20 12 No justice and reconciliation 31 15 6 4 8 36 13 Discrimination and sectarianism 30 14 8 8 16 24 14 The actions of the police 30 13 7 5 9 37 15 Rebel fighters from other countries 29 10 6 6 8 41 16 The actions of the rebels 27 13 6 6 10 39 17 No political solution to end conflict 26 15 8 6 9 36 18 UN resolutions and human rights violations 24 15 9 7 10 36 19 No effective negotiations to end conflict 24 15 9 7 9 37 20 Prejudice and personal safety 23 15 10 11 11 30 21 Media that insights hatred 23 13 11 11 23 20 22 Lack of language and cultural rights 23 13 11 11 14 28 23 The actions of the army 17 9 7 5 22 40 24 The military actions of foreign forces 15 10 8 7 14 45 25 The government’s foreign military engagements 14 9 8 8 14 46
25
Table 26. Problems India Muslim n=77
Indian Muslim n=77
Ver
y Si
gnifi
cant
Sign
ifica
nt
Of S
ome
Sign
ifica
nce
Of L
ittle
Sig
nific
ance
Of N
o Si
gnifi
canc
e A
t All
Can
’t Sa
y
1 Poor health care and infrastructure 68 14 7 4 4 4 2 Poor economy and unemployment 62 17 10 1 7 3 3 Low standards of education 60 14 4 8 4 10 4 Lack of food and clean water 57 18 7 5 5 8 5 Corrupt Government 55 9 5 7 9 16 6 So many killed and displaced by violence 53 13 7 9 3 16 7 Corruption and criminality in general 51 13 7 8 9 13 8 No justice and reconciliation 49 18 4 8 3 18 9 Elections not free and fair 43 17 5 3 16 17 10 Discrimination and sectarianism 42 16 5 4 18 16 11 The actions of the police 40 13 7 9 9 22 12 Poor political leadership 40 10 12 5 5 27 13 Lack of democratic accountability 39 18 5 9 7 22 14 Rebel fighters from other countries 39 16 7 13 3 23 15 No effective negotiations to end conflict 39 14 8 9 5 25 16 The actions of the rebels 38 21 7 7 8 21 17 Lack of free press and media 36 16 16 12 7 14 18 No political solution to end conflict 31 18 13 4 8 26 19 Prejudice and personal safety 30 17 9 7 13 25 20 Media that insights hatred 29 13 16 12 20 12 21 Lack of language and cultural rights 29 13 12 13 13 21 22 UN resolutions and human rights violations 26 25 9 5 7 29 23 The actions of the army 21 9 4 8 31 27 24 The military actions of foreign forces 20 21 9 12 8 31 25 The government's foreign military engagements 16 14 12 14 12 33
26
Table 27. Problems Assam Muslim n=39
Assam Muslim n=39
Ver
y Si
gnifi
cant
Sign
ifica
nt
Of S
ome
Sign
ifica
nce
Of L
ittle
Sig
nific
ance
Of N
o Si
gnifi
canc
e A
t All
Can
’t Sa
y
1 So many killed and displaced by violence 85 8 3 0 3 3 2 No political solution to end conflict 85 3 5 5 3 0 3 Poor economy and unemployment 82 10 3 3 3 0 4 Corrupt Government 82 3 8 3 3 3 5 No justice and reconciliation 80 13 3 3 0 3 6 Discrimination and sectarianism 80 3 3 13 3 0 7 No effective negotiations to end conflict 77 8 8 5 3 0 8 Corruption and criminality in general 74 13 5 5 3 0 9 Poor health care and infrastructure 74 3 8 15 0 0 10 UN resolutions and human rights violations 72 15 3 8 3 0 11 Low standards of education 69 15 10 3 3 0 12 The actions of the police 64 15 5 10 0 5 13 Prejudice and personal safety 64 13 10 8 5 0 14 Poor political leadership 64 13 8 10 3 3 15 Lack of language and cultural rights 59 18 10 10 3 0 16 Lack of food and clean water 59 8 10 18 5 0 17 Rebel fighters from other countries 56 10 3 10 10 10 18 The actions of the rebels 54 15 5 13 5 8 19 The actions of the army 54 13 5 18 5 5 20 Elections not free and fair 54 10 13 10 13 0 21 Media that insights hatred 54 8 13 15 10 0 22 Lack of free press and media 51 13 10 10 13 3 23 Lack of democratic accountability 49 13 13 13 13 0 24 The military actions of foreign forces 36 8 18 18 10 10 25 The government's foreign military engagements 26 23 10 13 18 10 Table 28. Top 5 of 38 problems for the Northern Sri Lanka Tamils in March 2010 a year after the end of the civil war (Irwin, 2010)
Northern Tamil per cent (2010) Very Significant
1st Failure to provide Sri Lankan Tamils with a constitutional solution to their problems 71 2nd The failure of successive governments to find a political solution 69 3rd Unemployment 64 4th Violence over the past 30 years 64 5th Heightened ethnic polarisation in politics and life 64
27
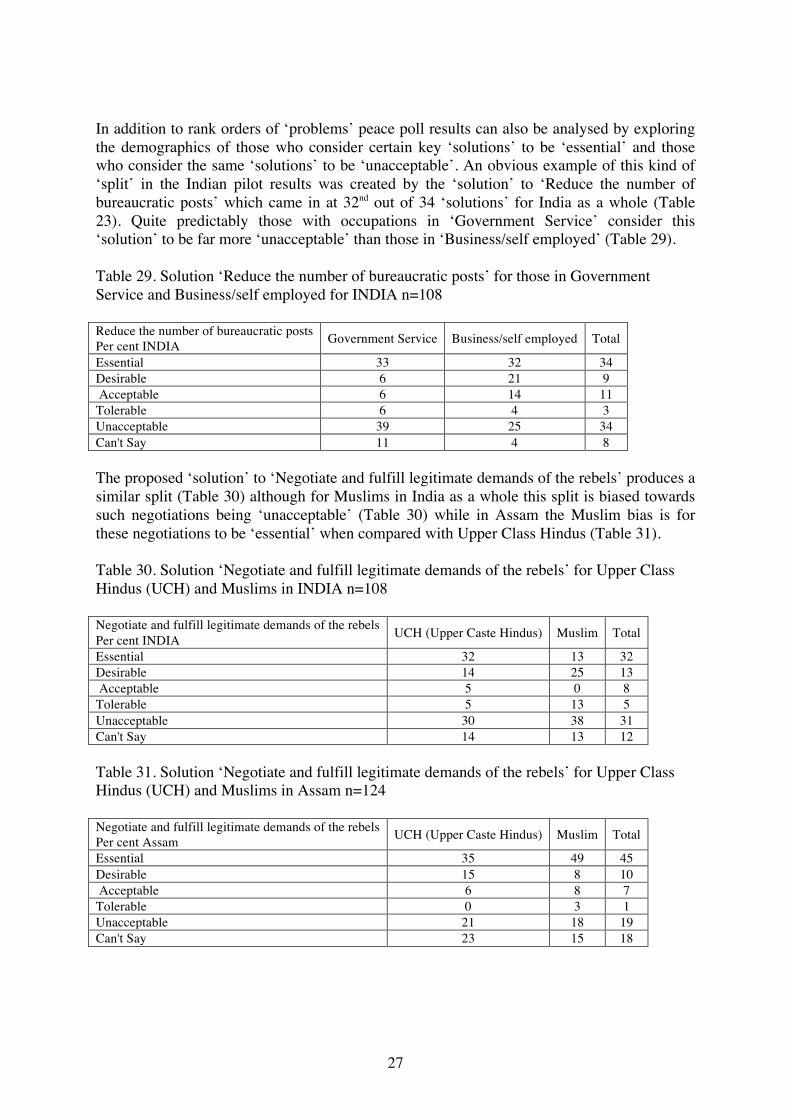
In addition to rank orders of ‘problems’ peace poll results can also be analysed by exploring the demographics of those who consider certain key ‘solutions’ to be ‘essential’ and those who consider the same ‘solutions’ to be ‘unacceptable’. An obvious example of this kind of ‘split’ in the Indian pilot results was created by the ‘solution’ to ‘Reduce the number of bureaucratic posts’ which came in at 32nd out of 34 ‘solutions’ for India as a whole (Table 23). Quite predictably those with occupations in ‘Government Service’ consider this ‘solution’ to be far more ‘unacceptable’ than those in ‘Business/self employed’ (Table 29). Table 29. Solution ‘Reduce the number of bureaucratic posts’ for those in Government Service and Business/self employed for INDIA n=108 Reduce the number of bureaucratic posts Per cent INDIA Government Service Business/self employed Total
Essential 33 32 34 Desirable 6 21 9 Acceptable 6 14 11 Tolerable 6 4 3 Unacceptable 39 25 34 Can't Say 11 4 8 The proposed ‘solution’ to ‘Negotiate and fulfill legitimate demands of the rebels’ produces a similar split (Table 30) although for Muslims in India as a whole this split is biased towards such negotiations being ‘unacceptable’ (Table 30) while in Assam the Muslim bias is for these negotiations to be ‘essential’ when compared with Upper Class Hindus (Table 31). Table 30. Solution ‘Negotiate and fulfill legitimate demands of the rebels’ for Upper Class Hindus (UCH) and Muslims in INDIA n=108 Negotiate and fulfill legitimate demands of the rebels Per cent INDIA UCH (Upper Caste Hindus) Muslim Total
Essential 32 13 32 Desirable 14 25 13 Acceptable 5 0 8 Tolerable 5 13 5 Unacceptable 30 38 31 Can't Say 14 13 12 Table 31. Solution ‘Negotiate and fulfill legitimate demands of the rebels’ for Upper Class Hindus (UCH) and Muslims in Assam n=124 Negotiate and fulfill legitimate demands of the rebels Per cent Assam UCH (Upper Caste Hindus) Muslim Total
Essential 35 49 45 Desirable 15 8 10 Acceptable 6 8 7 Tolerable 0 3 1 Unacceptable 21 18 19 Can't Say 23 15 18
28
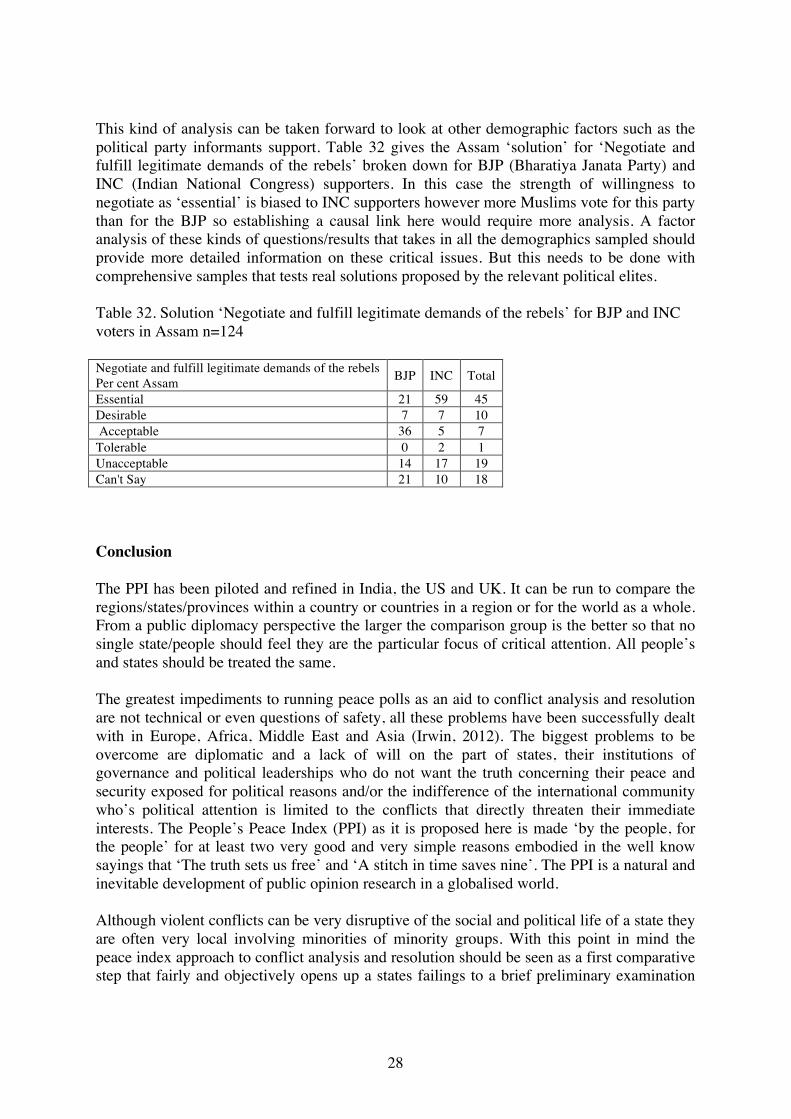
This kind of analysis can be taken forward to look at other demographic factors such as the political party informants support. Table 32 gives the Assam ‘solution’ for ‘Negotiate and fulfill legitimate demands of the rebels’ broken down for BJP (Bharatiya Janata Party) and INC (Indian National Congress) supporters. In this case the strength of willingness to negotiate as ‘essential’ is biased to INC supporters however more Muslims vote for this party than for the BJP so establishing a causal link here would require more analysis. A factor analysis of these kinds of questions/results that takes in all the demographics sampled should provide more detailed information on these critical issues. But this needs to be done with comprehensive samples that tests real solutions proposed by the relevant political elites. Table 32. Solution ‘Negotiate and fulfill legitimate demands of the rebels’ for BJP and INC voters in Assam n=124 Negotiate and fulfill legitimate demands of the rebels Per cent Assam BJP INC Total
Essential 21 59 45 Desirable 7 7 10 Acceptable 36 5 7 Tolerable 0 2 1 Unacceptable 14 17 19 Can't Say 21 10 18 Conclusion The PPI has been piloted and refined in India, the US and UK. It can be run to compare the regions/states/provinces within a country or countries in a region or for the world as a whole. From a public diplomacy perspective the larger the comparison group is the better so that no single state/people should feel they are the particular focus of critical attention. All people’s and states should be treated the same. The greatest impediments to running peace polls as an aid to conflict analysis and resolution are not technical or even questions of safety, all these problems have been successfully dealt with in Europe, Africa, Middle East and Asia (Irwin, 2012). The biggest problems to be overcome are diplomatic and a lack of will on the part of states, their institutions of governance and political leaderships who do not want the truth concerning their peace and security exposed for political reasons and/or the indifference of the international community who’s political attention is limited to the conflicts that directly threaten their immediate interests. The People’s Peace Index (PPI) as it is proposed here is made ‘by the people, for the people’ for at least two very good and very simple reasons embodied in the well know sayings that ‘The truth sets us free’ and ‘A stitch in time saves nine’. The PPI is a natural and inevitable development of public opinion research in a globalised world. Although violent conflicts can be very disruptive of the social and political life of a state they are often very local involving minorities of minority groups. With this point in mind the peace index approach to conflict analysis and resolution should be seen as a first comparative step that fairly and objectively opens up a states failings to a brief preliminary examination
29
that can lead to more detailed bespoke research as may be required. Most importantly the demographic questions should include nationality, ethnicity, race, religion and language appropriate to the demographics of the state being surveyed. In this way the PPI can be broken down, not only by state, but also by the majority and significant minorities within each state. Clearly it will also be possible to analyze the results transnationally for demographic variables such as religion (Christian, Catholic, Protestant, Muslim, Shia, Sunni etc.) or language (English, Arabic, Chinese etc.) to produce a number of transnational PPIs. The pilots reviewed here are capable of producing a number of indexes. However, one index alone may be misleading so the different sets of questions dealing with ‘Problems’, ‘Conflict Intensity’ and ‘Other Countries’ should be viewed as different methodologies used to address the same core issue. When one method or question or set of questions point to a matter of concern that issue should be ‘flagged up’ for discussion with the relevant stakeholders who should be invited to suggest explanations and propose solutions for testing in a future peace poll. From these pilots Gujarat would appear to be such a case. However, when all the indexes point to the same matter of concern, creating a triangulation of methodologies, then all relevant parties should share that concern and seek remedial action. From these pilots Assam would appear to be such a case. In our view the PPI questionnaire given in the appendix needs little or no revision for use around the world for face-to-face interviews or, as administered in India, RDD by CATI data collection. We think this is particularly true for the open-ended ‘Problems’ question, the ‘Conflict Intensity’ questions and the ‘Other Countries’ questions. The ‘25 Problems’ question should be run as it is for now. However, after a first cycle in a global context it would be as well to review the list adding and deleting items based on frequencies achieved and relevance for effective conflict analysis. Finally the style of the questions should be open to reformatting for different collection techniques on-line and using smart phones to achieve the widest possible penetration of critical minority groups. In-spite of present limitations the Google pilots demonstrate the viability of different question formats and delivery platforms. All that remains now is to get started. This can be done in a number of different ways. Firstly, like the GPI a single sponsor or patron could meet the costs of running the PPI globally on an annual basis. Secondly, like the Anholt-GfK Roper National Brands Index, a global market research company could run and PPI as a ‘lost leader’ in the expectation that it would generate follow up commissions. Thirdly, various regional barometers could run the PPI questions and the results pooled for analysis. Fourthly, A Wiki approach could allow for individual researchers around the world to run the PPI questions in their state and add the results to a central data bank open to registered users. In practice a combination of these various approaches to PPI management is likely to evolve. Most importantly, to assure public confidence in the results and analysis, which will challenge the selfish interests of ethnic entrepreneurs and political spoilers, the PPI should be transparent, open to peer group scrutiny and thus meet the very best international professional standards.
30
References Anholt-GfK Roper National Brands Index available at: http://www.gfkamerica.com/practice_areas/roper_pam/nbi_index/index.en.html Economist Intelligence Unit (EIU) available at: http://www.eiu.com/site_info.asp?info_name=about_eiu Global Peace Index (GPI) available at: http://www.visionofhumanity.org International Crisis Group (ICG) reports available at: http://www.crisisgroup.org/en/publication-type/crisiswatch.aspx Institute for Economics and Peace (IEP) available at: http://economicsandpeace.org Irwin, C. J., The People’s Peace: ‘Pax Populi, Pax Dei’ - How Peace Polls are
Democratizing the Peace Making Process, CreateSpace, Scotts Valley, CA, (2012). Available at: http://www.peacepolls.org/peacepolls/documents/002539.pdf
Irwin, C. J., ‘War and Peace’ and the APRC Proposals, Peacepolls.org, (2010). Irwin, C. J., Public Opinion and the Politics of Peace Research: Northern Ireland, Balkans,
Israel, Palestine, Cyprus, Muslim World and the ‘War on Terror’. WAPOR 58th Annual Conference: Search for a New World Order – the Role of Public Opinion, Cannes, France, September 15-17, (2005).
Irwin, C. J., The People’s Peace Process in Northern Ireland, Palgrave MacMillan,
Basingstoke and New York, (2002). Peace Polls available at: http://www.peacepolls.org/cgi-bin/greeting?instanceID=1 United States Peace Index (USPI) 2012 available at: http://www.visionofhumanity.org/uspeaceindex/
31
Appendix
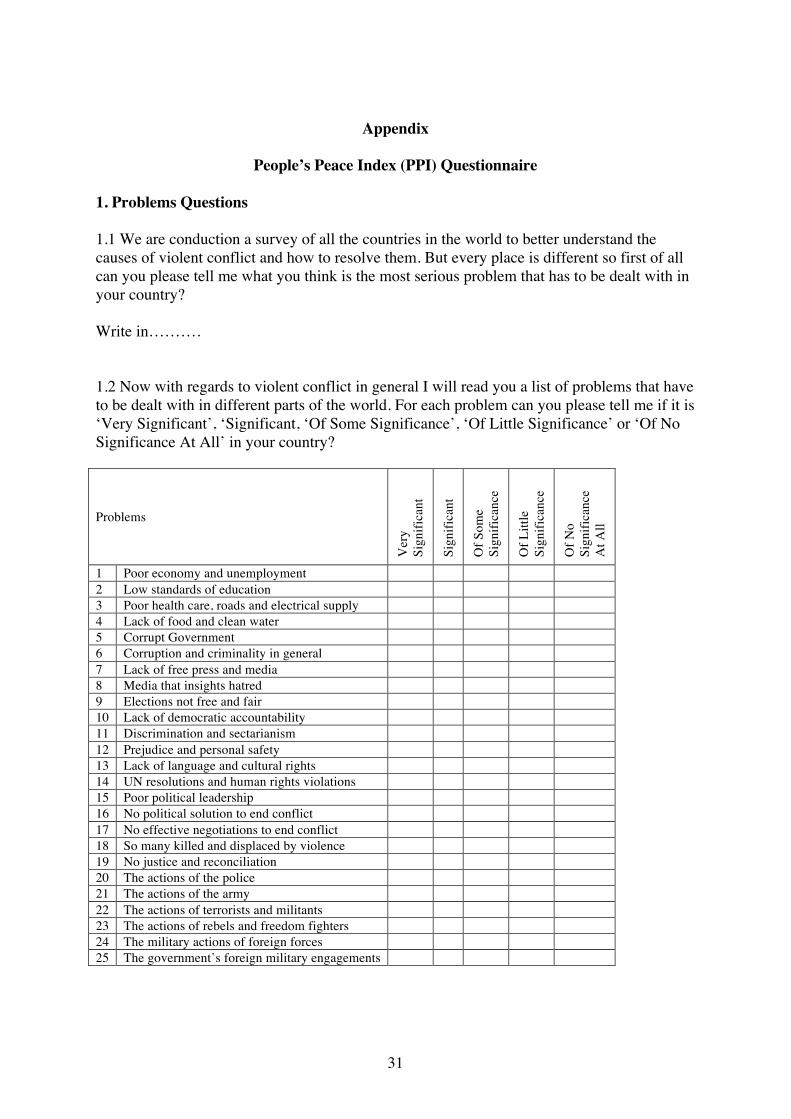
People’s Peace Index (PPI) Questionnaire 1. Problems Questions 1.1 We are conduction a survey of all the countries in the world to better understand the causes of violent conflict and how to resolve them. But every place is different so first of all can you please tell me what you think is the most serious problem that has to be dealt with in your country? Write in………. 1.2 Now with regards to violent conflict in general I will read you a list of problems that have to be dealt with in different parts of the world. For each problem can you please tell me if it is ‘Very Significant’, ‘Significant, ‘Of Some Significance’, ‘Of Little Significance’ or ‘Of No Significance At All’ in your country?
Problems
Ver
y
Sign
ifica
nt
Sign
ifica
nt
Of S
ome
Si
gnifi
canc
e
Of L
ittle
Si
gnifi
canc
e
Of N
o
Sign
ifica
nce
A
t All
1 Poor economy and unemployment 2 Low standards of education 3 Poor health care, roads and electrical supply 4 Lack of food and clean water 5 Corrupt Government 6 Corruption and criminality in general 7 Lack of free press and media 8 Media that insights hatred 9 Elections not free and fair 10 Lack of democratic accountability 11 Discrimination and sectarianism 12 Prejudice and personal safety 13 Lack of language and cultural rights 14 UN resolutions and human rights violations 15 Poor political leadership 16 No political solution to end conflict 17 No effective negotiations to end conflict 18 So many killed and displaced by violence 19 No justice and reconciliation 20 The actions of the police 21 The actions of the army 22 The actions of terrorists and militants 23 The actions of rebels and freedom fighters 24 The military actions of foreign forces 25 The government’s foreign military engagements
32
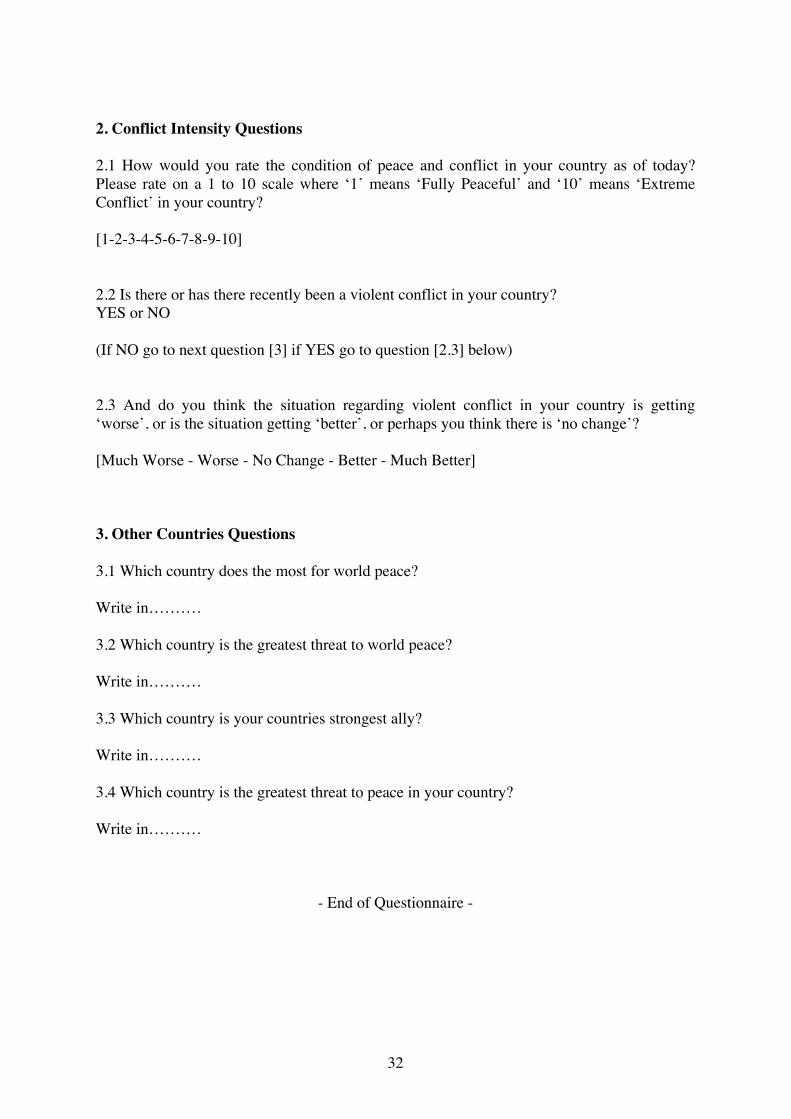
2. Conflict Intensity Questions 2.1 How would you rate the condition of peace and conflict in your country as of today? Please rate on a 1 to 10 scale where ‘1’ means ‘Fully Peaceful’ and ‘10’ means ‘Extreme Conflict’ in your country? [1-2-3-4-5-6-7-8-9-10] 2.2 Is there or has there recently been a violent conflict in your country? YES or NO (If NO go to next question [3] if YES go to question [2.3] below) 2.3 And do you think the situation regarding violent conflict in your country is getting ‘worse’, or is the situation getting ‘better’, or perhaps you think there is ‘no change’? [Much Worse - Worse - No Change - Better - Much Better] 3. Other Countries Questions 3.1 Which country does the most for world peace? Write in………. 3.2 Which country is the greatest threat to world peace? Write in………. 3.3 Which country is your countries strongest ally? Write in………. 3.4 Which country is the greatest threat to peace in your country? Write in……….
- End of Questionnaire -