Embed Size (px)
Citation preview
THE DETERMINATION OF SOIL PROPERTIES IN SITU
by
David B. Campbell w. Ronald Hudson
Research Report Number 89-7
-- ----
Soil Properties as Related to Load-Transfer Characteristics of Drilled Shafts
Research Project 3-5-65-89
conducted for
The Texas Highway Department
in cooperation with the U. S. Department of Transportation
Federal Highway Administration
by the
CENTER FOR HIGHWAY RESEARCH
THE UNIVERSITY OF TEXAS AT AUSTIN
November 1969
The op1n10ns, findings, and conclusions expressed in this publication are those of the authors and not necessarily those of the Federal Highway Administration.
ii
PREFACE
This report is the seventh in a series of reports from Research Project
3-5-65-89 of the Cooperative Highway Research Program. It describes and
discusses three devices used for determining soil properties in situ: the
Menard Pressuremeter, the Texas Highway Department cone penetrometer, and
The University of Texas in situ device.
This report is the product of the combined efforts of many people.
Specific thanks for technical contributions are due James N. Anagnos,
Michael W. O'Neill, John W. Chuang, and Vas ant N. Vijayvergiya. The authors
wish to thank Lymon C. Reese, the project supervisor, for his support and
helpful advice. Preparation and editing of the manuscript were supervised
by Art Frakes and staff.
The Texas Highway Department project contact representatives,
Messrs. Horace Hoy and H. D. Butler, and District 14 personnel have been help
ful and cooperative in the development of the work. Thanks are due them and
the U. S. Bureau of Public Roads who jointly sponsored the work.
November 1969
David B. Campbell
W. Ronald Hudson
iii
LIST OF REPORTS
Report No. 89-1, "Field Testing of Drilled Shafts to Develop Design Methods," by Lymon C. Reese and W. Ronald Hudson, describes the overall approach to the design of drilled shafts based on a series of field and laboratory investigations.
Report No. 89-2, "Measurements of Lateral Earth Pressure in Drilled Shafts, II
by Lymon C. Reese, J. Crozier Brown, and H. H. Dalrymple, describes the development and evaluation of pressure gages to measure lateral-earth pressures on the drilled shaft.
Report No. 89-3, "Studies of Shearing Resistance Between Cement Mortar and Soil," by John W. Chuang and Lymon C. Reese, describes the overall approach to the design of drilled shafts based on field and laboratory investigations.
Report No. 89-4, liThe Nuclear Method of Soil-Moisture Determination at Depth, If by Clarence J. Ehlers, Lymon C. Reese, and James N. Anagnos, describes the use of nuclear equipment for measuring the variations of moisture content at the drilled shaft test sites.
Report No. 89-5, "Load Distribution for a Drilled Shaft in Clay Shale," by Vasant N. Vijayvergiya, W. Ronald Hudson, and Lymon C. Reese, describes the development of instrumentation capable of measuring axial load distribution along a drilled shaft, the development, with the aid of full-scale load testing, of a technique of analysiS of observed data, and the correlation of observed data with the Texas Highway Department cone penetration test.
Report No. 89-6, "Instrumentation for Measurement of Axial Load In Drilled Shafts," by Walter R. Barker and Lymon C. Reese, describes the development and performance of various instrumentation systems used to measure the axial load distribution in field tests of full-scale drilled shafts.
Report No. 89-7, liThe Determination of Soil Properties In Si tu,n by David B. Campbell and W. Ronald Hudson, describes the use of thelMenard Pressuremeter, the Texas Highway Department cone penetrometer, and The UniverSity of Texas in situ device in estimating soil properties in situ and estimating load transfer values obtained from drilled shaft tests.
iv
ABSTRACT
The determination of the mechanical properties of soils as they exist
in nature, free from the disturbances due to sampling and laboratory hand
ling, is a useful and often necessary step toward proper foundation design.
This report discusses three devices used in the field for determining these
properties by testing the soil "in place." They are referred to as in situ
devices. The three discussed here are the Menard Pressuremeter, the Texas
Highway Department cone penetrometer, and The University of Texas in tu
device.
The description and evaluation of each device includes equipment, test
ing procedure, analysis of data, and limitations. Observed data from a
full-scale drilled shaft test are correlated in several ways to show the
effectiveness of each device in predicting load transfer characteristics of
the soil. Correlations with other methods of measuring soil properties are
also included.
Recommendations are made as to further use of each of the three in situ
devices.
KEY WORDS: foundation engineering, drilled shafts, soil testing, clay SOils,
shear strength, frictional resistance.
v
SUMMARY
The determination of soil properties is an essential step to proper
foundation design. It is useful and often necessary to determine the
numerical values of these properties as they exist in nature through the
use of in soil testing.
In this study three methods of
They are
(1) the Menard Pressuremeter,
situ soil testing are examined.
(2) the Texas Highway Department (THD) cone penetration test, and
(3) The University of Texas (UT) in situ device.
The Menard Pressuremeter was not available for field testing, but was studied
by review of prior research. Results obtained from the THO penetrometer are
well correlated with maximum load transfer values obtained from tests of
instrumented drilled shafts. Shearing resistances obtained from field
testing of the UT in situ device do not correlate well with conventional
laboratory test results, with penetration resistance measured by the THO cone
penetrometer or with load transfer data.
vi

IMPLEMENTATION STATEMENT
This study of three in situ devices was undertaken with the hope of
finding a method of measuring shear strengths in the field. These are parti
cularly needed for soils which do not readily lend themselves to undisturbed
sampling methods. Such a measurement tool would have been very useful in
the design of the drilled shaft foundations.
However, as noted in the recommendations, the Menard Pressuremeter
has not been available to The University of Texas personnel for correlation
studies and The University of Texas in situ device in its present form does
not ld reliable results. Therefore, all future effort to measure in situ
shear strengths will be through correlations with the THD cone penetrometer
Which is currently being used by the Texas Highway Departnlent.
vii
TABLE OF CONTENTS
PREFACE
LIST OF REPORTS
ABSTRACT
SUMMARY
IMPLEMENTATION STATEMENT
NOMENCLATURE
CHAPTER 1. INTRODUCTION
CHAPTER 2. MENARD PRESSUREMETER
Operational Concept Equipment Collection of Data •
•
Analysis of Menard Pressuremeter Data Pressuremeter Correlation Limitations v • • •
CHAPTER 3. PENETRATION TESTS
Static Penetration Tests Dynamic Penetration Tests THD Penetration Test.
•
•
•
CHAPTER 4. UNIVERSITY OF TEXAS IN SITU SHEAR TEST DEVICE
Operational Concept Equipment • Testing Procedure Analysis of Data. Limi ta tions
• • • • •
• • • • • •
• •
viii
•
• • • •
• • •
•
• •
iii
iv
v
vi
vii
x
1
4 4 6 7
10 17
19 22 26
31 33 38 39 40

CHAPTER 5. RESULTS OF CORRELATION STUDIES
Situ Device vs. Laboratory Testing Situ Device vs. THD Penetrometer
In Situ Device vs. Load Transfer ••• THD Penetrometer vs. Load Transfer.
CHAPTER 6. CONCLUSIONS AND RECOMMENDATIONS
Conclusions Recommenda ti ons
REFERENCES •
THE AUTHORS
• . . • •
• . .
• • . .
• • • • 0 •
•
•
ix
42 45 47 50
56 57
58
61
Symbol
A
Pf
PL
P 0
R
s
S o
Typical Units
ft2
2 kg/cm
tons
kg/cm 2
kg/cm 2
kg/cm 2
2 kg/cm
blows/ft
2 tons /ft
in.
2 kg/cm
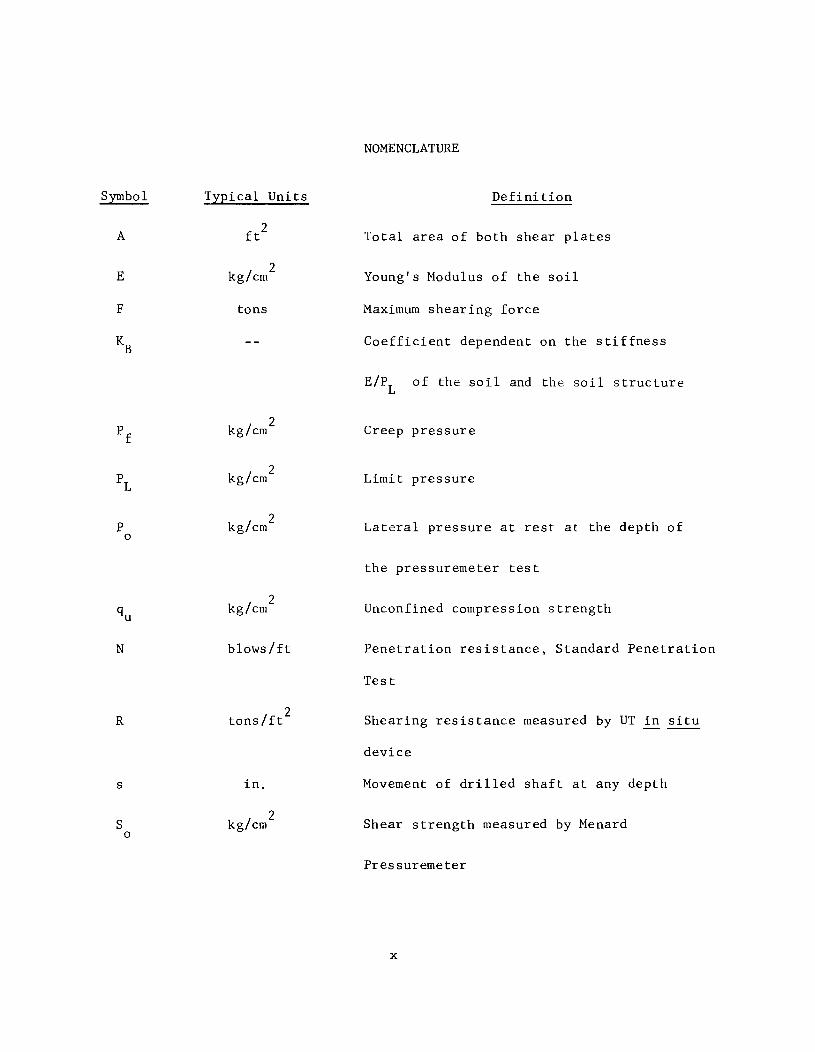
NOMENCLATURE
Defini tion
Total area of both shear plates
Young's Modulus of the soil
Maximum shearing force
Coefficient dependent on the stiffness
E/PL
of the soil and the soil structure
Creep pressure
Limit pressure
Lateral pressure at rest at the depth of
the pressuremeter test
Unconfined compression strength
Penetration resistance, Standard Penetration
Test
Shearing resistance measured by UT in situ
device
Movement of drilled shaft at any depth
Shear strength measured by Menard
Pressuremeter
x

s o
T
in.
2 tons/ft
xi
Maximum settlement of drilled shaft
Load transfer at any depth

CHAPTER I
INTRODUCTION
The application of the principles of soil mechanics in order to achieve
proper foundation design has become increasingly important in recent years.
In addition to the attention given to theory, more and more emphasis is
being placed on improving sampling and testing techniques. As a result,
numerous devices have been developed for taking undisturbed soil samples.
Such samples are desirable because soils as found in the field are
rarely homogeneous; their properties can vary in both the horizontal and
vertical directions. These properties may be radically altered by boring,
sampling, testing, and other handling in the laboratory. As a result of
such alterations, the mechanical properties as determined in the laboratory
may often differ appreciably from the natural properties of the soil.
Furthermore, certain soils as found in nature cannot be sampled satis-
factorily or prepared properly for laboratory testing. These include soils
with a considerable secondary structure, such as fissures, joints, slicken-
sides, and concretions, and those soils which contain rocks and shells of
appreciable size. It is therefore often desirable to test the soil as it
is found in nature without sampling, and in situ soil testing apparatus
becomes important in determining the soil properties.
There are several devices in present use for determining properties
of soil in situ. These include a number of devices designed for use in
1
2
boreholes of various sizes, vane shear apparatus, and a variety of
penetrometers. One such instrument has been developed by Iowa State
University for determining the load-bearing capacity, cohesion, and the
angle of internal friction of a test soil. This device consists of two
diametrically opposed, grooved expansion plates which are expanded by auto-
motive brake cylinders. At the field site the device is lowered into a
test hole. The plates are expanded against the walls of the hole and then
pulled upward, thus shearing the soil in contact with the plates. The
normal force and lifting force are measured separately. The result of the
test is a plot of the relationship between shear strength and normal force.
This device has been found satisfactory for testing homogeneous soft and
medium stiff cohesive material but not for testing mixtures of gravel
and clay.
The vane shear device is widely used for testing soft and medium stiff
cohesive soil. It consists of a four-bladed vane fastened to the bottom of
a vertical rod. This assembly can be pushed into the soil without any
appreciable disturbance of the material. The shear strength is computed
from the applied torque required to turn the assembly.
A direct shear test apparatus has been developed by the Comision
Federal de Electricidad in Mexico for the purpose of investigating the
shear strength of a soil in situ (Ref. 13). The device consists of a flat
circular steel disc onto which blades have been welded. The total shearing
area is approximately 0.5 2
m . After the blades have been forced into the
soil by a normal force, a torsion couple is transmitted to the disc by
means of two steel cables operated by horizontal hydraulic cylinders.
3
This device tests shear strength of the soil in the horizontal direction
only, whereas shear strength in the vertical direction is usually desired.
A variety of penetrometers is used for in situ determination of the
consistency of cohesive materials or the relative density of cohesionless
materials. Further discussion of penetrometers is continued in later
chapters.
The purpose of this report is to discuss and evaluate three available
in situ devices: the Menard Pressuremeter, the Texas Highway Department cone
penetrometer, and The University of Texas in situ device. For each device
the study describes the equipment and testing procedure involved, the
analysis of data obtained, and the limitations of its use. Correlations
between the devices, with conventional laboratory test results, and with
load transfer data measured from field tests of drilled shafts are developed
and analyzed. Conclusions are drawn from these correlations, and recom-
mendations are made concerning the desirability of using each device.
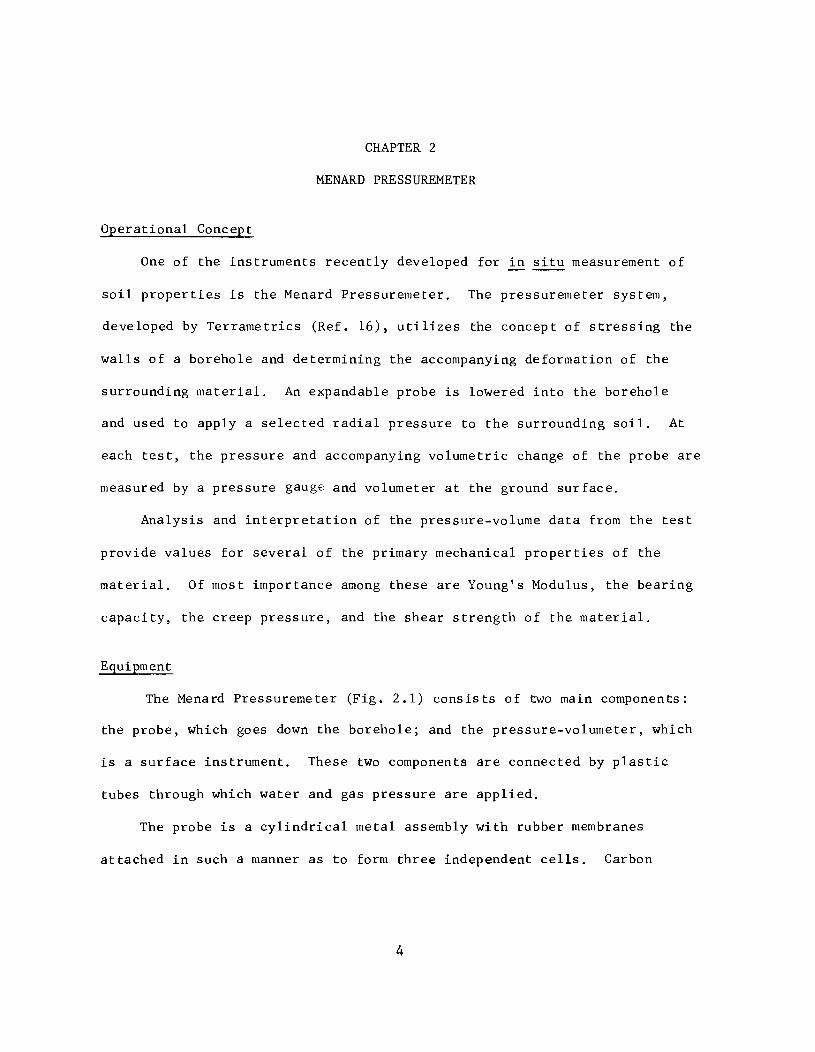
Operational Concept
CHAPTER 2
MENARD PRESSUREMETER
One of the instruments recently developed for in situ measurement of
soil properties is the Menard Pressuremeter. The pressuremeter system,
developed by Terrametrics (Ref. 16), utilizes the concept of stressing the
walls of a borehole and determining the accompanying deformation of the
surrounding material. An expandable probe is lowered into the borehole
and used to apply a selected radial pressure to the surrounding soil. At
each test, the pressure and accompanying volumetric change of the probe are
measured by a pressure gauge and volumeter at the ground surface.
Analysis and interpretation of the pressure-volume data from the test
provide values for several of the primary mechanical properties of the
material. Of most importance among these are Young's Modulus, the bearing
capacity, the creep pressure, and the shear strength of the material.
Equipment
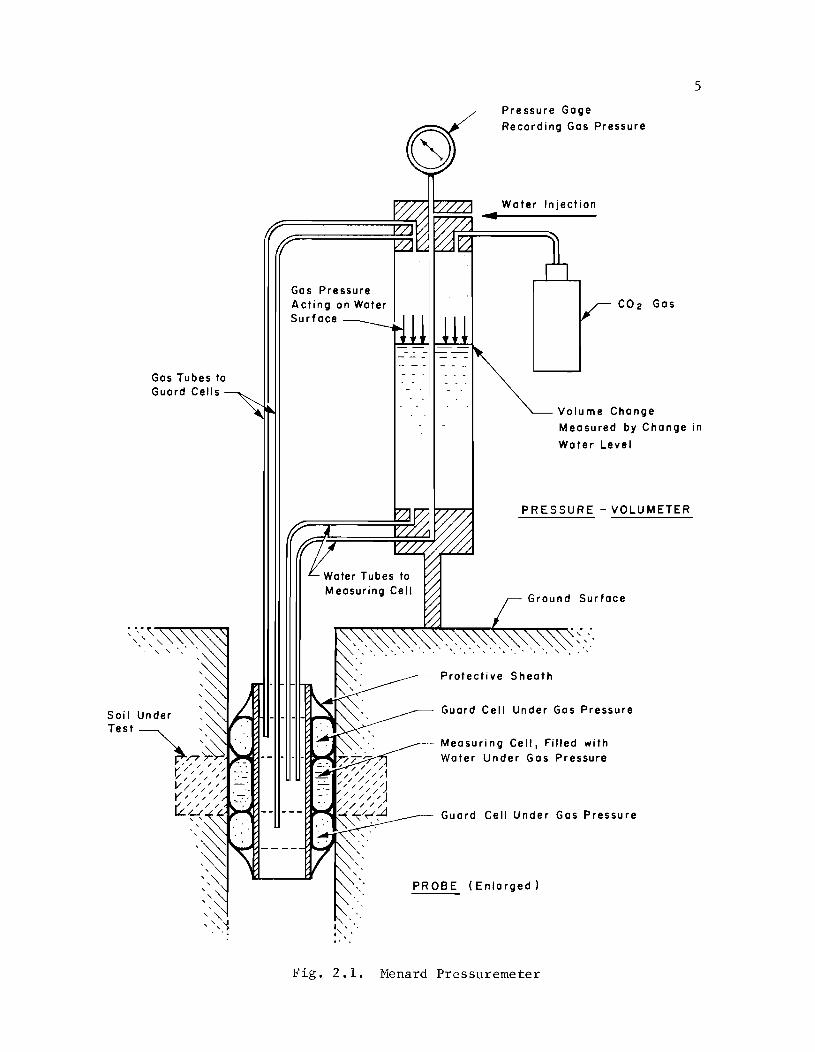
The Menard Pressuremeter (Fig. 2.1) consists of two main components:
the probe, which goes down the borehole; and the pressure-volumeter, which
is a surface instrument. These two components are connected by plastic
tubes through which water and gas pressure are applied.
The probe is a cylindrical metal assembly with rubber membranes
attached in such a manner as to form three independent cells. Carbon
4
Gas Tubes to Guard Cells
Soil Under
Gas Pressure Acting on Water Surface
I , ' . . ', .
Pressure Gage
Recording Gas Pressure
Water Injection
5
Volume Change
Measured by Change in
Water Level
PRESSURE - VOLUMETER
Sheath
Surface
, ' , ,
Under Gas Pressure
Measuri ng Cell, Filled with Water Under Gas Pressure
Guard Cell Under Gas Pressure
PROBE (Enlarged)
Fig. 2.1. Menard Pressuremeter
dioxide gas pressure is applied to the three cells from the surface and
inflates them to approximately twice their original diameter (Ref. 8).
Water is present in the central measuring cell and the volume of this
cell is measured by the lowering of the water level in the volumeter at
the surface. The upper and lower cells are known as guard cells, and
they expand under a gas pressure equivalent to that which is applied to
the central measuring cell. The purpose of these cells is to minimize
the effects of end restraint on the measuring cell. Probes are currently
available for holes with diameters of 1-1/2, 2, 2-3/8, and 3 inches.
The volumeter is equipped so that a monitored gas pressure can be
used to force water into the measuring cell. In addition, a measured
gas pressure is applied to the guard cells.
The plastic tube connecting the volumeter to the measuring cell is
enclosed inside a plastic tube going to the guard cells. The purpose of
this arrangement is to minimize any expansion of the tube going to the
measuring cell. Any expansion of this tube would result in inaccurate
estimates of the amount of water being forced into the measuring cell.
Collection of Data
If laboratory soil testing is to accompany the use of the Menard
Pressuremeter, samples should be obtained from the borehole used for the
pressuremeter. It is desirable to make the pressuremeter tests as soon
as possible after the removal of the samples. Readings should be taken
at the approximate center of the increment of the hole from which the
sample was taken.
At each desired depth, data are obtained by applying increments of
pressure to the water in the measuring cell and recording the corresponding
6

volume changes of the probe. Approximately eight different pressures are
used at each depth. Changes in volume are recorded at 15, 30, and 60
seconds after the application of each pressure. Pressuremeter tests are
taken at each depth of interest in the soil strata.
Analysis of Menard Pressuremeter Data
The data obtained from the pressuremeter tests are plotted on a graph
of pressure versus volume and ideally result in curves similar to those
shown in Fig. 2.2 (Ref. 10). The P-V curve is a plot of the cell pressure
versus the 60-second readings on the volumeter. The initial sloping por
tion of the curve results from restoration of the earth pressure to the
undisturbed condition prior to the removal of the soil from the hole.
Following this initial portion, the curve becomes nearly linear. It is
from this nearly linear phase that an approximation of Young's Modulus of
the material can be obtained. The end of this pseudo-elastic portion of
the curve marks the beginning of the yield condition at the wall of the
borehole. With further increase in pressure the volume change increases
rapidly, and the curve asymptotically approaches a vertical line as the
ultimate failure pressure of the soil is approached. The pressure reached
is referred to as the limit pressure, PL' It gives an indication of the
bearing capacity of the soil.
7
There are, however, several factors which must be considered in deter
mining a final limit pressure. First, the resistance of the rubber membrane
of the probe must be taken into account. This is accomplished by develop
ing a pressure-volume curve for the probe alone, without insertion in the
ground, from which the pressure required for the expansion of the probe

8
Pseudo-Elastic Plastic Phose Phose
800
700 , I I
600 I
500
V,ne,,", Co",
0 I u
CI) I E :)
(5 400 / > I / I
/ I 300 I 30
I u I u
200 I 20 CI)
I e :)
I ~ (5 > I:)
100 - VI 10 Q.
,- VI ~
Creep Curve '§I ~ ou ... Jo.. (.)
1
0 0 PL
Pressure, kg / cm! ..
Fig. 2.2. Curves Derived from Menard Pressuremeter Data

9
may be obtained for any volume and applied as a correction to the pressure
observed during the field test. This curve is known as the inertia curve
and is shown in Fig. 2.2 as a dashed line. Second, an effect similar to
the hydrostatic effect of the column of water in the measuring cell, which
becomes important at depths beyond 30 feet, must be introduced into the
guard cells (Ref. 8). This is done by using a second pressure-volumter
in the surface assembly. A third correction to be considered is that for
the expansion of the plastic water tube; however, this may be neglected if
the tube is constructed in a particular way as described in the section
on equipment.
During each applied pressure increment, the soil being tested will
usually deform with time. This aspect of the nature of the soil is illus-
trated by the creep curve in Fig. 2.2, a plot of the volume change between
the 30-second and 60-second readings. The pressure at which this curve
makes a definite upward break is designated the creep pressure, , and
is usually close to the end of the pseudo-elastic phase of the pressure-
volume curve.
The shear strength of the soil in question may be calculated from the
data obtained from the pressuremeter test. The formula for shear strength
as postulated by Menard is
s = o
p - P L 0 (2.1)
2KB

10
where
= the limit pressure as obtained from the test,
P the lateral pressure at rest at the depth of the test, o
= a coefficient dependent on the stiffness of the
soil and the soil structure,
Pressuremeter Correlation
Use of the Menard Pressuremeter at the Houston drilled shaft test site
and correlation of the data with laboratory test results for that location
are considered to be desirable, but a pressuremeter has not been available
for this study,
A pressuremeter correlation study on cohesive soils has been made by
C. M. Higgins, Soils Research Engineer for the Louisiana Department of
Highways (Ref. 10). The study involved comparing shear strength results
obtained by the Menard Pressuremeter with those obtained by conventional
test methods. The conventional tests used for comparative purposes were
the unconfined compression test, the vane shear test, and the consolidated
undrained triaxial test.
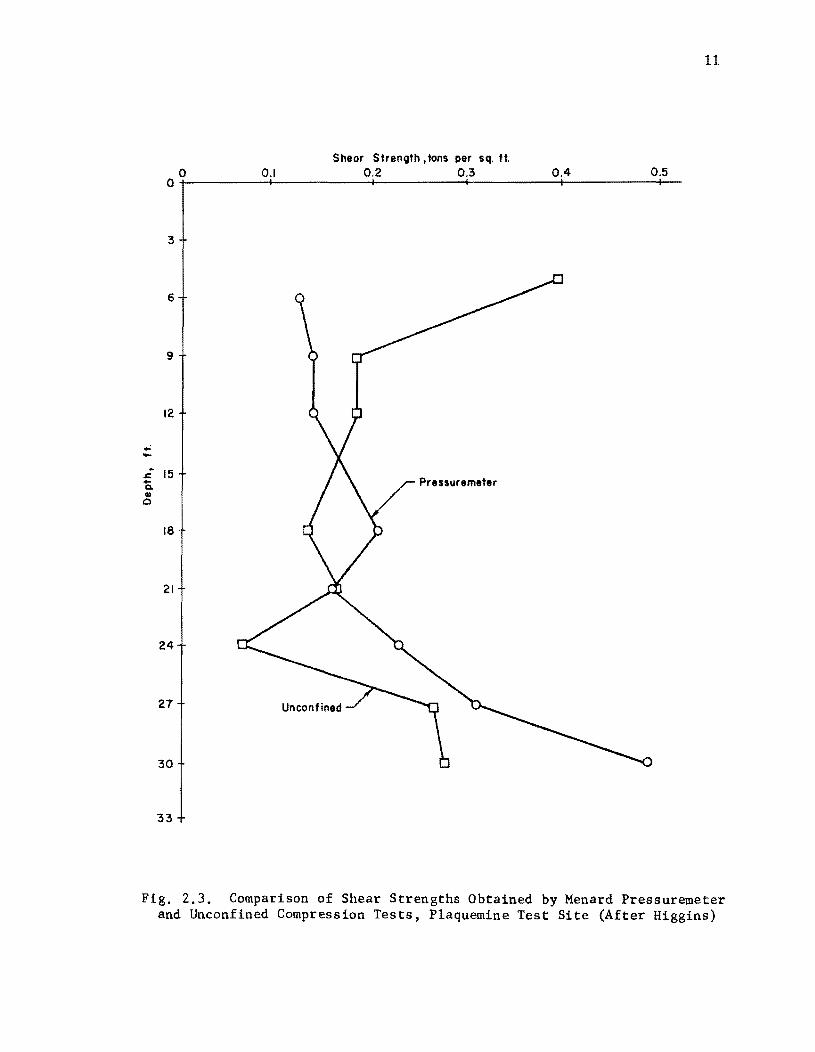
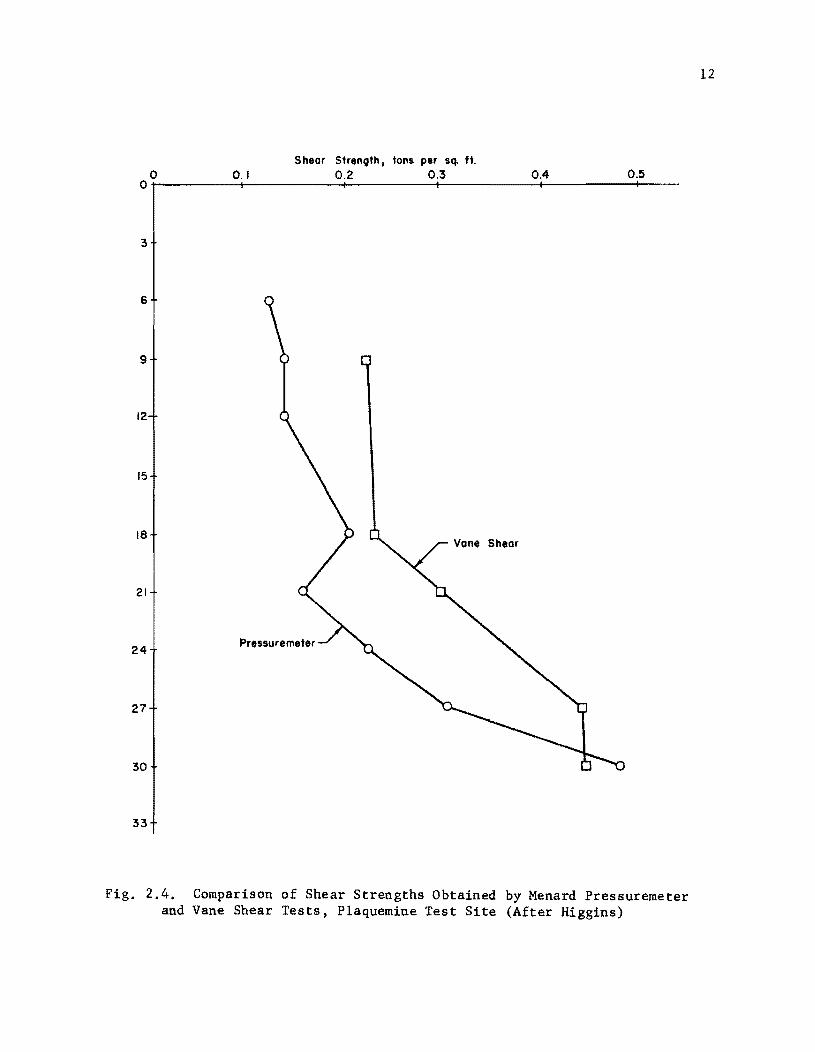
Pressuremeter results from a test site located at Plaquemine, Louisiana,
are shown with unconfined compression test results in Fig. 2.3 and with
vane shear test results in Fig. 2.4. The correlation between the pressure-
meter results and the results of the two conventional methods of testing
is fairly good. In general the pressuremeter results fall between the
unconfined test results and the vane shear test results. The soil at this
location ranged from a heavy clay to a silty clay loam (Ref. 10).
11
Shear Strength. tons per sq. ft. O 0.1 0.2 0.3
O+-------~~--------~--------~--------~--------~--0.4 0.5
6
9
12
.; -~
15 s:. Pressuremeter ~
Q.
tl 0
18
21
24
27
30
33
Fig. 2.3. Comparison of Shear Strengths Obtained by Menard Pressuremeter and Unconfined Compression Tests, Plaquemine Test Site (After Higgins)
Shear Strength, tons per sq. ft.
oo;--------~0~.~1--------~0+.2~------~0+.3~---------0+.4----------0+.5----
6
9
12
15
18 Vane Shear
21
24
27
30
33
Fig. 2.4. Comparison of Shear Strengths Obtained by Menard Pressuremeter and Vane Shear Tests, Plaquemine Test Site (After Higgins)
12

13
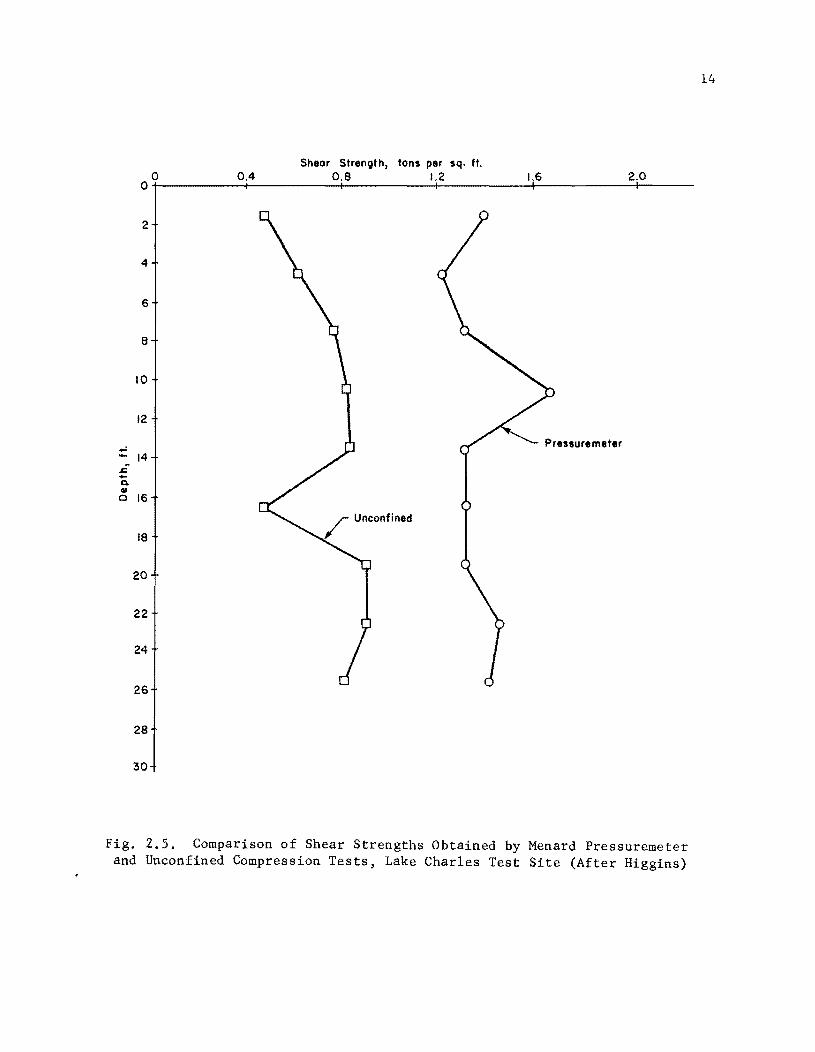
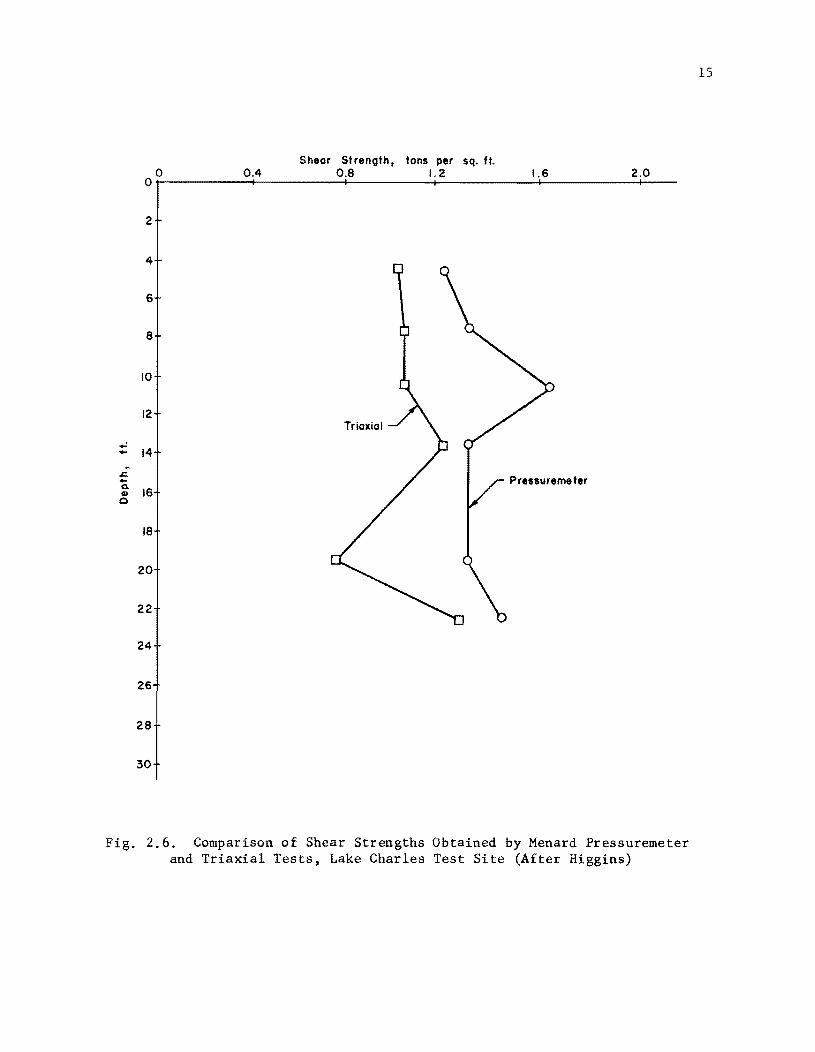
Pressuremeter results for Lake Charles, Louisiana, were compared
with shear strengths obtained from unconfined compressions tests (Fig. 2.5.)
and consolidated undrained triaxial tests (Fig. 2.6). The agreement
between these pressuremeter test results and the conventional test results
at this location is not as close as between those at the Plaquemine site.
The pressuremeter-derived strengths are somewhat greater than both the
unconfined test values and the triaxial values. The soil was a stiff
clay with numerous calcareous inclusions (Ref. 10).
This variation in the results has been attributed mainly to the nature
of the soil encountered at the Lake Charles site. When soils are tested
by either unconfined compression or triaxial testing, the sample normally
fails at the weakest point within the core which was at the calcareous
inclusions in the Lake Charles soil. The pressuremeter, however, tests
an area of soil about 18 inches in height, and the strengths obtained are
therefore more of an average of the material strengths within this zone.
It is believed that this average was not influenced appreciably by the
inclusions, since they are small when compared to the size of the area
being tested. Soil disturbance caused by sampling, handling, and testing in
the laboratory also caused the laboratory strengths to be lower than
those measured by the pressuremeter. It is therefore probable that the
strengths measured by the pressuremeter are more representative than the
lab tests of the strength of the material at this location.
Sheor Strength, tons per sq. ft. 0 0.4
0 0.8 1.2 1.6 2.0
2
4
6
8
10
12
..: Pressure meter - 14
.J:; .... Q. II)
0 16
18
20
22
24
26
28
30
Fig. 2.5. Comparison of Shear Strengths Obtained by Menard Pressuremeter and Unconfined Compression Tests, Lake Charles Test Site (After Higgins)
14
Shear Strength, tons per sq. It. 0 0.4
0 O.B I. 2 1.6 2.0
2
4
6
B
10
12
...: .... 14
.t:! +-CI.
16 • Pressuremeter
0
IB
20
22
24
26
2B
30
Fig. 2.6. Comparison of Shear Strengths Obtained by Menard Pressuremeter and Triaxial Tests, Lake Charles Test Site (After Higgins)
15

ins (Ref. 10) draws the following conclusions from the results of
his study:
16
(1) For very soft cohesive soils, the agreement between shear strengths
measured by the pressuremeter and shear strengths measured by
conventional methods was good.
(2) For cohesive soils of medium strength, not greatly influenced by
cracking of the soil near the ground surface, the pressuremeter
shear strengths and those obtained by conventional methods are
very close at shallow depths. The pressuremeter strengths do
become considerably greater than the conventional shear strengths
as the depth increases.
(3) For medium strength cohesive soils with numerous inclusions or
cracks, the pressuremeter strengths are greater at all depths
than those strengths derived by conventional methods. It is
probable, however, that the pressuremeter strengths are the more
representative of the true strength of the soil.
Further correlations involving Menard Pressuremeter data have not been
found in the literature. Mori and Tajima (Ref. 18) present a discussion of
the pressurementer in which they cite some of Menard's work (Ref. 15) on
estimating the allowable bearing capacity and settlement of deep foundations.
De Mello (Ref. 6) cites two authors, Goulet and Karst (Refs. 9 and 12), who
also report using the pressuremeter for foundation applications. Calhoon
(Ref. 4) discusses the pressuremeter and its ability to estimate the shear
strength and stress-strain characteristics of soils, but presents no
correlation between results obtained with the Menard system and soil prop
erties measured by conventional laboratory tests.

Limitations
Several difficulties have been encountered in the use of the Menard
Pressuremeter (Ref. 10). Some of these difficulties are:
17
(1) The quantity of water available in the volumeter may not be
sufficient to reach the actual limit pressure. When this is true,
the limit pressure can only be estimated.
(2) In very soft soils the inertia of the probe may approach the
strength of the soil, making it necessary to use the probe without
the outer rubber sheath and to use a softer rubber membrane for
the measuring cell.
(3) The probe is extremely sensitive to hole size. If the hole is too
large, there is not enough water in the volumeter to allow a suffi
cient pressure to be applied to the probe to estimate the limit
pressure. If the hole is too small, the probe must be forced
into the hole, thus disturbing the surrounding soil and causing
misleading readings.
(4) If the probe is to be used in a material containing angular or
sharp aggregates, it must be covered with a heavy plastic tape to
prevent the rubber sheath from bursting.
(5) Use of the pressuremeter at any depth should immediately follow
the extraction of the soil from that depth. If further coring is
continued the hole diameter at the original desired level of test
ing may be enlarged sufficiently to invalidate the information
obtained.
(6) Pressuremeter tests in sand are difficult due to caving in of the
hole. Erroneous results are obtained unless some means is used
to prevent the caving in.
(7) The operations necessary for effective use of the pressuremeter
are time consuming.
18
CHAPTER 3
PENETRATION TESTS
The simplest and most widely used method of determining in situ soil
properties is the penetration test. The testing procedure consists of
measuring the resistance offered by the soil to the advancement into the
ground of a penetrometer. A penetrometer is often a rod with an enlarged
end which is either driven or pushed into the ground, but those discussed
here are specifically designed for their intended uses. The measured
resistance, which usually gives some indication of the strength of clays
and of the relative density of cohesionless deposits, is developed as a
result of both point resistance and side friction, with the amount of each
depending on the soil properties.
Many varieties of penetration tests have been designed, each especially
adapted to certain kinds of material. They can, however, be separated into
two general groups, static and dynamic.
Static Penetration Tests
If the penetrometer is forced into the soil at a steady rate under a
fixed static load, the procedure is referred to as a static penetration
test. The pressure required to advance the penetrometer at this constant
rate is measured and is known as the penetration resistance.
A static penetration test very popular in Europe is the Dutch cone
penetration test (Refs. 1, 5, 6, 17, 20, 24, 28, and 34). The Dutch
19
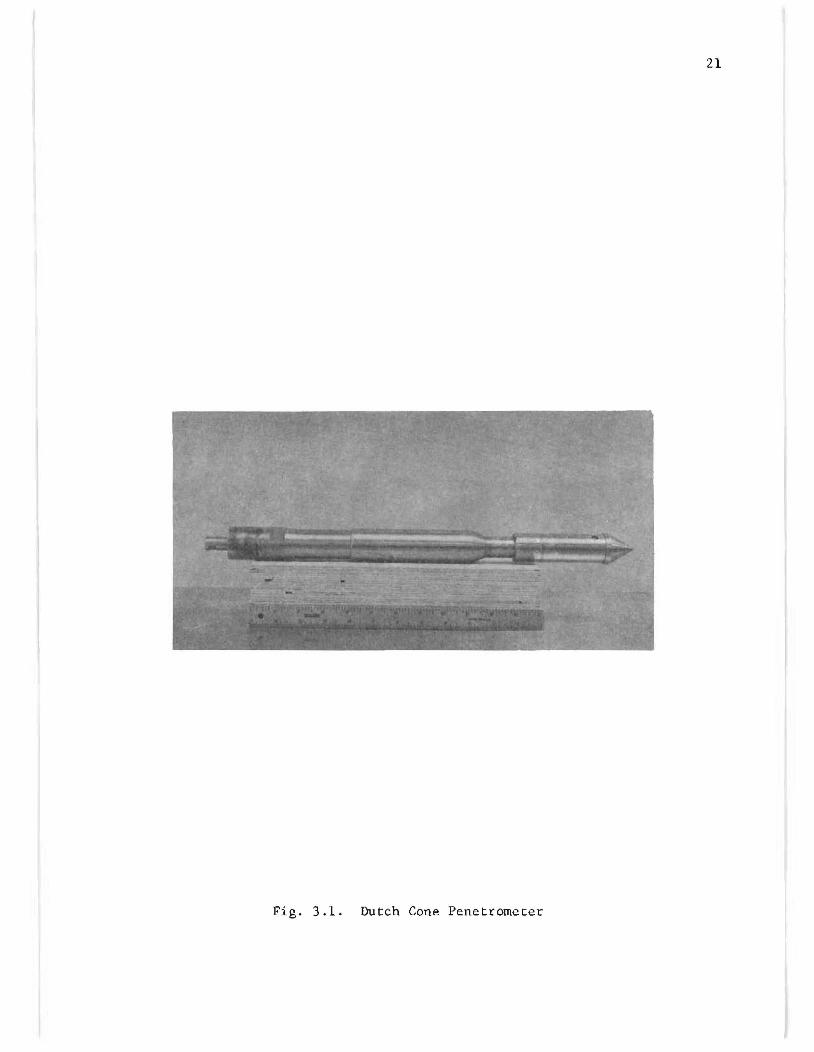
penetrometer, as shown in Fig. 3.1, is a 600 cone with a diameter of
1.4 inches. The cone, attached to the end of a rod which is inside a cas
ing to prevent development of side resistance, is either driven into the
ground to the desired depth of testing or positioned in an open hole at
this depth. The cone is forced at a constant velocity, usually 0.4 inches
per second, into the soil being tested, and the pressure required is the
penetration resistance.
20
Use of the cone penetration test in soft clays, silts, and peats is
quite successful (Ref. 20), and it has been used to investigate the rela
tive density of sands. The measurements from the static penetration test
provide considerable detail for a bearing capacity profile of the soils
encountered at the test site. Each test represents a form of static bear
ing capacity test which, with suitable theory, can be used to extrapolate
bearing capacity values for larger foundations (Ref. 23). From test
results in clays, the undrained shear strength can be computed with bearing
capacity theory, In sands, the relative density and/or the angle of inter
nal friction can be estimated from the magnitude of the cone bearing
value (Ref. 23).
An extensive literature search has yielded very little concerning cor
relation studies performed on the static cone test. De Mello (Ref. 6)
briefly cites several authors (Refs. 2, 3, 21, 30, 31, and 33) who have
made some c0rrelations between penetration resistance and shear strengths
measured by vane shear, unconfined compression, and undrained triaxial test
ing in clays. Meyerhof (Ref. 17) correlates static cone resistance with
penetration resistance measured by the Standard Penetration Test, which is
discussed later, and with the relative density of sands, as shown in Table 3.1.
21
Fig. 3.1. Dutch Cone Penetrometer
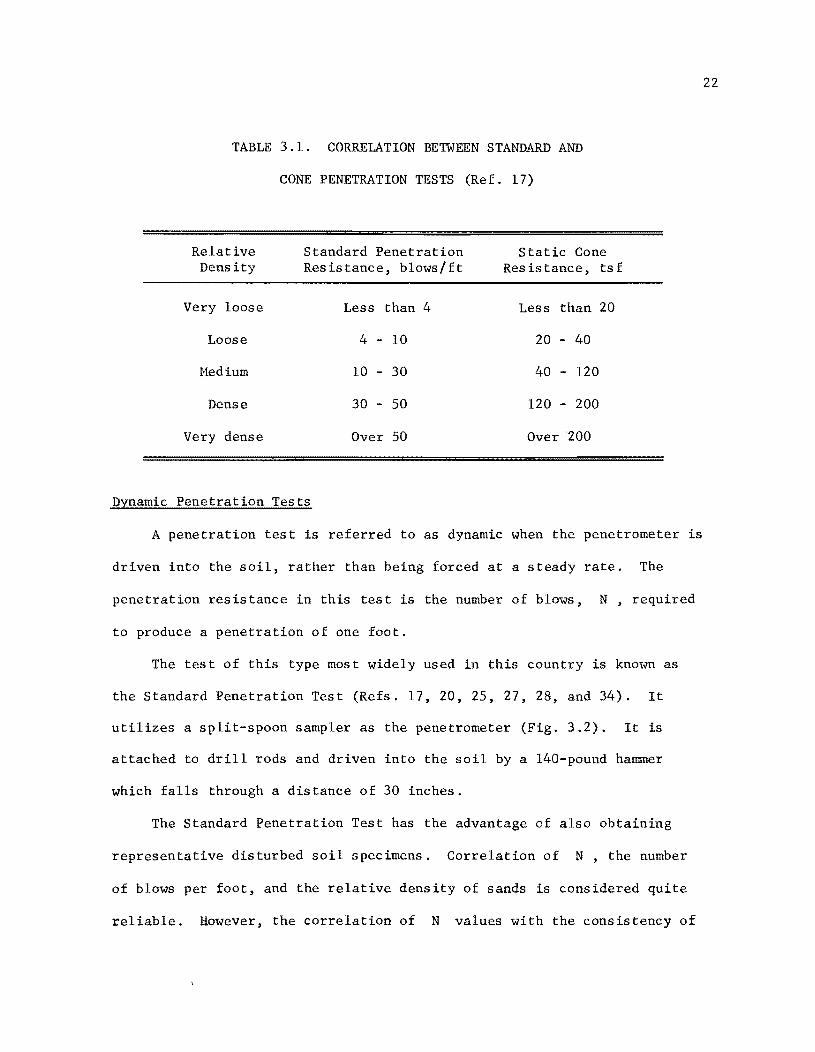
22
TABLE 3.1. CORRELATION BETWEEN STANDARD AND
CONE PENETRATION TESTS (Ref. 17)
Relative Standard Penetration Static Cone Density Resistance, b10ws/ft Res is tance, tsf
Very loose Less than 4 Less than 20
Loose 4 - 10 20 - 40
Medium 10 - 30 40 - 120
Dense 30 - 50 120 - 200
Very dense Over 50 Over 200
Dynamic Penetration Tests
A penetration test is referred to as dynamic when the penetrometer is
driven into the soil, rather than being forced at a steady rate. The
penetration resistance in this test is the number of blows, N, required
to produce a penetration of one foot.
The test of this type most widely used in this country is known as
the Standard Penetration Test (Refs. 17, 20, 25, 27, 28, and 34). It
utilizes a split-spoon sampler as the penetrometer (Fig. 3.2). It is
attached to drill rods and driven into the soil by a 140-pound hammer
which falls through a distance of 30 inches.
The Standard Penetration Test has the advantage of also obtaining
representative disturbed soil specimens. Correlation of N, the number
of blows per foot, and the relative density of sands is considered quite
reliable. However, the correlation of N values with the consistency of
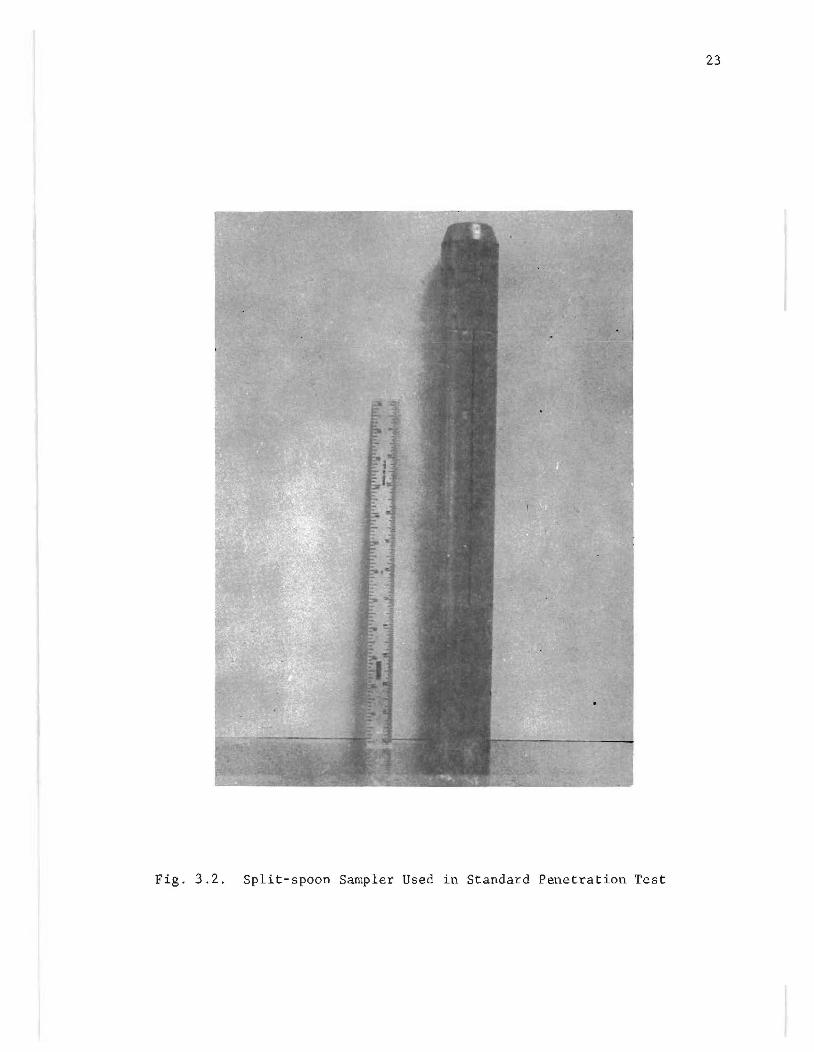
23
Fig. 3.2. Split-spoon Sampler Used in Standard Penetration Test
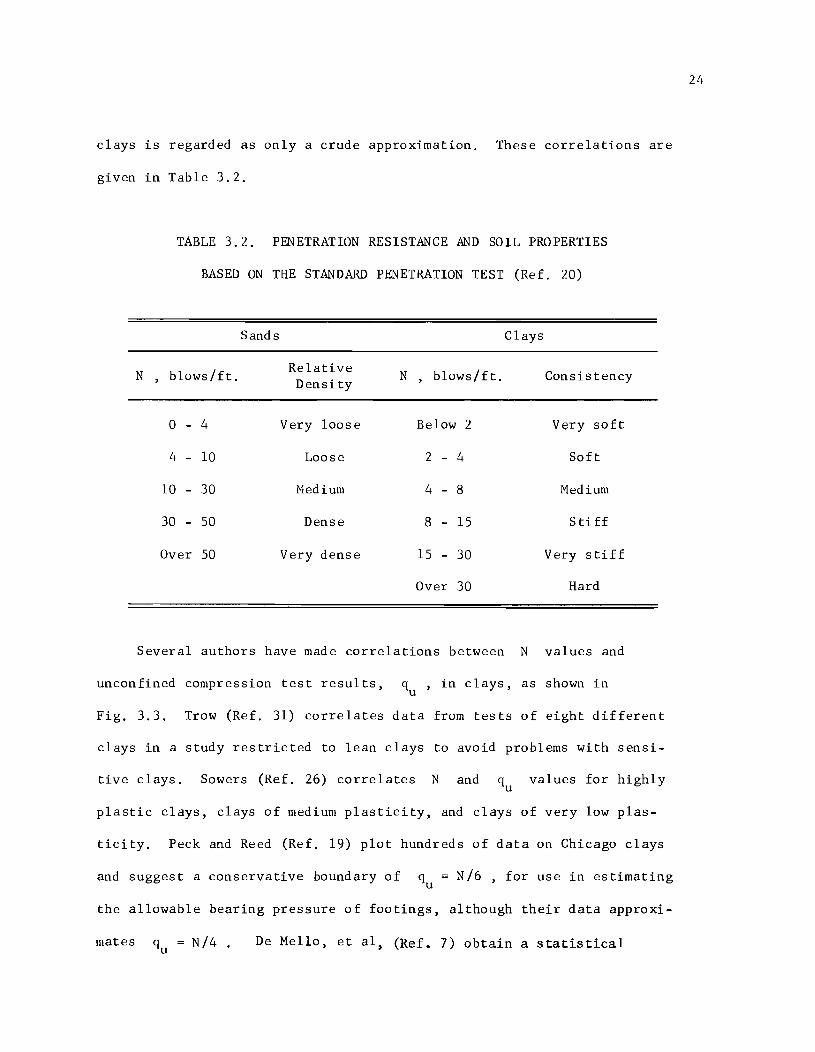
clays is regarded as only a crude approximation. These correlations are
given in Table 3.2.
TABLE 3.2. PENETRATION RESISTANCE AND SOIL PROPERTIES
BASED ON THE STANDARD PENETRATION TEST (Ref. 20)
Sands Clays
N , blows/ft. Relative Density
N , blows/ft. Consistency
0-4 Very loose Below 2 Very soft
4 - 10 Loose 2 - 4 Soft
10 - 30 Medium 4 - 8 Medium
30 - 50 Dense 8 - 15 Stiff
Over 50 Very dense 15 - 30 Very stiff
Over 30 Hard
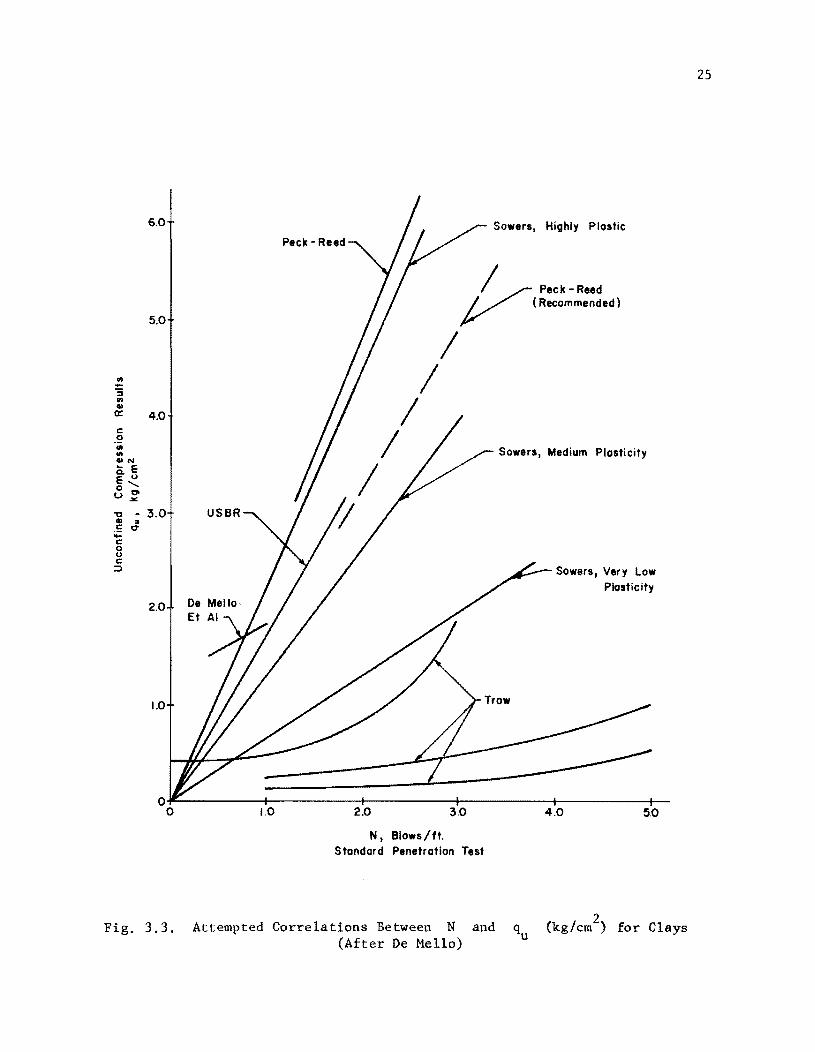
Several authors have made correlations between N values and
unconfined compression test results, q ,in clays, as shown in u
Fig. 3.3. Trow (Ref. 31) correlates data from tests of eight different
clays in a study restricted to lean clays to avoid problems with sensi-
tive clays. Sowers (Ref. 26) correlates Nand qu values for highly
plastic clays, clays of medium plasticity, and clays of very low plas-
ticity. Peck and Reed (Ref. 19) plot hundreds of data on Chicago clays
and suggest a conservative boundary of q = N/6 , for use in estimating u
the allowable bearing pressure of footings, although their data approxi-
mates q = N/4 . u
De Mello, et aI, (Ref. 7) obtain a statistical
24
III -:i III eo
6.0
5.0
Q: 4.0 c: .2 eft eft eoN ~~ E, o 1:" t.>....,
"0 - 3.0 CD ::0 c: 0--c: o u c:
::J
2.0
1.0
Sowers, Highly Plastic
Sowers, Medium Plasticity
Sowers, Very Low Plasticity
O~----------+-----------~----------+-----------~----------~-o
Fig. 3.3.
1.0 2.0 3.0
N, Blaws / ft. Standard Penetration Test
Attempted Correlations Between Nand q u (After De Mello)
4.0 5.0
2 (kg/em ) for Clays
25

relationship 2 q = 0.061 N + 1.3 (kg/em)
u for an unsaturated silty clay.
Another curve shown in Fig. 3,3 represents the results of a correlation
26
study of Nand qu values made by the United States Bureau of Reclamation
(Ref. 6). Terzaghi and Peck (Ref. 28) suggest the approximate relation-
ship between N values and unconfined compressive strengths shown in
Table 3.3.
TABLE 3,3. RELATION OF NUMBER OF BLOWS N ON SAMPLING SPOON
AND UNCONFINED COMPRESSIVE STRENGTH (Ref. 28)
N (blows/ft.) Below 2 2-4 4-8 8-15 15-30 Over 30
( tsf) Below 0.25 0.25-0.50 0.50-1.00 1.00-2.00 2.00-4.00 Over 4.00
As seen from the data in Fig. 3.3 and Table 3.3, the scatter of the
predicted values of qu for a given N value is quite large. Therefore,
compression tests should always be made on the samples which are recovered
from the split-spoon sampler used in the Standard Penetration Test.
Peck, Hanson, and Thornburn (Ref. 20) give an empirical relationship
between the penetration resistance and the relative density and angle of
internal friction of sands, as shown in Fig. 3.4. No further useful cor-
relations involving Standard Penetration Test results have been found in
the literature.
THD Penetration Test
Since this study is of direct interest to the Texas Highway Depart-
ment, all penetration test results noted in the following chapters were

--"-(II • 0 .is
tI 0 c .2 ... "iii tI a::
c 0 += 0
~ C
~
"E 0 ~ c 0 u;
90
80
70
60
50
40
30
20
10
0 30 32 34 36 38 40 42 44
Angle of Internal Friction, degrees
Fig. 3.4. Relationship Between Penetration Resistance and Angle of Internal Friction of Cohesion less Soils
(After Peck, et al)
27
tI III C • 0
» .. ~
tI ... c
f tI 0
0
tI >
J e ::I '6 :I
: 0 0 ..J
obtained by a test method commonly used by that Department, referred to as
the standard THD cone penetration test.
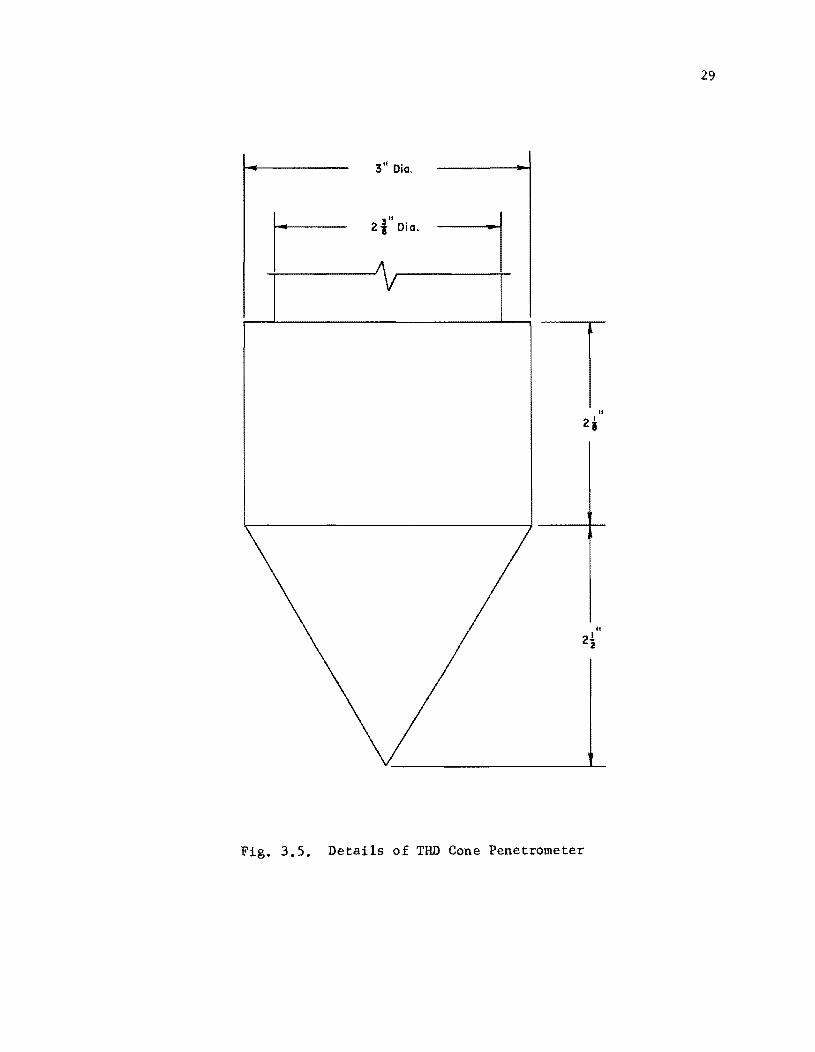
The THD cone penetration test (Ref. 29) utilizes a penetrometer cone
3.0 inches in diameter, as shown in Fig. 3.5, The cone is attached to a
drill stem of 2-3/8 inches in diameter and lowered to the bottom of the
test hole. An anvil is attached to the top of the drill stem, and an
automatic tripping mechanism with a l70-pound hammer is placed on top of
28
the anvil. This arrangement is shown in Fig. 3,6. The drop of the hammer
is regulated at two feet. The actual testing is begun by seating the cone
with 12 blows of the hammer, except in soft soils, in which the seating is
determined by the operator. If the soil to be tested is relatively soft,
the cone is driven one foot, and the number of blows required for each six
inches of penetration of the cone is recorded. However, in harder material,
where the blow count exceeds 100 blows per foot, the procedure is to apply
two sets of 50 blows each to the cone and to record the corresponding
penetration for each set of blows.
The THD cone penetration test is used quite extensively for obtaining
estimates of in ~ shear strengths in Texas. Its use in this study
involves determination of material properties at the test sites of the
Drilled Shaft Project. Discussion of these test results is found in
Chapters 5 and 6.
29
3" Oia.
3/1 2} Oia.
Fig. 3.5. Details of THD Cone Penetrometer
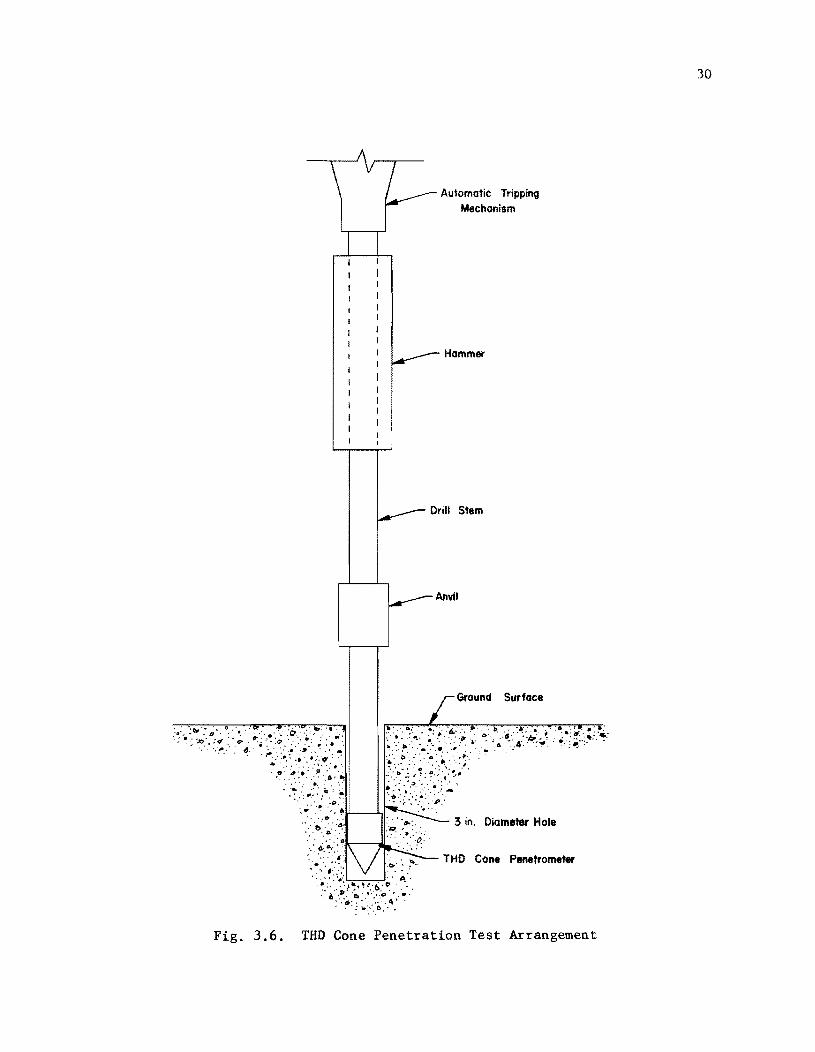
Fig. 3.6.
Automatic Tripping Mechanism
Hammer
Drill Stem
Anvil
Surface
3 in. Diameter Hole
THO Cone Penetrometer
THD Cone Penetration Test Arrangement
30
CHAPTER 4
UNIVERSITY OF TEXAS IN SITU SHEAR TEST DEVICE
In May 1966 considerable sampling difficulty was encountered at the
site of a drilled shaft test in San Antonio. Strata composed of gravel,
shells, and sandstone existed to such an extent as to inhibit satisfactory
sampling. For this reason in situ testing seemed desirable and necessary
for determining the soil properties at the site. For use in obtaining
these soil strength values in San Antonio and for further use in connection
with the Drilled Shaft Project (Ref. 22), a device was developed to measure
soil shear strength in situ. The device is identified as The University of
Texas in situ device.
Operational Concept
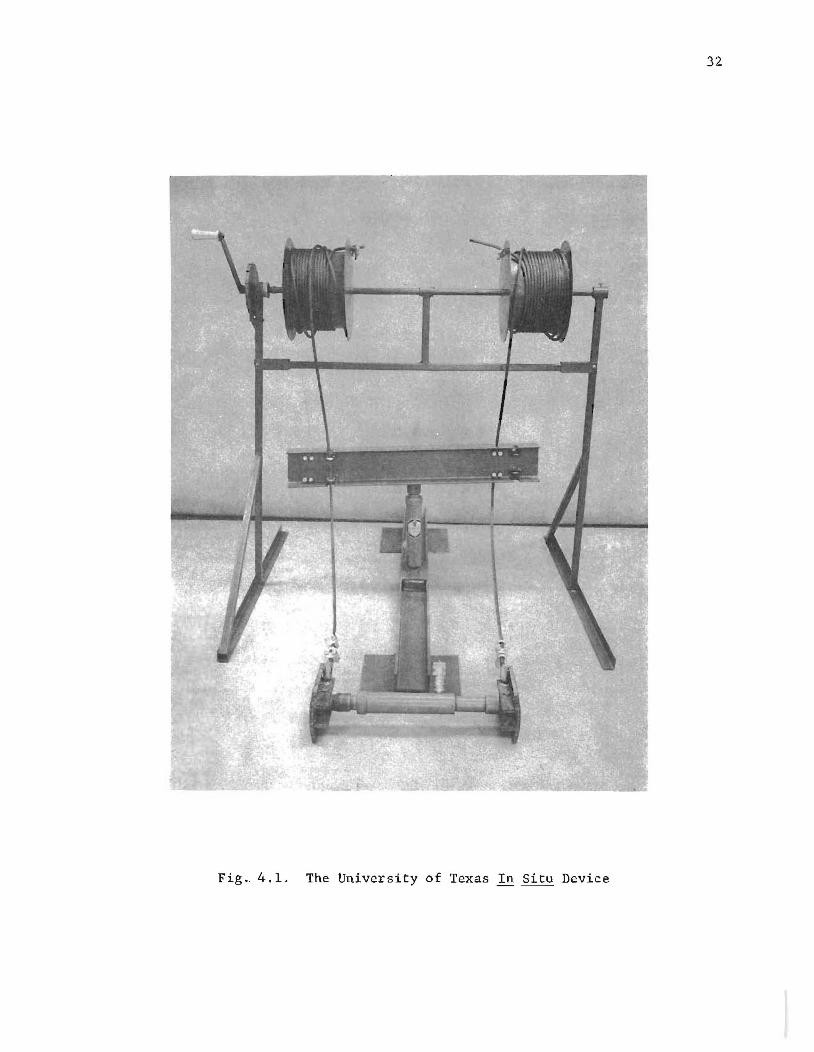
The University of Texas in situ device (Fig. 4.1) was designed to shear
the soil under investigation and to measure the maximum shearing resistance
offered by the soil under known normal pressures.
The first step in the procedure is to lower into a borehole a hydraulic
ram with shear plates attached to the ends. During lowering, the ram and
plates should be maintained in a horizontal position by adjusting the cables
(Fig. 4.1). When the assembly reaches the desired depth of testing, the
plates are forced against the walls of the hole, and the hydraulic ram is
used to exert a desired normal pressure on the soil in contact with the
plates. A hydraulic jack at the surface then applies an upward force on
31
32
Fig .. 4.1. The University of Texas In Situ Device
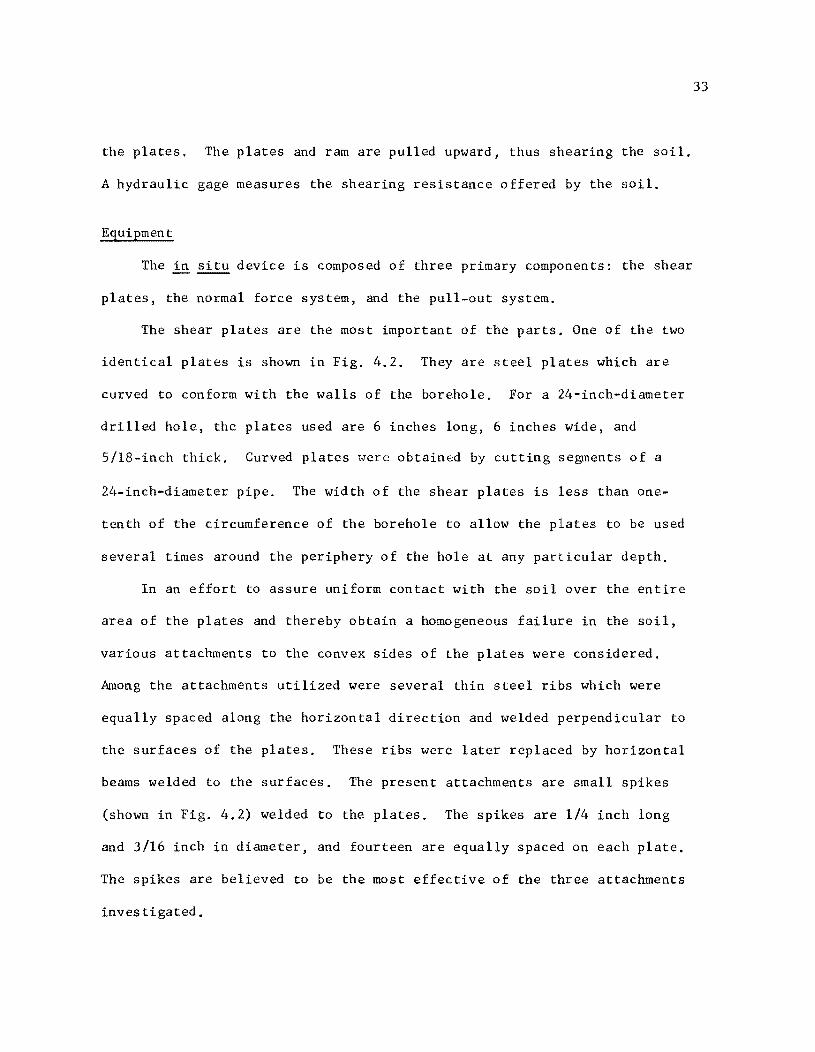
the plates. The plates and ram are pulled upward, thus shearing the soil.
A hydraulic gage measures the shearing resistance offered by the soil.
Equipment
The in situ device is composed of three primary components: the shear
plates, the normal force system, and the pull-out system.
The shear plates are the most important of the parts. One of the two
identical plates is shown in Fig. 4.2. They are steel plates which are
curved to conform with the walls of the borehole. For a 24-inch-diameter
drilled hole, the plates used are 6 inches long, 6 inches wide, and
S/lS-inch thick. Curved plates were obtained by cutting segments of a
24-inch-diameter pipe. The width of the shear plates is less than one
tenth of the circumference of the borehole to allow the plates to be used
several times around the periphery of the hole at any particular depth.
In an effort to assure uniform contact with the soil over the entire
area of the plates and thereby obtain a homogeneous failure in the soil,
various attachments to the convex sides of the plates were considered.
Among the attachments utilized were several thin steel ribs which were
equally spaced along the horizontal direction and welded perpendicular to
the surfaces of the plates. These ribs were later replaced by horizontal
beams welded to the surfaces. The present attachments are small spikes
(shown in Fig. 4.2) welded to the plates. The spikes are 1/4 inch long
and 3/16 inch in diameter, and fourteen are equally spaced on each plate.
The spikes are believed to be the most effective of the three attachments
investigated.
33

34
Fig. 4.2. Shear Plate for UT In Situ Device
35
In each case, the ratio of the surface area of the attachments to the
plate area in contact with the soil is less than five percent. This is to
minimize any friction force or bearing force which might develop between
the attachments and the soil. Bearing of the soil on the top edge of each
plate is reduced by the presence of a steel piece welded across the top
edge of each plate and sloping away from the convex surface (see Fig. 4.2).
On the concave side of each plate, two l/2-inch-thick, 2-inch-wide, and
6-inch-long stiffeners are fixed for transferring normal loads uniformly to
the plate. At the top of the stiffeners, cables are attached and extended
to the ground surface for transmitting the shear force.
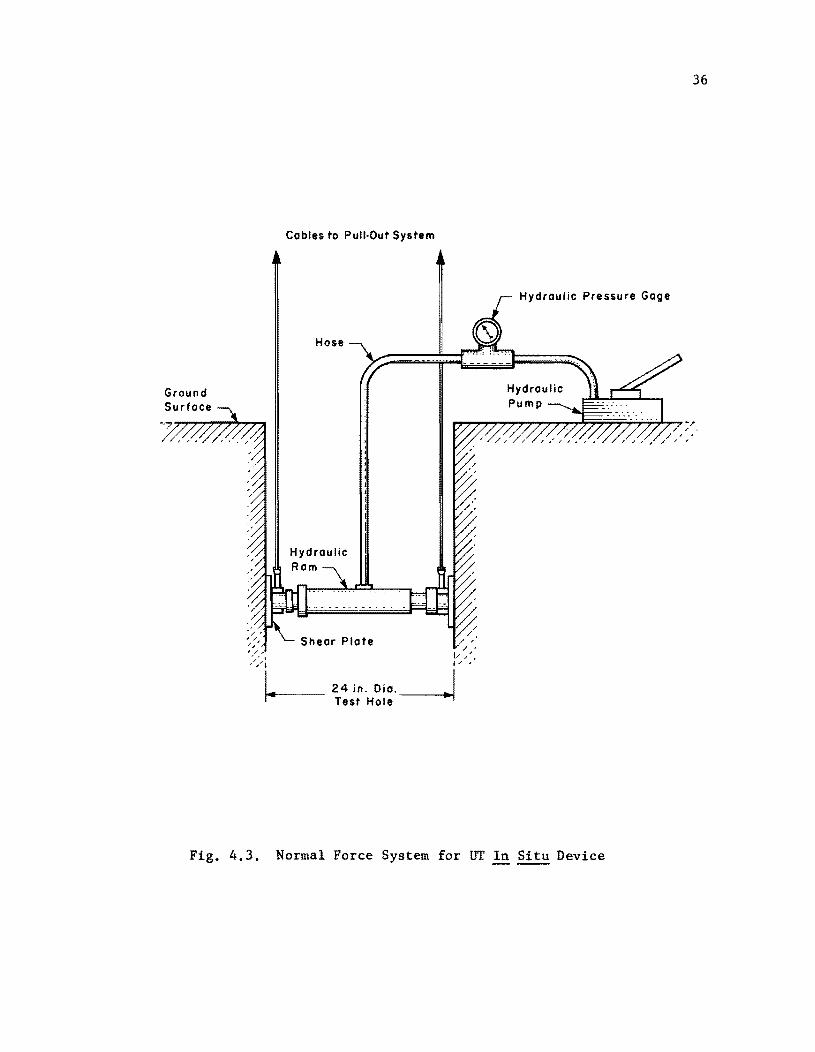
The normal force system (Fig. 4.3) used by the in situ device consists
of a hydraulic ram on the ends of which the two shear plates are connected.
A ram of ten-ton capacity is used to apply the various normal loads to the
plates. A hydraulic pressure gage connected in series with the hydraulic
ram measures the normal loads.
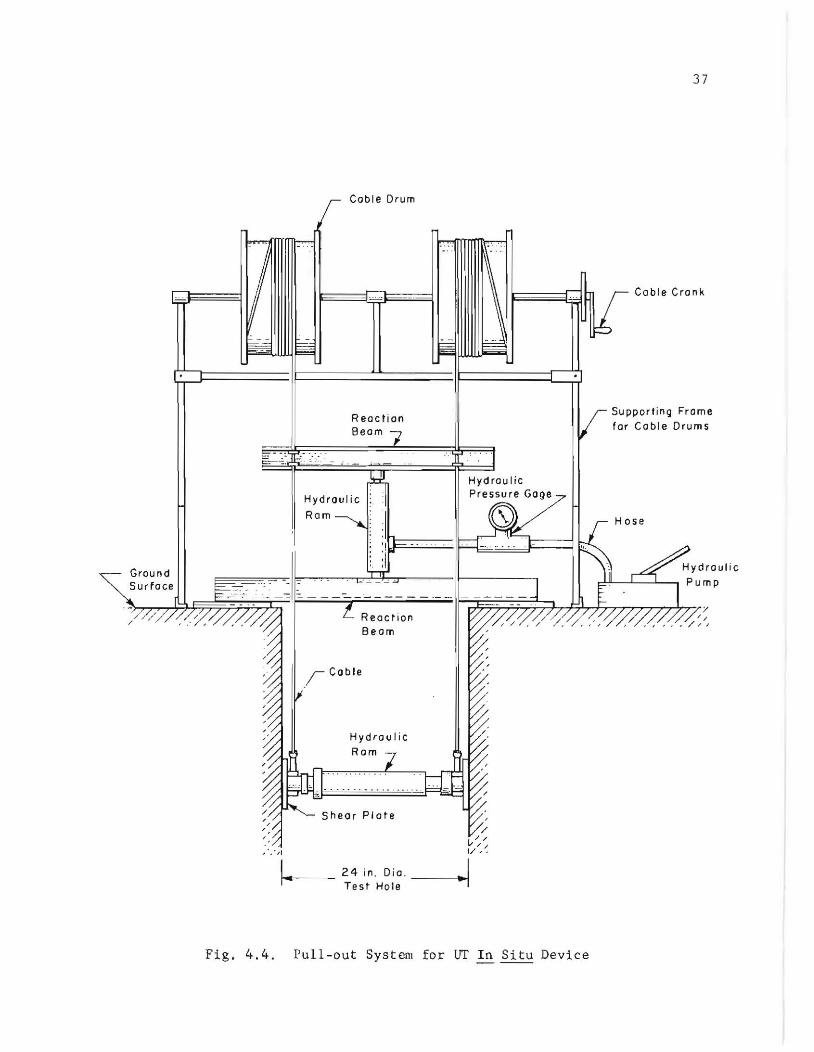
The pull-out system (Fig. 4.4) for the in situ device consists of the
equipment necessary for applying the shear force to the soil and measuring
that force during testing. The cables connected to the shear plates extend
above the ground surface and are clamped to a 24-inch-long beam fastened to
the top of a vertical hydraulic ram. The ram is centered on a second
reaction beam which is positioned over the test hole. The shearing force
is applied from the hydraulic ram and transferred to the shear plates by
the cables. The shearing force is measured by a hydraulic pressure gage
connected to the ram.
Cables to Pull-Out System
Hose
HydrauliC Pressure Gage
Hydraulic Pump
Fig. 4.3. Normal Force System for UT In Situ Device
36
Ground
• ' /1
I ..
Fig. 4.4.
Cable Drum
Reaction 8eom
Hydraulic
Rom
Reaction Beam
Coble
Hydraulic
Shear Plate
24 in . Dio . Test Hole
Hydraulic Pressure Gage
/ , " 1/ ' .
-I
Pull-out System for UT In Situ Device
37
Cable Cronk
Suppor'inq Frame for Coble Drums
Testing Procedure
The procedure used for the in situ device is as follows:
(1) Drill the test hole at the selected site. The present in situ
equipment allows testing at depths of up to 30 feet in holes with
diameters of 20 to 30 inches. If laboratory soil t esting is to
accompany the use of the in situ devic e , th e hole us ed for the
in situ tests should coincide with that from which the samples
were obtained.
(2) Center the reaction beam and the fram e supporting the cable drum
over the hole. It is neces s ary to lower th e horizontal ram into
the hole so that th e r eaction beam may be placed be tween the two
cables.
(3) Connect a hydraulic pump and pr essure gage in series t o each
hydraulic ram.
(4) Lower the shear plates to the desir ed level of t esting and
clamp the cabl es firmly to the upper reaction beam. One-foot
intervals are marked on the cables to det e rmine the depth to the
shear plates.
( 5) Apply the s e lected normal pressure to the shear plat es. Although
an y magnitude of normal pressure may be applied to the plates, it
is believed that an appropriate normal pressure is one which just
brings the surfaces of the plates and the soil in good contact .
Further discussion of normal pressure selection occurs lat er in
this ch apter.
38

39
(6) Apply the pull-out force to the shear plates at a slow, constant
rate while holding the selected normal pressure constant. Continue
to apply the pull-out force until a steady decrease in pressure is
noted by the pres sure gage measuring the shearing force. The maxi-
mum pressure reached is the pressure requir ed to cause a shear
failure of the soil.
(7) Release the normal pressure and rotate the plates 600
for further
testing at the s ame depth and repeat Steps 5 and 6. The shear
plates may be used three times at each depth with the normal
pressure remaining constant or being varied,
Analysis of Data
The shear failure is assumed in the soil, not at tht· interface between
the plates and the soil. The shearing resistance of the soil under the
particular normal pressure may be easily calculated when the pressure
required for the shear failure is obtained. This maximum pressure i s Con-
verted into a force, F J in pound s by use of the calibration curve for the
vertical hydr aulic ram and pressure gage combination. The shearing resistance
in tons per square foot is
where
R F A
F maximum shearing force, tons, and
A total area of both shear plates, square feet.
(4.1)
40
If several different normal pressures are used, es tima tes of the cohesion
and angle of internal friction of the soil may be obtained from a plot of
shearing resi stance versus normal pressure. The actual normal force , and
thereby the actual normal pressure, on the plates is obtained by converting
the normal pressure, as read on the pressure gage, by use of a similar
calibration curve.
Limitations
Several difficulties have been enco untered in the use of the in situ
dev ice, as follows:
(1) Perfect contact between the so il surface and the shear plates is
not always obtained. This may be due to inclusions in the soil or
to the nonhomogeneous natur e of the soil in conlacl with th e plates.
In th ese instances it is difficult to determine th e effec tive
contact area.
(2) At depths greater than 15 feet it is difficult to place the hori
zontal ram in a level position. The difficulty is a result of
poor illumination and having to level the ram by judgment based
On observations from the surface. If the ram is in an unlevel
position, part of the shear plates tilts away from the soil when
the normal pressure is app l ied . This also results in poor contact
between the soil and the shear plates.
(3) The selection of a proper normal pressure is necessary for obtain
ing reliable estimates of the shearing resistance of the so il.
This selection is difficult and can be determined only by visual
inspection from the surface; thus, it becomes more difficult with

41
increasing depth . Care should be taken to embed the spikes fully
into the soil, but not to embed the shear plates, which results in
a bearing pressure being developed. The selection of the normal
pressure is made easier through experience in working with the
in situ device. However, the selection will always be based on
the judgment of the operator, and thus will be subject to some error.
(4) Soil frequently becomes attached to the shear plates and must be
removed to avoid erroneous measurements. The process of pulling
the plates up and cleaning them after each tes t is very time
consuming.
(5) The pull-out force cannot be applied at a steady rate, as the
pumping of the hydraulic fluid to the vertical ram is done by hand.
(6) The cables need to be tightly clamped before beo;inning the test.
Occasionally one of the cables slipped during t es ting. This
resulted in a shifting of the load to the other cable and a possible
error in the measurement of the shearing resistance.
(7) Eccentric loading exists on the horizontal ram when one shear
plate moves more than the other.
(8) The measured force applied to the horizontal ram could be incorrect
due to the ram being unlevel.
CHAPTER 5
RESULTS OF CORRELATION STUDIES
In order to analyze the findings oE this study, several correlations
were made of in situ test results. Shearing resistances estimated [rom
the UT in situ device were correlated with
(1) strengths obtained by conventional laboratory tescs, and
(2) penetration resistance measured with the THD cone penetrometer.
Maximum load transfer results obtai.ned from tests of instrumented drilled
shafts were correlated with
(1) shearing resistances measured with the in situ device, and
(2) penetration resi.stance measured with the THD ConE' penetrometer.
In Situ Device Versus Laboratory Tests
The in situ device was used on two occasions at a test site near
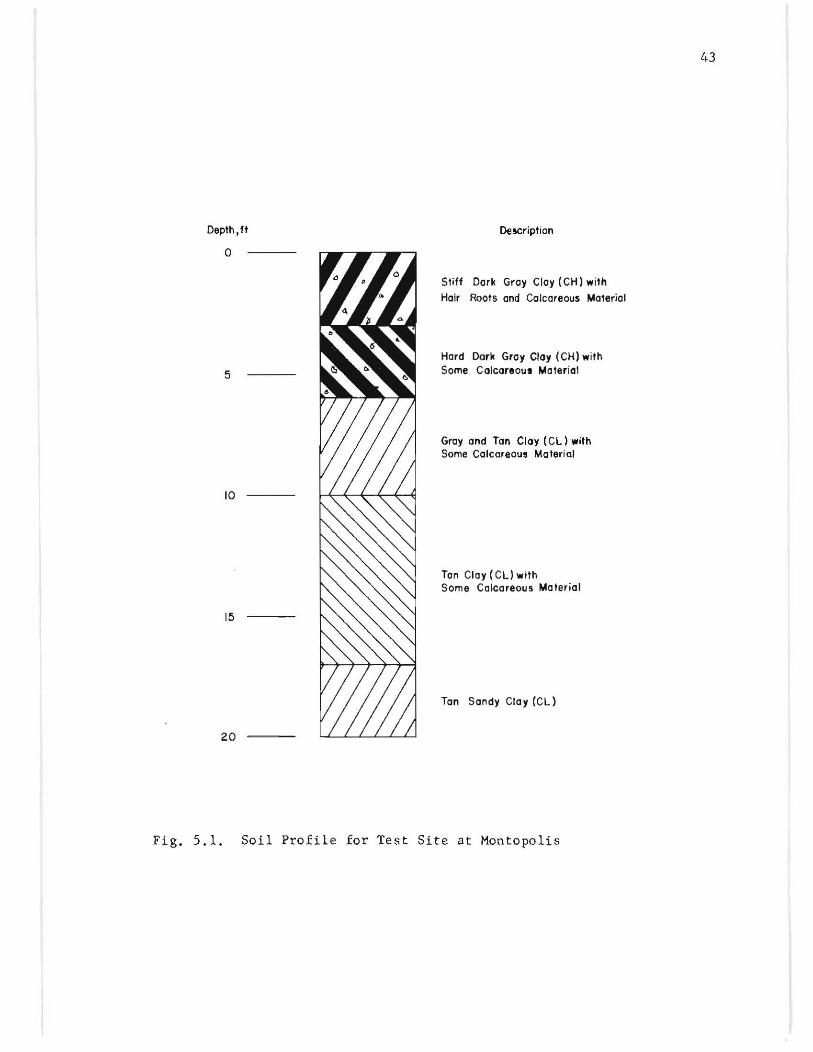
Montopolis, Texas, the location of the first drilled shaft test. A soil
profile of the Montopolis site is shown in Fig. 5.1.
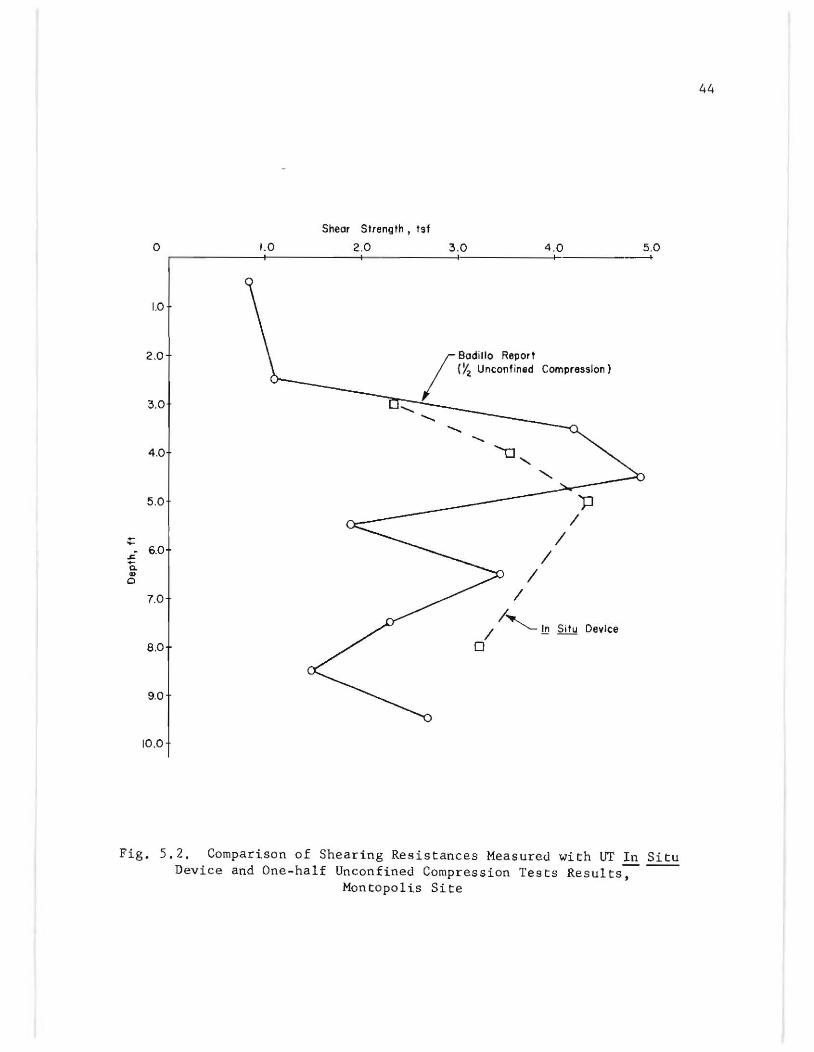
The initial use of the in situ device was in a 24-inch-diameter hole,
ten feet in depth. The shearing resistance results from this initial field
testing were compared with one-half of the unconfined compression test
results reported by Eulalio Juarez-Badillo (Ref. 11) in his soil investiga-
tion report for this particular drilled shaft test. This comparison is
shown in Fig. 5.2.
42
Oepth, ft
o
5
10
15
20
De!!Cription
St;ff Dark Gray Clay (CH) .. ith
HaIr Roots and Calcareous Malerial
Hard Dark Gray Cloy (CH) .. ith Some Colcoreout Material
Gray and Ton Cloy (CL) with Some Calcareous Material
Ton Cloy (CLl with Some Calcareous Material
Tan Sandy Clay (CL)
Fig. 5.1. Soil Profile for Test Site at Montopolis
43
o 1.0
1.0
2 .0
3.0
4 .0
5.0
::
" 6.0
Q. ~
0
7.0
8.0
9.0
10.0
Shear Strength, tsf
2.0 3.0 4.0
(Y;z Unconfined Compression) I Badillo Report
"-"-
"- ...... 'tJ,
'-
'p /
I I
I /
/I'!!l Situ Device
0
5.0
Fig. 5.2. Comparison of Shearing Resistances Measured with UT In Situ Devi ce and One-half Unconfined Compression Tests Results-,- ---
Montopolis Site
44
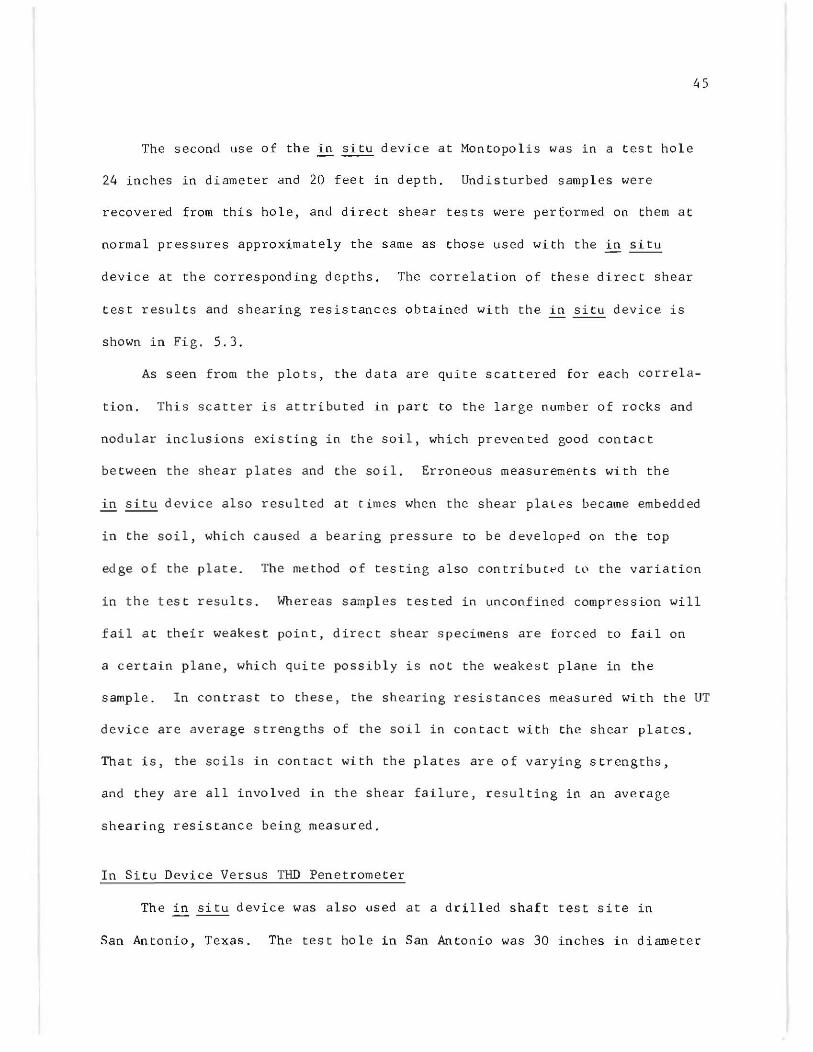
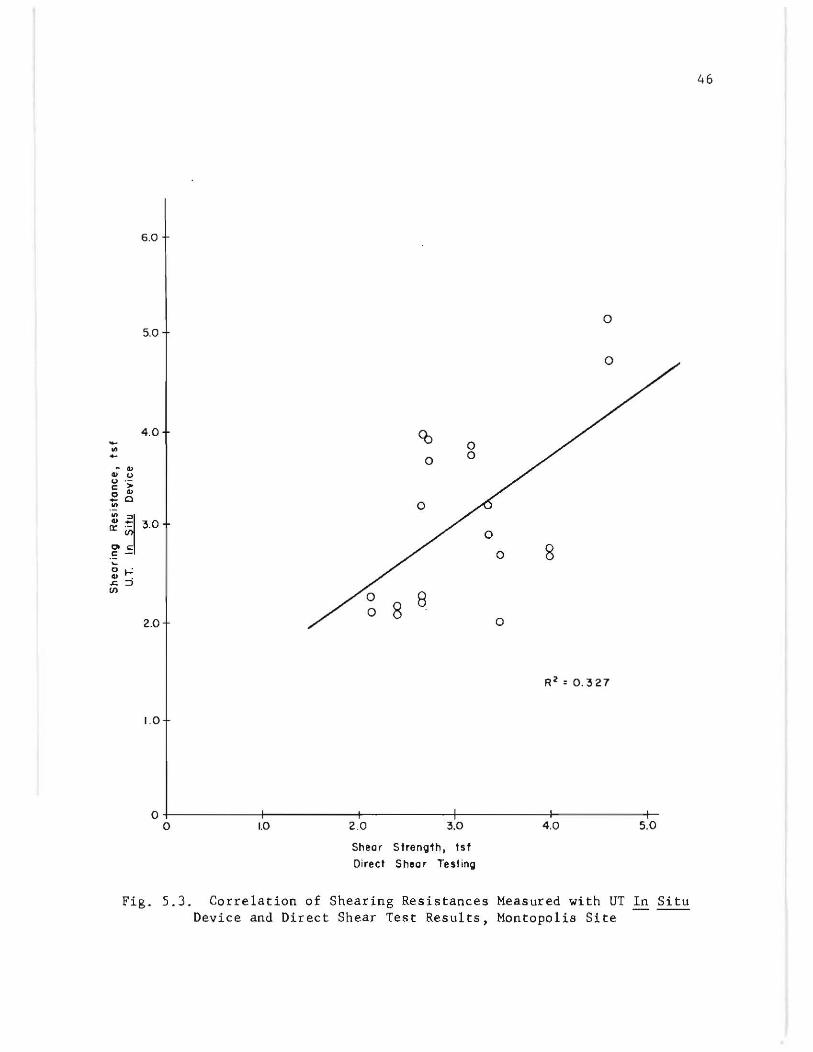
The second use of the in situ device at Montopolis was in a t es t hol e
24 inches in diameter and 20 feet in depth. Undisturbed samples were
recovered from this hole, and direct shear tests were performed on th em a t
normal pressures approximately the same as those used with the in situ
device at the corresponding depths. The correlation of these dir ec t s hea r
test results and shearing resistances obtained with the in situ device is
shown in Fi g. 5.3.
45
As seen from the plots, the data are quite scattered for each correla
t i on. This scatter is attributed in part to the large number of rocks and
nodular i nc l usions existing in the soil, which prevented good contact
be tw een th e shear plates and the soil. Erroneous measurements with the
i n situ d evi c e also resulted at tim es when the shear plales became embedded
in the soil, which caused a bearing press ure to be developed on the top
edge of the plate. The me thod of t es ting also contributed lp the variation
in th e t es t res ults . Wh ereas sampl es t es t ed in unconfined compression will
fail at their weakest pOint, direct s hear s pec imen s are fo rced to fail on
a certain plane, which quit e possibly i s not the weake s t plane in the
sample. In con trast to these, the s hear ing resistances measured with the UT
device are average strengths of the soil in contact with the shear plates.
That is, the soils in cont ac t with the plates are of varying strengths,
and they are all invo l ved i n th e shear failure, r esu lting in an average
shearing resistan ce being measured.
In Situ Device Versus THO Pene trome ter
The in situ devi ce was a lso used at a d rilled shaft test site in
San Antonio, Texas. The t es t hol e in San Antonio was 30 i nch es in diameter
46
6.0
o 5.0
o
4.0 -~ .; " " " .-c > c " -<> ~
~~ " - ~.O a:: .-
,,"c .: -~
c ,..: " :::i .c
'" 0
2.0 0
R>'0. ~27
1.0
0 0 1.0 2.0 ~.O 4 .0 5.0
Shear StrenQ'th, ts f Direct Shear TestinQ
Fig. S. J. Correlation of Shearing Resistances Measured with UT In Situ Device and Direct Shear Test Results, Montopolis Site
47
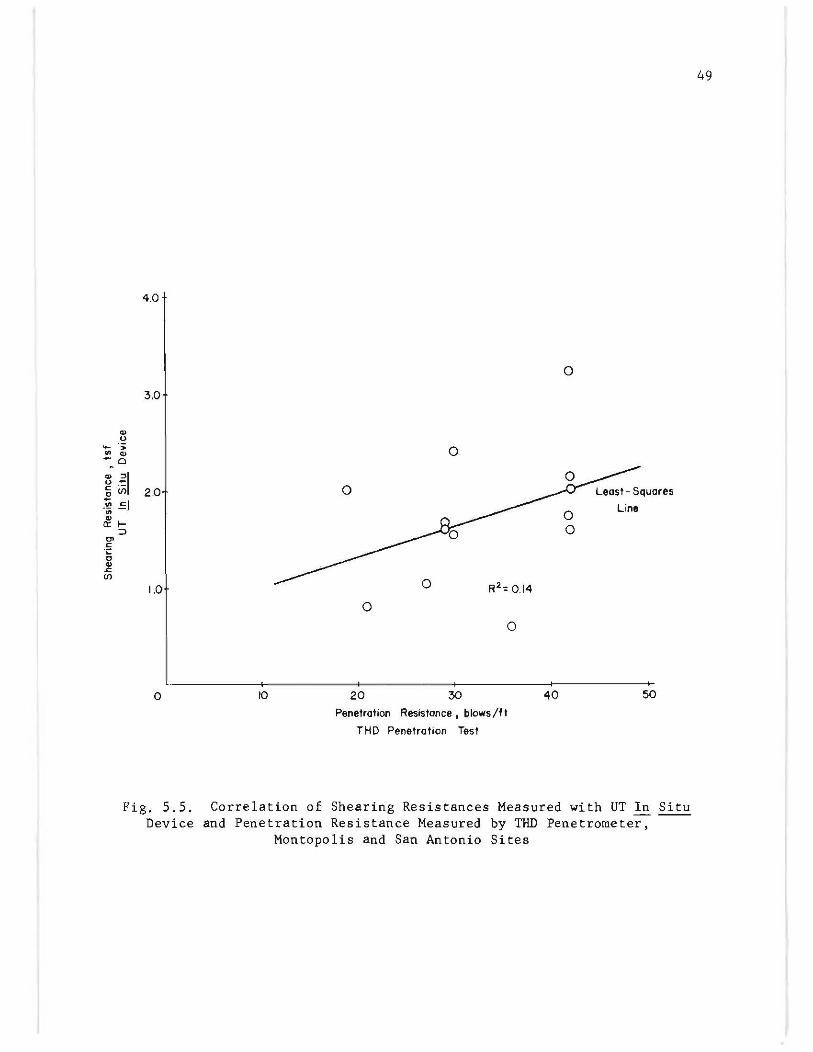
and 30 feet in depth. A soil profile of this s it e i s shown in Fig. 5.4.
The shearing resistance results of this test plus those from the Montopolis
tests were correlated with penetration resistance as measured by the THD
penetrome t er, which was also used to estimate soi l shear strengths at each
s it e. This cor relation (Fig. 5.5) was made to compare the UT in situ device
with a mOre established method of in s itu t es ting.
The low correlation i s attributed primarily to the difficulties
encountered with the UT device, such as embedding the shear plates and not
achieving good contact between the plates and the soil. Such condiLions
can res ult in excessive res istances being recorded in relatively wea k soils
and resistances below their actual va lues being recorded in s tronger soils.
However, the THD pene tration resistan ces (Refs. 22 and 32) are affected
by a number of fa c tors, which can cause the values to be unreliable. The
arbitrary placement of th e penetrometer for testing mayor may not result
in reli able average va lues of penetrat ion resistance being meas ured for
the soi ls encount ered . The presence of rocks and shells Can result in the
recording of resi s tan ces in excess of tho se actually existing in the soil
strata. The nonhomogeneous natur e o f soils and varying moisture conten ts
also add to the scatter of penetration resistance va lues which can be
measured in a soil s tratum.
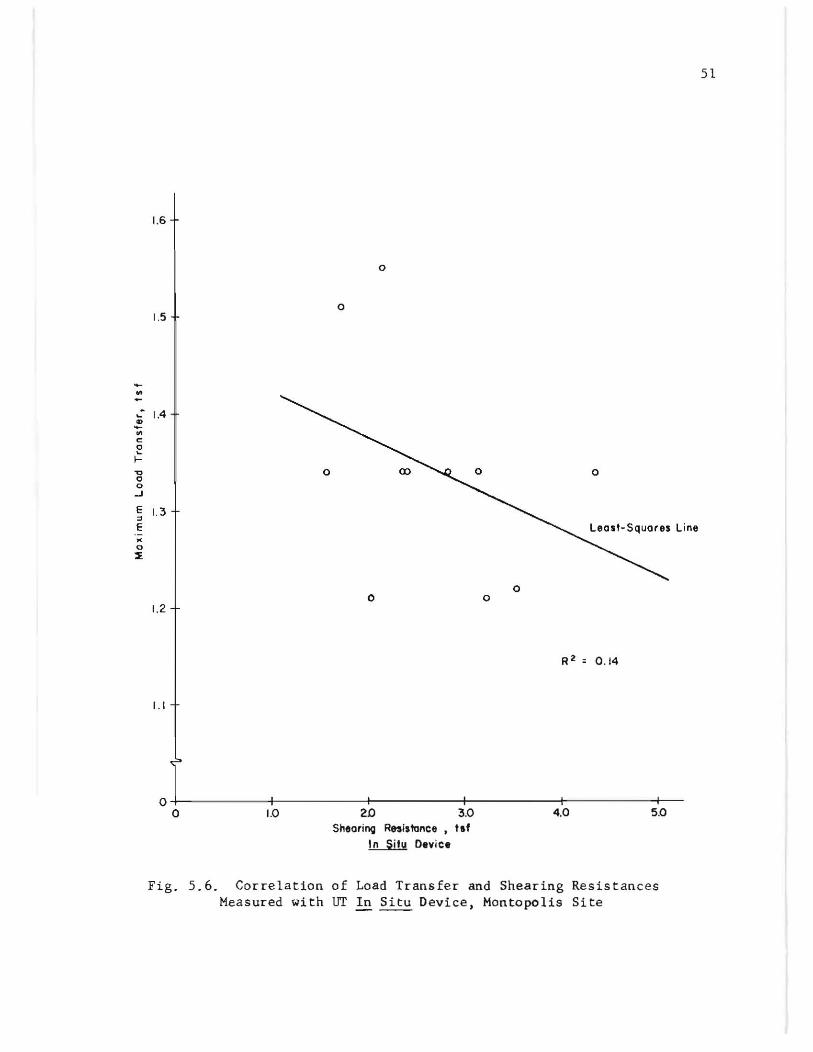
In Situ Device Versus Load Transf er
Essential to thi s study was the determination of how well the load
transfer in a drilled shaft could be estimated by using in situ testing
apparatus. A correlation was made be tween shearing resistances measured
with the in situ device and maximum load transfer values obtained from

o
10
20
30
40
50
Depth, ft. Description
Dark Gray Clay with Grayel, Seo Shells,
and Rool, (CH)
Yellow to Yellowish - Brown Clay with
Sea Shell. and Fin. Rools (CH)
Brown Clay Shale with Sea Shells and
Sandstone Layer (CL)
Bluish Gray Well-Bonded Cloy
Fig. 5.4. Soil Pro file fo r Tes t Site at San Antonio
48
4.0
3.0
~ 0 -.,
~ ~ 0
~ ~I o-II:: u; 2.0 l1 ·ili EJ &!f-
=> '" "E 0 .. ~ (f)
1.0
o 10
0
0
0 R2~ 0.14
0
0
20 30
Penetration Resistance I blows/ft
THD Penetration Test
0
0 Line
0
40 50
Fig. 5.5. Correlation of Shearing Resistances Measured with UT In Situ Device and Penetration Resistance Measured by THD Penetrometer,
Montopolis and San Antonio Sites
49

50
i ns trumented drilled shafts. This corr el ation was per formed for bo th the
Mon topo li s and San Antonio test sites . The results are shown in Figs. 5.6
and 5.7, r espec tively.
The correlation for the Mo ntopolis s it e is ve r y poor and also nega-
tive . Thi s lack of s ignificant correlation is attributed primarily to the
operational difficulties of the UT device noted above, s inc e the load trans -
fer values (Re f. 22) we re measured with accurate instrumentation and appear
t o be reliable.
The correlation for the San Antonio s ite is positive, but also quite
low. Two straight-line trends are noted in this data. The lower three
data points, which fall in a nearly horizontal lin e, r epresent test results
in the clay strata near the surface, and the increas ing shearing resistances
measured with the UT devi ce are primarily a ttributed to the partial embed-
ment of the shear plates during testing. In the harder shale and sandstone
strata at deeper depths, load transfer values increased appreciably with
depth. The in si tu device r esist an ces increas'ed likewise but at a lower - .--
rate. Nevertheless, the correlation of the data at this depth is fairly
good. The l oad transfer va lu es (Ref. 32) are measured with accurate
in s trumentation a nd appea r to be reliable.
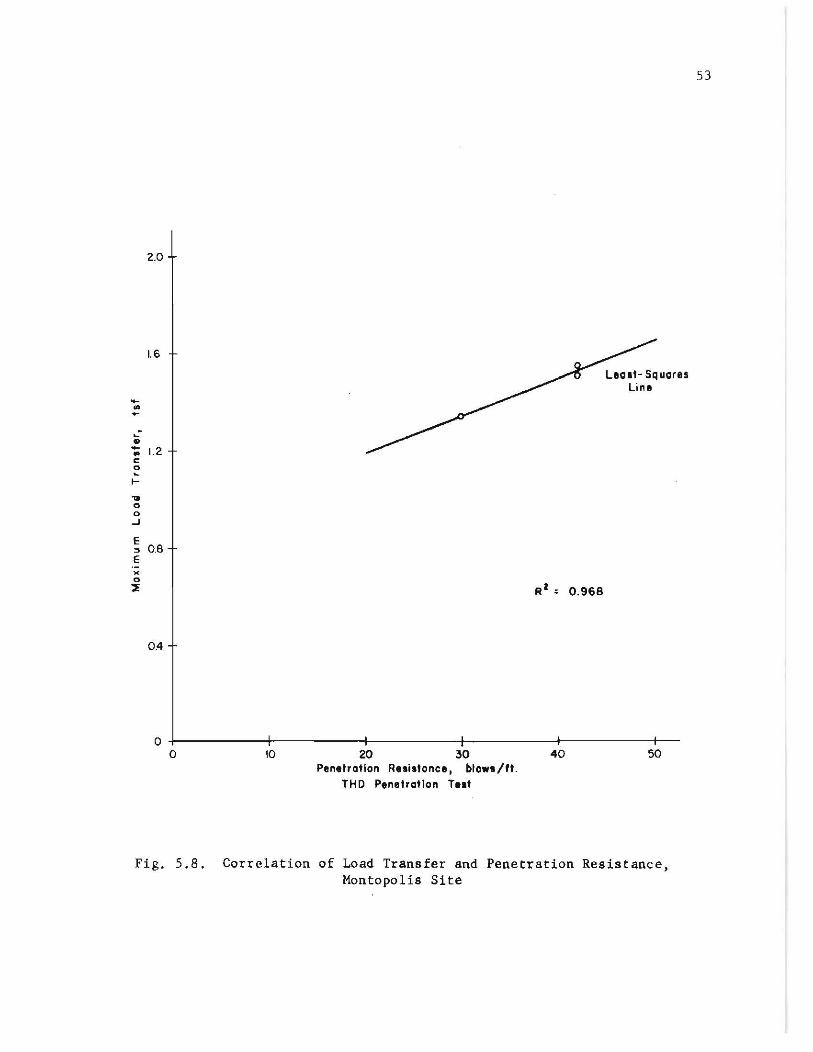
THD Penetrometer Ver s us Load Transfer
A corre la tion was likewise made be tween the THD penetromet er results
and load transfer t est result s in an effort to determine the extent that
load transfer could be es timated by penetration resistan ce . These corre-
lations for the two s ites are shown in Figs. 5.8 and 5.9. At each test site,
the correlation is quite hi gh , as shown by the R2 values of 0.968 and
~
-:'. ~
c 0
~ .., 0 0 ...J
E
" E w 0 ~
1.6
o
o 1.5
1.4
1.3
0 0 0
1.2
R' 0 . 14
1.1
o~--------~------~---------+---------r--------~o 1.0 20 3.0
Sneorino Resistance f taf ~ Deyice
4.0 5.0
Fig. 5.6. Correlation of Load Transfer and Shearing Resistances Measured with UT ~ Situ Device, Montopolis Site
51

14.0
12.0
10.0
o
o
o o o
0.5 1.0 1.5 2.0 2.5
Shearing Resistance I tsf I ill ~ Device
Fig. 5.7. Correlation of Load Transfer and Shearing Resistances Measured with UT In Situ Device, San Antonio Site
52
-~ ~ ..
2.0
1.6
':; I. 2 c o ~
I-
.,. o o ...J
E ~ 0.8 E
0.4
RZ , 0.968
Lea .t- Sq uares Line
0+---------4---------~--------~--------~--------~--o 10 20 30 40 50
Penetration R'.istonce, blows/ft. THO P.nel,allon Tnl
Fig. 5.8. Correlation of Load Transfer and Penetration Resistance, Montopolis Site
53

14 . .0
12.0
1.0 . .0
'E B.O
"C C
3 E ~
E .~
c ::I;
6 . .0
4 . .0
2 . .0
Least-Squares Line
o
.0 1.0.0 2.0.0 ~.o.o 4.0.0 5.0.0
Penetration Resistance I blows/ft
THO Penetration Test
Fig. 5.9. Correlation of Load Transfer and Penetration Resistance, San Antonio Site
54
6.0.0
55
0.962. From these R2 values, it may be interpreted that approximately
96 per c ent of the variation in load transfer values is linearly associated
with the variation in penetrometer values. The penetrome ter was consistent
in estimating load transfer values at each site.
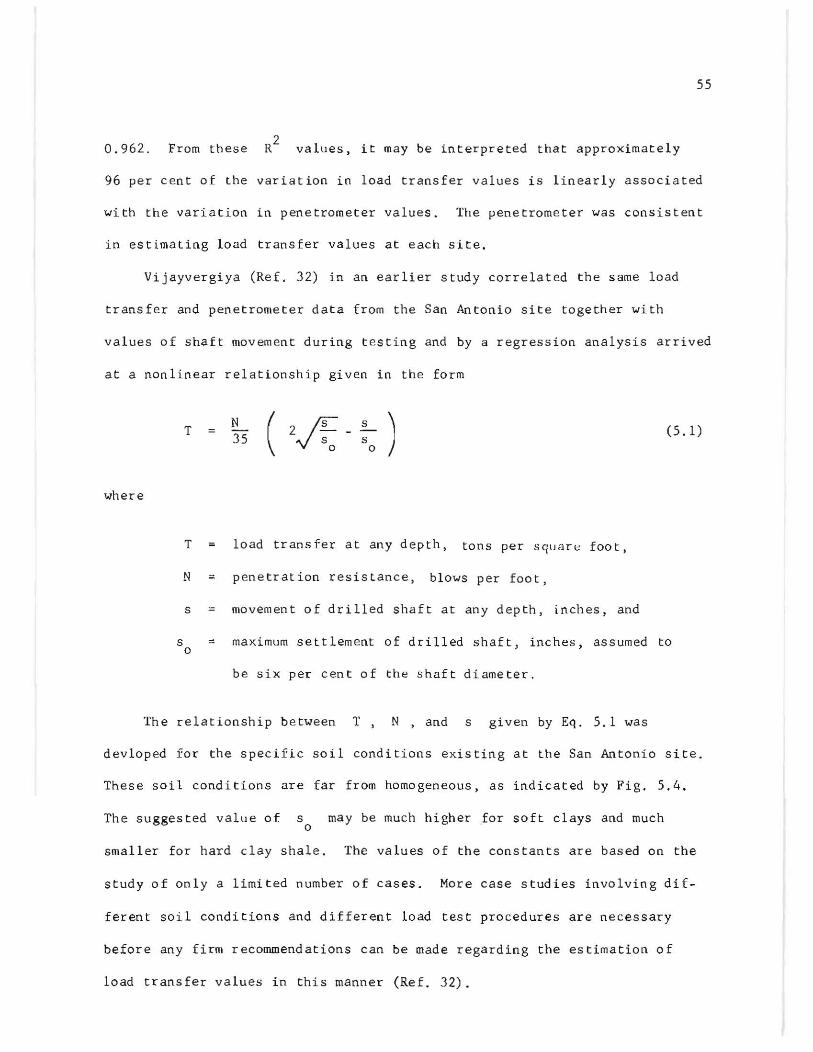
Vijayvergiya (Ref. 32) in an earlier study correlat ed the same load
transfe r and penetrometer data from the San Antonio site together with
values of shaft movem ent during t esting and by a regression analysis arrived
at a nonlinear relationship given in the form
where
T N 35 (
T lo ad transfer at any depth, tons per s qlJar~ foot,
N penetration resistance, blows per foot,
s ; movement of drilled shaft at any depth, inches, and
(5.1)
s = maximum settlem ent of drilled shaft, inches, assumed to o
be six per cent of the shaft diameter.
The relationship between T , N , and s gi ven by Eq. 5. 1 was
devloped for the specific soil conditions existing at the San Anton i o site.
These soil conditions are far from homogeneous, as indicated by Fig. 5.4.
The suggested value of s may be much higher for soft clays and much o
smaller for hard clay shale. The values of the constants are based on the
study of only a limited number of cases. More case studies involving dif-
ferent soil conditions and different load test procedures are necessary
before any firm recommendations can be made regarding the estimation of
load transfer values in this manner (Ref. 32).

CHAPTER 6
CONCLUSIONS AND RECOMMENDATIONS
Conclusions
Conclusions are drawn from these correlation studies and recommendations
are made concerning the future use of these three methods of in situ soil
testing as follows.
(1) Data available from other sources indicate that the Menard
Pressuremeter readings compare well with shear strengths measured
by conventional laboratory tests, and therefore the device may be
useful for determining in situ properties of homogeneous fine-
grained soils, but probably not for gravelly materials.
(2) Penetration res is tance measured with the Texas II ighway Departmen t
cone penetrometer appears to correlate well wi th maximum load
transfer values obtained from field tests of drilled shafts.
(3) The shearing resistances measured with The University of Texas
in situ device are not well correlated with either direct shear ---test results or with THO penetrometer results.
(4) There appears to be no significant correlation between the shear-
ing resistances measured with the UT in situ device and load
transfer tests results.
(5) In its present configuration, the UT in situ device has not
proven to be an effective means for determining soil properties.
56
57
Recormnenda tions
Based on the above conclusions, the following recommendations are made:
(1) The Menard Pressuremeter should be obtained for further study in
the Drilled Shaft Project, if possible. Shear strengths measured
with the pressuremeter should be correlated with laboratory soil
strengths and with load transfer field data.
(2) Use of the THD penetration tes t should continue at drilled shaft
tes t sites, with fu rther correlations being made between penetra
tion resistance and load transfer values.
(3) Use of the UT in situ device in its present design should be
discontinued unless and until it can be greatly improved. Two
needed revisions are (a) a means of unwinding equal lengths of
cable on each end of the horizontal ram to assure that the ram
is in a level position ,.,hen at the proper depth for testing, and
(b) a means of applying the pull-out force at a steady rate to
assure a constant shearing rate of the soil.
In summary, no additional work seemS warranted on the device at the
present time.
REFERENCES
1. Begemann, H. K. S., "Improved Method of Determining Resis tance to Adhesion by Sounding Through a Loose Sleeve Placed Behind the Cone," Proceedings of the Third International Conference on Soil Mechanics and Foundation Engineering, Vol. I, 1953, p. 17,
2. Begemann, H. K. S., liThe Friction Jacket Cone as an Aid in Determining The Soil Profile," Proceedings of the Sixth International Conference on Soil Mechanics and Foundation Engineering, Montreal, Vo 1. I, 1965, p. 17,
3. Blight, G. E., "Obs e r vations on the Shear Testing of Indurated Fissured Clays," Proceedings, Geotechnical Conference, Oslo, 1967, p. 97.
4. Calhoon, M. L., IIPressuremeter Field Testing of Soils," Civil Engineering, July 1969, pp. 71-74,
5. Chellis, R. D., rrpile Foundations/I Foundation Engineering, edited by G, A. Leonards, McGraw-Hill Book Company, Inc., New York, 1962, p, 643,
6. De Mello, V. F, B., "Foundations of Iluildings in Clay," State of the Art Volume, Seventh International Conference on Soil Mechanics and Foundation Engin eering, Mexico, 1969, pp. H3-84, and 92-94.
7. De Mello, V. F. B., et ai, "Some Field Gorrelations on Dynamic Penetration Resistances in Exploratory Borings, by GeotecnicoBrasil, II Proceedings, Firs I:. Pan American Conference, Mexico J
Vol. I, 1959, p. 959.
8. Gibson, R, E., ,nd W. F. Anderson, "In-Situ Measurement of Soil Properties with the Pressuremeter,11 Civil Engineer ing and Public Works ReView, Vol, 56, No, 658, May 1961 .
9, Goulet, G., "Comparison Entre Les Resultats de Chargement Statique d' un Pieu et Les Previsions Dedui ts des Ess a is-Geotechniques, II Sols-Soils, Vol. III, No. II, 19 64 , p. 21.
10. Higgins, C. M., "Pressuremeter Correlation Study," Re search Report No. 31, Louisiana Department of Highways, January 1969.
58
11. Juarez-Badillo, E., I'Drilled Shaft Project Soil Inv e stigation,!! unpublished report to The Univ ersity of Texas at Austin, Austin, Texas, June 1966.
12. Karst, H., and F. Bourges, "Remblais Sur Sols Compre ssibles," A.I.T.B.T.P., No. 203, Paris, 1964.
13. Marsal, R. J., L. R. de Arellano, and J. M. Campos, "Field Text on Fissured Clay Shales," Comi s ion Federal de Electricidad, Mexico, D. F., February 1965.
14. Menard, 1., "Calcul de la Force Portante des Fondations Sur la Base des Resultats Pressiometriques," Sol s -Sail s , Vol. 2, No.5, 1963, p. 9.
15. Menard, L., IIL 1 evaluation des Tassements-Tendanc es Nouvelles,ll Sols-Soils, Vol. I, Nos. 1 and 3, 1962.
59
16. Menard, L. , "The Ceocel Pres suremeter-Interpretation of a Pressuremeter Test," unpublished (avail able from Geocel Incorporated, 16027 West Fifth Avenue, Golden, Colorado 80401).
17. Meyerhof, G. G., "Penetration Tests and Bearing Capaci ty of Cohesionless SOi18,11 Proceedings of the American Society of Civil Engineers, Vol. S2, SM1, 1956.
IS. Mori, H. and S. Tajima, "The Application of Pressiometer Nethod to the Design of Deep Foundations," Soil and Foundations, Tokyo, February 1964.
19. Peck, R., and W. Reed, "Engineering Properties of Chicago Subsoils," Bulletin No. 423, University or Illinois, Urbana, Illinois, 1954.
20. Peck, R. B., W. E. Hanson, and J. H. Thornburn, Foundation Engineering, Eleventh Printing, John Wiley and Sons, Inc., New York, 1953, pp. lOS-Ill.
21. Pellegrino, M. A., Discussion Session 3B, Fifth International Conference , Paris, Vol. III, 1961, p. 273.
22. Reese, L. C., and W. R. Hudson, "Field Testing of Drilled Shafts to Develop Design Methods," Research Report No. 89-1, Center for Highway Research, The University of Texas at Austin, April 1968.
23. Schmertmann, J. H., "Static Cone Penetrometers for Soil Exploration," Civil Engineering, June 1967, pp. 71-74.
24. Skempton, A. W., and A. W. Bishop, "The Measurement of the Shear Strength of Soils," Geotechnique, No.2, 1950, p. 90.

25. Sowers, G. B., and G. F. Sowers, Introductory Soil Mechanics and Foundations, Second Edition, The MacMillan Company, New York, 1961, p. 358 .
26. Sowers, G. F. J lIModern Procedures for Underground Investigations," Proceedings of the Fifth International Conference on Soil Mechanics and Foundation Engineering, Paris, Vol. II, 1954, p. 143.
27. Taylor, D. W., Soil Mechanics, Sixteenth Printing, John Wiley and Sons, Inc., New York, 1967, p. 82.
28. Terzaghi, K., and R. B. Peck, Soil Mechanics in Engineering Practice, Second Edition, John Wiley and Sons, Inc., New York, 1967, pp. 304, 319-324.
29. Texas Highway Department, Foundation Exploration and Design Manual, January 1964.
30. Thomas, D. J IIStatic Penetration Tests in London Clay , !! Geotechnique, Vol. 15, No.2, 1965, p. 174.
60
31. Trow, W. A., "Deep Sounding Methods for Evaluating the Bearing Capacity of Foundations in Soil," Proceed i ngs, Fifth Canadian Soil Mechanics Conference, 1952, p. 23.
32. Vijayvergiya, V. N., W. R. Hudson, and L. C. Reese, "Load Distribution for a Drilled Shaft in Clay Shale," Research Report No. 89-5, Center for Highway Research, The University of Texas at Austin, November 1968.
33. Ward, W. H., et al, "Properties of the London Clay at the Ashford Common Shaft," Geotechnique, Vol. XV, No.4, 1965, p. 321.
34. Wu, T. H., Soil Mechanics, Third Printing, Allyn and Bacon, Inc., Boston, 1966, pp. 380-382.
THE AUTHORS
David B. Campbell was formerly a Research Engineer
Assistant with the Center for Highway Research at The
University of Texas at Austin. He was primarily concerned
with research in the area of estimating soil properties in
situ and estimating load transfer values obtained from
drilled shaft tests.
W. Ronald Hudson is an Associate Professor of Civil
Engineering and Associate Dean of the College of Engineering
at The University of Texas at Austin. He has had a wide
variety of experience as a research engineer with the Texas
Highway Department and the Center for Highway Research at
The University of Texas at Austin and was Assistant Chief
of the Rigid Pavement Research Branch of the AASHO Road Test. He is the
author of numerous publications and was the recipient of the 1967 ASCE
J. James R. Croes Medal. He is presently concerned with research in the
areas of (1) analysis and design of pavement management systems, (2) measure
ment of pavement roughness performance, (3) slab analysis and deSign, and
(4) tensile strength of stabilized subbase materials.
61