Embed Size (px)
Citation preview
The Determinants of Capital Structure: Evidence from an Economy
Without Stock Market*
Ignacio Munyoξ
Abstract
This paper analyzes the determinants of the sources of funding for the firms of an economy without stock market. Once the available and relevant financial sources for a Uruguayan firm are defined, their determinants are analyzed through cross section econometric models. The analysis casts out that size, tangibility and profitability are influencing variables in the financial structure. The less profitable firms are those mainly financed through external funding. The firms with a bigger proportion of tangible assets have easier access to long-term banking credit. On the other hand, the firms which do not possess these features or the ones which present a smaller relative proportion of these will tend to get financing through trade credit lines.
Key Words: Corporate finance, capital structure, leverage, tobit models JEL-Classification: G 3, G 32, C 34
ξCentre for the Study of Economic and Social Affairs (CERES). E-mail: [email protected] The views expressed herein are those of the author and not necessarily of the CERES.
*I wish to thank Juan Dubra for very helpful comments and Valentina de Yeregui for efficient research assistance. The author alone is responsible for the errors that remain in the paper.
1 Introduction This research is a contribution to the existing debate as to which theory is the most appropriate to explain the capital structure of firms. In particular, providing evidence for an economy like the Uruguayan in which there is a total lack of access at the corporate level information, and the stock market is not developed. The capital market is generally a modest financial source for firms in developing economies. In the Uruguayan case it becomes an extremely marginal alternative for the companies, almost inexistent. It goes beyond the objectives of this work to set the reasons for this reality, which makes the Uruguayan economy an interesting case study. The aim of this research is to study the structure of corporate finance in an economy without stock market: an empirical investigation based on Uruguayan case. The vast majority of previous empirical works analyses the capital structure of firms in economies with highly developed stock markets.1 Others studies analyses firms that quotes in the stock market in economies with non developed stock market.2 The comparative advantage of this paper is that study the determinants of capital structure of the most representative firms of a developing economy. These antecedents of developing economies do not take into account the key issue of the topic. The firms have severe constrains to access to the stock market for funding and the access of firm level information is in general only available for this “elite” of firms that quotes in the stock market. For this reason the empirical evidence faces to a trade-off between availability of information and accuracy of the sample. This work was motivated by the access to a new source of information, the balance sheet data base of Nation’s Internal Audit (NIA) of Uruguay. This data base comprises the universe of firms which abiding by the regulation in force, have registered their balance sheets, in the previously mentioned controlling public institution.3 The companies comprising this data base belong to the most diverse sectors of the economic activity, such as primary sector, manufacturing, construction, commerce, and other services. This population of firms represents 43% of the GDP of Uruguay in terms of Operational Income and 45% in terms of Assets. In the first place, the structure of assets as well as the capital structure of an average Uruguayan firm is analyzed. Therein is observed that 40% of the financing is done through equity and the remaining 60% is financed through external funding. The latter is divided in approximately three equal parts, bank debt, commercial debt and other liabilities. Only 11% of the assets are financed through long-term debt. Once the available and relevant financial sources for a Uruguayan company are defined, their determinants are then analyzed by the use of cross section econometric models. First, the paper analyzes the financial determinants for external funding and then it proceeds into the specific analysis of two main sources, bank debt and trade credit. Next, the research analyzes the determinants of the maturity structure of this debt.
1 Such Gupta(1969), Nadiri (1969), Herbst (1974), Taub, J. (1975), Titman and Wessels (1988), MacKie-Mason (1989), Barclay and Smith (1995), Cantillo and Wright (1995), Rajan and Zingales (1995), Peterson and Rajan (1997), Caprio and Demirgüç-Kunt (1998), Bevan and Danbolt (2000), Chen and Jiang (2001), Fisman and Love (2001), Denis and Mihov (2002), Mateut and Mizen (2002). 2 Such Singh and Hamid (1992), Schiantarelli and Srivastava (1996), Bentancor (1999), Booth et al. (2001), Finotti and Fama (2001), Prasad et al. (2001), Green et al. (2002), Huang and Song (2002). 3 According to Article 61 of Law 17243, enacted on June 29, 2000, those firms, whatever their form, whose total assets at the closing of each annual balance surpass the 30,000 Uruguayan Readjustable Units (UR) (approx. U$S 418,300, taking average period values) or who register within the same period net operational incomes surpassing 100,000 UR (approx. U$S 1,394,400), should register before the public control institution (NIA) their balance sheets within 180 days following the closing of its economic exercise.
The analysis casts out that size, tangibility and profitability are key variables in the financial structure of the Uruguayan companies. In general terms, the less profitable firms are those mainly financed through external funding. The big companies with a higher ratio of tangible assets have an easier access to long-term banking credit. On the other hand, the companies which do not possess these features or the ones which present a smaller relative proportion will tend to get financing through commercial credit. In none of these cases the capital market is a financing alternative for the Uruguayan firms, since none of the randomly selected firm’s quotes in the stock market neither as stocks nor securities. This paper does not analyze any dynamic issues, and this is of course a limitation. The reason for such a shortcoming is there were only available those balance sheets dating back from the time of the enactment of the law - June 2000. A second limitation was that given the characteristics of the analyzed population, there is a certain bias toward big firms in terms of assets and operational income.
2 Data The present research is done based on the population of the 3,758 companies registered at the NIA by July 2003. This population was corrected by excluding the Investment Financial Corporations and the Duty-Free Zone User Corporations as well as those companies pertaining to the financial sector. The reason for this correction lies on the specific features of the previously mentioned companies which leaves them aside from the research goals.4 In order to define the period of study, those balances with closing dates within July 1, 2001 and June 30, 2002 were classified as belonging to the 2001 fiscal year. Those balances with registered closing dates within July 1, 2002 and June 30, 2003 are considered as pertaining to the 2002 fiscal year. For the sake of the research, only those balances included in the 2001 exercise were considered. This is because the vast majority of registered balances at the NIA are in that year and very few companies have registered their balance sheets in the following year. On the other hand, the year 2002 can be considered as an atypical case for the Uruguayan economy due to the particular events that characterized it.5 In short, after performing all the above mentioned adjustments, it was left a population of 1,669 non-financial private companies.6 Having defined the population, according to the restraints of the balance sheets, it was taken a sample of 500 companies, the data is not available in electronic format, and they would not allow access of a RA to the papers. This was the maximum amount that could be obtained at the NIA. For this reason, the size of the sample was considered as data to perform the sampling and not as a control variable of the research. To select the sample it was sought to maximize the information gathered in it through the random stratified sampling procedure.7 Since random sampling does not guarantee average representation,
4 The main activities of the Investment Financial Corporations (IFC) is to make investments abroad. The IFCs can only have a few assets in country like bank accounts in foreign currency or stocks in other IFCs. While they do not perform any activity in Uruguay, the only tax to be paid is the annual 0.3% over its capital and reserves or over abilities in case the last doubles the amount composed by capital and reserves. On the other hand, the Duty-Free Zone User Corporations are capable of performing industrial and commercial activities or providing services at the IFCs. The law grants a generic and total exemption that includes all current national taxes on those to be created excluding those regarding social security. The financial companies where excluded from this research due to the differential features their financial structures present in the same way as Rajan y Zingales (1995) y Drobetz y Fix (2003). 5 The Uruguayan economy suffered a severe financial crisis with bank run. The deep 2002 economic crisis determined an 11% slump of the GDP. 6 For the sake of consolidating balances with different closing dates, all the values were expressed on December 2001 prices adjusted by the Consumer Price Index (CPI) evolution. It was not taken into account in the analysis the possibility of the usage of different adjustment criteria of the companies’ accounting information. This implies supposing that these criteria have all been adjusted before the closing date. 7 This procedure consists of dividing the population of N individuals in L subpopulations or stratums which do not overlap with the respective sizes N1, N2, ..., NL, such as N1 + N2 +...+ NL = N.
this type of sampling seeks to assure that each group, previously defined, is present in the sample. In order to define the stratums and to assign each sample to the appropriate place, it is necessary to determine what variable will be used. In this case, there was information available about size, measured by total assets, and about the activity sector where each company belongs to.
For the specification of sectors, the population under study was divided in terms of equivalence with the International Standard Industrial Classification - Third Revision (ISIC-III).8
Chart I: ISIC-III
INTERNATIONAL STANDARD INDUSTRIAL CLASSIFICATION Third Revision
A) Agriculture, hunting and forestry. I) Transport, storage and communications. B) Fishing. J) Financial intermediation. C) Mining and quarrying. K) Real estate, renting and business activities. D) Manufacturing. L) Public administration and defence; compulsory social security. E) Electricity, gas and water supply. M) Education. F) Construction. N) Health and social work. G) Wholesale and retail trade; repair of motor vehicles, O) Other community, social and personal service activities. motorcycles and personal and household goods P) Private households with employed persons. H) Hotels and restaurants. Q) Extra-territorial organizations and bodies.
In order to perform the sampling, according to the research objectives, priority was given to minimizing the probability of losing information about any activity sector. Thus the selection is based on the fact that the size variable - the other variable by which the sample could have been stratified - is limited by the proper characteristics of the population.9 Finally the following strata are left.
Chart II: Definition of Sectors
Sector ISIC-III # Firms
Primary A 93
Manufacturing D 403
Construction F 76
Commerce G 708
Other Services H, I, K, L, M, O 389
1669
Once the strata are defined, the criterion followed to the distribution of the sample units was the Neyman’s Optimum Allocation.10 This procedure makes the allocation in a way that minimizes the appraiser’s variance of a given cost of information collection or once having fixed the variance admitted for the appraiser, to minimize the cost in the collection of samples. After defining Lev (Leverage) as the random sampling variable, it can then be defined the
random variable over each stratum: iLev as the mean value of Lev considering a sample of
size ni for each stratum. Let )( iLevV be the total variance of the previously mentioned
8 The groups Agriculture, Hunting and Forestry (A) Manufacturing (D), Construction (F) and Commerce (G) were defined as sectors in the research. For the sake of sampling and due to the insignificance of the total population’s size of each group, it was decided to omit groups Fishing (B) and Electricity, Gas and Water Supply (E) and to group sectors H, I, K, M, N and O in one sector titled Other Services. As it was previously established, the companies belonging to the Financial Sector (J) were left aside. At the time of performing the research there was no observations in the NIA’s data base of rest of the groups of ISIC-III. 9 It must be remembered that NIA’s data base is composed by companies whose assets at the closing of each Fiscal Year surpass 30,000 UR (approx. U$S 418,300) or those who register net operational incomes over the same period greater than 100,000 UR (approx. U$S 1,394,400). 10 Due to Neyman (1934).
variable at random, 2ˆiσ the variance for each stratum and Ni, the population for each
stratum. Then the optimum allocation will be defined from the minimization of the following expression with n = 500.
j
L
jj
iiii
L
i N
NnnLevV
σ
σˆ
ˆ)(
1
1 ∑∑
=
= ⋅
⋅⋅=⇒
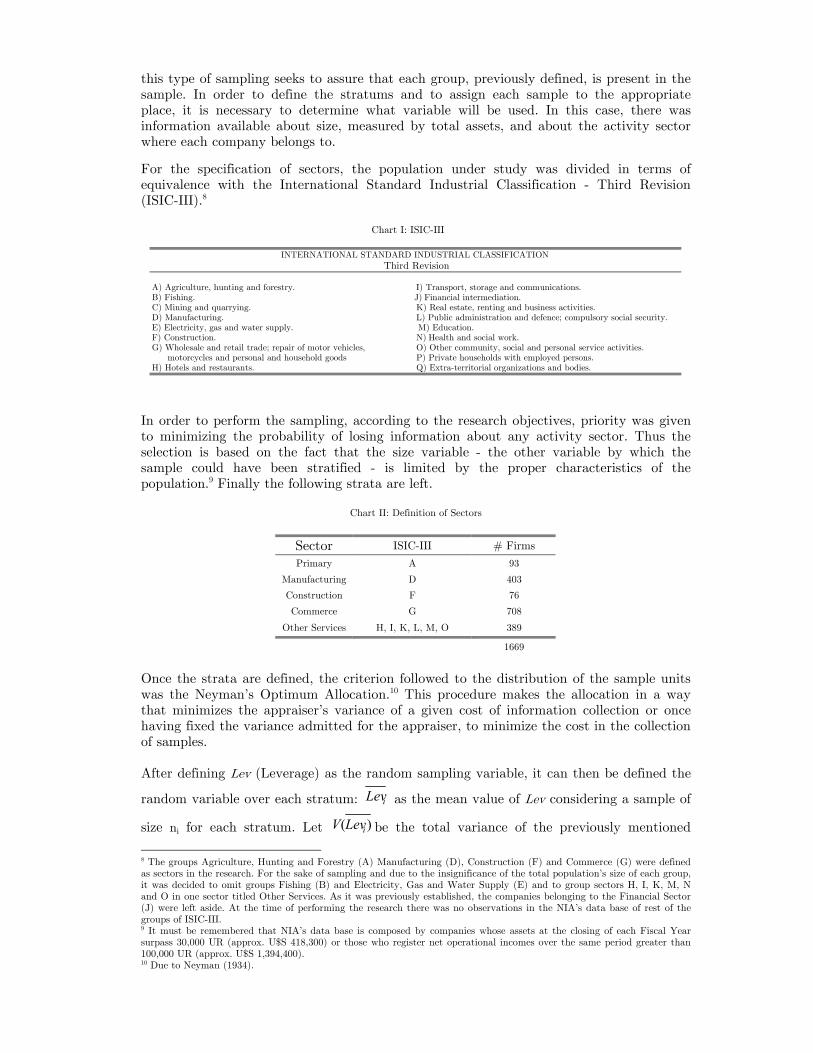
In Chart III the results from Neyman’s Optimum Allocation are presented for the specified variable and also to show how the allocation would have been in the case of having chosen the proportional allocation.11 Once the allocation has been defined, a random sample from each stratum is taken. Chart IV compares the size of the obtained sample with the variables at the population level.
Chart III: Sample Allocation
Sector Neyman´s Allocation Proportional
Primary 37 28
Manufacturing 114 121
Construction 17 23 Commerce 229 212
Other Services 103 116 500 500
Chart IV: Size of the Sample (Thousands of Uruguayan constant pesos of December 2001)
Sector Assets Liabilities Op. Income
Population 8.659.869 4.419.911 3.977.479
Sample 1.450.176 439.202 481.228 Primary
% Population 17% 10% 12%
Population 36.462.007 20.721.501 33.085.618
Sample 11.008.614 5.948.299 9.687.169 Manufacturing
% Population 30% 29% 29%
Population 2.544.561 1.629.372 2.308.778
Sample 746.918 434.080 960.966 Construction
% Population 29% 27% 42%
Population 44.103.711 32.846.097 47.008.552
Sample 9.998.763 7.056.738 16.454.612 Commerce
% Population 23% 21% 35%
Population 19.081.002 11.830.884 20.071.044
Sample 4.561.413 2.618.484 4.443.526 Other Services
% Population 24% 22% 22%
Population 110.851.150 71.447.766 106.451.471
%GDP 45% 29% 43%
Sample 27.765.883 16.496.804 32.027.501 TOTAL
% Population 25% 23% 30%
11 The proportional allocation defines the size in direct relationship to the population of each stratum following a
proportional allocation. Let ni be the size of each of the samples taken form each stratum such that : Lnnnn +++= ...21 . The allocation will be proportional if each stratum’s size is proportional to the corresponding size of the stratum
related to the total population NN
nn ii ⋅= Li ,...,1=
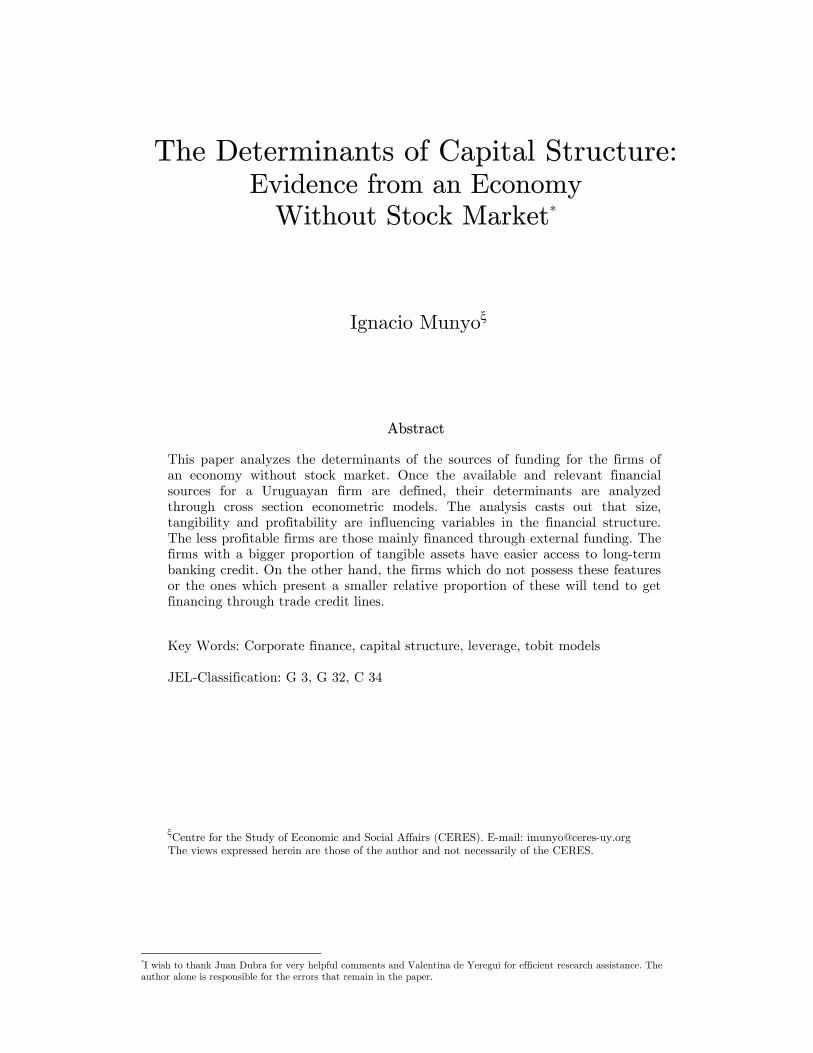
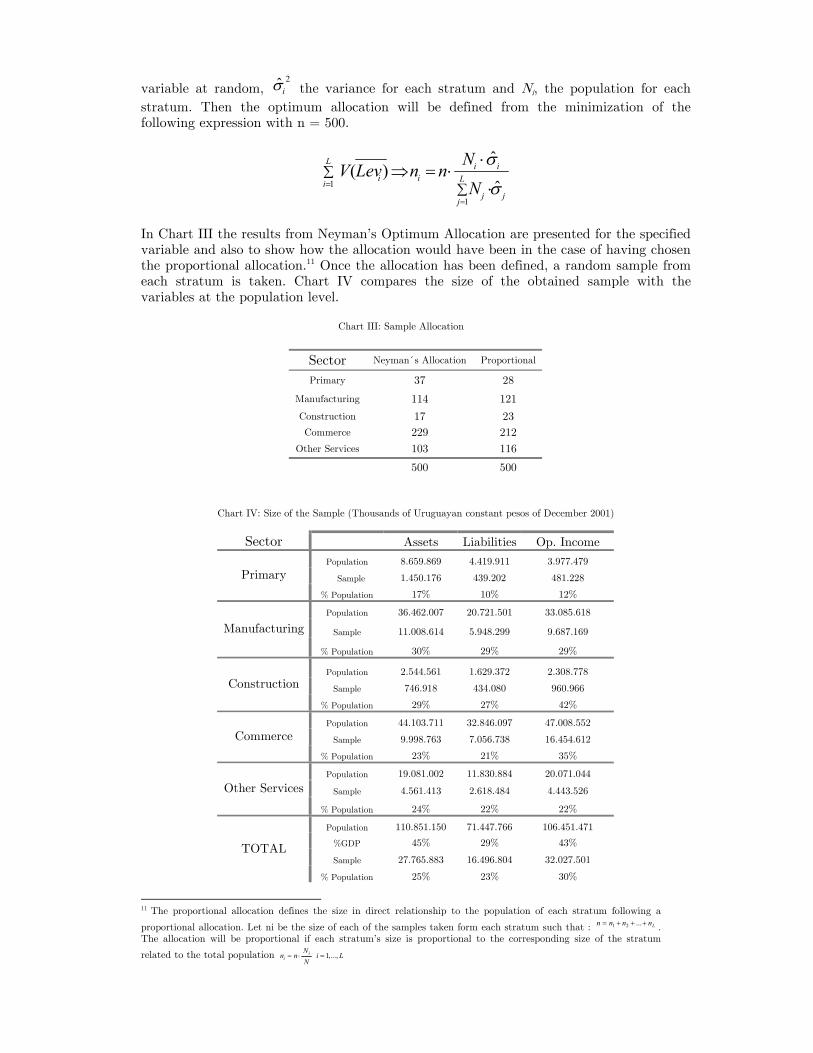
In a fast description of the sample, it is observed a composition of assets where 4% belong to Cash Assets, 19% to Inventories, 31% to Fixed Assets and a remaining 46% to Other Assets. From the financial aspect, it can be found that the portion that auto finances itself is 41%. While external financing is divided in similar proportions between Bank Credit, Commercial Credit and Other Liabilities (20%, 19% and 21% respectively). Only 11% of the assets are financed though long-term debt. It is not possible to make a relevant comparison of these results at the international level. This is due to the fact that in the greatest part of the works that have been done are included firms which rank in the stocks market; however, none of the companies taken from the sample of this research meets this condition. Moreover it is also due to the differences in the definitions of the Leverage used, fundamentally which debt should be included in the numerator.
Figure I: Financial Structure of an Average Uruguayan Firm
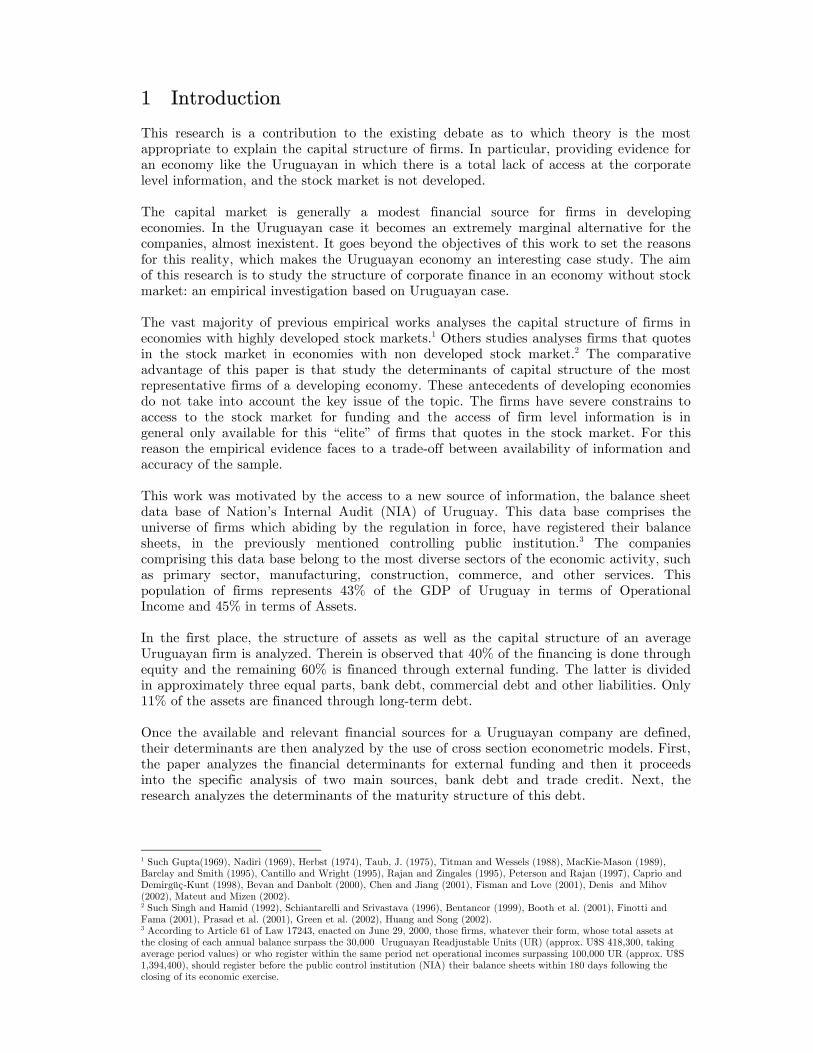
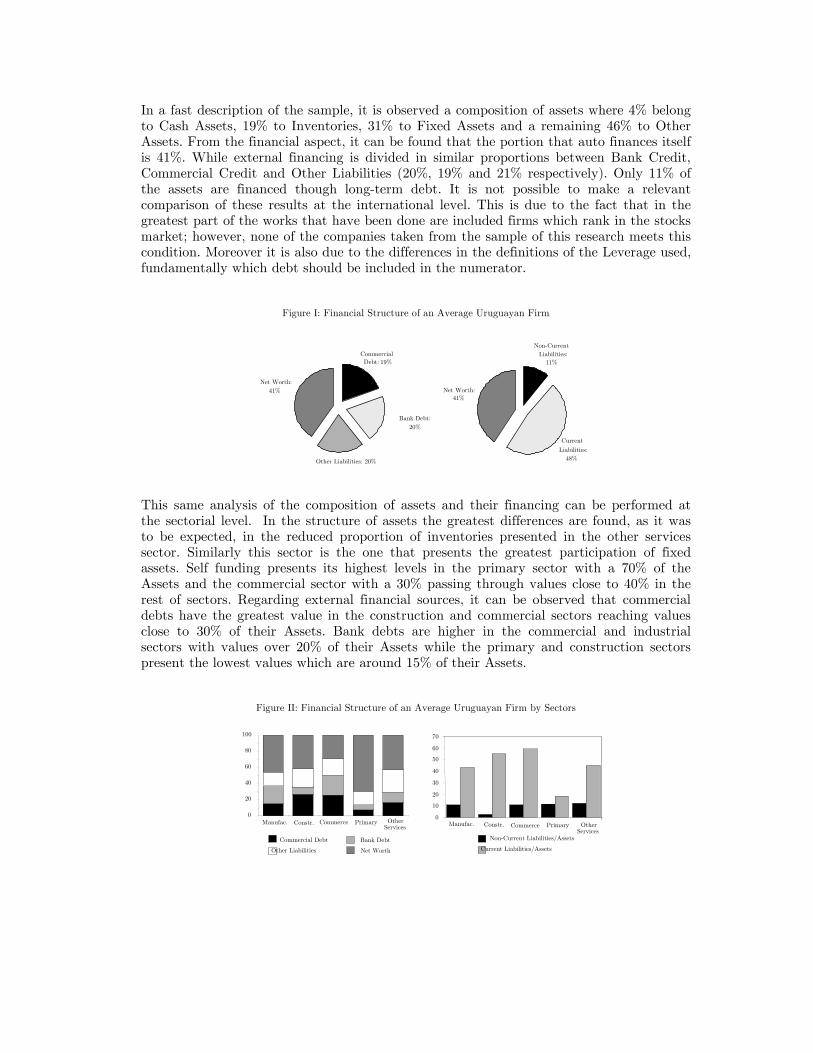
This same analysis of the composition of assets and their financing can be performed at the sectorial level. In the structure of assets the greatest differences are found, as it was to be expected, in the reduced proportion of inventories presented in the other services sector. Similarly this sector is the one that presents the greatest participation of fixed assets. Self funding presents its highest levels in the primary sector with a 70% of the Assets and the commercial sector with a 30% passing through values close to 40% in the rest of sectors. Regarding external financial sources, it can be observed that commercial debts have the greatest value in the construction and commercial sectors reaching values close to 30% of their Assets. Bank debts are higher in the commercial and industrial sectors with values over 20% of their Assets while the primary and construction sectors present the lowest values which are around 15% of their Assets.
Figure II: Financial Structure of an Average Uruguayan Firm by Sectors
0
20
40
60
80
100
Manufac. Constr. Commerce Primary Other Services
Commercial Debt Bank Debt
Net Worth
0
10
20
30
40
50
60
70
Manufac. Constr. Commerce Primary Other Services
Non-Current Liabilities/Assets
Net Worth: 41%
Other Liabilities: 20%
Commercial Debt: 19%
Bank Debt: 20%
Non-Current Liabilities:
11%
Current
Liabilities: 48%
Net Worth: 41%
Other Liabilities Current Liabilities/Assets
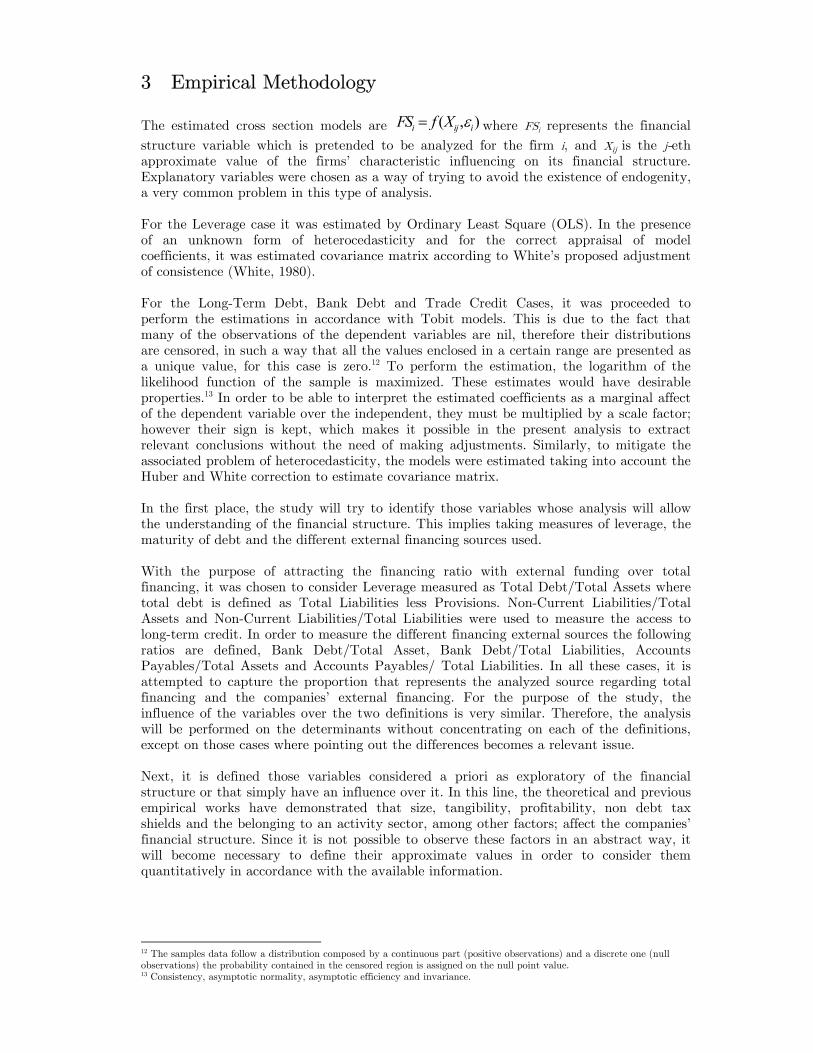
3 Empirical Methodology The estimated cross section models are ( , )i ij iFS f X ε= where FSi represents the financial
structure variable which is pretended to be analyzed for the firm i, and Xij is the j-eth approximate value of the firms’ characteristic influencing on its financial structure. Explanatory variables were chosen as a way of trying to avoid the existence of endogenity, a very common problem in this type of analysis. For the Leverage case it was estimated by Ordinary Least Square (OLS). In the presence of an unknown form of heterocedasticity and for the correct appraisal of model coefficients, it was estimated covariance matrix according to White’s proposed adjustment of consistence (White, 1980). For the Long-Term Debt, Bank Debt and Trade Credit Cases, it was proceeded to perform the estimations in accordance with Tobit models. This is due to the fact that many of the observations of the dependent variables are nil, therefore their distributions are censored, in such a way that all the values enclosed in a certain range are presented as a unique value, for this case is zero.12 To perform the estimation, the logarithm of the likelihood function of the sample is maximized. These estimates would have desirable properties.13 In order to be able to interpret the estimated coefficients as a marginal affect of the dependent variable over the independent, they must be multiplied by a scale factor; however their sign is kept, which makes it possible in the present analysis to extract relevant conclusions without the need of making adjustments. Similarly, to mitigate the associated problem of heterocedasticity, the models were estimated taking into account the Huber and White correction to estimate covariance matrix. In the first place, the study will try to identify those variables whose analysis will allow the understanding of the financial structure. This implies taking measures of leverage, the maturity of debt and the different external financing sources used. With the purpose of attracting the financing ratio with external funding over total financing, it was chosen to consider Leverage measured as Total Debt/Total Assets where total debt is defined as Total Liabilities less Provisions. Non-Current Liabilities/Total Assets and Non-Current Liabilities/Total Liabilities were used to measure the access to long-term credit. In order to measure the different financing external sources the following ratios are defined, Bank Debt/Total Asset, Bank Debt/Total Liabilities, Accounts Payables/Total Assets and Accounts Payables/ Total Liabilities. In all these cases, it is attempted to capture the proportion that represents the analyzed source regarding total financing and the companies’ external financing. For the purpose of the study, the influence of the variables over the two definitions is very similar. Therefore, the analysis will be performed on the determinants without concentrating on each of the definitions, except on those cases where pointing out the differences becomes a relevant issue. Next, it is defined those variables considered a priori as exploratory of the financial structure or that simply have an influence over it. In this line, the theoretical and previous empirical works have demonstrated that size, tangibility, profitability, non debt tax shields and the belonging to an activity sector, among other factors; affect the companies’ financial structure. Since it is not possible to observe these factors in an abstract way, it will become necessary to define their approximate values in order to consider them quantitatively in accordance with the available information.
12 The samples data follow a distribution composed by a continuous part (positive observations) and a discrete one (null observations) the probability contained in the censored region is assigned on the null point value. 13 Consistency, asymptotic normality, asymptotic efficiency and invariance.
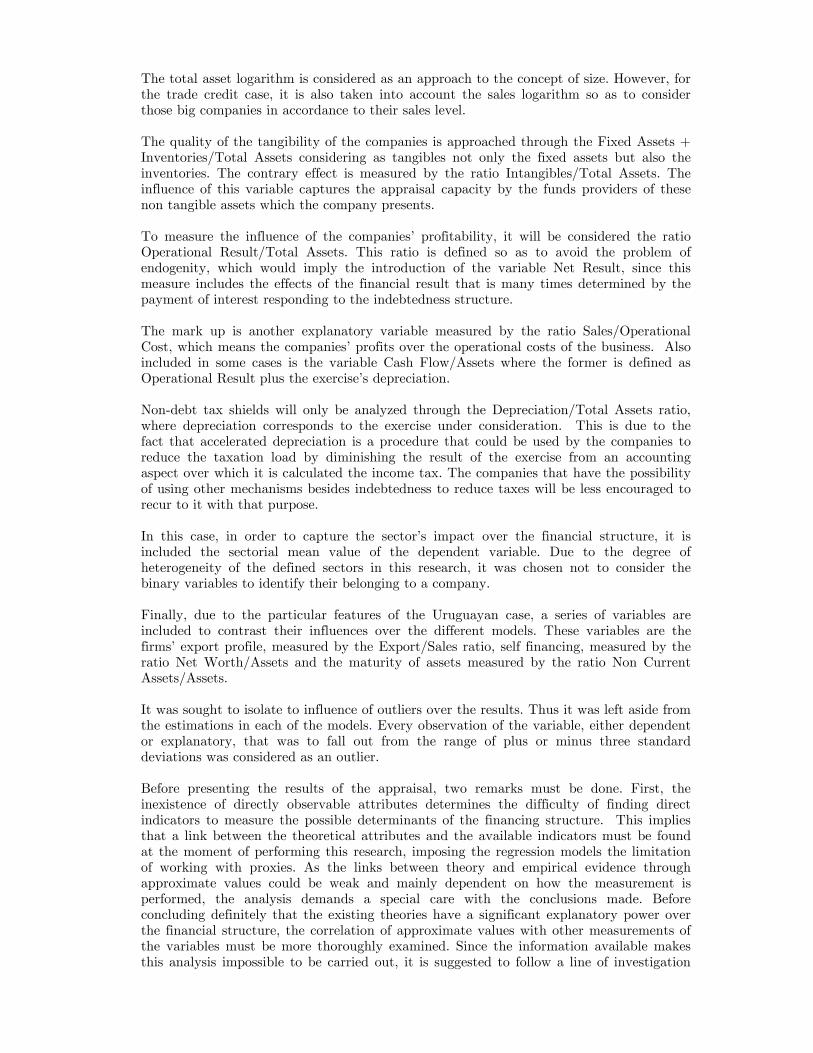
The total asset logarithm is considered as an approach to the concept of size. However, for the trade credit case, it is also taken into account the sales logarithm so as to consider those big companies in accordance to their sales level. The quality of the tangibility of the companies is approached through the Fixed Assets + Inventories/Total Assets considering as tangibles not only the fixed assets but also the inventories. The contrary effect is measured by the ratio Intangibles/Total Assets. The influence of this variable captures the appraisal capacity by the funds providers of these non tangible assets which the company presents. To measure the influence of the companies’ profitability, it will be considered the ratio Operational Result/Total Assets. This ratio is defined so as to avoid the problem of endogenity, which would imply the introduction of the variable Net Result, since this measure includes the effects of the financial result that is many times determined by the payment of interest responding to the indebtedness structure. The mark up is another explanatory variable measured by the ratio Sales/Operational Cost, which means the companies’ profits over the operational costs of the business. Also included in some cases is the variable Cash Flow/Assets where the former is defined as Operational Result plus the exercise’s depreciation. Non-debt tax shields will only be analyzed through the Depreciation/Total Assets ratio, where depreciation corresponds to the exercise under consideration. This is due to the fact that accelerated depreciation is a procedure that could be used by the companies to reduce the taxation load by diminishing the result of the exercise from an accounting aspect over which it is calculated the income tax. The companies that have the possibility of using other mechanisms besides indebtedness to reduce taxes will be less encouraged to recur to it with that purpose. In this case, in order to capture the sector’s impact over the financial structure, it is included the sectorial mean value of the dependent variable. Due to the degree of heterogeneity of the defined sectors in this research, it was chosen not to consider the binary variables to identify their belonging to a company. Finally, due to the particular features of the Uruguayan case, a series of variables are included to contrast their influences over the different models. These variables are the firms’ export profile, measured by the Export/Sales ratio, self financing, measured by the ratio Net Worth/Assets and the maturity of assets measured by the ratio Non Current Assets/Assets. It was sought to isolate to influence of outliers over the results. Thus it was left aside from the estimations in each of the models. Every observation of the variable, either dependent or explanatory, that was to fall out from the range of plus or minus three standard deviations was considered as an outlier. Before presenting the results of the appraisal, two remarks must be done. First, the inexistence of directly observable attributes determines the difficulty of finding direct indicators to measure the possible determinants of the financing structure. This implies that a link between the theoretical attributes and the available indicators must be found at the moment of performing this research, imposing the regression models the limitation of working with proxies. As the links between theory and empirical evidence through approximate values could be weak and mainly dependent on how the measurement is performed, the analysis demands a special care with the conclusions made. Before concluding definitely that the existing theories have a significant explanatory power over the financial structure, the correlation of approximate values with other measurements of the variables must be more thoroughly examined. Since the information available makes this analysis impossible to be carried out, it is suggested to follow a line of investigation
that explores more deeply these aspects as done by Bevan and Danbolt (2000).14 Secondly, there are certain variables that were not analyzed due to the impossibility of having access to them. These variables have been analyzed in other works, showing that they can influence the financial structure. Among them are the age of companies, their property and the tradable nature of their production.
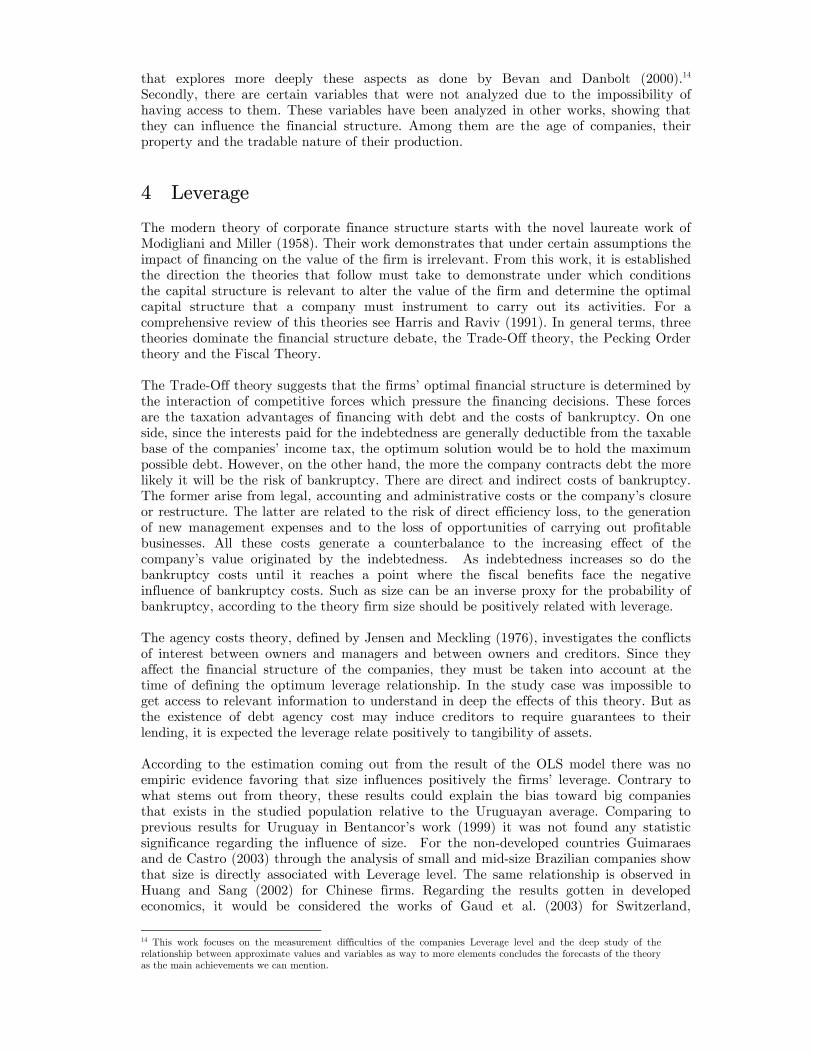
4 Leverage
The modern theory of corporate finance structure starts with the novel laureate work of Modigliani and Miller (1958). Their work demonstrates that under certain assumptions the impact of financing on the value of the firm is irrelevant. From this work, it is established the direction the theories that follow must take to demonstrate under which conditions the capital structure is relevant to alter the value of the firm and determine the optimal capital structure that a company must instrument to carry out its activities. For a comprehensive review of this theories see Harris and Raviv (1991). In general terms, three theories dominate the financial structure debate, the Trade-Off theory, the Pecking Order theory and the Fiscal Theory. The Trade-Off theory suggests that the firms’ optimal financial structure is determined by the interaction of competitive forces which pressure the financing decisions. These forces are the taxation advantages of financing with debt and the costs of bankruptcy. On one side, since the interests paid for the indebtedness are generally deductible from the taxable base of the companies’ income tax, the optimum solution would be to hold the maximum possible debt. However, on the other hand, the more the company contracts debt the more likely it will be the risk of bankruptcy. There are direct and indirect costs of bankruptcy. The former arise from legal, accounting and administrative costs or the company’s closure or restructure. The latter are related to the risk of direct efficiency loss, to the generation of new management expenses and to the loss of opportunities of carrying out profitable businesses. All these costs generate a counterbalance to the increasing effect of the company’s value originated by the indebtedness. As indebtedness increases so do the bankruptcy costs until it reaches a point where the fiscal benefits face the negative influence of bankruptcy costs. Such as size can be an inverse proxy for the probability of bankruptcy, according to the theory firm size should be positively related with leverage. The agency costs theory, defined by Jensen and Meckling (1976), investigates the conflicts of interest between owners and managers and between owners and creditors. Since they affect the financial structure of the companies, they must be taken into account at the time of defining the optimum leverage relationship. In the study case was impossible to get access to relevant information to understand in deep the effects of this theory. But as the existence of debt agency cost may induce creditors to require guarantees to their lending, it is expected the leverage relate positively to tangibility of assets. According to the estimation coming out from the result of the OLS model there was no empiric evidence favoring that size influences positively the firms’ leverage. Contrary to what stems out from theory, these results could explain the bias toward big companies that exists in the studied population relative to the Uruguayan average. Comparing to previous results for Uruguay in Bentancor’s work (1999) it was not found any statistic significance regarding the influence of size. For the non-developed countries Guimaraes and de Castro (2003) through the analysis of small and mid-size Brazilian companies show that size is directly associated with Leverage level. The same relationship is observed in Huang and Sang (2002) for Chinese firms. Regarding the results gotten in developed economics, it would be considered the works of Gaud et al. (2003) for Switzerland,
14 This work focuses on the measurement difficulties of the companies Leverage level and the deep study of the relationship between approximate values and variables as way to more elements concludes the forecasts of the theory as the main achievements we can mention.
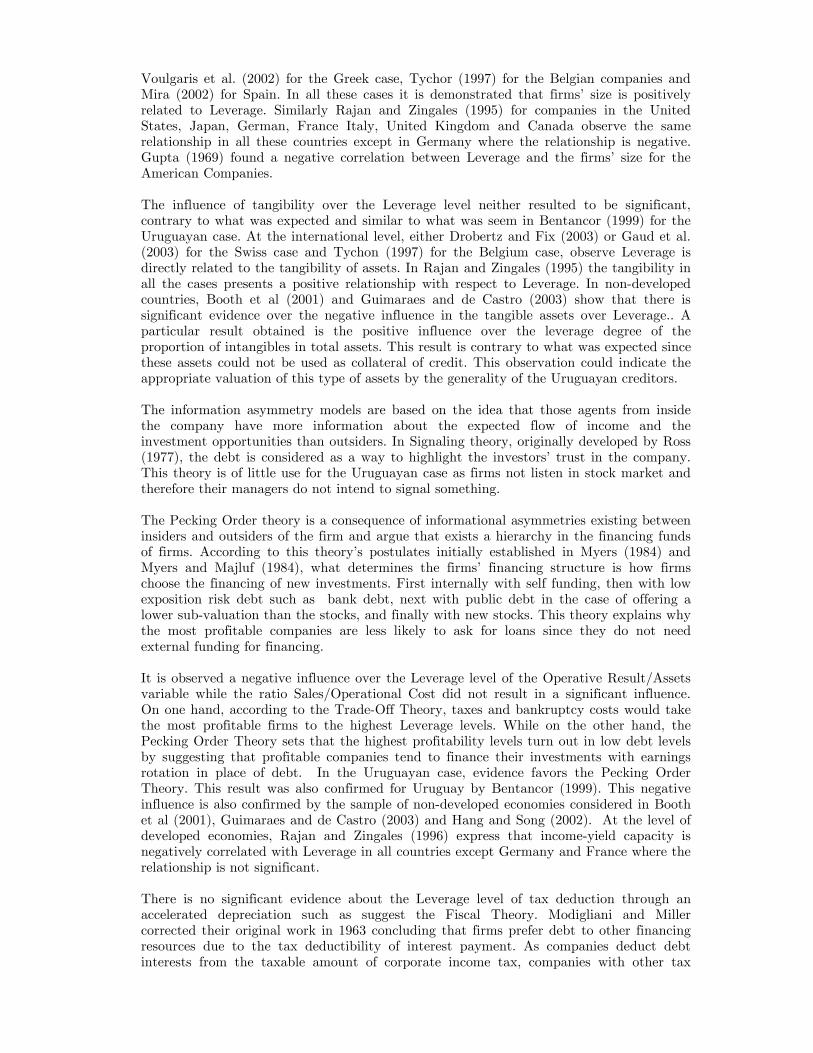
Voulgaris et al. (2002) for the Greek case, Tychor (1997) for the Belgian companies and Mira (2002) for Spain. In all these cases it is demonstrated that firms’ size is positively related to Leverage. Similarly Rajan and Zingales (1995) for companies in the United States, Japan, German, France Italy, United Kingdom and Canada observe the same relationship in all these countries except in Germany where the relationship is negative. Gupta (1969) found a negative correlation between Leverage and the firms’ size for the American Companies. The influence of tangibility over the Leverage level neither resulted to be significant, contrary to what was expected and similar to what was seem in Bentancor (1999) for the Uruguayan case. At the international level, either Drobertz and Fix (2003) or Gaud et al. (2003) for the Swiss case and Tychon (1997) for the Belgium case, observe Leverage is directly related to the tangibility of assets. In Rajan and Zingales (1995) the tangibility in all the cases presents a positive relationship with respect to Leverage. In non-developed countries, Booth et al (2001) and Guimaraes and de Castro (2003) show that there is significant evidence over the negative influence in the tangible assets over Leverage.. A particular result obtained is the positive influence over the leverage degree of the proportion of intangibles in total assets. This result is contrary to what was expected since these assets could not be used as collateral of credit. This observation could indicate the appropriate valuation of this type of assets by the generality of the Uruguayan creditors. The information asymmetry models are based on the idea that those agents from inside the company have more information about the expected flow of income and the investment opportunities than outsiders. In Signaling theory, originally developed by Ross (1977), the debt is considered as a way to highlight the investors’ trust in the company. This theory is of little use for the Uruguayan case as firms not listen in stock market and therefore their managers do not intend to signal something. The Pecking Order theory is a consequence of informational asymmetries existing between insiders and outsiders of the firm and argue that exists a hierarchy in the financing funds of firms. According to this theory’s postulates initially established in Myers (1984) and Myers and Majluf (1984), what determines the firms’ financing structure is how firms choose the financing of new investments. First internally with self funding, then with low exposition risk debt such as bank debt, next with public debt in the case of offering a lower sub-valuation than the stocks, and finally with new stocks. This theory explains why the most profitable companies are less likely to ask for loans since they do not need external funding for financing. It is observed a negative influence over the Leverage level of the Operative Result/Assets variable while the ratio Sales/Operational Cost did not result in a significant influence. On one hand, according to the Trade-Off Theory, taxes and bankruptcy costs would take the most profitable firms to the highest Leverage levels. While on the other hand, the Pecking Order Theory sets that the highest profitability levels turn out in low debt levels by suggesting that profitable companies tend to finance their investments with earnings rotation in place of debt. In the Uruguayan case, evidence favors the Pecking Order Theory. This result was also confirmed for Uruguay by Bentancor (1999). This negative influence is also confirmed by the sample of non-developed economies considered in Booth et al (2001), Guimaraes and de Castro (2003) and Hang and Song (2002). At the level of developed economies, Rajan and Zingales (1996) express that income-yield capacity is negatively correlated with Leverage in all countries except Germany and France where the relationship is not significant. There is no significant evidence about the Leverage level of tax deduction through an accelerated depreciation such as suggest the Fiscal Theory. Modigliani and Miller corrected their original work in 1963 concluding that firms prefer debt to other financing resources due to the tax deductibility of interest payment. As companies deduct debt interests from the taxable amount of corporate income tax, companies with other tax
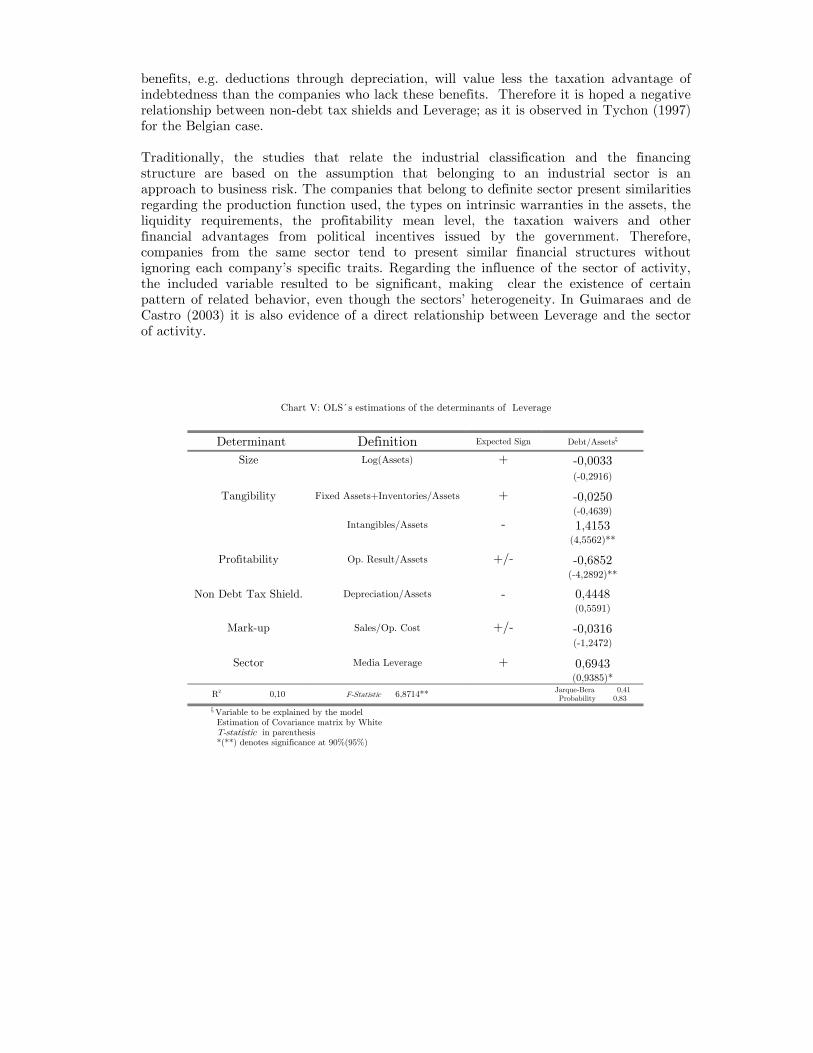
benefits, e.g. deductions through depreciation, will value less the taxation advantage of indebtedness than the companies who lack these benefits. Therefore it is hoped a negative relationship between non-debt tax shields and Leverage; as it is observed in Tychon (1997) for the Belgian case. Traditionally, the studies that relate the industrial classification and the financing structure are based on the assumption that belonging to an industrial sector is an approach to business risk. The companies that belong to definite sector present similarities regarding the production function used, the types on intrinsic warranties in the assets, the liquidity requirements, the profitability mean level, the taxation waivers and other financial advantages from political incentives issued by the government. Therefore, companies from the same sector tend to present similar financial structures without ignoring each company’s specific traits. Regarding the influence of the sector of activity, the included variable resulted to be significant, making clear the existence of certain pattern of related behavior, even though the sectors’ heterogeneity. In Guimaraes and de Castro (2003) it is also evidence of a direct relationship between Leverage and the sector of activity.
Chart V: OLS´s estimations of the determinants of Leverage
Determinant Definition Expected Sign Debt/Assetsξ
Size Log(Assets) + -0,0033 (-0,2916)
Tangibility Fixed Assets+Inventories/Assets + -0,0250 (-0,4639) Intangibles/Assets - 1,4153 (4,5562)**
Profitability Op. Result/Assets +/- -0,6852 (-4,2892)**
Non Debt Tax Shield. Depreciation/Assets - 0,4448 (0,5591)
Mark-up Sales/Op. Cost +/- -0,0316 (-1,2472)
Sector Media Leverage + 0,6943 (0,9385)*
R2 0,10 F-Statistic 6,8714** Jarque-Bera 0,41
Probability 0,83 ξ Variable to be explained by the model Estimation of Covariance matrix by White T-statistic in parenthesis *(**) denotes significance at 90%(95%)
5 Maturity Structure
The short-term credit presents certain advantages over long-term financing. In the first place, short-term debts could increase the efficiency of the firm acting as a disciplinarian factor due to the continuous tracking by the creditors. In the second place, long-term debt many times allows companies, which would be more socially desirable to be closed, to continue to operate. This loss of efficiency is mainly produced when the access to long-term credit is facilitated through subsidies. It must be said, in a third place, that the structure of terms affects the speed of adjustment with which companies react to adverse shocks; existing evidence favoring the short-term credit of indebted companies (Ofek, 1993). Finally, the structure of debt is also related to the quality and profitability of existing projects. Diamond (1991,1993) establishes that companies that have internal information related to positive expectations about their performance would rather look for a short-term finance option so as to benefit from the better conditions at the time of renegotiating the debt agreements after the disclosure of the new information.
The optimal debt maturity, besides being influenced by macroeconomic and institutional factors is determined by a series of visible parameters at the corporate level. Among these parameters are growth opportunities, project income return capacity, the possibility of self-funding the project, the value of assets and the size of the company. The last variable is key since a small company faces great difficulties to get long-term financing, mainly because they lack significant collaterals. At the same time, because big companies have a greater negotiation and lobbying power, they have an easier access to long-term credit. Another important aspect to point out is the trend to match the expiration of their assets and liabilities which determines the faster the investment returns are gotten the lesser the optimum expiration structure will be. The results of the estimations are found in accordance to what was expected and are meaningful enough to explain the influence of the size and tangibility features. It is possible to conclude that companies with a bigger proportion of tangible assets are more likely to finance through Long-Term Debt. The results are similar to the ones obtained by Bentancor (1999). In non-developed economies empirical works concludes that size and tangibility affects positively the proportion of long-term debt, see Booth et al. (2001), Jaramillo and Finotti and Fama (2001), Schiantarelli (2002), Huang and Song (2002). Comparing to developed economies, Titman and Wissels (1988) and Barday and Smith (1995) found that in the case of the American companies, the biggest ones present a relatively greater long term debt in their financial structure. Without reaching the necessary significance levels, evidence is not enough to verify for the Uruguayan case that the more profitable firms prefer short-term indebtedness. A similar result was gotten in Bentacor’s work (1999). It was expected to see that those companies with the best operational results would get short-term financing in order to take advantage of the better conditions in the successive negotiations in terms of debt contract. For non-developed economies, specifically in the Brazilian case, Finotti and Fama (2001) also observe that there is a positive influence in profitability over long term indebtedness. On the contrary, debt term decreases with profitability for the Chinese case. In the case of United Kingdom and Italy, Schiantarelli and Sembenelli (1997) conclude that the most profitable companies tend to present a greater proportion of long-term debts. If there is significant evidence in favor of the trend to match the maturity of assets and liabilities, it would confirm the intention by the firms of avoiding liquidity problems at the time the expirations are due. Schiantarelli and Sembenelli (1997) observe a similar relationship for United Kingdom and Italy. The sectorial variable is not significant in this case to explain long-term debt. During the whole research it was not possible to appropriately capture the influence of the activity
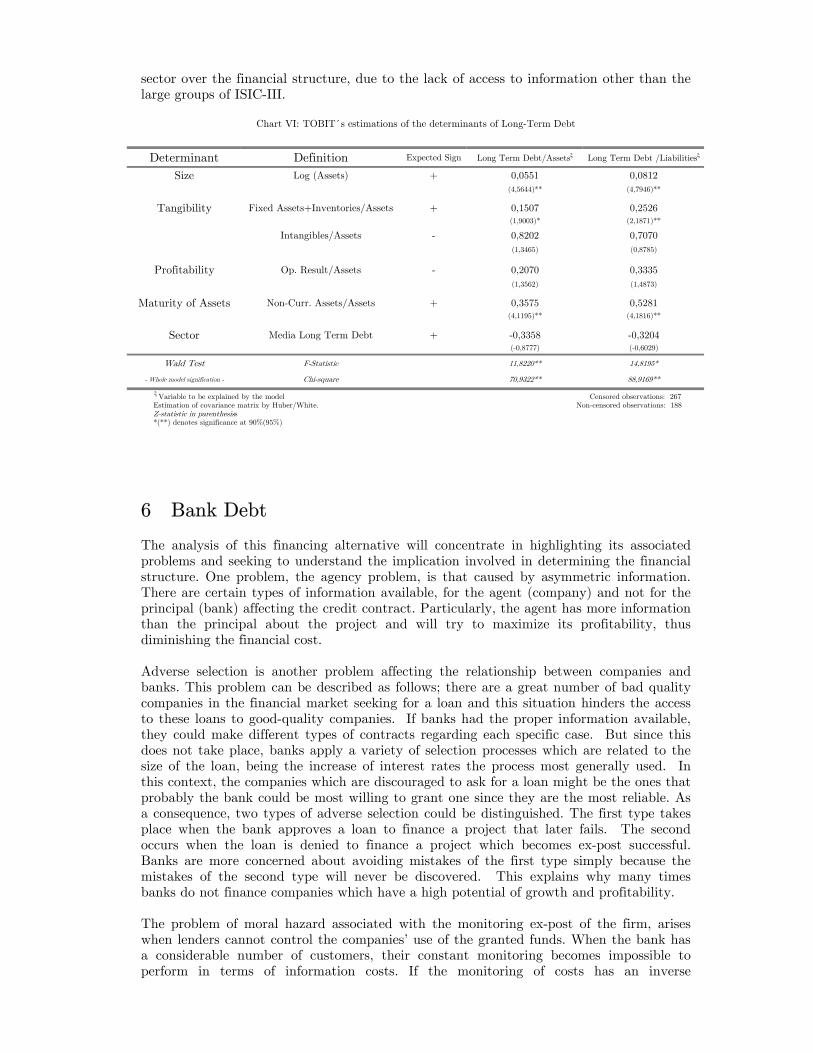
sector over the financial structure, due to the lack of access to information other than the large groups of ISIC-III.
Chart VI: TOBIT´s estimations of the determinants of Long-Term Debt
Determinant Definition Expected Sign Long Term Debt/Assetsξ Long Term Debt /Liabilitiesξ
Size Log (Assets) + 0,0551 0,0812
(4,5644)** (4,7946)**
Tangibility Fixed Assets+Inventories/Assets + 0,1507 0,2526 (1,9003)* (2,1871)**
Intangibles/Assets - 0,8202 0,7070
(1,3465) (0,8785)
Profitability Op. Result/Assets - 0,2070 0,3335
(1,3562) (1,4873)
Maturity of Assets Non-Curr. Assets/Assets + 0,3575 0,5281 (4,1195)** (4,1816)**
Sector Media Long Term Debt + -0,3358 -0,3204 (-0,8777) (-0,6029)
Wald Test F-Statistic 11,8220** 14,8195*
- Whole model signification - Chi-square 70,9322** 88,9169**
ξ Variable to be explained by the model Censored observations: 267 Estimation of covariance matrix by Huber/White. Non-censored observations: 188 Z-statistic in parenthesiss *(**) denotes significance at 90%(95%)
6 Bank Debt The analysis of this financing alternative will concentrate in highlighting its associated problems and seeking to understand the implication involved in determining the financial structure. One problem, the agency problem, is that caused by asymmetric information. There are certain types of information available, for the agent (company) and not for the principal (bank) affecting the credit contract. Particularly, the agent has more information than the principal about the project and will try to maximize its profitability, thus diminishing the financial cost. Adverse selection is another problem affecting the relationship between companies and banks. This problem can be described as follows; there are a great number of bad quality companies in the financial market seeking for a loan and this situation hinders the access to these loans to good-quality companies. If banks had the proper information available, they could make different types of contracts regarding each specific case. But since this does not take place, banks apply a variety of selection processes which are related to the size of the loan, being the increase of interest rates the process most generally used. In this context, the companies which are discouraged to ask for a loan might be the ones that probably the bank could be most willing to grant one since they are the most reliable. As a consequence, two types of adverse selection could be distinguished. The first type takes place when the bank approves a loan to finance a project that later fails. The second occurs when the loan is denied to finance a project which becomes ex-post successful. Banks are more concerned about avoiding mistakes of the first type simply because the mistakes of the second type will never be discovered. This explains why many times banks do not finance companies which have a high potential of growth and profitability. The problem of moral hazard associated with the monitoring ex-post of the firm, arises when lenders cannot control the companies’ use of the granted funds. When the bank has a considerable number of customers, their constant monitoring becomes impossible to perform in terms of information costs. If the monitoring of costs has an inverse
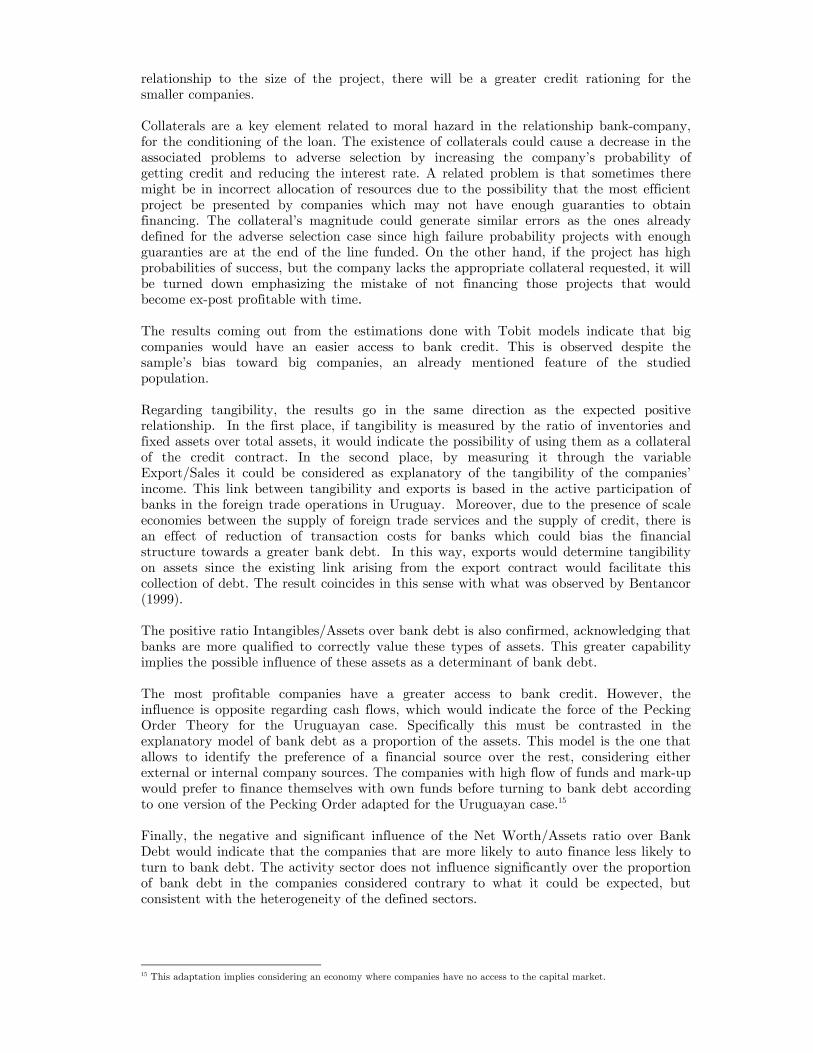
relationship to the size of the project, there will be a greater credit rationing for the smaller companies. Collaterals are a key element related to moral hazard in the relationship bank-company, for the conditioning of the loan. The existence of collaterals could cause a decrease in the associated problems to adverse selection by increasing the company’s probability of getting credit and reducing the interest rate. A related problem is that sometimes there might be in incorrect allocation of resources due to the possibility that the most efficient project be presented by companies which may not have enough guaranties to obtain financing. The collateral’s magnitude could generate similar errors as the ones already defined for the adverse selection case since high failure probability projects with enough guaranties are at the end of the line funded. On the other hand, if the project has high probabilities of success, but the company lacks the appropriate collateral requested, it will be turned down emphasizing the mistake of not financing those projects that would become ex-post profitable with time. The results coming out from the estimations done with Tobit models indicate that big companies would have an easier access to bank credit. This is observed despite the sample’s bias toward big companies, an already mentioned feature of the studied population. Regarding tangibility, the results go in the same direction as the expected positive relationship. In the first place, if tangibility is measured by the ratio of inventories and fixed assets over total assets, it would indicate the possibility of using them as a collateral of the credit contract. In the second place, by measuring it through the variable Export/Sales it could be considered as explanatory of the tangibility of the companies’ income. This link between tangibility and exports is based in the active participation of banks in the foreign trade operations in Uruguay. Moreover, due to the presence of scale economies between the supply of foreign trade services and the supply of credit, there is an effect of reduction of transaction costs for banks which could bias the financial structure towards a greater bank debt. In this way, exports would determine tangibility on assets since the existing link arising from the export contract would facilitate this collection of debt. The result coincides in this sense with what was observed by Bentancor (1999). The positive ratio Intangibles/Assets over bank debt is also confirmed, acknowledging that banks are more qualified to correctly value these types of assets. This greater capability implies the possible influence of these assets as a determinant of bank debt. The most profitable companies have a greater access to bank credit. However, the influence is opposite regarding cash flows, which would indicate the force of the Pecking Order Theory for the Uruguayan case. Specifically this must be contrasted in the explanatory model of bank debt as a proportion of the assets. This model is the one that allows to identify the preference of a financial source over the rest, considering either external or internal company sources. The companies with high flow of funds and mark-up would prefer to finance themselves with own funds before turning to bank debt according to one version of the Pecking Order adapted for the Uruguayan case.15 Finally, the negative and significant influence of the Net Worth/Assets ratio over Bank Debt would indicate that the companies that are more likely to auto finance less likely to turn to bank debt. The activity sector does not influence significantly over the proportion of bank debt in the companies considered contrary to what it could be expected, but consistent with the heterogeneity of the defined sectors. 15 This adaptation implies considering an economy where companies have no access to the capital market.
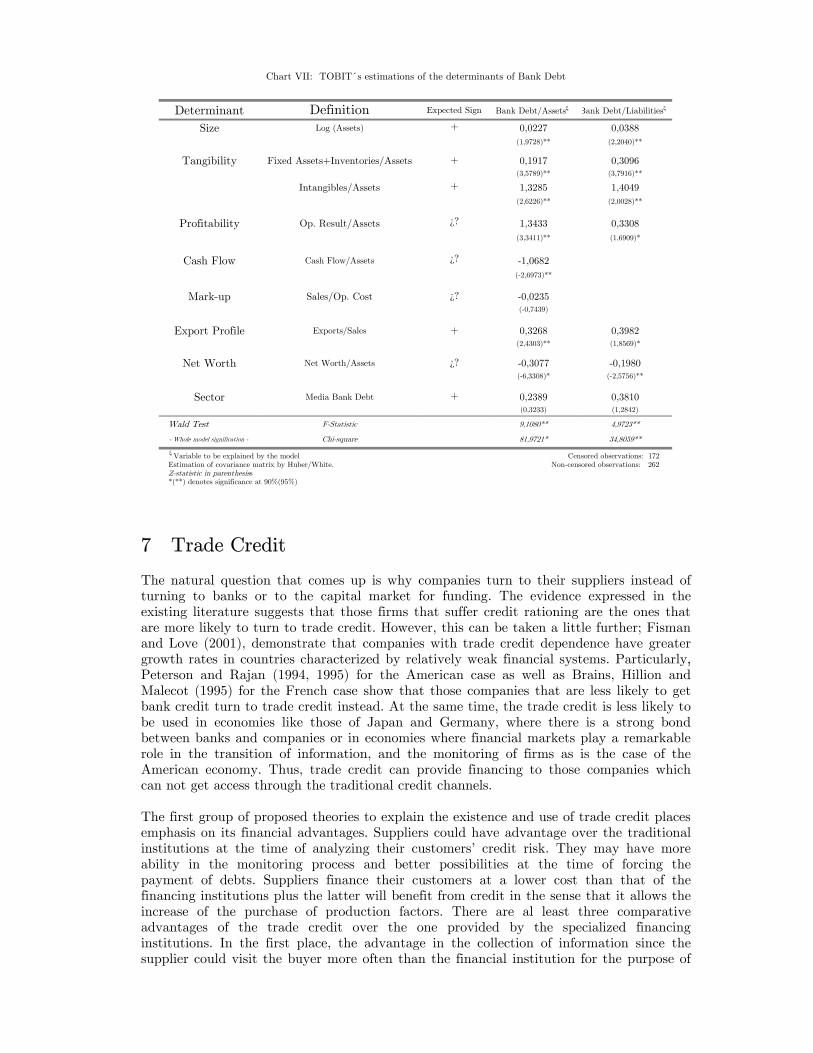
Chart VII: TOBIT´s estimations of the determinants of Bank Debt
Determinant Definition Expected Sign Bank Debt/Assetsξ Bank Debt/Liabilitiesξ
Size Log (Assets) + 0,0227 0,0388
(1,9728)** (2,2040)**
Tangibility Fixed Assets+Inventories/Assets + 0,1917 0,3096 (3,5789)** (3,7916)**
Intangibles/Assets + 1,3285 1,4049
(2,6226)** (2,0028)**
Profitability Op. Result/Assets ¿? 1,3433 0,3308
(3,3411)** (1,6909)*
Cash Flow Cash Flow/Assets ¿? -1,0682
(-2,6973)**
Mark-up Sales/Op. Cost ¿? -0,0235 (-0,7439)
Export Profile Exports/Sales + 0,3268 0,3982 (2,4303)** (1,8569)*
Net Worth Net Worth/Assets ¿? -0,3077 -0,1980 (-6,3308)* (-2,5756)**
Sector Media Bank Debt + 0,2389 0,3810 (0,3233) (1,2842)
Wald Test F-Statistic 9,1080** 4,9723**
- Whole model signification - Chi-square 81,9721* 34,8059**
ξ Variable to be explained by the model Censored observations: 172 Estimation of covariance matrix by Huber/White. Non-censored observations: 262 Z-statistic in parenthesiss *(**) denotes significance at 90%(95%)
7 Trade Credit The natural question that comes up is why companies turn to their suppliers instead of turning to banks or to the capital market for funding. The evidence expressed in the existing literature suggests that those firms that suffer credit rationing are the ones that are more likely to turn to trade credit. However, this can be taken a little further; Fisman and Love (2001), demonstrate that companies with trade credit dependence have greater growth rates in countries characterized by relatively weak financial systems. Particularly, Peterson and Rajan (1994, 1995) for the American case as well as Brains, Hillion and Malecot (1995) for the French case show that those companies that are less likely to get bank credit turn to trade credit instead. At the same time, the trade credit is less likely to be used in economies like those of Japan and Germany, where there is a strong bond between banks and companies or in economies where financial markets play a remarkable role in the transition of information, and the monitoring of firms as is the case of the American economy. Thus, trade credit can provide financing to those companies which can not get access through the traditional credit channels. The first group of proposed theories to explain the existence and use of trade credit places emphasis on its financial advantages. Suppliers could have advantage over the traditional institutions at the time of analyzing their customers’ credit risk. They may have more ability in the monitoring process and better possibilities at the time of forcing the payment of debts. Suppliers finance their customers at a lower cost than that of the financing institutions plus the latter will benefit from credit in the sense that it allows the increase of the purchase of production factors. There are al least three comparative advantages of the trade credit over the one provided by the specialized financing institutions. In the first place, the advantage in the collection of information since the supplier could visit the buyer more often than the financial institution for the purpose of
getting more information about the business. The size and frequency of the buyer’s orders could give the supplier an idea of the business performance. In the second place, there are advantages for the lender’s control since he provides the expenditures used for the manufacture of the goods to be sold. This gives him certain negotiation power by having the possibility of threatening the buyer with a cut in the supply line in case of not meeting the debt’s payment terms. This threat will be more credible if the buyer represents an insignificant portion of the provider’s sales. Finally it must also be mentioned the advantage of the recovery of assets in case of bankruptcy; since if the buyer fell into a default of the debt, the supplier could recover the goods he provided. The more enduring the goods are the greater will be the trade credit warranty, independently from the legal aspects of each specific economy. The second group of theories looks for an alternative answer to the question why trade credit is possible when there are restrains to bank credit. According to Bairs and Gollier (1997), trade credit could be offered even though the supplier does not have any financial advantage over the specialized credit institutions since it could be used as a price discriminating mechanism. For the credit terms are unchangeable before the buyer’s credit quality, trade credit reduces the effective price of assets belonging to the low quality debtors. If the ones who get the credit belong to a market segment of high price elasticity, the trade credit becomes an effective means of price discrimination since the lowering the good’s effective price allows to capture a higher demand. This approach establishes that the supplier does not discriminate in favor of his risky customers because he may be interested in his customer’s survival in the long term, especially in the case of not having any substitute customers. Finally, a third group of theories focuses on the cost reduction of the transaction the trade credit generates. Instead of paying each time the expenditure goods are sent, the buyer can accumulate liabilities and cancel then periodically allowing separating the payment cycle of the inventory turnover. These credits give the buyers the time to program the payment to their suppliers regarding the projections of funds availability. In the light of the results stemming from the estimations of Tobit models it is set forth that the firms’ size, measured in this case by the Total Assets logarithm, influence negatively over the ratio Accounts Payable/Liabilities. In line with what is expected, it is a fact that the smaller companies are the ones who proportionally get greater financing through Trade Credit. However, if size is approached by the sales capacity, the inverse relationship can be observed, where it is expressed that bigger companies will have a greater proportion of Accounts Payable in their liabilities, thus suggesting a greater relationship with its suppliers. It is also observed in a negative relationship between tangibility and Trade Credit which is compatible with the idea that the more tangible companies would have greater access to bank credit. It is also confirmed the expected negative relationship which explains the greater capacity of correctly valuating the intangible assets the bank would have in respect to suppliers. With clear empirical evidence and as it was to be expected, the companies having difficulty to access bank credit turn to Trade Credit. This is shown through the negative relationship of bank debt ratio as a financing of the assets with the commercial debt ratio. There is not evidence regarding the influence of income return. It was expected that the profitable companies turned to their suppliers to get financing since they would have difficulties to get it through the specialized credit institutions. It is not possible to arrive to conclusions about those companies who finance themselves mainly through self funding and use commercial credit. This is due to the fact that the influence of the variable Capital/Assets is not significant enough to explain the ratio accounts payable in the liabilities. Neither is found a relationship between the firm’s export orientation and financing through commercial credit. It is expected a negative relationship in reference to
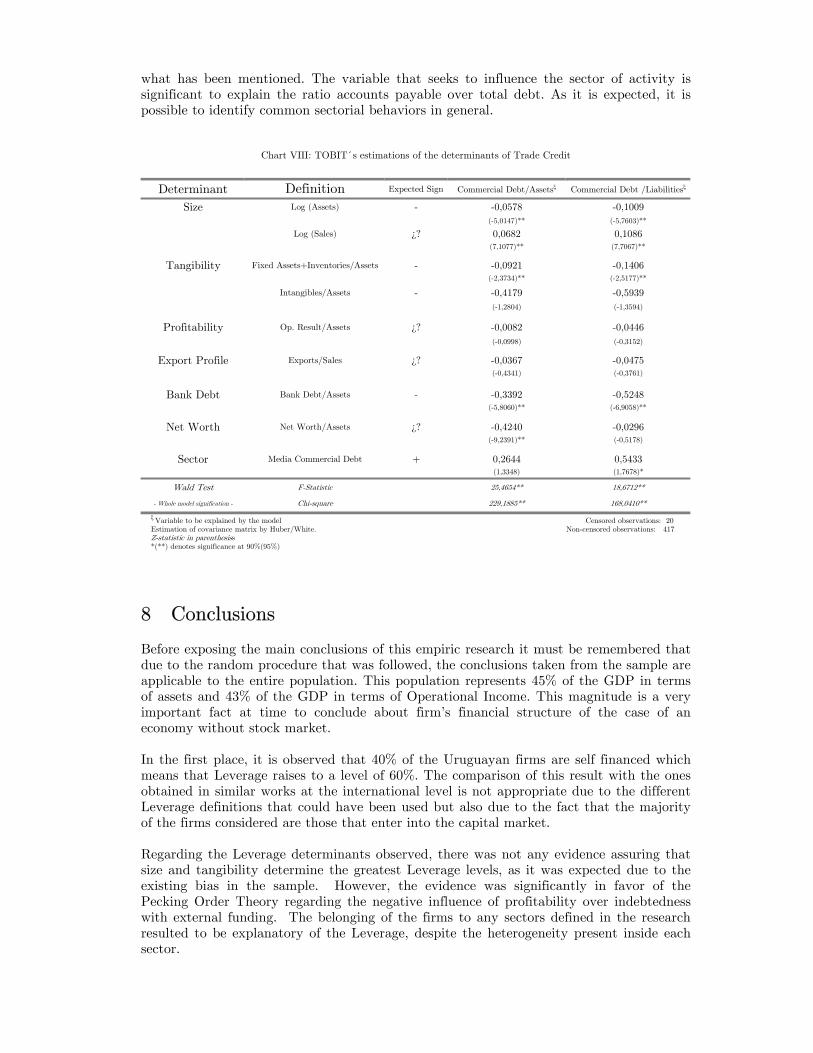
what has been mentioned. The variable that seeks to influence the sector of activity is significant to explain the ratio accounts payable over total debt. As it is expected, it is possible to identify common sectorial behaviors in general.
Chart VIII: TOBIT´s estimations of the determinants of Trade Credit
Determinant Definition Expected Sign Commercial Debt/Assetsξ Commercial Debt /Liabilitiesξ
Size Log (Assets) - -0,0578 -0,1009
(-5,0147)** (-5,7603)**
Log (Sales) ¿? 0,0682 0,1086 (7,1077)** (7,7067)**
Tangibility Fixed Assets+Inventories/Assets - -0,0921 -0,1406 (-2,3734)** (-2,5177)**
Intangibles/Assets - -0,4179 -0,5939
(-1,2804) (-1,3594)
Profitability Op. Result/Assets ¿? -0,0082 -0,0446
(-0,0998) (-0,3152)
Export Profile Exports/Sales ¿? -0,0367 -0,0475 (-0,4341) (-0,3761)
Bank Debt Bank Debt/Assets - -0,3392 -0,5248 (-5,8060)** (-6,9058)**
Net Worth Net Worth/Assets ¿? -0,4240 -0,0296 (-9,2391)** (-0,5178)
Sector Media Commercial Debt + 0,2644 0,5433 (1,3348) (1,7678)*
Wald Test F-Statistic 25,4654** 18,6712**
- Whole model signification - Chi-square 229,1885** 168,0410**
ξ Variable to be explained by the model Censored observations: 20 Estimation of covariance matrix by Huber/White. Non-censored observations: 417 Z-statistic in parenthesiss *(**) denotes significance at 90%(95%)
8 Conclusions Before exposing the main conclusions of this empiric research it must be remembered that due to the random procedure that was followed, the conclusions taken from the sample are applicable to the entire population. This population represents 45% of the GDP in terms of assets and 43% of the GDP in terms of Operational Income. This magnitude is a very important fact at time to conclude about firm’s financial structure of the case of an economy without stock market. In the first place, it is observed that 40% of the Uruguayan firms are self financed which means that Leverage raises to a level of 60%. The comparison of this result with the ones obtained in similar works at the international level is not appropriate due to the different Leverage definitions that could have been used but also due to the fact that the majority of the firms considered are those that enter into the capital market. Regarding the Leverage determinants observed, there was not any evidence assuring that size and tangibility determine the greatest Leverage levels, as it was expected due to the existing bias in the sample. However, the evidence was significantly in favor of the Pecking Order Theory regarding the negative influence of profitability over indebtedness with external funding. The belonging of the firms to any sectors defined in the research resulted to be explanatory of the Leverage, despite the heterogeneity present inside each sector.
Regarding the maturity structure, in aggregate levels, the average company finances with long-term debts 11% of its assets. The biggest and more tangible companies will be those which have a greater access to long-term credit. It is observed a trend toward matching the maturity structure of assets and liabilities. The results reached are in accordance with those reached in developed countries regarding the negative influence of profitability over Leverage. There is also a match regarding the positive effect of the firm’s size over the likeliness to compatibilizing the expiration of assets and liabilities. Comparing the findings for Uruguay to the results gotten from investigations performed in other non-developed countries, it can be observed the similarity regarding the negative effect of income return over Leverage. Size and tangibility present the same positive influence over long-term indebtedness. Evidence confirms that access to the stock market cannot be considered as a real financial source for the Uruguayan firms, making this economy a very interesting case of study. This conclusion stems from the fact that none of the random selected firms ranks in the stock market. Among the external financial sources, bank credit is an alternative that explains 20% of the financing of assets of this economy without stock market. Those firms with more tangibility assets, either considering the proportion of inventories or fixed assets within the assets or the firm’s export profile, will have a greater access to bank credit. Regarding the proportion of intangibles in the assets, the evidence found is in line with the intuition that banks have the means to correctly value them and thus influence in a positive way over bank indebtedness. Those big and profitable firms will have an easier access. It has not been observed any influence over the bank debt belonging to the activity sectors already defined. Another relevant financial source for the Uruguayan firms is the trade credit representing 20% of the assets. The smallest firms with less tangible assets use in greater proportion these credit lines for their financing. Those firms with greater sales values proceed in a similar manner. The negative relationship between Bank and Trade Credit indicate that firms turn to the latter as an alternative financial source. The sectorial influence is significant and suggests similar behaviors among firms who share certain features. This research suggests three possible lines of action for future investigations. The first seeks to intensify and consolidate the results, reconsidering the relationships between theoretical models and the empirical specifications making it extensive to those explanatory variables about which no information was gathered. This could only be possible by enhancing the information at the companies level beyond what has been expressed in the balance sheets. A second course of action would imply to let the time pass in order to allow the information that started to become available in 2001 to continue to generate from year to year. Being able to count with this data base would allow studying the influence of those variables related to the evolution of companies which unavoidably were left aside in this research. Finally there is a door open for a third line of investigation that would analyze the causes of the financial structure herein presented, assess its normative and set forth the pertinent policy recommendations.
9 References Amemiya, T. (1985). Advanced Econometrics. Basil Blackwell Ltd. Oxforfd Agarwal, R and J. Elston (2000). Bank-Firm Relationships, Financing and Firm Performance in Germany. University of Central Florida. Mimeo. Almazan, A.and C. Molina (2002). Intra-Industry Capital Structure Dispersion: How Do Capital Structures Differ Among Competitors? Finance Department, McCombs School of Business, University of Texas at Austin. Mimeo.
Bancel, F. and U. Mitoo (2002). The Determinants of Capital Structure Choice: A Survey of European Firms. University of Manitoba. Mimeo. Barclay, M. and C. Smith Jr. (1995). The maturity structure of corporate debt. The Journal of Finance, 50 (2): 609-631. Bentancor, A.(1999). Determinantes de la Estructura Financiera de las Empresas en Uruguay. Final Research Thesis. Universidad de la República. Uruguay. Bevan, A. and J. Danbolt (2000) Capital Structure and its Determinants in the United Kingdom a Decompositional Analysis. Departament of Acconting and Finance. University of Glasgow. Working Paper Series. Biais, B. and C. Gollier (1997). Trade Credit and Credit Rationing. The Review of Financial Studies, 10(4): 903-937. Booth, L.; V. Aivazian; A. Demirguc-Kunt and V. Maksimovic (2001). Capital Structures in Developing Countries. The Journal of Finance 56(1): 87-129. Cantillo, M. and J. Wright (1995). How do firms choose their lenders? Theory and evidence. Walter A. Haas School of Business. Research Program in Finance. Working Paper Series, University of California at Berkeley, F.W.P. 256. Caprio,G. Jr. and A. Demirgüç-Kunt (1998). The role of long term finance: Theory and evidence. The World Bank Research, 13 (2): 171-189. Casasola, M. and J. Tribó (2001). Deuda Bancaria y Deuda Negociable: Un estudio para las Empresas Manufactureras Españolas. Unniversidad Carlos III de Madrid. Departamento de Economía de la Empresa. Working Paper 01-02. Cochran, W. (1971) Té cnicas de Muestreo. Compañía Editorial Continental, México. Copeland, T. and J. Weston (1995) Finanzas en administración, Novena edición, Mc Graw Hill, México. Chen, L.H. and G.J. Jiang (2001) The Determinants of Dutch Capital Structure Choice. University of Groningen, Research Institute SOM. Research Report 01E55. de Blasio, G. (2003). Does Trade Credit Substitute for Bank Credit? Evidence from Firm-Level Data. IMF Working Paper. WP/03/166. de Britto, P (2003). Small Firm Financing: Debt Relif, Equity, and Judicial System and Bankruptcy Code. University of Illinois at Urbana-Champaign. Mimeo. Demirguc-Kunt, A. and V. Maksimovic (2001). Firms as Financial Intermediaries: Evidence from Trade Credit Data. World Development Report 2002. World Bank. Denis, D. and V. Mihov (2002). The Choice Among Bank Debt, Non-Bank Private Debt and Public Debt: Evidence From New Corporate Borrowings. Mimeo. Diamond, D. (1989). Reputation Acquisition in Debt Markets. Journal of Political Economy, 97 (4) 828-862. Diamond, D. (1991a). Monitoring and Reputation: The Choice Between Bank Loans and Directly Placed Debt. Journal of Political Economy, 99 (4): 689-721. Diamond, D. (1991b). Debt Maturity Structure and Liquidity Risk. Quarterly Journal of Economics, 106: 710-737. Drobetz, W. and R. Fix (2003). What are the Determinants of the Capital Structure? Some Evidence for Switzerland. University of Basel. WWZ/Departament of Finance, Working Paper No. 4/03. Elston, J. (2003). Bank Influence, Firm Performace and Suvival: Empirical Evidence from Germany 1970-1986. University of Central Florida. Mimeo. Faus, J (1997). Políticas and Decisiones Financieras. Finanzas Estructuradas para Directores. IESE. Universidad de Navarra. Finotti Cordeiro Perobelli, F. and R. Fama (2001). Fatores Determinantes da Estrutura de Capital: Aplicaç ao a Empresas de Capital Aberto no Brasil. Encontro Brasileiro de Finanças. Sociedade Brasileira de Fianças.

Fisman, R. and I. Love (2001). Trade Credit, Finacial Intermediary Development and Industry Growth. World Bank. Frank, M. and V. Goyal (2003). Capital Structure Decisions. University of British Columbia and Hong Kong University. Mimeo. Gallego, F. and N. Loayza (2000). Financial Structure in Chile: Macroeconomic developments and Microeconomic effects. Banco Central de Chile. Working Paper. Glen, J. and B. Pinto (1994). Debt or Equity?. How Firms in Developing Countries Choose. International Finance Corporation. Discussion Paper 22. Green, C. ; V. Murinde and J. Suppakitjarak (2002). Corporate Financial Structures in India. Finance and Development Reseach Programme. Working Paper Nº 43. Greene, W.H. (1999). Aná lisis Economé trico. Tercera edición, Prentice Hall, New York. Guimaraes E. and C. de Castro (2003). Determinants of the firm s capital strucutre: The case of the very small enterprises. Brazil Fiscal Tax Secretariat. Mimeo. Gupta, M. (1969). The Effect of Size, Growth and Industry on the Financial Structure of Manufacturing Companies. The Journal of Finance, 24(3), 517:529. Harris, M. and A. Raviv (1991). The theory of capital structure. The Journal of Finance, 46 (1): 297-355. Herbst, A. (1974). Some Empirical Evidence on the Determinants of Trade Credit at the Industry Level of Aggegation. The Journal of Financial and Quantitative Analysis,9(3), 377:394. Hess, J.D. (1984). Imperfect information and Credit Rationing: Comment. The Quarterly Journal of Economics, 865-868. Huang, S. and F. Song (2002). The Determinants of Capital Structure: Evidence from China. School of Economics and Finance and Centre for China Financial Research (CCFR) The University of Hong Kong. Huber, P. (1967). The Behavior of Maximum Likelihood Estimates Under Non-Standard Conditions. Proceeding of the Fifth Berkeley Symposium on Mathematical Statistics and Probablity. Instituto Nacional de Estadística - Uruguay. Manual guía para la codificación de actividades económicas. Clasifiación Internacional Uniforma (CIIU) Revisión 3. Jaffee, D. M.and T. Russell (1984). Imperfect information, uncertainty, and credit rationing: A reply. The Quarterly Journal of Economics, 869-872. Jaramillo, F. and F. Schiantarelli (2002). Access to long Term Debt and Effects on firms` performance: lessons from Ecuador. IADB. Research Network Working Paper R-460. Jensen, M.(1986). Agency Costs of Free Cash Flow, Corporate Finance and Takeovers. American Economic Review 76, 323:339. Jensen, M and H. Meckling (1976). Theory of the Firm: Managerial Behavior, Agency Costs and Ownership Structure. Journal of Financial Economics, 3, 305:360. Johnston, J. and J. Dinardo (2001). Mé todos de Econometría. Vicens Vives. Barcelona. MacKay, P. and G. Phillips (2002). Is There an Optimal Industry Financial Structure? NBER Working Paper Series, 9032. MacKie-Mason, J. (1989). Do Firms Care Who Provides Their Financing? NBER Working Paper 3039. Maddala, G. (1994). Limited-Dependent and Qualitative Variables in Econometrics. Cambridge University Press. Mascareñas, J and G. Lejarriaga (1993). Aná lisis de la Estructura de capital de la empresa. Eudema. Madrid. Mateut, S. and P. Mizen (2002). Trade Credit and Bank Lending: An Investigation into the Determinants of UK Manufacturing Firms`Access to Trade Credit. European University Institute, Department of Economics, Working Paper Nº 2003/3. Miller, M. H. (1977). Debt and Taxes. The Journal of Finance, 32 (2): 261-275.

Miller, M. H. (1988). The Modigliani-Miller propositions. After thirty years. Journal of Economic Perspectives, 2 (4): 99-120. Miller, M. H. (1991). Leverage. The Journal of Finance, 46 (2): 479-488. Mira, F. S. (2002). On Capital Structure in the Small and Medium Enterprises: The Spanish Case. Instituto de Estudios Europeos. Modigliani, F. and M. Miller (1958). The Cost of Capital Corporation, Finance and the Theory of Investment. The American Economic Review, 48(3):267-297. Modigliani, F. and M. H.Miller (1963). Corporate Income Taxes and The Cost of Capital: A Correction. The American Economic Review, 53 (3): 433-443. Munyo, I. (2003). La Estructura Finnaciera de las Empresas y sus Determinantes. Evidencia para el Caso Uruguayo. Final Research Thesis. Universidad de la República. Uruguay. Munyo, I. (2003). Relevant Corporate Financial Strucutre Theories for Developing Economies. Mimeo Myers, S. and N. Majluf (1984). Corporate Financing and Investment Decisions When Firms Have Information That Investors Do Not Have. Journal of Financial Economics, 13, 187:221. Nadiri, M. (1969). The Determinats of Trade Credit in the U. S. Total Manufacturing Sector. Econometrica, 37(3), 408:423. Nilsen, J. (1999). Trade Credit and the Bank Lending Channel. Studienzentrum Gerzensee. Mimeo. Ofek, E. (1993). Capital Structure and Firm Response to Poor Performance: An Empirical Investigation. Journal of Financial Economics, 34: 3-30. Pagano, M., F. Panetta and L. Zingales. (1998). Why Do Companies Go Public? An Empirical Analysis. Journal of Finance, 53:27-64. Pascale, Ricardo (1978). Inversión, Financiamiento y Rentabilidad de la Industria Manufacturera Uruguaya. Banco Central del Uruguay. Pascale, Ricardo (1982). Comportamiento Financiero de la Industria Manufacturera Uruguaya 1977-1980. Banco Central del Uruguay. Pascale, Ricardo (1994). Finanzas de las Empresas Uruguayas. Contribución a la Investigación de sus Elementos Caracterizantes. Banco Central del Uruguay. Pascale, Ricardo (2003). Decisiones Financieras. Cuarta edición. Ediciones Macchi. Peterson, M. and R. Rajan (1997). Trade Credit: Theories and Evidence. The Review of Financial Studies, 10(3), 661:691. Peterson, M. and R. Rajan (1994). The Benefits of Lending Relationships: Evidence from Small Business Data. The Journal of Finance, 49(1), 3:37. Pinches, G.; K. Mingo and J. Caruthers (1973). The Stability of Financial Patterns in Industrial Organizations. The Journal of Finance, 28(2), 389:396. Prasad, S.; C. Green and V. Murinde (2001). Corprate Financial Structures in Developing Economies: Evidence from a Comparative Analysis of Thai and Malay Corporations. Finance and Development Reseach Programme. Working Paper 35. Rajan, R. and L. Zingales (1995). What Do We Know about Capital Strucuture? Some Evidence from International Data. The Journal of Finance, 50 (5):1421-1460. Robledo, Isabel (1994). Estructura Financiera de la Empresa e Inversión. El Caso Uruguayo. CERES. Working Paper. Ross, S. (1977). The Determination of Financial Structure: The incentive Signalling Approach. Bell Journal of Economics, 8:23-40. Salloum, C. and P. Vigier (1999). Los Problemas del Financiamiento de la Pequeña y Mediana Empresa: La Relación Bancos-PyME s. Revista de la Escuela de Economía y Negocios.
Scheaffer, R. , W.Mendenhall and L. Ott (1986). Elementos de Muestreo. Grupo Editorial Iberoamérica. México. Schwartz, R. (1974) An Economic Model of Trade Credit. The Journal of Financial and Quantitative Analysis, 9(4): 643-657. Schiantarelli, F. and A. Sembenelli (1997). The Maturitty Structure of Debt. Determinants and Effects on Firm s Performance. Evidence fron United Kindow and Italy. World Bank. Policy Research Working Paper. Schiantarelli, F. and V. Srivastava (1996). Debt Maturitty Structure and Effects Firm Performance: A Panel Study of Indian Public Limited Companies. World Bank. Singh, A. and J. Hamid (1992). Corporate Financial Structure in Developing Countries. International Finance Corporation. Technical Paper 1. Smith, J. (1987). Trade Credit and Informational Asymmetry. The Journal of Finance, 42(4): 863-872. Stiglitz, J.(1974). On the Irrelevance of Corporate Financial Policy. The American Economic Review, 64(6): 851-866. Stiglitz, J. (1988). Why Financial Structure Matters. Journal of Economic Perspectives, 2(4): 121-126. Stiglitz, J. and A. Weiss (1981). Credit Rationing in Markets with Imperfect Information. The American Economic Review, 71 (3): 393-410. Suárez Gálvez, C. (2000). Elección de las Fuentes de Financiación de las Empresas. Fundación Empresa Pública. Working Paper 0002. Sudarsanam, P. (1992). Market and Industry Structure and Corporate Cost of Capital. The Journal of Industrial Economics,40(2): 189-199. Summers, B. and N. Wilson (1999). An Empirical Investigation of Trade Credit Use: A Note. University of Leeds. Mimeo. Taub, J. (1975). Determinants of the Firm s Capital Structure. The Review of Economics and Statistics, 57 (4): 410-416.