Embed Size (px)
Citation preview
Data Science and Service Research
Discussion Paper
Discussion Paper No. 32
The determinants of bank net interest
margins: A panel evidence from South
Asian countries
Shahidul Islam Shin-Ichi Nishiyama
February, 2015
Center for Data Science and Service Research
Graduate School of Economic and Management
Tohoku University
27-1 Kawauchi, Aobaku
Sendai 980-8576, JAPAN
The determinants of bank net interest margins: A panel evidence from South Asian countries
Shahidul Islama, b, 1 , Shin-Ichi Nishiyamaa
a Graduate School of Economics and Management, Tohoku University, Japan b Department of Banking and Insurance, University of Dhaka, Bangladesh
Abstract:
This paper studies the determinants of net interest margins of banks (NIMs) in four South Asian countries
(Bangladesh, India, Nepal and Pakistan) in the period 1997-2012 using panel data of 230 banks. The study is
in line of Ho-Saunders (1981) dealership model and its later expansions but extended the model by adding new
variable the relative size of the banks and also classifying the determinants of interest margins as bank specific,
industry specific and macroeconomic specific variables. We found that liquidity and equity positions, required
reserve and operating expenses to total asset ratios affect net interest margins positively while relative size of
the banks, market power and economic growth affect inversely.
JEL classification: G21, C23
Key words: net interest margins, spread, non-performing loan
1. Introduction
Existence of net interest margins (NIMs) or spread is the fundamental factor of Banking as the
Financial Intermediary business. Spread is the difference between the weighted average of yields
on assets (interest revenue) and liabilities (interest expense) - also called the bankers’ mark-up
(Allen, 1988). However a very high or low and volatile spread can cause severe bank
management problem and can create distrust among the stakeholders of the banking business.
There may be a strong relationship between the higher spreads and higher default rate. Again
from bankers’ perspective, there may be trustworthy causes to charge higher margins as the
1 Corresponding author. Graduate School of Economics and Management, 27-1 Kawauchi, Aoba-ku, Sendai 980-8576, Japan. Tel: +81- 080-4514-7262. E-mail: [email protected]
1
wealth maximizer candidate in the economy. From the societal perspective, the higher the
interest margins, the lower will be the social welfare. So, regularly updating our knowledge on
interest margin determinants is valuable for number of reasons including monitoring changing
trends in bank efficiency through time and evaluating whether bank margins are providing
effective price signals to market players (Hawtrey and Liang, 2008).
In line of the Ho and Saunders’ (1981) dealership model of banking where the banks receive
deposits funds at random intervals, and subsequently, utilize these funds to satisfy stochastically
received loan request has been studied for many years by different scholars in extended formats.
Allen’s (1988) studies on portfolio effects on spreads and Saunders- Schumacher’s (2000)
considerations for regulatory components, a market structure component and a risk premium
component to determine the net interest margins of bank are notable. Angbazo (1997) studied the
dealership model in single stage, considering the credit risk and also interest rate risk. Maudos
and Guevara (2004) extended the dealership model viewing banks as the firm considering the
operating expenses explicitly into account.
Kunt and Huizinga (1999) found that a larger ratio of bank assets to gross domestic product and
a lower market concentration ratio lead to lower margins, controlling for differences in the bank
activity, leverage and the macroeconomic environment in their 80 cross-country sample study.
Bernanke, Gertler and Gilchrist (BGG) (1999) in their dynamic general equilibrium model to
clear the credit market frictions in business fluctuations and Gertler and Kiyotaki (2011) in their
macroeconomic paper on financial intermediation and credit policy in business cycle analysis
also discussed about the effect of net worth of banking firms and default probability and their
impact on margin determination.
2

In this paper, we tested the dealership model and its later extensions of bank interest margin
determinants in case of four South Asian countries that is Bangladesh, India, Nepal and Pakistan,
using fixed effect panel of 230 banks data for the period of 1997 to 2012. We viewed each
country’s banking sector in terms of a single representative agent and interested in margin
determination on national basis. We studied the explanatory variables of interest margins
classifying as bank specific, industry specific and macroeconomics specific and incorporated
new bank specific variable the relative size of the bank which we found significantly and
inversely affect net interest margins of banks. In our empirical model, we included 15
deterministic variables which seems a populous model of interest margin determinants in terms
of number of variables. Selection of our sample was also notable on the ground that most of our
sample countries (Bangladesh, India and Pakistan) were under the rule of British colony for
around two hundred years. We got the opportunity to study those countries’ banking systems all
–together considering likely regulatory, social and economic environments. The similarities of
the countries gave us opportunity to test our theoretical model empirically using fixed effect
panel regression. We also ran country-wise fixed effect panel regression and presented in the
paper along the base line regression result. In the near past we found similar studies 2 on
developed and developing countries of USA, Europe, Australia and Latin America but in case of
South Asia, this study is a unique addition to the literature of the determinants of bank net
interest margins.
The rest of the paper has been organized as follows: in section 2, we presented relevant literature
on the determinants of net interest margins. In section 3 the empirical approach of our study and
2 Kunt and Huizinga(1999) studied 80 developed and developing countries, Saunders and Schumacher’s (2000) studies included USA and six EU countries, Maudos and Guevara (2004) studied 5 European countries. Also Afanisieff (2002) and Williams (2007) studied determinants of net interest margins on Brazilian and Australian banks respectively among others.
3
in section 4 the sample description has been outlined. In section 5 the result and finally in section
6 we presented the conclusion and policy implications of our study.
2. The literature on determinants of net interest margins
Starting point of bank net interest margins determinants can be attributed to the dealership model
of Ho and Saunders (1981) as an extension of the hedging hypothesis and the expected utility
approach. In their landmark initiative, they proposed the two stage model of interest margin
determination. In stage one; they argued the existence of ‘pure spread’ as the price of providing
immediacy of services in face of the uncertainty generated by asynchronous deposit supplies and
loan demands. In stage two; they attempted to measure the amount of pure spread by considering
number of imperfections and regulatory restrictions. According to the model, pure spread is the
difference between the bank lending rate (𝑃𝐿) and the deposit rate (𝑃𝐷). As there exist transaction
uncertainty, banks set their interest rates as a margin relative to the interest rate of the money
market (𝑝). These happens as,
𝑃𝐷 = p- a
𝑃𝐿 = p+ b
Where a and b are the margins for the provision of immediacy services. Thus, as the risk averse,
utility maximizer, bank’s pure spread (S) could be determined as follows:
S = 𝑃𝐿 -𝑃𝐷 = a + b....................................................... Equation 1
Lerner (1981) criticized the dealership model that it failed to recognize the bank as a firm having
a certain production function associated with provision of the intermediation services. The
4

presence of cost inefficiencies associated with the production process across banks can have a
distortionary effect on the margin. The extension of the basic dealership model by Maudos and
Guevara (2004) responded to this criticism by explicitly incorporating the role of operating costs
and providing a detailed description of the link between riskiness and the margin in their one
stage model of interest margin determinants which covered the data of 5 European countries to
prove the model empirically.
Allen (1988) expanded the dealership model from a structure with one kind of loan and deposit
to loans and deposits with many maturities that is the ‘portfolio effect’ apparent to margin
determination. Angbazo (1997) studied the net interest margins of commercial banks reflect both
default and interest rate risk premia. The study also showed that banks with more risky loans
and higher interest rate risk exposure would select loan and deposit rates to achieve higher net
interest margins and cross sectional differences in interest rate risk and liquidity risk are related
to differences in off-balance sheet exposure.
Saunders and Schumacher (2000) conducted an international study on USA and European banks
for the net interest margin determination for 1988-1995 period and found that implicit interest
payments, opportunity cost, capital to asset ratio, market power and interest rate volatility affect
net interest margins positively but they omitted any proxy variable for risk aversion and size of
transaction in their model. Afanasieff et al. (2002) used a panel regression of 142 Brazilian banks
and found that size of bank, opportunity cost and operating cost are positively related to interest
margins but a set of macroeconomic variables such as the market interest rate, the volatility of
market interest rate, inflation rate and output growth heavily affect margins as well.
5
Valverde and Fernandez (2007) applied Ho and Saunders dealership model to a multi-output
framework and showed that the relationship between bank margins and market power varies
significantly across bank specializations. They conducted empirical studies for a sample of
19,322 European banks from Germany, Spain, France, the Netherlands, Italy, the UK and
Sweden and found that market power increases as output becomes more diversified towards non-
traditional activities. Hawtrey and Liang (2008) studied the determinants of bank interest
margins using panel data covering the banking sector of fourteen OECD countries and found that
national banking industry interest margins are influenced by market power, operational cost, risk
aversion, interest rate volatility, credit risk, volume of loans, implicit interest payments and also
quality of management. With a particular emphasis on the bank ownership structure, Fungacova
and Poghosyan (2011) conducted empirical studies using panel data on the interest margin
determinants in the Russian banking. They found that the impact of a number of commonly used
determinants such as market structure, credit risk, liquidity risk and size of operations differs
across ownership structure of banks but influence of operational cost and risk aversion are
homogeneous. Among others, Tarus et al. (2012) studied the determinants of net interest margins
of commercial banks in Kenya using pooled and fixed effect panel covering the period of 2000-
2009. They found that operating expenses, credit risk and inflation are positively and market
concentration and economic growth are negatively related to the net interest margins.
In the literature of the determinants of interest margins of banks, we also recognize the studies of
Bernanke, Gertler and Gilchrist (BGG, 1999). Another seminal study was conducted by Gertler
and Kiyotaki (2011) where their macroeconomic viewpoint on the interest margin is that so
called risk aversion or the net-worth position of banks negatively and the default risk positively
influences the net interest margins of banks.
6
We get the motivation for our present study by the inconclusive nature of the empirical literature
of the determinants of net interest margins of banks. We want to focus on the determinants of net
interest margins by adding new variable the relative size of banks and also incorporating the
explanatory variables both microeconomic and macroeconomic in the past literature in our
contemporary cross-country study. A prior cross country study was conducted by Kunt and
Huizinga (1999) using global 80 countries’ data over the period 1988 to 1995, however their
particular concern was exogenous influences such as macroeconomic indicators, tax rates and the
degree of international ownership, all of which found significantly related to interest margins.
Complementing their works, our study results, reported here focus on both microeconomic and
macroeconomic determinants of the net interest margins of banks.
3. Empirical Approach
3.1. Econometric Model
We used the fixed effect panel estimator to evaluate the impact of various determinants of bank
net interest margins (NIMs) in the South Asian countries. The fixed effect model is:
𝑌𝑖𝑡 = 𝛼 + 𝛽𝑋𝑖𝑡 + 𝑢𝑖 + 𝜀𝑖𝑡
= 𝛼𝑖 + 𝛽𝑋𝑖𝑡 + 𝜀𝑖𝑡 ............................................. ...................Equation 2
Where, 𝛼𝑖 = 𝛼 + 𝑢𝑖 and 𝜀𝑖𝑡 is independently and identically distributed (i.i.d).
Our model to be estimated is of the following linear form:
NIMit = F [Bank Specific Factors (BSF), Industry Specific Factors (ISF), Macroeconomic
Specific Factors (MSF)]
Or, NIMit = F[BSFit (.), ISFit (.), MSFt(.)]
So, the general specification model (equation 2) can be re-written as follows:
7

𝑵𝑰𝑴𝒊𝒕 = ∁ + �𝜷𝒋𝑿𝒊𝒕𝒋
𝑱
𝒋=𝟎
+ �𝜷𝒍𝑿𝒊𝒕𝒍𝑳
𝒍=𝟎
+ � 𝜷𝒎𝑿𝒊𝒕𝒎𝑴
𝒎=𝟎
+ �𝜸𝒅𝒁𝒕𝒅𝑫
𝒅=𝟎
+ 𝑢𝑖 + 𝜺𝒊𝒕
........................Equation 3
Or, for fixed effect specification, we can rewrite the equation 3 as follows:
𝑵𝑰𝑴𝒊𝒕 = ∁ + �𝜷𝒋𝑿𝒊𝒕𝒋
𝑱
𝒋=𝟎
+ �𝜷𝒍𝑿𝒊𝒕𝒍𝑳
𝒍=𝟎
+ � 𝜷𝒎𝑿𝒊𝒕𝒎𝑴
𝒎=𝟎
+ �𝜸𝒅𝒁𝒕𝒅𝑫
𝒅=𝟎
+ 𝜺𝒊𝒕
........................Equation 4
Where, 𝑁𝐼𝑀𝑖𝑡 is the net interest margin of bank i at time t. The superscripts j, l and m of Xit,
denote the bank-specific, industry specific and macroeconomic specific variables respectively.
Whereas, Z is unobserved variable but correlated with X. Z can be interpreted as an intercept of
unobserved effect of observation i and unobserved time specific effects on the dependent
variable can be captured by introducing time dummies so we did in our study as (𝒁𝒕𝒅). All other
regulatory and country specific effects supposed to be included in the constant term (∁).
3.2. Variables
The econometric model developed in the section 3.1 to determine the net interest margins of
banks in the South Asian countries requires proxy variables to prove the model empirically. We
have used 3 categories if explanatory variables namely (i) bank specific, (ii) industry specific and
(iii) macroeconomic specific variables. In total we used 15 explanatory variables of which 11 are
bank specific, 1 industry specific and 3 macroeconomic specific. Some of the variables have
been considered to prove our initial hypotheses and some of them for the controlling purpose
only. Additionally we used time dummies in our model to see the time variant influences (if any)
to determine the net interest margins of banks. However the categorical variables have been
proxied empirically as follows:
8

3.2.1. Dependent variable
Net interest margins (NIM)
In our econometric model of determinants of net interest margins, net interest margins (NIM) is
the dependent variable. We defined net interest margins of a bank as the difference between
interest income and interest expense divided by total assets.
3.2.2. Explanatory variables:
(a) Firm specific explanatory variables
(i) Relative size of the bank
Relative size of the bank is used as the proxy variable of information asymmetry in our
econometric model of determinants of net interest margins. We want to see how information
asymmetry affects the net interest margins of banks. But it is hard to find the information
asymmetry variables from the disclosed chapters of the bank information from their financial
statements. Then we aimed to characterize banks as small and large (relative size) in terms of
their holding of assets. We calculated the relative size of the bank as the ratios of total asset of
bank i to the total banking industry asset of the economy. Relative size of the bank in our model
as explanatory variable, answers the question of whether the large banks are charging more or
less in relation to the small banks or not. Our hypothesis is that, holding others remaining
constant, the relative size of the bank affect the net interest margin inversely.
(ii) Non-performing loan (NPL)
Non-performing loan to total loan which actually the default risk of bank i has been used as the
explanatory variable in our model. Many of the past literature expressed this variable as credit
9

risk or default risk and calculated differently. For example, Ho and Saunders (1981) used default
premium (DPi) as the ratio of net loan chargeoffs to total earning assets in their two stage model
of determining net interest margins of banks. Moudos and Guevara (2004) proxied credit risk as
loans to total assets ratio. According to the Bank for International Settlements (BIS, 1999) loans
are the largest and most obvious source of credit risk for most banks but we think this approach
is too pessimistic to measure the credit risk for banks. However, this is natural for banks to
charge additional on the initial margins on lending if the borrower’s probability of being default
is high. We expect ceterus paribas, a positive relationship between non-performing loan and the
net interest margins.
(iii)Interaction between non-performing loan (NPL) and Standard deviation of short term
interest rate (SDint)
This interaction variable has been used in our econometric model of determining the net interest
margins of banks to see whether they are jointly affect the dependent variable or not. Use of this
variable has been supported by the previous literature for example Maudos and Guevara (2004),
Hawtrey and Liang (2008) among others.
(iv) Liquid asset to total asset ratio
Following Angbazo (1997), we used the variable liquid asset but calculated differently for our
modeling. Angbazo (1997) used liquid asset to liabilities to proxy for the liquidity risk as the
determinant of net interest margins. However, in our model, liquid asset (extracted from the
Bank Scope database as the total earning assets) to total asset is a proxy for the liquidity position
of the bank. We argue that banks are not only provider of liquidity on demand to the liability side
but also on the asset side in the form of providing loan commitments and so on. Banks whose
10
liquidity position is better than others may charge extra margins on the loans they provide. For
this, a positive sign is expected.
(v) Equity to total asset ratio
The variable measures the capitalization of a bank considering the regulatory requirements
regarding the minimum equity holdings. Following McShane and Sharpe (1985), we also used
equity to total asset ratio as the proxy of degree of risk aversion of banks. Among others,
Saunders and Schumacher (2000), Maudos and Guevara (2004) used the variable in the same
way but Hawtrey and Liang (2008) used different approach to calculate the risk averseness of the
banks by dividing securities plus other assets by volume of loans.
Regarding the relationship between equity to total asset ratio and the net interest margins of
banks, we found contrast literature in the past. Macroeconomic stream like Gertler and Kiyotaki
(2011) framework argued that the rise in net worth (equity) relative to the capital stock reduces
the expected default probability, everything else equal. The underlying economics of that
proposition is that banks can charge lower margins where default probability is lower.
On the other hand, mainstream banking and finance literature expect positive sign arguing that
customers are willing to bear (pay for) bank regulatory taxes in return for the positive externality
related to bank monitoring. That is ‘banks are special’ and customers are willing to pay for that
specialness (as cited by Saunders and Schumacher, 2000). To address the systematic risk and
other regulatory reasons, banks maintain certain equity level. So, everything remains constant,
the risk averse bank tends to charge more as the interest margins. Hence, we expect the positive
relationship between equity to total asset ratio and the net interest margin of bank.
11
(vi) Total loan to total deposit ratio
Differences in the standard deviations of deposit strength and the loan strength (long run
relationship) explain the heterogeneity in bank’s price setting behavior (Gambacorta, 2008). In
our model of determinants of net interest margins of banks, we applied this total loan to total
deposit ratio as the explanatory variable to see whether the funding strength (how much of the
total loan have been financed through deposit and other sources of funding) has any significant
deterministic power to banks’ price setting or in other words net interest margins. In this study,
we expect positive sign between total loan to total deposit ratio and the net interest margin of
bank.
(vii) Log (loan)
Ho and Saunders (1981) showed that size of transaction and banks’ interest margins are
positively related. Maudos and Guevara (2004) also stated that banks apply large margins on
sizable volume of loans. But the reality is different. We see big-loan-customers enjoy special
discounted rate (prime rate) on their borrowings. Also, banks enjoy the economies of scale
benefit of processing and maintenance cost of big loans which reduces banks operating cost to
revenue. As Hawtrey and Liang (2008) expected negative relationship between log (loan) and
interest margins arguing that increased volume of loans should result in a reduction of unit costs,
which achieves economies of scale and results in narrower margins. Again, McShane and Sharpe
(1985) assumed that size of the transaction is invariant across trading banks and time. We used
the logarithm of total loan as the proxy for size of operation or so called scale effect in our model
and expect positive relationship between log (loan) and net interest margin of a bank.
12
(viii) Net non-interest income
Modern banking and their services have been expanded in many folds so their sources of income
and heads of expenditures. A bank incurs cost of deposits as the largest volume of interest
expenses and the interest income on loans as the largest volume of interest income. Other than
the interest income that is the non-interest income may include service and penalty charges,
capital gain on assets sales, property leasing etc. On the other hand, expenses not included in the
cost of deposits like almost all operating and overhead costs will be included as non-interest
expenses.
Net non-interest income as the proxy for implicit interest payment and an explanatory variable to
determine the net interest margin of banks can be found in many previous literature. Among
others, Ho and Saunders (1981), Angbazo (1997), Saunders and Schumacher (2000) calculated
this as the net non-interest income (non-interest expense less non-interest revenue) divided by
earning assets whether Maudos and Guevara (2004) expressed the same as the percentage of total
assets. We followed the later approach and expected that, everything else remaining constant, an
increase in the net non-interest income will affect a bank’s net interest margin positively.
(ix) Required reserve to total asset ratio
Portion of deposits that a bank must hold but cannot lend out is the required reserve. This is one
of the regulatory variables of central banks to conduct monetary policy. Although, this
safeguards the depositors against sudden run out of banks but for banks, holding every penny
from the deposit amount reduces the loanable funds so as reduce the probability of earning more
interest income on loans or from investing in the financial markets. The larger the volume of
required reserve, the greater will be the opportunity cost. In our econometric model of
13
determinants of net interest margins of banks, we used cash and due from banks from bank scope
database as the proxy measure for required reserve. Our hypothesis is, holding other things
remaining constant, the larger the volume of required reserve of a bank, the more will be the net
interest margin.
(x) Operating expenses to total assets ratio
Operating expenses of a bank includes non-interest expenses like overhead and administrative
cost, maintenance of properties and others. Controlling for these costs promotes efficiency of the
bank and enhances the competitiveness as well. Among others, Kunt et. all. (1999), Maudos and
Guevara (2004), Hawtrey and Liang (2008) studied the effect of overhead expenses on
determining interest margins of banks. We also employed the operating expenses to total asset
ratio in our model to see how this variable affect the net interest margins of a bank. Principally, if
a bank’s unit operating expenses is relatively higher (less efficient), that bank will try to
compensate that by charging additional on the regular margins. So, a positive sign has been
expected.
(xi) Operating expenses to gross income ratio
Operating expenses to gross income ratio captures the bank management’s efficiency showing
the amount of expenses for every one dollar of income generated to the firm. According to
Angbanzo (1997) as well as Maudos and Guevara (2004) the higher the quality of management
of a bank, the higher the interest margins that will be imposed by the bank, on the ground that a
high quality of administration implies a high yield and low cost composition of assets and
liabilities. On the other hand Gischer and Juttner (2002) argued inverse relationship between the
14
quality of management and the net interest margins of banks but failed to prove their hypothesis
empirically. In our empirical model of determinants of net interest margins, our hypothesis is that
bank may charge higher margins for their excellent service offered to the customers.
(b) Industry specific explanatory variable
(xii) Herfindahl index
We used the Herfindahl Index (HI) in our econometric model of determinants of net interest
margins of banks to find out the relationship between market concentration and the net interest
margins in South Asia. Herfindahl index has been defined as the sum of squares of individual
bank asset shares in the total banking sector assets for a country. This is a common and widely
used measure of market concentration where higher market concentration means lower
competition and vice versa. Past literature has contrasting views regarding the relationship
between market concentration and interest margins of banks. Most of the recent studies3 on the
developed countries found positive sign coefficient for the variable. But Hesse (2007) and
Fungacova and Poghosyan (2011) who studied Kenyan and Russian banking respectively found
negative relationship between market structure and the net interest margins of banks. We
expected positive relationship between the market concentration and net interest margins of
banks supportive to the Ho and Saunders’ (1981) proposition that, if a bank faces relatively
inelastic demand and supply functions in the markets in which it operates, it may be able to
exercise monopoly power by demanding a greater spread than it could get if banking markets
were competitive.
3 Angbanzo (1997), Saunders and Schumacher (2000), Maudos and Guevara (2004), Williams (2007) for reference.
15

(c) Macroeconomics specific explanatory variables
(xiii) Standard deviation of short term interest rate (SDint)
Past literature used variety of measures to proxy for the volatility of interest rates and its impact
on the net interest margins of banks, including rates on short term money market rates to medium
and long term capital market rates. For our model of determinants of net interest margins of
banks, we used the annualized standard deviation of monthly average of daily call money rates.
Based on the monthly average of the daily call money rates, we have calculated the annual
standard deviation. We also assumed that there will be positive impact of the SDint on the net
interest margins of banks.
(xiv) Rate of inflation
Although there is no empirical consensus on the effects of inflation on interest margins, high
inflation rates are generally associated with high interest rates and therefore, higher interest
margins. Even if inflation is not anticipated by banks, in the short term interest rates may not
reflect the increased inflation, but in the medium and long term, banks will adjust their interest
rates to compensate for the inflation premium and will increase the interest margins (Tarus et al.,
2012). Kunt et al. (1999) found a positive relationship between inflation and the net interest
margins in their study with global evidences from 80 countries. On the other hand, Abreu and
Mendes (2003) found inverse relationship between rate of inflation and net interest margins of
banks on a cross country study of Portugal, Spain, France and Germany. Our hypothesis is rate
of inflation affect net interest margins positively.
16

(xv) Growth rate of gross domestic product (GDP)
Growth rate of GDP or economic growth rate of a country is important variable to influence the
determinants of net interest margins of banks. Growth rate of GDP affect directly the demand
and supply of deposits and loans and thus the banking activities. Kunt et al. (1999), Tarus et al.
(2012) studied the importance of economic growth rate to determine bank interest margins and
found inverse relationship. We also argue that economic growth brings prosperity to the
economy. Investors find various scope of investment and create green fields for the banks for
financing. Banks can do business in a relatively ease environment and thus may charge little as
interest margins. Hence, our hypothesis is that growth rate of GDP significantly and negatively
affects net interest margins of banks.
4. Sample description:
In our econometric model of the determinants of net interest margins of banks, we studied 230
banks of four countries in South Asia between 1997-2012 periods to test the model empirically.
By countries, India represents 53% banks in our total sample while Bangladesh, Nepal and
Pakistan represent 14%, 13% and 20% respectively. We defined banks as the financial
intermediary who takes deposits and provide loans and advances in the ordinary courses of
business. We excluded the data of Islamic banks from our sample as in India and Nepal there is
no or very limited Islamic banking operation. For our analyses, we collected data from various
sources. The dependent variable and the bank specific explanatory variables, we collected data
from the Bureau Van Dijk’s Bank Scope database (Bank Scope 2013) using the universal model
of banking database. We took the primary data set from the Bank Scope but calculated by our
own to get the Herfindahl Index and Concentration Ratio (CR3) which we used as the industry
17
specific explanatory variables in the baseline model and also to perform the robustness check.
Finally, for macroeconomics specific variables, we collected data from two sources. We
collected the data regarding interest rate volatility from the central banks websites of the
respective countries included in our study. We took the monthly averages of the daily call money
rates and later calculated the annual standard deviation at our own. From International Financial
Statistics (IFS) database (IFS 2014), we collected yearly data of rate of inflation and the growth
rate of gross domestic product (GDP).
Table-1 in the following presents the summary statistics of the determinants of net interest
margins. In South Asian countries, in our study period, average net interest margin was 2.98%
with 3.28% standard deviation. Relative size of the bank was 3.21% and the non performing loan
rate was 8.1% on an average.
<Table-1>
Liquid asset to total asset ratio averaged 86.02% whereas equity to total asset ratio average was
11.58% with 13.36% standard deviation. Among others, average required reserve ratio was
5.64% and operating expense to total asset ratio was 2.98% on an average.
Average value of Herfindahl Index 0.1398 indicates the existence of sound competitive banking
environment in the South Asian countries. Average rate of inflation was slightly more than 7%
and South Asian nations grew about 6% in our sample period.
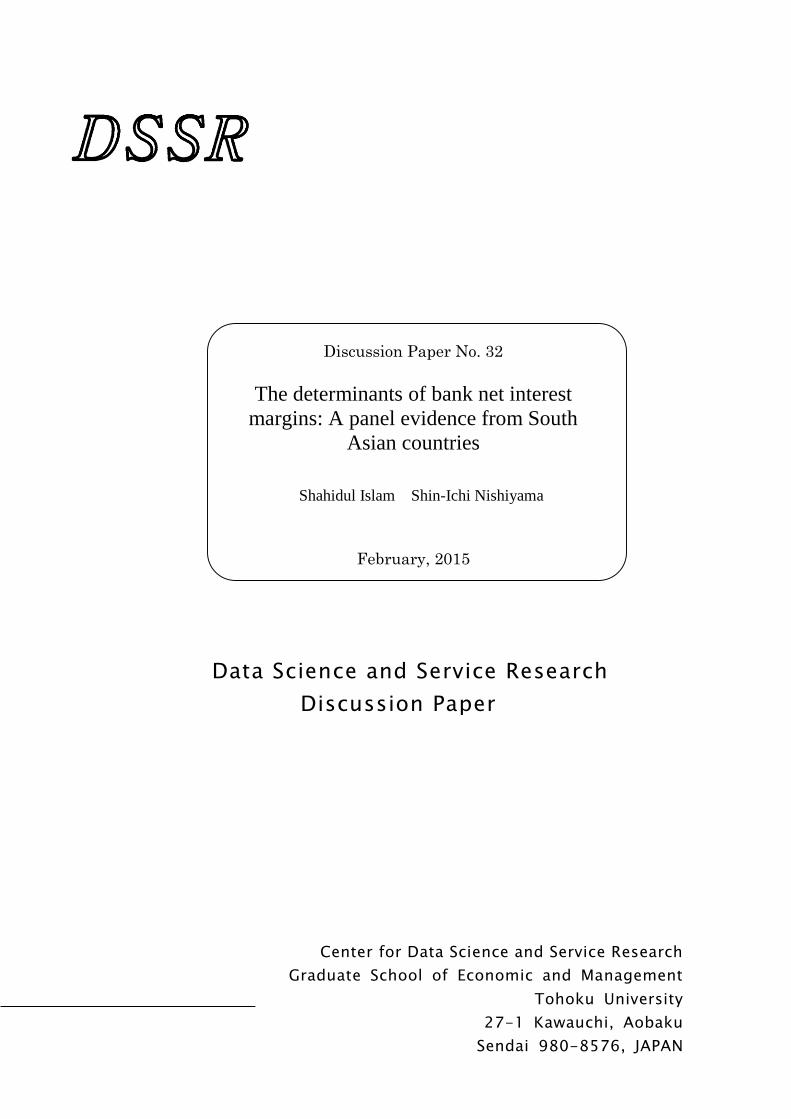
Table-2 presents the average and standard deviation of net interest margins of South Asia from
1997 to 2012. Also figure-1 and figure-2 in the following present the average and standard
deviation of net interest margins. From these table and figures we see over the period, in Pakistan
18
average net interest margins was higher than the South Asian average while in Bangladesh that
was lower. In 2003, Pakistani banks’ earned on an average 5% net interest margin that was the
highest in our sample period and that was the lowest (0.5%) for Bangladesh in the year 1997.
<Figure-1>
<Table-2
From figure -2, we also observe the higher dispersion of net interest margins of banks in Pakistan and
may be the lower in case of banks in Bangladesh over the sample period.
<Figure-2>
5. Results:
We used fixed effect4 model to capture the specific characteristics of each group, using the
within-group estimator. We also introduced the time dummies for each year to control for time
invariant effect in the regression model. First, we will present our baseline model result of the
pooled estimation. Then robustness checking of our baseline model and in the later part of this
section we will demonstrate the country-wise regression results. In all the cases, we allowed for
individual heterogeneity and used robust standard error5.
5.1.Baseline result
Result of our baseline model of fixed effect regression, where we assumed each country’s
banking sector as a single representative firm, has been presented in table -3: determinants of net
interest margins of banks in South Asia, 1997-2012, total sample. The first column of the table
4 The Hausman test allows the null hypothesis that the individual effect and the explanatory variables are uncorrelated, rejected in all the cases. 5 Confirmed by LM Heteroskedasticity test and the test statistics (p-value) are presented in the respective tables.
19
present the list of the dependent and independent variables but the independent variables have
been presented in quite classification of bank specific, industry specific and macroeconomic
specific variables respectively.
Another feature of the presentation of table -3 is that there are two models- model 1 and model 2.
Three columns of each of the model 1 and model 2 present the coefficient, robust standard error
and t-statistics respectively.
In model 1 we included the explanatory variable –relative size of the bank but excluded in model
2. We did so to see the particular effect of this variable to determine net interest margins as the
previous literature ignored the importance of this variable. We found that relative size of the
bank plays an important role in determining net interest margins of banks. We see the inverse
relationship between the relative size of banks and the net interest margins and support our
hypothesis that the larger banks charge smaller interest margins and vice versa. In particular, a
10% rise in the value of relative size of the banks would decrease net interest margins by 50
basis points. We also have confirmed the justification of inclusion of this variable in our baseline
regression model by checking the R2. In model 2, where we excluded this variable, the R2 is
0.2693 while in model 1, where we included the variable of relative size of the banks, the R2 is
0.2932.
Non-performing loan (NPL), which also capture the so called credit risk exposure of the banking
firm, found negative coefficient but statistically insignificant in our study. This result opposes
the major studies in the past like Ho and Saunders (1981), Angbanzo (1997), Saunders and
Schumacher (2000), Maudos and Guevara (2004), Hawtrey and Liang (2008), mostly of the
developed countries. This finding is also in contrast the macroeconomic framework of Bernanke,
20

Gertler and Gilchrist (BGG) (1999) where they assumed that default probabilities and default
premia rise when the aggregate return to capital is lower than expected. In counter, Williams
(2007), Hesse (2007) and Fungacova and Poghosyan (2011) who studied on Australian banking,
Kenyan and Russian banking respectively, found credit risk is negatively related to net interest
margins.
We studied the interaction term variable of NPL and Standard deviation of short term interest
rate (SDint) that is NPL*SDint to see whether these two variables are jointly have any significant
impact on net interest margins or not. We found NPL*SDint has insignificant relationship with
net interest margins in the South Asian banking markets.
Liquid asset to total asset ratio is significant and positively related to net interest margins of
banks. Economically a 10% increase in this explanatory variable would lead to raise net interest
margins by 32 basis points. This implies that the solvent banks charge higher margins exposing
their financial strength in terms of their excellent liquidity position.
<Table-3>
Equity to total asset ratio (E/TA) is positively related to the net interest margins of banks with
statistically significant impact. We found that if the equity to total asset ratio increases by 10%
then net interest margins of banks would increase by 64 basis points. As we stated in section
3.2.1 (e) that past literature has collided expectations regarding the relationship between equity
to total asset ratio and the net interest margins of banks. In the mainstream banking and finance
literature expect positive sign arguing that ‘banks are special’ and customers are willing to pay
for that specialness. In the macroeconomics literature, Gertler and Kiyotaki (2011) framework
argued the rise in net worth (equity) relative to the capital stock reduces the expected default
21
probability so banks can charge lower margins holding other things remain constant. However,
result of this paper support our hypothesis that solvent banks charge higher net interest margins.
Total loan to total deposit (TL/TD) ratio which captures the funding channel(s) of the banks for
loans and advances found positive coefficient but insignificantly related to the net interest
margins of banks.
Log (Loan) which also be termed as the size of the operation of banks has insignificant
relationship to the net interest margins of banks according to our baseline study on South Asian
banking. This outcome fails to prove our initial hypothesis that size of operation and net interest
margins of banks are positively related. But South Asian banking scenario seems different from
the hypothesis.
Net non interest income (the ratio of the difference between non-interest expense and non-
interest revenue to total asset) found to be insignificant.
Required or regulatory reserve to total asset ratio and net interest margins of banks are positively
related and the relationship is statistically significant. The result is also supportive to the baseline
dealership model of net interest margins determination of Ho and Saunders (1981) and also the
subsequent expansion and their studies of the model so as our initial hypothesis that everything
else constant, increase in cost of reserve will cause increase in interest margins of banks. That is
if the bank’s cost of holding regulatory reserve increases, banks subsequently shift that cost
burden to the customers. Economically speaking, a 10% rise in the required reserve ratio will
increase the net interest margins by 48 basis points.
We found positive and statistically significant relationship between operating expense to total
asset ratio and the net interest margins of banks in our South Asian banking studies. The baseline
22
result states that a 10% increase in operating expense to total asset ratio will raise the net interest
margins by 2.3%. The variable covers the level of efficiency of a bank. We proved our
hypothesis that efficient banks (here in our study, in terms of cost or cost efficiency) may charge
lower margins or in other way, customers are paying higher to the less efficient banks in South
Asia.
Operating expenses to gross income ratio or the quality of management found insignificantly
related to the net interest margins of banks.
Market structure (Herfindahl index) of banking in South Asian countries and net interest margins
of banks are inversely related and found statistically significant. This result disproves our initial
hypothesis that higher market concentration will create scope for charging higher interest
margins for banks. This divert outcomes of the studies may arise question regarding the
significant differences in the market structures of the different economic background economies
and their impact on determination of net interest margins for their banking market.
Finally, among the macroeconomics specific variables, we found standard deviation of short
term interest rate (SDint) and the rate of inflation have no significant relationship in determining
the net interest margins of banks.
Growth rate of Gross Domestic Product (GDP) and net interest margins are negatively and
statistically significantly related. That is if the economy grows at 10% then we can expect a 61
basis points reduction in the net interest margins of banks. The economics of thinking so is that
when GDP grows, economic expansion also becomes visible. In that expansionary economy
bank can expand their business and thus will be able to charge less form their customers.
23

Finally we introduced time dummies for every years of our observation period to capture the
time specific effect (if any). But we found time effect is insignificant to determine the net interest
margin of banks in the South Asian countries.
5.2. Robustness check
Table -4: robustness check for the determinants of net interest margins of banks in South Asia,
1997-2012, total sample presents the robust result of our baseline model of determinants of net
interest margins. We conducted the robustness check for our baseline models by using the
Concentration Ratio (CR3) as an alternative measure of Herfindahl index (HI). CR3 has been
calculated as the ratio of assets of largest 3 banks to the total asset of the banking industry
(Fungacova at all, 2011).
However, using CR3 as an alternative measurement of market structure, we found no change in
signs and no significant change in values of the coefficients of the explanatory variables. The
reported estimation results, presented in table-4, confirm that the results obtained for the baseline
model remain valid.
<Table-4>
5.3. Country-wise regression output
We estimated the explanatory equation of the determinants of net interest margins of banks for
each of the country’s banking sector included in our baseline model. Our aim was to see the
country variation (if any) and their impact on determining the net interest margins. Another
intention to do so as our fixed effect regression model does not determine the country specific
variation (if any) by using country dummies in the regression equation.
24
However, the country specific regression output has been presented on table-5: country-wise
regression of determinants of net interest margins, 1997-2012, total sample. From table-5, we see
the coefficients of the determinants of the explanatory variables vary among countries. For
example, the coefficient for the variable, relative size of the bank is statistically significant only
in case of Nepal although the sign of the coefficient is negative for every country. We found
positive and statistically significant coefficient for non performing loan for Bangladesh and
Nepal. For Pakistan, the coefficient is negative and statistically significant. But for India, the
coefficient bears negative sign but statistically insignificant.
Liquid asset to total asset ratio found significant and positively related to net interest margins of
banks in Bangladesh and Pakistan but insignificant for India and Nepal.
Equity to total asset ratio found highly significant and positively related to net interest margins
for Bangladesh, India and Nepal. For Pakistan, found positive coefficient but marginally
insignificant.
Total loan to total deposit ratio is positively and significantly determine the net interest margins
of banks in India, Nepal and Pakistan. Log (loan) plays significant and positive role in the
banking market of Bangladesh and Nepal.
<Table-5>
Net non interest income is positively and significantly related to net interest margins of banks in
Bangladesh and India. Whatever the margins in the banking markets of Bangladesh and India,
can be attributed to this variable largely. For every 1 percent increase in net non interest income
will result about 0.57% and 0.25% increase in net interest margins in Bangladesh and India
25
respectively. For Nepal, the impact of net non interest income on determining interest margins
of banks is negative and statistically significant. In Pakistan, this is insignificant.
Required reserve to total asset ratio is found positively related to the net interest margins but
found statistically significant for Bangladesh and Pakistan.
Operating expenses to total asset ratio is highly significant and has positive impact to determine
net interest margins of banks in all the countries included in our study. In Bangladesh and Nepal,
lion’s share of the net interest margins is determined by this variable. For every 1 percent
increase in operating expense to total asset ratio, interest margins will increase by around 0.71
percent, 0.28 percent, 0.62 percent and 0.26 percent in Bangladesh, India, Nepal and Pakistan
banking markets respectively.
Operating expenses to gross income ratio is significant only in case of Bangladesh and is
negatively related to net interest margins of banks.
According to the country specific regression output, we see Herfindahl index i.e. the market
structure is important to determine interest margins of banks in Pakistan where this variable is
negatively related to the interest margins and significant at 10 percent standard error.
Among the macroeconomic specific variables, we found short term interest rate, which have
been proxies by the standard deviation of short term interest rate (SDint) is significant and
negatively related to net interest margins of banks in India. Rate of inflation plays significant
negative role to determine interest margins of banks in Nepal. Finally, growth rate of GDP plays
significant and positive role in Bangladesh but negative role in Pakistan in determining net
interest margins of banks.
26

6. Conclusions and implications
Using a comprehensive cross –country panel data set with bank-level, industry-level and macroeconomic
–level explanatory variables, this paper presents the empirical results on how bank specific, industry
specific and macroeconomics specific factors affect the interest margins of banks. We started from the
dealership model of Ho and Saunders (1981) and later extension by other authors but followed the single
stage model of margin determination and included four South Asian countries’ that is Bangladesh, India,
Nepal and Pakistan banking sector data covering the period of 1997-2012. Our empirical findings are
consistent with our theoretical analysis.
Among the bank specific determinants, we found the liquid asset to total asset ratio, equity to total asset
ratio, required reserve to total asset ratio and operating expenses to total asset ratio are positively related
and the relative size of the bank is negatively related to the interest margins of banks at 1% significance
level. Unfortunately our result does not support significant relationship between non-performing loan or
the default risk and the interest margins.
A negative concentration effect found in the South Asian banking may be due to the high concentration of
the foreign banks those charge lower interest margins. A market characterized by foreign banks has lower
interest margin because of superior management or production technology (Tarus et al. 2012).
However, the macroeconomic variables like standard deviation of interest rate and the rate of inflation
found insignificantly related to interest margins. But the economic growth has significant and negative
relationship with bank interest margin which suggest that national economic prosperity provides sound
interest margin compensation to the banks.
We conducted our panel empirical study employing both fixed effect and random effect estimations but
fixed effect model performs better and generates the preferred specification. Robust standard error has
27
been incorporated for the base line model, the robustness check and the country-wise regression which
ensure the correct inferences from the estimation.
Regarding policy implications, we suggest the banks to take appropriate actions so that the default
probability would have proper reflection in determining the interest margins. For the regulatory bodies,
we recommend liberal policy actions for new entrants that could contribute to the improvement of the
competitive environment in the industry in order to reduce the cost of financial intermediation to facilitate
the society as a whole.
In terms of directions for future research, studies on a number of additional explanatory variables like
corporate tax rates, competition among banks and other financial institutions, ownership structure, deposit
insurance, information asymmetry, portfolio effect would be tested as the extension of the model. Due to
limitation of data and the degrees of freedom or for the potential multicollinearty problem, we could not
have fruitful insight of the literature but doing such could be apparently an interesting path for future
research.
28
References:
1. Abreu, M., & Mendes, V., 2003. Do macro financial variables matter for European bank interest margins and profitability. Financial Management Association International.
2. Afanisieff, T., Lhacer, P., and Nakane, M. 2002, The determinants of bank interest spread in Brazil. Centre for Latin American Monetary Studies, Money Affairs 15 (July-December (2)), 183-207.
3. Allen L., 1988. The determinants of bank interest margins: a note. Journal of Financial and Quantitative Analysis, 23, 231-235.
4. Angbazo, L., 1997. Commercial bank net interest margins, default risk, interest rate risk and off-balance sheet banking. Journal of Banking and Finance, 21, 55-87.
5. Bank Scope, 2013. Bureau Van Dijk, New York.
6. Bank for International Settlements (BIS), 1999. Credit risk modeling: Current practices and applications, Switzerland: Basel Committee.
7. Berger, A. N., 1995a. The profit structure relationship in banking: test of market power and efficient structure hypothesis. Journal of Money, Credit and Banking, 27 (2), 404-31.
8. Berger, A.N., Udell, G.F., 1992. Some evidence on the empirical significance of credit rationing. Journal of Political Economy 100 (5), 1047-1077.
9. Bernanke, Ben S., Gertler, M., and Gilchrist, S., 1999. The financial accelerator in a quantitative business cycle framework. Handbook of Macroeconomics, Vol. 1, Elsevier Science, B.V.
10. Degryse, H., Kim, M., and Ongena, S., 2009. Microeconometrics of Banking Methods, Applications and Results, Oxford University Press
11. Dufresne, Pierre C., et. el., 2001. The determinants of credit spread changes. The Journal of Finance, Vol. 56, No. 6, December.
12. Editorial., 2013. Recent developments in financial markets and banking. Journal of Banking and Finance, 37, 5392- 5393.
29
13. Focarelli, D., Panetta, F., 2003. Are merger beneficial to consumers? Evidence from the market for bank deposits. American Economic Review 93 (4), 1152-1172.
14. Fungacova, Z., Poghosyan, T., 2011. Determinants of bank interest margins in Russia: Does bank ownership matter? Economic Systems 35 (2011), 481-495.
15. Gambacorta, L., 2000. How do banks set interest rates? European Economic Review, 52 (2008), 792-819.
16. Gertler, M., Kiyotaki, N., 2011. Financial intermediation and credit policy in business cycle analysis. Handbook of Monetary Economics, Vol. 3A, ISSN 0169-7218, Elsevier B. V.
17. Gischer, H. Juttner, D.J., 2002. Global competition, fee income and interest rate margins of banks. Financial management association conference
18. Gropp, R., et. el., 2007. The dynamics of bank spreads and financial structure. European Central bank, Working paper series, No. 714/January.
19. Hawtrey, K. and Liang, H., 2008. Bank interest margins in OECD countries. North American Journal of Economics and Finance 19 (2008) 249-260.
20. Hesse, H., 2007. Financial intermediation in the pre-consolidated banking sector in Nigeria. World Bank Policy Research Working Paper 4267, Washington, DC.
21. Ho, T., Saunders, A., 1981. The determinants of bank interest margins: theory and empirical evidence. Journal of Financial and Quantitative Analysis, 16, 581-600.
22. International Financial Statistics (IFS), July, 2014. International Monetary Fund (IMF), Washington DC, 20431, USA.
23. Ivashina, V., 2004. Asymmetric information effects on loan spreads. Harvard Business School.
24. Kunt, A.D., Huizinga, H., 1999. Determinants of commercial bank interest margins and profitability: Some international evidence. The World Bank Economic Review, Vol. 13, No. 2, 379-408.
25. Lerner, E.M., 1981. Discussion. The determinants of bank interest margins: Theory and empirical evidence. Journal of Financial and Quantitative Analysis XVI (4), 601-602.
30

26. McShane, W., Sharpe, G., 1985. A time series/ cross section analysis of the determinants of Australian trading bank loan/deposit interest margins: 1962- 1981. Journal of Banking & Finance, 9, (1), p. 115-136.
27. Maudos, J., Fernandez de Guevara, J., 2004. Factors explaining the interest margin in the banking sectors of the European Union. Journal of Banking & Finance 28, 2259-2281.
28. Nishiyama, Shin-Ichi, Okada, T., Watanabe, W., 2006. Do banks reduce lending preemptively in response to capital losses? Evidence from Japan. RIETI discussion paper series, March.
29. Saunders, A., Schumacher, L., 2000. The determinants of bank interest margins: an international study. Journal of International Money and Finance, 19 (2000), 813-832.
30. Tarus, D.K., Chekol, Y.B., Mutwol, M., 2012. Determinants of net interest margins of commercial banks in Kenya: A panel study. Procedia Economics and Finance 2 (2012) 199-208.
31. Valverde, SC., Fernandez, FR., 2007. The determinants of bank margins in European banking. Journal of Banking & Finance 31 (2007) 2043-2063.
32. Williams, B., 2007. Factors determining net interest margins in Australia: domestic and foreign banks. Financial Markets, Institutions and Instruments 16, 145-165.
33. www.bangladesh-bank.org/ July, 2014
34. www.centralbankofindia.co.in/ July, 2014
35. www.nrb.org.np/ July, 2014
36. www.sbp.org.pk/ July, 2014
37. Xavier, F., Rochet, Jean-Charles, 2008. Microeconomics of banking, MIT, 2nd edition.
31

Figure-1: Net Interest Margins (NIMs) in South Asian Countries
Figure-2: Standard Deviation (SD) of Net Interest Margins (NIM) in South Asian Countries
0.0000
0.0100
0.0200
0.0300
0.0400
0.0500
0.0600
1997 1998 1999 2000 2001 2002 2003 2004 2005 2006 2007 2008 2009 2010 2011 2012
Average NIM (South Asia) Average NIM (Bangladesh) Average NIM (India)
Average NIM (Nepal) Average NIM (Pakistan)
0.0000
0.0200
0.0400
0.0600
0.0800
0.1000
1997 1998 1999 2000 2001 2002 2003 2004 2005 2006 2007 2008 2009 2010 2011 2012
SD(NIM) SA SD(NIM) BD SD(NIM) IND SD(NIM) Nepal SD(NIM) PAK
32
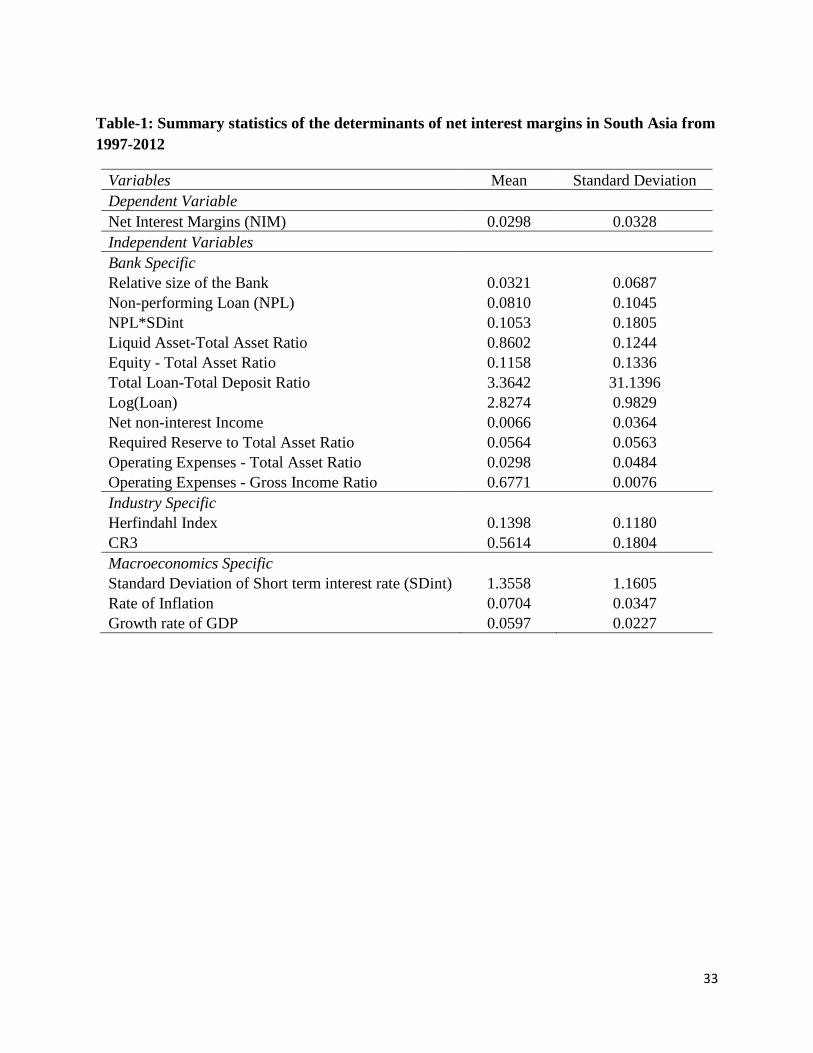
Table-1: Summary statistics of the determinants of net interest margins in South Asia from 1997-2012
Variables Mean Standard Deviation Dependent Variable Net Interest Margins (NIM) 0.0298 0.0328 Independent Variables Bank Specific
Relative size of the Bank 0.0321 0.0687 Non-performing Loan (NPL) 0.0810 0.1045 NPL*SDint 0.1053 0.1805 Liquid Asset-Total Asset Ratio 0.8602 0.1244 Equity - Total Asset Ratio 0.1158 0.1336 Total Loan-Total Deposit Ratio 3.3642 31.1396 Log(Loan) 2.8274 0.9829 Net non-interest Income 0.0066 0.0364 Required Reserve to Total Asset Ratio 0.0564 0.0563 Operating Expenses - Total Asset Ratio 0.0298 0.0484 Operating Expenses - Gross Income Ratio 0.6771 0.0076 Industry Specific Herfindahl Index 0.1398 0.1180 CR3 0.5614 0.1804 Macroeconomics Specific Standard Deviation of Short term interest rate (SDint) 1.3558 1.1605 Rate of Inflation 0.0704 0.0347 Growth rate of GDP 0.0597 0.0227
33
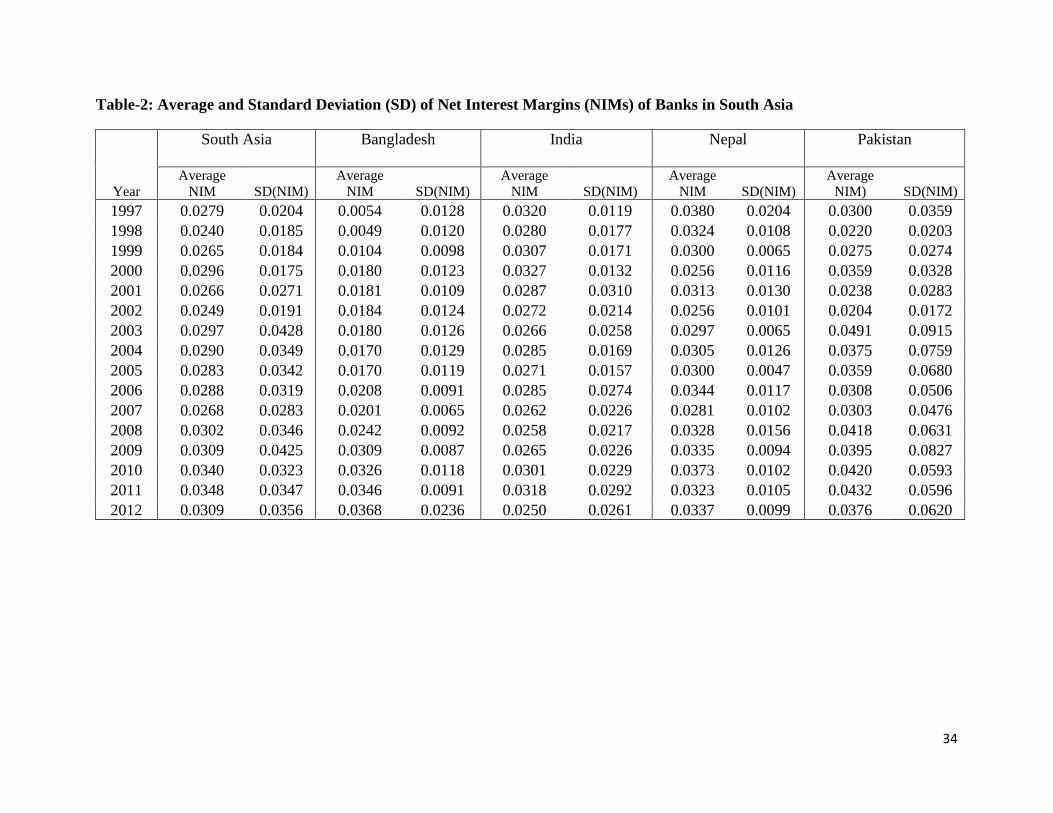
Table-2: Average and Standard Deviation (SD) of Net Interest Margins (NIMs) of Banks in South Asia
Year
South Asia
Bangladesh
India
Nepal
Pakistan
Average NIM SD(NIM)
Average NIM SD(NIM)
Average NIM SD(NIM)
Average NIM SD(NIM)
Average NIM) SD(NIM)
1997 0.0279 0.0204 0.0054 0.0128 0.0320 0.0119 0.0380 0.0204 0.0300 0.0359 1998 0.0240 0.0185 0.0049 0.0120 0.0280 0.0177 0.0324 0.0108 0.0220 0.0203 1999 0.0265 0.0184 0.0104 0.0098 0.0307 0.0171 0.0300 0.0065 0.0275 0.0274 2000 0.0296 0.0175 0.0180 0.0123 0.0327 0.0132 0.0256 0.0116 0.0359 0.0328 2001 0.0266 0.0271 0.0181 0.0109 0.0287 0.0310 0.0313 0.0130 0.0238 0.0283 2002 0.0249 0.0191 0.0184 0.0124 0.0272 0.0214 0.0256 0.0101 0.0204 0.0172 2003 0.0297 0.0428 0.0180 0.0126 0.0266 0.0258 0.0297 0.0065 0.0491 0.0915 2004 0.0290 0.0349 0.0170 0.0129 0.0285 0.0169 0.0305 0.0126 0.0375 0.0759 2005 0.0283 0.0342 0.0170 0.0119 0.0271 0.0157 0.0300 0.0047 0.0359 0.0680 2006 0.0288 0.0319 0.0208 0.0091 0.0285 0.0274 0.0344 0.0117 0.0308 0.0506 2007 0.0268 0.0283 0.0201 0.0065 0.0262 0.0226 0.0281 0.0102 0.0303 0.0476 2008 0.0302 0.0346 0.0242 0.0092 0.0258 0.0217 0.0328 0.0156 0.0418 0.0631 2009 0.0309 0.0425 0.0309 0.0087 0.0265 0.0226 0.0335 0.0094 0.0395 0.0827 2010 0.0340 0.0323 0.0326 0.0118 0.0301 0.0229 0.0373 0.0102 0.0420 0.0593 2011 0.0348 0.0347 0.0346 0.0091 0.0318 0.0292 0.0323 0.0105 0.0432 0.0596 2012 0.0309 0.0356 0.0368 0.0236 0.0250 0.0261 0.0337 0.0099 0.0376 0.0620
34
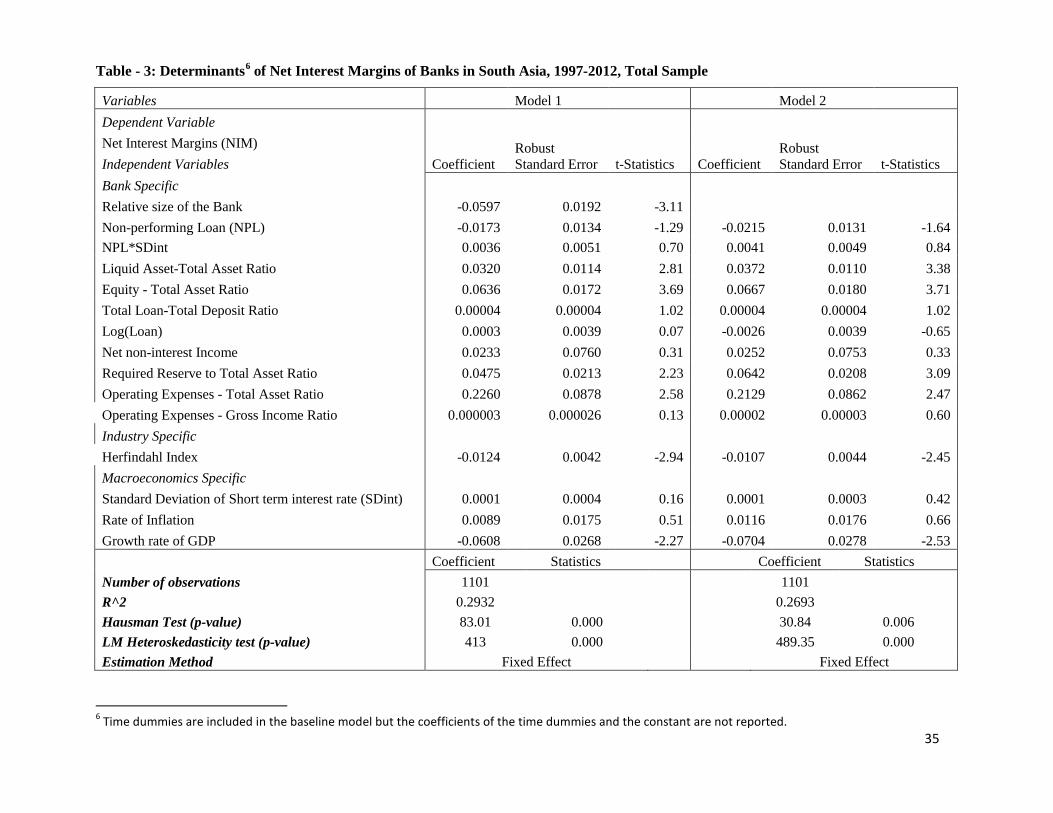
Table - 3: Determinants6 of Net Interest Margins of Banks in South Asia, 1997-2012, Total Sample
Variables
Model 1
Model 2 Dependent Variable
Coefficient Robust Standard Error t-Statistics Coefficient
Robust Standard Error t-Statistics
Net Interest Margins (NIM) Independent Variables Bank Specific
Relative size of the Bank -0.0597 0.0192 -3.11 Non-performing Loan (NPL) -0.0173 0.0134 -1.29 -0.0215 0.0131 -1.64
NPL*SDint 0.0036 0.0051 0.70 0.0041 0.0049 0.84 Liquid Asset-Total Asset Ratio 0.0320 0.0114 2.81 0.0372 0.0110 3.38 Equity - Total Asset Ratio 0.0636 0.0172 3.69 0.0667 0.0180 3.71 Total Loan-Total Deposit Ratio 0.00004 0.00004 1.02 0.00004 0.00004 1.02 Log(Loan) 0.0003 0.0039 0.07 -0.0026 0.0039 -0.65 Net non-interest Income 0.0233 0.0760 0.31 0.0252 0.0753 0.33 Required Reserve to Total Asset Ratio 0.0475 0.0213 2.23 0.0642 0.0208 3.09 Operating Expenses - Total Asset Ratio 0.2260 0.0878 2.58 0.2129 0.0862 2.47 Operating Expenses - Gross Income Ratio 0.000003 0.000026 0.13 0.00002 0.00003 0.60 Industry Specific
Herfindahl Index -0.0124 0.0042 -2.94 -0.0107 0.0044 -2.45 Macroeconomics Specific
Standard Deviation of Short term interest rate (SDint) 0.0001 0.0004 0.16 0.0001 0.0003 0.42 Rate of Inflation 0.0089 0.0175 0.51 0.0116 0.0176 0.66 Growth rate of GDP -0.0608 0.0268 -2.27 -0.0704 0.0278 -2.53
Coefficient Statistics
Coefficient Statistics
Number of observations 1101
1101 R^2 0.2932
0.2693
Hausman Test (p-value) 83.01 0.000
30.84 0.006 LM Heteroskedasticity test (p-value) 413 0.000
489.35 0.000
Estimation Method Fixed Effect
Fixed Effect
6 Time dummies are included in the baseline model but the coefficients of the time dummies and the constant are not reported. 35
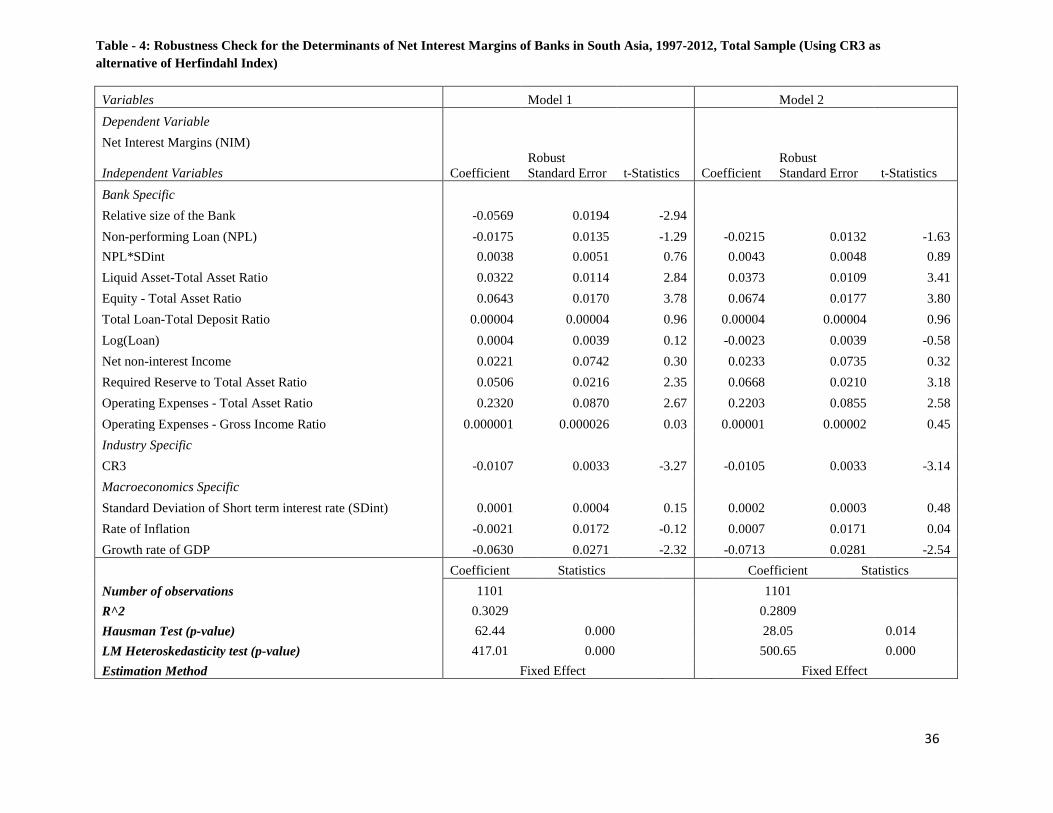
Table - 4: Robustness Check for the Determinants of Net Interest Margins of Banks in South Asia, 1997-2012, Total Sample (Using CR3 as alternative of Herfindahl Index)
Variables
Model 1
Model 2 Dependent Variable
Net Interest Margins (NIM)
Independent Variables Coefficient Robust Standard Error t-Statistics Coefficient
Robust Standard Error t-Statistics
Bank Specific Relative size of the Bank -0.0569 0.0194 -2.94
Non-performing Loan (NPL) -0.0175 0.0135 -1.29 -0.0215 0.0132 -1.63 NPL*SDint 0.0038 0.0051 0.76 0.0043 0.0048 0.89 Liquid Asset-Total Asset Ratio 0.0322 0.0114 2.84 0.0373 0.0109 3.41 Equity - Total Asset Ratio 0.0643 0.0170 3.78 0.0674 0.0177 3.80 Total Loan-Total Deposit Ratio 0.00004 0.00004 0.96 0.00004 0.00004 0.96 Log(Loan) 0.0004 0.0039 0.12 -0.0023 0.0039 -0.58 Net non-interest Income 0.0221 0.0742 0.30 0.0233 0.0735 0.32 Required Reserve to Total Asset Ratio 0.0506 0.0216 2.35 0.0668 0.0210 3.18 Operating Expenses - Total Asset Ratio 0.2320 0.0870 2.67 0.2203 0.0855 2.58 Operating Expenses - Gross Income Ratio 0.000001 0.000026 0.03 0.00001 0.00002 0.45 Industry Specific
CR3 -0.0107 0.0033 -3.27 -0.0105 0.0033 -3.14 Macroeconomics Specific
Standard Deviation of Short term interest rate (SDint) 0.0001 0.0004 0.15 0.0002 0.0003 0.48 Rate of Inflation -0.0021 0.0172 -0.12 0.0007 0.0171 0.04 Growth rate of GDP -0.0630 0.0271 -2.32 -0.0713 0.0281 -2.54
Coefficient Statistics
Coefficient Statistics
Number of observations 1101
1101 R^2 0.3029
0.2809
Hausman Test (p-value) 62.44 0.000
28.05 0.014 LM Heteroskedasticity test (p-value) 417.01 0.000
500.65 0.000
Estimation Method Fixed Effect
Fixed Effect
36
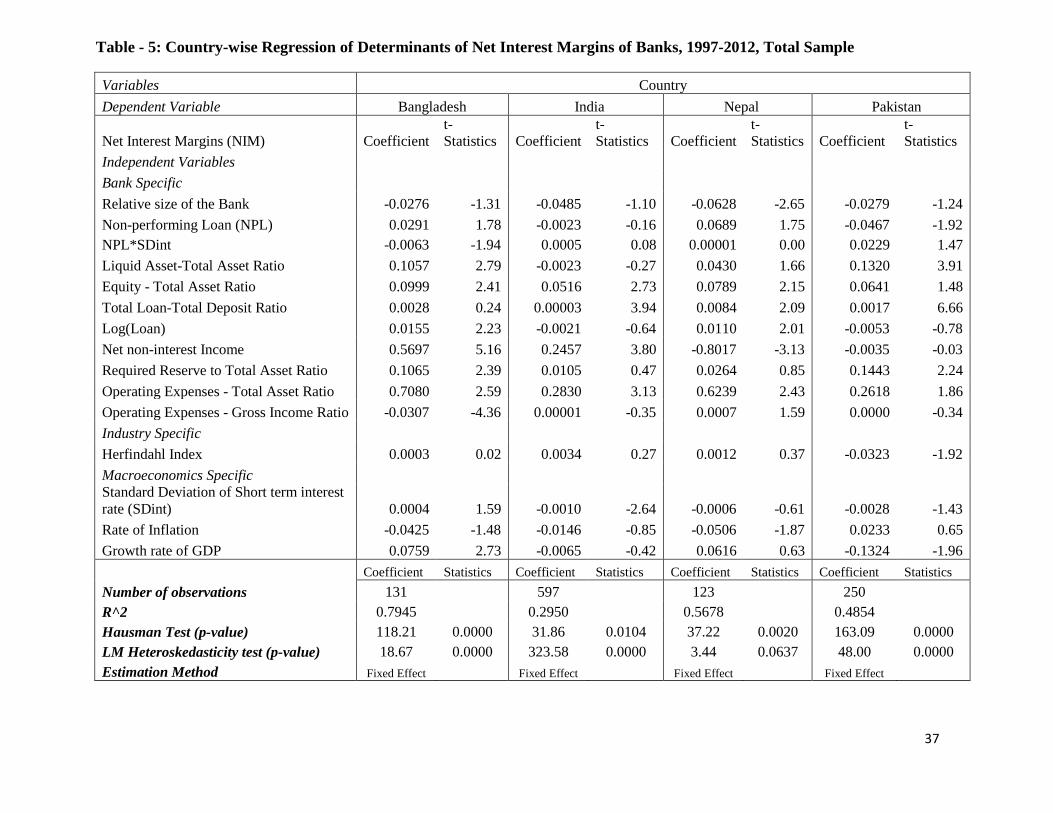
Table - 5: Country-wise Regression of Determinants of Net Interest Margins of Banks, 1997-2012, Total Sample
Variables Country Dependent Variable Bangladesh India Nepal Pakistan
Net Interest Margins (NIM) Coefficient t-Statistics Coefficient
t-Statistics Coefficient
t-Statistics Coefficient
t-Statistics
Independent Variables Bank Specific
Relative size of the Bank -0.0276 -1.31 -0.0485 -1.10 -0.0628 -2.65 -0.0279 -1.24 Non-performing Loan (NPL) 0.0291 1.78 -0.0023 -0.16 0.0689 1.75 -0.0467 -1.92 NPL*SDint -0.0063 -1.94 0.0005 0.08 0.00001 0.00 0.0229 1.47 Liquid Asset-Total Asset Ratio 0.1057 2.79 -0.0023 -0.27 0.0430 1.66 0.1320 3.91 Equity - Total Asset Ratio 0.0999 2.41 0.0516 2.73 0.0789 2.15 0.0641 1.48 Total Loan-Total Deposit Ratio 0.0028 0.24 0.00003 3.94 0.0084 2.09 0.0017 6.66 Log(Loan) 0.0155 2.23 -0.0021 -0.64 0.0110 2.01 -0.0053 -0.78 Net non-interest Income 0.5697 5.16 0.2457 3.80 -0.8017 -3.13 -0.0035 -0.03 Required Reserve to Total Asset Ratio 0.1065 2.39 0.0105 0.47 0.0264 0.85 0.1443 2.24 Operating Expenses - Total Asset Ratio 0.7080 2.59 0.2830 3.13 0.6239 2.43 0.2618 1.86 Operating Expenses - Gross Income Ratio -0.0307 -4.36 0.00001 -0.35 0.0007 1.59 0.0000 -0.34 Industry Specific
Herfindahl Index 0.0003 0.02 0.0034 0.27 0.0012 0.37 -0.0323 -1.92 Macroeconomics Specific
Standard Deviation of Short term interest rate (SDint) 0.0004 1.59 -0.0010 -2.64 -0.0006 -0.61 -0.0028 -1.43 Rate of Inflation -0.0425 -1.48 -0.0146 -0.85 -0.0506 -1.87 0.0233 0.65 Growth rate of GDP 0.0759 2.73 -0.0065 -0.42 0.0616 0.63 -0.1324 -1.96
Coefficient Statistics Coefficient Statistics Coefficient Statistics Coefficient Statistics
Number of observations 131
597
123
250 R^2 0.7945
0.2950
0.5678
0.4854
Hausman Test (p-value) 118.21 0.0000 31.86 0.0104 37.22 0.0020 163.09 0.0000 LM Heteroskedasticity test (p-value) 18.67 0.0000 323.58 0.0000 3.44 0.0637 48.00 0.0000 Estimation Method Fixed Effect
Fixed Effect
Fixed Effect
Fixed Effect
37

Appendix:
Table-A6: Empirical results regarding some key determinants of banks net interest margin in the past literature
Authors Angbanzo Saunders & Schumacher
Demirguc-Kunt & Huizinga
Maaudos & Guevara Williams Hesse
Fungacova & Poghosyan
Year 1997 2000 2000 2004 2007 2007 2011
Journal/Working paper JBF JIMF
WB Econ Review JBF FMII
WB Policy Research Paper
Economic Systems
Market Structure + + + + + - - Credit Risk/Non-performing loan + N/A + + - - -
Sample USA
Germany, Spain, France, UK, Italy, Switzerland, USA
80 countries worldwide
France, Germany, Italy, Spain Australia Nigeria Russia
Estimation Method GLS
Cross-sectional OLS for each year Pooled WLS FE OLS
Pooled OLS, GLS Random effects OLS
Pooled OLS, FE OLS, Median LS FE OLS
Note: +, -, and? Indicate positive significant, negative significant and insignificant respectively.
38

Table-A7: Correlation matrix* of the variables studied for the model of bank net interest margins determinants of South Asia
Variables** npl npl*SDint lr eta tltd lln nnii re oeta oegi share hhi cr3 SDint inf gdp _cons npl 1.00 nplsdint -0.50 1.00 lr 0.33 -0.07 1.00 eta 0.33 -0.01 0.12 1.00 tltd -0.02 0.01 -0.01 -0.02 1.00 lln 0.22 0.04 -0.14 0.22 -0.02 1.00 nnii 0.02 -0.03 -0.09 0.10 0.00 -0.28 1.00 re 0.18 0.01 0.56 0.13 0.01 -0.05 -0.10 1.00 oeta -0.08 0.04 0.11 -0.08 -0.01 0.28 -0.66 0.06 1.00 oegi -0.05 0.02 -0.05 0.00 0.00 -0.01 0.04 -0.03 -0.05 1.00 share -0.05 -0.05 0.05 0.19 0.00 0.00 -0.03 0.19 -0.05 0.03 1.00 hhi -0.01 -0.03 -0.07 0.08 -0.01 0.16 -0.02 -0.06 0.01 -0.02 0.03 1.00 cr3 -0.02 0.05 0.03 -0.09 0.01 -0.13 0.06 0.02 -0.07 0.05 0.03 -0.77 1.00 sdint 0.33 -0.60 0.09 -0.06 -0.02 -0.05 0.05 -0.10 -0.06 -0.01 0.04 -0.15 0.09 1.00 inf 0.03 -0.01 0.18 -0.22 0.00 -0.56 0.07 0.12 -0.10 0.00 0.15 -0.19 0.29 -0.01 1.00 gdp 0.08 0.12 0.00 0.07 -0.05 0.02 0.04 -0.08 0.02 0.06 -0.06 0.14 -0.21 -0.11 -0.03 1.00 _cons -0.46 0.05 -0.87 -0.28 0.01 -0.29 0.21 -0.57 -0.27 0.03 -0.12 0.08 -0.11 -0.07 -0.04 -0.07 1.00 *Output of Stata ** Refer to the table -1 of summary statistics for elaboration of the names of the variables
39